

Submitted:
27 June 2023
Posted:
28 June 2023
You are already at the latest version
Abstract
A micro energy harvesting device proposed in the literature, is numerically studied. It consists of two bluff bodies in a micro-channel and a flexible diaphragm at its upper wall. Vortex shedding behind bodies induces pressure fluctuation causing vibration of the diaphragm that converts me-chanical energy to electrical by means of a piezoelectric membrane. Research on enhancing vortex shedding is justified due to the low power output of the device. Amplitude and frequency of un-steady pressure fluctuation on the diaphragm center are numerically predicted. Vortex shedding severity is mainly assessed in terms of pressure amplitude. The CFD model set-up is described in detail and appropriate metrics to assess energy harvesting potential are defined. Several cases are simulated to study the effect of inlet Reynolds number and channel blockage ratio on the prospec-tive performance of the device. Furthermore, the critical blockage ratio leading to vortex shedding suppression is sought. Higher inlet velocity for a constant blockage ratio is found to enhance vor-tex shedding and pressure drop. Great blockage ratio values, but lower than the critical one, seem to provide great pressure amplitudes in the expense of moderate pressure drop. There is evidence that the field is fruitful for research and relevant directions are provided.
Keywords:
Energy harvesting
; micro-channel flow
; CFD
; piezoelectric phenomenon
; bluff body.
1. Introduction
Micro-energy harvesting consists one of the most interesting perspectives of energy harnessing, having numerous applications; for example, such a characteristic application is powering of Wireless Sensor Networks (WSN), where millimetre-scale energy harvesting devices are required. WSN comprise small dimensions sensors that have been proposed and used in industrial process monitoring, control, machine health monitoring, structural health, bridge monitoring, predictive maintenance, environment monitoring, forest surveillance, intelligent buildings, etc. However, their main drawback is their limited duration of operation, so effective ways to recharge their batteries are sought [1].
Various energy sources are offered for micro-energy harvesting: mechanical, flow, thermal, solar, electromagnetic, etc. In case of converting flow energy to electricity, the proposed miniature pneumatic power systems usually make use either of micro-turbines [2] or bluff bodies [3]. The former pose requirements for precise fabrication of millimetre-scale turbomachinery components, while the latter offer the advantages of simple design, easy fabrication and application [3]. In case of using bluff bodies, one or more of them are appropriately installed into the flow in order to cause enhanced vortex shedding behind them for a wide range of Reynolds numbers. Vortex shedding induces pressure fluctuations that can be exploited by energy-converting materials to generate electrical power; such materials are for example piezoelectric membranes. Usually, flexible structures that can exploit fluid structure interaction phenomena, are used to utilize the piezoelectric effect and harvest flow energy. Various configurations using flexible membranes in conjunction with bluff bodies, both in external and internal flows, have been proposed and assessed in the literature [4,5]. Often, fabricated prototype configurations are experimentally and/or numerically tested to assess their performance. Some of these studies aim to find the appropriate bluff body shape that produces significant vortex shedding; this is the same objective with that used in designing an effective flow meter [6]. Furthermore, using multiple bluff bodies in tandem instead of one, consists an interesting perspective towards enhancing the associated vortex shedding [7]. A very good and compact literature review on these topics can be found in [3].
In [3], a miniature pneumatic energy generating device was originally proposed and tested. This device utilizes one or two bluff bodies in tandem installed in a micro-channel. A flexible diaphragm, with a piezoelectric film on it, is located above the bodies at the upper channel wall. Pressure fluctuations and unsteady forces induced on the diaphragm due to vortex shedding cause vibrations to it and convert mechanical energy to electrical. Such a device, involves ease fabrication and installation, facilitates miniaturization and massive production avoiding the need for micro-assembling processes and could be used in liquid or gas pipeline systems. Its main drawback is the low power output, so further research is required aiming to enhance its performance. This device was studied in [8], in order to assess its prospective operation and performance, based on numerical simulations. To this end, a CFD model was appropriately set-up and validated. While the device was experimentally tested in [3] by measuring its actual electric power output, in [8], extended use of the CFD model was made in order to study the driving force for the operation of the device, i.e. the pressure fluctuation induced on the diaphragm due to the flow-field in the channel. Various bluff body shapes and configurations were simulated for a fixed inlet flow Reynolds number and channel blockage ratio. Pressure fluctuation characteristics (amplitude and frequency) acting on the center of the diaphragm were numerically predicted. Vortex shedding severity was quantified and assessed in terms of the maximum unsteady pressure fluctuation amplitude. The conclusions of [8] focused on the most effective configuration with respect to body geometry and diaphragm position. The work of [8] was partially continued in [9], where, by means of numerical simulations on the same case, the effect of the inlet Reynolds number was studied.
The present study focuses on studying further the most effective configuration found in [8]. This case with the original Reynolds number and blockage ratio is considered herein to be the baseline case. The set-up of the CFD model is described in detail and appropriate metrics to assess the energy harvesting potential are defined. Grid independence study is carried out, followed by corresponding time-step independence study, in order to use grid of sufficient size and appropriately select time-step value for the various simulations. Aiming to assess the effect of inlet Reynolds number and of blockage ratio in the channel on the prospective performance of the device, several cases are simulated. Results are presented and discussed, conclusions are drawn and future research directions are proposed.
2. Set-up of the CFD Model
The academic version of the ANSYS commercial CFD software FLUENT [10] was used for the numerical simulations. The necessary geometric modeling and grid generation tasks were accomplished by using the relevant software modules available in this software.
2.1. Flow Domain Geometry
Figure 1 presents the device under consideration, where two triangular bodies are located in a flow channel of very small height. A flexible diaphragm is installed above the bodies and causes vibrations to a piezoelectric film connected to it, converting mechanical energy to electrical, under the action of the unsteady flow pressure forces; the latter are induced by the vortex shedding, occurring behind the bodies. Contrary to most applications where vortex shedding suppression is sought, in such an application, vortex shedding enhancement is sought for a better performance of the device.
The flow domain used for the numerical simulations in [8] is shown in Figure 2. The bluff body shape is an isosceles triangle, the base of which faces the incoming flow from the left. The length of the channel is L=77.06D and its height is H=3.76D, where the width of the bluff body (length of the triangle base) is D=4.25mm. The blockage ratio of the channel is defined by the ratio BR=D/H=0.27. The aspect ratio of each triangle, i.e. ratio of height to base is 1.95. The flexible diaphragm is located on the upper wall of the channel. Its origin is exactly above the position of the first triangle base. The distance from channel inlet to the origin of the diaphragm is 23.53D=100mm. The length of the diaphragm is 8.94D=40mm and the distance downstream the diaphragm up to the flow outlet is 44.59D=160mm. The whole upper and lower boundaries of the channel are treated as solid walls. The left boundary is the inlet of the flow domain and the right one is the outlet domain and the right one is the outlet.
2.2. Governing Equations and Numerical Solver
In order to simulate the low-speed flow of air in the micro-channel, the two-dimensional unsteady, incompressible, Reynolds Averaged Navier-Stokes (RANS) equations are numerically solved, i.e. the continuity and momentum ones (mean-flow equations). Turbulence is taken into account by means of the realizable variant of the k-ε two-equation model; this variant ensures that only physically realistic viscous stresses will be allowed to arise during the simulations [11]. The mean flow equations are solved by means of FLUENT software [10], based on the SIMPLE pressure correction scheme, in the context of finite volume method, on unstructured grids consisting of triangular elements. Second-order spatial accuracy is used for the convective terms of the mean flow equations, while first order is used for the turbulence model ones. Transient solution of the governing equations is sought by means of first-order Euler scheme in physical time with constant time step, while 20 sub-iterations are applied to converge the solution between two successive time steps. Inlet velocity is prescribed at flow inlet (termed as ‘velocity inlet’ in the software), while zero pressure value is set at outlet (termed as ‘pressure outlet’). No-slip condition is used for the velocity at walls (channel and bodies). Wall functions are implemented to model velocity profiles at walls. In particular, the option of ‘scalable wall functions’ is used, ensuring that the wall distance employed in wall functions will be such that y+≥11.126. Thus, erroneous modelling of the laminar and buffer boundary layer regions (occurring in the range y+<11.126), is avoided by effectively shifting the near-wall mesh point to y+=11.126, irrespective the level of the actual near-wall grid refinement.
2.3. Description of Case Studies
In the present work, the effect of two parameters is investigated on the energy harvesting potential of the device under consideration. These are the inlet Reynolds number (Re) and the blockage ratio (BR), i.e. the ratio of body width to channel height. To this end, two different studies were carried out; the first concerns the effect of varying blockage ratio and Reynolds number on the device performance, while the second refers to finding the critical value of blockage ratio that causes vortex shedding suppression in the channel. In what follows, the cases that had to be simulated in order to accomplish the two studies, are described and organized.
2.3.1. Cases to study the effect of blockage ratio and Reynolds number
The bluff body width D is the characteristic length of the flow. Reynolds number (Re) based on inlet velocity Vin and body width D is Re=ρVinD/μ. By writing D in terms of blockage ratio BR, as D=BR.H (H being the channel width), the above formula becomes Re=ρVin BR.H /μ. Air was used as the working fluid in all the simulations with a density of ρ=1.225kg/m3 and a dynamic viscosity coefficient of μ=1.789x10⁻⁵Pa.s. For the baseline case studied in [8], where Vin=20.7m/s and BR=0.27, the Reynolds number is Re=6024.
Apart from the baseline value of BR=0.27, six more BR values were simulated, i.e. seven cases in total. For each of these seven BR values, seven different Re numbers are simulated (the corresponding cases are named after C1,…,C7), resulting in a total number of 49 simulations with respect to the variation of both Re and BR. In each of these cases, the value of the inlet velocity is set according to the formula Vin=(μ.Re)/(ρ.BR.H). Table 1 summarizes the values of inlet velocity used for the various values of Re and BR.
2.3.2. Cases to find the value of blockage ratio causing suppression of vortex shedding
According to the literature, the increase of blockage ratio generally enhances vortex shedding; however, in confined geometries, there is a critical value of BR that causes suppression of vortex shedding [3]. In order to find this value, a number of simulations was carried out, in which the baseline inlet velocity (Vin=20.7m/s) was kept constant, while the value of the blockage ratio, was gradually increased, starting from a low value, up to finding the required critical value.
2.4. Fluid Data for the Simulations
Since the Reynolds number based on channel width H is greater than that based on body width D, i.e. ReH=ρVinH/μ > ρVinD/μ=ReD. Thus, according to Table 1, in all cases Re > 4000 that dictates turbulent flow. In order to set boundary conditions for turbulence, the values of turbulence intensity It and turbulent length scale Lt are prescribed at the inlet. Assuming fully developed flow, this is estimated by Lt=0.07D, while turbulence intensity is computed as It=0.16(ReD)-1/8 [3,8,9].
A constant time step is used to march the flow-field in physical time. A characteristic time scale of the problem at hand is the so-called ‘convective time’, defined by TC=D/Vin. As in [3], a value of 5% of Tc, is proposed for the physical time-step in the simulations, i.e. Δt=Δtc=(0.05)Tc. For the baseline case, where D=0.00425m and Vin=20.7m/s, this value is Δtbsl=10-5s=0.01ms. At each case, starting from an ambient initial velocity field, the solution is marched using the corresponding physical time step for sufficient time to establish periodicity and then the flow field is let to evolve for at least three periods.
2.5. Assumptions Involved in the Simulations
All of the numerical simulations performed in the present work, rely on the following assumptions:
- The flexible diaphragm is considered to be rigid wall, fluid-structure interaction phenomena are ignored, displacement of the fluid due to diaphragm motion is ignored and feedback effects from the diaphragm to the flow were neglected.
- The diaphragm has small inertia and oscillates with the frequency of vortex shedding, the piezoelectric film is supposed to be strained laterally, following the vibrations of the diaphragm and, according to the piezoelectric phenomenon, produce electrical power.
- Although the actual geometry is three-dimensional, two-dimensional simulations along the symmetry plane of the channel are performed to model the phenomenon.
- The greater the calculated vortex shedding intensity, the better the expected performance of the device.
2.6. Definition of metrics to assess the energy harvesting potential of the device
The assessment of flow energy harvesting potential in the present work, is made on the basis of some appropriately selected and defined metrics. These are quantities of interest, either being indicative for assessing the potential to cause a greater effect on the piezoelectric membrane or characteristic quantities of the flow-field, like for example pressure drop along the channel.
Since the time evolution of pressure acting on the center of the diaphragm exhibits periodicity, its amplitude, i.e. its maximum fluctuation width, is considered to be the basic criterion to comparatively assess the energy harvesting potential of the flow from such a device [8]. To monitor pressure on the diaphragm, 21 distinct equidistant positions are defined along it on the upper channel wall, denoted by the points P1, P2, …, P21 (Figure 3). These points serve to evaluate and compare local pressure signals, as well as estimate corresponding amplitude values. The latter is towards searching for the maximum energy harvesting potential of the device, in the sense that the best performance will be exhibited if the center of the membrane is located at the position experiencing the maximum amplitude of pressure pi(t), i=1,2,…,21.
In the light of the above, the selected metrics that are computed in each case after establishing flow periodicity, are:
- The position (point Pi,max among the 21 points), where the maximum pressure fluctuation amplitude Δpi,max is predicted.
- The value of the maximum pressure fluctuation amplitude Δpi,max and the corresponding non-dimensional quantity (pressure coefficient) Cpi,max=Δpi,max/0.5ρVin2.
- The frequency and the non-dimensional frequency, i.e. Strouhal number St=fD/Vin, of the pressure signal at point Pi,max.
- The average pressure drop Δpdrop in the duct, calculated as the difference between inlet and outlet average pressures, as well as the same quantity in non-dimensional form, i.e. Cpdrop=Δpdrop/0.5ρVin2.
The grid independence study for the baseline case, as well as the assessment of vortex shedding severity for the various inlet Reynolds numbers and blockage ratios, to be presented in the following sections, have been based on the above defined metrics.
3. Selection of Grid Size and Time-Step
3.1. Grid Generation
In order to numerically simulate the flow in the channel and around the bluff bodies, the flow domain was discretized by means of unstructured grid consisting of triangular elements. To this end, the grid generation module of the academic version of FLUENT was used. The grid was made denser near the walls in order to better resolve the boundary layer regions. From the various grid metrics available in FLUENT, the parameter named after ‘mesh size’ was mainly used to create meshes of varying density.
A series of seven grids in total were generated to facilitate the grid independence study. The latter is demonstrated herein for the baseline case (Re=6024, BR=0.27). Table 2 summarizes the name, size, and corresponding value of the mesh size parameter for each of the seven grids. Figure 4 presents comparative partial views of the grid region near the bodies for the grids corresponding to the mesh size parameter values of 1.0, 0.5 and 0.3.
3.2. Grid Indepemdence Study
For the sake of grid independence study, the baseline case was simulated in all of the grids described in Table 1 (i.e. G1.0 to G0.2).
Figure 5(a) presents pressure fluctuation amplitude for points P1-P21 as it was predicted in each of the seven grids G1.0 to G0.2. According to the corresponding plots, the position of maximum pressure amplitude along the diaphragm for the first two grids, namely G1.0 and G0.7 appears to be at positions P8 and P9, respectively, while in all the rest finer grids it was predicted at point P5, i.e. at a distance 1.88D=8mm from the beginning of the diaphragm (not at the center of it).
Figure 5(b) presents average pressure drop in the channel as it was predicted in the grids of various sizes. As it becomes evident from this plot, this quantity essentially stops changing after grid G0.3.
Figure 6(a) presents local pressure evolution in time at point P5 (where the maximum amplitude of pressure fluctuation is predicted) for grids G1.0, G0.7, G0.5, G0.4, G0.3. It has to be mentioned that the pressure signal curves, after dropping out their transient part till the establishment of periodicity, have been shifted in time for the sake of comparison. According to this figure, it is clear that the various grids from G1.0 to G0.3 exhibit a different resolution of pressure evolution.
Figure 6(b) presents again local pressure evolution in time at P5, but for grids G0.3, G0.25, G0.2. According to it, differences in pressure evolution between them are practically negligible, i.e. local pressure evolution at point P5 exhibits negligible variation for grids having lower size than that of G0.3.
According to the above analysis, grid G0.3 was considered to be sufficient for obtaining grid-independent solution in the case under consideration and the size of 0.3mm was selected to generate all the grids required for the numerical simulations in the present work.
For the sake of completeness, the necessity of using ‘scalable wall functions’ was assessed by computing the value of y+ in several simulations. Thus, for the baseline case in grids of various sizes, minimum y+ was found to be between 0.3-1.1, while maximum y+ was found to be in the range 17.3-74.0. For the seven different Reynolds numbers (C1, …, C7) in case of BR=0.27 using grid G0.3, minimum y+ was between 0.3-1.1 and maximum y+ was in the range 17.1-27.2. The aforementioned minimum values justify the use of the selected approach.
3.3. Time-step selection
According to what was prescribed in section 2.5, the time-step for each simulation is calculated as Δtc=0.05(D/Vin). In [8], where all the numerical simulations referred to the baseline case (Re=6400, BR=0.27), the value computed by this formula i.e. Δtbsl=10-5s=0.01ms was used. However, in the present study, that the inlet velocity in each case is calculated as Vin=(μ.Re)/(ρ.D), the above formula for time-step is written as Δtc=0.05(ρ.D2)/(μ.Re). Furthermore, by taking into account that D=BR.H, the final formula for time-step as a function of Re and BR is written as Δtc=0.05(ρ.BR2H2)/(μ.Re), i.e. Δtc depends on BR and Re, so it is different in each case. In particular, the value of Δtc is found in some cases to be lower than Δtbsl (Δtc < Δtbsl); this happens in cases with BR=0.24 for Re > 4830 (i.e. C3-C7, 5 cases) and in those with BR=0.27 for Re > 6024 (i.e. C5-C7, 3 cases). For these cases, appropriate comparisons were made in order to assess the effect of time-step on the resolution of the flow-field, so as to decide if the use of Δtbsl at any case is sufficient or the corresponding value of Δtc had to be considered instead. The comparison was made in terms of pressure evolution at point P5, where maximum local pressure fluctuation is predicted in all cases (as it will be shown below in subsection 5.1.1).
Figure 7 demonstrates comparison of pressure evolution at P5 for cases C5, C6, C7 with BR=0.24 and C7 with BR=0.27, as they are predicted by using either Δt=Δtbsl=10-5s (blue curves) or Δt=Δtc<Δtbsl (red curves). These comparisons reveal that pressure evolution predicted by the use of the two time steps Δtc and Δtbsl is different. Furthermore, for the same BR, it seems that the discrepancy between the two curves rather becomes more significant as Re increases (from case C5 to C7). Obviously, in cases where Δtc<Δtbsl, the lower value (i.e. Δtc) is considered to provide more accurate results. Thus, according to the above analysis, the value of the time-step used at each simulation was set as Δt=min{Δtc , Δtbsl}.
4. Results and Discussion
The operational principle of the device under consideration relies on the severity of vortex shedding. The results to be presented concern the effect of various Reynolds numbers and blockage ratios on its prospective performance, as well as the estimation of the critical blockage ratio leading to vortex shedding suppression. These investigations are made on the basis of the flow metrics defined in subsection 2.7.
4.1. Effect of Reynolds Number and Blockage Ratio
As mentioned above, the seven cases C1-C7, corresponding to different inlet Reynolds numbers, were simulated in grids having characteristics similar to those of G0.3, for each of the seven different BR values. The results that are presented and discussed below in this section have been produced and presented in the context of [12].
4.1.1. Effect of Reynolds number - Baseline geometry
Some representative pictures of the flow-field are presented first, for the sake of demonstration. These refer to the baseline geometry (BR=0.27). In particular, Figure 8(a) shows iso-velocity contours predicted at time 8ms for case C4 (Vin=20.7m/s, Re=6024), while Figure 8(b) shows corresponding results for case C7 (Vin=26.7m/s, Re=7770). Obviously, due to the greater inlet velocity, a greater velocities are attained in case C7, above and below the bluff bodies (red regions) where flow is accelerated due to the narrow flow passage.
Figure 9 presents the variation of pressure amplitude along the diaphragm, versus the distance from the beginning of the diaphragm (i.e. for each of the points P1-P21), for various inlet Reynolds numbers, in the baseline geometry. According to this, the position of maximum pressure amplitude, is found for all cases C1-C7 to be at point P5, i.e. at a distance 8mm=1.88D from the beginning of the diaphragm (at the 20% of the diaphragm length from its origin and at the 76% of the distance L=10.5mm between the two bodies). Similar plots like that of Figure 9 have been derived for all the other values of blockage ratio and, according to the corresponding results, the maximum pressure amplitude for all cases and all blockage ratios simulated herein, was predicted to be at the same location, i.e. at point P5.
The authors in [3] state that “maximum pressure fluctuation is located near where the minimum mean pressure occurs” as it is shown in their plot in Figure 10(a) reproduced by [3]. More specifically, it seems that maximum pressure amplitude occurs a little downstream the location of minimum mean pressure. This claim motivated the present research to examine if the aforementioned statement concerning maximum pressure amplitude and mean pressure is also valid for the set of cases simulated herein. The results of this investigation are shown in Figure 10(b), where the distribution of mean pressure along the diaphragm is plot. According to this, the position of minimum mean pressure was found for all cases C1-C7 to be at point P7, i.e. at a distance 12mm=2.82D from the beginning of the diaphragm (at the 30% of the diaphragm length). This seems to validate the statement that maximum pressure amplitude occurs near the position of minimum mean pressure; however, herein, in contrast to the results of [3], maximum pressure amplitude occurs a little upstream the location of minimum mean pressure.
Figure 11 presents the pressure evolution at point P5, after periodicity has been established, for the baseline geometry and various Reynolds numbers. The results for all cases C1-C7 are distributed and shown in a set of four different plots, each of them containing one or two curves (in order to clearly distinguish them and compare each other). Furthermore, in these four plots, the same range has been used in the vertical axis, in order to facilitate cross comparison among them. So, cases C1-C2 are shown in Figure 11(a), C3-C4 in Figure 11(b), C5-C6 in Figure 11(c), and C7 in Figure 11(d). As it can be observed, both amplitude and fundamental frequency of pressure evolution at point P5, increase with the increase of Reynolds number.
4.1.2. Effect of Reynolds number - Various blockage ratios
In this subsection, plots of the performance metrics against Re are presented, with BR as a parameter. Figure 12(a) presents the variation of maximum pressure amplitude at point P5 with respect to the increase of inlet velocity for various values of BR. A first notice is that the curves in the plot are shifted to the left as BR increases, i.e. towards lower values of velocity. This is due to the fact that the same range of Reynolds numbers was simulated for each BR, so at each case, inlet velocity was computed by Vin=(μ.Re)/(ρ.BR.H) (see section 2.4.2); according to this equation, for the same Re, Vin decreases as BR increases.
Referring to Figure 12(a), some further remarks can be stated:
- An almost linear increase of pressure amplitude with inlet velocity is noticed for all BR; this increase becomes steeper for greater values of BR.
- Pressure amplitude increases with the increase of BR for the same inlet velocity.
Figure 12(b) presents the corresponding curves, in terms of non-dimensional quantities, namely the coefficient of maximum pressure amplitude against Reynolds number. According to this, Cp,max seems to vary slightly for the same BR, irrespective the value of Re, i.e. the effect of Re on Cp,max is very weak. It could be stated that Cp,max is essentially an increasing function of BR only.
Figure 13(a) shows the variation of the fundamental frequency of pressure signal at point P5 with respect to inlet velocity for the various BR values. According to it:
- An almost linear variation is predicted for all the values of BR; all curves have about the same inclination.
- For the same inlet velocity, contrary to pressure amplitude, frequency decreases with the increase of BR.
Figure 13(b) presents the corresponding curves in terms of non-dimensional quantities, namely Strouhal number against Reynolds number. According to this plot, the value of St for each BR is almost independent the Re, and increases with the increase of BR, i.e. St presents a similar behavior with Cp,max.
Figure 14(a) presents the variation of average channel pressure drop with the increase of inlet velocity for various BR. As expected, pressure drop increases with the square of velocity for constant BR. For the same inlet velocity, pressure drop increases for greater values of BR, which is expected, due to the resistance caused in the flow by the greater channel blockage.
Figure 14(b) presents the corresponding curves in terms of average pressure drop coefficient Cp,drop against Re. According to it, Cp,drop slightly varies with Re, however having a different value for each BR, not monotonically increasing or decreasing with it.
4.1.3. Effect of blockage ratio - Various Reynolds numbers
For the sake of completeness, in this subsection, the results of the previous subsections referring to non-dimensional performance quantities against Re for various BR, are briefly presented in another form, namely against BR with Re as a parameter.
Figure 15(a) and Figure 15(b) show the plots of pressure amplitude coefficient Cp,max and Strouhal number, respectively, against BR for various Re; both quantities exhibit an almost linear increase with BR irrespective the Re. Similarly, Figure 16 presents pressure drop coefficient Cp,drop against BR for various Re; like Cp,max and Strouhal, Cp,drop is almost independent the Reynolds and increases about linearly with BR, except the final value (this behavior can also be noticed in Figure 14(b)).
4.2. Investigation of vortex shedding suppression due to blockage ratio increase
Nguyen et al [3] numerically investigated the effect of blockage ratio increase on the performance of the device under consideration. To this end, they predicted the mean value and amplitude of the pressure at the center S of the diaphragm for values of BR higher that the baseline one (i.e. BR>0.27) for Vin=20.7m/s. Figure 17 reproduces their plot from [3], in which, the change in pressure mean value and amplitude at the center of the diaphragm is plot versus BR. They concluded that by increasing BR, the pressure amplitude is enhanced, attaining a maximum for BR=0.33, then gradually decreases and becomes zero for BR=0.42, where actually vortex shedding suppression is predicted. No other information is provided in [3], for example on the corresponding behavior of pressure drop or vortex shedding frequency.
The authors of the present work attempted to verify the findings of [3], so the BR=0.42 case was first simulated. Contrary to what the authors claim in [3] reporting suppression of vortex shedding for BR=0.42, not only vortex shedding is predicted by the present approach at BR=0.42, but pressure amplitude at the center S of the diaphragm continues to increase significantly beyond that value (for BR>0.42). This fact motivated the present authors to conduct a thorough study in order to seek the value of BR, for which the present CFD model predicts vortex shedding suppression, named after “critical” value of BR, in what follows.
To this end, a series of appropriate simulations were carried out, in which, the inlet velocity was kept constant Vin=20.7m/s and the blockage ratio BR was gradually increased, while the body aspect ratio value was also kept constant and equal to 1.95 (like in [3]). Each time, a new grid was generated, the corresponding case was simulated and the results were post-processed, up to numerically predict suppression of vortex shedding. Figure 18 depicts a focused view of some grids used in this study, in the region near the bluff bodies for various BR values. In each of these simulations, the mean value and amplitude of pressure at the diaphragm center, the average channel pressure drop, as well as vortex shedding frequency and Strouhal number were recorded. After several numerical simulations and related trial-and-error efforts, the critical value of BR value was finally found at about BR=0.662, i.e. significantly higher than that predicted in [3]!
Figure 19(a) shows the results from the present investigation in a form similar to that of Figure 17, i.e. change in pressure mean value and amplitude at the center of diaphragm versus BR. According to this figure, pressure amplitude increases with the increase of BR, attaining a maximum for BR=0.655. Then an abrupt decrease occurs and suddenly becomes zero for BR=0.662, i.e. in a very small region of BR increase. This behavior of attaining a maximum and then decreasing to zero is qualitatively the same with that of Figure 17 predicted in [3]. However, these are predicted now in significantly greater values of BR and in a much more pronounced way; the maximum is greater than double and the corresponding decrease much more abrupt. Figure 19(b) provides a focused view of the same plot in the range of abrupt amplitude decrease, i.e. in the neighborhood of the critical BR value.
Figure 20 presents in the same diagram, the pressure amplitude at S with the increase of BR, along with the corresponding change in the channel average pressure drop. The comparative view of these two curves, namely that of pressure amplitude (for which a high value is desired) and that of pressure drop (that a high value is unwanted) may be particularly useful to the designer of the device. Their comparison shows that, in the case under consideration, the increase in pressure amplitude due to increase of the body width comes in the cost of about a similar pressure drop, up to the value of BR=0.42. Then the two curves diverge and they come close again at BR=0.65, where both amplitude and pressure drop are maximized. From a designer point of view and provided that these results would be validated by experiments, the value of BR=0.60 seems to provide a significant increase in amplitude in the expense of a moderate pressure drop.
Figure 21(a) and Figure 21(b) present the corresponding plots of frequency and Strouhal number versus BR, respectively (always referring to pressure signal at the center S of the diaphragm). Both quantities follow the behavior described for pressure amplitude in Figure 20; the predicted vortex shedding beyond the value of BR=0.42 is characterized by increase in the frequency which is maximized for BR=0.660, where it is maximized and then exhibits a steep decrease.
For the sake of completeness, Figure 22 demonstrates the predicted pressure signal at the center S of the diaphragm for various values of BR. In particular, the plots in Figure 24(a) refer to the values of BR=0.65, 0.655, 0.660, 0.661, 0.662, 0.663, while those in Figure 24(b) refer to BR=0.661, 0.662, 0.663. As it becomes evident from these plots, the value of BR=0.662 is the first one for which pressure essentially stops fluctuating.
Figure 23 demonstrates iso-surfaces of instant velocity, at time 25ms after the beginning of flow solution for some BR values. Vortex shedding seems to be suppressed for BR=0.662.
4.2.1. Discussion on the estimation of the critical BR
An explanation about the difference of the present results and those of [3] concerning the estimation of the critical BR value is not obvious at all, since a very similar numerical approach has been implemented in both works (same commercial software, similar grids, same turbulence model and time step selection). It has to be mentioned that, concerning the effect of BR on vortex shedding suppression, no further information is provided in [3] for the simulations or any relevant experimental evidence.
For the sake of investigation, the cases BR=0.42 and BR=0.55, containing one instead of two bluff bodies, were also simulated. Figure 24(a) and Figure 24(b) present the evolution of pressure at the center of the membrane in these cases. According to Figure 24(a), the present method predicts vortex shedding for BR=0.42 even for the case of one body and with a predicted amplitude comparable to that of the corresponding case with two bodies. According to Figure 24(b), vortex shedding has been suppressed for the case with one body for BR=0.55 (but not for the case with the two bodies).
Figure 24.
Pressure evolution at the center of the membrane for the cases with one or two bluff bodies for (a) BR=0.42 and (b) BR=0.55.
Figure 24.
Pressure evolution at the center of the membrane for the cases with one or two bluff bodies for (a) BR=0.42 and (b) BR=0.55.

In parallel with the present work relying on simulations, a corresponding experimental work is conducted in the Department of Naval Architecture of the University of West Attica, where the present authors belong. This concerns the fabrication of the device under consideration and relevant measurements of the produced voltage by the piezoelectric element [13]; in that work, vortex shedding appears in the form of fluctuations on the measured voltage signal. In an effort to have an initial hint on what is the actual behavior of the flow in this case, the present authors addressed their question to the group of experimentalists. They asked them for conducting an indicative experiment with Vin=20.7m/s and BR=0.55, in order to check if their measurements are compatible with the occurrence of vortex shedding in such a case. This value of BR is well beyond BR=0.42, i.e. in a region where the present numerical results clearly predict vortex shedding, while in [3], suppression of vortex shedding has been noticed from the value of BR=0.42. The desired experiment was performed twice, using two different piezoelectric membranes, one at a time; with both membranes it was verified that the measured voltage signal corresponded to a flow exhibiting vortex shedding [14]. For the sake of demonstration, Figure 25(a) and (b) depict measured voltage in the case with two bluff bodies for BR=0.27 and BR=0.55, respectively [14]. As it can be seen, both cases exhibit similar behavior, that of a flow with vortex shedding. This fact is considered to be positive information for the results of the present study. (Obviously, the joint work that just started with the group of experimentalists must and will definitely be continued).
5. Conclusions – Future Research
A millimeter-scale flow energy harvesting device proposed in the literature [3] was studied numerically. The device contains two bluff bodies installed in a very small flow channel. It exploits vortex shedding behind them to cause oscillations on a flexible diaphragm above them and convert flow energy to electrical one by means of the piezoelectric phenomenon.
In [8], a CFD model was set-up for the numerical simulation of this case and different body shapes and configurations were simulated for a fixed flow Reynolds number. The achieved vortex shedding severity was assessed in terms of the predicted unsteady pressure fluctuation on the diaphragm in order to find the most efficient configuration, which involved two bodies of triangular section. The study of this configuration was continued herein by scrutinizing the CFD model of [8] and performing parametric studies to understand the effect of various parameters on the expected performance of the device. In particular, grid independence study and investigation on the selection of a sufficient time step for the resolution of the flow phenomena under consideration were performed. The device performance was then numerically assessed in a range of different inlet Reynolds numbers and blockage ratios. Furthermore, the behaviour of vortex shedding with respect to blockage ratio increase was studied in detail and the critical value of BR (for which vortex shedding suppression occurs) was sought and found.
5.1. Conclusions
The conclusions drawn in the present work can be summarized (from a designer’s point of view) as:
- The maximum pressure amplitude (Δpmax) in all cases occurs at the same position, located upstream the center of the diaphragm (at distance 8mm from its beginning). Thus, in order to maximize the effect of vortex shedding on the diaphragm, the center of the latter should be placed upstream at the point where maximum pressure amplitude is predicted.
- The maximum pressure amplitude increases almost linearly with the inlet velocity for all the values of blockage ratio (BR); the greater the BR, the more abrupt is the increase. Thus, using greater inlet velocity and greater blockage ratio, greater maximum pressure fluctuation amplitude can be achieved.
- The fundamental frequency of the predicted pressure signal at the point where Δpmax occurs, increases almost linearly with inlet velocity for all values of BR; the slope of the linear increase remains almost constant for all BR. This frequency slightly decreases with the increase of BR for the same Reynolds number. Since a high frequency is rather desired, maximizing the pressure amplitude (as proposed above) will also lead to a frequency increase.
- The channel pressure drop (Δpdrop) increases with the square of inlet velocity for all values of BR. For the same inlet velocity, pressure drop increases with BR. As expected, increase of pressure amplitude causes increase in pressure drop.
- As a contribution of this work, from a designer point of view, and under the prerequisite that these results would be validated by experiments, a great value of BR but lower than its critical one, seems to provide a great value of amplitude in the expense of a moderate pressure drop (Figure 20).
5.2. Further Discussion
The non-dimensional quantities Cp,max, Strouhal number and Cp,drop, all exhibit the same behavior, i.e. are almost constant irrespective the Re number for the same value of BR. This constant value is an increasing function of BR and could be estimated by averaging for various Re (for example from Figures 15(a), 15(b) and 16 for Cp,max, Strouhal number and Cp,drop, respectively).
Figure 26(a) presents the variation of the Re-averaged values of Cp,max, St and Cp,drop versus BR. It can be clearly seen that the increase in BR increases all these three quantities. However, the rate of increase in Cp,max is greater than that of Cp,drop, which again dictates that appropriate increase in BR may be an efficient way to enhance the vortex shedding effect on the piezoelectric membrane.
Figure 26(b) shows plot of the ratio Δpmax / ΔpS, i.e. pressure fluctuation amplitude at P5 to pressure fluctuation amplitude at the center S of the diaphragm, versus Reynolds number, for various values of BR. This ratio slightly decreases with Reynolds and for each Re it increases with BR.
Figure 26(c) shows plot of the ratio Δpmax / Δpdrop, i.e. maximum pressure amplitude at P5 to the average channel pressure drop, versus Reynolds, for various blockage ratios. This ratio seems also to be independent the Reynolds number and be an increasing function of BR.
Figure 26(d) presents the Re-averaged value for the two above presented pressure ratios for each value of BR. The following information that could be extracted from this figure:
- Δpmax is, over the BR range, from 1.3 to 2.6 times the value of ΔpS (about double in average) and the same is valid for Δpdrop. This means that if the diaphragm was positioned with its center at S at point P5, the achieved pressure amplitude could be multiplied by the corresponding ratio (greater than 100% increase).
- The value of Δpdrop is of the order of that of ΔpS and definitely lower than Δpmax.
Based on the above statements and according to Figure 20, the greater the BR, the greater the enhancement of ΔpS, for BR values lower than the critical one. In particular, for a 44.4% increase of BR (from the baseline value 0.27 to 0.39), the increase in ΔpS is about 125%. Furthermore, beyond the value of 0.42 that the authors in [3] claim vortex suppression to take place, the increase in ΔpS is much more significant, i.e. for a 41% increase (from 0.39 to 0.55) the increase in ΔpS becomes about 167%. The value of ΔpS for the baseline case according to Figure 9 and Figure 20 is ΔpS=252kPa. By further considering the above claim (Figure 27(d)) that Δpmax~1.5ΔpS (using a moderate estimation), it is concluded that for BR=0.55, a value of about (252)(1.67)(1.5)=631.3kPa could be attained if the center of the membrane was placed at point P5. However, this case corresponds to Re=12473 which is outside the range studied in Figure 13(b). Furthermore, experimental validation of these important statements becomes absolutely necessary. Anyway, according to all the above, there is evidence that the relevant research field is fruitful and open to further research.
5.3. Future Research
In view of the above, aiming to further develop research on the study and design of flow energy piezoelectric harvesting micro-devices, the following directions are proposed for ongoing research and future work:
- Study of the effect of the distance between the two bluff bodies on the device performance, since there is already experimental evidence [13], that a greater distance between the bodies may lead to a greater pressure amplitude.
- Study the device performance for a particular membrane and attempt to correlate maximum pressure fluctuation amplitude predicted by CFD with measured electric power from corresponding experiments, i.e. to extract the operational curve of the device.
- To perform design optimization studies with respect to characteristic geometric quantities (location and distance between the two bodies, location of the diaphragm, channel blockage ratio, etc) for maximum performance. A stochastic-based approach can be implemented (e.g. genetic algorithms), which would utilize either the present CFD solver or any reduced order model of the phenomenon. The solution of a multiobjective problem could be sought, e.g. maximization of Δpmax with minimization of Δpdrop. Furthermore, this could be a constrained problem, e.g. by requiring the frequency to be near the resonant frequency of the membrane.
- To model the phenomenon more accurately, like for example to compare 3D against 2D simulations and/or model membrane dynamics and consider fluid-structure interaction in the simulations.
Author Contributions
Conceptualization, methodology, investigation, writing-original draft preparation, supervision; DGK, software, validation, investigation, resources, visualization; MVNB. All authors have read and agreed to the published version of the manuscript.
Funding
This research received no external funding.
Data Availability Statement
Data sharing not applicable.
Acknowledgments
Professor D.N. Pagonis and graduate student I. Matsoukas, Department of Naval Engineering, School of Engineering, University of West Attica are gratefully acknowledged for conducting the experiment to validate the occurrence of vortex shedding in case BR=0.55.
Conflicts of Interest
The authors declare no conflict of interest.
References
- Zhou, G.; Huang, L.; Li, W.; Zhu, Z. Harvesting ambient environmental energy for wireless sensor networks: A survey (Review article). J. of Sensors 2014. [Google Scholar] [CrossRef]
- Lyshevski, S.E. High-power density miniscale power generation and energy harvesting systems Energy Conv. Manag., 2011, 52, 46–52. [Google Scholar]
- Nguyen, H-D. T; Pham, H-T; Wang, D-A. A miniature pneumatic energy generator using Karman vortex street, J. Wind Eng. and Industr. Aerodyn., 2013, 116, 40–48.
- Akaydin, H.D.; Elvin, N.; Andreopoulos, Y. Wake of a cylinder: a paradigm for energy harvesting with piezoelectric materials, Exp. in Fluids, 2010, 49, 291–304. [Google Scholar] [CrossRef]
- Sanchez-Sanz, M.; Fernandez, B.; Velazquez, A. Energy-harvesting microresonator based on the forces generated by the Karman street around a rectangular prism J. Microelectromech. Syst. 2009, 18, 449–457. [Google Scholar] [CrossRef]
- Miau, J.J.; Liu, T.W. Vortex flowmeter designed with wall pressure measurement Review Scient. Instr. 1990, 61, 2676–2681. [Google Scholar] [CrossRef]
- Peng, J. Fu, X. ; Chen, Y. Flow measurement by a new type vortex flowmeter of dual triangulate bluff body Int. J. Energy Research 2004, 33, 1180–1190. [Google Scholar]
- Koubogiannis, D.G. Parametric CFD study of micro-energy harvesting in a flow channel exploiting vortex shedding. Open Eng. 2016, 6, 135–144. [Google Scholar] [CrossRef]
- Benetatos, M.V.; Koubogiannis, D.G. Numerical Investigation of the Energy Harvesting Potential from a Micro-channel Flow. In Proceedings of the 10th International Conference from “Scientific Computing to Computational Engineering” 10th IC-SCCE Athens, Greece, 6–9 July 2022. [Google Scholar]
- ANSYS FLUENT, academic version. Available online: https://www.ansys.com/academic (accessed on 24 June 2023).
- Shih, T.-H.; Liou, W. W.; Shabbir, A.; Yang, Z.; Zhu, J. A New k-ε Eddy-Viscosity Model for High Reynolds Number Turbulent Flows - Model Development and Validation. Comp. Fluids 1995, 24, 227–238. [Google Scholar] [CrossRef]
- Benetatos, M.V. Assessment of flow energy harvesting in a duct by means of CFD numerical simulations, Diploma Thesis, University of West Attica, Athens, Greece, March 2023. Available online: https://polynoe.lib.uniwa.gr/xmlui/handle/11400/3968. Available online: https://polynoe.lib.uniwa.gr/xmlui/handle/11400/3968 (accessed on 24 June 2023).
- Matsoukas, I. Development of an air flow measurement device employing a piezoelectric membrane and a 3D printed structure containing a piezoresistor, Diploma Thesis, University of West Attica, Athens, Greece, February 2023, (in Greek). Available online: https://polynoe.lib.uniwa.gr/xmlui/handle/11400/3646. Available online: https://polynoe.lib.uniwa.gr/xmlui/handle/11400/3646 (accessed on 24 June 2023).
- Matsoukas, I.; Pagonis, D.N. ; (University of West Attica, Athens, Greece); Personal communication, 2023.
Figure 1.
Miniature energy harvesting devise using two triangles in tandem (from [3]): (a) Configuration; (b) Operational principle.
Figure 1.
Miniature energy harvesting devise using two triangles in tandem (from [3]): (a) Configuration; (b) Operational principle.
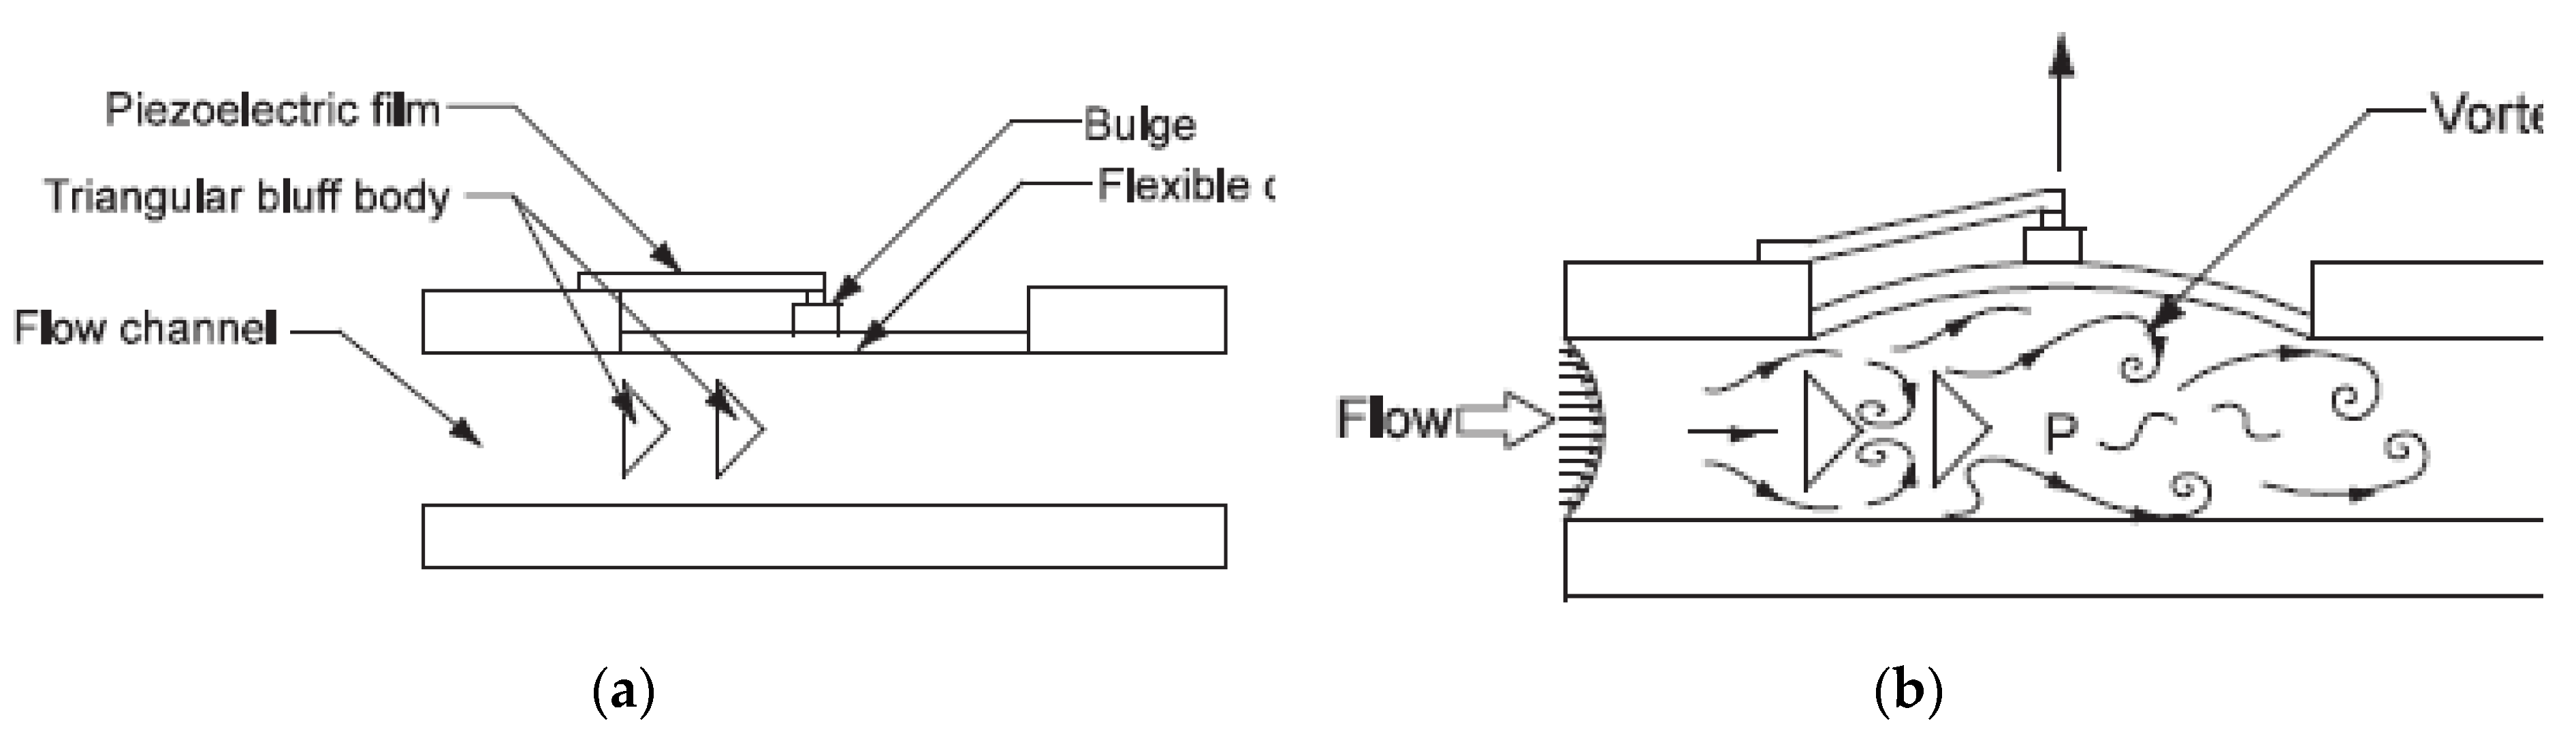
Figure 2.
View of the computational flow domain used for the numerical simulations (not to scale).
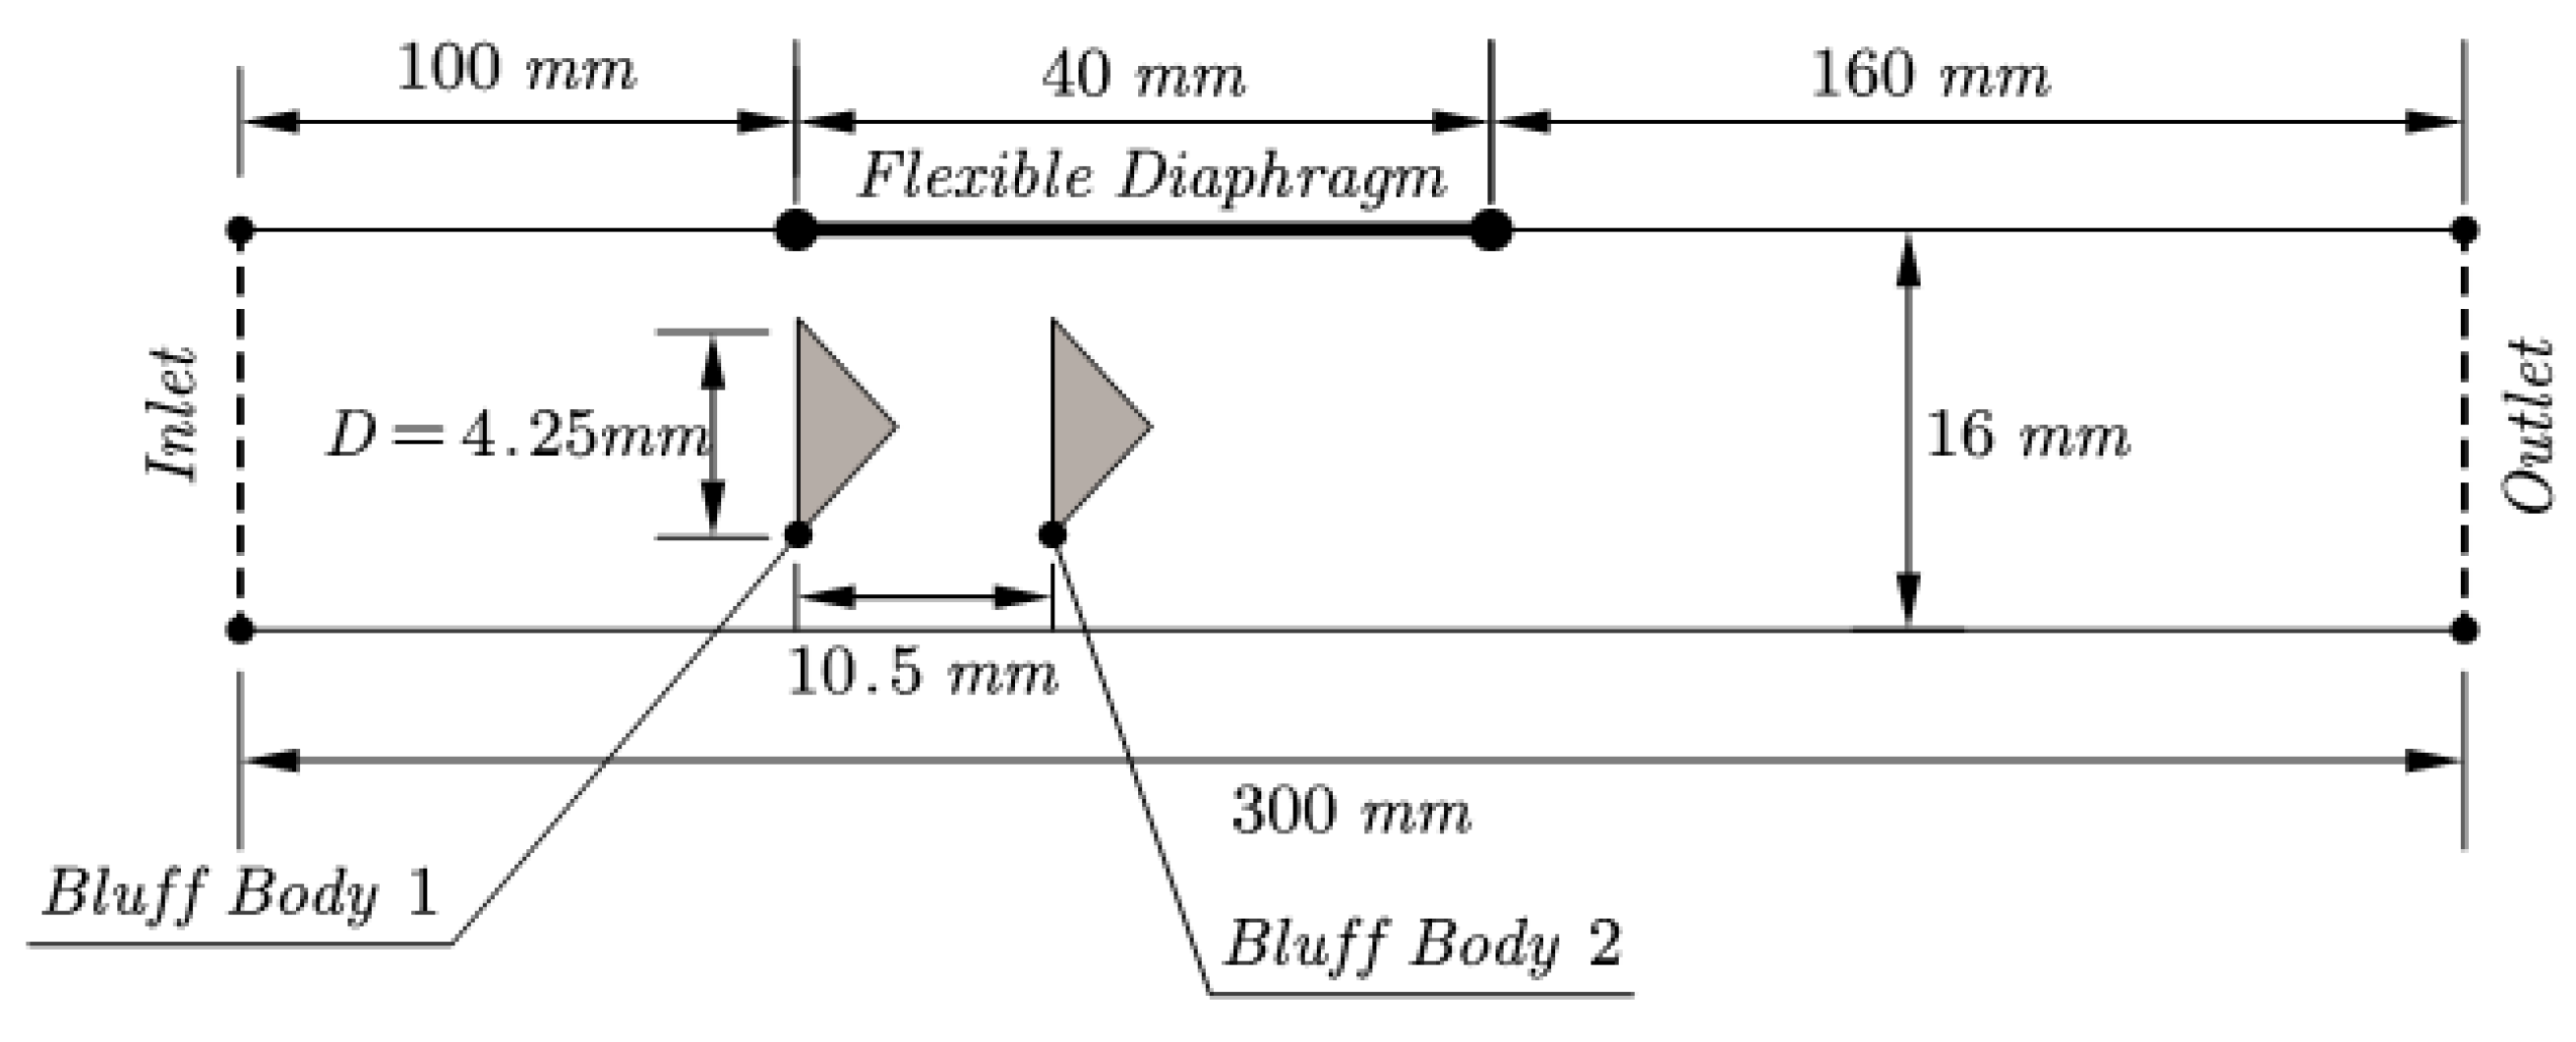
Figure 3.
Positions P1, P2,…, P21 along the membrane.

Figure 4.
Grids corresponding to mesh size values of 1mm (left), 0.5mm (middle) and 0.3mm (right).
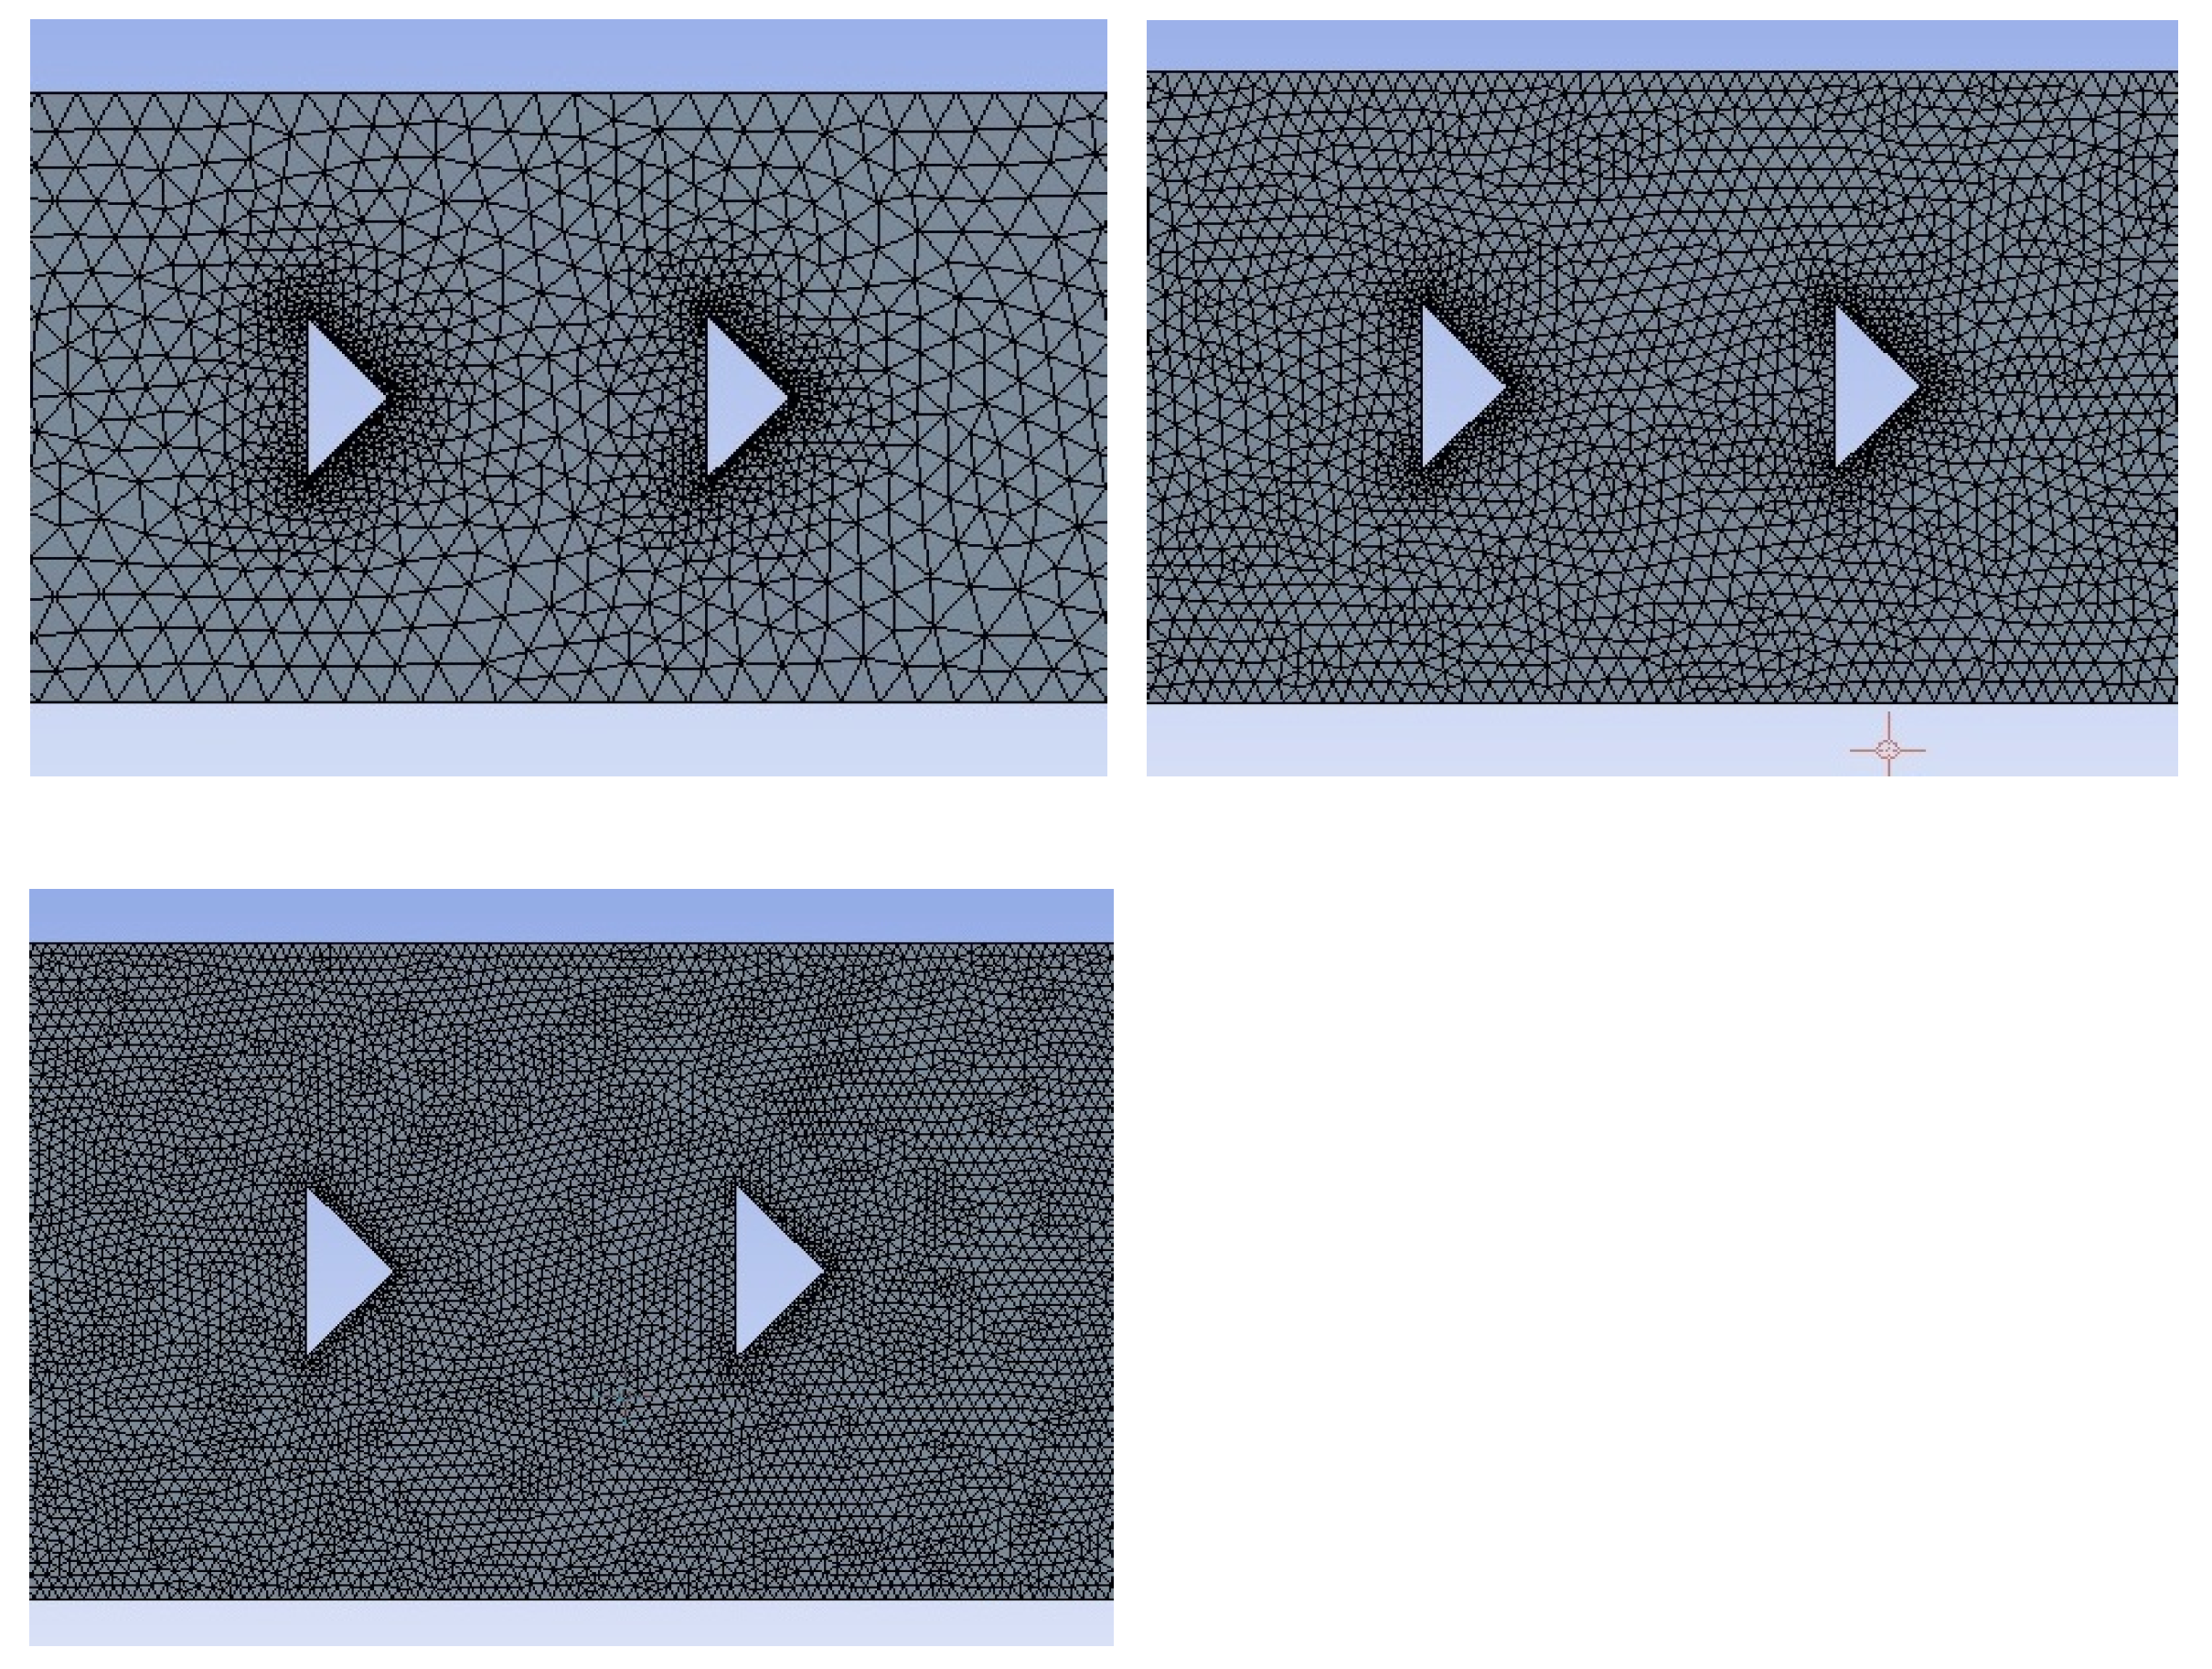
Figure 5.
(a) Position of maximum pressure fluctuation amplitude along diaphragm for various grid sizes. (b) Average pressure drop predicted for various size grids.
Figure 5.
(a) Position of maximum pressure fluctuation amplitude along diaphragm for various grid sizes. (b) Average pressure drop predicted for various size grids.
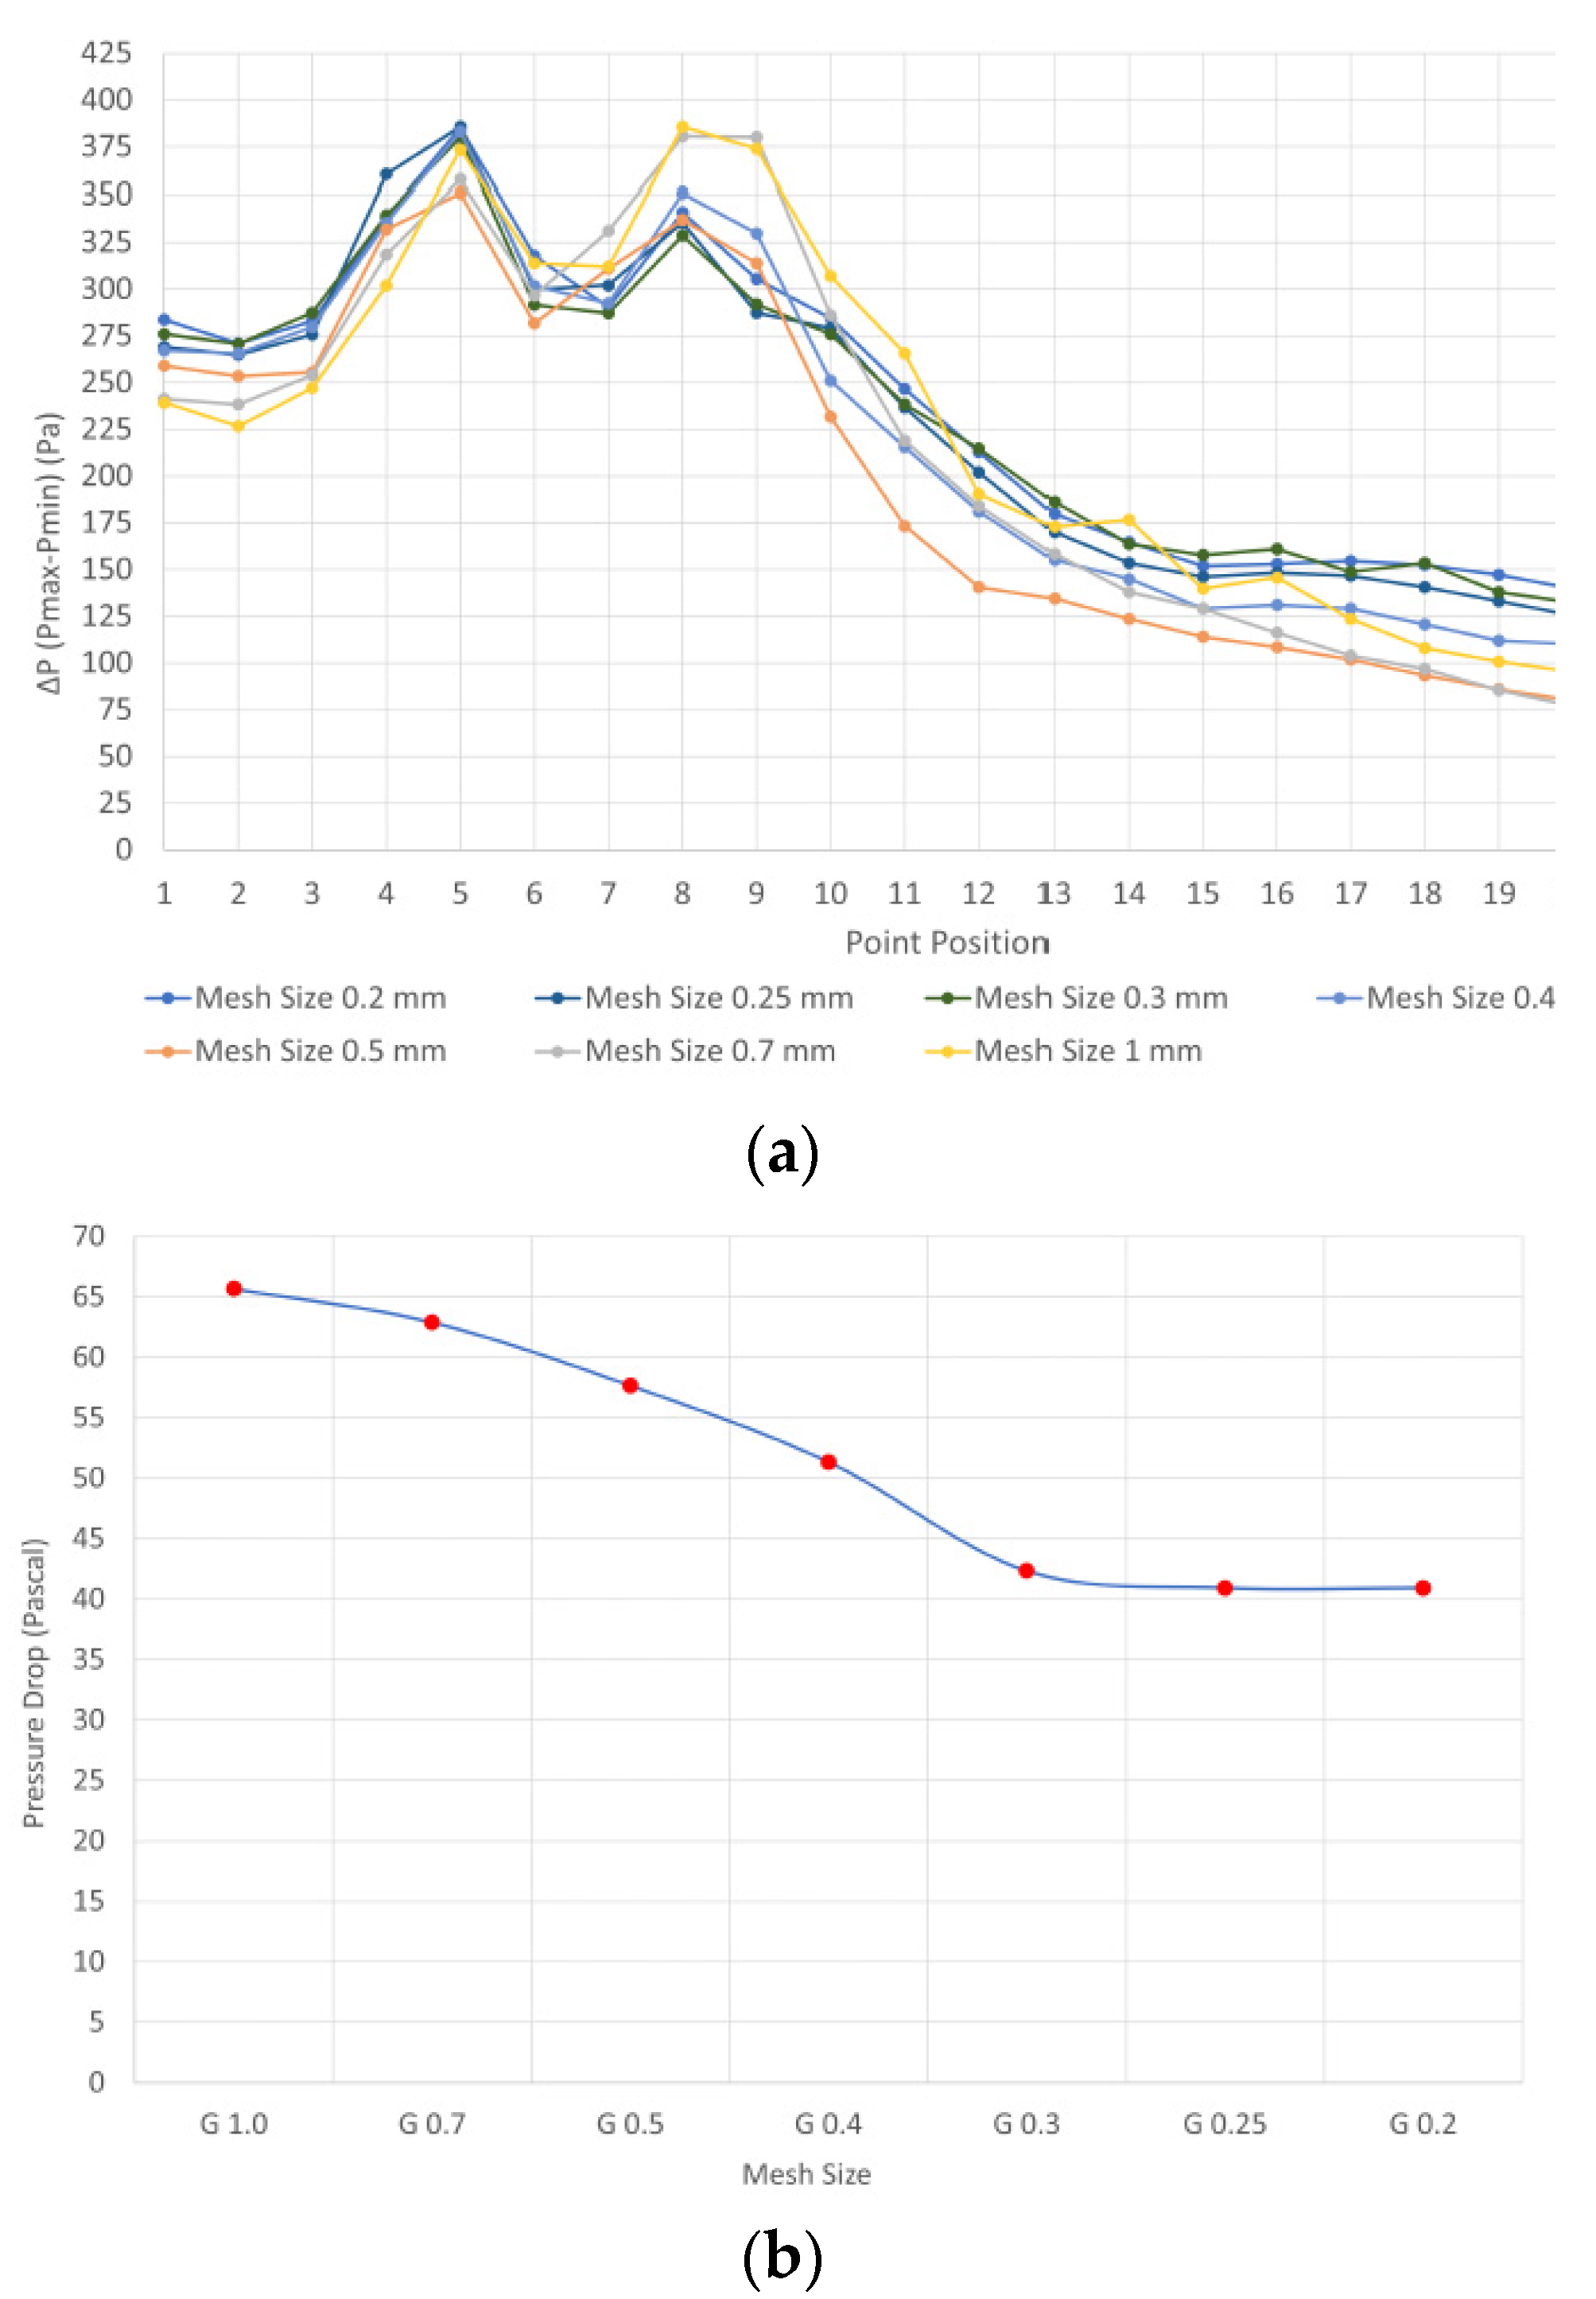
Figure 6.
Local pressure evolution at point P5, for grids (a) G1.0 to G0.3 and (b) G0.3 to G0.2 .
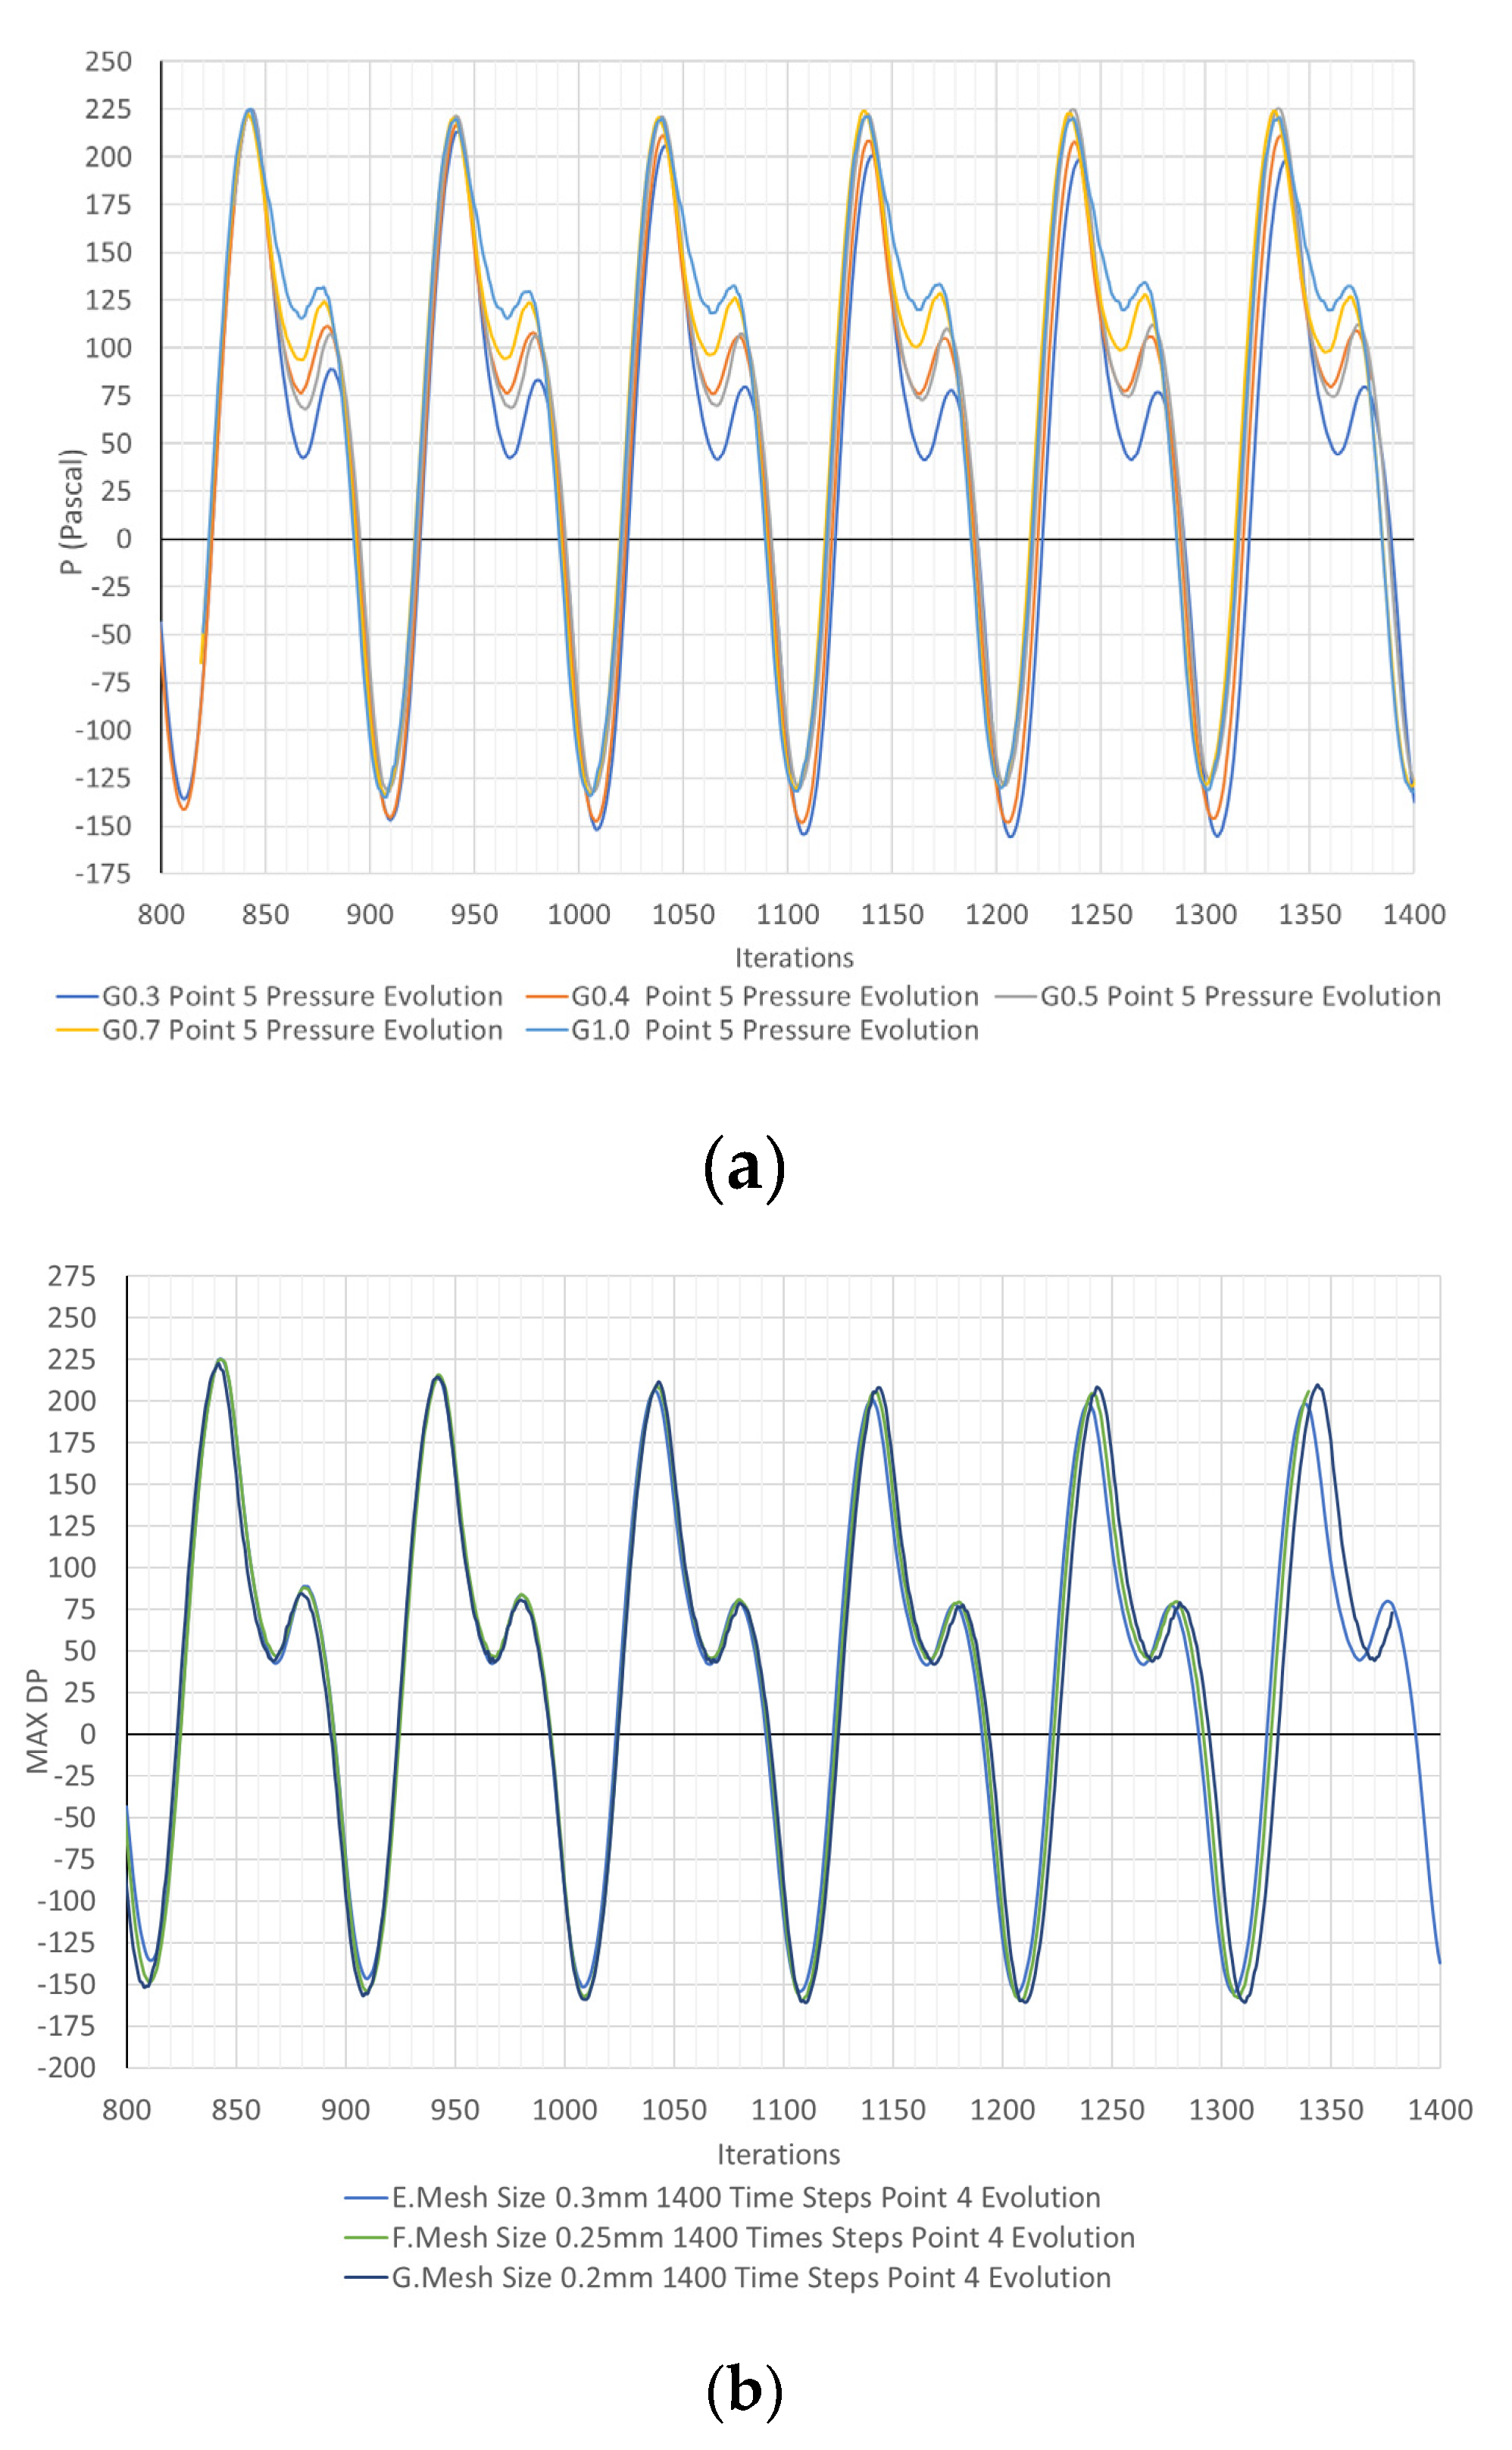
Figure 7.
Pressure evolution at point P5 for cases (a) C5 with BR=0.24, (b) C6 with BR=0.24, (c) C7 with BR=0.24 and (d) C7 with BR=0.27. The blue curves correspond to results obtained with Δt=Δtbsl=10-5s, while the red ones to results obtained with Δt=Δtc<Δtbsl.
Figure 7.
Pressure evolution at point P5 for cases (a) C5 with BR=0.24, (b) C6 with BR=0.24, (c) C7 with BR=0.24 and (d) C7 with BR=0.27. The blue curves correspond to results obtained with Δt=Δtbsl=10-5s, while the red ones to results obtained with Δt=Δtc<Δtbsl.
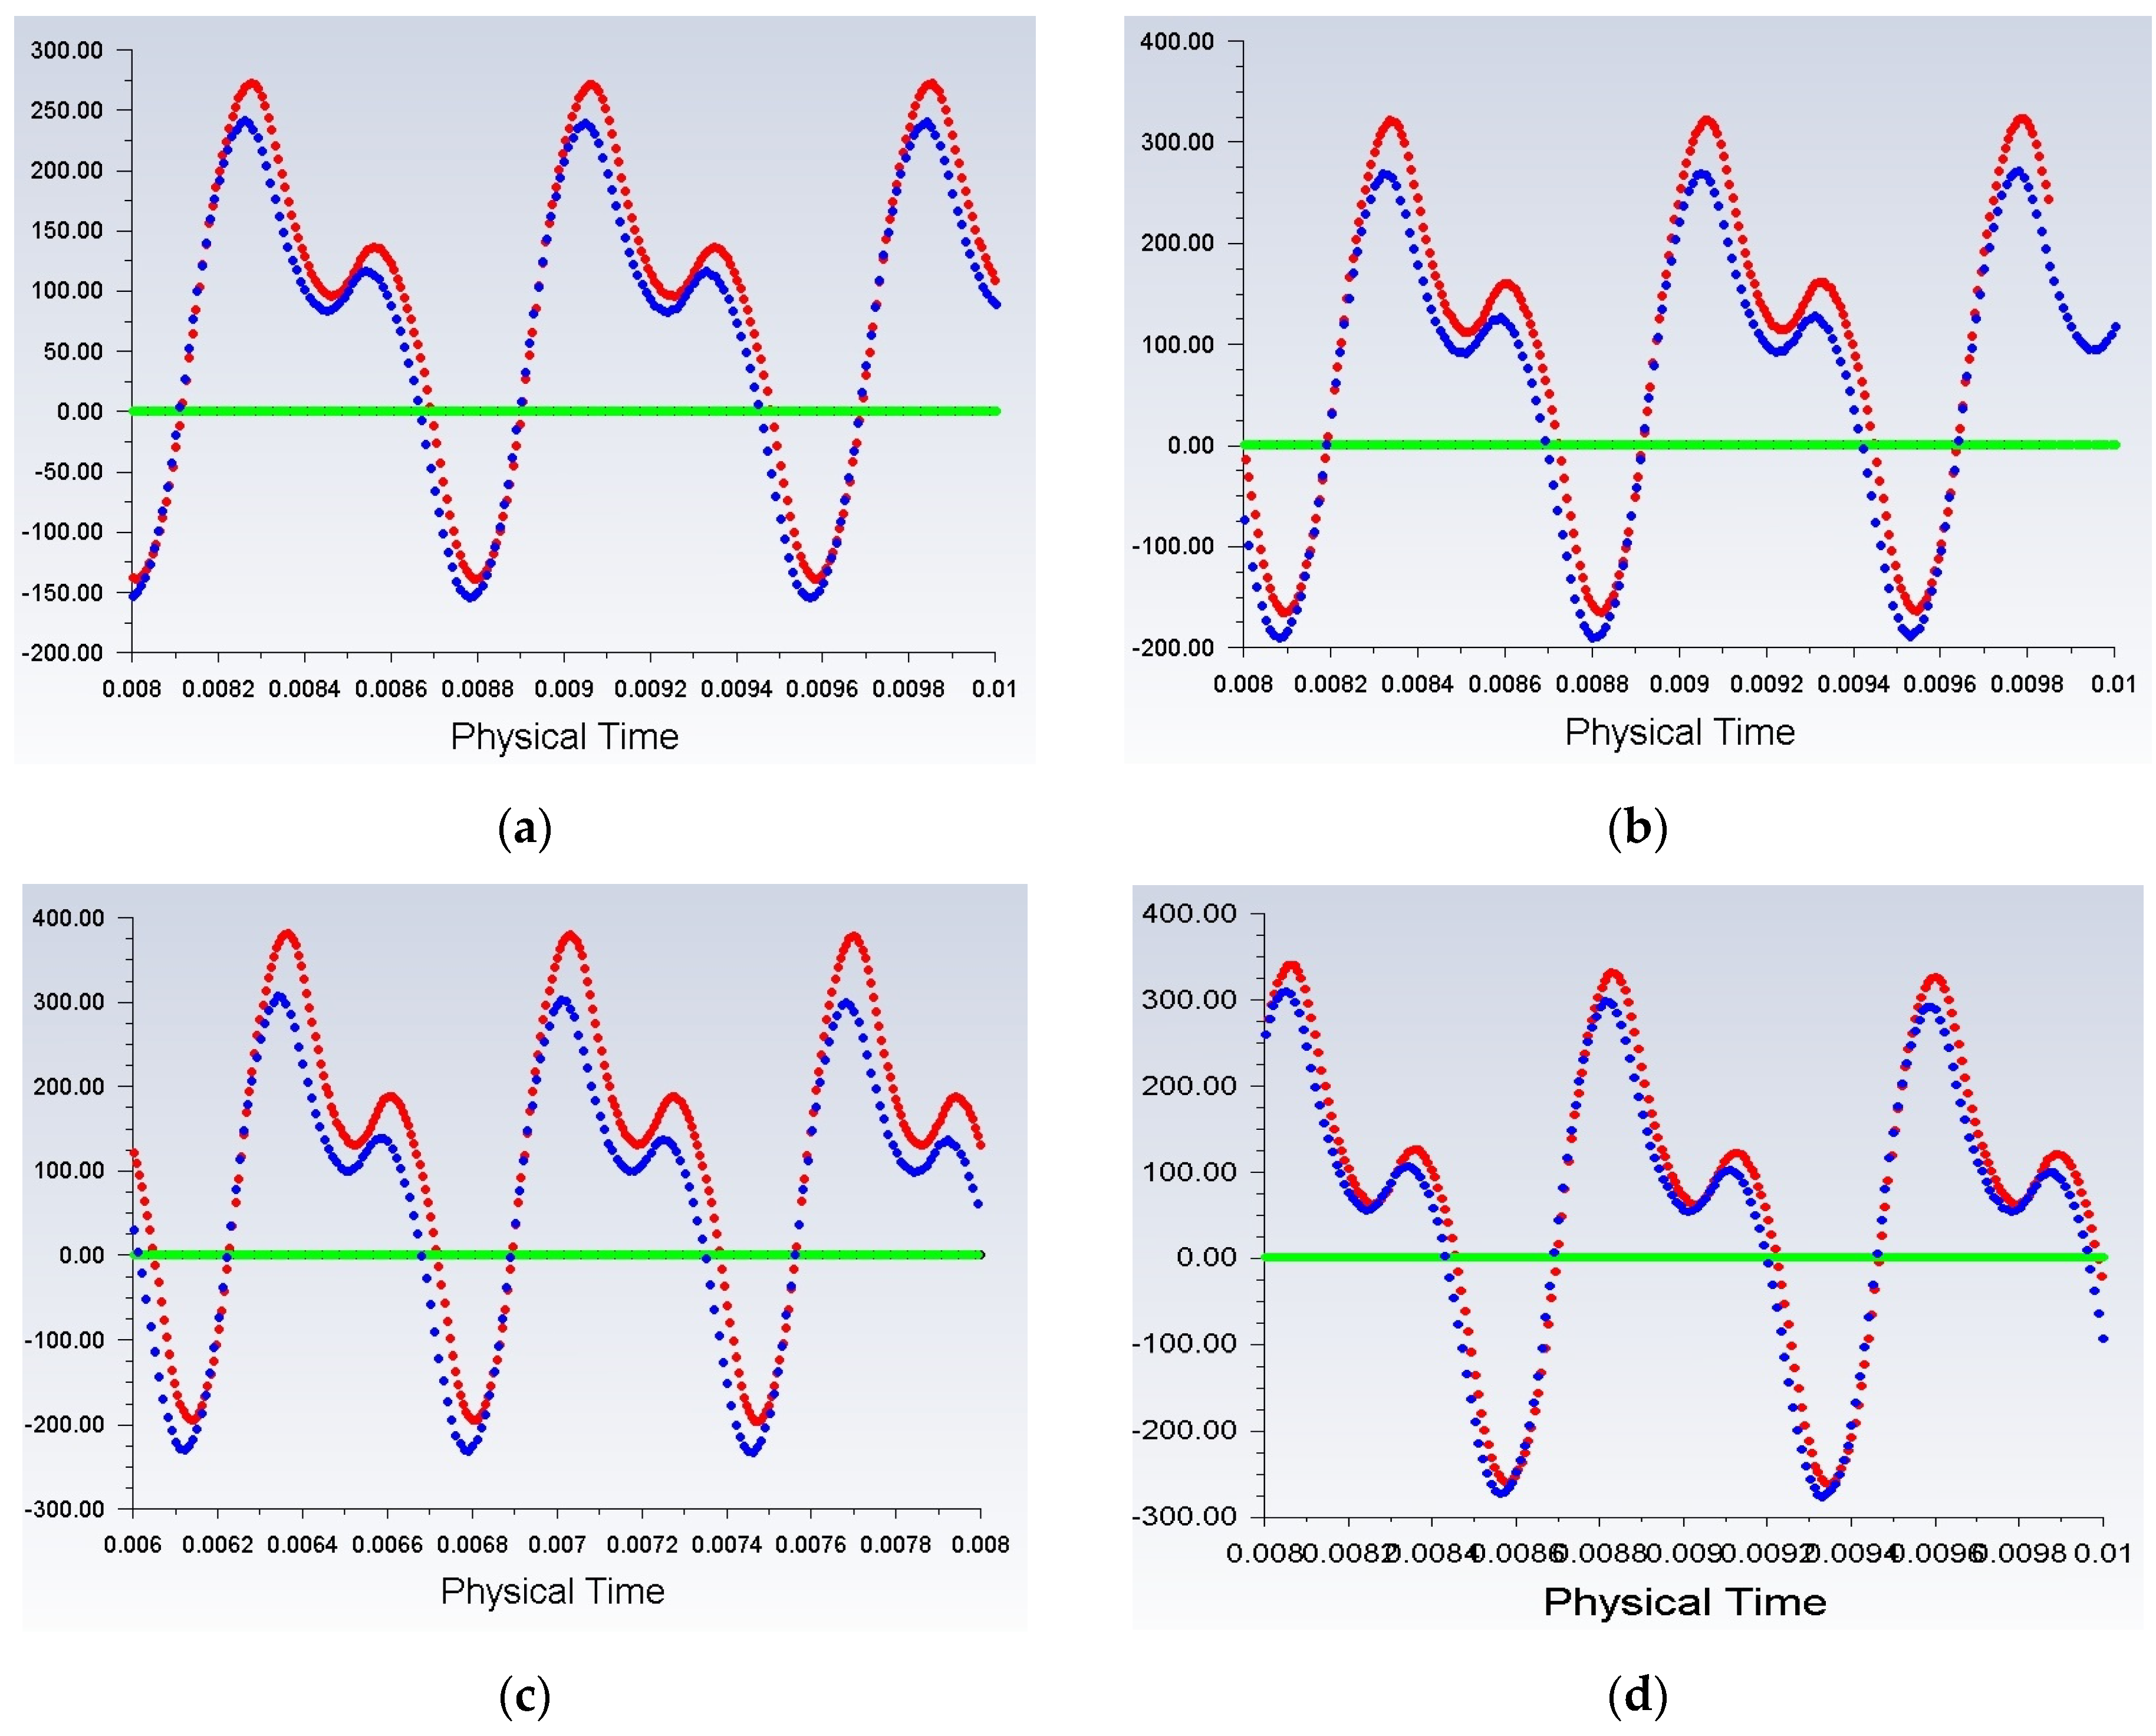
Figure 8.
Iso-velocity contours predicted at 8ms in the baseline geometry (BR=0.27) for cases (a) C4 (Re=6024, Vin=20.7m/s) and (b) Re=7770 (Vin=26.7m/s).
Figure 8.
Iso-velocity contours predicted at 8ms in the baseline geometry (BR=0.27) for cases (a) C4 (Re=6024, Vin=20.7m/s) and (b) Re=7770 (Vin=26.7m/s).
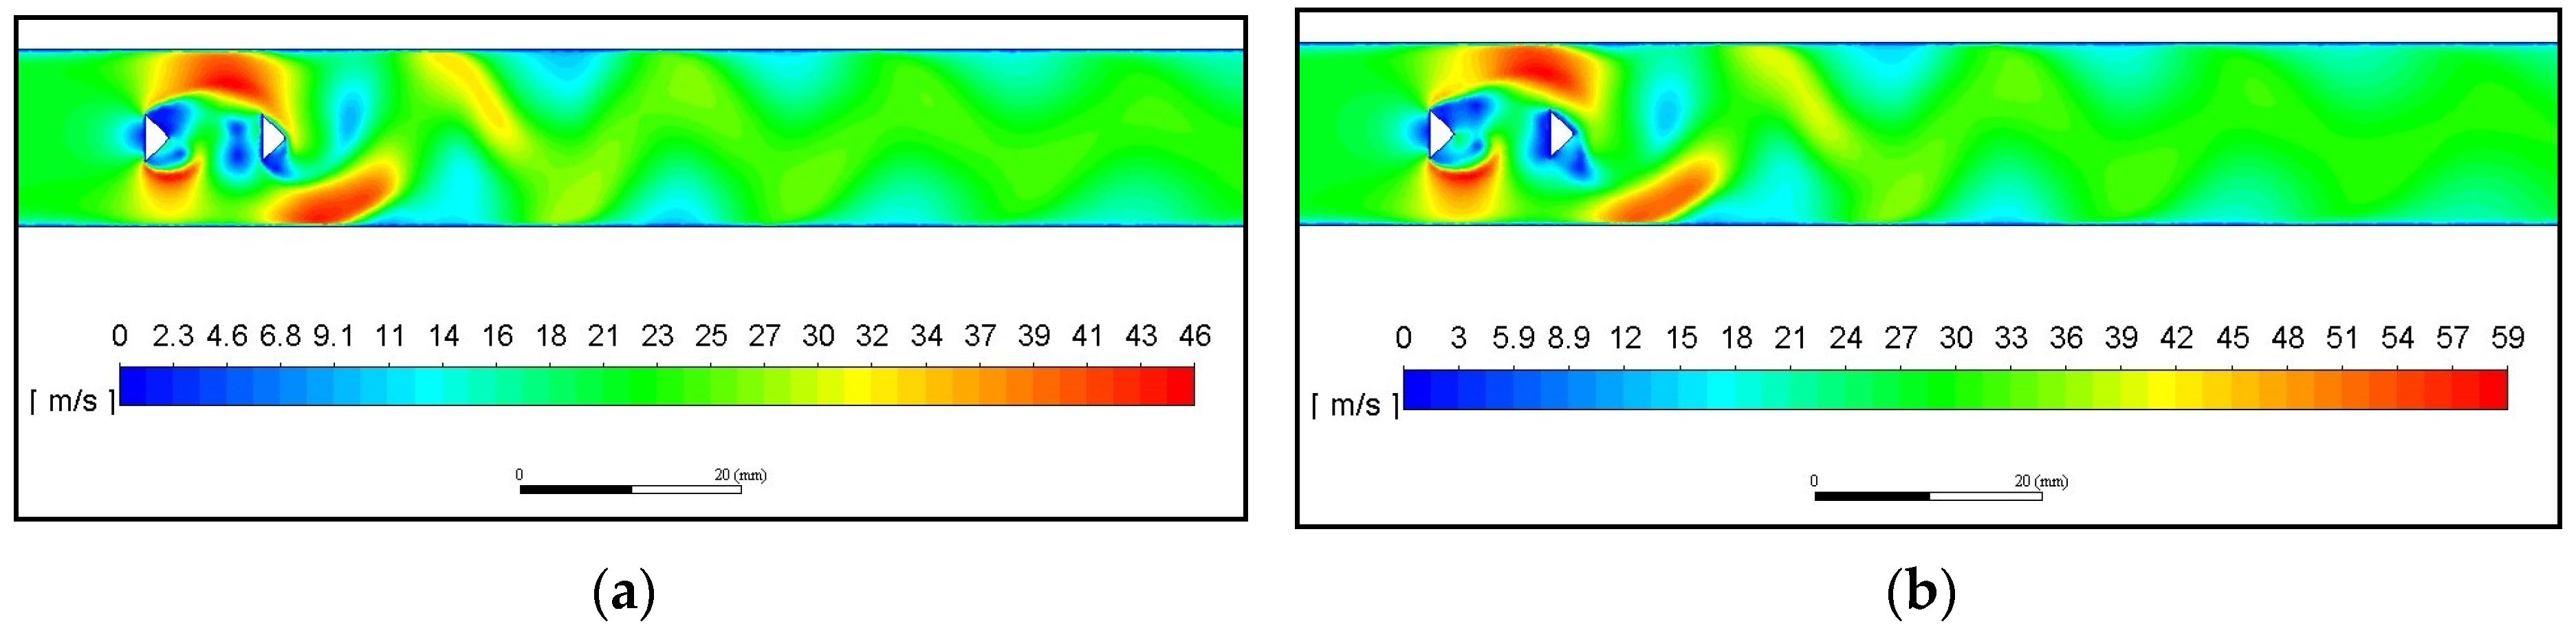
Figure 9.
Pressure fluctuation amplitude versus distance from the beginning of the diaphragm for baseline geometry (BR=0.27) and various inlet velocities (Re).
Figure 9.
Pressure fluctuation amplitude versus distance from the beginning of the diaphragm for baseline geometry (BR=0.27) and various inlet velocities (Re).
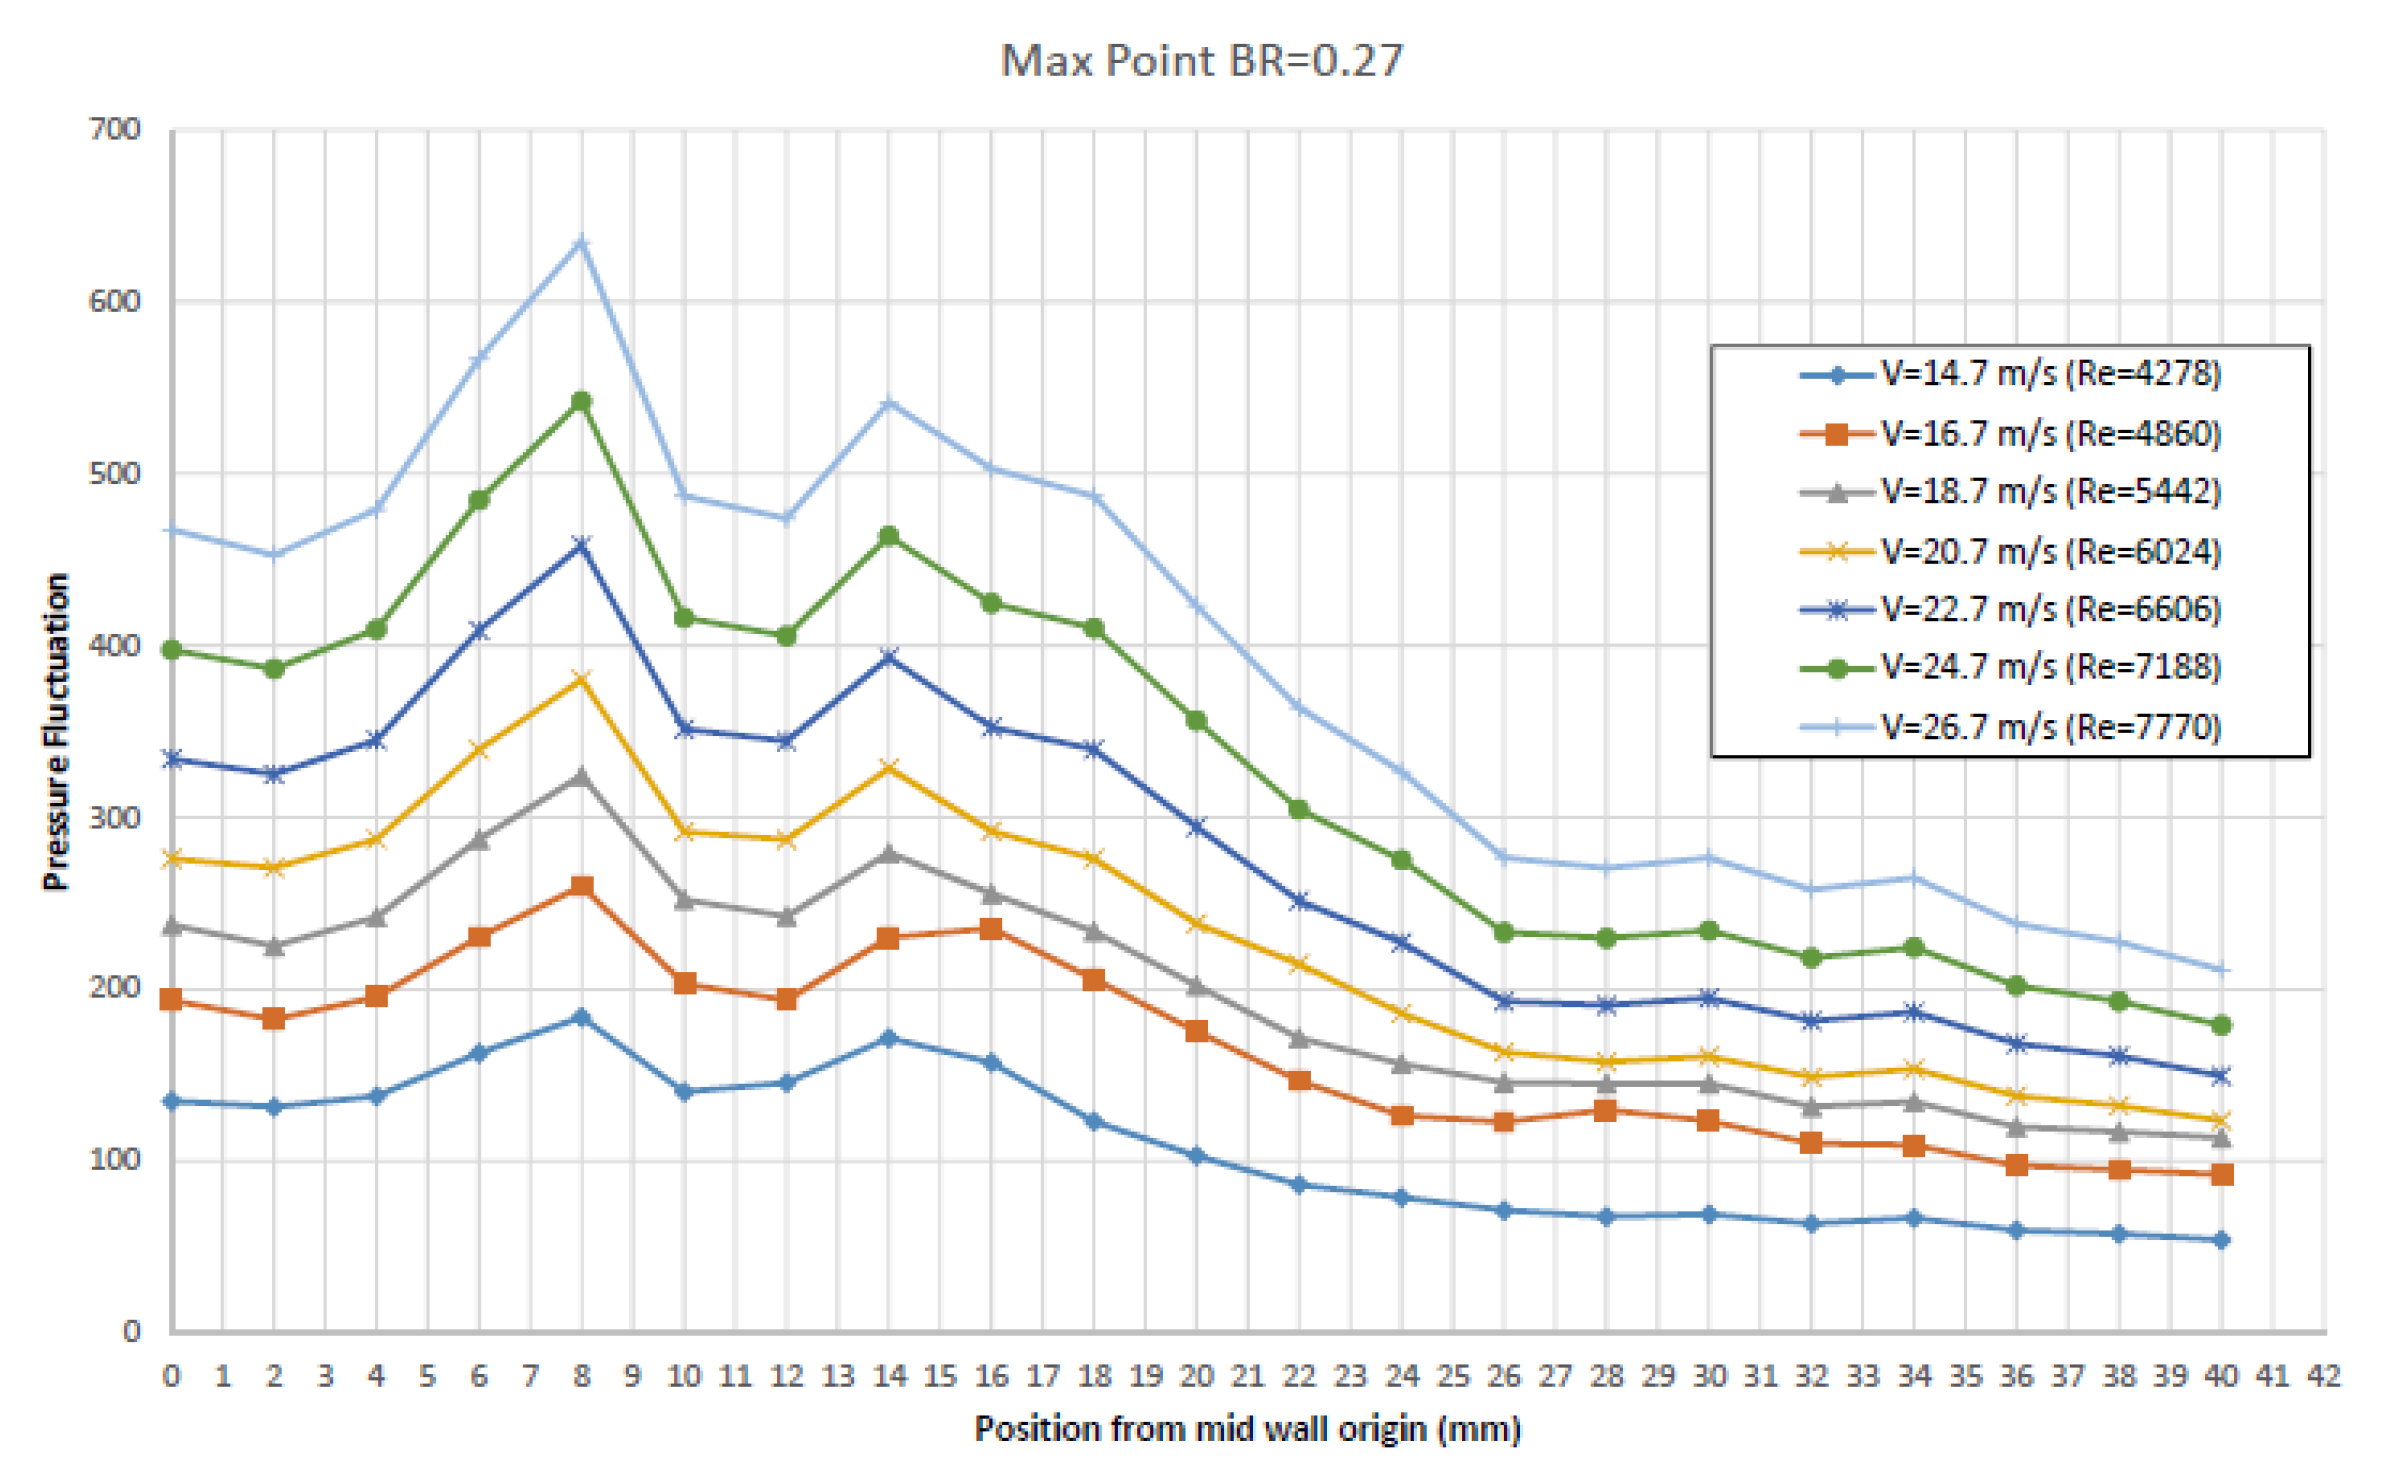
Figure 10.
(a) Pressure amplitude and mean pressure versus streamwise coordinate for the baseline case (from [3]). (b) Mean pressure versus distance from the beginning of diaphragm for baseline BR and various Re (present results).
Figure 10.
(a) Pressure amplitude and mean pressure versus streamwise coordinate for the baseline case (from [3]). (b) Mean pressure versus distance from the beginning of diaphragm for baseline BR and various Re (present results).
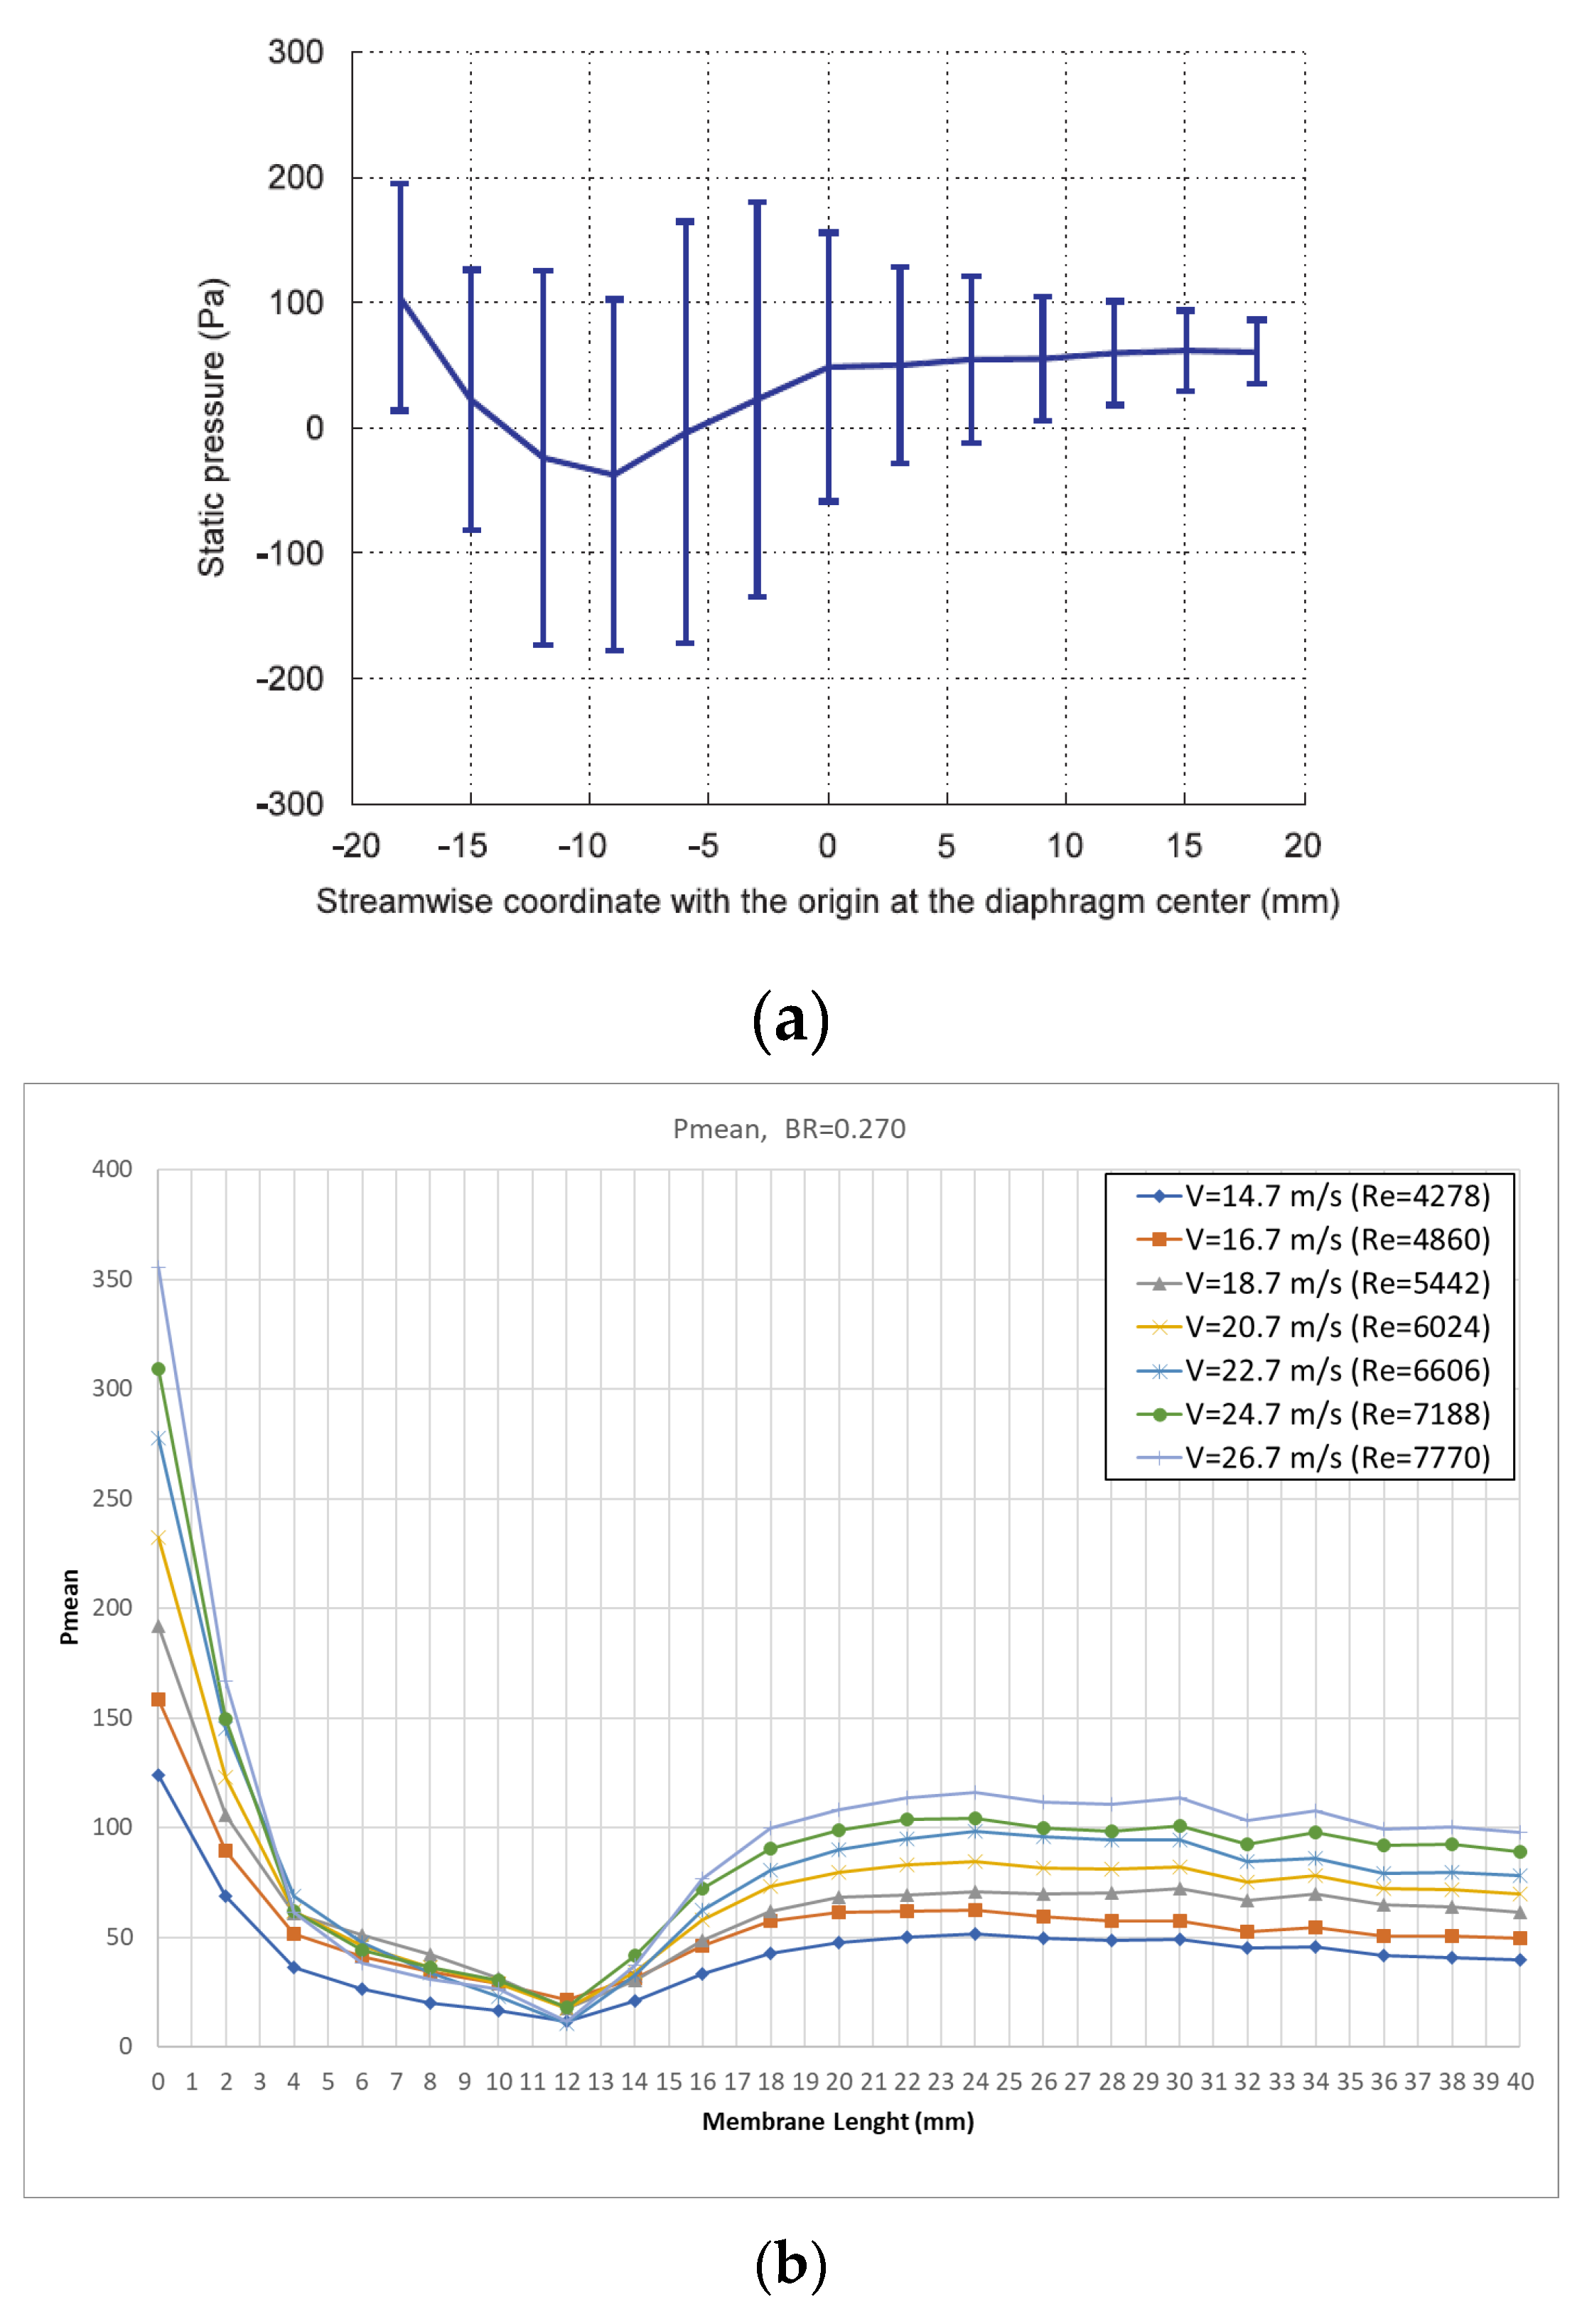
Figure 11.
Comparative pressure evolution for the baseline geometry at point P5 for cases (a) C1-C2, (b) C3-C4, (c) C5-C6 and (d) C7 (the same range has been used in the vertical axis).
Figure 11.
Comparative pressure evolution for the baseline geometry at point P5 for cases (a) C1-C2, (b) C3-C4, (c) C5-C6 and (d) C7 (the same range has been used in the vertical axis).
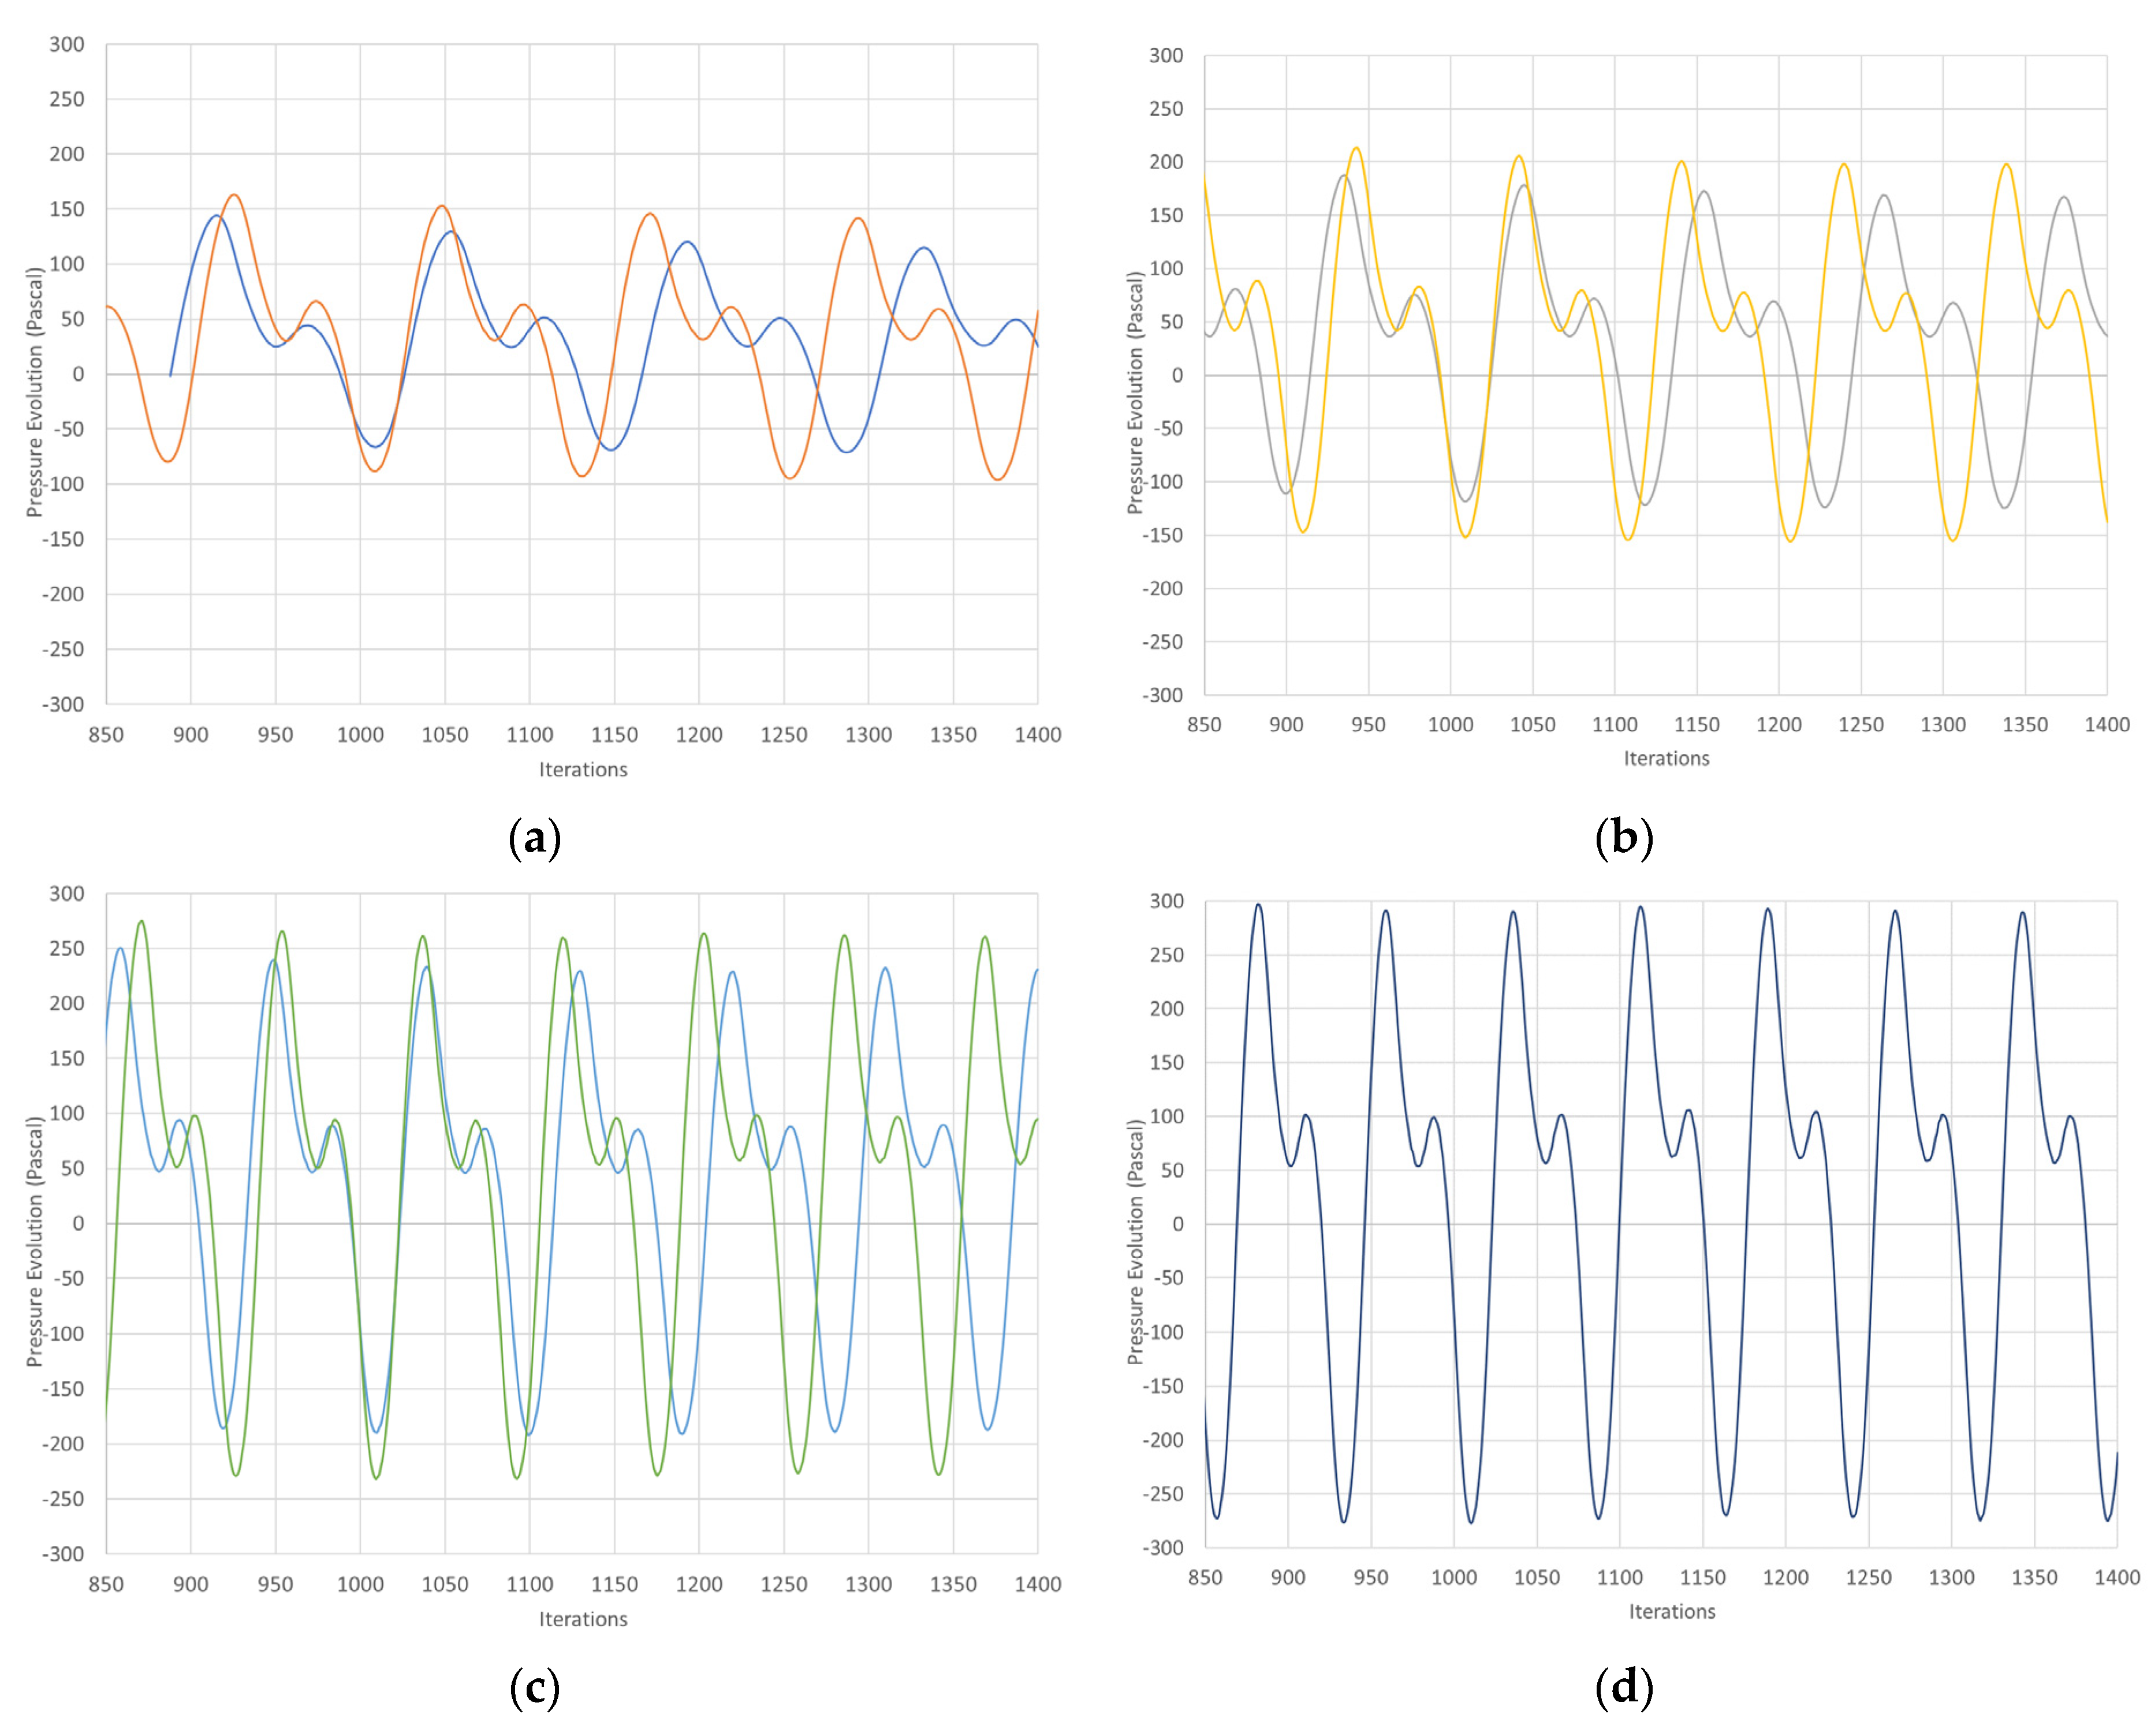
Figure 12.
(a) Pressure amplitude vs inlet velocity and (b) pressure amplitude coefficient vs Reynolds number.
Figure 12.
(a) Pressure amplitude vs inlet velocity and (b) pressure amplitude coefficient vs Reynolds number.
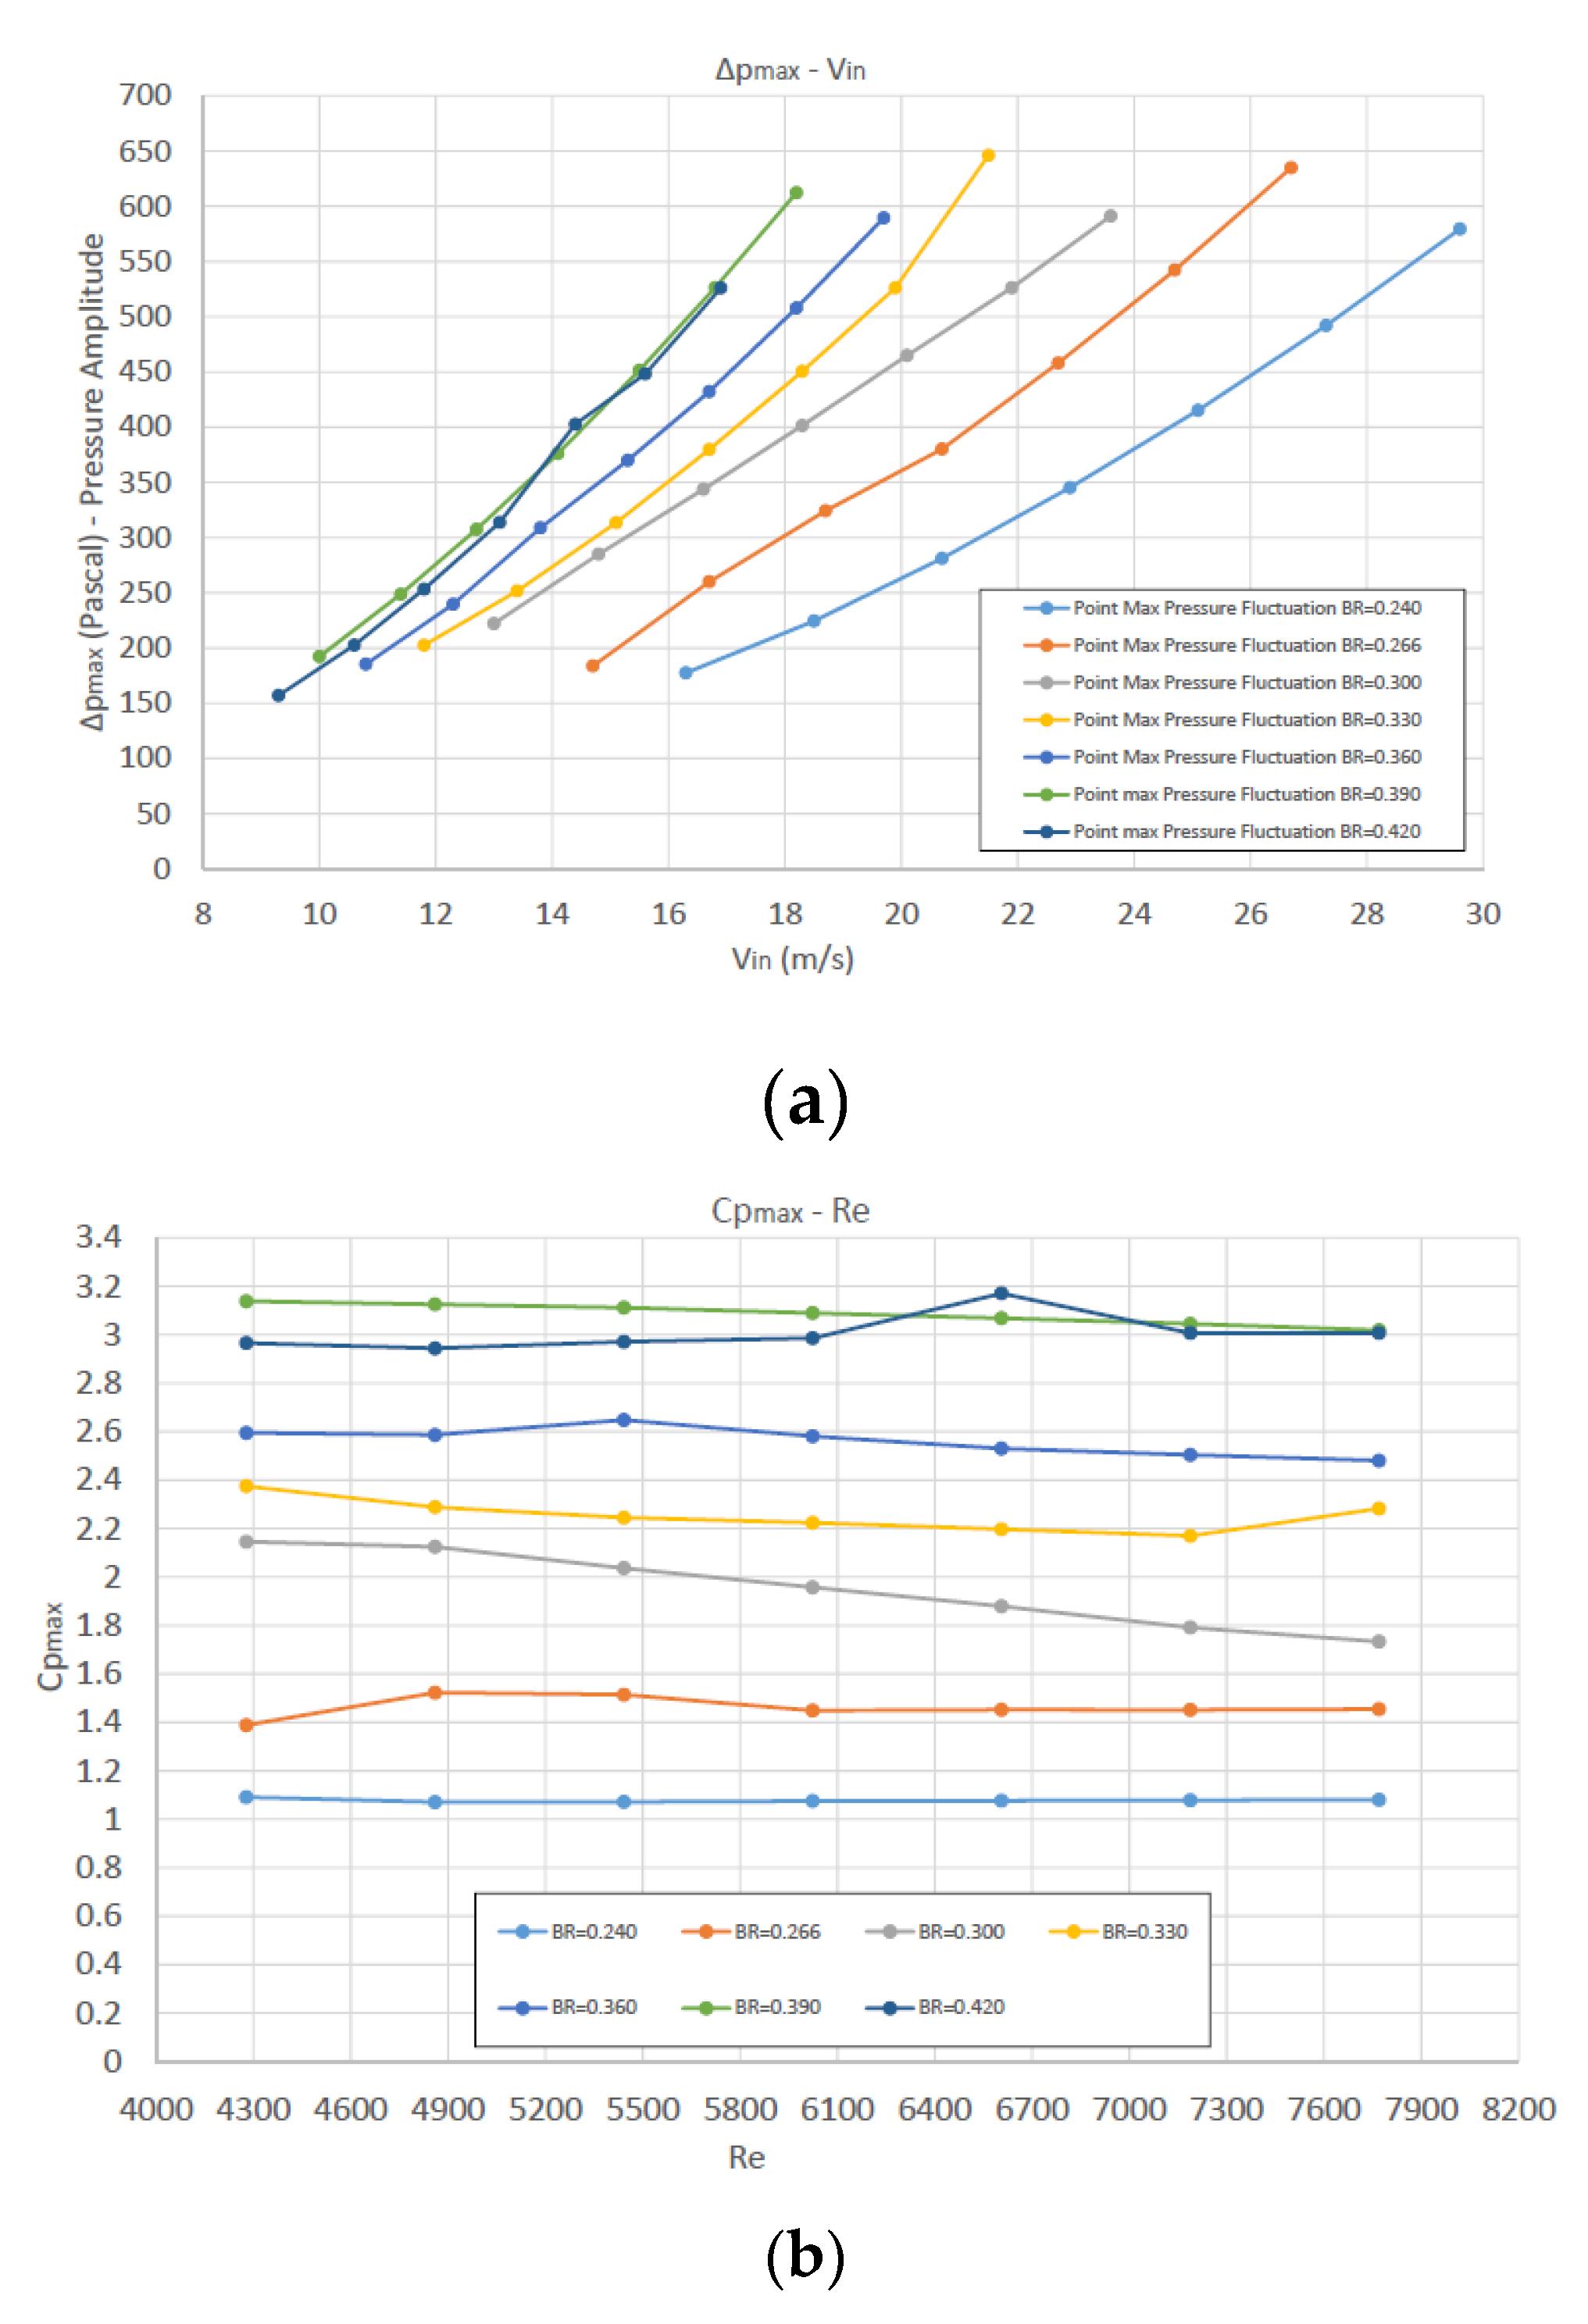
Figure 13.
(a) Frequency vs inlet velocity and (b) Strouhal vs Reynolds number, for various BR.
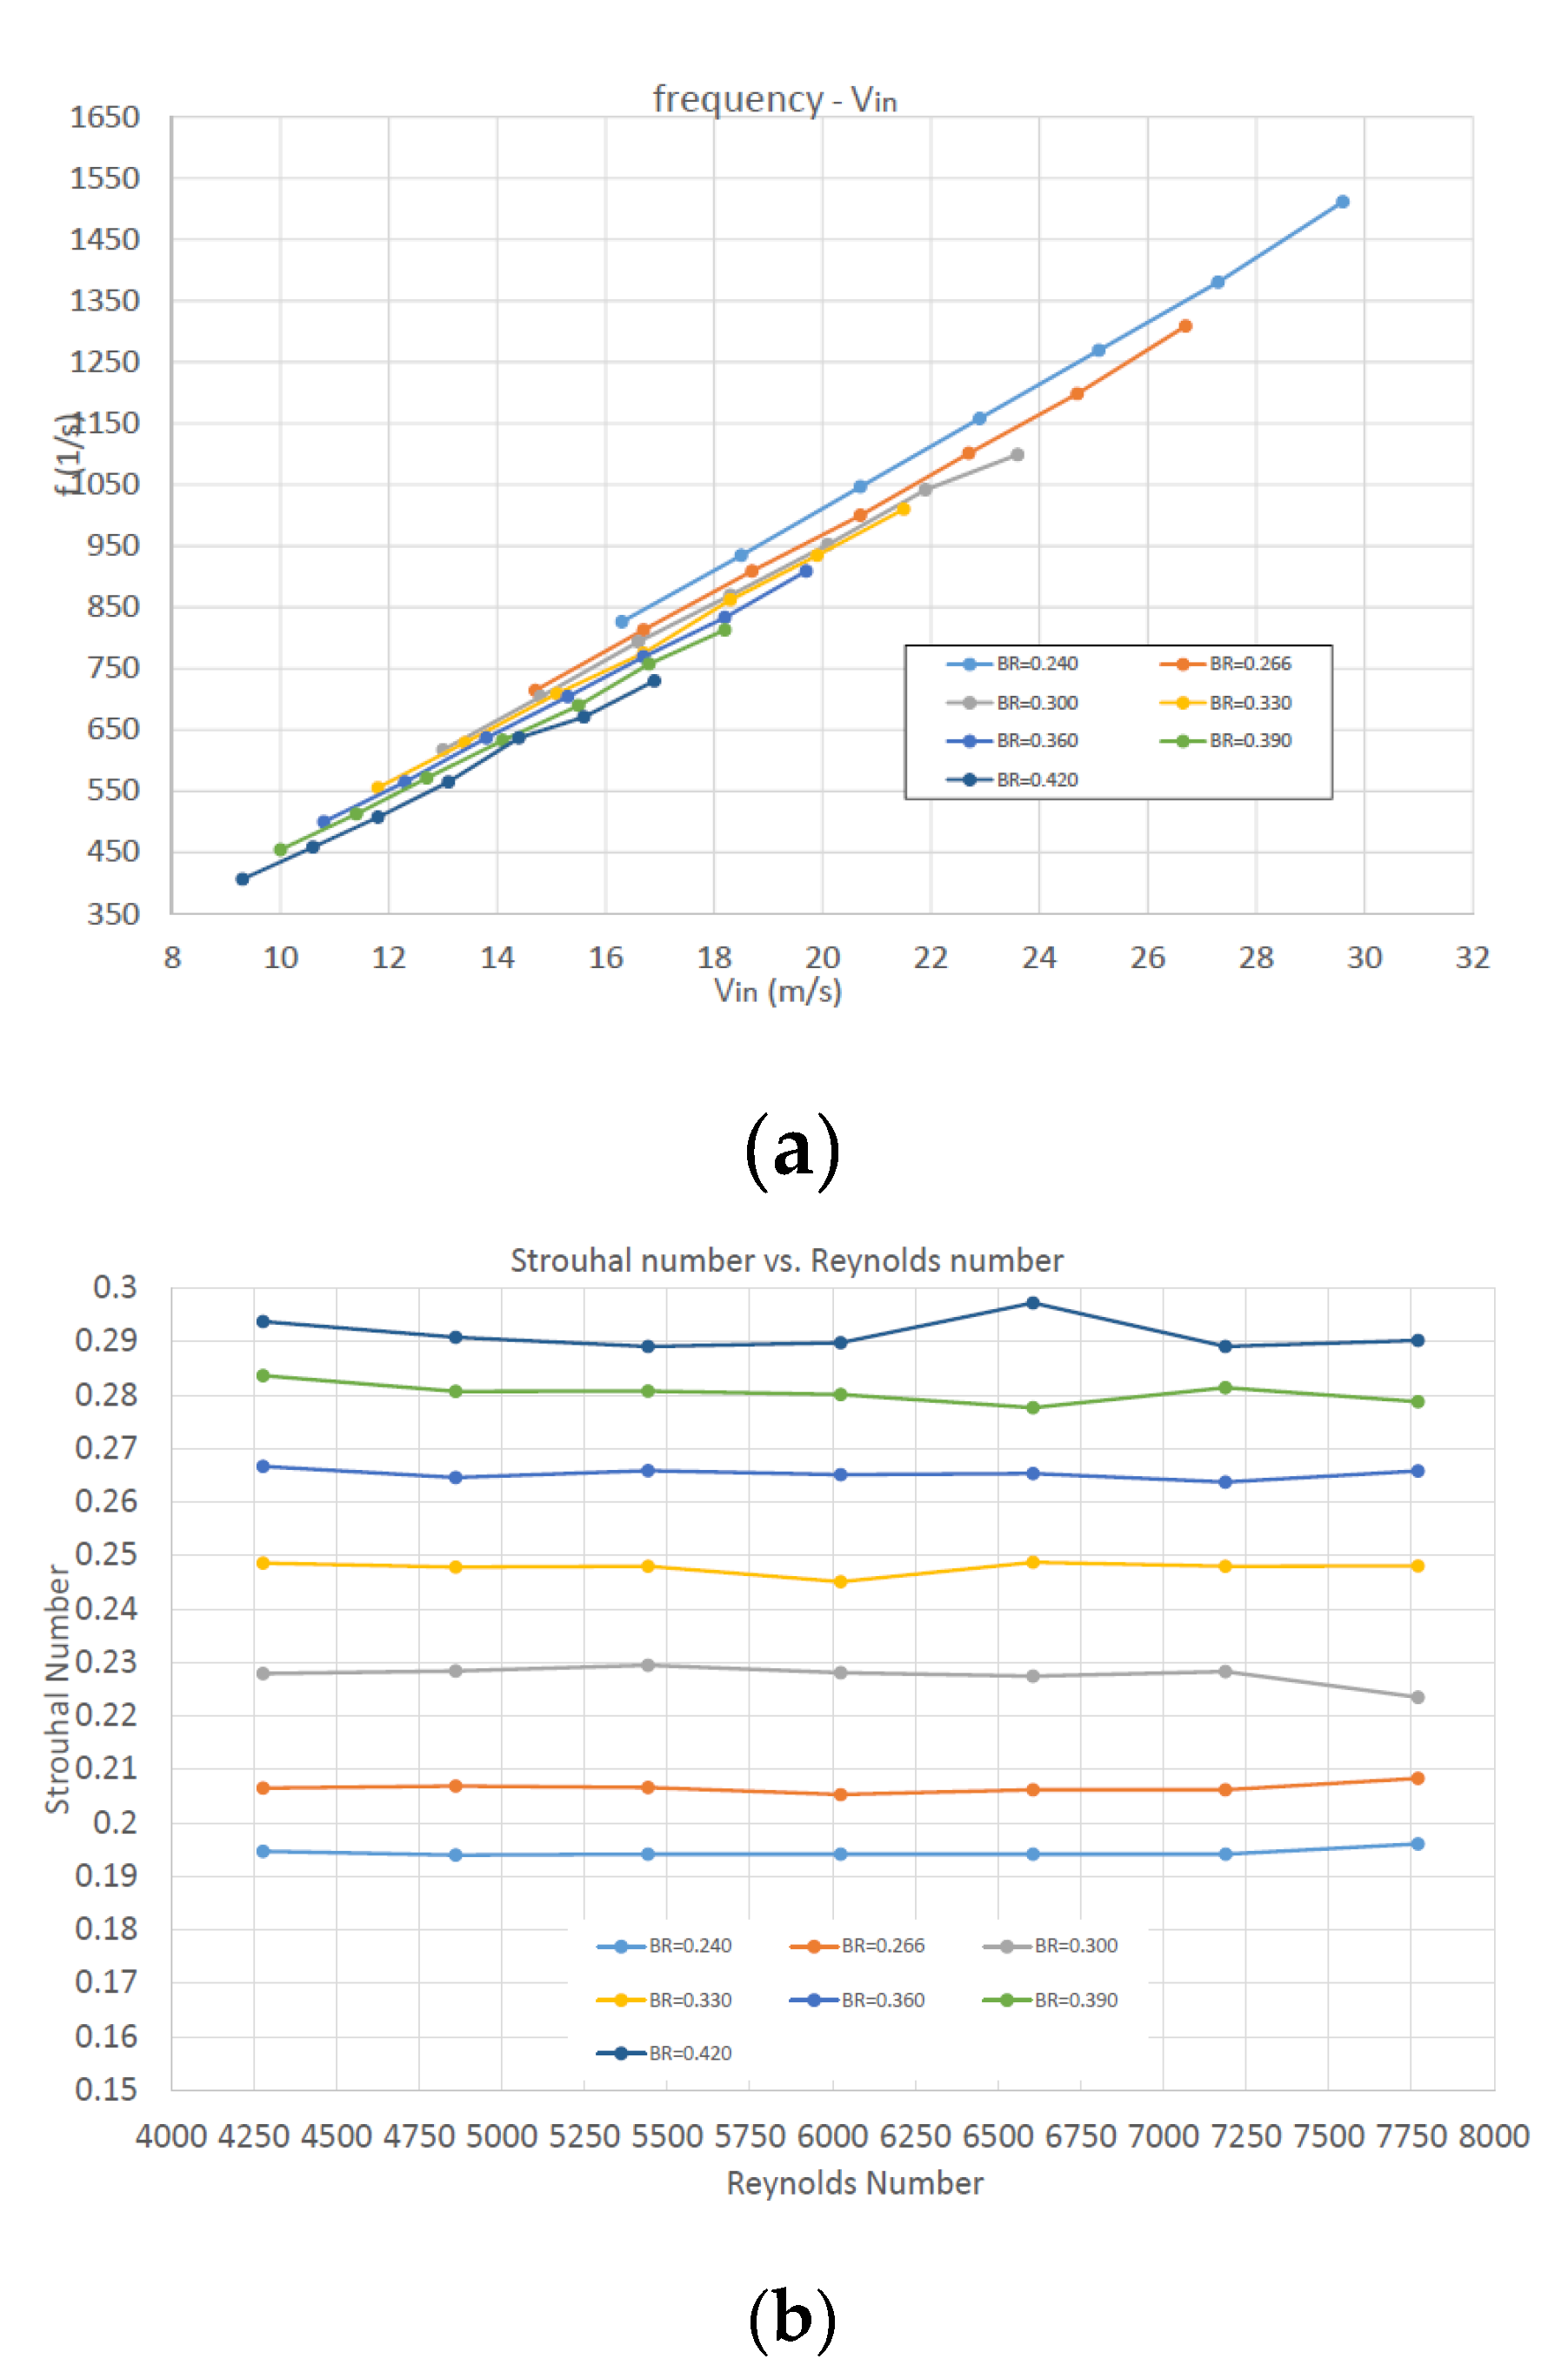
Figure 14.
(a) Average pressure drop vs inlet velocity and (b) average pressure drop coeffficent vs Re, for various values of BR.
Figure 14.
(a) Average pressure drop vs inlet velocity and (b) average pressure drop coeffficent vs Re, for various values of BR.
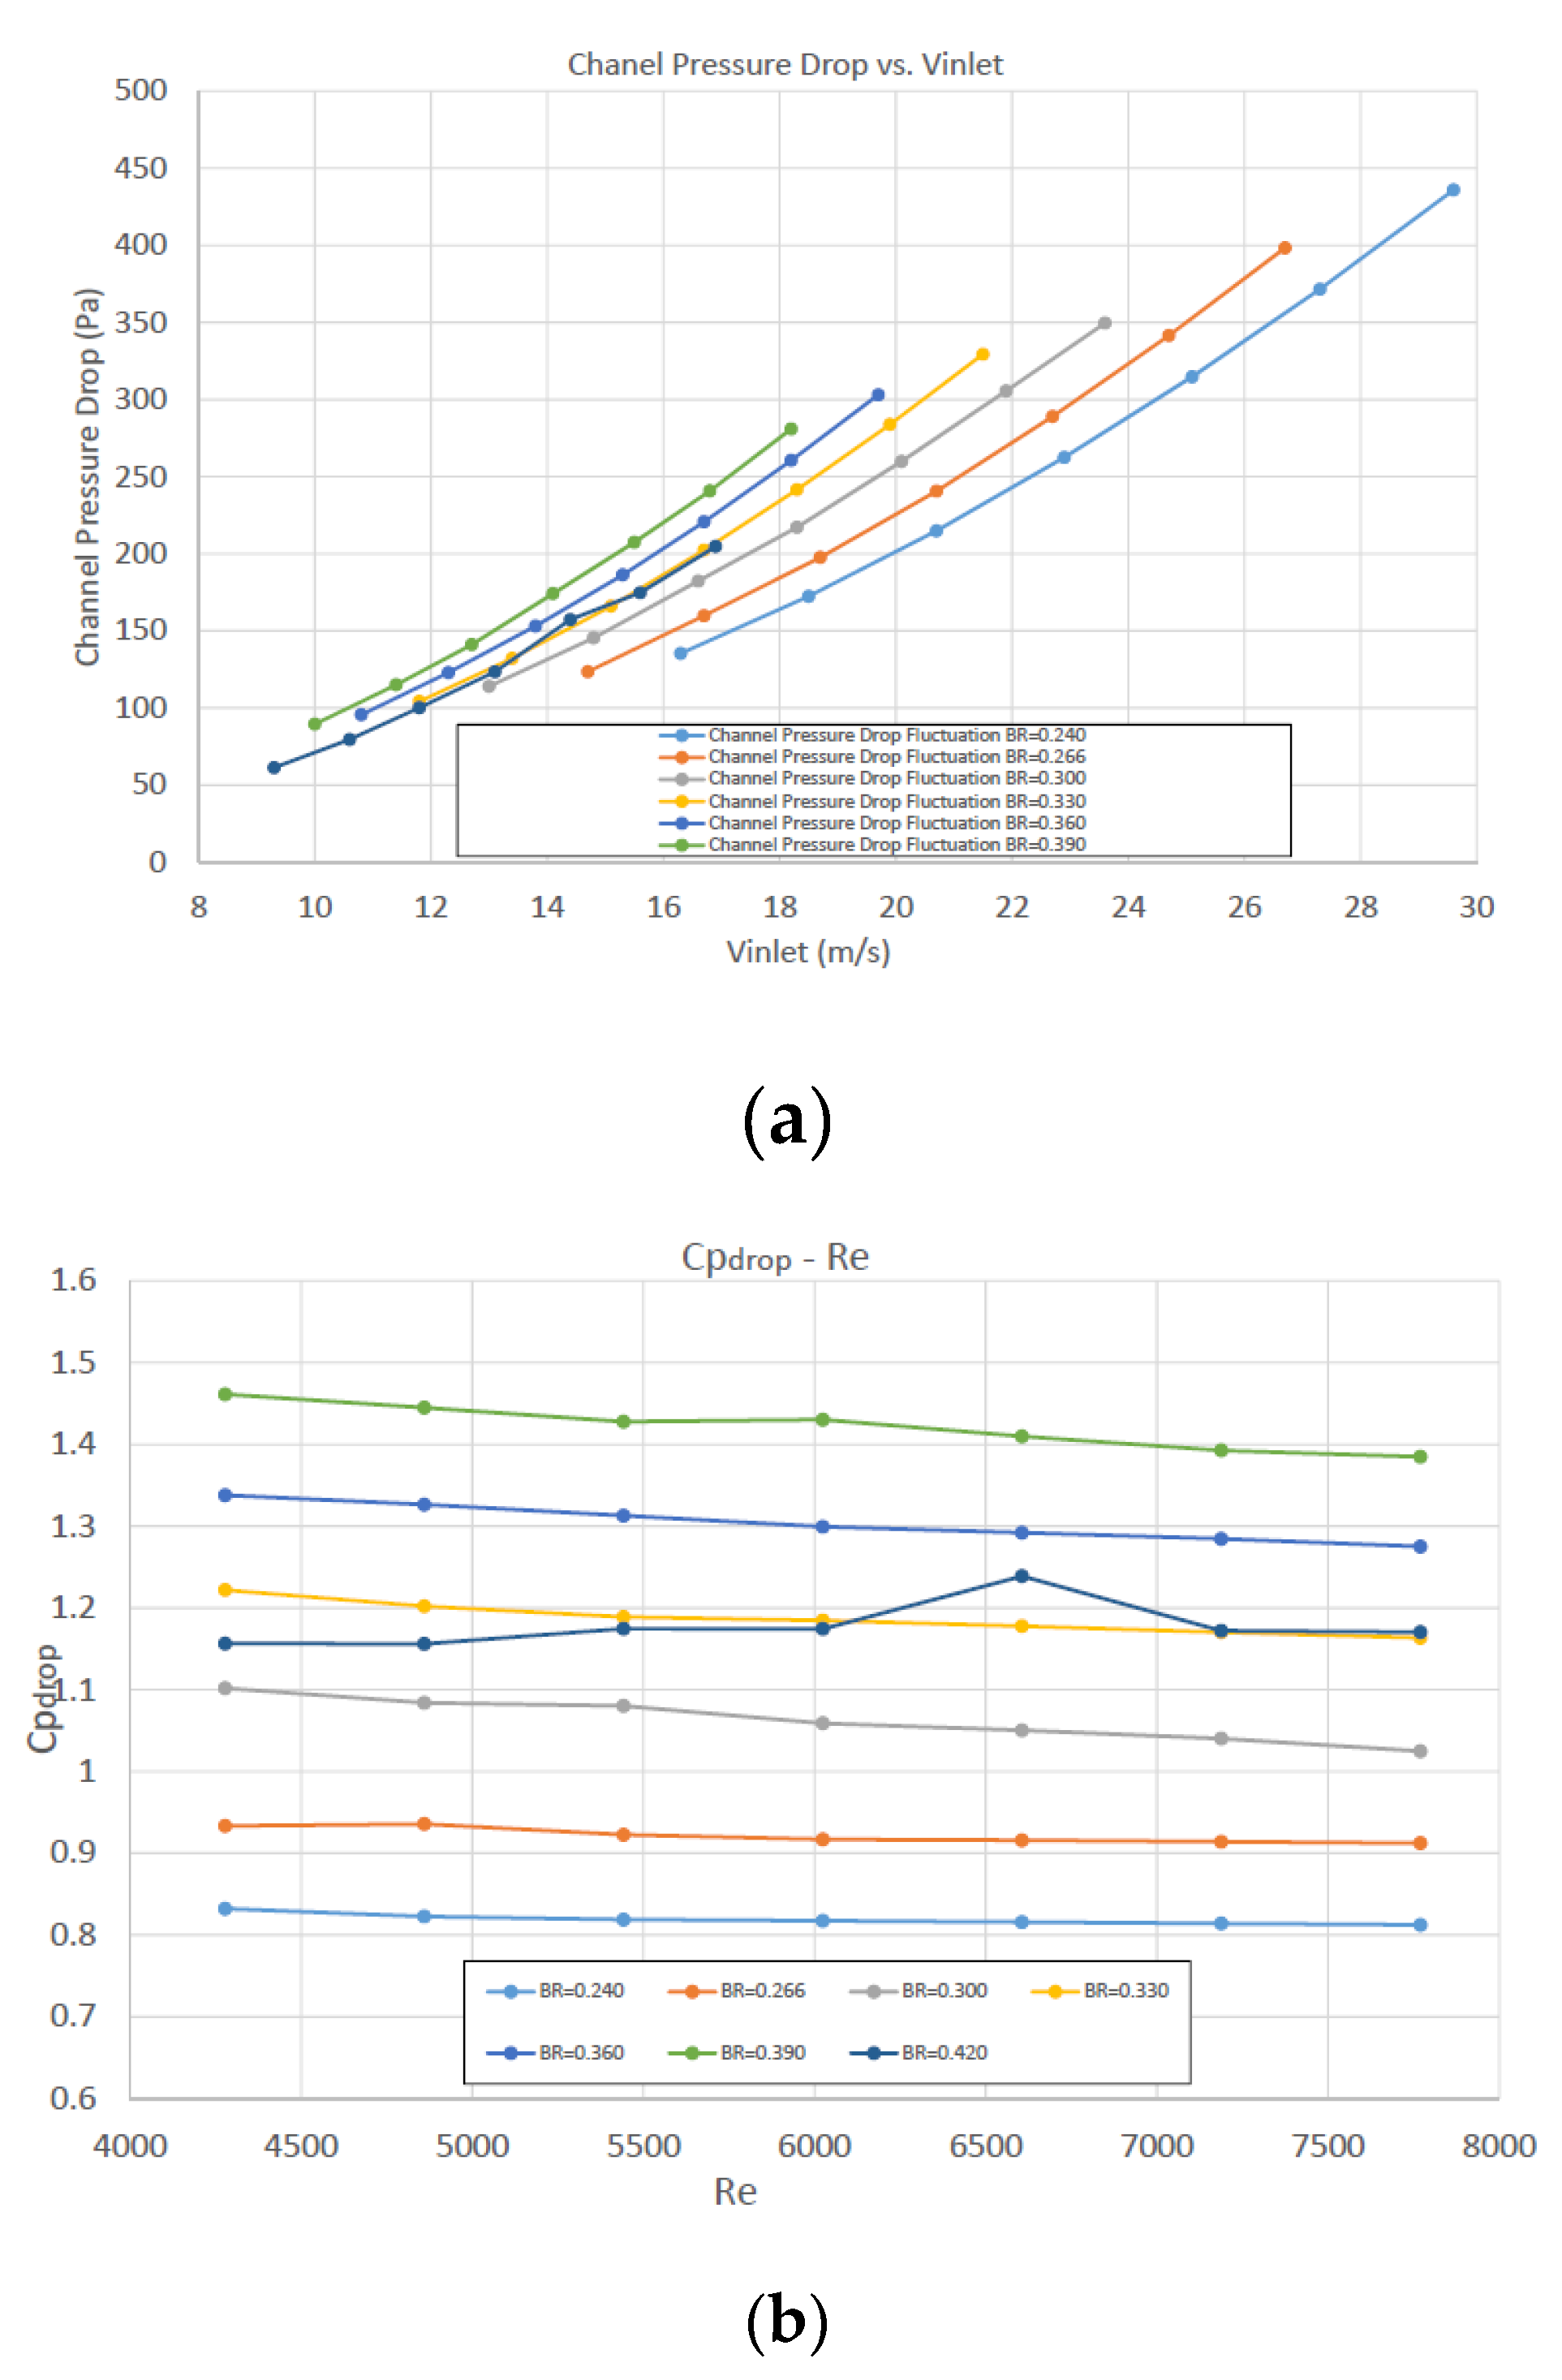
Figure 15.
(a) Pressure amplitude and (b) Strouhal number against BR for various Re.
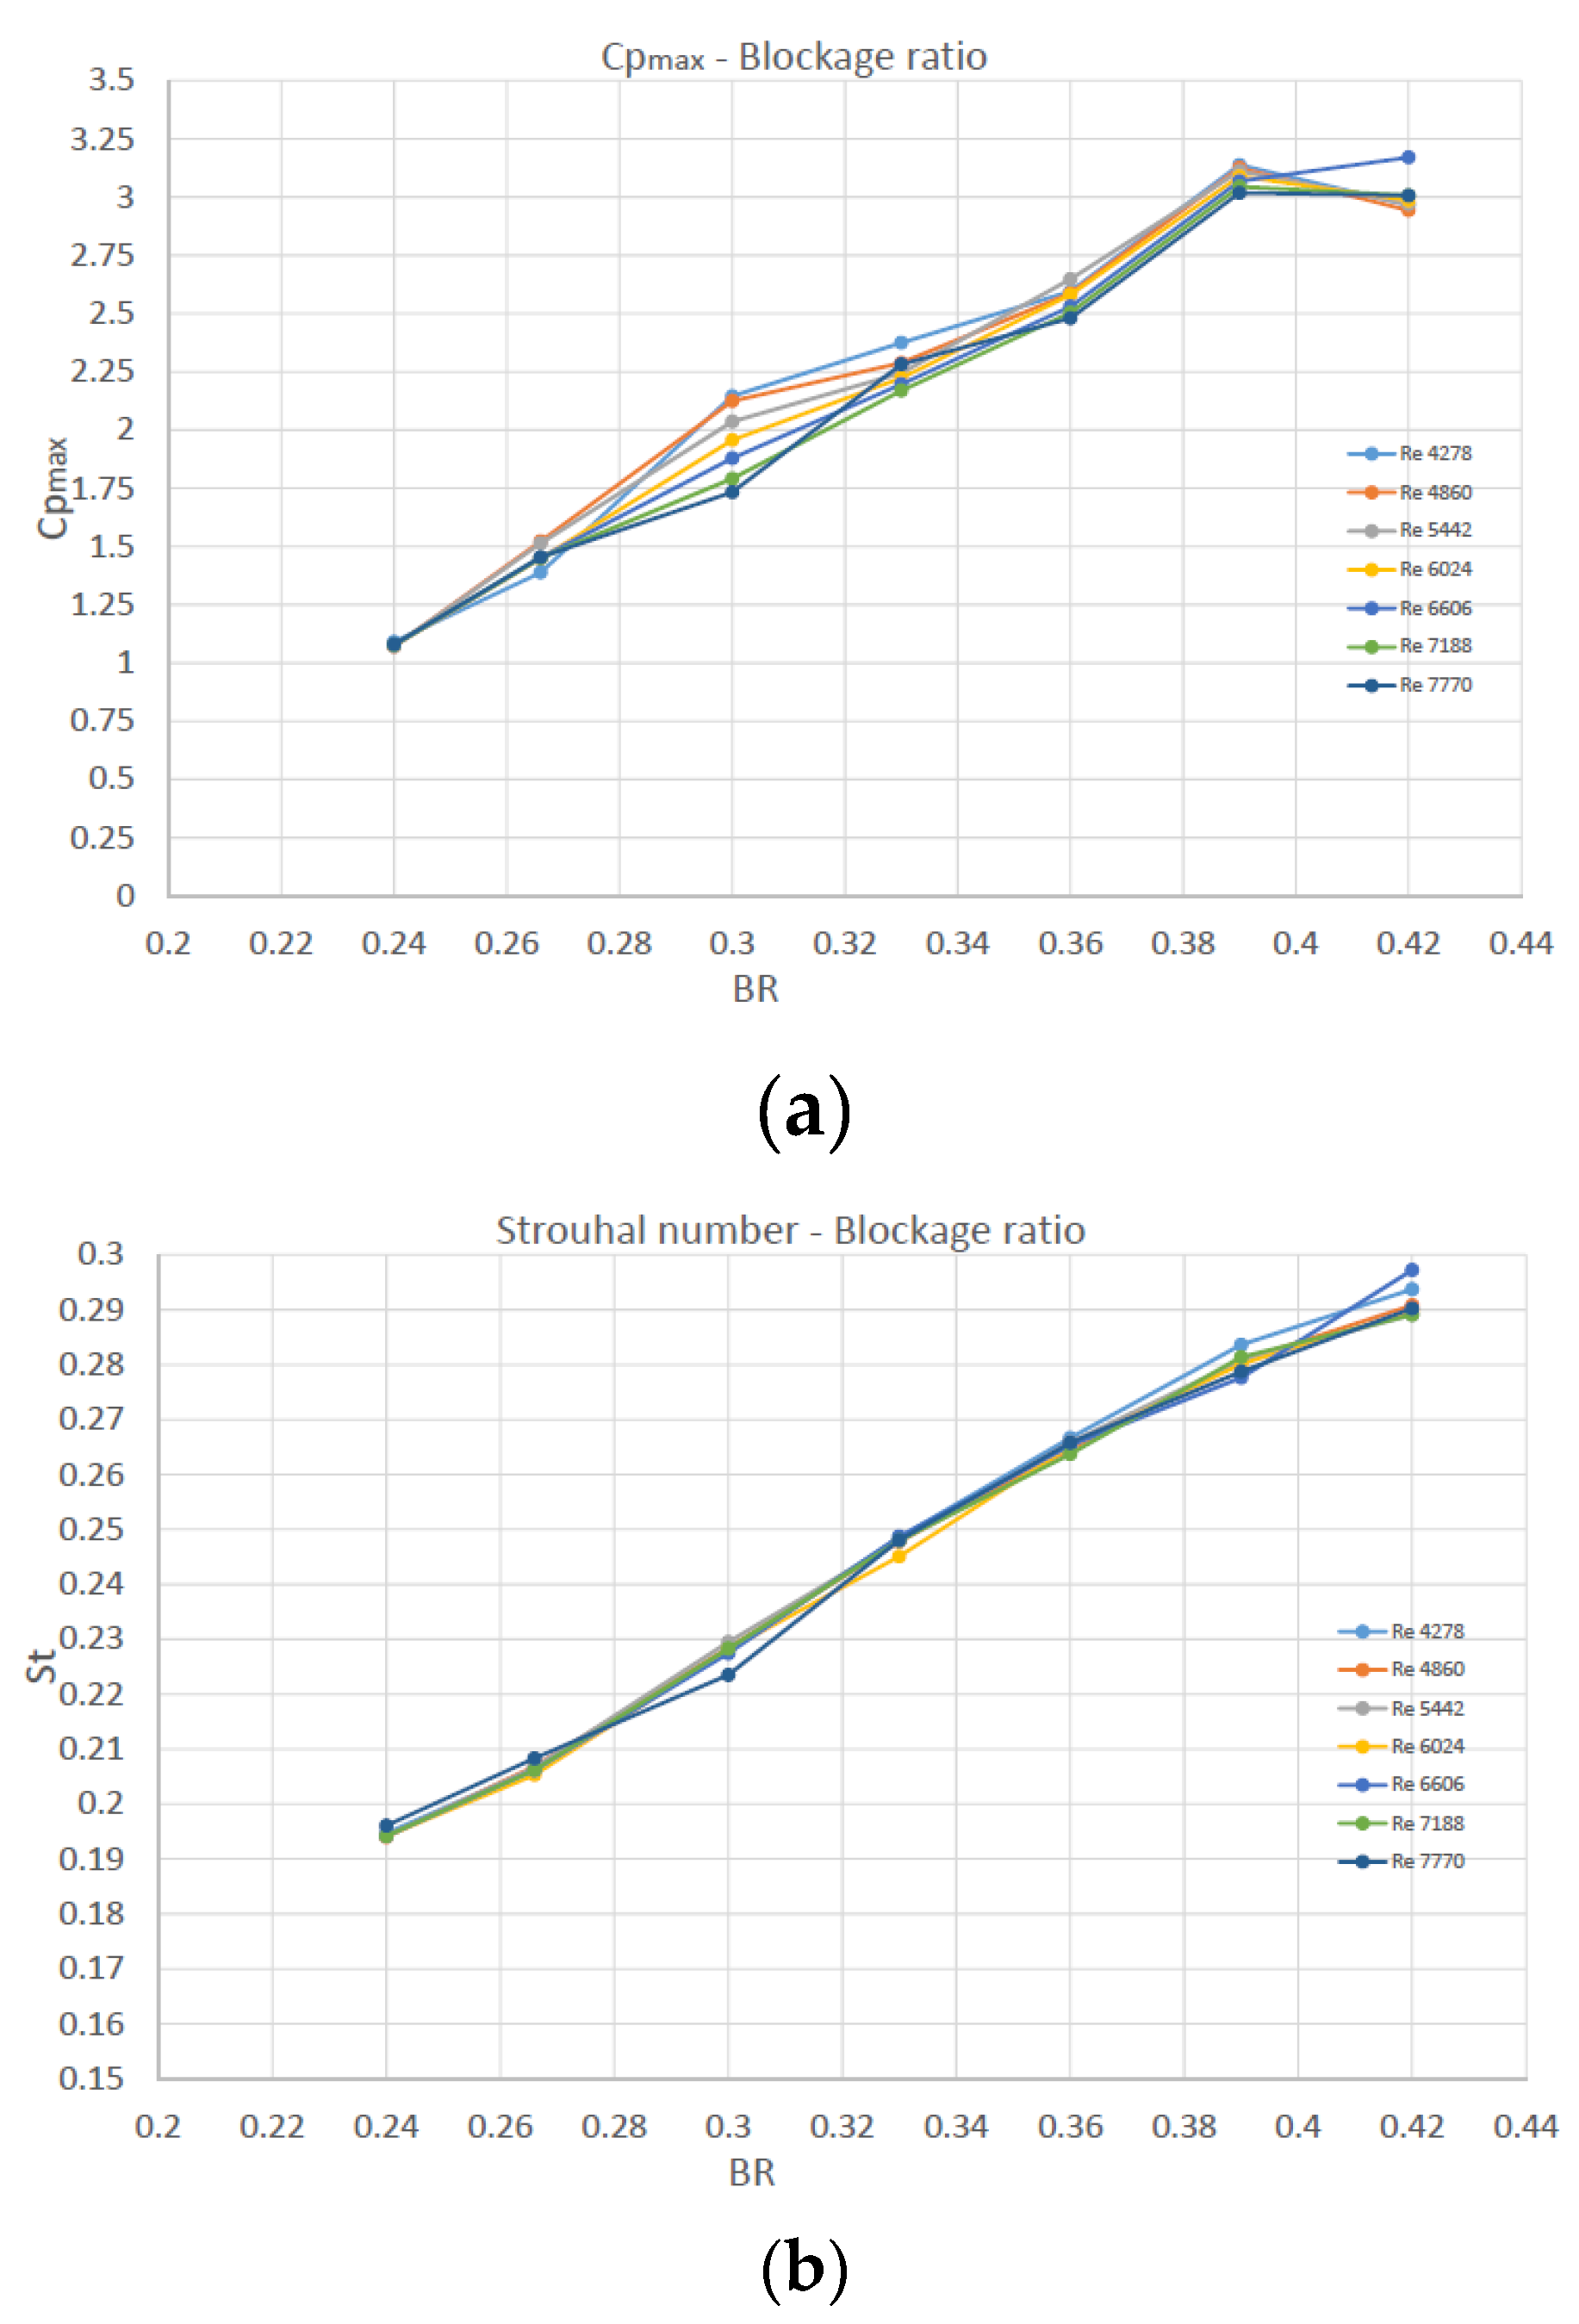
Figure 16.
Average pressure drop coefficient vs BR for various Re.
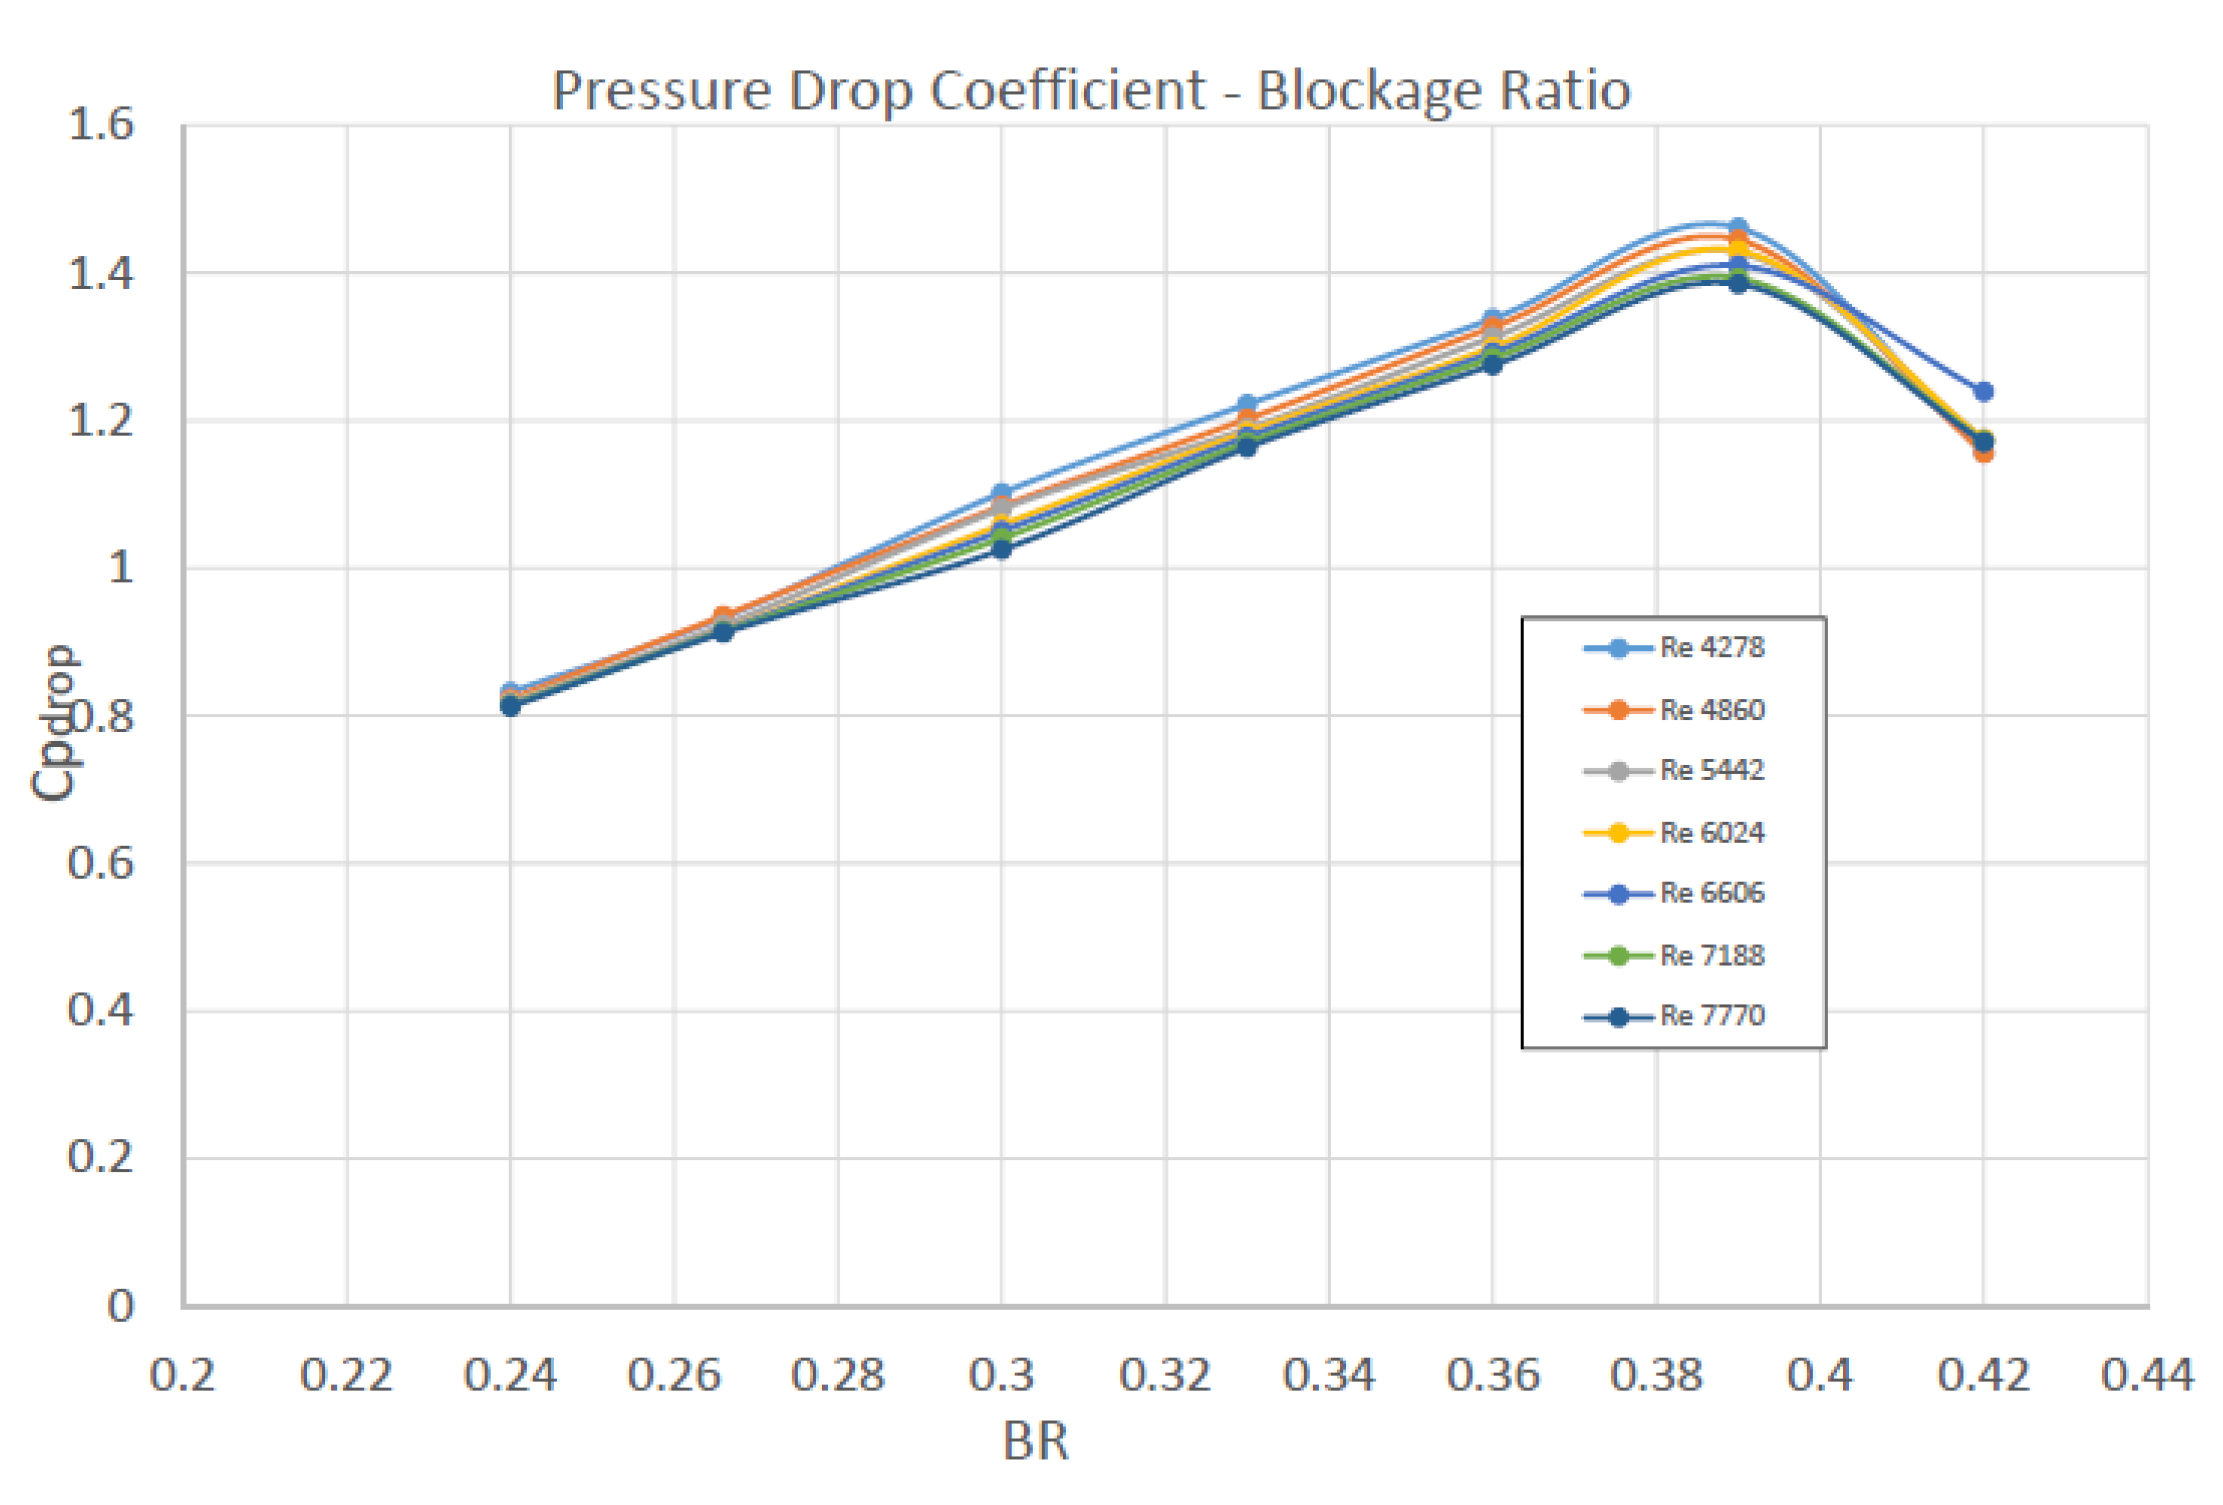
Figure 17.
Pressure mean value and amplitude at the center of the diaphragm vs BR (reproduced by [3]).
Figure 17.
Pressure mean value and amplitude at the center of the diaphragm vs BR (reproduced by [3]).
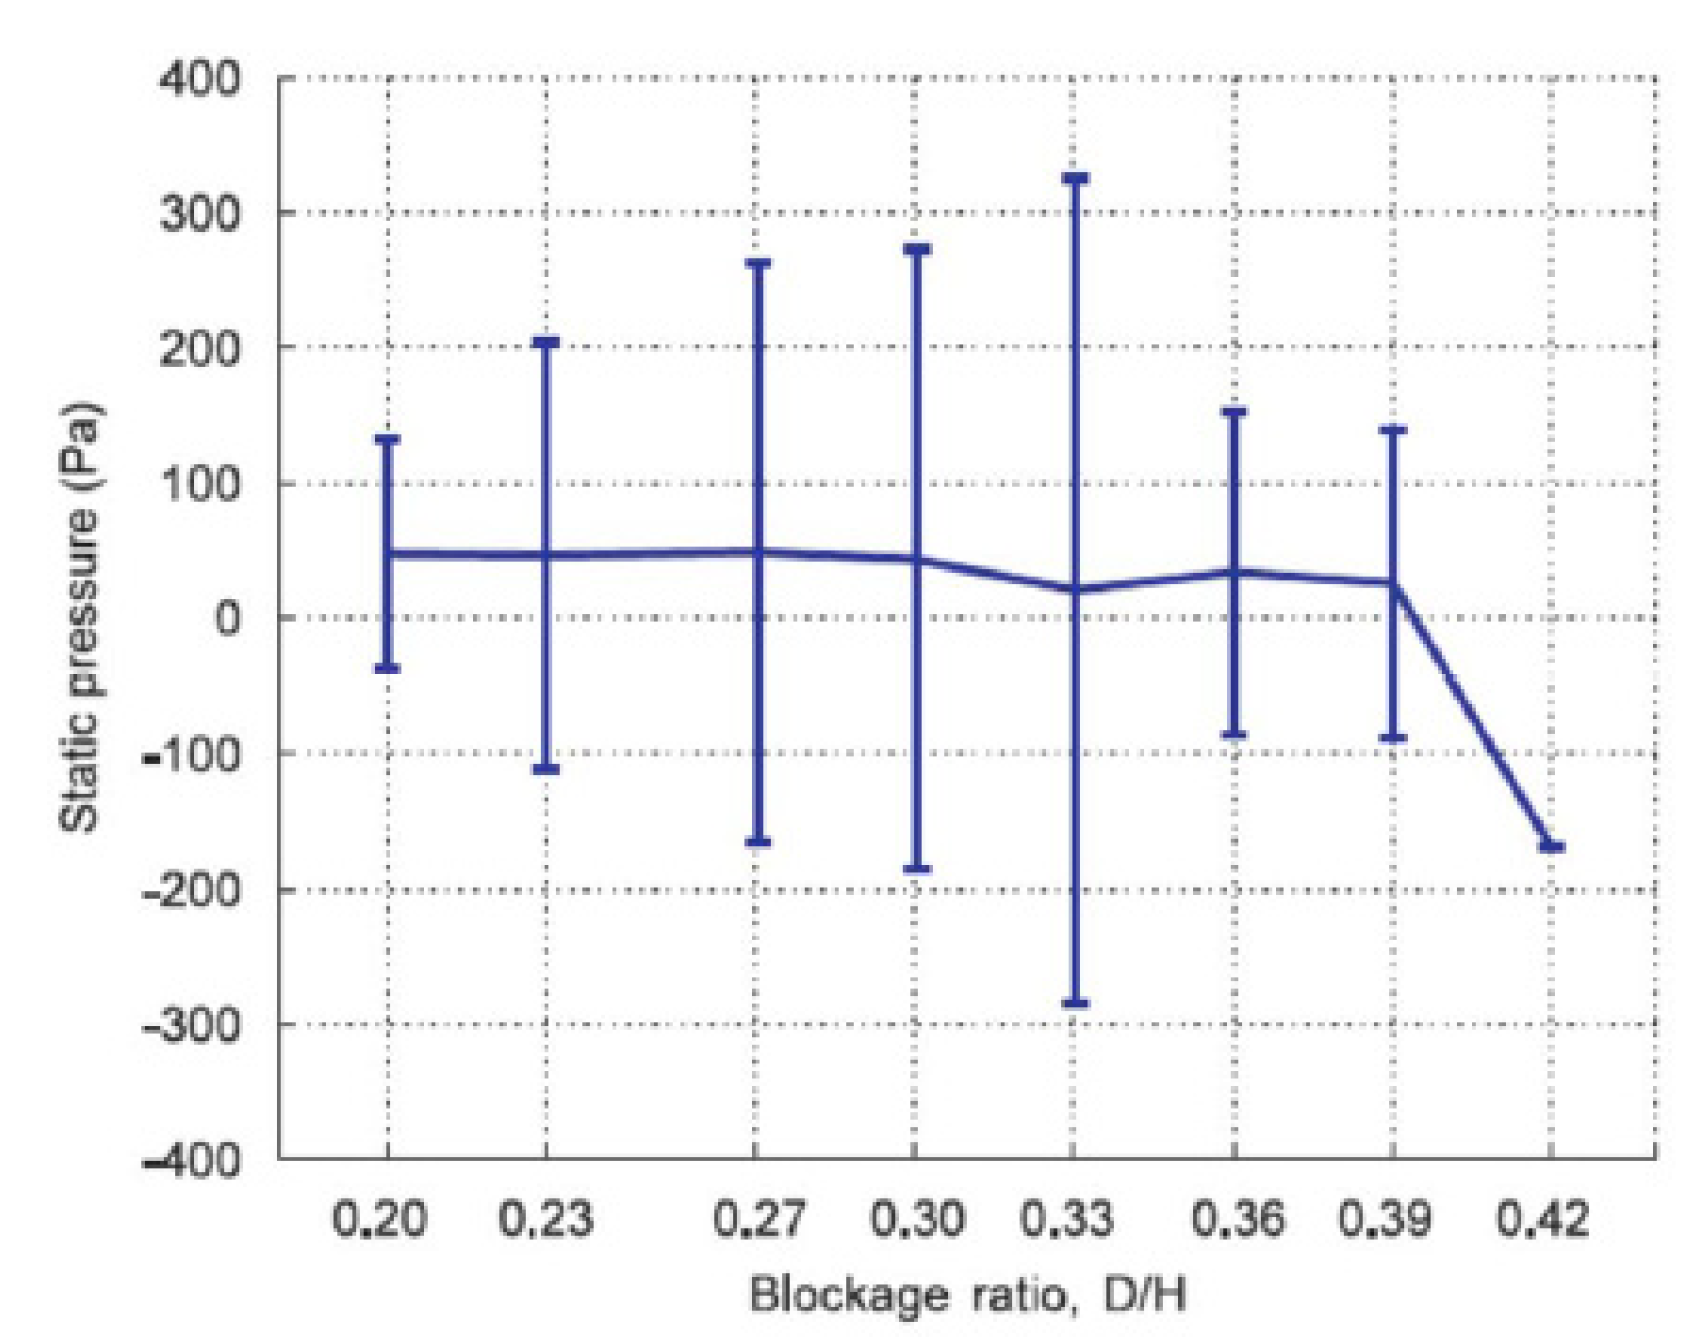
Figure 18.
Focused view of grids near the bluff bodies for various BR values in increasing order.
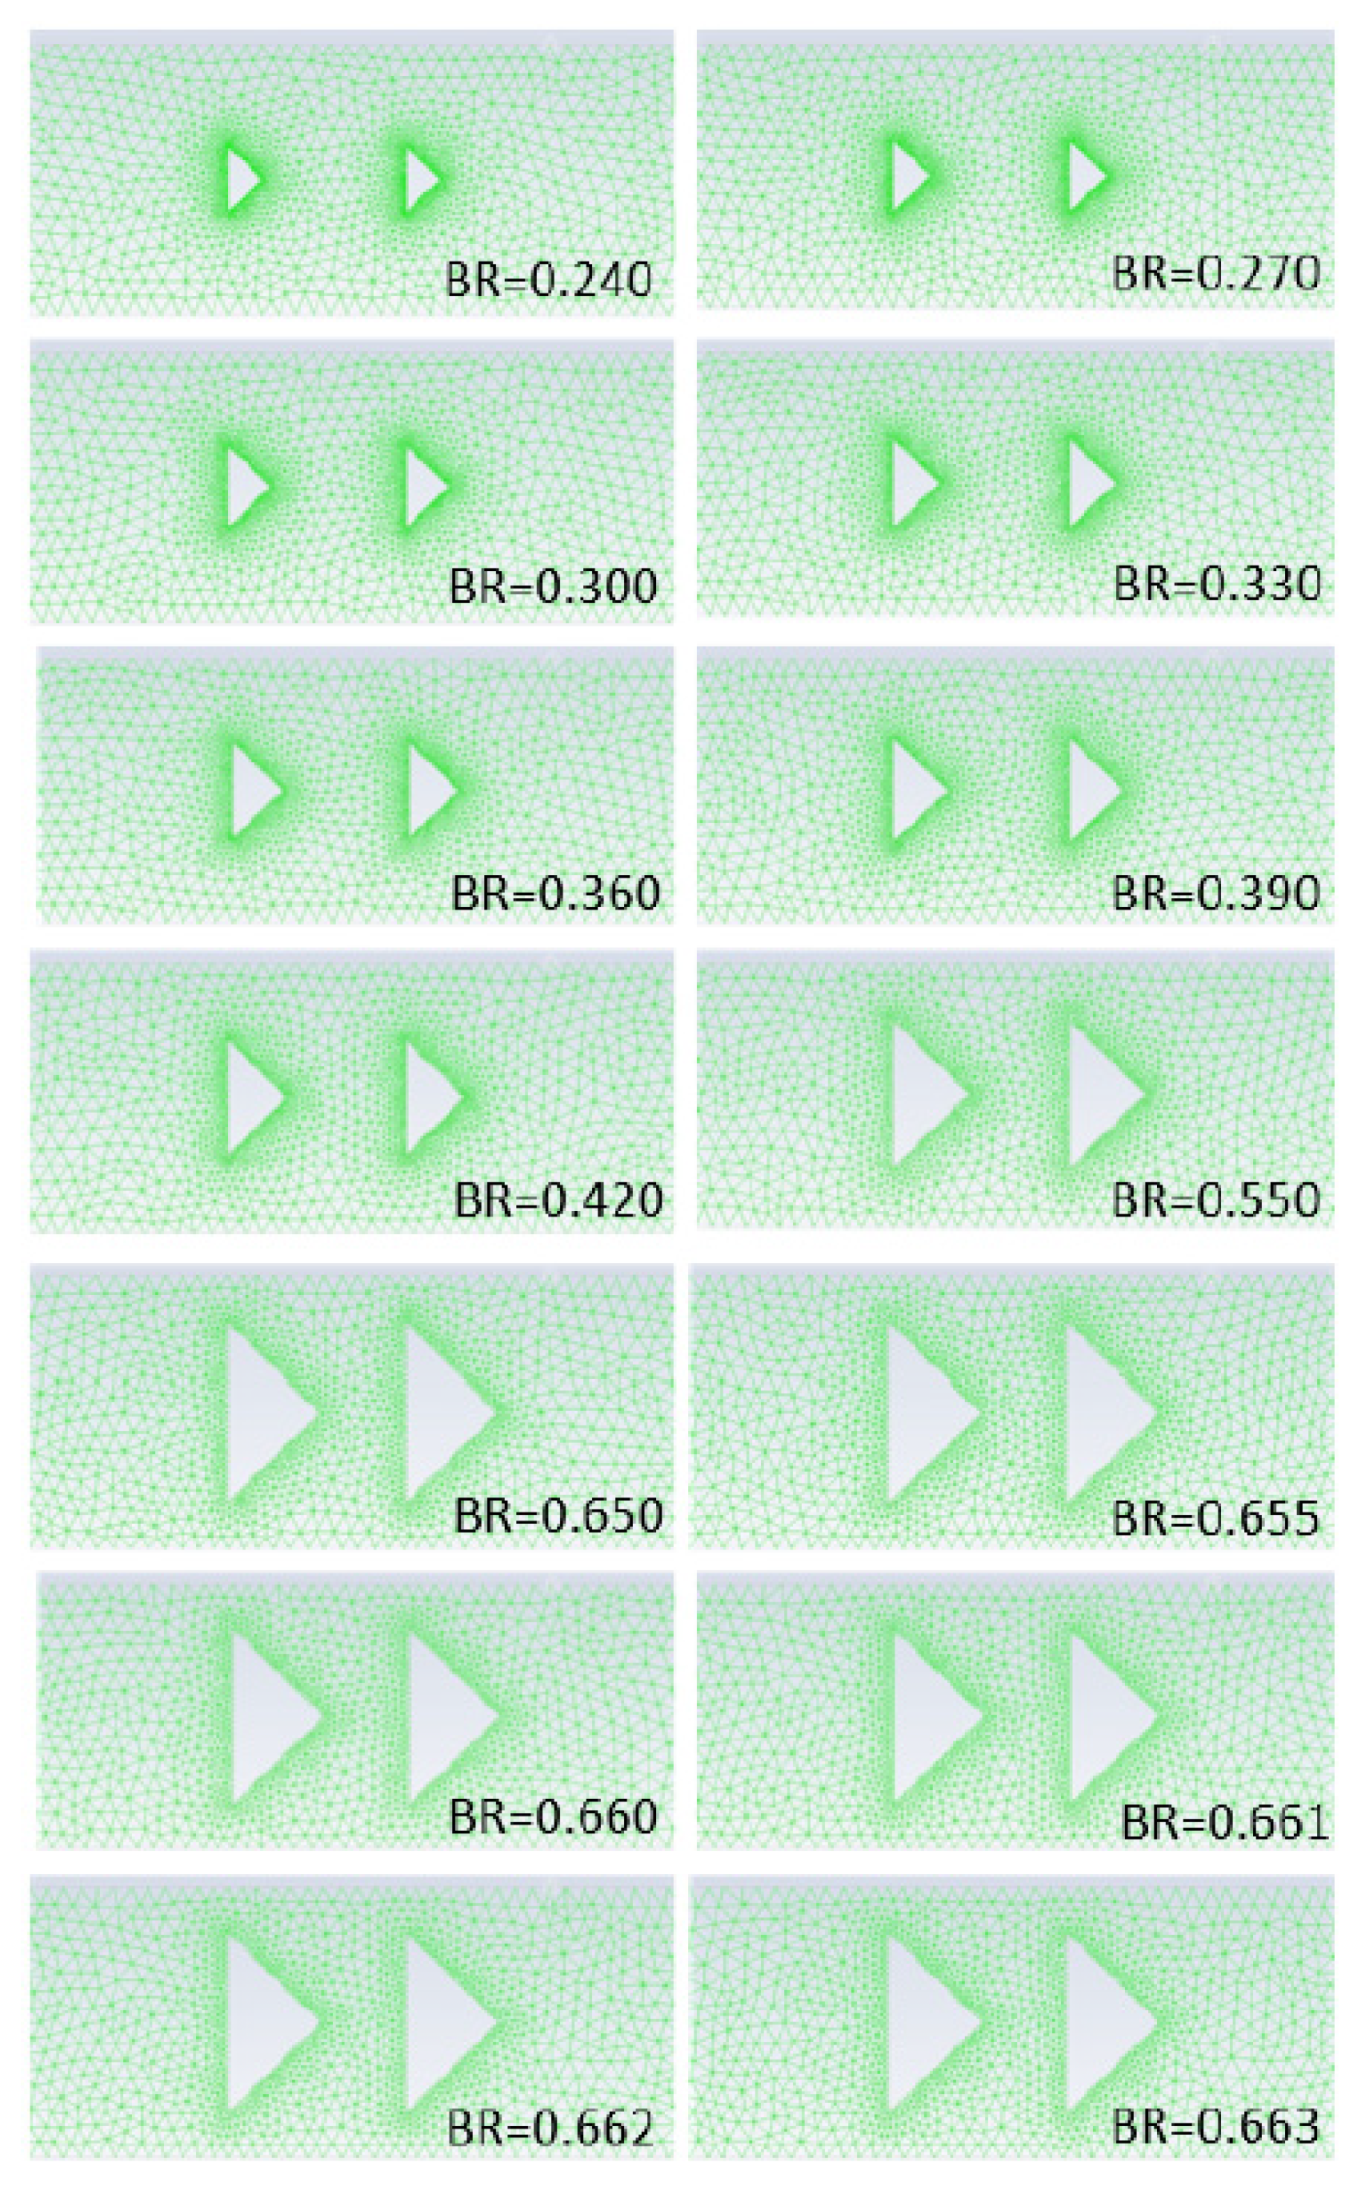
Figure 19.
(a) Mean value and amplitude of pressure at the center of the diaphragm vs BR by the present method. (b) Focused view in the range near the critical BR value.
Figure 19.
(a) Mean value and amplitude of pressure at the center of the diaphragm vs BR by the present method. (b) Focused view in the range near the critical BR value.
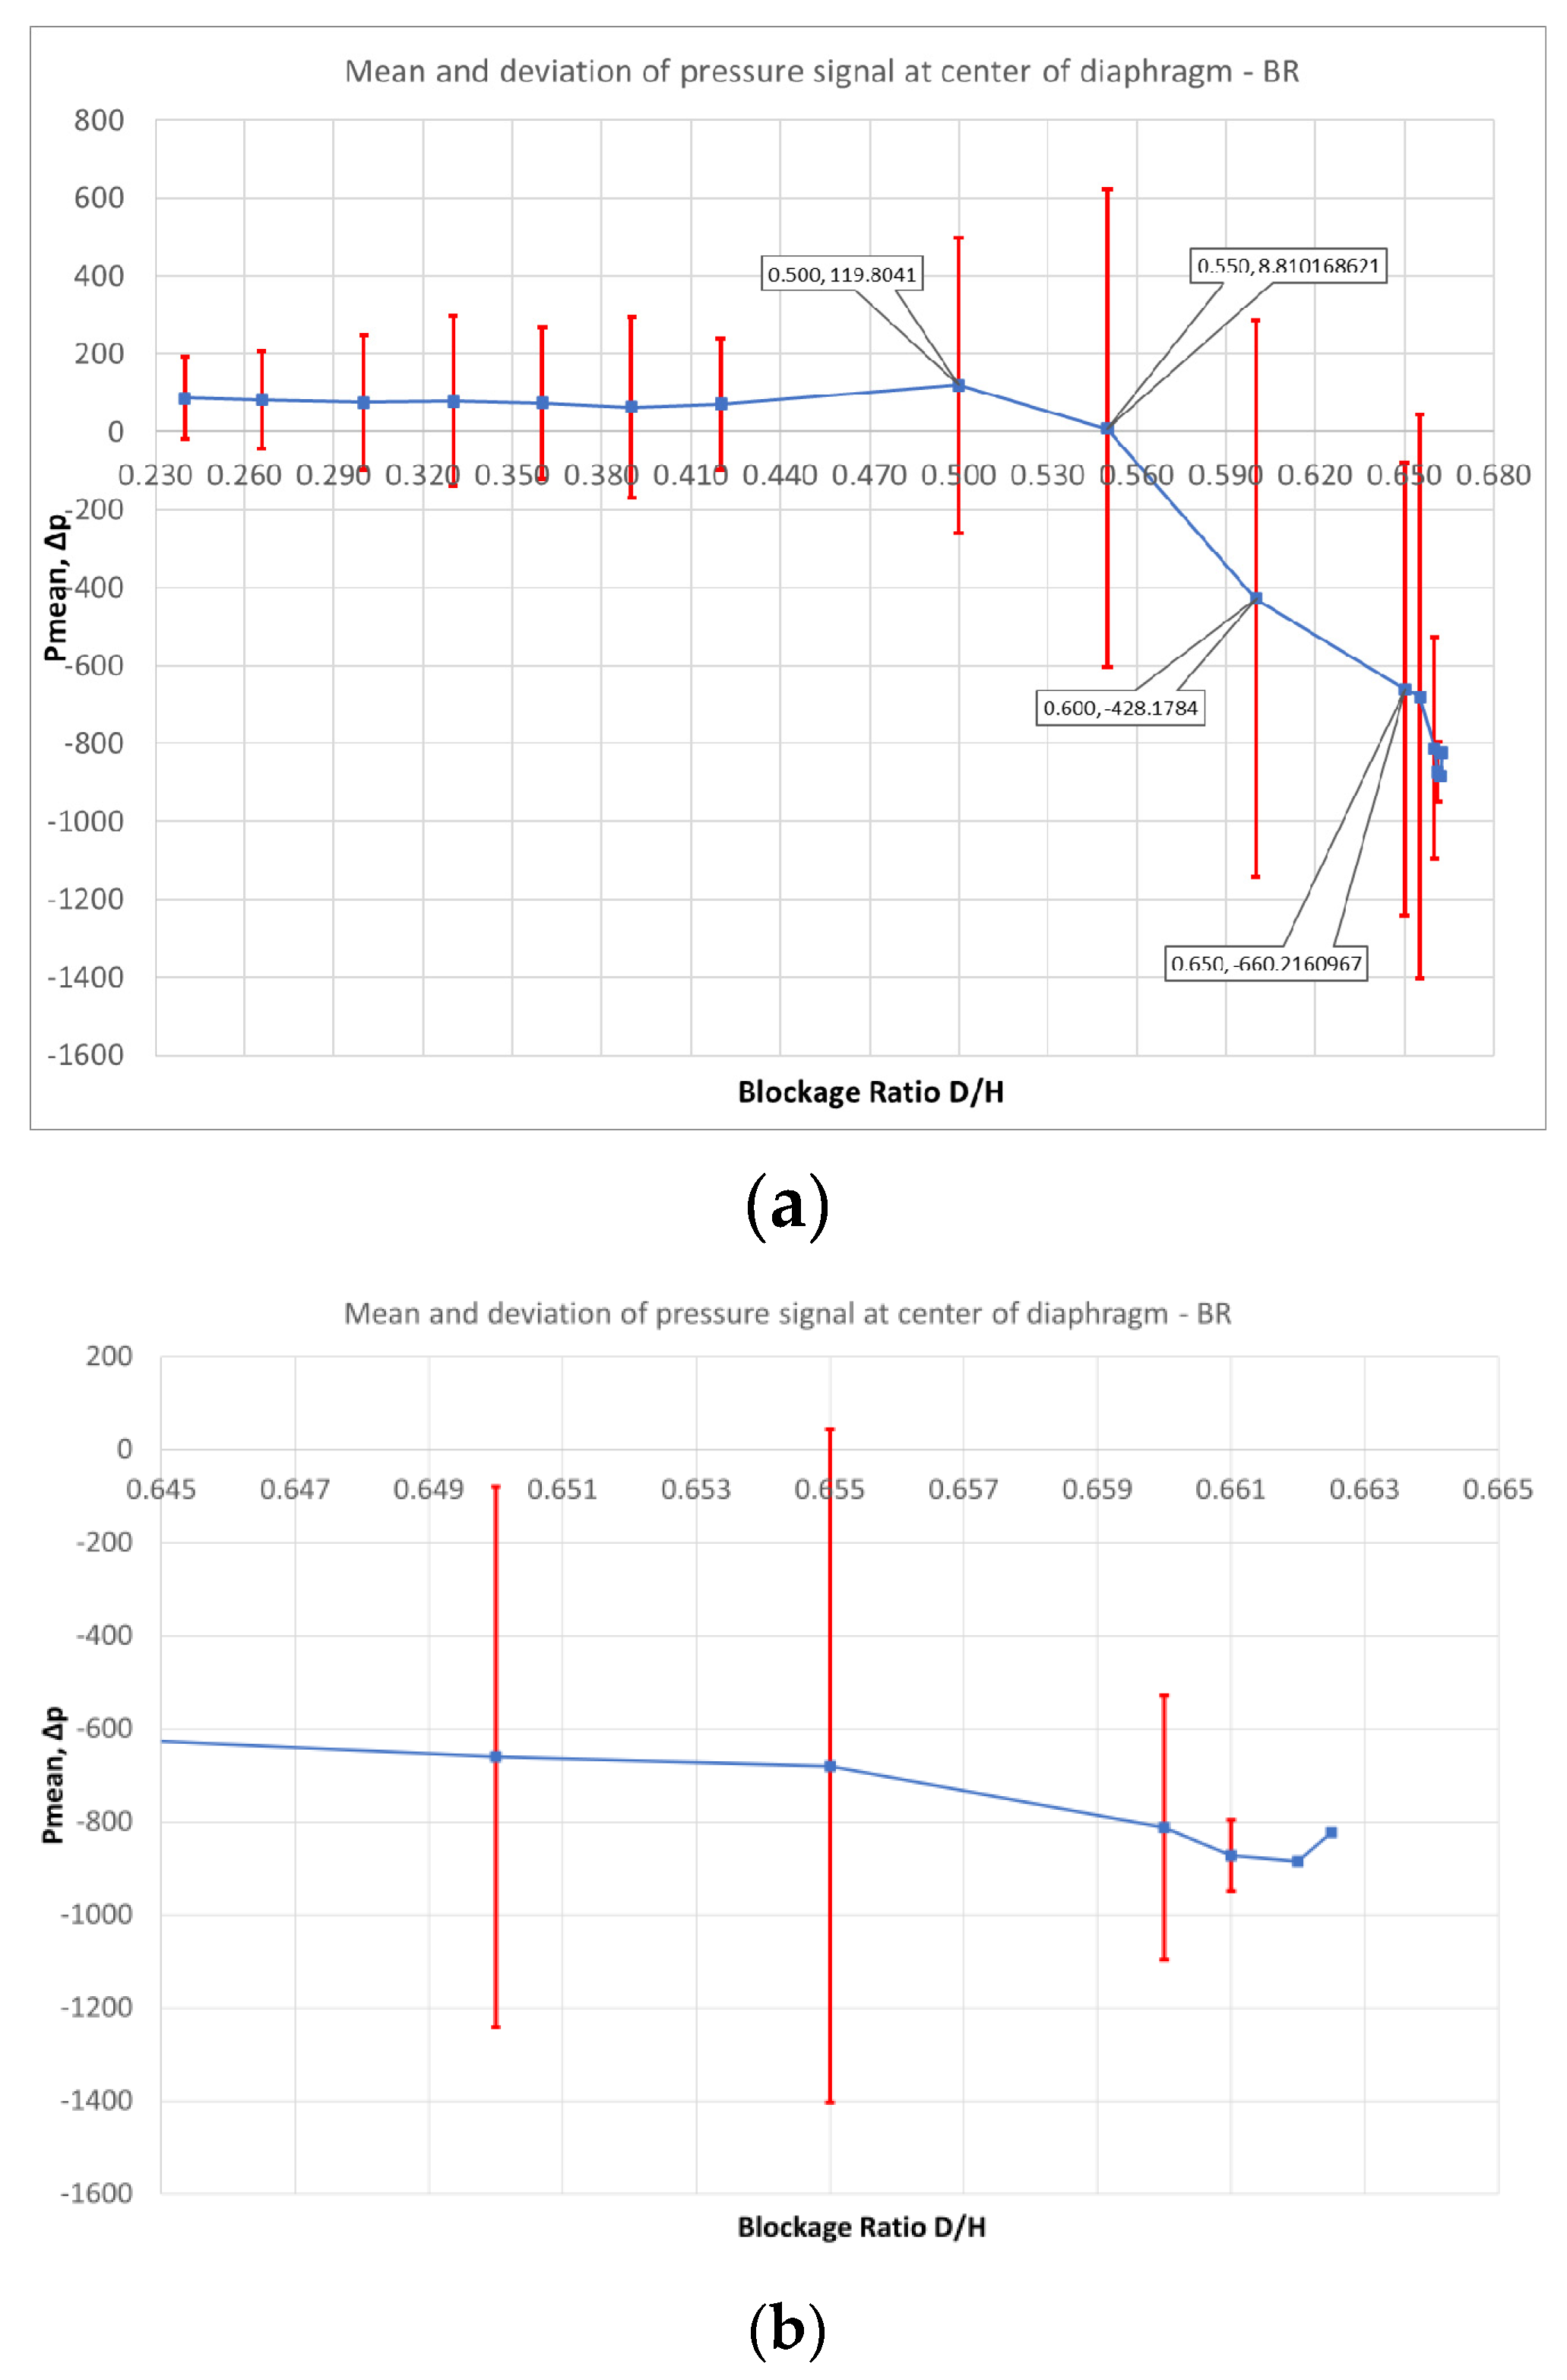
Figure 20.
Pressure amplitude on the center S of the diaphragm and average channel pressure drop as functions of BR for constant inlet velocity.
Figure 20.
Pressure amplitude on the center S of the diaphragm and average channel pressure drop as functions of BR for constant inlet velocity.
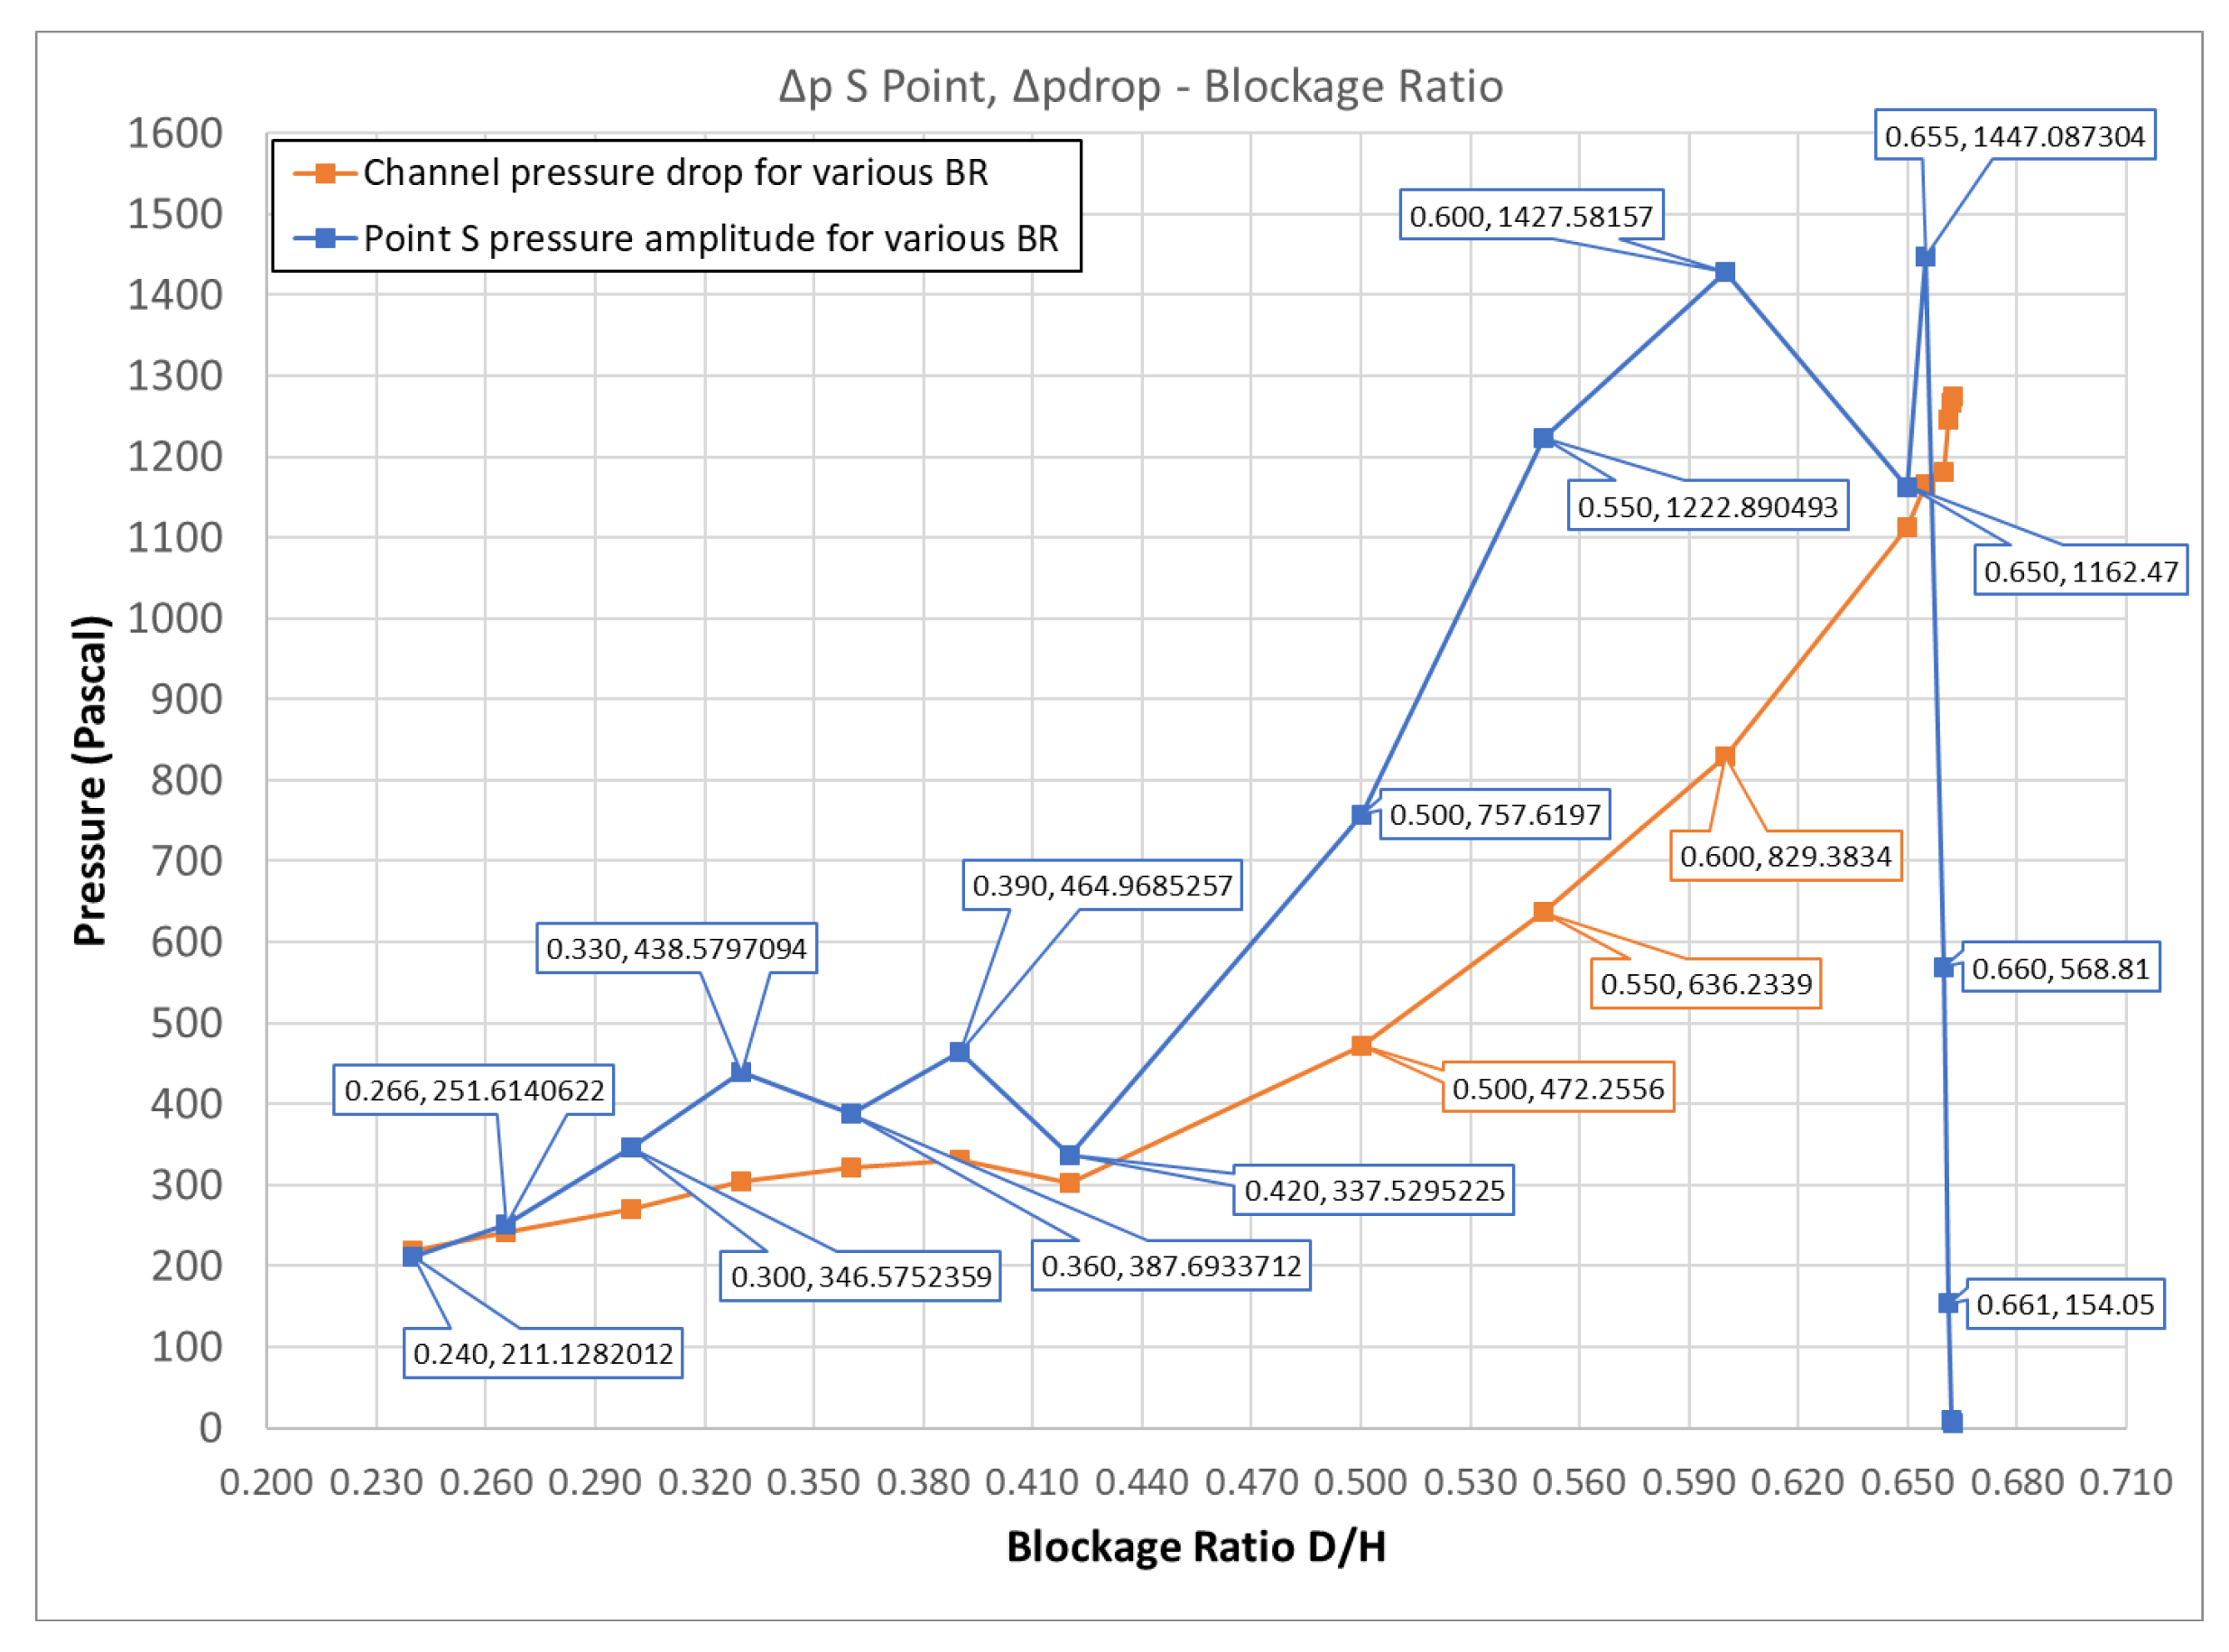
Figure 21.
(a) Frequency and (b) Strouhal number of the pressure signal at the center of the diaphragm as functions of BR for constant inlet velocity.
Figure 21.
(a) Frequency and (b) Strouhal number of the pressure signal at the center of the diaphragm as functions of BR for constant inlet velocity.
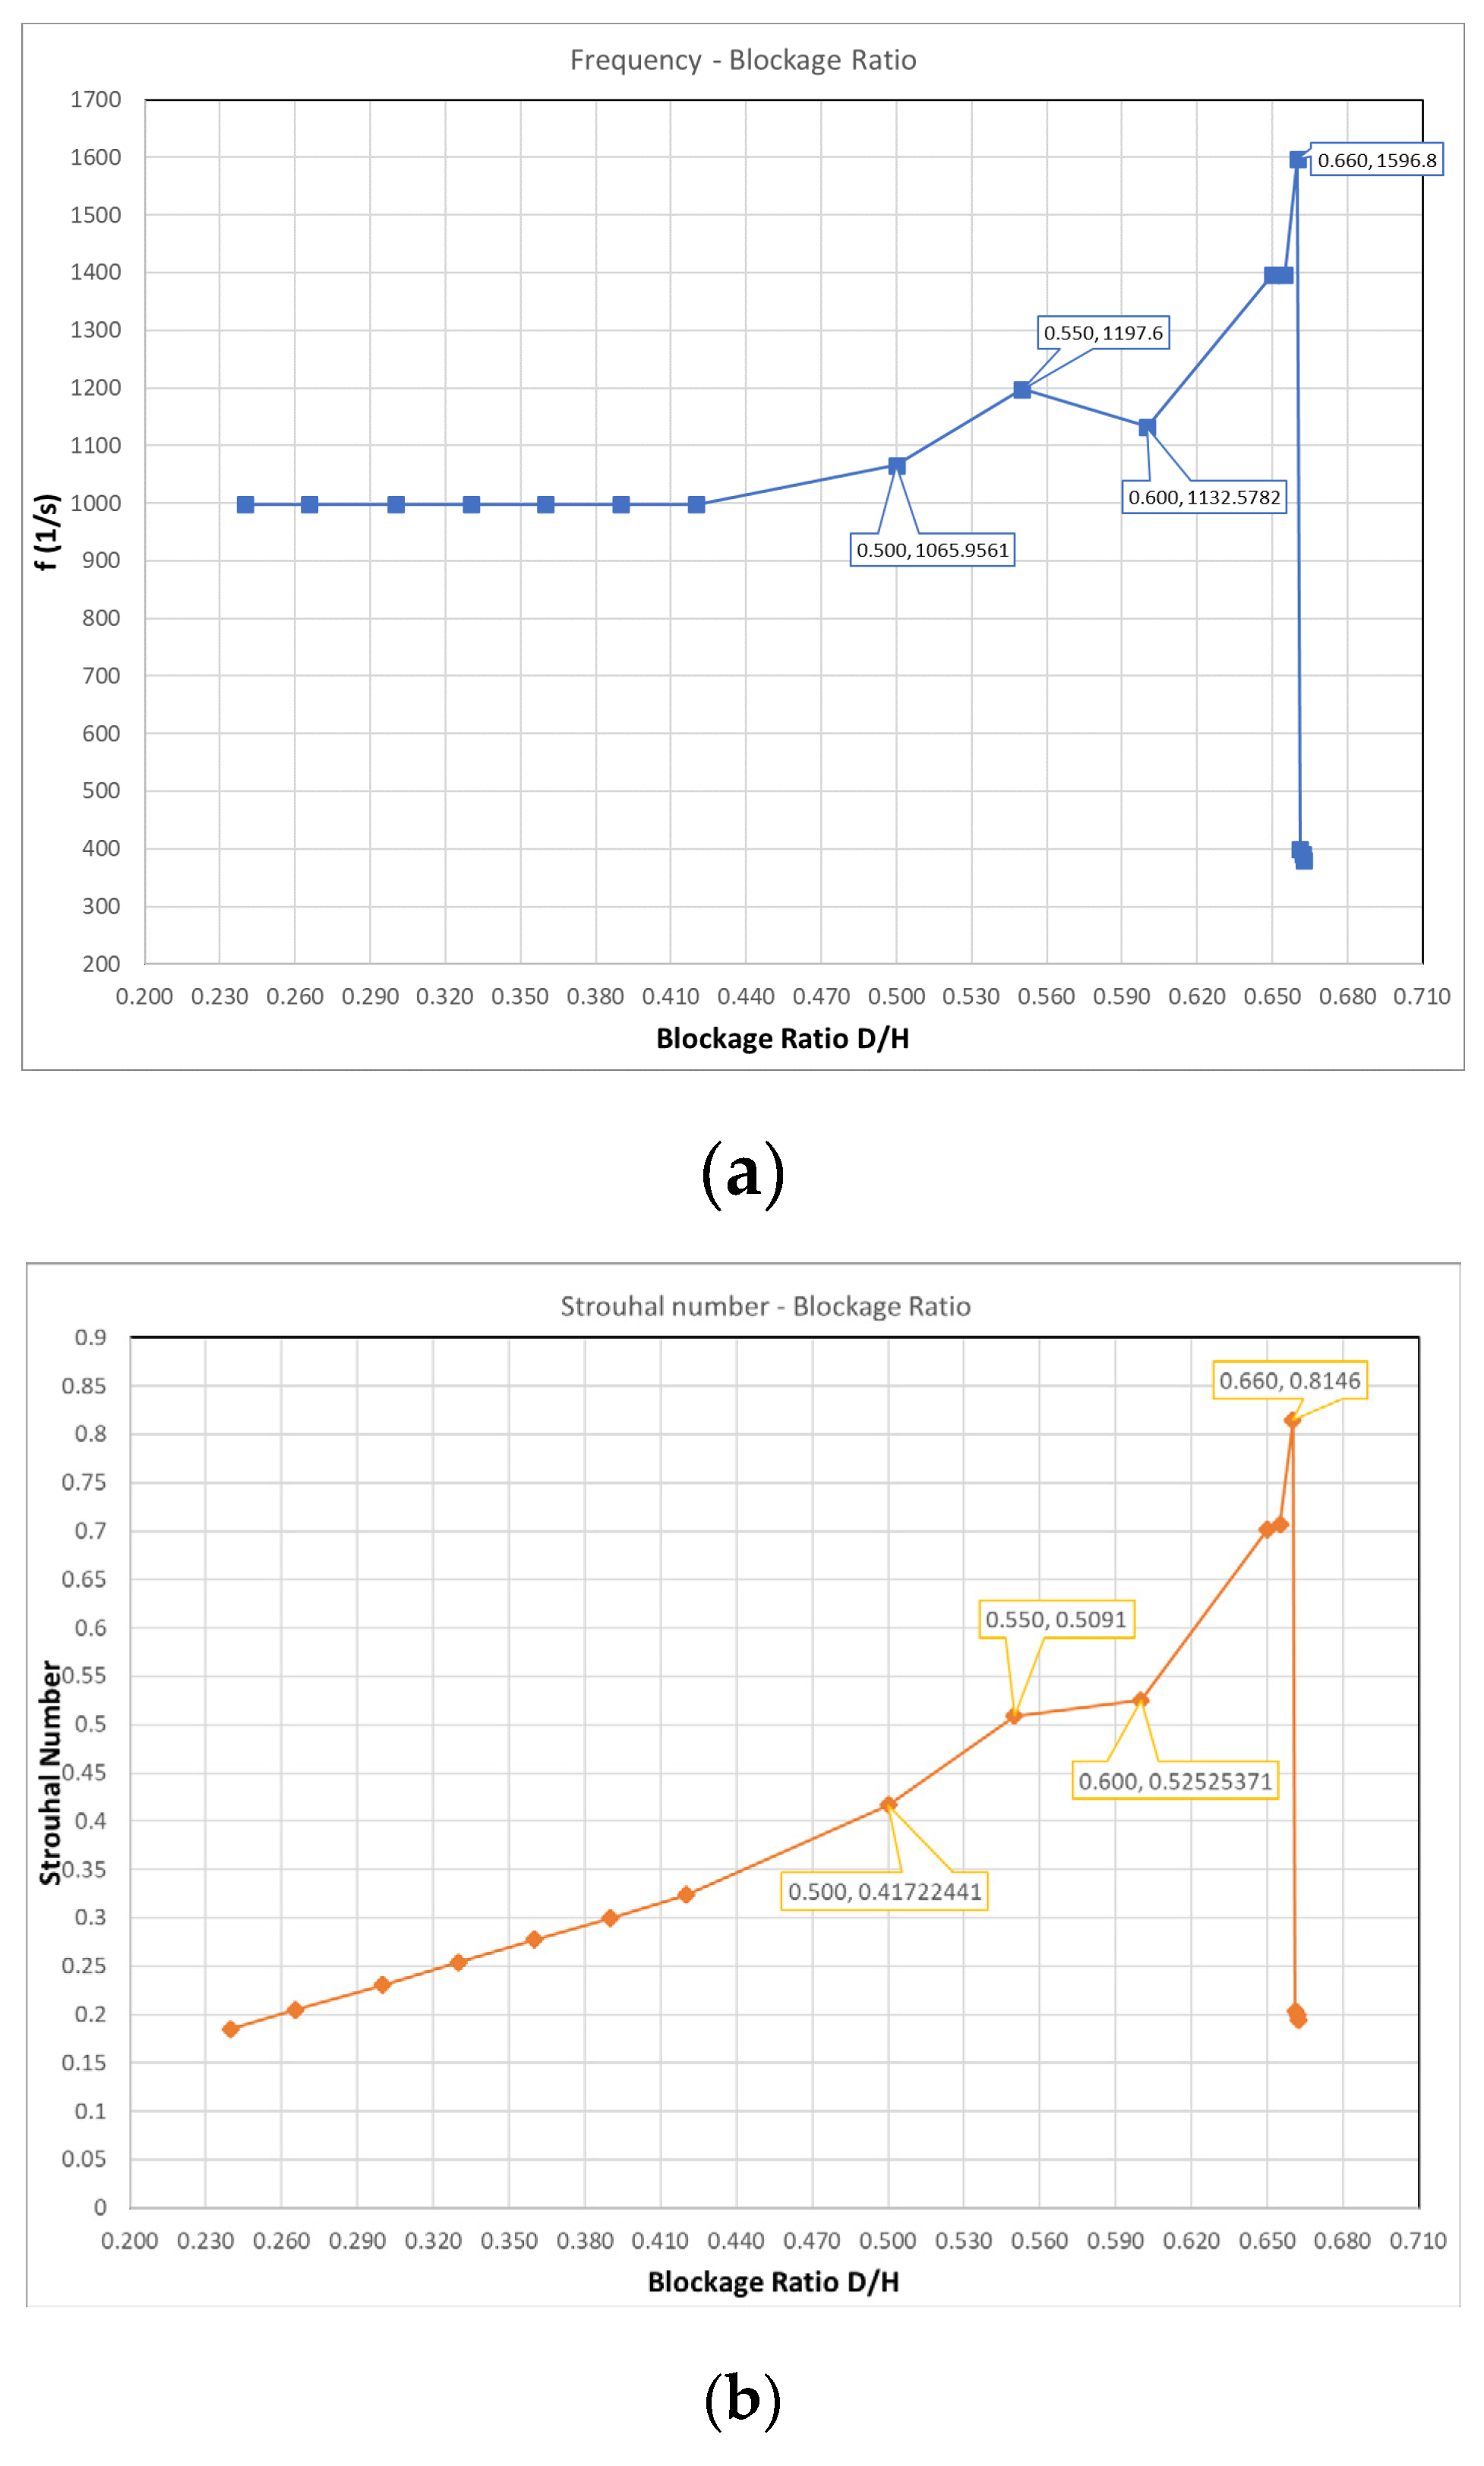
Figure 22.
Pressure signal at the center S of the diaphragm. (a) For values of BR=0.65, 0.655, 0.660, 0.661, 0.662, 0.663. (b) For values of BR=0.661, 0.662, 0.663.
Figure 22.
Pressure signal at the center S of the diaphragm. (a) For values of BR=0.65, 0.655, 0.660, 0.661, 0.662, 0.663. (b) For values of BR=0.661, 0.662, 0.663.
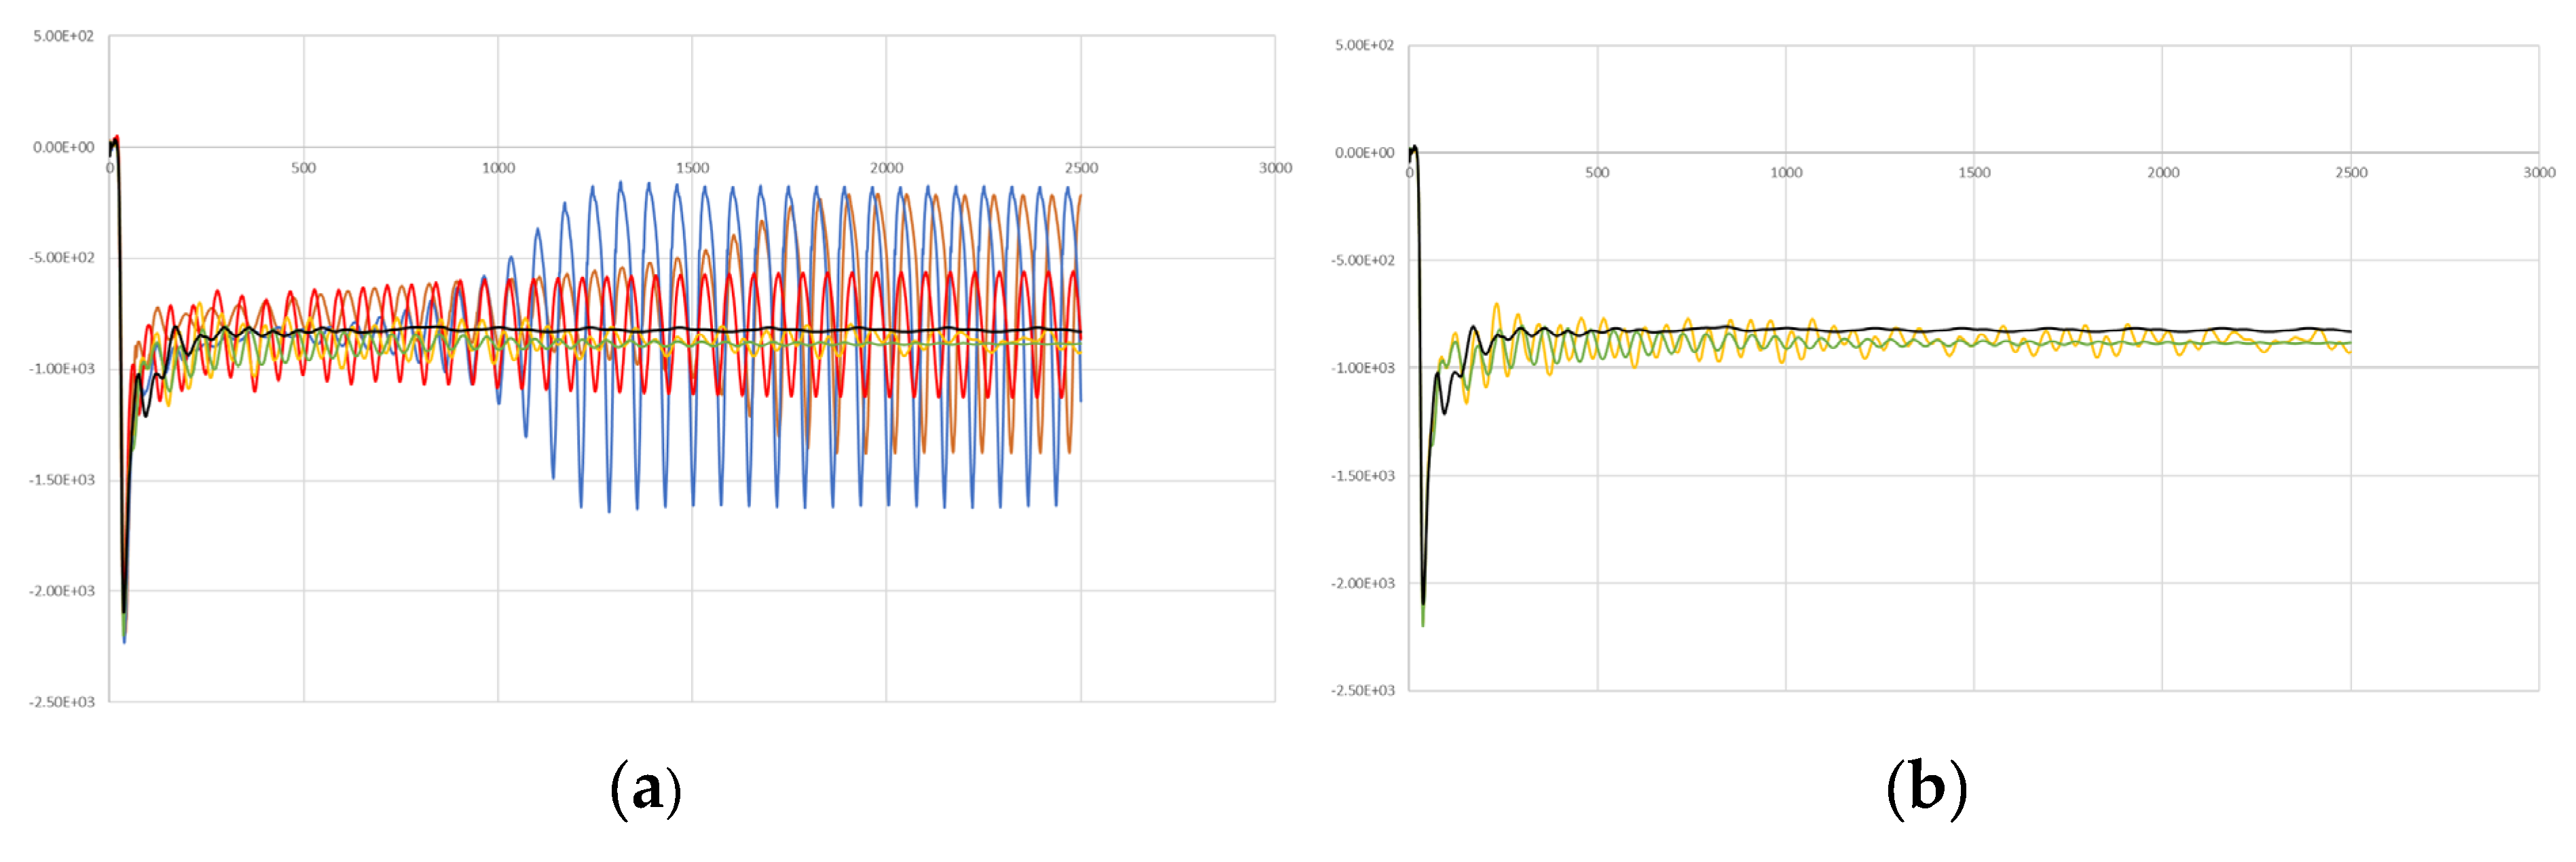
Figure 23.
Instant iso-surfaces of velocity 25ms after beginning the flow solution. Clearly vortex shedding seems to be suppressed for BR=0.662.
Figure 23.
Instant iso-surfaces of velocity 25ms after beginning the flow solution. Clearly vortex shedding seems to be suppressed for BR=0.662.
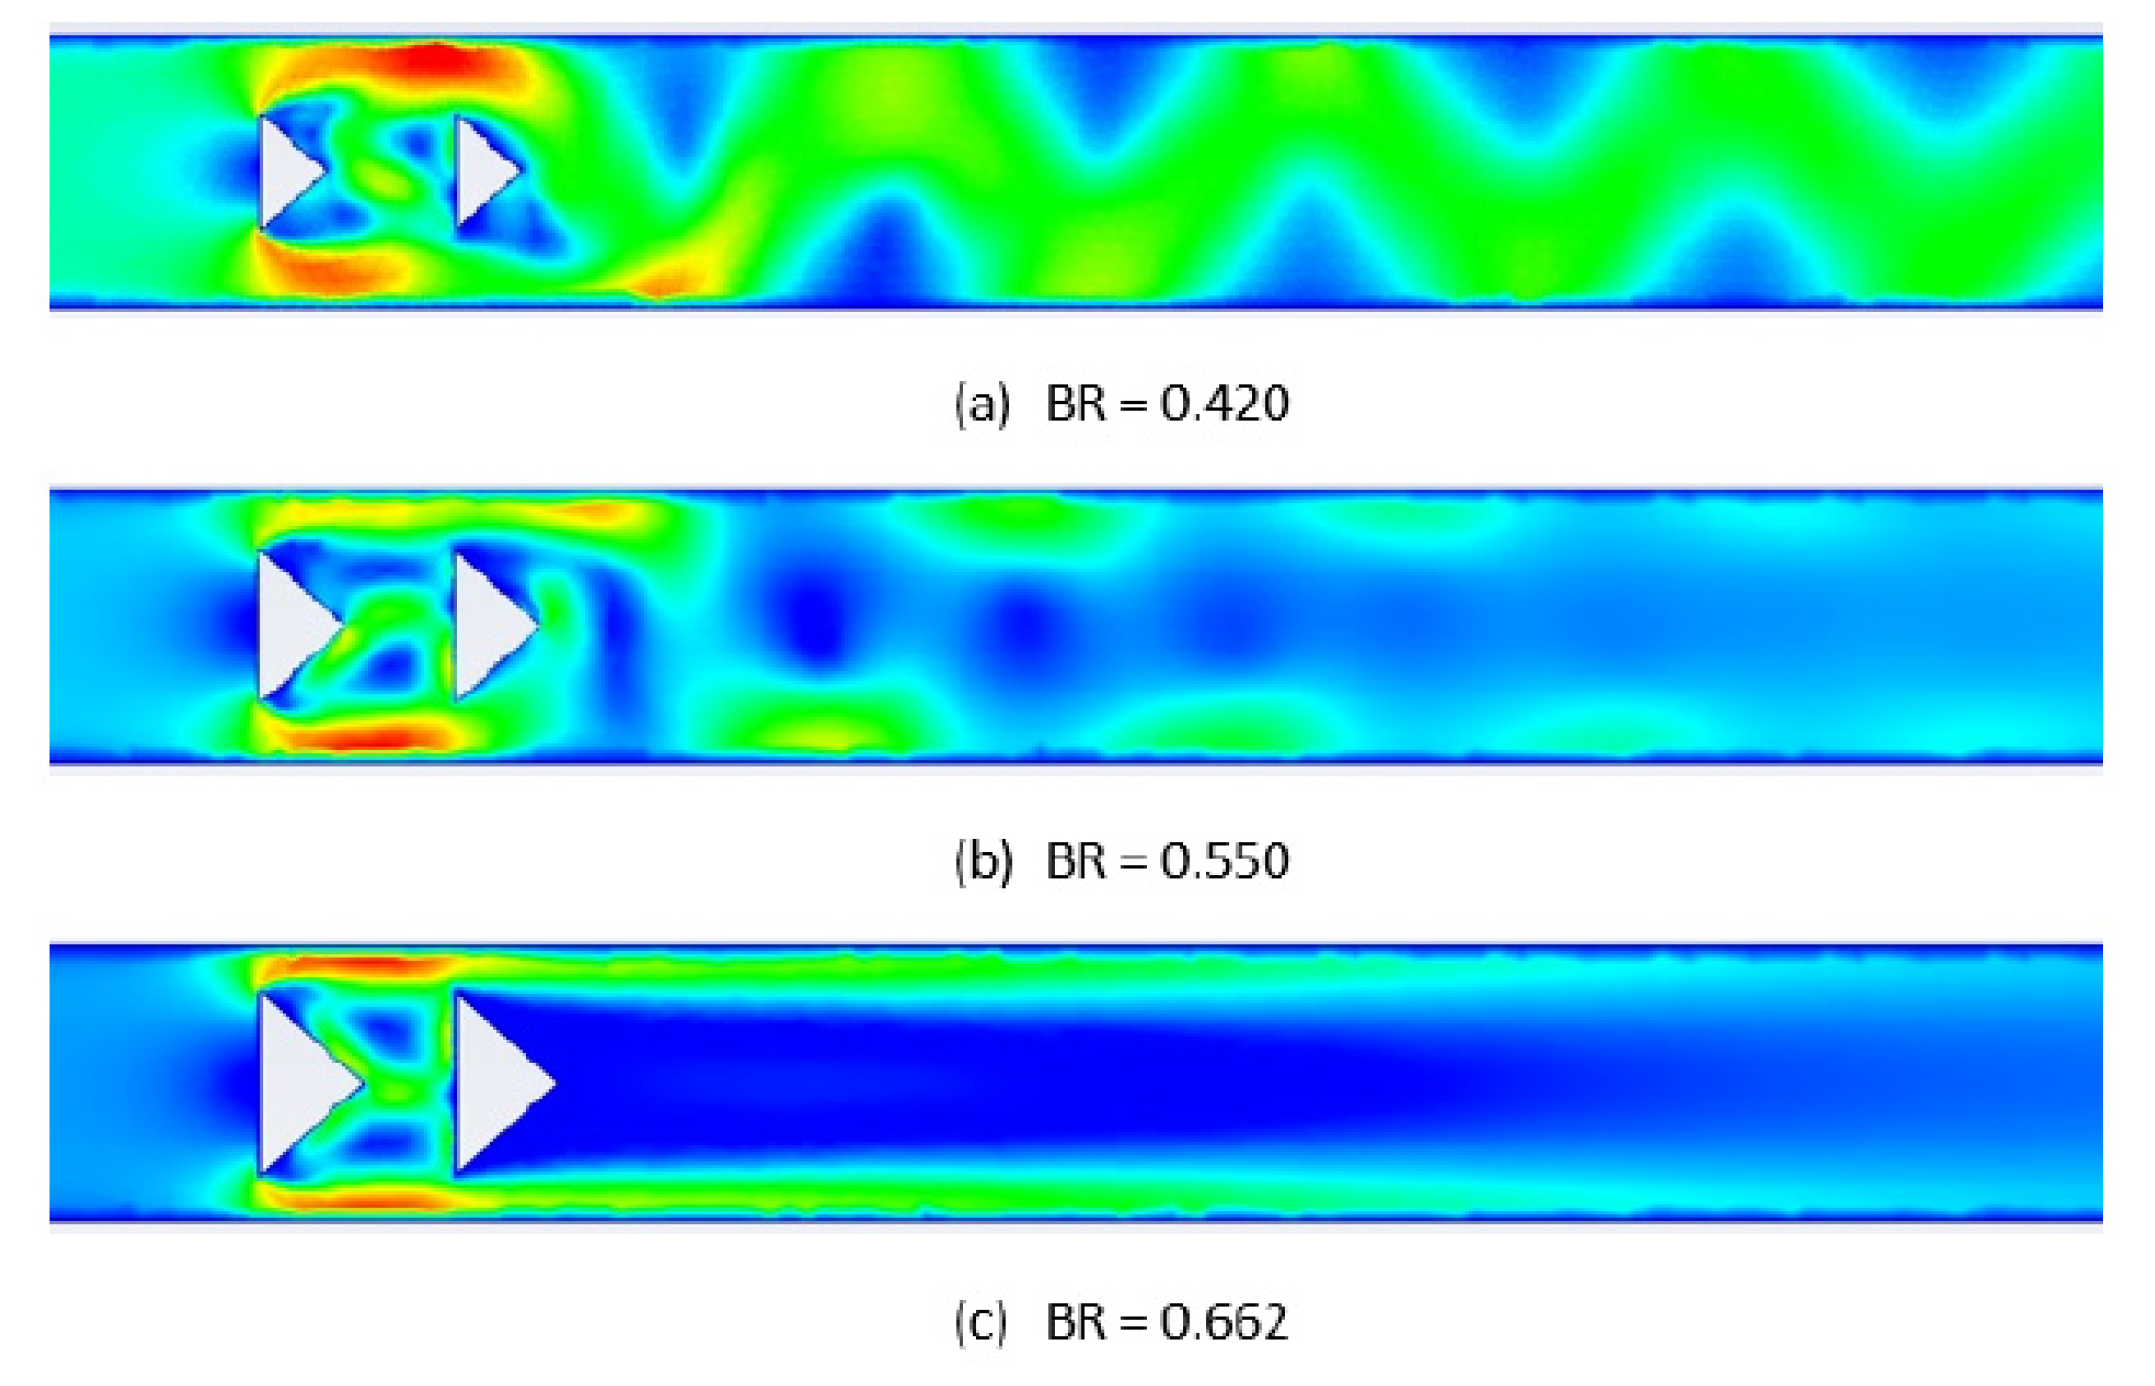
Figure 25.
Measured voltage in case with two bluff bodies for (a) BR=0.27 and (b) BR=0.55 [14].
Figure 25.
Measured voltage in case with two bluff bodies for (a) BR=0.27 and (b) BR=0.55 [14].
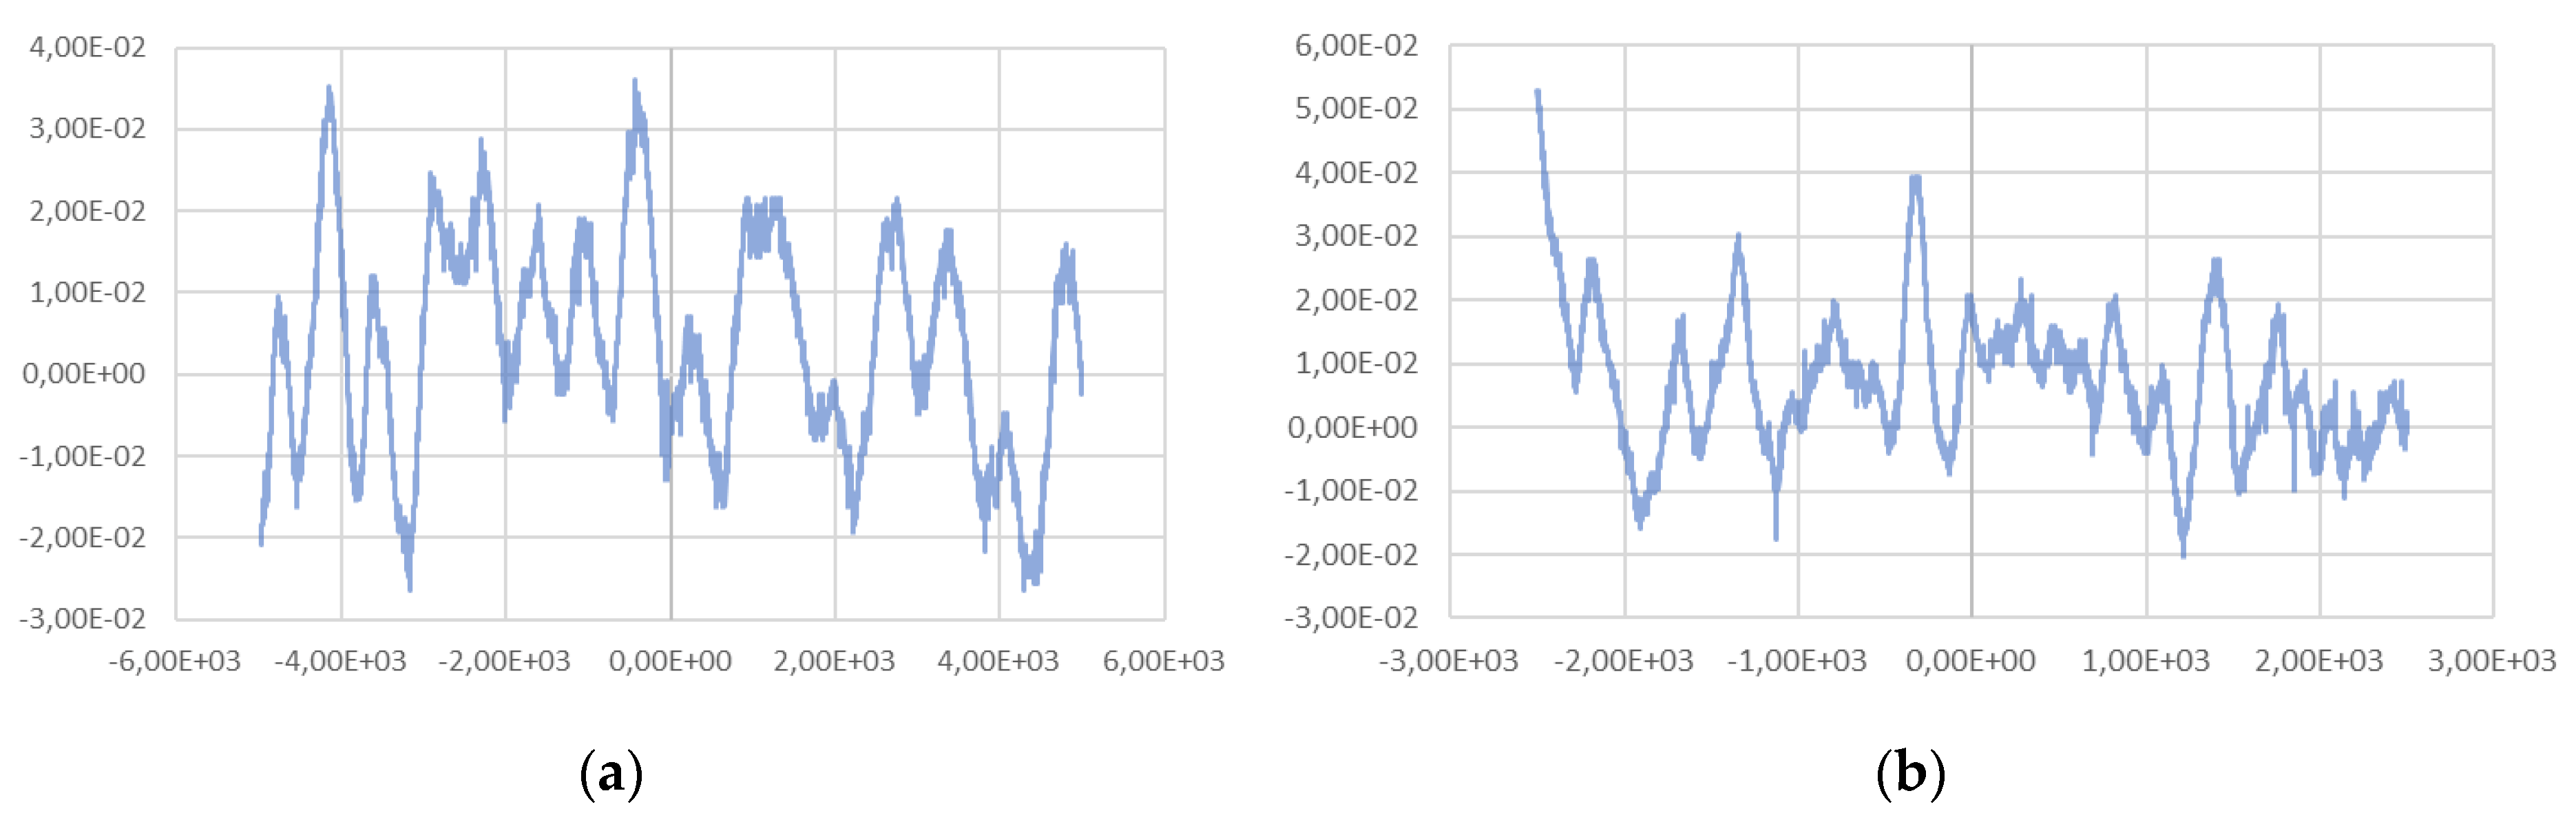
Figure 27.
(a) Re-averaged values of Cp,max, Strouhal and Cp,drop versus BR. (b) Ratio Δpmax / ΔpS versus Re for various BR. (c) Ratio Δpmax / Δpdrop versus Re for various BR. (d) Re-averaged values of Δpmax / ΔpS and Δpmax / Δpdrop versus BR.
Figure 27.
(a) Re-averaged values of Cp,max, Strouhal and Cp,drop versus BR. (b) Ratio Δpmax / ΔpS versus Re for various BR. (c) Ratio Δpmax / Δpdrop versus Re for various BR. (d) Re-averaged values of Δpmax / ΔpS and Δpmax / Δpdrop versus BR.
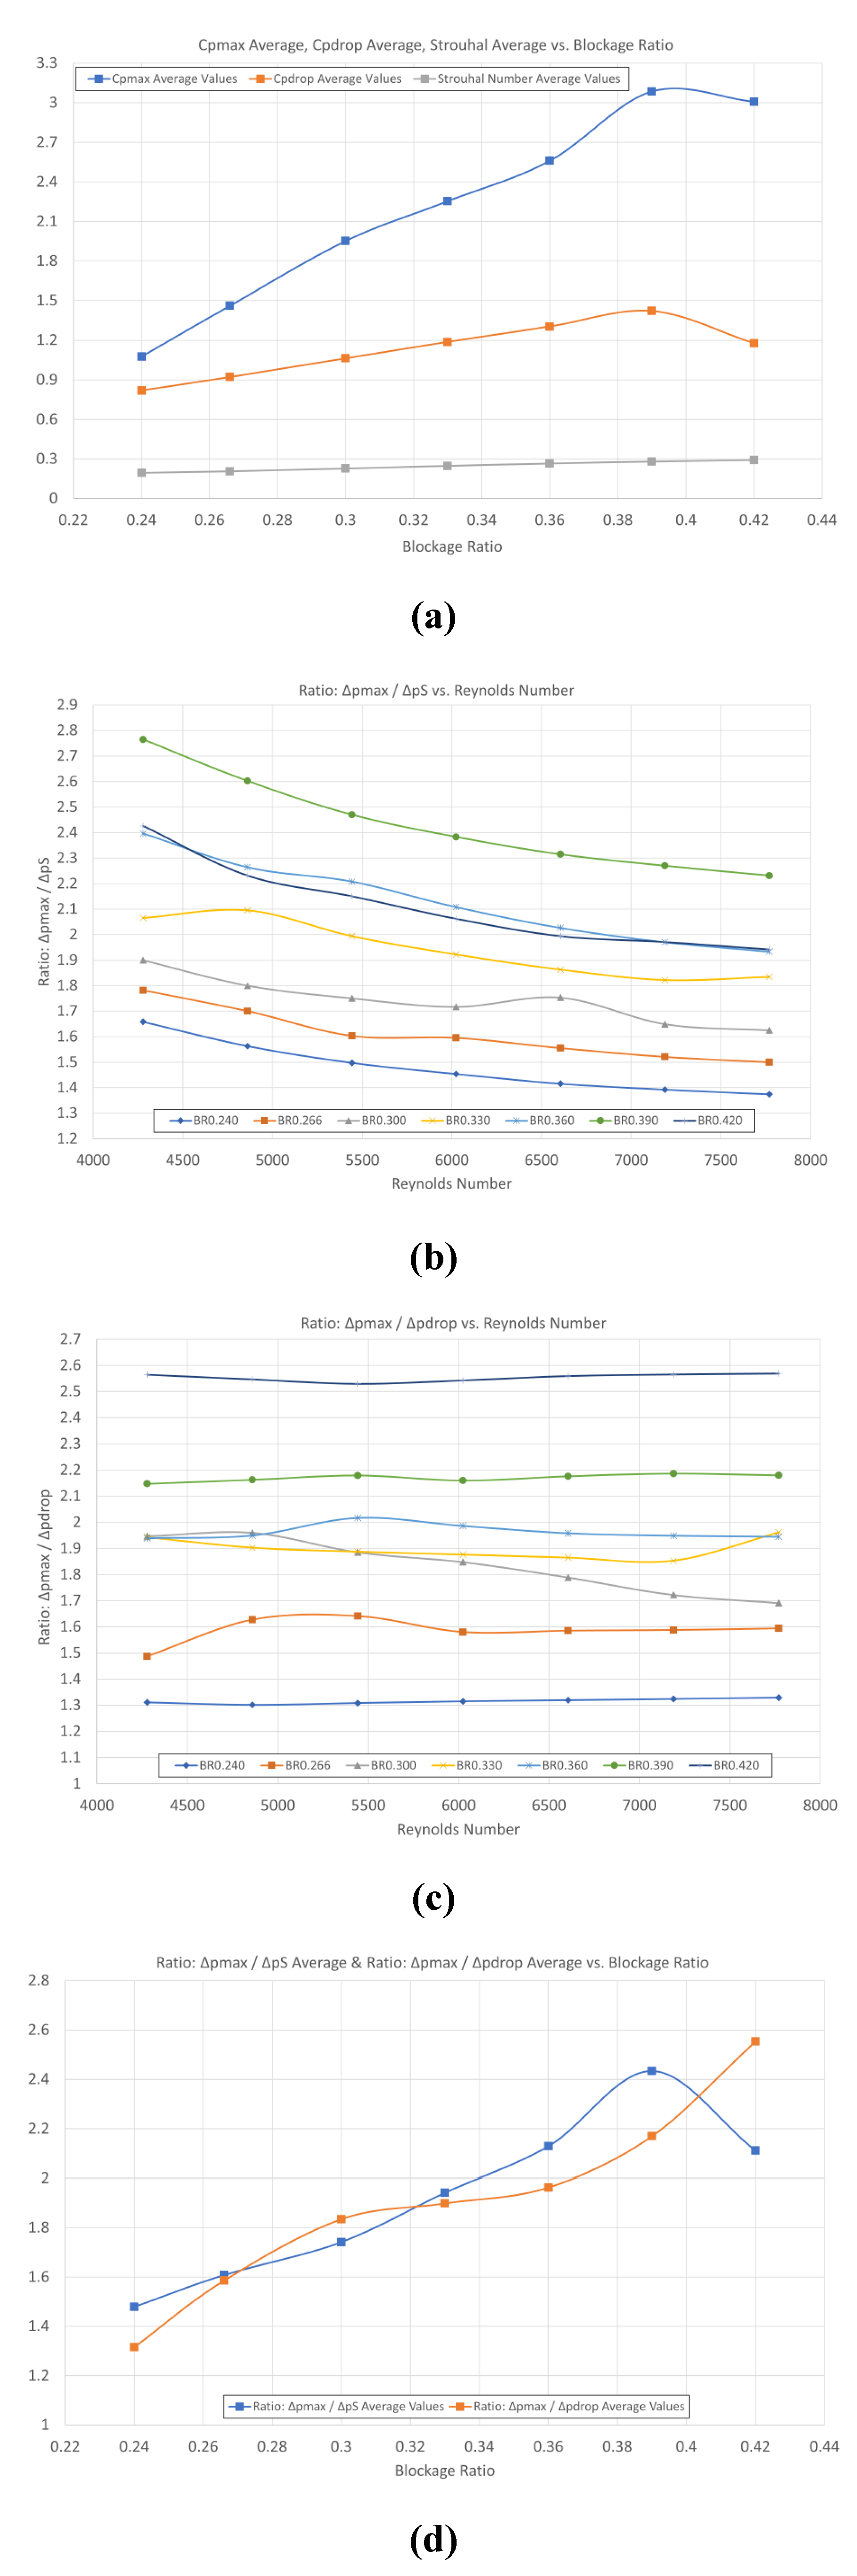

Table 1.
Inlet velocity used for the various Reynolds numbers and blockage ratios (data for baseline case are in bold).
Table 1.
Inlet velocity used for the various Reynolds numbers and blockage ratios (data for baseline case are in bold).
| Case | C1 | C2 | C3 | C4 | C5 | C6 | C7 | |
|---|---|---|---|---|---|---|---|---|
| Re | 4278 | 4860 | 5442 | 6024 | 6606 | 7188 | 7770 | BR |
| 16.3 | 18.5 | 20.7 | 22.9 | 25.1 | 27.3 | 29.6 | 0.24 | |
| 14.7 | 16.7 | 18.7 | 20.7 | 22.7 | 24.7 | 26.7 | 0.27 | |
| 13.0 | 14.8 | 16.6 | 18.3 | 20.1 | 21.9 | 23.6 | 0.30 | |
| Vin (m/s) | 11.8 | 13.4 | 15.1 | 16.7 | 18.3 | 19.9 | 21.5 | 0.33 |
| 10.8 | 12.3 | 13.8 | 15.3 | 16.7 | 18.2 | 19.7 | 0.36 | |
| 10.0 | 11.4 | 12.7 | 14.1 | 15.5 | 16.8 | 18.2 | 0.39 | |
| 9.3 | 10.6 | 11.8 | 13.1 | 14.4 | 15.6 | 16.9 | 0.42 |
Table 2.
Mesh sizes used in the grid independence study.
| Name | G1.0 | G0.7 | G0.5 | G0.4 | G0.3 | G0.25 | G0.2 |
|---|---|---|---|---|---|---|---|
| Mesh size (mm) | 1.00 | 0.70 | 0.50 | 0.40 | 0.30 | 0.25 | 0.20 |
| # Nodes | 6415 | 12623 | 21433 | 30490 | 56529 | 87216 | 105783 |
| # Elements | 12086 | 24230 | 41491 | 59288 | 110840 | 171737 | 208238 |
Disclaimer/Publisher’s Note: The statements, opinions and data contained in all publications are solely those of the individual author(s) and contributor(s) and not of MDPI and/or the editor(s). MDPI and/or the editor(s) disclaim responsibility for any injury to people or property resulting from any ideas, methods, instructions or products referred to in the content. |
© 2023 by the authors. Licensee MDPI, Basel, Switzerland. This article is an open access article distributed under the terms and conditions of the Creative Commons Attribution (CC BY) license (http://creativecommons.org/licenses/by/4.0/).
Copyright: This open access article is published under a Creative Commons CC BY 4.0 license, which permit the free download, distribution, and reuse, provided that the author and preprint are cited in any reuse.


