
Submitted:
26 June 2023
Posted:
28 June 2023
You are already at the latest version
Abstract
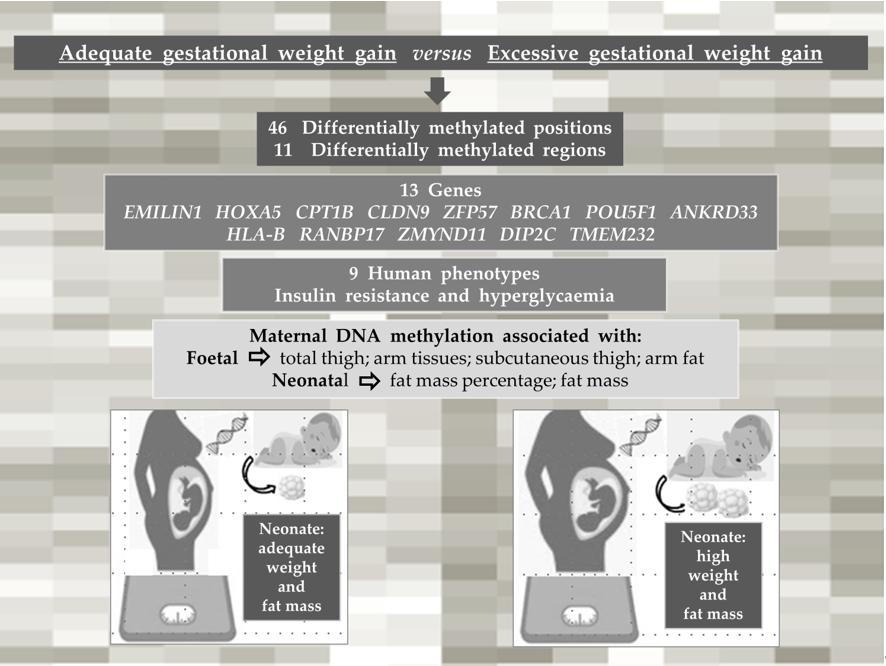
Background: Changes in body weight are associated with the regulation of DNA methylation (DNAm). In this study, we investigated the associations between maternal gestational weight gain-related DNAm and foetal and neonatal body composition. Methods: Brazilian pregnant women from the Araraquara Cohort Study were followed up during pregnancy, delivery, and after hospital discharge. Women with normal pre-pregnancy BMI were allocated to two groups: adequate gestational weight gain (AGWG, n=45) and excessive gestational weight gain (EGWG, n=30). Foetal and neonatal body composition was evaluated by ultrasound and plethysmography, respectively. DNAm was assessed in maternal blood using Illumina Infinium MethylationEPIC BeadChip arrays. Linear regression models were used to explore the associations between DNAm and foetal and neonatal body composition. Results: Maternal weight, GWG, neonatal weight, and fat mass were higher in the EGWG group. Analysis of DNAm identified 46 differentially methyl-ated positions and 11 differentially methylated regions (DMRs) between the EGWG and AGWG groups. Nine human phenotypes were enriched for these 11 DMRs located in 13 genes (EMILIN1, HOXA5, CPT1B, CLDN9, ZFP57, BRCA1, POU5F1, ANKRD33, HLA-B, RANBP17, ZMYND11, DIP2C, TMEM232), highlighting the terms insulin resistance, and hyperglycaemia. Maternal DNAm was associated with foetal total thigh and arm tissues and subcutaneous thigh and arm fat, as well as with neonatal fat mass percentage and fat mass. Conclusion: The methylation pat-tern in the EGWG group indicated a risk for developing chronic diseases and involvement of ma-ternal DNAm in foetal lean and fat mass and in neonatal fat mass.
Keywords:
gestational weight gain
; DNA methylation
; ultrasonography
; plethysmography
; offspring body composition
1. Introduction
Weight gain during pregnancy is important for adequate development of the foetoplacental unit. The Institute of Medicine (IOM) recommends gestational weight gain (GWG)[1] based on pre-gestational body mass index (BMI). Excessive GWG is associated with tiredness, altered breathing, joint alterations, maternal obesity, caesarean section, obstetric risks, and postpartum weight retention[2].
Overweight is a global problem in women of childbearing age. In the United States, maternal obesity and excessive GWG affect approximately 60% of women[3]. About 30% of women in Europe and 10% of women in Asia who become pregnant are overweight or obese[4]. In Brazil, a study using weight data of 840,243 women from the Food and Nutritional Surveillance System showed an increase in overweight and pre-gestational obesity, as well as in the prevalence of excessive GWG, in 11 of the 27 units of the Brazilian federation between 2008 and 2016[5].
Overweight or obesity during pregnancy contributes to the development of diseases in the offspring at different stages of life. This fact was explained by foetal metabolic programming, a process describing the epigenetic mechanisms that modulate gene expression[6,7]. One such mechanism is DNA methylation (DNAm). During pregnancy, maternal diet, smoking, stress and hormonal changes affect DNAm patterns[8]. Maternal obesity, which is associated with birth weight, also alters the methylation of CpG sites (CpGs)[9]. However, little is known about the effect of excessive GWG in the absence of maternal obesity on DNAm and neonatal body composition. Therefore, the objective of the present study was to assess changes in maternal DNAm related to GWG in women who started pregnancy with an adequate BMI and their associations with foetal and neonatal body composition.
2. Materials and Methods
2.1. Subjects
This is a prospective cohort study involving healthy pregnant women randomly selected from 34 Basic Health Units and the Municipal Maternity Hospital of Araraquara, São Paulo, Brazil, as part of the epidemiological Araraquara Cohort Study. A convenience sample of pregnant women with a normal pre-pregnancy BMI (≥ 18.5 and < 24.9 kg/m2) was randomly selected and further divided into two groups according to GWG recommended by the IOM[1]: excessive gestational weight gain - EGWG (total weight gain > 16 kg; n=30) and adequate gestational weight gain (AGWG; 11.5 kg > total weight gain < 16.0 kg; n=45).
The women were followed up at three different time points during pregnancy, at delivery, and at hospital discharge: T1, up to gestational age (GA) ≤ 15 weeks; T2, 20-26 weeks; T3, 30-36 weeks; T4, at delivery, and T5, hospital discharge (72 hours after delivery). This study was conducted in accordance with the Declaration of Helsinki and approved in 12/05/2017 by the Research Ethics Committee of the School of Public Health, University of São Paulo (protocol number 2.570.576).
Pregnant women who met one of the following exclusion criteria were removed from further analyses: more than 15 gestational weeks; under 18 and over 35 years of age; diagnosis of chronic diseases, severe mental illness, and infectious disease; multiple pregnancy; a history of abortion; smoking and use of alcohol or other drugs at the beginning of the study or during follow-up. Women who lost weight or had poor weight gain during pregnancy, those who had a stillborn child or a child with congenital diseases, and those who failed to attend one appointment during the follow-up period were also excluded.
2.2. Anthropometric assessment of the pregnant women
Pre-gestational maternal BMI was used for nutritional diagnosis, identifying pregnant women with normal BMI. The pre-gestational weight was measured until the 13th week of gestation (assessed by ultrasonography). Weight at the three different time points during pregnancy and at delivery was measured by bioimpedance analysis using the Inbody 370 analyser (Biospace®, Seoul, Korea). Women were classified according to the GWG recommendations of IOM[1] as EGWG and AGWG.
2.3. Foetal body composition
Foetal body composition was evaluated by ultrasonography at T2 and T3. A trained sonographer performed the measurements using the ACUSON X300TM ultrasound system, premium edition (Siemens®, Mountain View, CA, USA) equipped with curvilinear abdominal transducers (C5-2, C6-3, V7-3). The following foetal parameters were assessed: subcutaneous abdominal fat thickness (SCFT, mm); total thigh tissue=total muscle mass + fat (cm3); thigh muscle mass=internal area of the subcutaneous tissue of the thigh (cm3); subcutaneous thigh fat=total thigh tissue - thigh muscle mass (cm3); total arm tissue=thigh muscle mass + fat (cm3); arm muscle mass=internal area of the subcutaneous tissue of the arm (cm3); subcutaneous arm fat=total arm tissue - arm muscle mass (cm3).
2.4. Anthropometry and body composition of neonates
Neonates were evaluated at hospital discharge (T5), 12-72 hours after delivery. Length (cm) was measured with a Seca® 416 infantometer (Hamburg, Germany). The body composition and weight of the neonates were evaluated by air displacement plethysmography using the PEA POD equipment (Cosmed®, Concord, CA, USA).
2.5. Sample collection and DNA extraction
At T3, 2 ml of maternal blood during fasting was collected into VACUETTE® EDTA tubes, manually homogenized, and refrigerated for further extraction of DNA. Total genomic DNA was extracted from maternal blood samples with proteinase K (Thermo Fisher® Products, Vilnius, LTU) according to the manufacturer’s protocol, followed by a modified salting method[10]. The extracted DNA was quantified in a Nanodrop spectrophotometer (Thermo Fisher Scientific Inc., Santa Clara, CA, USA). Samples with an OD260:OD280 ratio greater than 1.8 and an OD260:OD230 ratio between 1.8 and 2.2 were considered to be pure. Integrity was checked by 2.0% agarose gel electrophoresis with ethidium bromide diluted to a concentration of ~50 ng/µl. The DNA methylome was evaluated in eight pregnant women of each group, matched for baby’s sex and maternal parity.
2.6. Methylation analysis
High-quality bisulfite-converted DNA samples (EZ DNA Methylation Kit, Zymo Research Corp, Irvine, CA, USA) were hybridized to the Infinium HumanMethylationEPIC BeadChip microarray (EPIC, Illumina), following the Illumina Infinium HD protocol at Diagenode (www.diagenode.com). Raw data were extracted as IDAT files with the iScan SQ Scanner (Illumina) using the GenomeStudio software (v.2011.1) and the methylation module v.1.9.0 (Illumina). Probes were annotated according to the Illumina annotation file using the Human GRCh37/hg19 assembly.
Quality control was assessed on the IDAT files, loaded into the R environment with the ChAMP package[11]. Failed probes (detP > 0.01, n=3,755), probes with <3 beads in at least 5% of samples (n=40,386), non-CG probes (n=2,791), multi-hit probes[12] (n=11), and probes located in XYS[13] (n=109,529) were excluded. The remaining 709,466 probes were normalized using the BMIQ method[14] (Additional file 1: Figure S1). Singular value decomposition (SVD) analysis[15] identified batch effects in the dataset, which were corrected[16]. Biological covariates were then correlated with the main components of the methylation data. Next, we estimated the influence of methylation resulting from the distinct cellular composition of whole blood using methylation profiles of the major blood cell types. Based on the results, we adjusted the cell-type heterogeneity for each sample using the RefbaseEWAS method[17]. Methylation levels for each probe are reported as beta-values (0: unmethylated, 1: methylated), which were used for graphical representation; M-values (logit-transformed beta-values) were used for statistical analysis due to the homoscedastic behaviour of the data, unless otherwise stated.
Differential methylation analyses were performed comparing the two groups of pregnant women, AGWG and EGWG. Empirical Bayesian estimation was applied to M-values using a linear regression model from the limma package[18] to identify differential methylated positions (DMPs). The bumphunter package[19] was used to identify differentially methylated regions (DMRs), considering at least 7 CpGs in a maximum gap of 300 bases, lowess smoothing of the genomic profile, and 250 resamples to compute the null distribution. Functional annotation of DMRs was performed by enrichment analysis using GREAT[20]. We considered DMPs, DMRs, and functional annotation with a p-value ≤0.05 to be significant.
2.7. Data analysis
The Shapiro-Wilk test was applied to test the normality of the data. The t-test for independent samples was used for comparisons between the AGWG and EGMG groups. The chi-square test was applied to compare categorical variables between the two groups of pregnant women. Repeated measures ANOVA using a mixed model and Bonferroni’s post hoc test were performed, in which the follow-up data were the repeated measures over time and the groups were the independent variables. Univariate and multiple linear regression models were used to explore the associations between mean maternal DNAm levels in each DMR and markers of foetal and neonatal body composition. The outcome measures were weight, SCFT, total thigh tissue, thigh muscle mass, subcutaneous thigh fat, total arm tissue, arm muscle mass and subcutaneous arm fat of the foetus at T2 and T3, and weight, length, fat-free mass percentage, fat mass percentage, fat-free mass and fat mass of the neonate at T5. The confounding variables included maternal age, pre-pregnancy BMI, GWG, GA, and newborn sex. Statistical significance was set at p≤0.05 and analysis was performed using the SPSS 18.0 software (SPSS, Chicago, IL, USA).
3. Results
3.1. Characteristics of the pregnant women and their neonates
Table 1. shows the demographic, socioeconomic and obstetric characteristics of the pregnant women. No differences in age, ethnicity, marital status, or education were found between groups.
3.2. Anthropometry and body composition of pregnant women and of their foetuses and neonates
The anthropometric characteristics and body composition of pregnant women in the AGWG and EGWG groups are shown in Table 2. As expected, pre-gestational weight, pre-gestational BMI, height or pre-gestational body composition did not differ between AGWG and EGWG. However, total GWG was significantly higher in EGWG (p=0.01). Furthermore, significant differences in weight and GWG between the two groups occurred with advancing gestation. There was an effect of time [F(3;219) = 1,484.79; p<0.001], with T4 > T3 > T2 > T1 (p<0.001), and group [F(1;73)=15.95; p<0.001] on weight, with EGWG women exhibiting significantly higher weights than AGWG women (p<0.001). There was also an effect of the time*group interaction [F (3;219)=53.50; p<0.001] on weight, where AGVW=EGWG, with T4 > T3 > T2 > T1 (p<0.001). Comparison of the different time points showed no significant difference between groups at T1 (p=0.07), but there were statistically significant differences at T2, T3, and T4. With the exception of T1, the EGWG group always had significantly higher weights than the AGWG group (p<0.001), Figure 1(a). There was an effect of time [F(2;146)=894,63; p<0.001], with T4 > T3 > T2 (p<0.001), and group [F(1;73)=101,96; p<0.001] on GWG, with significantly higher GWG in the EGWG group (p<0.001). There was also an effect of the time*group interaction [F(2;146)=32,24; p<0.001] on GWG, where AGWG=EGWG, with T4 > T3 > T2 (p<0.001). Comparison of the different time points showed statistically significant differences at T2, T3, and T4. Gestational weight gain was always higher in the EGWG group compared to the AGWG group (p<0.001), Figure 1(b).
Table 2 also shows the foetal body composition at T2 and T3 and anthropometry and neonatal body composition at T5. There were no differences in the foetal body composition parameters investigated. However, neonates of the EGWG group at 72 hours of life had higher weights (p = 0.027) and fat mass (p = 0.039) than those born to AGWG mothers.
3.3. Characterization of DNA methylation
DNA methylation at 709,466 CpGs was evaluated in the two groups of pregnant women. Multidimensional scaling (MDS) analysis of the 1% most variable positions showed inter-sample variability, indicating that there were no systemic methylation changes among groups (Additional file 2: Figure S2). To obtain more robust findings and considering the small sample size in our study, we searched for DNAm differences using two approaches: DMPs and DMRs.
We did not identify differences in DMPs between the EGWG and AGWG groups at the CpGs after Benjamini-Hochberg correction (adjusted p-value <0.05). This finding is not unexpected considering three factors: small sample size, population of healthy pregnant women, and mild DNAm changes. However, we found 46 CpGs (33 hyper- and 13 hypomethylated) with a p-value <0.05 and DNAm differences greater than 10% between EGWG and AGWG (Additional file 3: Table S1). Hierarchical clustering based on these DMPs identified two groups: one group of 7 women who gained adequate weight and 1 woman who gained excessive weight, and a second group containing 7 women who gained excessive weight and 1 woman who gained adequate weight (Figure 2). Likewise, the significant biological covariates identified by SVD analysis showed slightly different patterns for each group (Additional file 4: Figure S3), suggesting that these patterns may be related to the epigenetic signature.
Pearson correlation distance with complete linkage. Heatmap colours refer to methylation levels: unmethylated (white), partially methylated (gray), and methylated (black). The heatmap columns are annotated with biological covariates correlated with principal components of the methylation data. T2GWG: gestational weight gain (kg) at T2; T3GWG: gestational weight gain (kg) at T3; T4GWG: gestational weight gain (kg) at T4; T3AMM: arm muscle mass (cm3) at T3; T3TMM: thigh muscle mass (cm3) at T3; T3GW: gestational weight (kg) at T3; T4GW: gestational weight (kg) at T4; T4GBMI: gestational body mass index (kg/m2) at T4; FMM: fat-free mass (%) at T5. E: represent samples from the group with excessive gestational weight gain and A: represent samples from the group with adequate gestational weight gain.
Furthermore, we identified 11 DMRs between EGWG and AGWG (DMR1 = chr6:29648161-29648756, DMR2 = chr6:31148332-31148666, DMR3 = chr7:27183133-27183816, DMR4 = chr10:530635-531584, DMR5 = chr22:51016386-51016950, DMR6 = chr16:3062296-3062975, DMR7 = chr5:110062539-110062837, DMR8 = chr17:41278135-41278906, DMR9 = chr2:27301195-27301943, DMR10 = chr5:170288671-170288788, DMR11 = chr12:52281482-52281997), being 9 hyper- and 2 hypomethylated (Additional file 5: Table S2), located in 13 genes (EMILIN1, HOXA5, CPT1B, CLDN9, ZFP57, BRCA1, POU5F1, ANKRD33, HLA-B, RANBP17, ZMYND11, DIP2C, TMEM232) (Additional file 6: Figure S4). Nine human phenotypes were enriched for these DMRs (Table 3).
3.4. DNA methylation changes are associated with some foetal and neonatal outcomes
We explored the associations of mean maternal DNAm levels in each DMR with the extent of maternal GWG and foetal and neonatal body composition. Table 4 shows significant associations between mean maternal DNAm levels in each DMR and foetal and neonatal body composition, even after adjusting for confounding factors. Maternal DMR2 methylation was associated with foetal total thigh tissue at T2 (p=0.014) and T3 (p=0.018), thigh muscle mass at T2 (p=0.021) and T3 (p=0.032), and subcutaneous thigh fat at T2 (p=0.029). There were associations of maternal DMR6 methylation with foetal total thigh tissue at T2 (p=0.039), subcutaneous thigh fat at T2 (p=0.017), total arm tissue at T3 (p=0.002), and subcutaneous arm fat at T3 (p=0.01). Maternal DMR10 methylation was associated with foetal subcutaneous thigh fat at T3 (p=0.033). At T5, associations were found between maternal DMR2 methylation and neonatal fat mass percentage (p=0.039) and fat mass (p=0.040).
4. Discussion
In this study, we evaluated the influence of maternal weight gain during pregnancy on DNAm patterns and its potential impact on foetal and neonatal body composition. A rigorous selection was applied to include only healthy pregnant women in the EGWG and AGWG groups, who started gestation with a normal BMI and similar pre-pregnancy lean mass and fat mass, in order to eliminate unwanted methylation patterns related to any of the exclusion factors.
There was a difference in GWG between the two groups of women from T3 onwards. The mean difference in weight gain was approximately 6kg. In contrast to other studies, we considered weight gain the variable of interest and controlled for other comorbidities, like obesity[9]. There were no differences in the characteristics of the pregnant women or neonate sex between groups. Foetal body composition did not differ significantly between the EGWG and AGWG groups. Few studies have assessed adiposity by ultrasound during the foetal period, especially the effect of GWG on foetal adiposity parameters such as SCFT, which was higher in foetuses of pregnant women with alterations in the glycaemic index[21] and with obesity[22]. In our study, neonates born to EGWG women had a significantly higher weight and fat mass than those born to AGWG women. The explanation for the different fat mass results between neonates in the EGWG and AGWG groups, but not between foetuses, may be related to the gap of 6 weeks between T3 and T4, when the foetuses probably gained more weight; these time points correspond to the periods when the groups of women started to show statistically significant differences in GWG. In addition to the epigenetic marks that may be registered in the parameters of body composition of the foetus and manifested at birth.
The differences in DNAm between the EGWG and AGWG groups were mild compared to those observed in other diseases such as obesity. Studies have shown a positive association of higher methylation with a BMI outside the normal range[9]. However, we demonstrate that, even in the absence of other risk factors, EGWG can potentially trigger changes in clinical and epigenetic factors in pregnant women and their offspring. Furthermore, DNAm was altered in regions located in 13 important genes. The methylation in these genes has been less studied; we therefore highlight below the literature findings regarding the involvement of these genes in metabolism.
The levels of the elastin microfibril interfacer 1 (EMILIN1) gene that encodes an extracellular matrix glycoprotein were found to be altered in hypertension and obesity[23]. Homeobox a5 (HOXA5), which encodes a developmental transcription factor and is expressed in embryonic adipose tissue, is involved in adipose tissue differentiation, browning of white adipose tissue, and regulation of brown adipose tissue development[24]. The carnitine palmitoyl transferase 1b (CPT1b) gene controls β-oxidation by regulating the transport of long-chain fatty acids across mitochondrial membranes. Low CPT1b levels contribute to fat accumulation. This gene showed lower expression in the muscle outer mitochondrial membrane of obese subjects compared to lean individuals[25].
The claudin-9 (CLDN9) gene was differentially co-expressed in a study of obesity-associated networks in human subcutaneous adipose tissue[26]. This gene is also involved in mechanisms underlying dietary modulation of intestinal permeability with probiotics[27]. The zinc finger protein 57 homolog (ZFP57) gene, a transcriptional repressor, is involved in genomic imprinting and mutations in this gene have been associated with transient neonatal diabetes mellitus[28]. The ZFP57 genes was one of 38 genes potentially associated with monogenic diabetes in a next-generation sequencing study[29]. The breast cancer 1 (BRCA1) gene, a tumour suppressor, has been associated with ovarian and breast cancers in women. Obesity can change the expression of this gene[30]. The POU class 5 homeobox 1 (POU5F1) gene, a transcription factor involved in the self-renewal of undifferentiated stem cells and induction of embryonic pluripotency via metabolic mechanisms, has been shown to be involved in β-cell dedifferentiation in type 2 diabetes[31] and is altered in breast cancer[32].
The ankyrin repeat domain 33 (ANKRD33) gene was found among the top 20 differently expressed genes in placenta of women with pre-eclampsia when compared to those with normal pregnancy[33]. This gene predominated in methylation quantitative trait loci in a functional genomics study of the paediatric obese asthma phenotype[34]. The major histocompatibility complex gene class I, B (HLA-B) plays a role in the immune response to viruses and infectious diseases. Its alleles have been strongly associated with obesity because they are related to increased BMI in adults[35]. The RAN-binding protein 17 (RANBP17) gene, a nuclear transport receptor, has been associated with BMI and visceral adiposity in polymorphism studies[36].
The zinc finger MYND-type containing 11 (ZMYND11) gene plays a role in cancer[37] and a recent transcriptome meta-analysis in young and older humans showed an inverted expression profile of this gene in resistance training[38]. The disco-interacting protein 2 homolog C (DIP2C) gene has been implicated in developmental delays[39]. The gene is also found among the main differentially expressed genes in polycystic ovary syndrome[40]. The transmembrane protein 232 (TMEM232) gene has been associated with lung diseases such as asthma[41].
In summary, the genes containing DMRs found in the present study are implicated in diabetes, hypertension, obesity, lung diseases, cancer, inflammation, adipogenesis, genomic imprinting, and lipid metabolism. Supporting our findings, several terms related to metabolism were also identified among the enriched human phenotypes, such as transient neonatal diabetes mellitus, neonatal insulin-dependent diabetes mellitus, insulin-resistant diabetes mellitus, insulin resistance, and hyperglycaemia, indicating a tenuous alteration in the metabolism of women who gained excessive weight during pregnancy and a risk pattern for developing diseases in pregnancy or later in life.
Overweight in children can be attributed to GWG[42]. A study conducted in Brazil showed that the higher the GWG, the greater the body fat mass at 6 years of age[43]. Fat mass measured by plethysmography in preschool children from the European Childhood Obesity Project was associated with their DNAm[44]. In the present study, combined analysis revealed associations between the mean level of maternal DNAm (mainly in 3 DMRs) and the foetal body composition parameters investigated: total thigh tissue at T2 and T3, thigh muscle mass at T2 and T3, subcutaneous thigh fat at T2 and T3, total arm tissue at T3, and subcutaneous arm fat at T3. Furthermore, there were associations between the mean level of maternal DNAm (mainly in 3 DMRs) and neonatal (T5) fat mass percentage and fat mass. These results suggest that body composition is not only affected by immediate circumstances but can be programmed by intrauterine exposures. This is an important finding since fat mass and fat-free mass can have different effects on health outcomes[45].
We point out some limitations of this study: 1) DNAm changes were assessed at the end of pregnancy and not compared to DNAm patterns at baseline, although the study design has the advantage that the whole population starts pregnancy with an adequate BMI; 2) the small sample size; 3) the lack of assessment of gene expression that could be correlated with the methylation levels in DMRs. Thus, further cohort studies are necessary to confirm our results in different human populations and futher studies is also needed to elucidate the mechanistic links of our current fndings.
5. Conclusion
To our knowledge, this is the first study that assessed the relationship of maternal DNAm in EGWG with foetal and neonatal adiposity. The methylation pattern in the EGWG women who started pregnancy with a normal BMI indicated a risk for developing chronic diseases and involvement of maternal DNAm in foetal lean and fat mass and in neonatal fat mass. These findings provide support for possible epigenetic programming of offspring body composition and contribute to literature data that link specific exposures to variations in epigenetic profiles and metabolic phenotypes in humans.
Supplementary Materials
The following supporting information can be downloaded at the website of this paper posted on Preprints.org. Addtional file 1. Figure S1: Multidimensional scaling of the 1% most variable CpG sites; Additional file 2. Tabela S1: 46 differentially methylated CpG sites between EGWG and AGWG; Additional file 3. Figure S2: Singular value decomposition (SVD); Additional file 4. Table S2: Identification of differentially methylated regions; Additional file 5. Figure S3: Chromosome location of differentially methylated regions associated with the transcription start sites of genes; Additional file 6. Figure S5: Density plot of beta-values.
Author Contributions
PHCR, PPA, JVSG, ERS, and MM designed the research; PHCR and LAL coordinated the field work; PPA participated in the collection of clinical data and biological material; PPA, LAL, and ESR performed the acquisition, analysis, and interpretation of DNA methylation data; MM and JVSG conducted bioinformatics analysis. PPA and PHCR directed statistical analysis; PPA and JVSG wrote the first draft of the manuscript; PHCR, MM, LAL, and ESR reviewed the manuscript and provided critical revision. All authors read and approved the final manuscript.
Funding
PHCR received a grant number 2015/03333-6 from the São Paulo State Research Foundation (FAPESP) to support the study. PPA received Doctorate scholarships from the Coordination for the Improvement of Higher Education Personnel (CAPES) and from FAPESP, grant number 2018/17824-0. FAPESP and CAPES had no role in the design, analysis, or writing of this manuscript.
Institutional Review Board Statement
This study was conducted in accordance with the Declaration of Helsinki. All experiments were performed in accordance with relevant guidelines and regulations, approved in 12/05/2017 by the Research Ethics Committee of the School of Public Health, University of São Paulo (protocol number 2.570.576). The informed consent was obtained from all subjects and/or their legal guardian(s).
Informed Consent Statement
Not applicable.
Data Availability Statement
The datasets supporting the conclusions of this article are included within the article and its additional files. The raw data are not publicly available due individual privacy but are available from the corresponding author on reasonable request.
Acknowledgments
We would like to thank the Health Units, the Special Health Care Service, and the Municipal Maternity Hospital of Araraquara. We are especially grateful to the Director Lúcia Ortiz, Dr. Ademir Roberto Sala, Dr. Walter Manso Figueiredo, and Prof. Angela Aparecida Costa for their help with the data collection. We also thank all pregnant women and their babies who participated in this study.
Conflicts of Interest
All authors declare that they have no competing interests.
List of abbreviations
The Institute of Medicine (IOM), body mass index (BMI), gestational age (GA), gestational weight gain (GWG), adequate gestational weight gain (AGWG), excessive gestational weight gain (EGWG), subcutaneous abdominal fat thickness (SCFT), time 1 (T1), time 2 (T2), time 3 (T3), time 4 (T4), time 5 (T5), DNA methylation (DNAm), CpG sites (CpGs), differential methylated positions (DMPs), differentially methylated regions (DMRs) and singular value decomposition (SVD).
References
- Rasmussen, K.M.; Yaktine, A.L. Guidelines I of M (US) and NRC, Weight (US) Committee to Reexamine IOM Pregnancy. Weight Gain During Pregnancy. Weight Gain Dur Pregnancy Reexamining Guidel 2009.
- Guelinckx, I.; Devlieger, R.; Beckers, K.; Vansant, G. Maternal obesity: Pregnancy complications, gestational weight gain and nutrition. Obes. Rev, 2008, 9, 140-150. [CrossRef]
- Centers for disease control and prevention et al. QuickStats: Gestational Weight Gain* Among Women with Full-Term, Singleton Births, Compared with Recommendations - 48 States and the District of Columbia, 2015. MMWR Morb Mortal Wkly Rep. 2016, 3, 2018.
- Goldstein, R.F.; Abell, S.K.; Ranasinha, S.; Misso, M.L.; Boyle, J.A.; Harrison, C.L.; et al. Gestational weight gain across continents and ethnicity: systematic review and meta-analysis of maternal and infant outcomes in more than one million women. BMC Med [Internet]. BMC Medicine. 2018, 16, 1-14. [CrossRef]
- Carrilho, T.R.B.; Rasmussen, K.M.; Hutcheon, J.A.; Alves, R.F.S.; Farias, D.R.; Freitas-Costa, N.C.; et al. Prevalence and temporal trends in prepregnancy nutritional status and gestational weight gain of adult women followed in the Brazilian Food and Nutrition Surveillance System from 2008 to 2018. Matern & Child Nutr. 2022, 18, e13240. [CrossRef]
- Barker, D.J. In utero programming of chronic disease. Clin Sci (Lond). 1998, 95, 115-28.
- Godfrey, K.M.; Sheppard, A.; Gluckman, P.D.; Lillycrop, K.A.; Burdge, G.C.; Mclean, C.; et al. Epigenetic gene promoter methylation at birth is associated with child’s later adiposity. Diabetes. 2011, 60, 1528-1534. [CrossRef]
- Portha, B.; Fournier, A.; Ah Kioon, M.D.; Mezger, V.; Movassat, J. Early environmental factors, alteration of epigenetic marks and metabolic disease susceptibility. Biochimie. 2014, 97, 1-15. [CrossRef]
- Sharp, G.C.; Lawlor, D.A,; Richmond, R.C.; Fraser, A.; Simpkin, A.; Suderman, M.; et al. Maternal pre-pregnancy BMI and gestational weight gain, offspring DNA methylation and later offspring adiposity: findings from the Avon Longitudinal Study of Parents and Children. Int J Epidemiol. 2015, 44, 1288-1304. [CrossRef]
- Olerup, O.; Zetterquist, H.; HLA-DR typing by PCR amplification with sequence-specific primers (PCR-SSP) in 2 hours: An alternative to serological DR typing in clinical practice including donor-recipient matching in cadaveric transplantation. Tissue Antigens. 1992, 39, 225-35. [CrossRef]
- Morris, T.J.; Butcher, L.M.; Feber, A.; Teschendorff, A.E.; Chakravarthy, A.R.; Wojdacz, T.K.; et al. ChAMP: 450k Chip Analysis Methylation Pipeline. Bioinformatics. 2014, 30, 428-30. [CrossRef]
- Nordlund, J.; Bäcklin, C.L.; Wahlberg, P.; Busche, S.; Berglund, E.C.; Eloranta, M.L.; et al. Genome-wide signatures of differential DNA methylation in pediatric acute lymphoblastic leukemia. Genome Biol. 2013, 14, 1-15. [CrossRef]
- Zhou, W.; Laird, P.W.; Shen, H. Comprehensive characterization, annotation and innovative use of Infinium DNA methylation BeadChip probes. Nucleic Acids Res. 2017, 45, e22-e22. [CrossRef]
- Teschendorff, A.E.; Marabita, F.; Lechner, M.; Bartlett, T.; Tegner, J.; Gomez-Cabrero, D.; et al. A beta-mixture quantile normalization method for correcting probe design bias in Illumina Infinium 450 k DNA methylation data. Bioinformatics. 2013, 29, 189-96. [CrossRef]
- Teschendorff, A.E.; Menon, U.; Gentry-Maharaj, A.; Ramus S,J.; Gayther, S.A.; Apostolidou, S.; et al. An epigenetic signature in peripheral blood predicts active ovarian cancer. PLoS One. 2009, 4, e8274. [CrossRef]
- Johnson, W.E.; Li, C.; Rabinovic, A. Adjusting batch effects in microarray expression data using empirical Bayes methods. Biostatistics. 2007, 8, 118-27. [CrossRef]
- Houseman, E.A.; Accomando, W.P.; Koestler, D.C.; Christensen, B.C.; Marsit, C.J.; Nelson, H.H,; et al. DNA methylation arrays as surrogate measures of cell mixture distribution. BMC Bioinformatics. 2012, 13, 1-16. [CrossRef]
- Smyth, G.K. Linear models and empirical bayes methods for assessing differential expression in microarray experiments. Stat Appl Genet Mol Biol. 2004, 3, 1. [CrossRef]
- Jaffe, A.E.; Murakami, P.; Lee, H.; Leek, J.T.; Fallin, M.D.; Feinberg, A.P.; et al. Bump hunting to identify differentially methylated regions in epigenetic epidemiology studies. Int J Epidemiol. 2012, 41, 200-9. [CrossRef]
- McLean, C.Y.; Bristor, D.; Hiller, M.; Clarke, S.L.; Schaar, B.T.; Lowe, C.B.; et al. GREAT improves functional interpretation of cis-regulatory regions. Nat Biotechnol [Internet]. 2010, 28, 495-501. [CrossRef]
- Venkataraman, H.; Ram, U.; Craik, S.; Arungunasekaran, A.; Seshadri, S.; Saravanan, P. Increased fetal adiposity prior to diagnosis of gestational diabetes in South Asians: more evidence for the ‘thin-fat’ baby. Diabetologia. 2017, 60, 399-405. [CrossRef]
- Yerlikaya-Schatten, G.; Feichtinger, M.; Stopp, T.; Huhn, E.A.; Chalubinski, K.; Husslein, P.; et al. Trajectories of Fetal Adipose Tissue Thickness in Pregnancies After Gastric Bypass Surgery. Obes Surg. 2020, 30, 96-101. [CrossRef]
- Favero, G.; Paini, A.; De Ciuceis, C.; Rodella, L.F.; Moretti, E.; Porteri, E.; et al. Changes in extracellular matrix in subcutaneous small resistance arteries of patients with essential hypertension. Blood Press [Internet]. 2018, 27, 231-239. [CrossRef]
- Holzman, M.A.; Ryckman, A.; Finkelstein, T.M.; Landry-Truchon, K.; Schindler, K.A.; Bergmann, J.M.; et al. HOXA5 Participates in Brown Adipose Tissue and Epaxial Skeletal Muscle Patterning and in Brown Adipocyte Differentiation. Front Cell Dev Biol. 2021, 9, 311. [CrossRef]
- Lefort, N.; Glancy, B.; Bowen, B.; Willis, W.T.; Bailowitz, Z.; De Filippis, E.A.; et al. Increased reactive oxygen species production and lower abundance of complex I subunits and carnitine palmitoyltransferase 1B protein despite normal mitochondrial respiration in insulin-resistant human skeletal muscle. Diabetes. 2010, 59, 2444-52. [CrossRef]
- Walley, A.J.; Jacobson, P.; Falchi, M.; Bottolo, L.; Andersson, J.C.; Petretto, E.; et al. Differential coexpression analysis of obesity-associated networks in human subcutaneous adipose tissue. Int J Obes. 2012, 36, 137-47. [CrossRef]
- Tulyeu, J.; Kumagai, H.; Jimbo, E.; Watanabe, S.; Yokoyama, K.; Cui, L.; et al. Probiotics prevents sensitization to oral antigen and subsequent increases in intestinal tight junction permeability in juvenile–young adult rats. Microorganisms. 2019, 7, 463. [CrossRef]
- Mackay, D.J.G.; Callaway, J.L.A.; Marks, S.M.; White, H.E.; Acerini, C.L.; Boonen, S.E.; et al. Hypomethylation of multiple imprinted loci in individuals with transient neonatal diabetes is associated with mutations in ZFP57. Nat Genet. 2008, 40, 949-51. [CrossRef]
- Parkkola, A.; Turtinen, M.; Härkönen, T.; Ilonen, J.; Knip, M.; Knip, M.; et al. Family history of type 2 diabetes and characteristics of children with newly diagnosed type 1 diabetes. Diabetologia. 2021, 64, 581-90. [CrossRef]
- Iyengar, N.M.; Zhou, X.K.; Mendieta, H.; El-Hely, O.; Giri, D.D.; Winston, L.; et al. Effects of obesity on breast aromatase expression and systemic metabo-inflammation in women with BRCA1 or BRCA2 mutations. NPJ Breast Cancer [Internet]. 2021, 7, 18. [CrossRef]
- 31. Sun, T.; Han, X. Death versus dedifferentiation: The molecular bases of beta cell mass reduction in type 2 diabetes. Semin Cell Dev Biol [Internet]. 2020, 103, 76-82. [CrossRef]
- Jin, X.; Li, Y.; Guo, Y.; Jia, Y.; Qu, H.; Lu, Y.; et al. ERα is required for suppressing OCT4-induced proliferation of breast cancer cells via DNMT1/ISL1/ERK axis. Cell Prolif. 2019, 52, e12612. [CrossRef]
- Wang, J.; Gao, F.; Zhao, X.; Cai, Y.; Jin, H. Integrated analysis of the transcriptome- wide m6A methylome in preeclampsia and healthy control placentas. PeerJ. 2020, 8, e9880. [CrossRef]
- Rastogi, D.; Johnston, A.D.; Nico, J.; Loh, L.N.; Jorge, Y.; Suzuki, M.; et al. Functional genomics of the pediatric obese asthma phenotype reveal enrichment of rho-gtpase pathways. Am J Respir Crit Care Med. 2020, 202, 259-74. [CrossRef]
- Shen, J.; Guo, T.; Wang, T.; Zhen, Y.; Ma, X.; Wang, Y.; et al. HLA-B∗07, HLA-DRB1∗07, HLA-DRB1∗12, and HLA-c∗03:02 strongly associate with BMI: Data from 1.3 million healthy Chinese adults. Diabetes. 2018, 67, 861-71. [CrossRef]
- Karlsson, T.; Rask-Andersen, M.; Pan, G.; Höglund, J.; Wadelius, C.; Ek, W.E.; et al. Contribution of genetics to visceral adiposity and its relation to cardiovascular and metabolic disease. Nat Med [Internet]. 2019, 25, 1390-5. [CrossRef]
- Boyson, S.P.; Gao, C.; Quinn, K.; Boyd, J.; Paculova, H.; Frietze, S.; et al. Functional roles of bromodomain proteins in cancer. Cancers (Basel). 2021, 13, 3606. [CrossRef]
- Deane, C.S.; Willis, C.R.G.; Phillips, B.E.; Atherton, P.J.; Harries, L.W.; Ames, R.M.; et al. Transcriptomic meta-analysis of disuse muscle atrophy vs. resistance exercise-induced hypertrophy in young and older humans. J Cachexia Sarcopenia Muscle. 2021, 12, 629-45. [CrossRef]
- Descipio, C.; Conlin, L.; Rosenfeld, J.; Tepperberg, J.; Pasion, R.; Patel, A.; et al. Subtelomeric deletion of chromosome 10p15.3: Clinical findings and molecular cytogenetic characterization. Am J Med Genet Part A. 2012, 158, 2152-61. [CrossRef]
- Devarbhavi, P.; Telang, L.; Vastrad, B.; Tengli, A.; Vastrad, C.; Kotturshetti, I. Identification of key pathways and genes in polycystic ovary syndrome via integrated bioinformatics analysis and prediction of small therapeutic molecules. Reprod Biol Endocrinol. 2021, 19, 31. [CrossRef]
- Yang, I.V.; Lozupone, C.A.; Schwartz, D.A. The environment, epigenome, and asthma. J Allergy Clin Immunol [Internet]. 2017, 140, 14-23. [CrossRef]
- Voerman, E.; Santos, S.; Golab, B.P.; Amiano, P.; Ballester, F.; Barros, H.; et al. Maternal body mass index, gestational weight gain, and the risk of overweight and obesity across childhood: An individual participant data meta-analysis. PLoS Med. 2019, 16, e1002744. [CrossRef]
- Castillo, H.; Santos, I.S.; Matijasevich, A. Relationship between maternal pre-pregnancy body mass index, gestational weight gain and childhood fatness at 6-7 years by air displacement plethysmography. Matern Child Nutr. 2015, 11, 606-17. [CrossRef]
- Rzehak, P.; Covic, M.; Saffery, R.; Reischl, E.; Wahl, S.; Grote, V.; et al. DNA-Methylation and Body Composition in Preschool Children: Epigenome-Wide-Analysis in the European Childhood Obesity Project (CHOP)-Study. Sci Rep [Internet]. 2017, 7, 14349. [CrossRef]
- Bigaard, J.; Frederiksen, K.; Tjønneland, A.; Thomsen, B.L.; Overvad, K.; Heitmann, B.L.; et al. Body fat and fat-free mass and all-cause mortality. Obes Res. 2004, 12, 1042-9. [CrossRef]
Figure 1.
Evolution of gestational weight and gestational weight gain. Repeated measures ANOVA using a mixed model and Bonferroni’s post hoc test. T1= ≤15 gestational weeks, T2=20-26 weeks, T3=30-36 weeks and T4=delivery. ×p≤0.05.
Figure 1.
Evolution of gestational weight and gestational weight gain. Repeated measures ANOVA using a mixed model and Bonferroni’s post hoc test. T1= ≤15 gestational weeks, T2=20-26 weeks, T3=30-36 weeks and T4=delivery. ×p≤0.05.
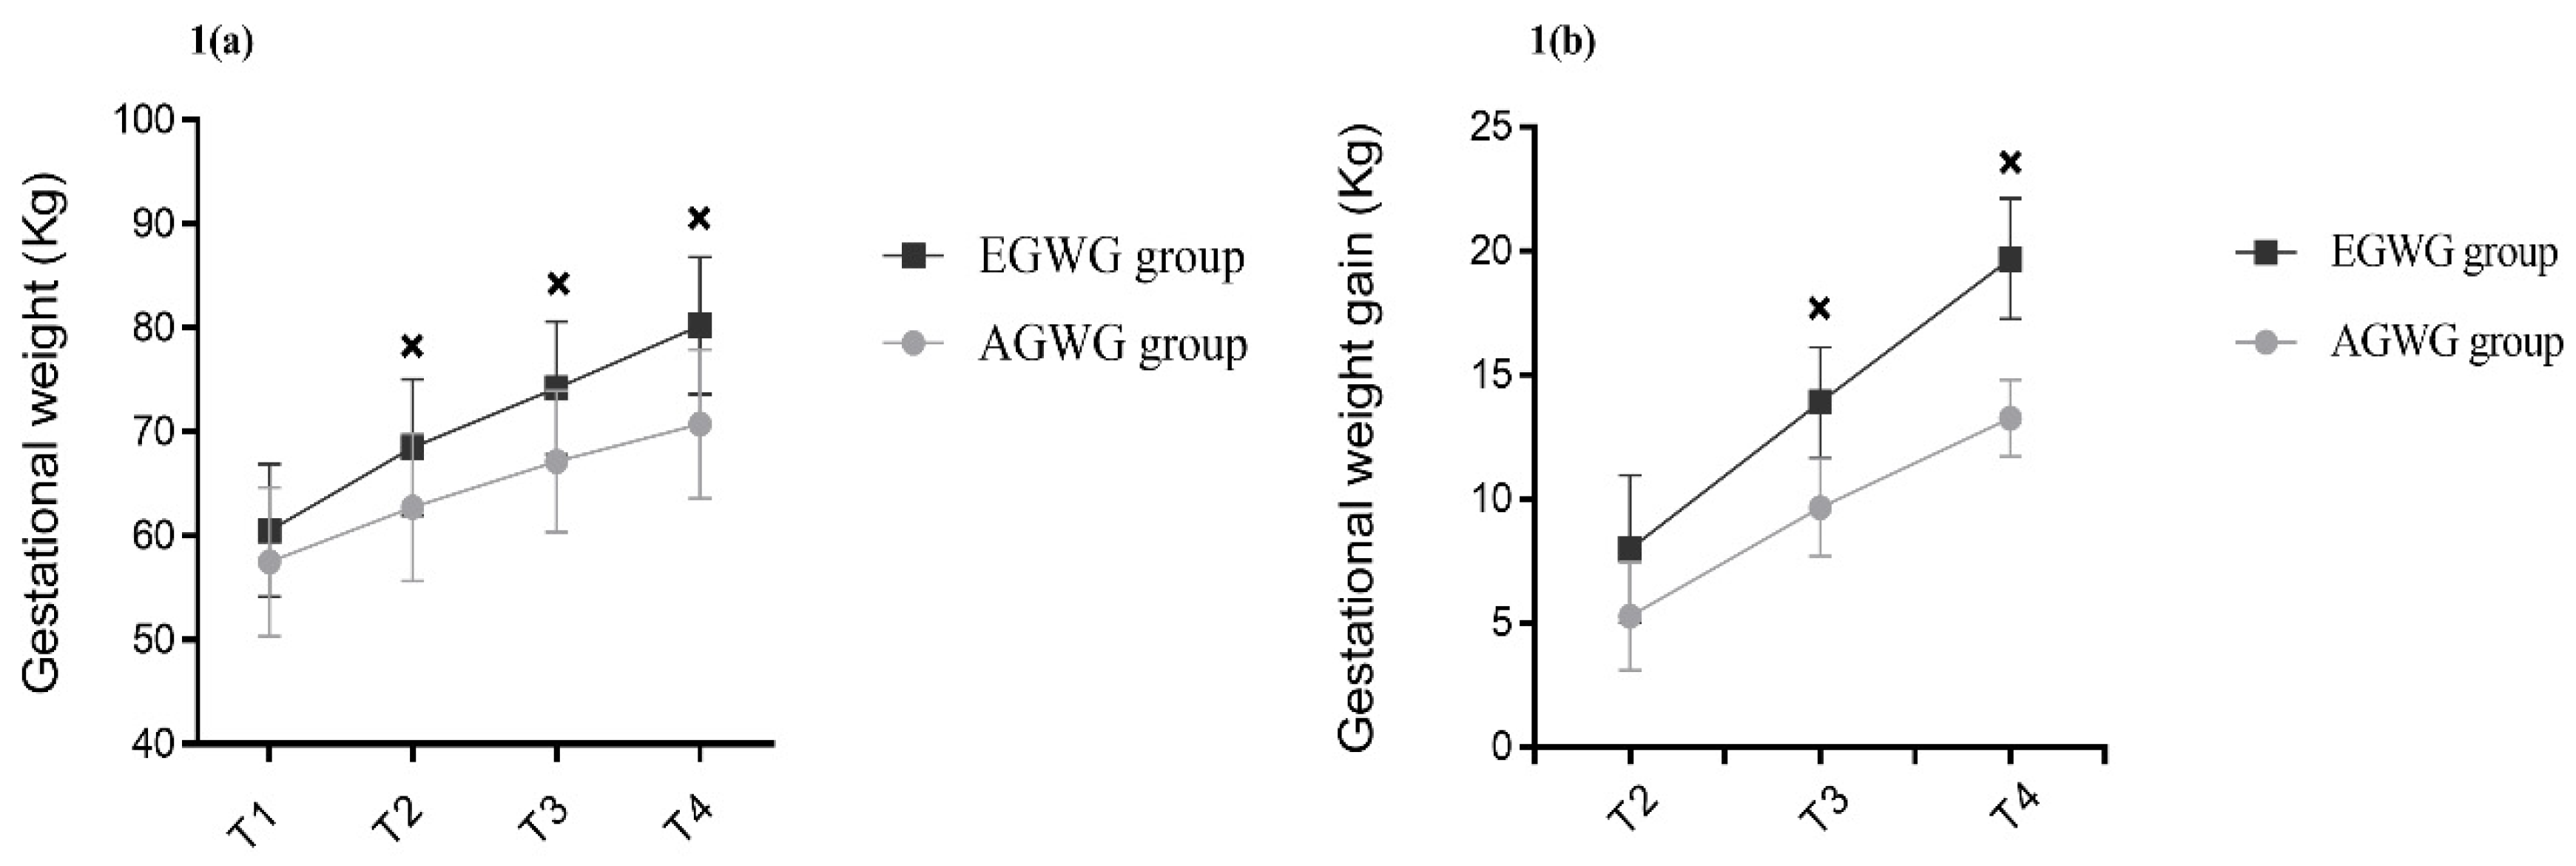
Figure 2.
Hierarchical clustering of 16 samples based on methylation levels at 46 differentially methylated CpG sites.
Figure 2.
Hierarchical clustering of 16 samples based on methylation levels at 46 differentially methylated CpG sites.
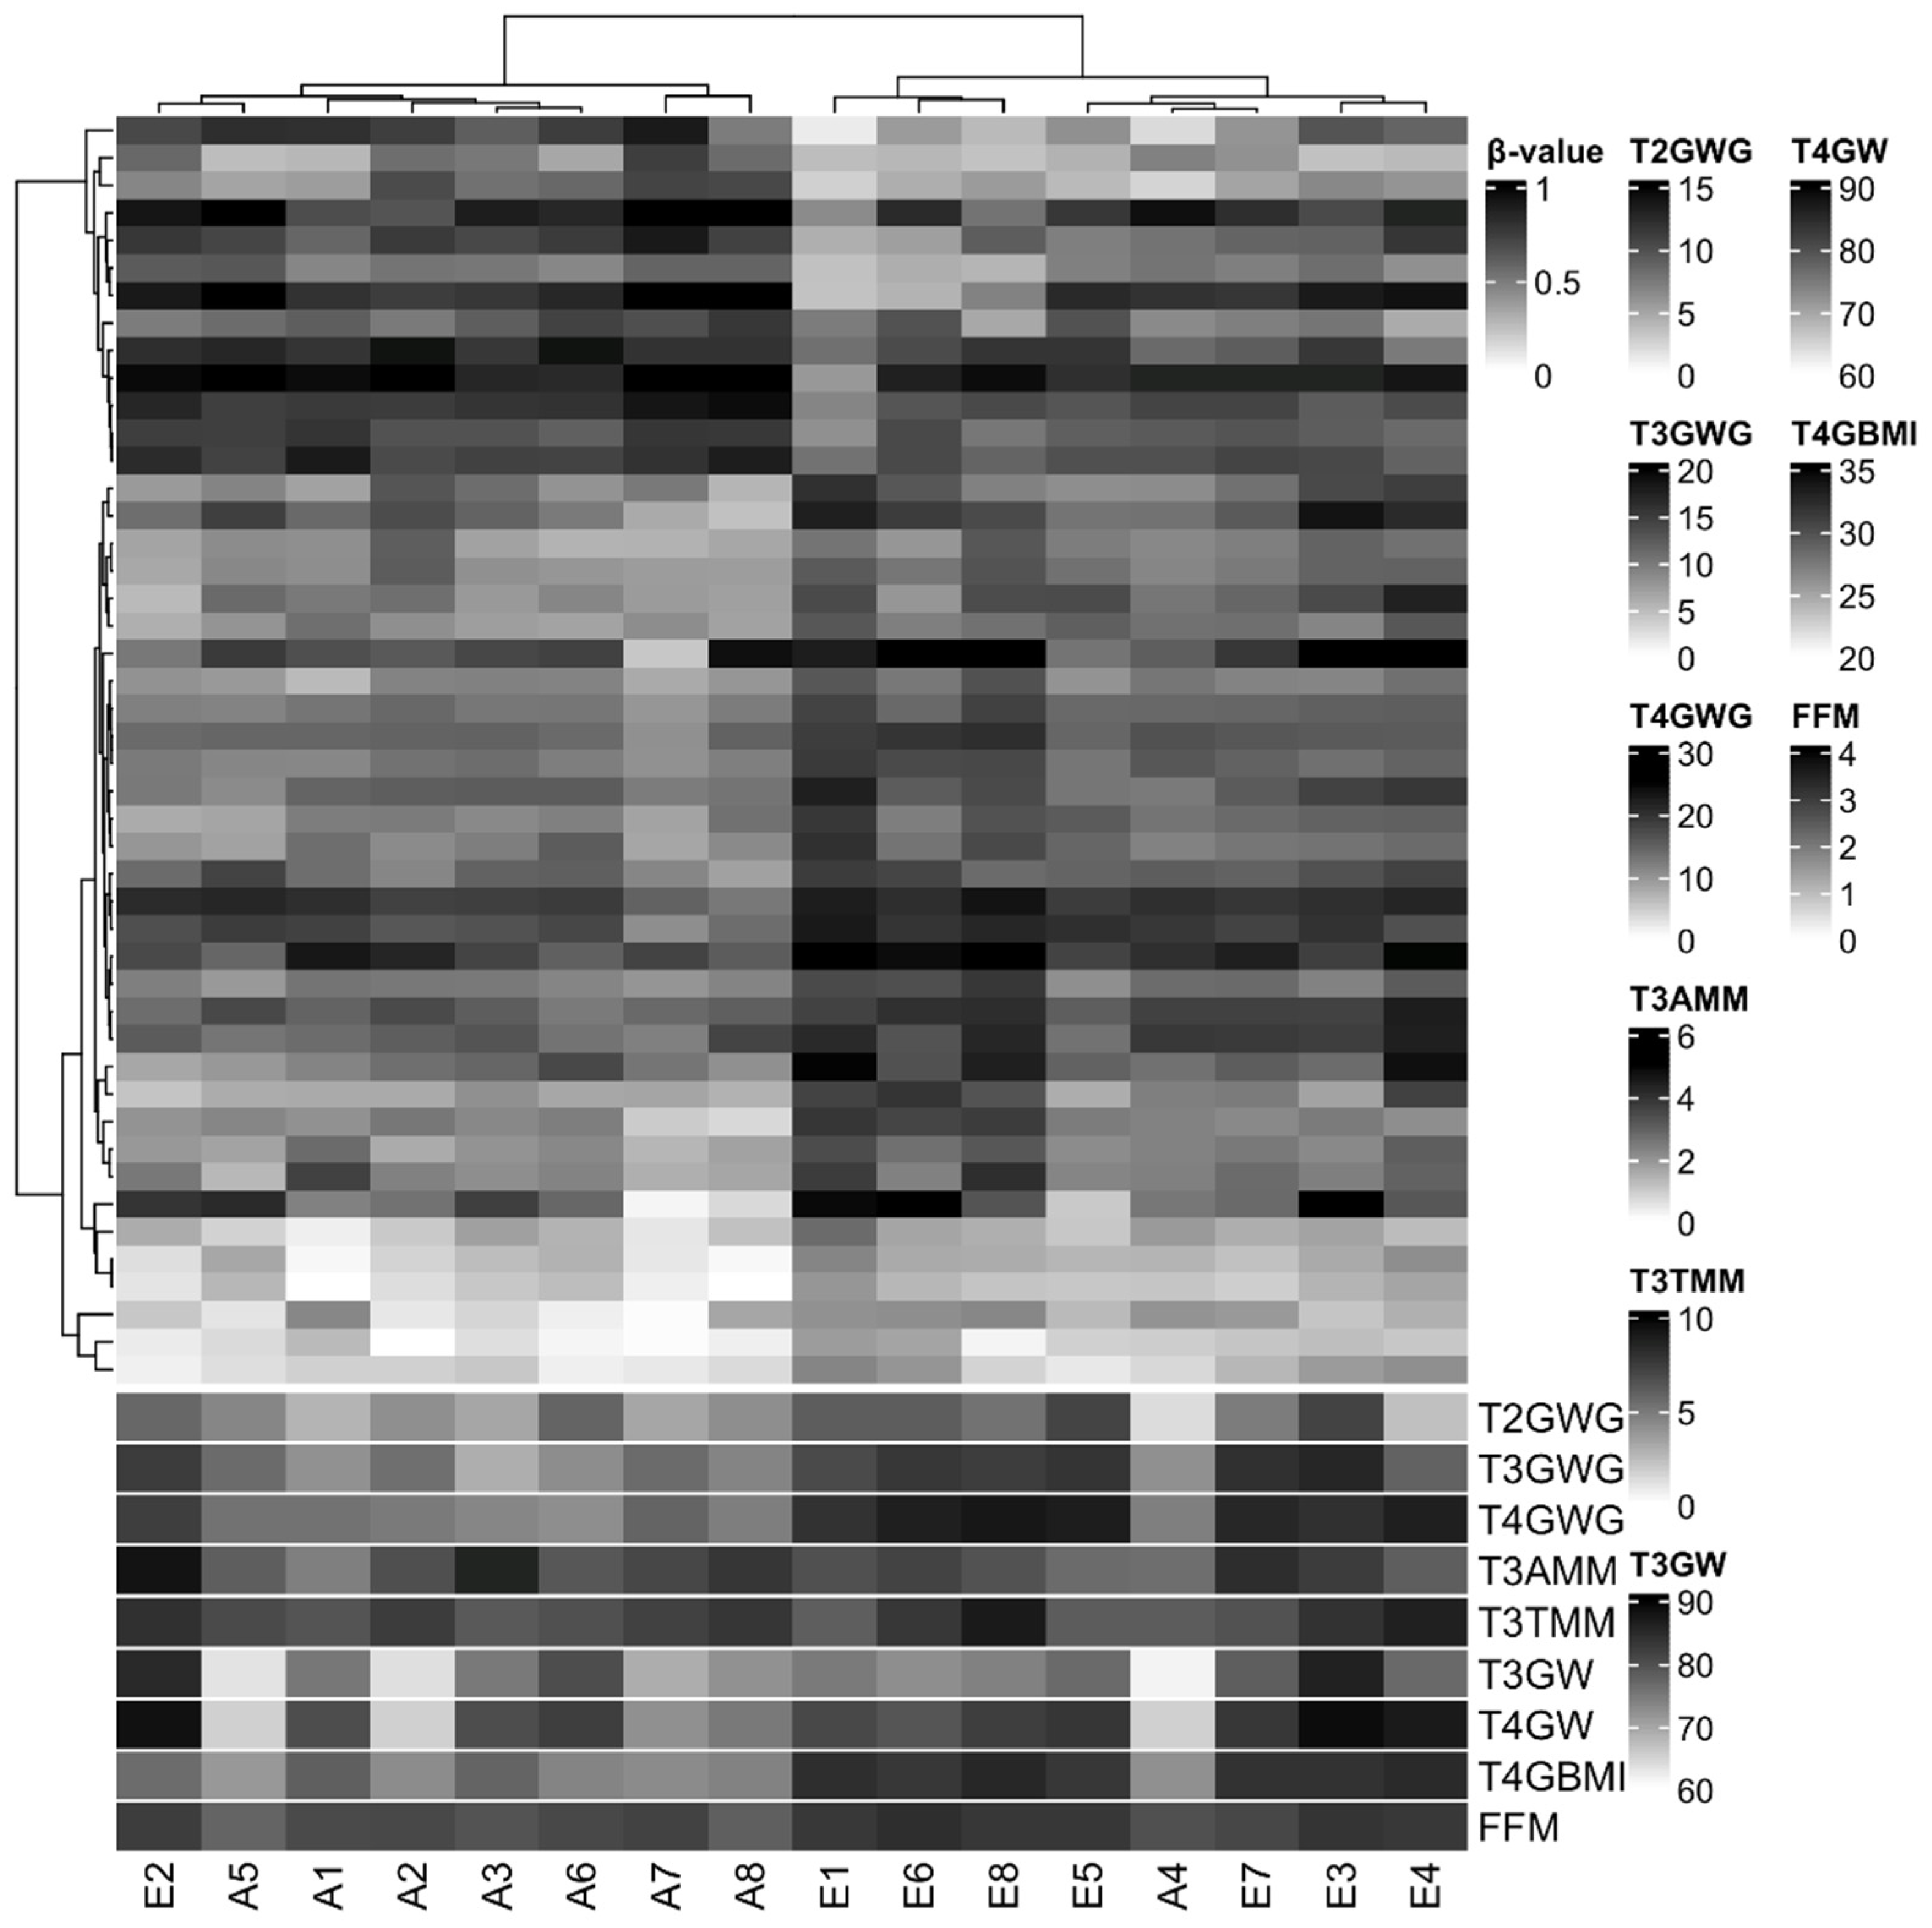

Table 1.
Characteristics of the pregnant women with adequate/excessive gestational weight gain and their neonates.
Table 1.
Characteristics of the pregnant women with adequate/excessive gestational weight gain and their neonates.
| Variables | Excessive gestational weight gain (n=30) | Adequate gestational weight gain (n=45) | P |
| Pregnant women | |||
| Age (years) | 25.9±6.0 | 29.0±6.4 | 0.064 |
| Ethnicity | |||
| White | 10 (33.3%) | 15 (33.3%) | 0.351 |
| Black | 03 (10.0%) | 10 (22.2%) | |
| Brown | 17 (56.7%) | 20 (44.4%) | |
| Marital status | |||
| Single/without partner | 00 (0.0%) | 04 (8.8%) | 0.245 |
| Married/with partner | 30 (100.0%) | 41 (91.1%) | |
| Education | |||
| Elementary school | 01 (3.3%) | 09 (20.0%) | 0.115 |
| High school degree | 24 (80.0%) | 30 (66.7%) | |
| University degree | 05 (16.7%) | 06 (13.3%) | |
| Parity | |||
| 0 | 05 (16.7%) | 07 (15.6%) | 0.991 |
| 1 | 19 (63.3%) | 29 (64.4%) | |
| 2 a 4 | 06 (20.0%) | 09 (20.0%) | |
| Neonates | |||
| Age (weeks) | 39.9±1.1 | 39.2±1.4 | 0.162 |
| Sex | |||
| Female | 17 (56.6%) | 16 (35.6%) | 0.071 |
| Male | 13 (43,3%) | 29 (64.4%) | |
Mean±SD or number of individuals (percentage). T test for independent samples or Chi-square test.
Table 2.
Anthropometry and body composition of pregnant women and of their fetuses and neonates.
| Variables | Excessive gestational weight gain (n=30) | Adequate gestational weight gain (n=45) | p | ||
| Pregnant women | |||||
| Anthropometry | |||||
| T1 Pre-pregnancy weight (kg) | 60.54 | 6.37 | 57.52 | 7.17 | 0.682 |
| T1 Height (cm) | 163.71 | 6.56 | 161.39 | 6.93 | 0.785 |
| T1 Pre-pregnancy BMI (kg/m2) | 22.68 | 1.74 | 22.06 | 1.79 | 0.405 |
| T4 BMI (kg/m2) | 29.90 | 2.01 | 27.15 | 1.84 | 0.010 |
| T4 Total gestational weight gain (kg) | 19.60 | 2.43 | 13.26 | 1.54 | 0.010 |
| Pre-pregnancy body composition | |||||
| Pre-pregnancy fat mass (%) | 29.32 | 4.03 | 26.80 | 4.85 | 0.262 |
| Pre-pregnancy fat mass (kg) | 18.75 | 4.19 | 15.82 | 4.40 | 0.167 |
| Pre-pregnancy fat-free body mass (Kg) | 44.17 | 4.60 | 42.26 | 3.85 | 0.188 |
| Pre-pregnancy muscle mass (kg) | 41.94 | 4.35 | 40.04 | 3.58 | 0.135 |
| Fetuses | |||||
| T2 Fetal weight (g) | 629.30 | 204.02 | 598.87 | 186.40 | 0.875 |
| T3 Fetal weight (g) | 2172.82 | 353.43 | 2132.18 | 457.47 | 0.514 |
| T2 SCFT (mm) | 2.84 | 0.52 | 2.95 | 0.56 | 0.721 |
| T3 SCFT (mm) | 4.13 | 0.76 | 4.07 | 1.07 | 0.521 |
| T2 Total thigh tissue (cm3) | 5.23 | 1,78 | 5.12 | 1.53 | 0.945 |
| T3 Total thigh tissue (cm3) | 13.37 | 2.97 | 13.53 | 3.25 | 0.955 |
| T2 Thigh muscle mass (cm3) | 2.97 | 1.04 | 2.90 | 0.93 | 0.729 |
| T3 Thigh muscle mass (cm3) | 7.69 | 1.72 | 7.54 | 1.80 | 0.643 |
| T2 Subcutaneous thigh fat (cm3) | 2.26 | 0.84 | 2.27 | 0.76 | 0.991 |
| T3 Subcutaneous thigh fat (cm3) | 5.68 | 1.64 | 6.03 | 1.61 | 0.225 |
| T2 Total arm tissue (cm3) | 3.05 | 0.93 | 2.85 | 0.83 | 0.358 |
| T3 Total arm tissue (cm3) | 7.01 | 1.55 | 7.07 | 1.87 | 0.860 |
| T2 Arm muscle mass (cm3) | 1.57 | 0.50 | 1.46 | 0.46 | 0.224 |
| T3 Arm muscle mass (cm3) | 3.45 | 0.82 | 3.52 | 0.98 | 0.683 |
| T2 Subcutaneous arm fat (cm3) | 1.46 | 0.52 | 1.46 | 0.63 | 0.991 |
| T3 Subcutaneous arm fat (cm3) | 3.55 | 0.93 | 3.56 | 1.02 | 0.928 |
| Neonates | |||||
| T5 Weight (g) | 3354.87 | 298.47 | 3068.50 | 386.57 | 0.027 |
| T5 Length (cm) | 50.03 | 1.78 | 48.80 | 2.33 | 0.182 |
| T5 Fat-free mass percentage (%) | 90.39 | 3.98 | 91.57 | 5.65 | 0.120 |
| T5 Fat mass percentage (%) | 9.61 | 3.98 | 8.43 | 5.65 | 0.120 |
| T5 Fat-free mass (kg) | 3.08 | 0.19 | 2.76 | 0.27 | 0.218 |
| T5 Fat mass (kg) | 0.34 | 0.13 | 0.26 | 0.21 | 0.039 |
Mean±SD. T test for independent samples. BMI: Body Mass Index. SCFT: subcutaneous abdominal fat thickness. T1= ≤ 15 gestational weeks. T2=20-26 weeks. T3=30-36 weeks. T4=delivery and T5=72 hours after delivery.
Table 3.
Human phenotype of pregnant women with adequate/excessive gestational weight gain.
| Terms name | Binom Raw P-Value | Binom Fold Enrichment |
| Transient neonatal diabetes mellitus | 0.0010 | 1041.1 |
| Neonatal insulin-dependent diabetes mellitus | 0.0015 | 656.2 |
| Severe failure to thrive | 0.0037 | 269.7 |
| Insulin-resistant diabetes mellitus | 0.0185 | 53.7 |
| Insulin resistance | 0.0236 | 42.0 |
| Breast carcinoma | 0.0255 | 38.7 |
| Neoplasm of the breast | 0.0272 | 36.4 |
| Hyperglycemia | 0.0275 | 35.9 |
| Dehydration | 0.0379 | 25.9 |
These human phenotypes were identified by enrichment analysis with GREAT.
Table 4.
Multiple linear regression models associations between maternal DNAm and fetal and neonatal body composition.
Table 4.
Multiple linear regression models associations between maternal DNAm and fetal and neonatal body composition.
| T2 Total thigh tissue | Β | r² | p | 95% CI |
| DMR 2 | 9.172 | 0.853 | 0.014 | 2.340; 16.005 |
| Gestational weight gain | -0.010 | 0.843 | -0.127; 0.106 | |
| Pre-pregnancy BMI | -0.780 | 0.005 | -1.249; -0.310 | |
| Maternal age | -0.048 | 0.400 | -0.172; 0.076 | |
| Sex | 1.026 | 0.092 | -0.205; 2.257 | |
| Gestational age | 0.833 | 0.002 | 0.411; 1.255 | |
| DMR 6 | 21.516 | 0.039 | 1.407; 41.625 | |
| Gestational weight gain | -0.072 | 0.322 | -0.228; 0.084 | |
| Pre-pregnancy BMI | -0.786 | 0.820 | 0.008 | -1.316; -0.256 |
| Maternal age | -0.044 | 0.489 | -0.181; 0.093 | |
| Sex | 1.313 | 0.070 | -0.131; 2.757 | |
| Gestational age | 0.939 | 0.002 | 0.443; 1.434 | |
| T3 Total thigh tissue | Β | r² | p | 95% CI |
| DMR 2 | 8.265 | 0.715 | 0.018 | 1.790; 14.740 |
| Gestational weight gain | 0.045 | 0.371 | -0.064; 0.154 | |
| Pre-pregnancy BMI | -0.393 | 0.080 | -0.844; 0.058 | |
| Maternal age | 0.036 | 0.487 | -0.077; 0.150 | |
| Sex | 0.679 | 0.127 | -0.235; 1.593 | |
| Gestational age | 0.472 | 0.155 | -0215; 1.160 | |
| T2 Thigh muscle mass | Β | r² | p | 95% CI |
| DMR 2 | 5.314 | 0.814 | 0.021 | 1.006; 9.622 |
| Gestational weight gain | -0.026 | 0.440 | -0.100; 0.047 | |
| Pre-pregnancy BMI | -0.416 | 0.011 | -0.712; -0.120 | |
| Maternal age | -0.012 | 0.739 | -0.090; 0.066 | |
| Sex | 0.773 | 0.051 | -0.003; 1.549 | |
| Gestational age | 0.431 | 0.005 | 0.165; 0.697 | |
| T3 Thigh muscle mass | Β | r² | p | 95% CI |
| DMR 2 | 6.373 | 0.687 | 0.032 | 0.694; 12.052 |
| Gestational weight gain | 0.067 | 0.147 | -0,029; 0.162 | |
| Pre-pregnancy BMI | -0.177 | 0.339 | -0,572; 0.219 | |
| Maternal age | 0.036 | 0.429 | -0,063; 0.136 | |
| Sex | 0.442 | 0.244 | -0.360; 1.243 | |
| Gestational age | 0.358 | 0.213 | -0.246; 0.961 | |
| T2 Subcutaneous thigh fat | Β | r² | p | 95% CI |
| DMR 2 | 3.858 | 0.846 | 0.029 | 0.506; 7.211 |
| Gestational weight gain | 0.016 | 0.549 | -0.041; 0.073 | |
| Pre-pregnancy BMI | -0.364 | 0.006 | -0.594; -0.133 | |
| Maternal age | -0.037 | 0.207 | -0.097; 0.024 | |
| Sex | 0.254 | 0.367 | -0.350; 0.858 | |
| Gestational age | 0.402 | 0.002 | 0.195; 0.609 | |
| DMR 6 | 10.933 | 0.017 | 2.494; 19.372 | |
| Gestational weight gain | -0.019 | 0.532 | -0.084; 0.047 | |
| Pre-pregnancy BMI | -0.385 | 0.862 | 0.004 | -0.607; -1.162 |
| Maternal age | -0.035 | 0.202 | -0.093; 0.023 | |
| Sex | 0.424 | 0.148 | -0.182; 1.030 | |
| Gestational age | 0.463 | 0.001 | 0.255; 0.671 | |
| T3 Subcutaneous thigh fat | Β | r² | p | 95% CI |
| DMR 10 | 7.604 | 0.596 | 0.033 | 0.763; 14.445 |
| Gestational weight gain | -0.034 | 0.267 | -0.100; 0.031 | |
| Pre-pregnancy BMI | -0.247 | 0.064 | -0.511; 0.018 | |
| Maternal age | 0.015 | 0.619 | -0.052; 0.083 | |
| Sex | 0.257 | 0.311 | -0.284; 0.797 | |
| Gestational age | -0.004 | 0.982 | -0.401; 0.393 | |
| T3 Total arm tissue | Β | r² | p | 95% CI |
| DMR 6 | -25.640 | 0.804 | 0.002 | -39.368; -11.911 |
| Gestational weight gain | 0.115 | 0.039 | 0.007; 0.222 | |
| Pre-pregnancy BMI | 0.410 | 0.043 | 0.016; 0.805 | |
| Maternal age | 0.038 | 0.400 | -0.059; 0.134 | |
| Sex | -0.269 | 0.460 | -1.059; 0.521 | |
| Gestational age | 0.311 | 0.257 | -0.271; 0.893 | |
| T3 Subcutaneous arm fat | Β | r² | p | 95% CI |
| DMR 6 | -17.433 | 0.667 | 0.010 | -29.597; -5.270 |
| Gestational weight gain | 0.078 | 0.097 | -0.017; 0.172 | |
| Pre-pregnancy BMI | 0.233 | 0.165 | -0.116; 0.583 | |
| Maternal age | 0.014 | 0.716 | -0.071; 0.099 | |
| Sex | -0.339 | 0.302 | -1.039; 0.361 | |
| Gestational age | 0.175 | 0.461 | -0,340; 0.691 | |
| T5 Fat mass percentage | Β | r² | p | 95% CI |
| DMR 2 | -20.299 | 0.761 | 0.039 | -39.362; -1.236 |
| Gestational weight gain | 0.500 | 0.013 | 0.135; 0.865 | |
| Pre-pregnancy BMI | 0.651 | 0.275 | -0.615; 1.916 | |
| Maternal age | 0.071 | 0.530 | -0.175; 0.318 | |
| Sex | -5.207 | 0.002 | -7.968; -2.446 | |
| Gestational age | -0.653 | 0.196 | -1.710; 0.403 | |
| T5 Fat mass | Β | r² | p | 95% CI |
| DMR 2 | -0.719 | 0.780 | 0.040 | -0.395; -0.042 |
| Gestational weight gain | 0.019 | 0.009 | 0.006; 0.032 | |
| Pre-pregnancy BMI | 0.026 | 0.216 | -0.018; 0.071 | |
| Maternal age | 0.003 | 0.391 | -0.005; 0.012 | |
| Sex | -0.180 | 0.002 | -0.279; 0.082 | |
| Gestational age | -0.016 | 0.374 | -0.053; 0.022 |
Multiple linear regression models. BMI: Body Mass Index.T1= ≤ 15 gestational weeks. T2=20-26 weeks. T3=30-36 weeks. T4=delivery and T5=72 hours after delivery.
Disclaimer/Publisher’s Note: The statements, opinions and data contained in all publications are solely those of the individual author(s) and contributor(s) and not of MDPI and/or the editor(s). MDPI and/or the editor(s) disclaim responsibility for any injury to people or property resulting from any ideas, methods, instructions or products referred to in the content. |
© 2023 by the authors. Licensee MDPI, Basel, Switzerland. This article is an open access article distributed under the terms and conditions of the Creative Commons Attribution (CC BY) license (http://creativecommons.org/licenses/by/4.0/).
Copyright: This open access article is published under a Creative Commons CC BY 4.0 license, which permit the free download, distribution, and reuse, provided that the author and preprint are cited in any reuse.


