Submitted:
28 June 2023
Posted:
28 June 2023
You are already at the latest version
Abstract
The deployment of a manufacturing execution system (MES) holds promising potential in facilitating the accumulation of a substantial amount of inspection data. Low quality levels in discrete manufacturing environments are the result of multi-factor coupling and failure to find quality issues in a timely manner within manufacturing settings may trigger the propagation of defects downstream. Currently, most of the inspection quality methods are direct measurement followed by manual judgment. The integration of deep learning methods provides a feasible way to identify defects in a timely manner, thus improving the acceptance rate of factories. This paper focuses on the design of a data-driven quality prediction and control model around discrete manufacturing characteristics, and use fuzzy theory to evaluate the quality level of production stages. Building Multivariate Long and short-term memory learning hidden quality representations to extract predictions from multi-level inspection data in manufacturing systems. Finally, by validating the data of actual produced water dispensers according to three evaluation indexes, RMSE, MAE, MAPE, the results show that Multivariate Long and short-term memory has better prediction performance.
Keywords:
manufacturing execution system
; quality prediction
; discrete manufacturing
; Multivariate Long and short-term memory
1. Introduction
As the modern manufacturing industry is evolving to become increasingly discrete and intricate, a crucial characteristic is the mastery of core technology in-house while outsourcing the production of other components to downstream factories. As a result, quality control assumes a paramount importance in the production process. At the same time the development of big data, cloud computing, Internet of things gradually around the layout of the industry, sensors and intelligent data acquisition are helping to improve the life cycle of any asset, starting from design, manufacturing, distribution, maintenance, until recycling [1]. The dynamic and complex nature of the production floor, characterized by intermittent, fluctuating, stochastic, and non-linear behaviors, poses a significant challenge in leveraging data for effective utilization. Consequently, the development of a robust quality prediction model represents a formidable undertaking.
The prediction of quality models is a significant concern within the realm of industrial intelligence and represents a typical task for analytical processes within the industry[2], The task of prediction is bifurcated into the capacity to effectuate suitable modifications based on the outcomes, thereby enhancing the product's qualification rate. At present, discrete manufacturing facilities predominantly rely on Manufacturing Execution Systems (MES) to manage and analyze their manufacturing data, which has exhibited a remarkable surge in usage. Meanwhile, manufacturing plants typically employ arbitrary inspection methods to identify defects in the parts received from their downstream suppliers. However, issues pertaining to the quality of supplier parts can significantly impede production, resulting in a divergence in both the supply chain and quality-related factors[3]. Predictive manufacturing systems are emerging as a new paradigm for solving quality problems caused by quality divergences in the production process that propagate downstream in the production chain and cannot be detected.
From a technological perspective, research related to efficient processing of multivariate heterogeneous data in the past decade has been plagued by problems such as missing data, duplication, nonlinearity of noisy data structures, and concatenation of various stages. Improve product quality and ensure production stability, many key quality indicators often play an important role in quality control and forecasting [4-6]. A large number of research works have been published to efficiently handle industrial multivariate heterogeneous data and etraction of quality-related elements including the data-driven and deep learning methods[7-11]. For example, A method based on rough set data theory using particle swarm algorithm and least squares support vector machine [12] to model manufacturing data of 5M1E in discrete manufacturing helps manufacturing companies to accomplish quality prediction and quality control. A data-driven real-time learning model is used to deal with nonlinear processes in the face of uncertainty perturbations in industrial environments, which in turn improves fault detection accuracy [13]. As well as proposing a framework for a data-driven approach [14] to bottleneck discovery in manufacturing execution systems to reduce the quality fluctuations brought about by uncertainty allowing perturbations. Help improve the digitalization of the discrete shop by combining a manufacturing execution system and a computerized maintenance system [15] for prediction and decision support of core equipment maintenance in the production process. In [16], the manufacturing critical feature points are classified according to the assembly requirements by means of an comprehensive coordination model, and the distribution method for minimizing integrated errors in the manufacturing process is established and applied in the aircraft assembly process. However these do not take into account the complexity of discrete manufacturing mainly around univariate prediction and control, the large amount of data in the MES system needs to extract data associated with quality characteristics for analysis, and in the past no link between quality and raw data was established.
The main components of the manufacturing execution system are [17]: he Manufacturing Execution System (MES) is comprised of several key modules, including the CONFIG basic parameter setting module, the PM production management module, the PMO production site monitoring module, the QC quality control module, and the REPAIR repair station module. The QC module, which follows ISO09001 product line specifications, uploads test results to the database[18]. Qualified products proceed to the next station for production, while unqualified products are sent for rework. In recent years, there have been many new advancements in the field of deep learning that have been integrated into manufacturing systems, making it a highly promising area for extending predictive capabilities and optimizing quality control and process efficiency in QC modules. In [19] prevented the propagation of undetected defects down the production line and used the XBoost method is combined in the manufacturing system to improve the recall rate of automotive defective products. In [20] based on deep learning in an intelligent monitoring system selects the most relevant features with quality to predict the product pass rate to improve the factory quality.
Also the application of neural networks provides novel solutions for nonlinear prediction in manufacturing systems, in [21] for deep learning for quality management for quality extraction of aluminum castings based on a feature pyramid network approach to improve accuracy. The smart manufacturing device data is analyzed in [22] and the accuracy of device identification is improved by finding the correlation between the data through LSTM in the cloud server. Learning relevant hidden variables in [23] using supervised LSTM networks to predict quality dynamic properties. A 2DConvLSTMAE method for metal can manufacturing speed in [24] uses a 2DConvLSTMAE method for simultaneous prediction of multiple machines to reduce training time and improve prediction performance. The scheduling model for the workshop cycle scheduling problem is established using LRNNN, which reduces the complexity of the problem and is more convenient for use in actual production[25]. The contemporary challenge for discrete manufacturing quality prediction is the real-time monitoring of product quality for enterprises. To address this challenge, the use of high-performance, dynamic, and synchronous recurrent neural networks has been proposed. This proposal stems from the findings of an empirical survey conducted on the actual generation process of multi-dimensional inspection data extraction quality features within manufacturing systems.
Based on the above analysis, and considering the complexity of quality prediction in the product production process, this paper proposes a fuzzy quality evaluation for data representation of quality issues at each stage of product production, followed by quality prediction in a multivariate long and short term memory model. The proposed model is validated in the drinking water line and trained by each testing index power, flow rate, heating rate, leakage current and evaluation results as historical data to predict the product quality level of the next batch of products at that node in the short term of the assembly line. Section II of the article presents the theoretical background implementation principles of the gateway deployment and approach. Section III shows the experimental results and presents insights. Section IV concludes the performance of the presented method on the data set and suggests possible improvement measures for the model.
2. MATERIALS AND METHODS
2.1. Data Acquisition
Data collection in ci xi city prays for the qi xi intelligent technology limited company's water dispenser production line data, through the production of each stage of the deployment of interface transmission detection data to achieve data collection, the collection of data stored in the server, you can view the product id real-time data in the mobile terminal.
Which each part sampling data by the quality inspector will be the same manufacturer batch of products in accordance with a certain proportion of the function of the conformity check usually sampling sample data as the batch of parts quality data, in order to prevent the occurrence of quality differences can increase the number of sampling to increase the reliability of detection. Semi-finished product testing according to a certain degree of product assembly after a testing step water dispenser product testing can be divided into electrical testing and water testing, its electrical testing by a series of measurement tools such as oscilloscopes specific data testing, water testing by the flow sensor, temperature sensor and the relationship between the specific value of time detection. Finished product testing in the cold and heat shock test, fatigue test, smoke test for the quality inspector according to the actual situation of the evaluation of the test.
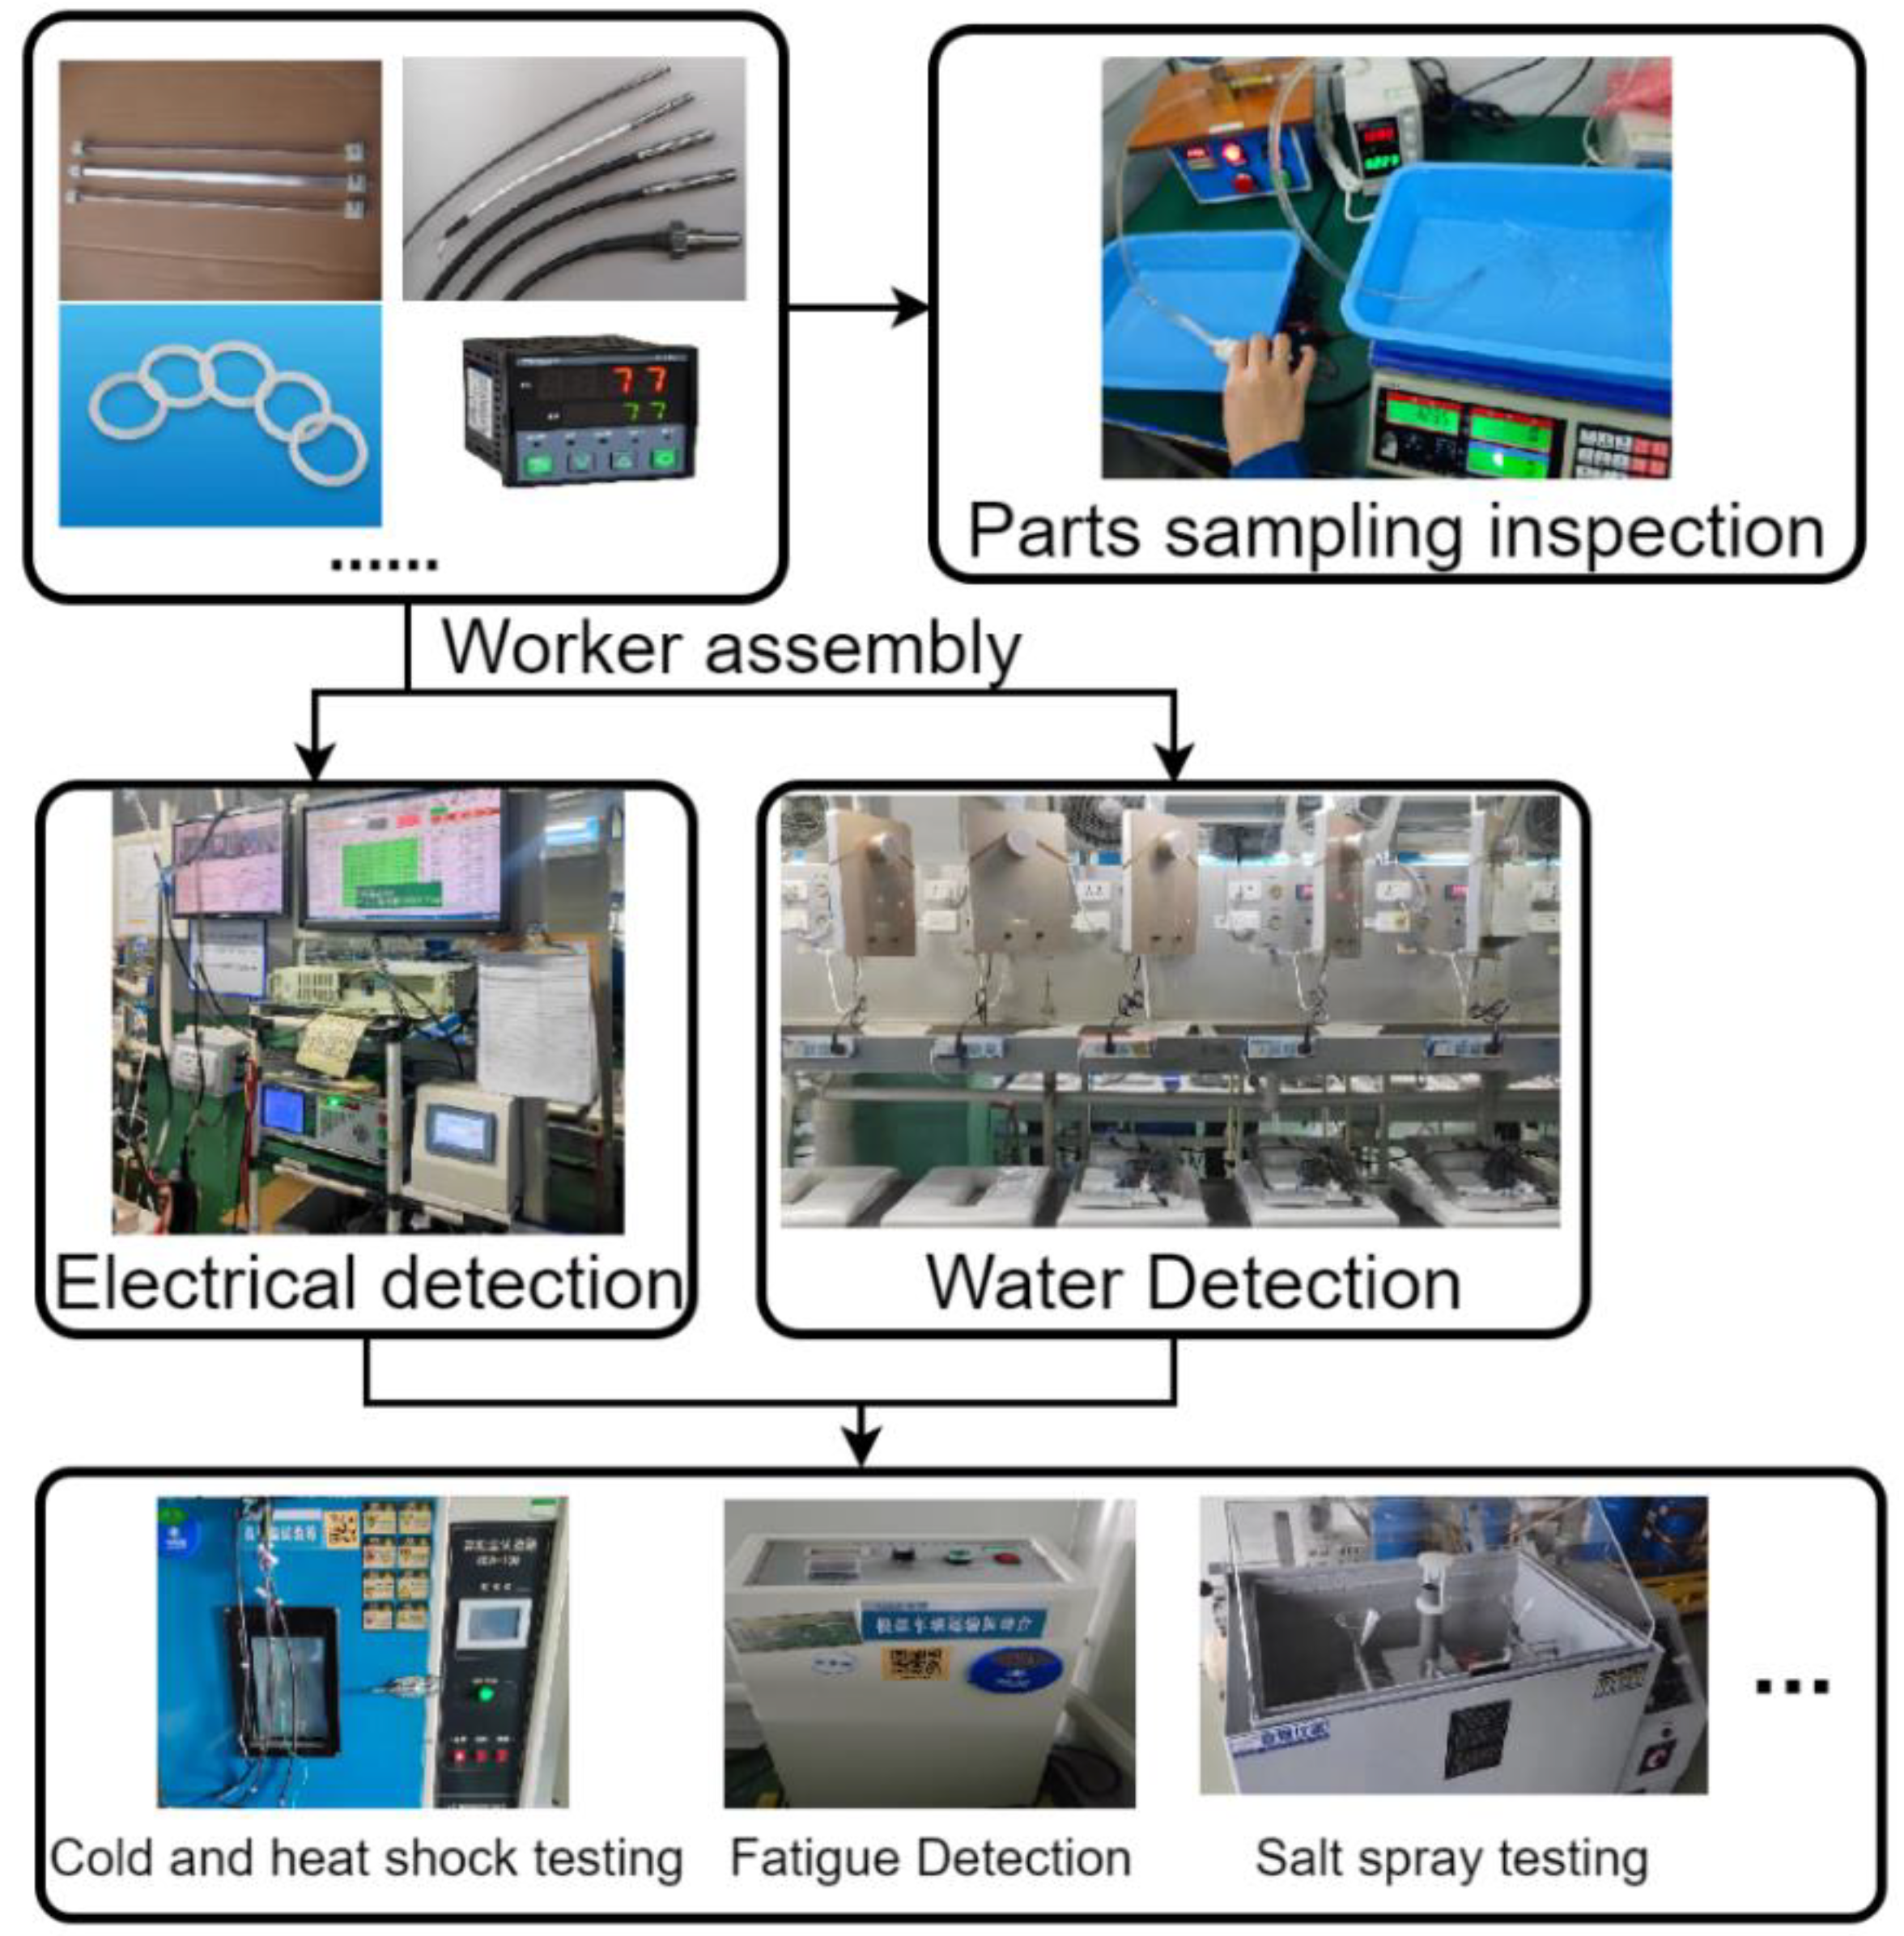

Figure 1.
Multi-stage detection data collection for water dispenser production line.
By traversing the gateway data of the drinking fountains produced by QIXI and extracting the semi-finished product stage data from the supply chain and manufacturing execution system of the production line, the quality level was evaluated with 500 drinking fountains produced continuously on the same production line to discover the quality divergence points. The LSTM model can generally only reflect the variable time-series dynamic characteristics and cannot extract the quality features we extract the quality features at this stage according to fuzzy theory, of the export of real-time data starting file is mainly stored in json format we need to traverse each variable to facilitate later input model. After traversing the data we tested the water dispenser semi-finished product including power, PCA Current test, PCA Voltage test, flow output, and leakage current. Missing defaults take the interpolation method for completing. There are many reasons for missing data, which may be caused by human or sensor failure, and the specific methods can be found in [26].
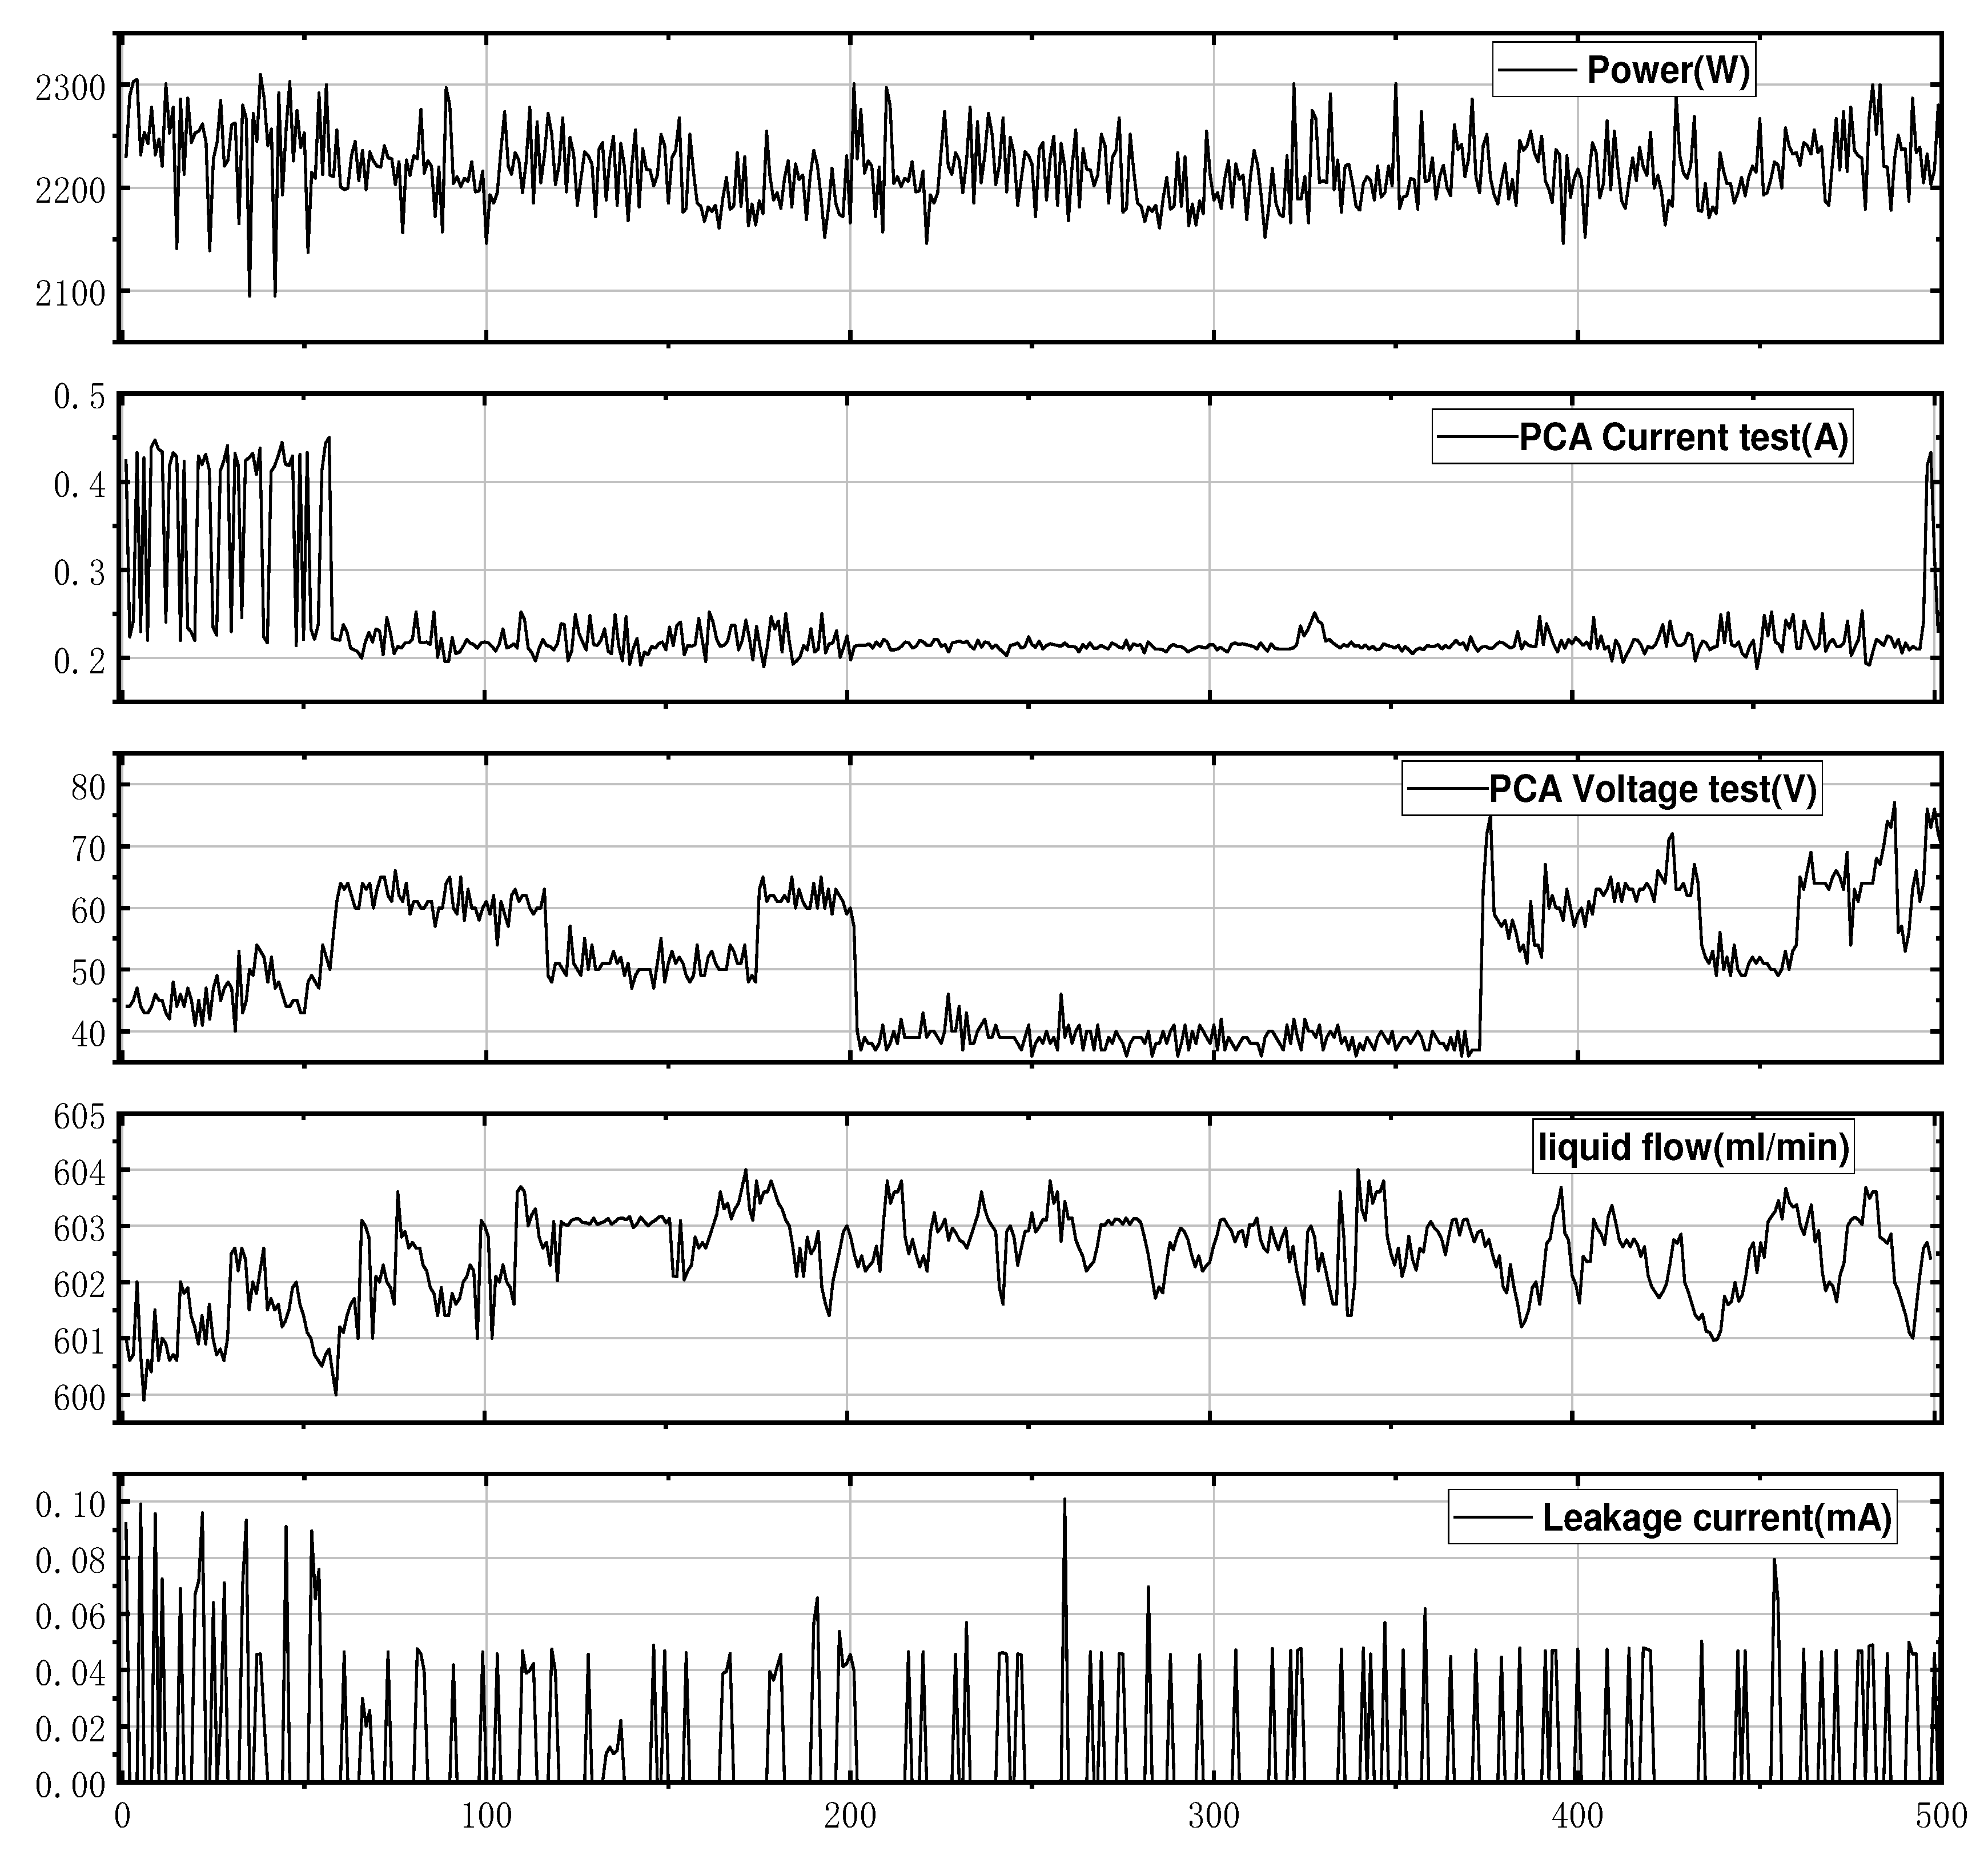
Figure 4.
Semi-finished product manufacturing data traversal.
2.2. LSTM prediction model
Traditional neural networks are fully connected from the input layer to the hidden layers and then to the output layer, but lack intra-layer connections between neurons. This can result in large deviations when processing sequential data [27]. In contrast, recurrent neural networks (RNNs) have the ability to retain and apply information from previous computations to current output calculations through the presence of connections between neurons within the hidden layers. The input to the hidden layer is comprised of both the output from the input layer and the output from the hidden layer at the previous time step. A common training method for RNNs when processing sequential data is the back-propagation through time (BPTT) algorithm, which operates by locating optimal points along the negative gradient direction of parameter optimization until convergence is achieved. However, during optimization, it is necessary to trace back information for all previous time steps in order to compute the partial derivative of parameters at a given moment. The overall partial derivative function is then calculated as the sum of all time steps. The inclusion of activation functions can result in multiplicative interactions between their derivatives, leading to issues such as “gradient vanishing” or “gradient explosion” [28].
LSTM is a recurrent neural network RNN improvement, is a recurrent neural network used to extract the temporal information and temporal characteristics of the processing, compared to RNN designed memory cells to introduce the forgetting gate method for information can be selective memory filter out the noise information, reducing the memory burden.
In Figure 2 the input gate learns the quality-related sequence, in the forgetting gate the information is learned and saved in the memory cell, and the output gate outputs the result by controlling the current time step. Assuming that the equation passed at time step t moments:
The same as RNN, LSTM uses back propagation method to update the model, but LSTM can fit faster than RNN but the number of parameters is large so it needs a lot of data as support.
Like the RNN, the LSTM network has a process of data back-propagation, where the error t value propagates along the time series and spreads between layers. After obtaining the updated gradient of the horizontal and vertical weights and bias terms through the structure of the hidden layers, the updated value of each weight and bias term can be obtained. The calculation method is the same as the RNN network, and the value of the learning rate α should be set to control the error updated gradient and the speed of error decline. In the above training model, we introduced three evaluation metrics [39] to evaluate the prediction effect, which are defined as follows:
The root mean square error, also known as the standard error, is the square root of the mean square error. The rationale for introducing the root mean square error is identical to that for introducing the standard deviation. That is, the magnitude of the root mean square error differs from that of the data and does not visually reflect the degree of dispersion. Therefore, the square root is taken on the root mean square error to obtain the root mean square error:
The mean absolute error (MAE) is a commonly used regression loss function that represents the average magnitude of the error in predicted values, irrespective of the direction of the error. It is calculated as the sum of the absolute values of the differences between the target and predicted values and is expressed by the following equation 7:
The Mean Absolute Percentage Error (MAPE) is distinct from the RMSE in its relatively low sensitivity to discrete points. It serves as a robust statistical indicator of prediction accuracy, as demonstrated in Equation 8:
The improved MV-LSTM prediction model is proposed for the production characteristics of discrete manufacturing, which expands the input layers to multiple dimensions compared to the traditional LSTM. By learning historical data to map manufacturing parameters and quality characteristics, the number of neuron cells, LSTM layer, and Dense layer are adjusted to improve the accuracy of prediction to find quality divergence points.
2.3. Data preprocessing.
2.3.1. Data pre-processing
The filtered 500 product data were divided into two parts, 80% as training set and 20% as test set. To ensure the temporal correlation in the manufacturing process and to make the model fit better. We normalize the test data so that the input data is between (0, 1). The standard calculation formula is as follows:
The normalized feature value for sequence i is represented by xti. The maximum and minimum values of the training dataset for a given feature are denoted by xmax and xmin, respectively. The actual value of sequence i is denoted by xi. The power, PCA Current test, PCA Voltage test, flow output, and leakage current were all normalized to the range of 0–1 using the aforementioned equation.
2.3.2. Model construction
Univariate LSTM, which makes predictions of temporal characteristics for xi column data, and MV-LSTM, which expands one-dimensional xi data to multiple dimensions. The secondary indicators with large influence on the quality characteristics are entered into the MV-LSTM, which contains the main influences on the objective function.
The MV-LSTM neural network was constructed to design the LSTM layer, Dense layer and the number of neuron cells as parameters to regulate the prediction performance, and the expression between the target and acquisition variables can be expressed as follows:
The ADAM algorithm is used for prediction performance optimization to adjust hyperparameters, and the analysis is performed by specifying hyperparameters and training all specified parameters to select the solution with the most parameters. The input variables are the number of LSTM hidden layers, the number of Dense hidden layers, the number of neurons, the memory step, three parameters to train different models, loss function using RMSE, and finally determine the optimal parameters, the main process of the model is represented in Figure 4.
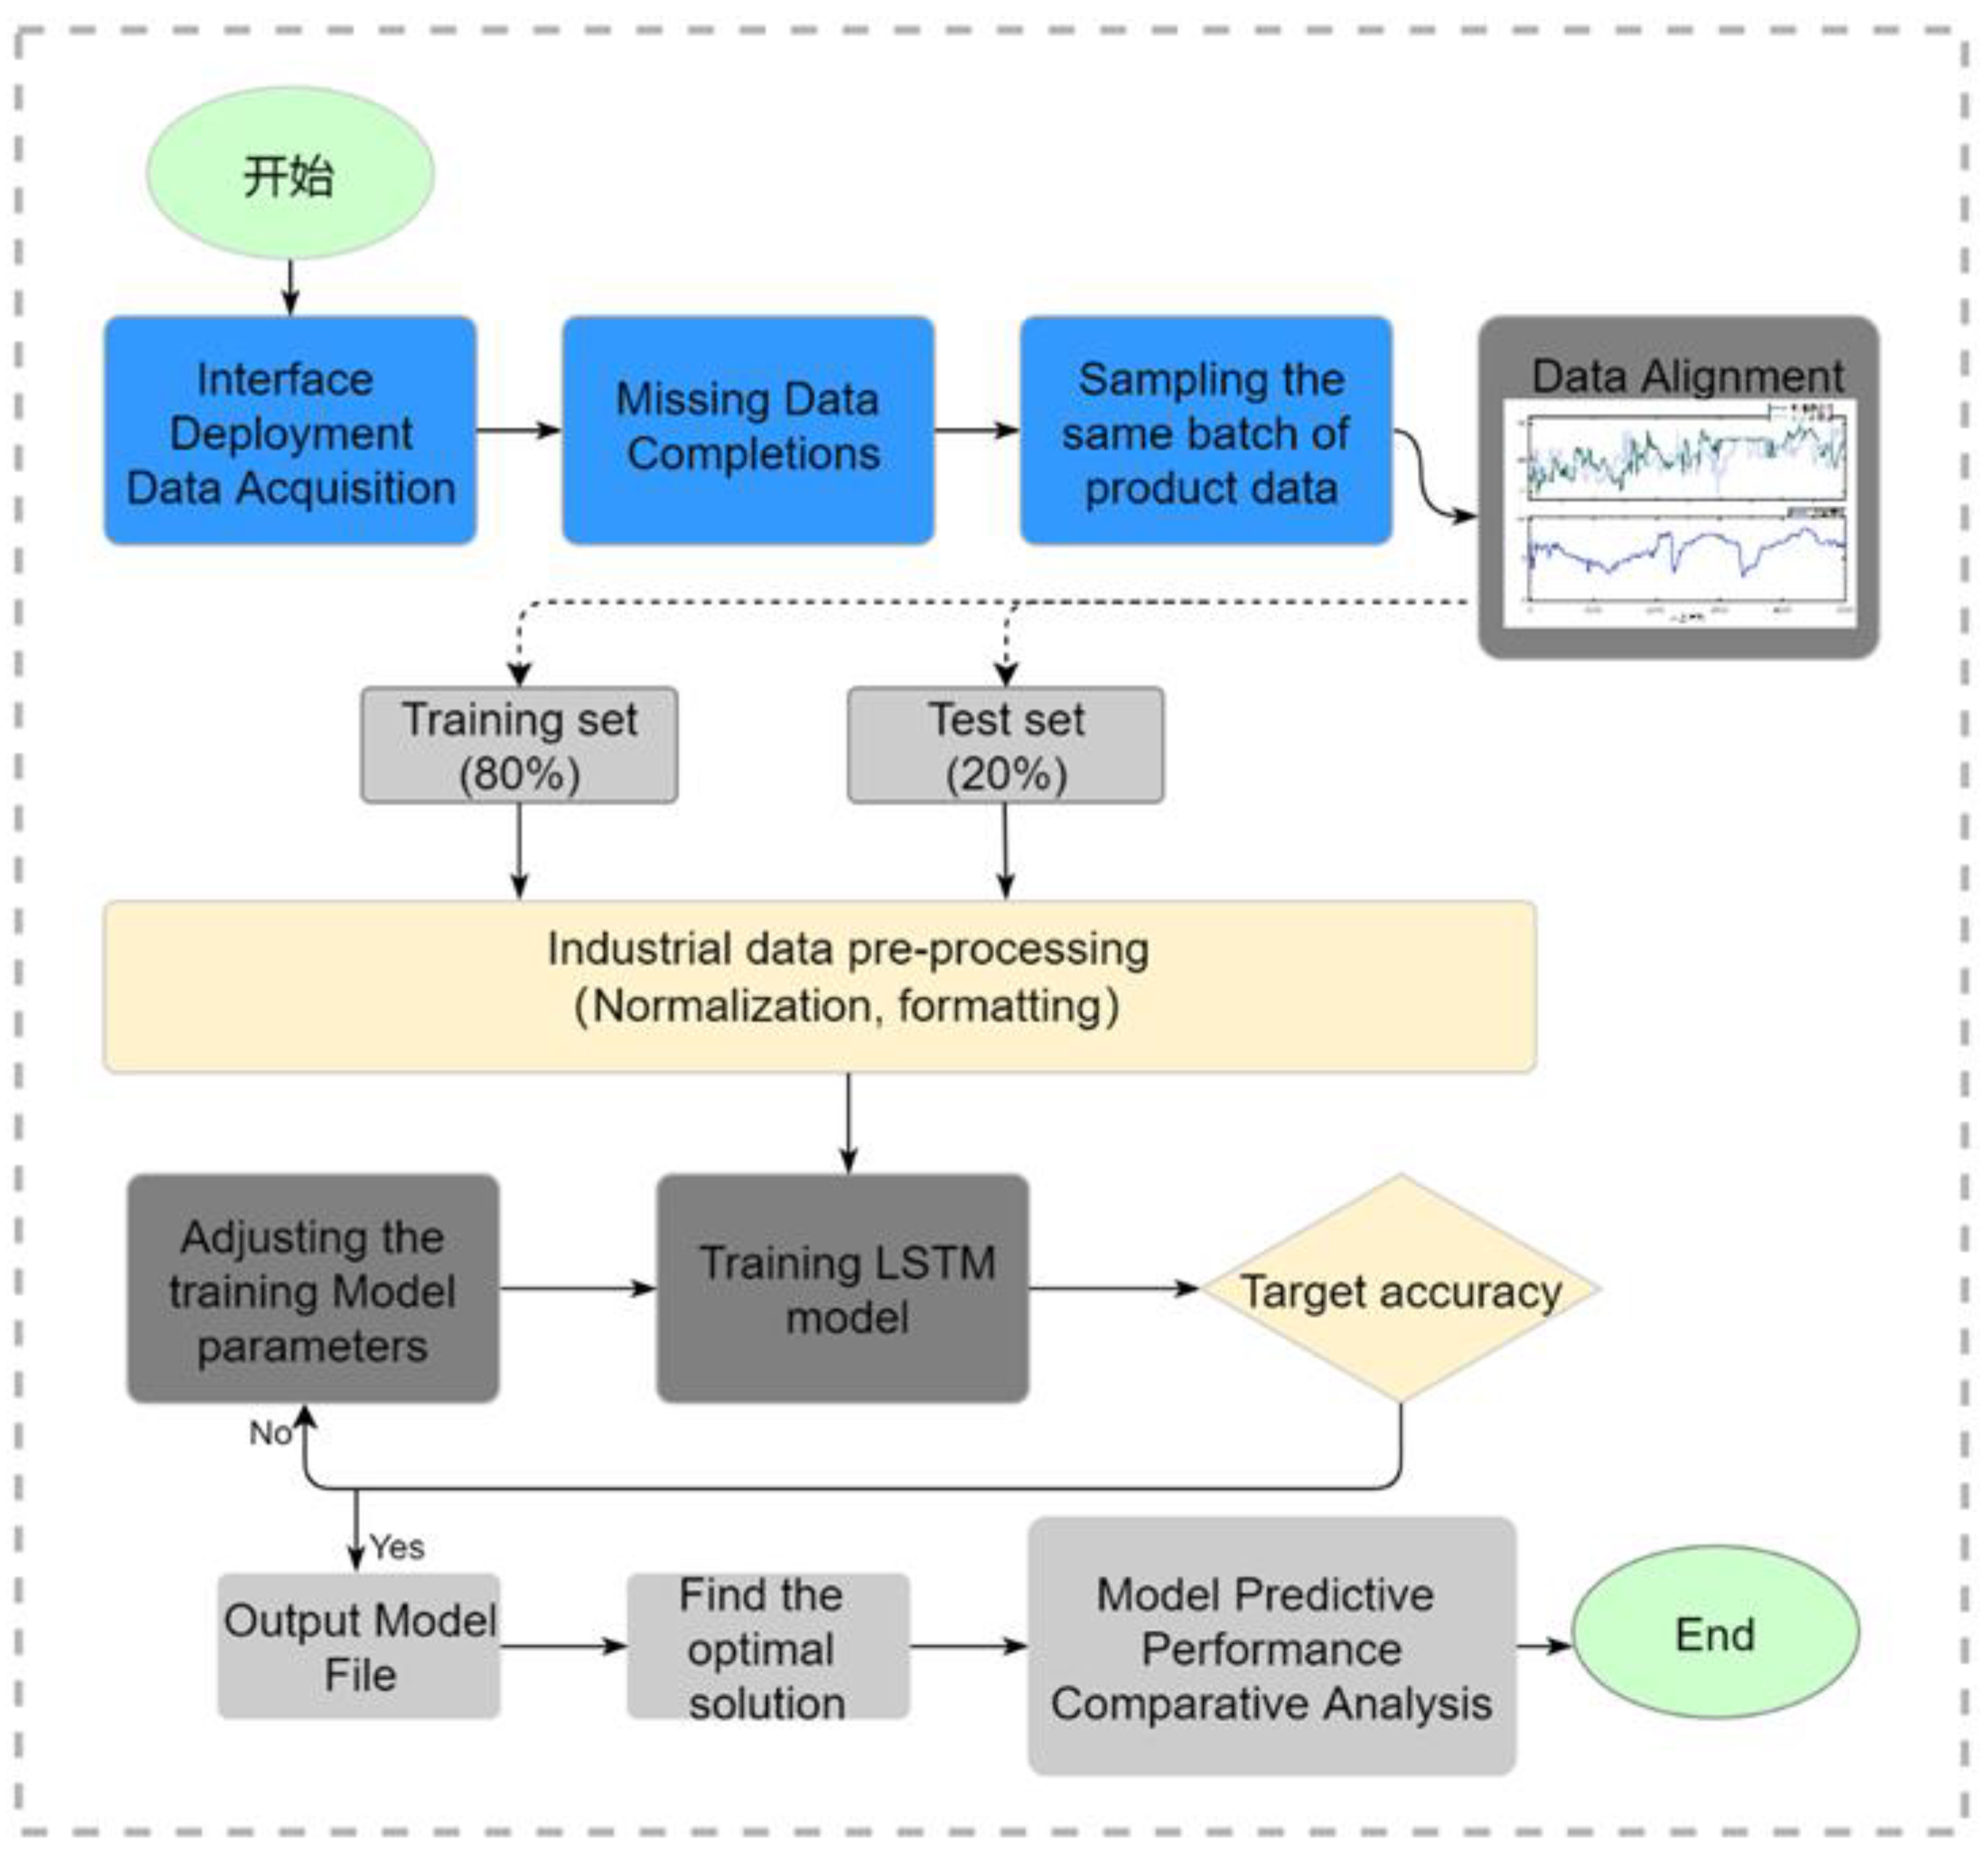
Figure 4.
Framework of LSTM network method for product production stage quality prediction.
A gateway is deployed to collect and analyze the manufacturing data of drinking fountains produced continuously on a single production line. The data is completed for missing values and aligned by product sequence number. 400 sequential product data is used as the training set and 100 product data as the test set. The data is normalized and formatted for easy input into the model. The LSTM parameters are trained with 400 product data, and the optimal prediction is obtained by adjusting the parameters. The parameter file is exported after the prediction results are adjusted. Finally, the best method for drinking water line production data is determined through comparative analysis.
3. Results and Discussions
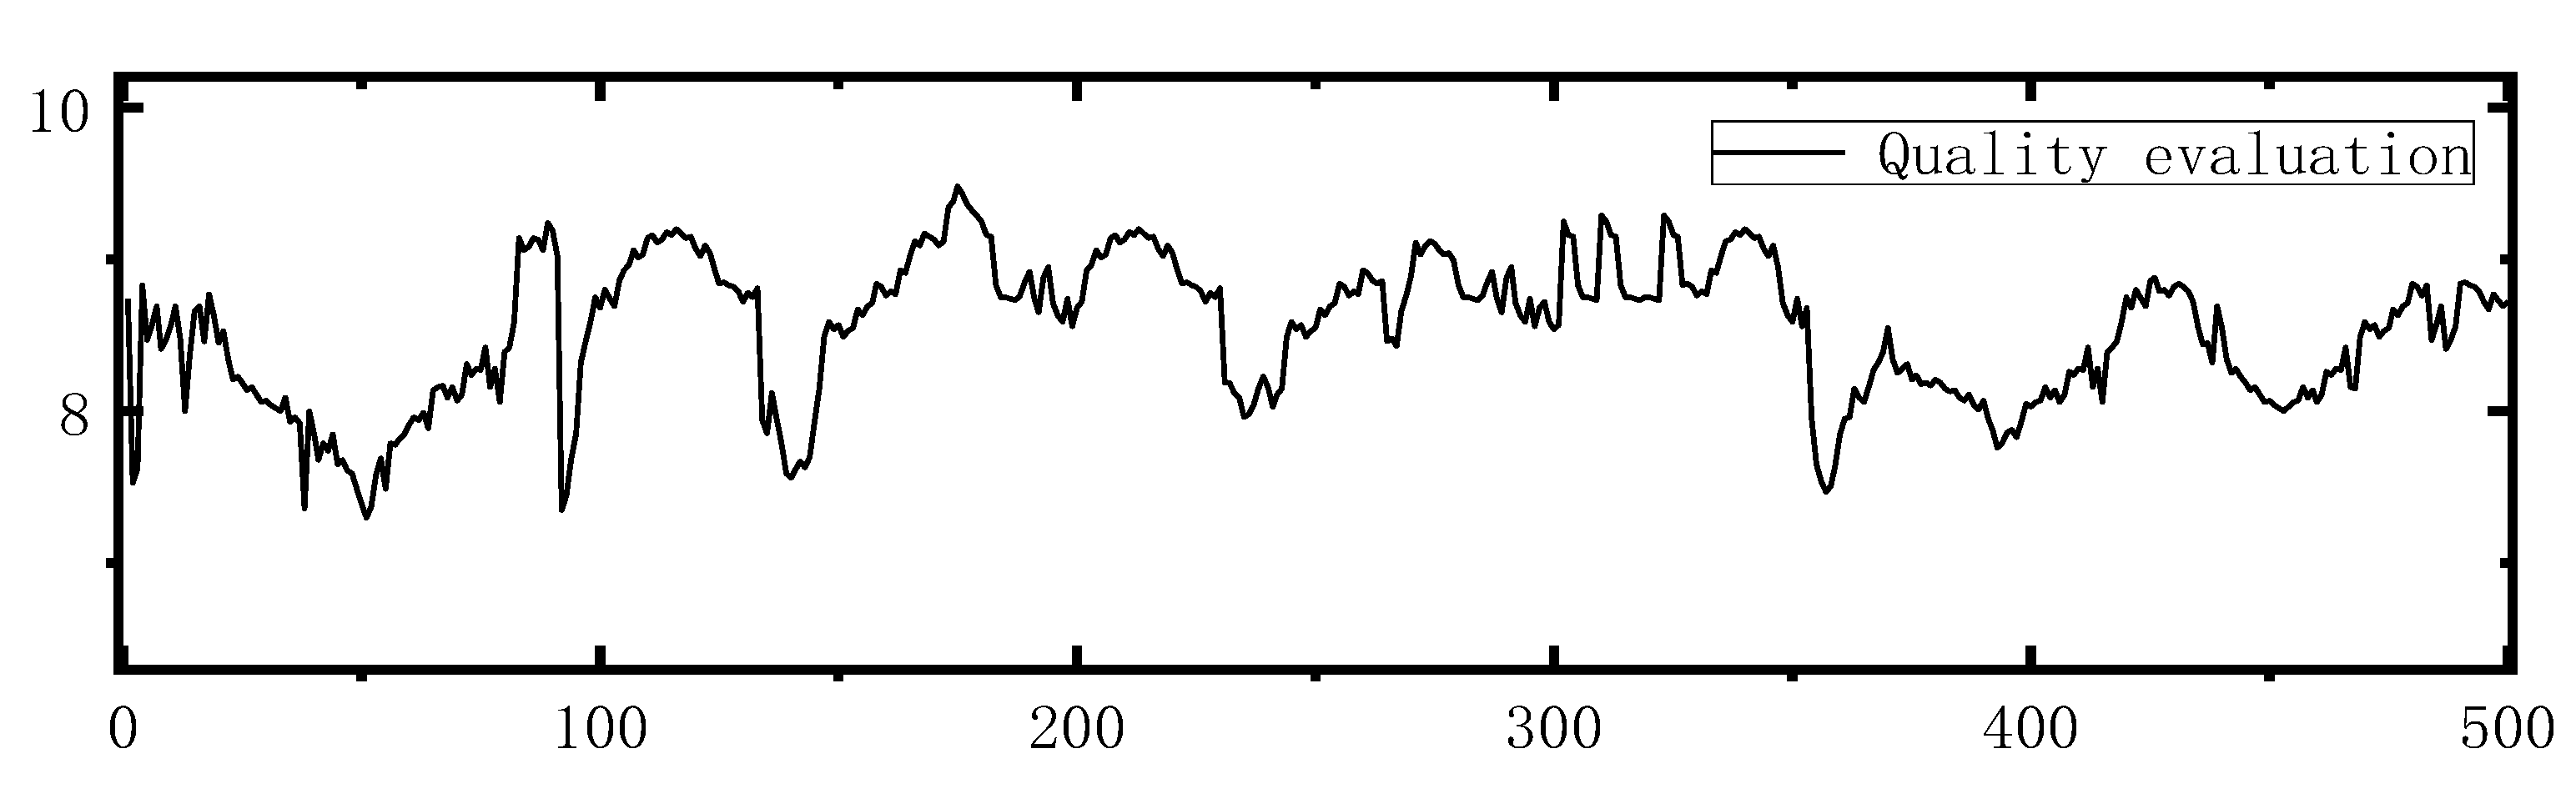
3.1. Quality Fuzzy Evaluation.
The AHP hierarchical analysis was used to decompose the z-quality evaluation indexes and determine the weights of each index. According to the experience, the evaluation set is set as V = {V1,V2,V3} = {excellent, qualified, unqualified} a total of 3 levels of rubric set, 10 senior employees are invited to rate the product evaluation indexes of each production stage, and the ratings are substituted into the subordinate degree function to obtain the fuzzy evaluation matrix of each level of indexes, which is substituted into the mathematical calculation software MATLAB for operation, and the calculated results are The consistency of the calculation results is verified. Consistency is an evaluation index of the reasonableness and accuracy of the scoring. If the scoring difference is obvious, the ranking result is considered invalid, and the judgment matrix should be reasonably revised until the consistency reaches the standard. Table 1 calculates the weights and comprehensive weights of each level 1 index and level 2 index for the mean values of the scores of 10 employees.
The quality characteristics of the drinking fountains are evaluated by 10 quality inspectors in the workshop after calculating the mean value of the results to be affiliation function to get the matrix, the consistency of the matrix is verified, and the weight coefficients of the indicators at all levels in Table 1 are derived according to the mean score.
The quality characteristics of the grade into excellent, qualified, unqualified three levels according to the evaluation characteristics of the choice of the Coase distribution as the affiliation function, which is evaluated as excellent affiliation function noted as AV1 can be expressed as follows:
Ensuring the continuity of the function between [0,100] and thus solving for the parameter a can be solved as follows:
The solution is a equal to 1.765 will be substituted into the function.
The affiliation function of the indicators whose evaluation level is qualified is chosen as the symmetric Cauchy distribution AV2 can be expressed as:
10 quality inspectors are rated high relative to the affiliation function in the unqualified the smaller the correlation, choose the Cauchy distribution function in [0,100] divided into three segments taking into account the continuity of the function, calculate the AV3 affiliation function:
3.2. Comparative analysis of prediction results
In order to verify that MV-LSTM is more superior in terms of accuracy and robust generalization ability for discrete manufacturing quality prediction, the results of pre-processed training samples test samples based on the collected dataset are compared and analyzed with SVM, univariate LSTM.
According to the QIXI manufacturing industry production of drinking fountains single processing line of raw material quality, semi-finished products sampling, finished product testing data constitute the input set. Input layer to quality prediction as the main purpose of selecting quality evaluation and quality-related indicators with greater weight as the input layer can be expressed as follows:
Q denotes the quality evaluation value; q is the power; l is the flow data of semi-finished products as the input layer to simulate the actual production process based on the quality data of each product to help companies conduct real-time quality monitoring. In the quality-oriented process we consider that the power and flow data in the measurement data contribute more to the overall quality variability and therefore are based on more attention in the quality prediction.
The comparison of quality prediction revealed that the prediction error of univariate LSTM was the largest and the prediction lag was obvious because the univariate LSTM could only reflect the dynamic characteristics of univariate time domain but not the quality level or because of the improper adjustment of hyperparameters, meanwhile the multivariate LSTM was improved compared with both traditional machine learning support vector machine and univariate LSTM.
The prediction results of SVM, univariate LSTM and MV-LSTM are shown in Table 2.
The model’s prediction analysis is based on a dataset generated through pre-processing and normalization of actual production data. Production line prediction models are established using SVM, univariate LSTM, and multivariate LSTM algorithms. The three methods are trained with samples to obtain optimal parameters. Finally, the predicted and true values of the three methods are compared to determine the best strategy.
As depicted in Figure 6, the prediction results of the support vector machine exhibit relatively large errors, although the overall trend is similar. The univariate LSTM demonstrates relatively small errors and high stability in early test results. The multivariate LSTM exhibits excellent performance in both single-point prediction of true values and trend prediction. Consequently, the multivariate LSTM surpasses both the SVM and univariate LSTM models in terms of prediction performance
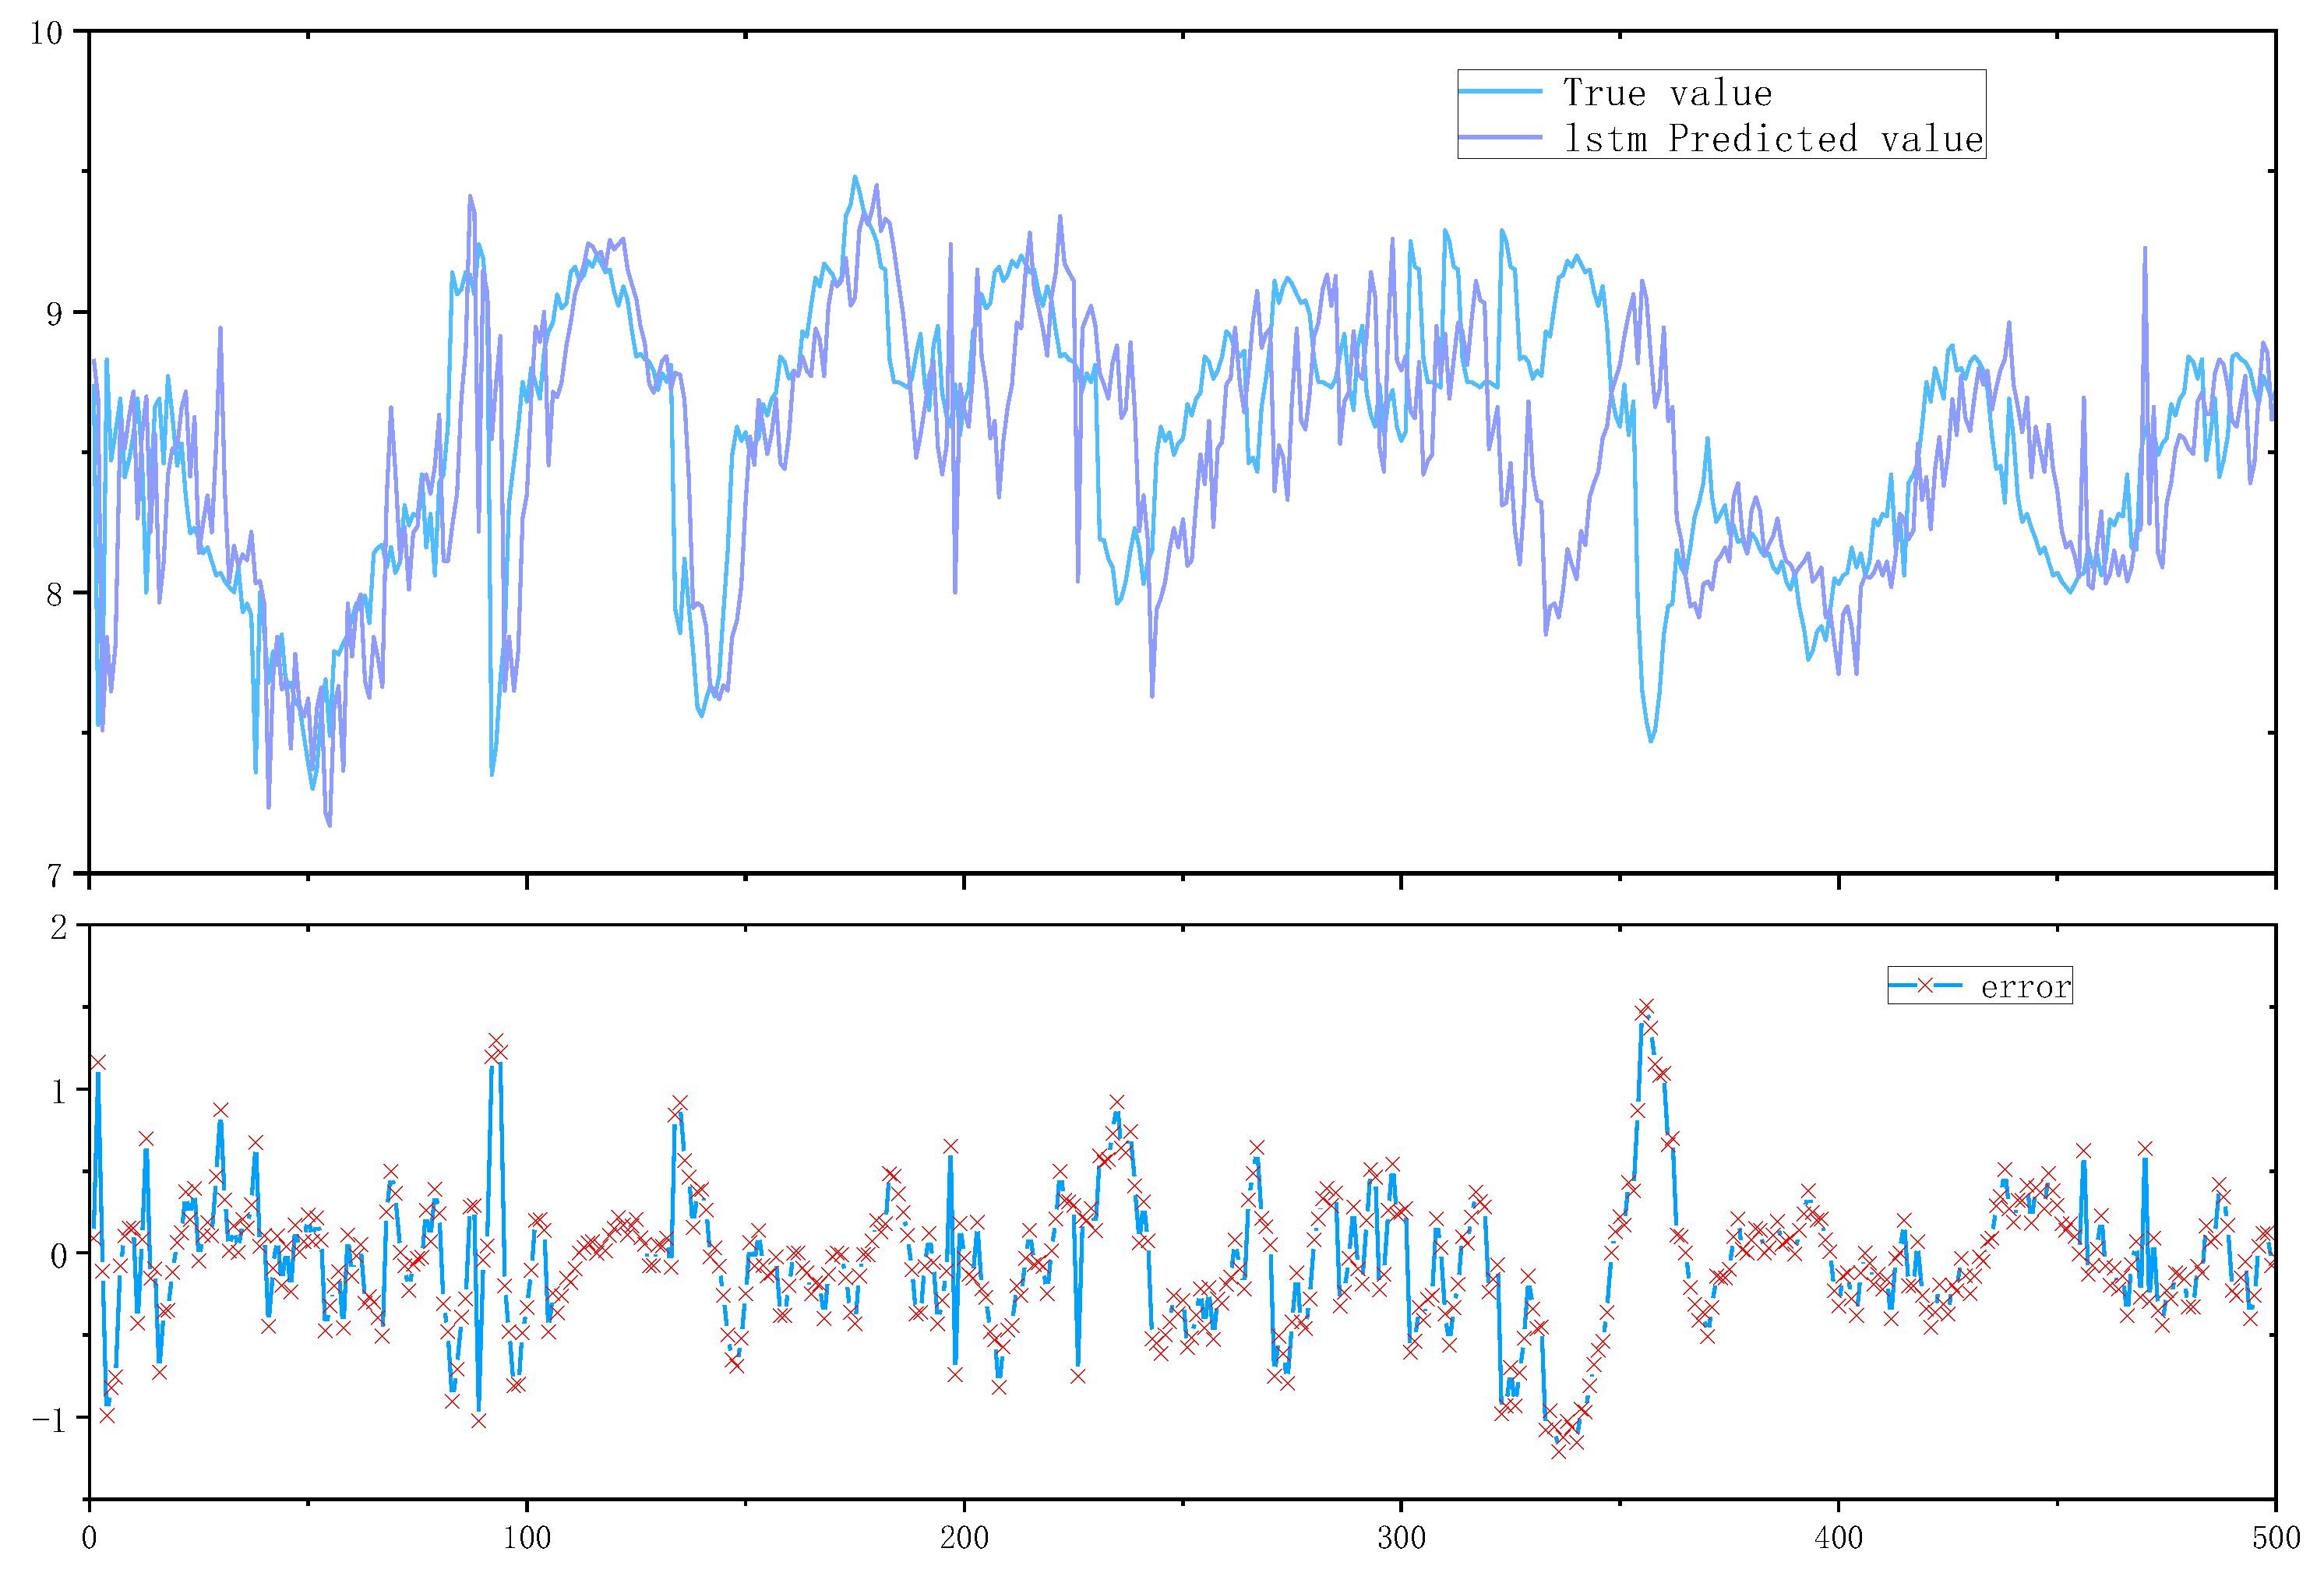
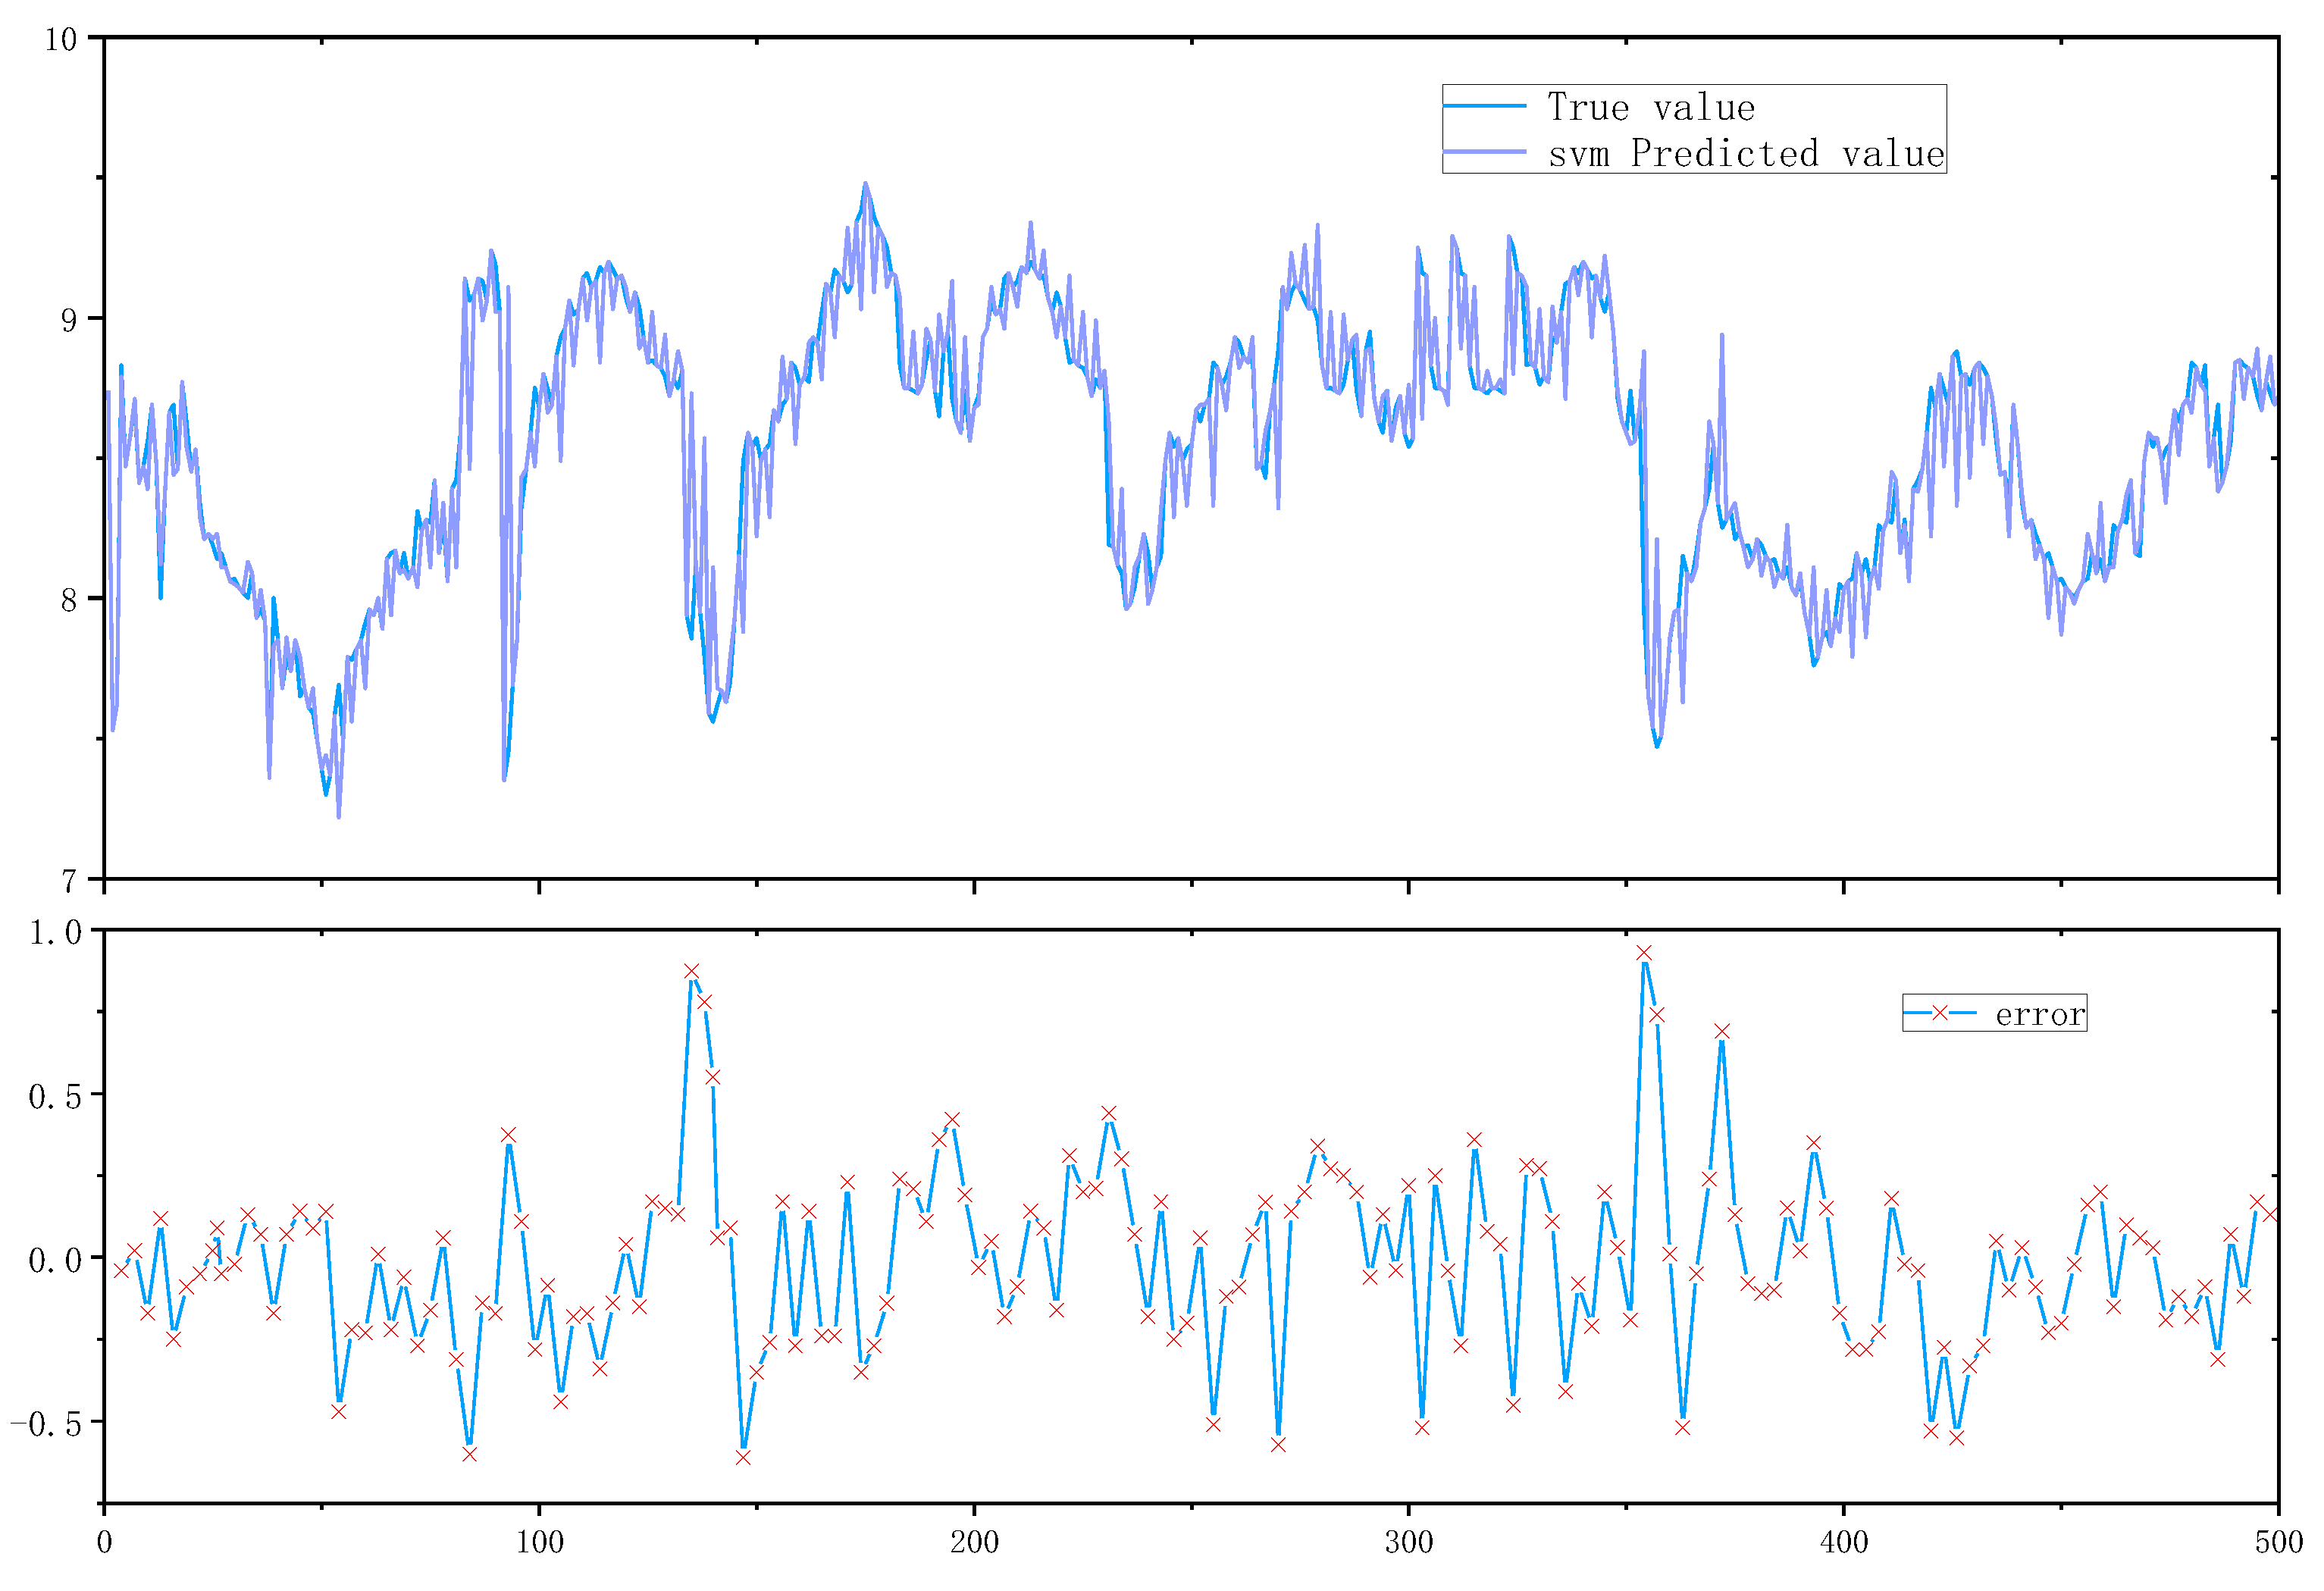
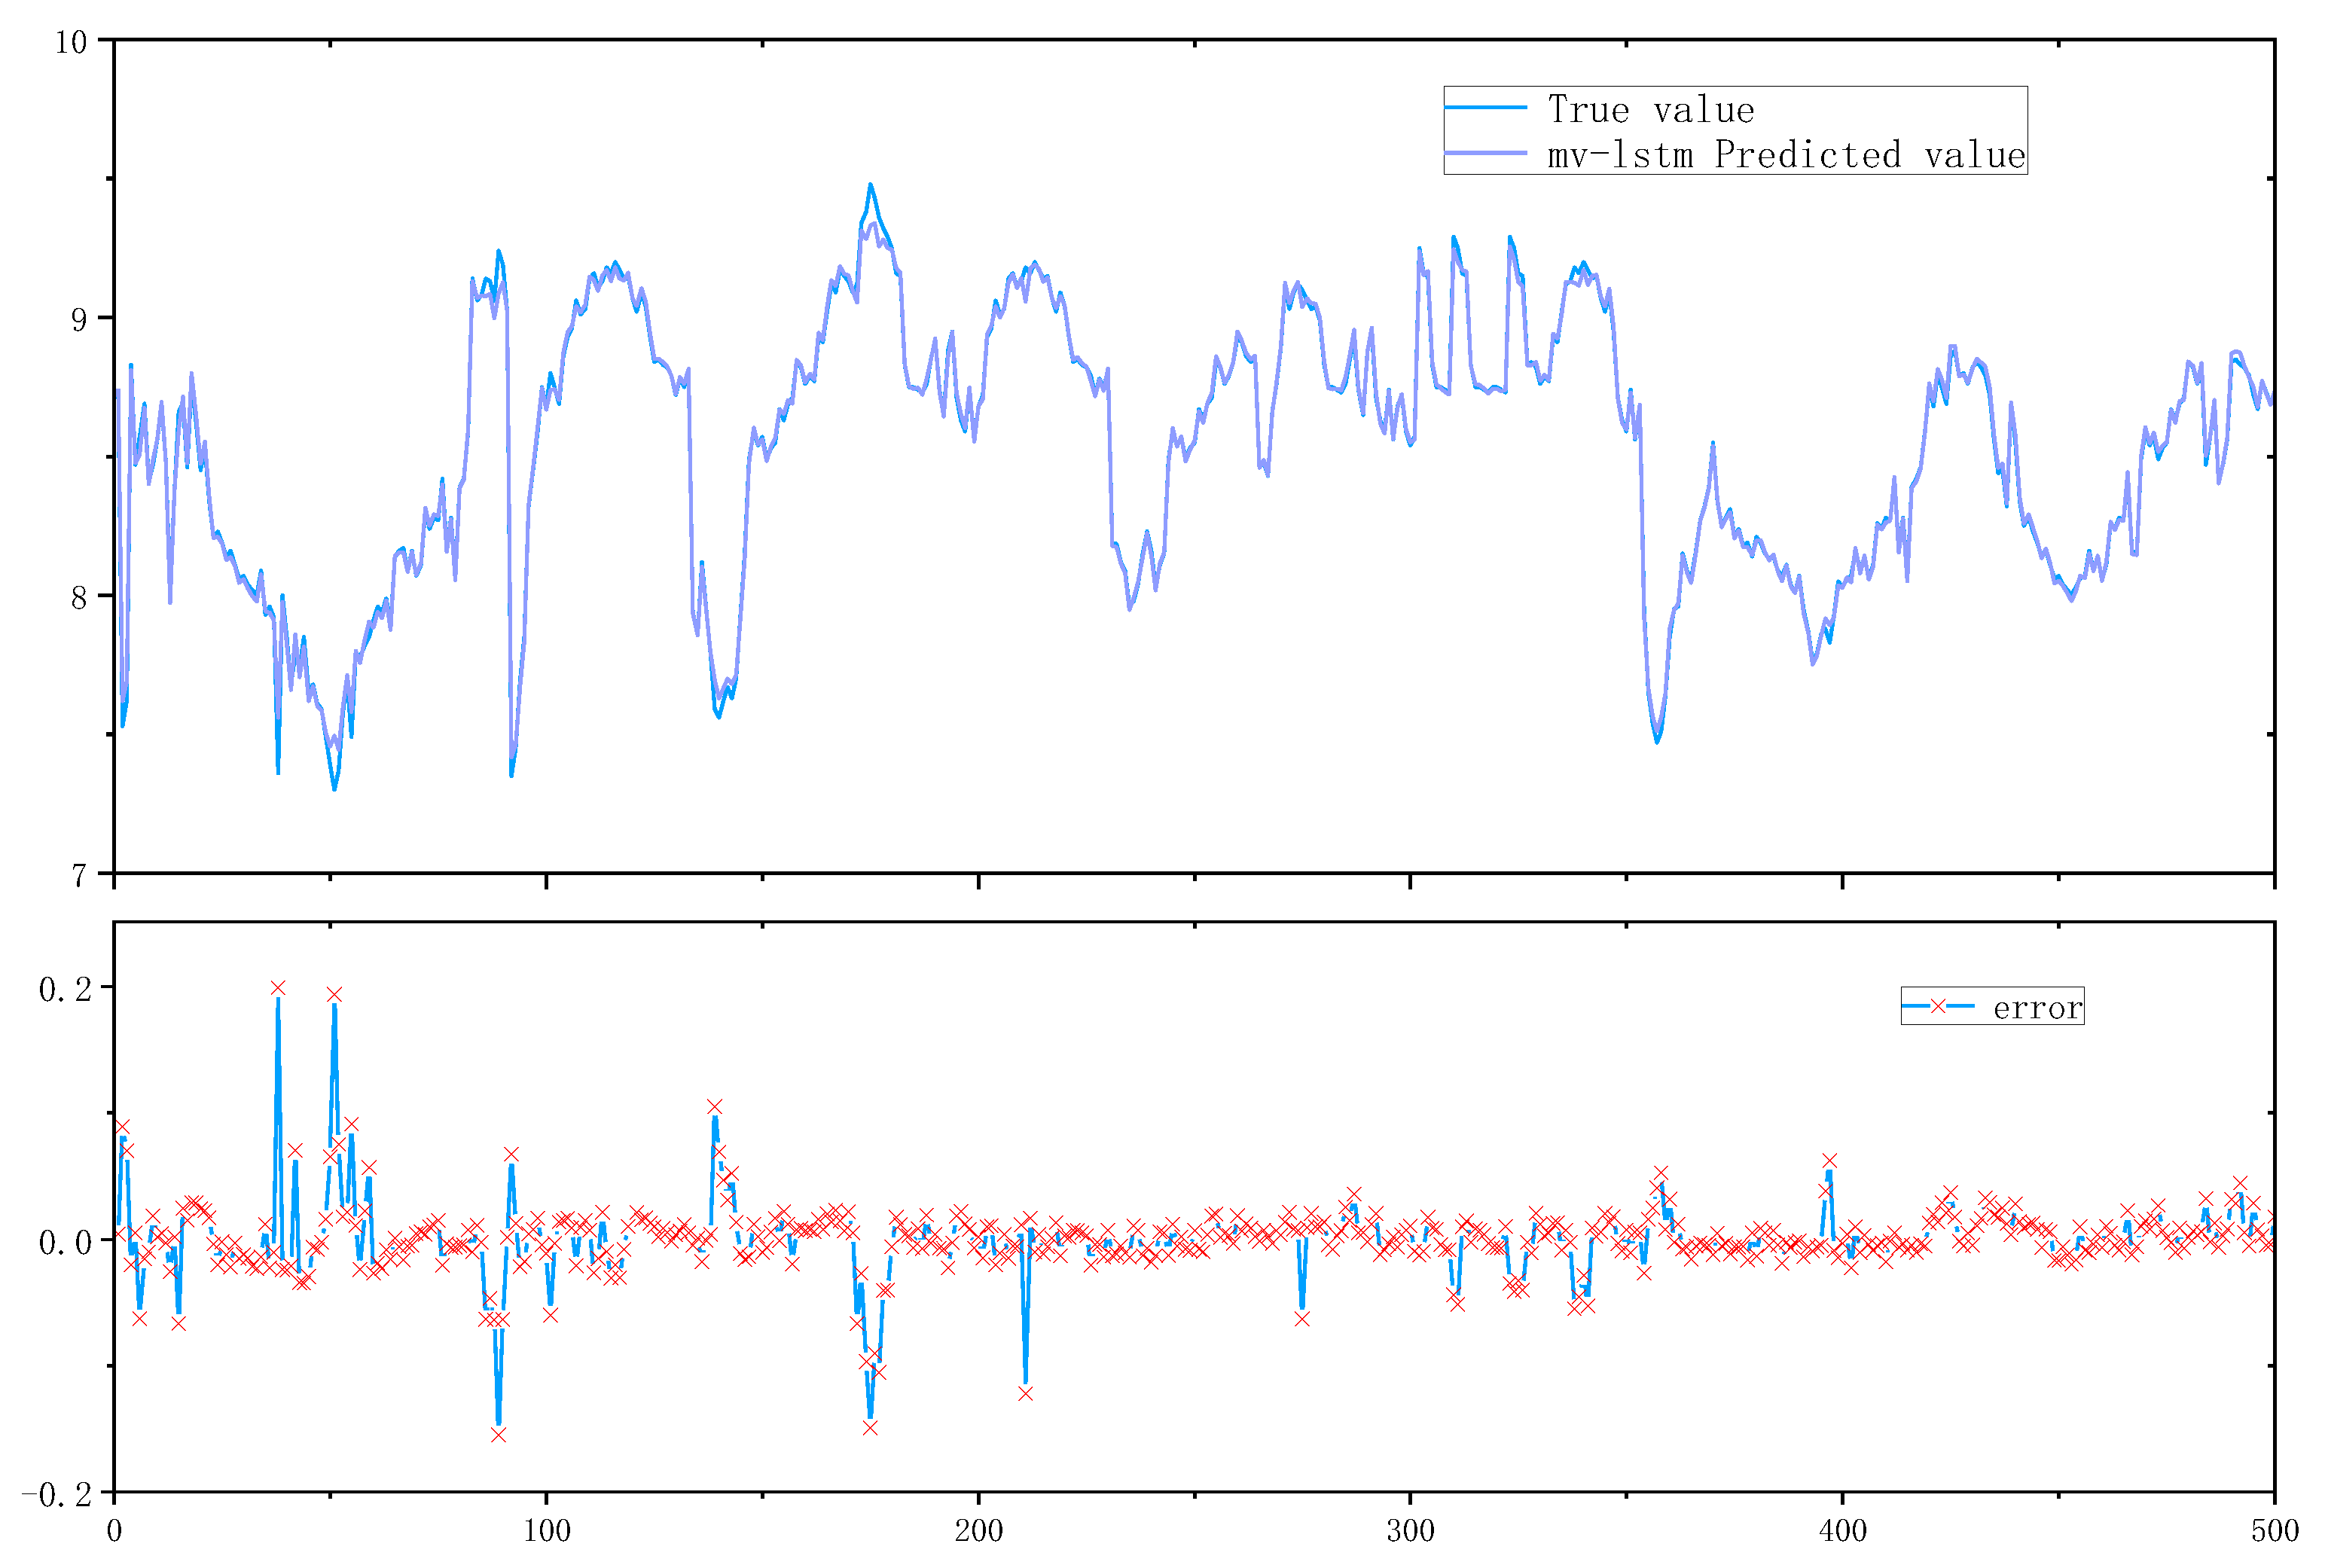
Figure 6.
svm prediction results and errors.
Figure 7.
Univariate lstm prediction results and errors.
Figure 8.
Multivariate lstm prediction results and errors.
4. Conclusion
This study employs a quality assessment approach to analyze product quality in light of the inherent risks present throughout the production process. Given the influence of uncertainty and complexity on product quality at the production level, a fuzzy evaluation method is utilized to establish the relationship between each testing index and quality. This is achieved by constructing a multivariate input prediction model for stage quality prediction, which facilitates timely product rework and reduces factory costs.
In the factory production process, the manufacturing execution system’s inspection data collection QC module is extended to enhance prediction capabilities. This provides production companies with improvement activities and enables early detection of product quality issues. The proposed model is validated using the QIXI production line as a case study, demonstrating that the multivariate long and short-term memory model employed for surface analysis exhibits strong fitting capabilities for dealing with nonlinearities and is well-suited for systematic transformation of the production line.
Many manufacturers strive to increase quality improvement activities to prevent defective products from leaving the factory and damaging their reputation. In response to this demand, a higher level of quality prediction is required, as failed predictions inevitably lead to poor decisions. The model used in this paper exhibits higher accuracy compared to traditional methods and facilitates enterprise quality management and risk control. In the future, the development of manufacturing execution systems will trend towards greater intelligence, leveraging big data and deep learning to manage key equipment production and assess production levels at each stage. This will enable enterprises to identify quality divergence points earlier
References
- Errandonea I, Beltrán S, Arrizabalaga S. Digital Twin for maintenance: a literature review. Comput Ind 2020;123:103316. [CrossRef]
- Mayne D Q, Rawlings J B, Rao C V, Scokaert POM. Constrained model predictive control: stability and optimality. Automatica, 2000, 36(6): 789−814.
- ZHONG R Y,HUANG G Q,LAN S,et al. A big data approach for logistics trajectory discovery from RFID-enabled production data [J]. International Journal of Production Economics,2015(165):260-272.
- M. Kano and Y. Nakagawa, "Data-based process monitoring, process control, and quality improvement: Recent developments and applications in steel industry," Comput. Chem. Eng., vol. 32, no. 1, pp. 12-24, 2008. [CrossRef]
- S. Khatibisepehr, B. Huang, and S. Khare, "Design of inferential sensors in the process industry: A review of Bayesian methods," J. Process Contr., vol. 23, no. 10, pp. 1575-1596, 2013. [CrossRef]
- X. Yuan, Z. Ge, B. Huang, and Z. Song, "A Probabilistic Just-in-Time Learning Framework for Soft Sensor Development With Missing Data," IEEE. T. Contr. Syst. T., vol. 25, no. 3, pp. 1-9, 2017. [CrossRef]
- H. Zhang, S. Sfarra, F. Sarasini, C. Ibarra-Castanedo, S. Perilli, H.C. Fernandes, et al., Optical and mechanical excitation thermography for impact response in basalt-carbon hybrid fiber-reinforced composite laminates, IEEE Trans. Ind. Inf. 14 (2) (2018) 514–522. [CrossRef]
- R. Yang, Y. He, A. Mandelis, A. Mandelis, N. Wang, X. Wu, S. Huang, Induction infrared thermography and thermal-wave-radar analysis for imaging inspection and diagnosis of blade composites, IEEE Trans. Ind. Inf. 14 (12) (2018) 5637–5647. [CrossRef]
- H. Zhang, L. Yu, U. Hassler, H. Fernandes, M. Genest, F. Robitaille, et al., An experimental and analytical study of micro-laser line thermography on micro-sized flaws in stitched carbon fiber reinforced polymer composites, Compos. Sci. Technol. 126 (2016) 17–26. [CrossRef]
- Y. Duan, H. Zhang, X. Maldague, C. Ibarra-Castanedo, P. Servais, M. Genest, et al., Reliability assessment of pulsed thermography and ultrasonic testing for impact damage of CFRP panels, NDT and E Int. 102 (2019) 77–83. [CrossRef]
- Y. He, G. Tian, M. Pan, D. Chen, Impact evaluation in carbon fiber reinforced plastic (CFRP) laminates using eddy current pulsed thermography, Compos. Struct. 109 (1) (2014) 1–7. [CrossRef]
- Su, Y., Han, L., Wang J., Wang H.(2019), “Quantum-behaved RS-PSO-LSSVM method for quality prediction in parts production processes”, Concurrency and Computation-Practice & Experience, Vol. 9, e5522.
- S. Yin, H.Gao, J.Qiu, and O. Kaynak, “Fault detection for non-linear process with deterministic disturbances: A just-in-time learning based data driven method, ”IEEE Trans. Cybern., vol. 47, no. 11,pp. 3649–3657, Nov. 2017.
- Chunlong Yu & Andrea Matta (2016): A statistical framework of data-driven bottleneck identification in manufacturing systems, International Journal of Production Research. [CrossRef]
- Maheshwaran Gopalakrishnan , Mukund Subramaniyan & Anders Skoogh (2020): Data-driven machine criticality assessment – maintenance decision support for increased productivity, Production Planning & Control. [CrossRef]
- Yifan Zhang, Qing Wang and Anan Zhao (2019): A multi-object posture coordination method with tolerance constraints for aircraft components assembly Assembly Automation 40/2 (2020) 345–359.
- Wang H, Liu L, Fei Y, et al. A collaborative manufacturing execution system oriented to discrete manufacturing enterprises. Concurr Eng 2016;24(4):330–43.
- Schäfer C (2007) On the modularity of manufacturing systems.IEEE Ind Electron Mag Fall 2007:20–27.
- R. S. Peres, J. Barata, P. Leitao, and G. Garcia, ‘‘Multistage quality control using machine learning in the automotive industry,’’ IEEE Access, vol. 7, pp. 79908–79916, 2019. [CrossRef]
- C. A. Escobar and R. Morales-Menendez, ‘‘Machine learning techniques for quality control in high conformance manufacturing environment,’’ Adv. Mech. Eng., vol. 10, no. 2, 2018, Art. no. 1687814018755519. [CrossRef]
- Du, W., Shen, H., Fu, J., Zhang, G., He, Q.: Approaches forimprovement of the x-ray image defect detection of automobilecasting aluminum parts based on deep learning. ND E Int.107,102144 (2019).
- C.-F. Lai, W.-C. Chien, L. T. Yang, and W. Qiang, “LSTM andedge computing for big data feature recognition of industrial electricalequipment,”IEEE Trans. Ind. Informat., vol. 15, no. 4, pp. 2469–2477,Apr. 2019.
- X. F. Yuan, L. Li, and Y. L. Wang, “Nonlinear dynamic soft sensor modeling with supervised long short-term memory network,” IEEE Trans. Ind. Inform. [CrossRef]
- E. Essien and C. Giannetti, “A deep learning model for smart manufacturing using convolutional lstm neural network autoencoders, ”IEEE Transactions on Industrial Informatics, vol. PP, no. 99, pp. 1–1,2020. [CrossRef]
- Kechadi M, Low KS, Goncalves G. Recurrent neural network approach for cyclic job shop scheduling problem. J Manuf Syst 2013;32(4):689–99. [CrossRef]
- Ye W, Hong HP, Wang JF (2015) Comparison of spatial interpolation techniques for extreme wind speedsover Canada. J Comput Civil Eng ASCE 29(6), November/December, 04014095.
- Yan, B.Z.; Sun, J.; Wang, X.Z.; Han, N.; Liu, B. Groundwater level prediction based on multivariable LSTM neural network. J. Jilin Univ. 2020, 50, 1.
- Ma, X.; Tao, Z.; Wang, Y.; Yu, H.; Wang, Y. Long short-term memory neural network for traffic speed prediction using remote microwave sensor data. Transp. Res. Part. C Emerg. Technol. 2015, 54, 187–197. [CrossRef]
Figure 2.
LSTM model network.
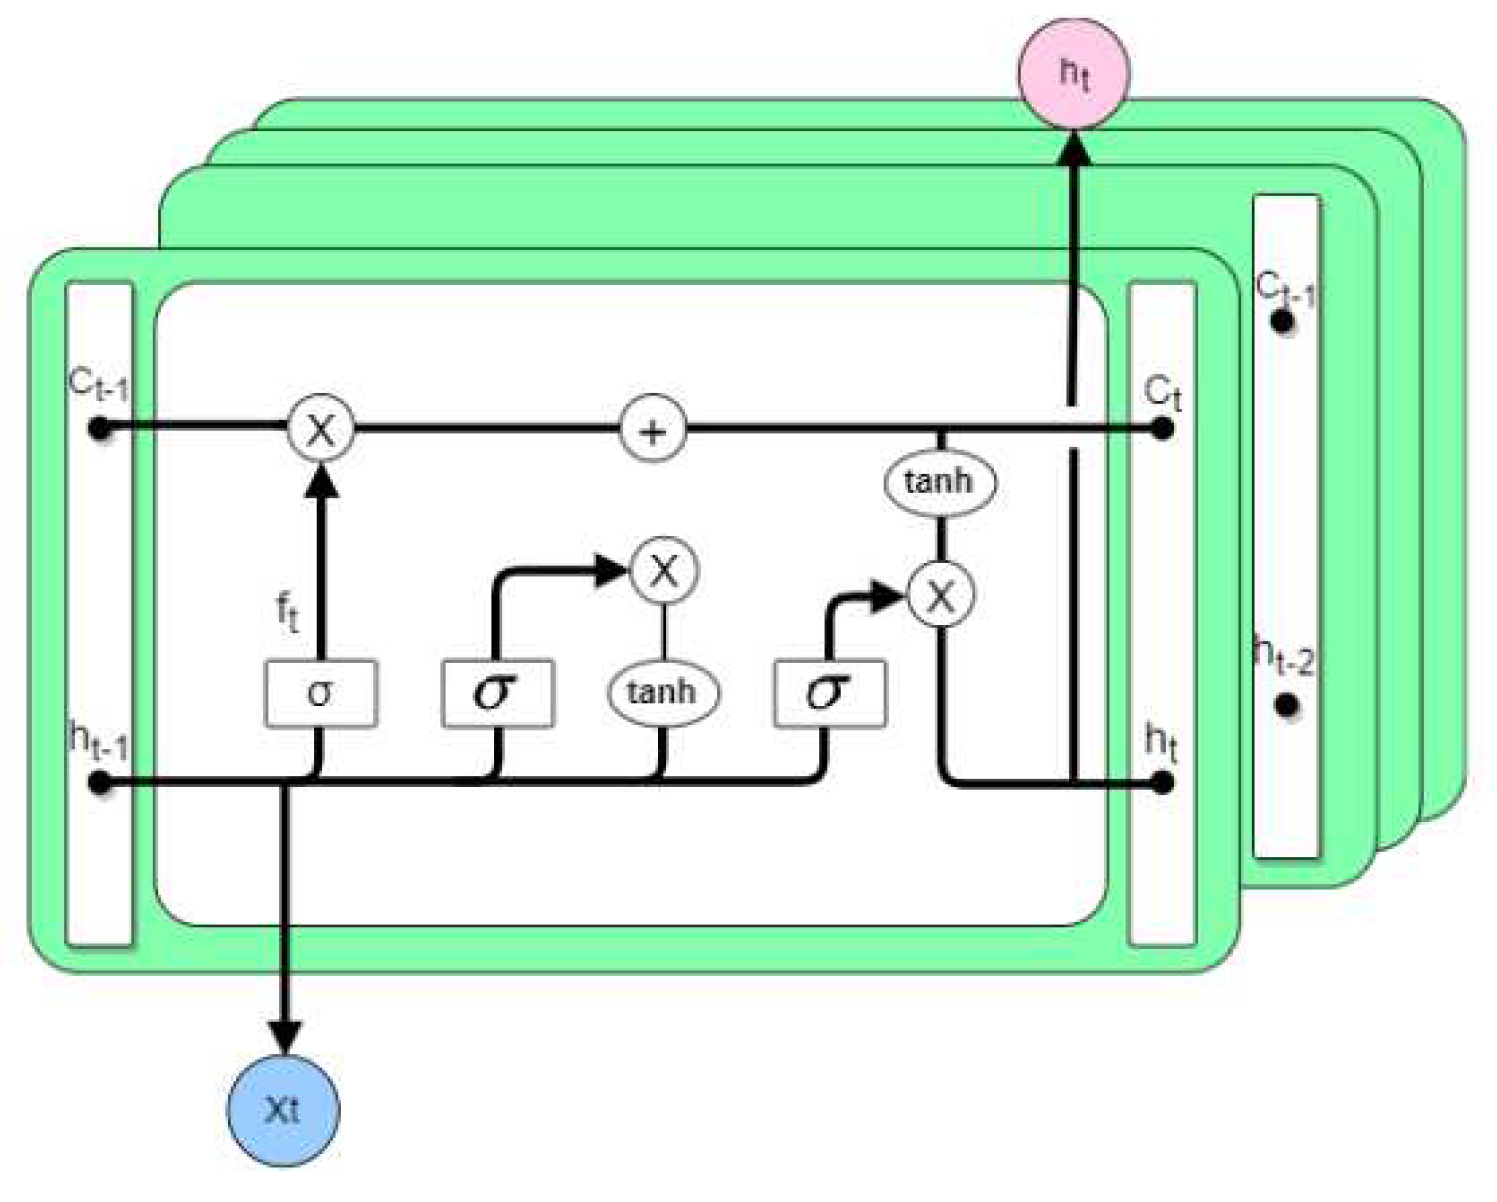
Figure 3.
Multivariate input LSTM model network.
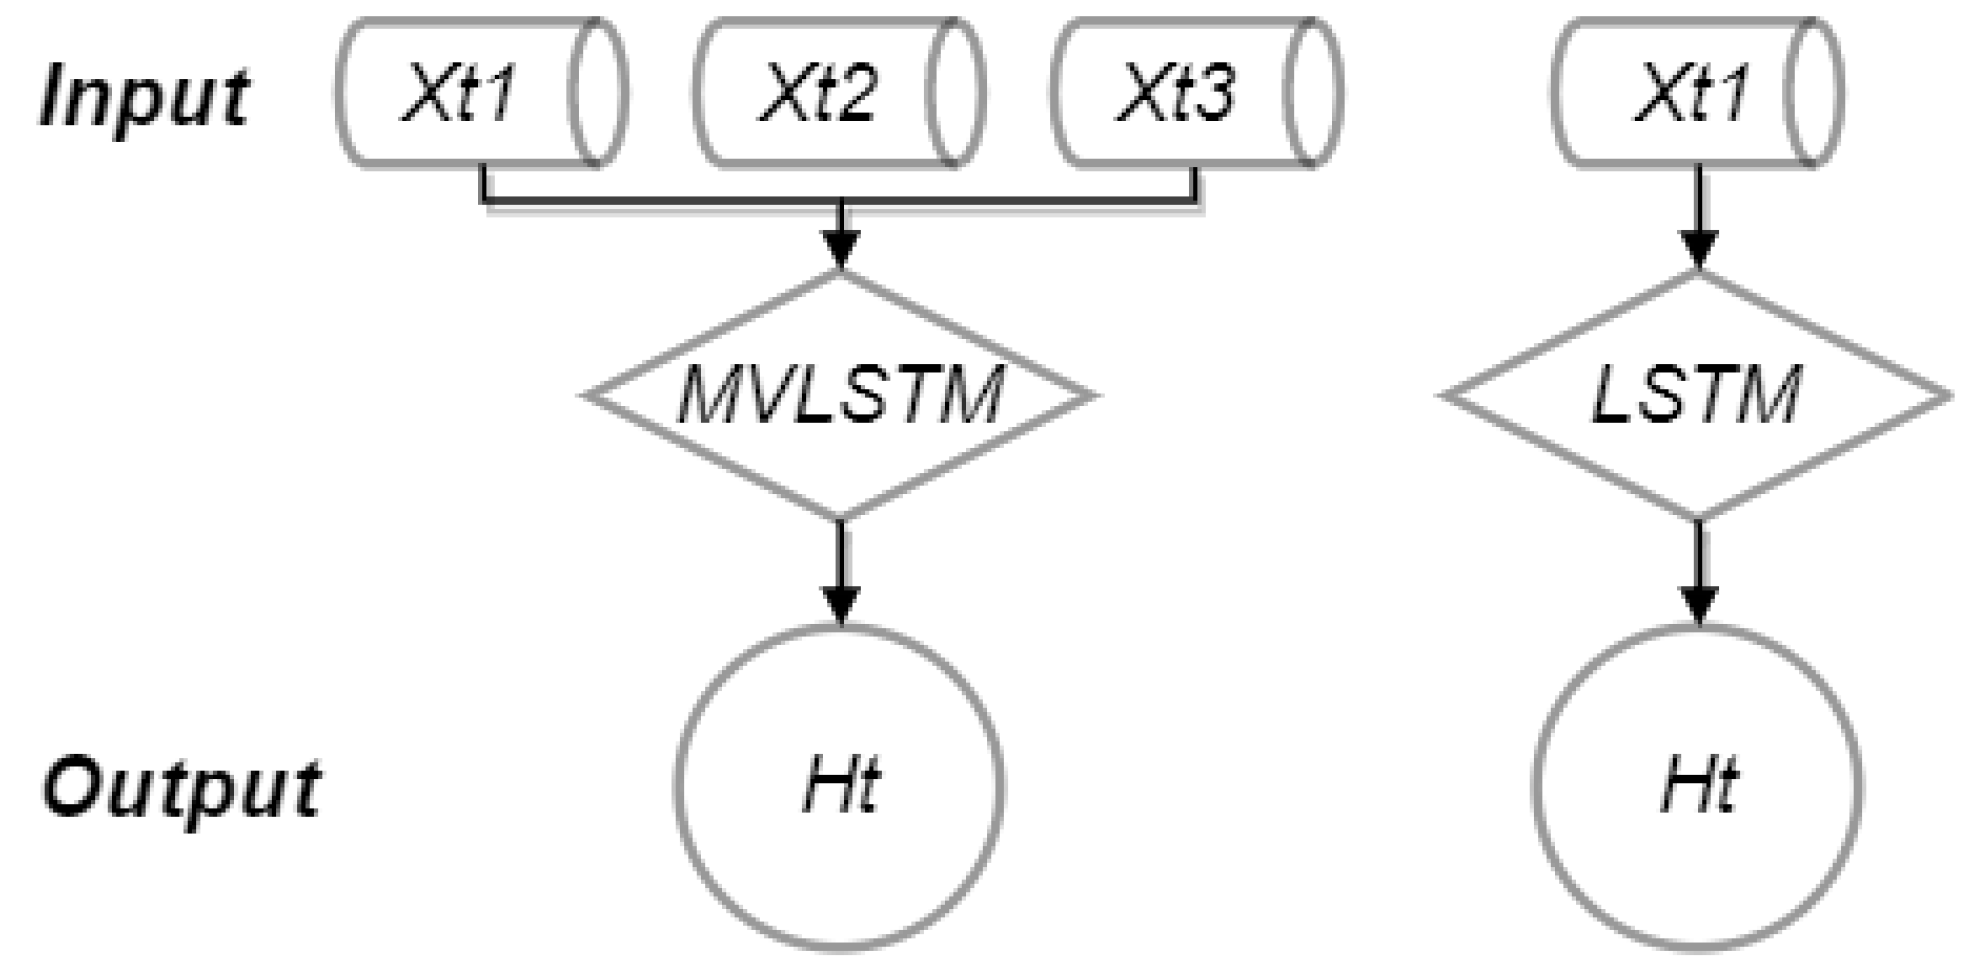

Table 1.
Production line quality characteristics weights.
| Status | Tier 1 Indicators | Weights | Secondary indicators | Weights | Combined weights |
| Mechanical Components | Supply Chain | 0.14767 | Stepper motors | 0.3416 | 0.05504 |
| Seals | 0.1274 | 0.01881 | |||
| Quartz heaters | 0.3071 | 0.04534 | |||
| Circuit Boards | 0.2239 | 0.03306 | |||
| Semi-finished products | Water Detection | 0.27459 | Discharge flow | 0.5542 | 0.15217 |
| Temperature control | 0.4457 | 0.12238 | |||
| Electrical detection | 0.22956 | Power | 0.3713 | 0.08523 | |
| PCA Voltage test | 0.1425 | 0.03271 | |||
| Leakage current | 0.1826 | 0.04191 | |||
| PCA Current test | 0.1369 | 0.03142 | |||
| Grounding current | 0.1667 | 0.03826 | |||
| Finished product | 0.34818 | Cold and heat shock | 0.3158 | 0.10995 | |
| Fatigue detection | 0.3469 | 0.12078 | |||
| Salt Spray Test | 0.3373 | 0.11744 | |||
| Method | RMSE | MAE | MAPE(%) |
| SVM | 0.1719 | 0.07274 | 0.86158 |
| LSTM | 0.40957 | 0.40957 | 3.5848 |
| MV-LSTM | 0.02755 | 0.01639 | 0.19421 |
Disclaimer/Publisher’s Note: The statements, opinions and data contained in all publications are solely those of the individual author(s) and contributor(s) and not of MDPI and/or the editor(s). MDPI and/or the editor(s) disclaim responsibility for any injury to people or property resulting from any ideas, methods, instructions or products referred to in the content. |
© 2023 by the authors. Licensee MDPI, Basel, Switzerland. This article is an open access article distributed under the terms and conditions of the Creative Commons Attribution (CC BY) license (http://creativecommons.org/licenses/by/4.0/).
Copyright: This open access article is published under a Creative Commons CC BY 4.0 license, which permit the free download, distribution, and reuse, provided that the author and preprint are cited in any reuse.


