
Submitted:
27 June 2023
Posted:
28 June 2023
You are already at the latest version
Abstract
The inability to efficiently metabolize homocysteine (Hcy), which occurs in nutritional and genetic deficiencies, leads to hyperhomocysteinemia (HHcy) thereby causing endothelial dysfunction, a hallmark of atherosclerosis which underpins cardiovascular disease (CVD). The dysregulation of mammalian target of rapamycin (mTOR) signaling, and impaired autophagy play important roles in CVD. Biochemically, HHcy is characterized by elevated levels of Hcy and its metabolites, Hcy-thiolactone (HTL) and N-Hcy-protein (N-Hcy). However, whether these metabolites can dysregulate mTOR signaling and autophagy in endothelial cells is not known. Here, we examined the influence of HTL, N-Hcy, and Hcy on the PHF8/H4K20me1/mTOR/autophagy pathway in human umbilical vein endothelial cells (HUVEC). We found that treatments with HTL, N-Hcy, or Hcy significantly reduced PHF8 protein and mRNA expression, increased H4K20me1, and upregulated mTOR signaling. Autophagy was also impaired (significantly downregulated BECN1, ATG5, ATG7, and LC3 protein and mRNA levels). We also found that these changes were mediated by PHF8-targeting microRNA (miR): miR-22-3p and miR-1229-3p. The effects of HTL, N-Hcy, or Hcy on the miR expression and on the PHF8/H4K20me1/mTOR/autophagy pathway were abrogated by treatments with an inhibitor of miR-22 or miR-1229. Taken together, these findings show that Hcy metabolites can upregulate miR-22-3p and miR-1229-3p expression, which then dysregulate the PHF8/H4K20me1/mTOR/autophagy pathway, important for vascular homeostasis.

Keywords:
homocysteine thiolactone
; N-homocysteinylated protein
; microRNA
; PHF8
; mTOR
; autophagy
; endothelial cells
1. Introduction
Atherosclerosis, an inflammatory disease [1,2], and its vascular manifestations, such as myocardial infarction, stroke, and peripheral artery disease, are the leading cause of morbidity and mortality worldwide. Endothelium supports vascular homeostasis by regulating the vascular tone and permeability. Endothelial dysfunction caused by biochemical or mechanical factors disrupts vascular homeostasis, induces inflammation, and is associated with atherothrombotic cardiovascular disease (CVD). The response-to-injury hypothesis proposes that endothelial dysfunction is the first step in atherosclerosis. In addition to elevated low-density lipoprotein, cigarette smoking, hypertension, diabetes mellitus, infectious microorganisms, and genetic alterations, endothelial dysfunction can be caused by elevated plasma homocysteine (Hcy), i. e., hyperhomocysteinemia (HHcy) [2]. Indeed, endothelial dysfunction and inflammation are common findings in HHcy in humans and animal models [3,4,5]. Inflammation is also seen in cultured endothelial cells treated with Hcy [6,7] or Hcy-thiolactone (HTL) [7].
Biochemically, HHcy is characterized by elevated levels of Hcy and its metabolites such as HTL and N-Hcy-protein (N-Hcy), observed in genetic and nutritional deficiencies in Hcy metabolism in humans and animals [8]. Genetically or nutritionally induced HHcy causes pro-atherogenic changes in gene expression in mice and humans [9,10].
Earlier studies have shown that human umbilical vein endothelial cells (HUVEC) metabolize Hcy to HTL and N-Hcy and that HTL and N-Hcy levels depend on extracellular concentrations of Hcy, folic acid, and HDL, factors that determine the susceptibility to vascular disease in humans, suggesting that HTL and N-Hcy could be involved in endothelial dysfunction and atherosclerosis [11]. Later studies in HUVEC found that HTL and N-Hcy induce pro-atherogenic changes in gene expression that included upregulation by HTL of LAMTOR2 mRNA, a component of the mammalian target of rapamycin (mTOR) signaling pathway [12]. However, mechanisms by which these metabolites can affect gene expression in human vascular endothelial cells are not known.
MicroRNAs (miRs) are small non-coding RNAs which play a key role in cellular homeostasis by regulating gene expression at mRNA level [13]. miR genes are transcribed by RNA polymerase II to primary miR, which is first cleaved by DROSHA and then by DICER [14,15], generating 21-23 nt double strand mature miRs [16]. One strand is incorporated into RISC (RNA-induced silencing complex) and regulates gene expression by binding to partially complementary mRNA sequence (mainly found in 3` UTR) to induce translational repression, mRNA deadenylation or cleavage [17]. Dysregulated miR expression can lead to endothelial dysfunction [18] and associated diseases such as CVD [19], stroke [20], and neuropathies [21,22].
Plant homeodomain finger protein 8 (PHF8) as one of the X chromosome genes linked to the intellectual disability syndrome, autism spectrum disorder, attention deficit hyperactivity disorder [21], and severe intellectual disability [22]. PHF8 is a histone demethylase that demethylates H4K20me1, which is important for homeostasis of the mTOR signaling [23]. The expression of PHF8 is known to be regulated by microRNA such as miR-22 [24] and miR-1229 [25], which bind to PHF8 3’UTR. Studies in mice and neural cells showed that HHcy attenuated Phf8 expression [26]. Whether HHcy affects PHF8 expression in human endothelial cells and whether miRs mediate effects of HHcy is unknown.
The mTOR signaling pathway is an important regulator of cellular metabolism and survival. When activated by nutrient abundance, it promotes anabolic processes such as protein biosynthesis and inhibits catabolic processes such as autophagy. Accumulating evidence suggests that mTOR signaling plays an important role in atherosclerosis and CVD [27,28].
Autophagy is an evolutionarily conserved cellular process involving degradation and recycling damaged proteins and organelles. Autophagy occurs continually at basal levels in cells and contributes to the maintenance of cellular homeostasis. Impaired autophagy flux causes the accumulation of damaged proteins and abnormal protein aggregates, and is associated with CVD, metabolic and neurodegenerative diseases [29].
We have previously demonstrated that HHcy activated mTOR signaling via a PHF8/H4K20me1-dependent mechanism and impaired autophagy in brains of mice genetically deficient in their ability to metabolize Hcy (Cbs-/- mice [30,31]) or HTL (Blmh-/- mice [32]; Pon1-/- mice [26]), and that Hcy metabolites such as HTL and N-Hcy activated mTOR signaling via the PHF8/H4K20me1-dependent mechanism, and impaired autophagy in cultured mouse neuroblastoma cells [26,31,32]. However, mechanisms by which HTL, N-Hcy, and Hcy may affect mTOR and autophagy in human vascular endothelial cells are not known.
We hypothesize that HHcy-associated metabolites inhibit the expression of histone demethylase PHF8 via a miR-mediated mechanism, which in turn influences mTOR and autophagy in human endothelial cells. To test this hypothesis, we studied how HTL, N-Hcy, and Hcy affect miRs targeting PHF8 in HUVEC. We also examined how miR inhibitors influence the expression of PHF8 and its downstream targets.
2. Materials and Methods
2.1. Cell culture and treatments
Human primary umbilical vein endothelial cells (HUVEC; ATCC, Manassas, VA, USA, Cat. # PCS-100-013) were grown (37°C, 5% CO2) in Vascular Cell Basal Medium (ATCC, Cat. # PCS-100-030) supplemented with 5% FBS and Endothelial Cell Growth Kit-VEGF (ATCC), and antibiotics (penicillin/streptomycin) (MilliporeSigma, Saint Louis, MO, USA).
After cells reached 70-80% confluency, the monolayers were washed with PBS (2-times) and overlaid with M199 medium without methionine (Thermo Fisher Scientific, Waltham, MA, USA) having 5% dialyzed fetal bovine serum (FBS; Millipore Sigma). Cell cultures were treated with N-Hcy-protein (prepared as described in ref. [12]), L-Hcy-thiolactone, or D,L-Hcy (Millipore Sigma) (concentrations indicated in figure legends) and incubated at 37°C in 5% CO2 atmosphere for 24 h; cells from untreated cultures were used as controls.
For miR inhibition experiments, HUVEC were transfected in Opti-MEM medium (Thermo Scientific) with specific miR inhibitors (MH10203 for hsa-miR-22-3p and MH13382 for hsa-miR-1220-3p; Thermo Scientific) using Lipofectamine RNAiMax. After 4-h-incubation, cells were washed with PBS (2-times) and overlaid with M199 medium w/o methionine (Thermo Scientific) containing 5% dialyzed FBS (Millipore Sigma). Cells were treated with D,L-Hcy, L-Hcy-thiolactone (Millipore Sigma), or N-Hcy-protein as above. Cells transfected with mirVana™ miRNA Mimic, Negative Control #1 (Thermo Scientific) were used as controls.
2.2. Western blots
Proteins were extracted with RIPA buffer (Millipore Sigma) according to manufacturer’s protocol, separated by SDS-PAGE on 10% gels (20 µg protein/lane), and transferred to PVDF membrane (Bio-Rad) for 20 min at 0.1 A, 25 V using Trans Blot Turbo Transfer System (Bio-Rad) as previously described [26,33]. After blocking with 5 % bovine serum albumin in TBST buffer (1h, room temperature), the membranes were incubated with anti-PHF8 (Abcam, ab36068), anti-H4K20me1 (Abcam ab177188), anti-mTOR (CS #2983), anti-pmTOR Ser2448 (CS, #5536), anti-ATG5 (CS, #12994), anti-ATG7 (CS, #8558), anti-BECN1 (CS, #3495), anti-p62 (CS, #39749), anti-LC3 (CS, #12741), anti-Gapdh (CS, #5174) for 16 hours. Membranes were washed three times with 1X Tris-Buffered Saline, 0.1% Tween 20 Detergent (TBS-T), 10 min each, and incubated with goat anti-rabbit IgG secondary antibody conjugated with horseradish peroxidase. Positive signals were detected using Western Bright Quantum-Advansta K12042-D20 and GeneGnome XRQ NPC chemiluminescence detection system. Bands intensity was calculated using Gene Tools program from Syngene.
2.3. mRNA and miR quantification by RT-qPCR
Total RNA was isolated using Trizol reagent (Millipore Sigma). cDNA synthesis was conducted using Revert Aid First cDNA Synthesis Kit (Thermo Fisher Scientific) according to manufacturer’s protocol. Nucleic acid concentration was measured using NanoDrop (Thermo Fisher Scientific). RT-qPCR was performed with SYBR Green Mix and CFX96 thermocycler (Bio-Rad). RT-qPCR primer sequences are listed in Table 1.
One μg of total RNA was used for the microRNA polyadenylation and reverse-transcription reactions. MicroRNAs (miRs) were polyadenylated and then reverse-transcribed using the miR 1st-Strand cDNA Synthesis Kit (Agilent Technologies) according to manufacturer’s protocol.
cDNA was used for RT-qPCR with miRNA QPCR Master Mix (Agilent Technologies). Universal reverse primers (Agilent Technologies) and unique miR-specific primers (same sequence as an analyzed miR) were used to quantify miR levels. Reactions were conducted on CFX96 thermocycler (Bio-Rad). 18S rRNA and U6 snRNA were used as references for miR quantification.
The 2(-ΔΔCt) method was used to calculate the relative expression levels [34]. Data analysis was performed with the CFX Manager™ Software, Microsoft Excel, and GraphPad Prism7.
2.4. Statistical analysis
Data as mean ± standard deviation (SD). Values for each experimental/treatment group were normalized to controls. Data were analyzed using one-way analysis of variance (ANOVA) with Tukey’s multiple comparisons post-test using GraphPad Prism7 software (GraphPad Holdings LLC, San Diego CA, USA, https://www.graphpad.com).
3. Results
3.1. Hcy-thiolactone, N-Hcy-protein, and Hcy downregulate the histone demethylase Phf8, upregulate the H4K20me1 epigenetic mark and mTOR, and impair autophagy in HUVEC
We have previously shown that HUVEC can metabolize Hcy to HTL and N-Hcy. To figure out how each of these metabolites affects the expression of Phf8 and its effects on downstream targets, we treated HUVECs with Hcy-thiolactone, N-Hcy-protein, and Hcy. We found significantly reduced PHF8 expression in HUVECs treated with 20 μM Hcy-thiolactone (0.69±0.10), Hcy (0.66±0.09), or 10 μM N-Hcy-protein (0.65±0.06) compared to control (1.00±0.08, P < 0.001; Figure 1A).
We also found significantly elevated levels of the methylated histone H4K20me1, a positive epigenetic regulator of mTOR expression, in HUVEC treated with 20 μM Hcy-thiolactone (1.94±0.14), Hcy (1.78±0.17), or 10 μM N-Hcy-protein (1.51±0.12) compared to untreated control cells (1.00±0.09, P < 0.0001; Figure 1B).
The expression of mTOR was significantly upregulated in HUVEC by treatments with these metabolites: 20 μM Hcy-thiolactone (1.95±0.15), Hcy (1.80±0.28), or 10 μM N-Hcy-protein (1.44±0.09) compared to untreated control cells (1.00±0.14, P < 0.0001) (Figure 1C). As mTOR is activated by phosphorylation, we quantified the active form of mTOR, phosphorylated at Ser2448 (pmTOR). Levels of pmTOR were also significantly upregulated by these treatments: 20 μM Hcy-thiolactone (1.65±0.22), Hcy (1.48±0.08), 10 μM N-Hcy-protein (1.56±0.11) compared to control (1.00±0.12, P < 0.0001) (Figure 1D).
The regulators of autophagosome assembly BECN1, ATG5, and ATG7 were significantly downregulated (by 16-25%, P < 0.001; Figure 1E, Figure 1D and Figure 1G, respectively) in HUVECs treated with Hcy-thiolactone, N-Hcy-protein, or Hcy. Similar effects were seen in HUVECs treated with 10-fold higher concentrations of Hcy-thiolactone and Hcy (200 μM), or 2-fold higher N-Hcy-protein (20 μM) (Figure 1).
To find out whether Hcy metabolites affect the autophagy flux, we also quantified microtubule-associated protein 1 light chain 3 (LC3) and p62, a receptor for degradation of ubiquitinated substrates. We found significant reductions in unlipidated LC3-I (Figure 1I) and lipidated LC3-II (Figure 1J) in HUVECs treated with Hcy, HTL, or N-Hcy. The LC3-II/LC3-I ratio, a measure of the autophagy flux, was significantly reduced in cells treated with Hcy or HTL but not N-Hcy (Figure 1K), while p62 was upregulated only in cells treated with N-Hcy but not with HTL or Hcy (Figure 1H). These findings suggest that Hcy metabolites can impair autophagy flux in a metabolite-specific manner.
These findings show that Hcy and its downstream metabolites, Hcy-thiolactone and N-Hcy-protein, can influence the expression of PHF8 and its downstream targets, mTOR signaling-related and autophagy-related proteins.
3.2. Hcy-thiolactone, N-Hcy-protein, and Hcy downregulate PHF8 by upregulating the expression of miR-22-3p and miR-1229-3p targeting PHF8
To elucidate the mechanism by which Hcy metabolites affect PHF8 expression we first quantified PHF8 mRNA to find out whether Hcy metabolites exert transcriptional control on PHF8 expression in HUVECs. We found that PHF8 mRNA was significantly downregulated in HUVECs treated with 20 μM Hcy-thiolactone (0.49±0.11), Hcy (0.60±0.09), or 10 μM N-Hcy-protein (0.42±0.01) compared to untreated control (1.00±0.08, P < 0.001) (Figure 2A), reflecting similar downregulation seen in the PHF8 protein levels (Figure 1A). These findings show that effects of Hcy metabolites on PHF8 expression are transcriptional.
To find out whether the transcriptional downregulation of PHF8 caused by Hcy metabolites is mediated by PHF8 mRNA-targeting miRs (Figure 3), we quantified miR-22-3p and miR-1229-3p in HUVECs treated with HTL, N-Hcy, or Hcy. We found significantly upregulated miR-22-3p levels in HUVECs treated with 20 μM Hcy-thiolactone (1.57±0.28), Hcy (1.74±0.08), or 10 μM N-Hcy-protein (1.46±0.09) compared to control (1.00±0.13, P < 0.001) (Figure 2B). Treatments of HUVECs with 10-fold higher concentrations of Hcy-thiolactone or Hcy (200 μM), or 2-fold higher N-Hcy-protein (20 μM) had similar stimulatory effects on miR-22-3p expression (Figure 2B).
We also found significantly upregulated miR-1229-3p levels in HUVECs treated with 20 μM Hcy-thiolactone (1.77±0.32), Hcy (1.89±0.36), or 10 μM N-Hcy-protein (1.69±0.20) compared to control (1.00±0.28, P < 0.05) (Figure 2C). Treatments of HUVECs with 10-fold higher concentrations of Hcy-thiolactone or Hcy (200 μM), or 2-fold higher N-Hcy-protein (20 μM) had similar stimulatory effects on miR-1229-3p expression (P < 0.01; Figure 2C).
3.3. Treatments with miR inhibitors ameliorate effects of Hcy-thiolactone, N-Hcy-protein, and Hcy on miR-22-3p, miR-1229, and PHF8 expression
To verify these findings, we carried out experiments with PHF8 miR inhibitors. We found that transfections of HUVECs with miR-22 inhibitor significantly reduced miR-22-3p levels (6.0±0.7-fold, to 17±2 % vs. untreated control, P < 0.0001; Figure 2D) while transfections with miR-1229 inhibitor reduced miR-1229-3p levels (4.5±1.6-fold, to 22± 6% vs. control, P < 0.0001; Figure 2E).
We also found that treatments of HUVEC with miR-22 inhibitor significantly increased PHF8 mRNA (3.2±-fold vs. untreated control, P < 0.01; Figure 2F) and PHF8 protein level (1.25±-fold vs. untreated control, P < 0.001; Figure 2G). Treatments with miR-1229 inhibitor significantly increased PHF8 mRNA (2.64±0.15-fold vs. untreated control, P < 0.001; Figure 2H) and protein level (1.27±0.15-fold vs. untreated control, P < 0.01; Figure 2I).
At the same time, inhibitors of miR-22 and miR-1229 ameliorated stimulatory effects of HTL, N-Hcy, and Hcy on miR-22-3p (Figure 2D) and miR-1229-3p expression (Figure 2E) seen in the absence of these inhibitors (Figure 2B and Figure 2C, respectively).
Inhibitors of miR-22 and miR-1229 also ameliorated inhibitory effects of HTL, N-Hcy, and Hcy on PHF8 mRNA (Figure 2F and Figure 2H, respectively) and PHF8 protein expression (Figure 2G and Figure 2I, respectively) seen in the absence of these inhibitors (PHF8 mRNA, Figure 2A; PHF8 protein, Figure 1A).
Effects of miR inhibitors are propagated to downstream targets of PHF8
As PHF8 is a master regulator of mTOR expression, which in turn influences autophagy, we predicted that the primary effect of miR-22 and miR-1229 inhibitors on PHF8 will be propagated to targets downstream of PHF8. To examine this prediction, we quantified mTOR- and autophagy-related mRNAs and proteins in HUVEC transfected with miR inhibitors. We found that the miR-22 inhibitor significantly downregulated the expression of mTOR mRNA (0.74±-fold vs. control, P < 0.01; Figure 4A). Autophagy-related mRNAs were upregulated: ATG5 (1.63±0.20-fold vs. control, P < 0.05; Figure 4B), ATG7 (1.57±0.09-fold vs. control, P < 0.01; Figure 4C), BECN1 (1.78±0.24-fold vs. control, P < 0.01; Figure 4D), and LC3 mRNAs were upregulated (1.79±0.41-fold vs. control, P < 0.05; Figure 4E). p62 mRNA was not affected by miR-22 inhibitor (Figure 4F).
The effect of miR-22 inhibitor on PHF8 was also propagated to mTOR- and autophagy-related proteins. Specifically, the miR-22 inhibitor significantly downregulated H4K20me1 (P < 0.01, Figure 4G), mTOR (P < 0.01, Figure 4H), and pmTOR (P < 0.01, Figure 4I) protein levels vs. control. Autophagy-related proteins ATG7 (P < 0.001, Figure 4J) and BECN1 (P < 0.05, Figure 4K) were significantly upregulated while p62 protein (P < 0.05, Figure 4L) was downregulated by miR-22 inhibitor.
We also found that miR-1229 inhibitor significantly downregulated the expression of mTOR mRNA (0.58±0.10-fold, P < 0.01; Figure 5A). Autophagy-related mRNAs were upregulated: ATG5 (1.72±0.11-fold, P < 0.001; Figure 5B), ATG7 (1.66±0.23-fold, P < 0.001; Figure 5C), BECN1 (1.72±0.21-fold, P < 0.01; Figure 5D), and LC3 (1.58±0.20-fold, P < 0.01; Figure 5E). p62 mRNA tended to be upregulated by miR-22 inhibitor (1.24±0.19-fold vs. control, P < 0.061; Figure 5F).
The effects of miR-1229 inhibitor on PHF8 were also propagated to mTOR- and autophagy-related proteins. For example, miR-1229 inhibitor significantly downregulated H4K20me1 (P < 0.001, Figure 5G), mTOR (P < 0.05, Figure 5H), and pmTOR (P < 0.05, Figure 5I) protein levels. Autophagy-related proteins ATG5 (P < 0.05, Figure 5J), lipidated LC3-II (P < 0.05, Figure 5K), LC3-II/LC3-I ratio (P < 0.05, Figure 5L) were significantly upregulated by miR-1229 inhibitor.
4. Discussion
HHcy has been associated with CVD in many studies [35]. Endothelial dysfunction plays a central role in CVD and is a common finding in HHcy in humans and in animal models [3,4]. To understand the mechanisms by which HHcy disrupts normal cellular function and ultimately causes disease, we studied in HUVECs, an often-used model of vascular cells [11,36], how Hcy and its metabolites Hcy-thiolactone and N-Hcy-protein, which accumulate in HHcy, affect the expression of miR-22 and miR-1229, regulators of histone demethylase PHF8. We also studied the downstream consequences of these effects on mTOR signaling and autophagy, processes important for vascular homeostasis [36]. Our data show that Hcy and its metabolites, HTL and N-Hcy, upregulate the expression of miR-22 and miR-1229, which downregulate PHF8 expression at mRNA and protein levels in HUVECs. The Hcy metabolites-induced downregulation of PHF8 elevates H4K20me1, which causes upregulation of mTOR expression and so the inhibition of autophagy. The ability of Hcy, HTL, and N-Hcy to upregulate miR-22 and miR-1229 expression and thus affect the PHF8/H4K20me1/mTOR/autophagy pathway, important for vascular homeostasis, can explain the susceptibility of human endothelial cells to HHcy-induced endothelial dysfunction and atherosclerosis.
Studies of metabolic conversions of Hcy led to the discoveries of HTL and N-Hcy in human cells and the proposal by one of us (HJ) that these metabolites are responsible for the pathological consequences of HHcy [37]. These discoveries were confirmed in HUVEC [11] and later in mice [38,39] and humans [38,40,41]. More recent clinical studies by one of us (HJ) have shown that HTL is a risk predictor of myocardial infarction in patients with coronary artery disease, providing a support to the hypothesis that Hcy-thiolactone is mechanistically involved in CVD [42]. Our present findings that HTL and N-Hcy, as well as Hcy, upregulate miR-22-3p and miR-1229-3p in HUVECs thereby starting a pathway leading to impaired autophagy, suggest that these miRs can also be associated with endothelial dysfunction and supply a new mechanistic explanation of the involvement of HHcy in CVD.
PHF8 is a transcription activator that can bind to promoters of about one-third of human genes [43]. Thus, dysregulation of PHF8 expression can affect many biological processes and is likely to cause disease. Indeed, PHF8 depletion has been linked to neurological disorders such as autism spectrum disorder, attention deficit hyperactivity disorder, severe intellectual disability [21,22] and Alzheimer’s disease [26] while PHF8 upregulation is a key factor in variety of cancers [24]. Our present findings that PHF8 expression is downregulated by Hcy, HTL, and N-Hcy metabolites in HUVEC resulting in dysregulated mTOR signaling and impaired autophagy flux in HUVEC, suggest that PHF8 depletion can also lead to vascular disease. This suggestion is supported by findings of other investigators showing that autophagy flux controls endothelial cells homeostasis while impaired autophagy can promote pro-atherogenic phenotype [36].
Hcy, HTL, and N-Hcy metabolites similarly downregulated PHF8 expression, upregulated H4K20me1 levels, and the expression of TOR and its active form pmTOR (Figure 1A-D). These metabolites also similarly downregulated autophagy related BECN1 and ATG5 expression (Figure 1EFigure F). In contrast, other autophagy related proteins were affected in a metabolite-specific manner. For example, ATG7 was downregulated by N-Hcy and HTL but not by Hcy, p62 only by N-Hcy, and the autophagy flux LC3-II/LC3-I by HTL and Hcy but not by N-Hcy. These findings suggest that Hcy, HTL, and N-Hcy can influence the expression of ATG7, p62, LC3-I and LC3-II independently of their effects on PHF8.
During the past two decades, miRs have been identified as key regulators of the pathophysiological processes involved in atherosclerosis such as signaling (NF-κB, MAPK, SOCS, SDF-1/CXCR4, TGF-β, BMP, TLR) and lipid homeostasis pathways [44]. The HDL-carried miRNAs can mediate extracellular signaling by repressing genes in target tissues and HDL interaction with macrophages and endothelial cells may also result in miRNA exchange. Our present findings show that, Hcy metabolites, which are associated with CVD, upregulate two miRs targeting PHF8 in HUVEC (Figure 2): miR-22-3p (https://mirtarbase.cuhk.edu.cn/~miRTarBase/miRTarBase_2022/php/detail.php?mirtid=MIRT732854) and miR-1229-3p (https://mirtarbase.cuhk.edu.cn/~miRTarBase/miRTarBase_2022/php/detail.php?mirtid=MIRT036321) (Figure 3). Of these, miR-22-3p has been associated with cancer, neuropathy [24], and heart failure [45], while miR-1229-3p has been associated with bladder neoplasms and risk of Alzheimer’s disease [25]. We also showed that Hcy metabolite-induced miR-22-3p and miR-1229-3p expression lowered histone demethylase PHF8 and upregulated methylated histone H4K20me1, a key regulator that increased mTOR expression, which in turn inhibited autophagy in HUVEC. These findings suggest that miR-dependent dysregulation of mTOR signaling pathway and impaired autophagy can be involved in endothelial dysfunction and atherosclerosis induced by Hcy metabolites.
In conclusion, our findings define a new miR-mediated mechanism by which HHcy can induce endothelial dysfunction.
Author Contributions
Conceptualization, Hieronim Jakubowski; Data curation, Łukasz Witucki and Hieronim Jakubowski; Formal analysis, Łukasz Witucki and Hieronim Jakubowski; Funding acquisition, Hieronim Jakubowski; Investigation, Łukasz Witucki and Hieronim Jakubowski; Methodology, Łukasz Witucki and Hieronim Jakubowski; Project administration, Hieronim Jakubowski; Resources, Hieronim Jakubowski; Validation, Łukasz Witucki and Hieronim Jakubowski; Visualization, Hieronim Jakubowski; Writing – original draft, Hieronim Jakubowski; Writing – review & editing, Łukasz Witucki and Hieronim Jakubowski.
Funding
This research was funded by the National Science Center, Poland grants 2016/23/N/NZ3/01216 (ŁW), 2018/29/B/NZ4/00771 (HJ), 2019/33/B/NZ4/01760 (HJ), 2021/43/B/NZ4/00339 (HJ) and the American Heart Association grant 17GRNT32910002 (HJ).
Institutional Review Board Statement
Not applicable.
Informed Consent Statement
Not applicable.
Data Availability Statement
The data that support the findings of this study are available in the methods of this article.
Conflicts of Interest
The authors declare no conflict of interest. The funders had no role in the design of the study; in the collection, analyses, or interpretation of data; in the writing of the manuscript; nor in the decision to publish the results.
References
- Libby, P. Inflammation in atherosclerosis. Nature 2002, 420, (6917), 868-74.
- Ross, R. Atherosclerosis--an inflammatory disease. N Engl J Med 1999, 340, (2), 115-26.
- Lentz, S. R. Mechanisms of homocysteine-induced atherothrombosis. J Thromb Haemost 2005, 3, (8), 1646-54.
- Dayal, S.; Lentz, S. R. Murine models of hyperhomocysteinemia and their vascular phenotypes. Arterioscler Thromb Vasc Biol 2008, 28, (9), 1596-605.
- Esse, R.; Barroso, M.; Tavares de Almeida, I.; Castro, R. The Contribution of Homocysteine Metabolism Disruption to Endothelial Dysfunction: State-of-the-Art. Int J Mol Sci 2019, 20, (4).
- Poddar, R.; Sivasubramanian, N.; DiBello, P. M.; Robinson, K.; Jacobsen, D. W. Homocysteine induces expression and secretion of monocyte chemoattractant protein-1 and interleukin-8 in human aortic endothelial cells: implications for vascular disease. Circulation 2001, 103, (22), 2717-23.
- Kerkeni, M.; Tnani, M.; Chuniaud, L.; Miled, A.; Maaroufi, K.; Trivin, F. Comparative study on in vitro effects of homocysteine thiolactone and homocysteine on HUVEC cells: evidence for a stronger proapoptotic and proinflammative homocysteine thiolactone. Mol Cell Biochem 2006, 291, (1-2), 119-26.
- Jakubowski, H. Homocysteine Modification in Protein Structure/Function and Human Disease. Physiol Rev 2019, 99, (1), 555-604.
- Sikora, M.; Lewandowska, I.; Marczak, L.; Bretes, E.; Jakubowski, H. Cystathionine beta-synthase deficiency: different changes in proteomes of thrombosis-resistant Cbs(-/-) mice and thrombosis-prone CBS(-/-) humans. Sci Rep 2020, 10, (1), 10726.
- Sikora, M.; Jakubowski, H. Changes in redox plasma proteome of Pon1-/- mice are exacerbated by a hyperhomocysteinemic diet. Free Radic Biol Med 2021, 169, 169–180. [Google Scholar]
- Jakubowski, H.; Zhang, L.; Bardeguez, A.; Aviv, A. Homocysteine thiolactone and protein homocysteinylation in human endothelial cells: implications for atherosclerosis. Circ Res 2000, 87, (1), 45-51.
- Gurda, D.; Handschuh, L.; Kotkowiak, W.; Jakubowski, H. Homocysteine thiolactone and N-homocysteinylated protein induce pro-atherogenic changes in gene expression in human vascular endothelial cells. Amino Acids 2015, 47, 1319–39. [Google Scholar]
- Olejniczak, M.; Urbanek, M. O.; Jaworska, E.; Witucki, L.; Szczesniak, M. W.; Makalowska, I.; Krzyzosiak, W. J. Sequence-non-specific effects generated by various types of RNA interference triggers. Biochim Biophys Acta 2016, 1859, 306–14. [Google Scholar] [CrossRef]
- Starega-Roslan, J.; Krzyzosiak, W. J. Analysis of microRNA length variety generated by recombinant human Dicer. Methods Mol Biol 2013, 936, 21–34. [Google Scholar] [PubMed]
- Starega-Roslan, J.; Galka-Marciniak, P.; Krzyzosiak, W. J. Nucleotide sequence of miRNA precursor contributes to cleavage site selection by Dicer. Nucleic Acids Res 2015, 43, 10939–51. [Google Scholar] [CrossRef] [PubMed]
- Starega-Roslan, J.; Koscianska, E.; Kozlowski, P.; Krzyzosiak, W. J. The role of the precursor structure in the biogenesis of microRNA. Cell Mol Life Sci 2011, (17), 2859–71. [Google Scholar]
- Stroynowska-Czerwinska, A.; Fiszer, A.; Krzyzosiak, W. J. The panorama of miRNA-mediated mechanisms in mammalian cells. Cell Mol Life Sci 2014, 71, 2253–70. [Google Scholar] [PubMed]
- Minjares, M.; Wu, W.; Wang, J. M. Oxidative Stress and MicroRNAs in Endothelial Cells under Metabolic Disorders. Cells 2023, 12, (9).
- Zhou, S. S.; Jin, J. P.; Wang, J. Q.; Zhang, Z. G.; Freedman, J. H.; Zheng, Y.; Cai, L. miRNAS in cardiovascular diseases: potential biomarkers, therapeutic targets and challenges. Acta Pharmacol Sin 2018, 39, 1073–1084. [Google Scholar] [PubMed]
- Mens, M. M. J.; Heshmatollah, A.; Fani, L.; Ikram, M. A.; Ikram, M. K.; Ghanbari, M. Circulatory MicroRNAs as Potential Biomarkers for Stroke Risk: The Rotterdam Study. Stroke 2021, 52, 945–953. [Google Scholar]
- Sobering, A. K.; Bryant, L. M.; Li, D.; McGaughran, J.; Maystadt, I.; Moortgat, S.; Graham, J. M., Jr.; van Haeringen, A.; Ruivenkamp, C.; Cuperus, R.; Vogt, J.; Morton, J.; Brasch-Andersen, C.; Steenhof, M.; Hansen, L. K.; Adler, E.; Lyonnet, S.; Pingault, V.; Sandrine, M.; Ziegler, A.; Donald, T.; Nelson, B.; Holt, B.; Petryna, O.; Firth, H.; McWalter, K.; Zyskind, J.; Telegrafi, A.; Juusola, J.; Person, R.; Bamshad, M. J.; Earl, D.; University of Washington Center for Mendelian, G.; Tsai, A. C.; Yearwood, K. R.; Marco, E.; Nowak, C.; Douglas, J.; Hakonarson, H.; Bhoj, E. J. Variants in PHF8 cause a spectrum of X-linked neurodevelopmental disorders and facial dysmorphology. HGG Adv 2022, 3, 100102. [Google Scholar]
- Laumonnier, F.; Holbert, S.; Ronce, N.; Faravelli, F.; Lenzner, S.; Schwartz, C. E.; Lespinasse, J.; Van Esch, H.; Lacombe, D.; Goizet, C.; Phan-Dinh Tuy, F.; van Bokhoven, H.; Fryns, J. P.; Chelly, J.; Ropers, H. H.; Moraine, C.; Hamel, B. C.; Briault, S. Mutations in PHF8 are associated with X linked mental retardation and cleft lip/cleft palate. J Med Genet 2005, (10), 780–6. [Google Scholar] [CrossRef] [PubMed]
- Chen, X.; Wang, S.; Zhou, Y.; Han, Y.; Li, S.; Xu, Q.; Xu, L.; Zhu, Z.; Deng, Y.; Yu, L.; Song, L.; Chen, A. P.; Song, J.; Takahashi, E.; He, G.; He, L.; Li, W.; Chen, C. D. Phf8 histone demethylase deficiency causes cognitive impairments through the mTOR pathway. Nat Commun 2018, 9, 114. [Google Scholar] [CrossRef] [PubMed]
- Cai, M. Z.; Wen, S. Y.; Wang, X. J.; Liu, Y.; Liang, H. MYC Regulates PHF8, Which Promotes the Progression of Gastric Cancer by Suppressing miR-22-3p. Technol Cancer Res Treat 2020, 19, 1533033820967472. [Google Scholar] [CrossRef]
- Ghanbari, M.; Ikram, M. A.; de Looper, H. W. J.; Hofman, A.; Erkeland, S. J.; Franco, O. H.; Dehghan, A. Genome-wide identification of microRNA-related variants associated with risk of Alzheimer's disease. Sci Rep 2016, 6, 28387. [Google Scholar] [PubMed]
- Witucki, L.; Jakubowski, H. Depletion of Paraoxonase 1 (Pon1) Dysregulates mTOR, Autophagy, and Accelerates Amyloid Beta Accumulation in Mice. Cells 2023, 12, (5).
- Kaldirim, M.; Lang, A.; Pfeiler, S.; Fiegenbaum, P.; Kelm, M.; Bonner, F.; Gerdes, N. Modulation of mTOR Signaling in Cardiovascular Disease to Target Acute and Chronic Inflammation. Front Cardiovasc Med 2022, 9, 907348. [Google Scholar]
- Samidurai, A.; Kukreja, R. C.; Das, A. Emerging Role of mTOR Signaling-Related miRNAs in Cardiovascular Diseases. Oxid Med Cell Longev 2018, 2018, 6141902. [Google Scholar]
- Kim, K. A.; Shin, D.; Kim, J. H.; Shin, Y. J.; Rajanikant, G. K.; Majid, A.; Baek, S. H.; Bae, O. N. Role of Autophagy in Endothelial Damage and Blood-Brain Barrier Disruption in Ischemic Stroke. Stroke 2018, 49, 1571–1579. [Google Scholar] [CrossRef]
- Khayati, K.; Antikainen, H.; Bonder, E. M.; Weber, G. F.; Kruger, W. D.; Jakubowski, H.; Dobrowolski, R. The amino acid metabolite homocysteine activates mTORC1 to inhibit autophagy and form abnormal proteins in human neurons and mice. FASEB J 2017, (2), 598–609. [Google Scholar] [CrossRef]
- Witucki, L., Jakubowski, H. Homocysteine Metabolites Inhibit Autophagy and Elevate Amyloid Beta by Impairing Phf8/H4K20me1-dependent Epigenetic Regulation of mTOR in Cystathionine β-Synthase-Deficient Mice. bioRxiv 2023. [CrossRef]
- Witucki, L. Witucki, L., Borowczyk, K., Suszyńska-Zajczyk, J., Warzych, E., Pawlak, P., Jakubowski, H., Depletion of bleomycin hydrolase (Blmh) downregulates histone demethylase Phf8, impairs mTOR signaling/autophagy, accelerates amyloid beta accumulation, and induces neurological deficits in mice bioRxiv 2023. [CrossRef]
- Witucki, L.; Kurpik, M.; Jakubowski, H.; Szulc, M.; Lukasz Mikolajczak, P.; Jodynis-Liebert, J.; Kujawska, M. Neuroprotective Effects of Cranberry Juice Treatment in a Rat Model of Parkinson's Disease. Nutrients, 2022; 14. [Google Scholar]
- Livak, K. J.; Schmittgen, T. D. Analysis of relative gene expression data using real-time quantitative PCR and the 2(-Delta Delta C(T)) Method. Methods 2001, 25, 402–8. [Google Scholar] [CrossRef]
- Smith, A. D.; Refsum, H. Homocysteine - from disease biomarker to disease prevention. J Intern Med 2021, 290, 826–854. [Google Scholar] [CrossRef]
- Mameli, E.; Martello, A.; Caporali, A. Autophagy at the interface of endothelial cell homeostasis and vascular disease. FEBS J 2022, 289, 2976–2991. [Google Scholar] [CrossRef] [PubMed]
- Jakubowski, H. Metabolism of homocysteine thiolactone in human cell cultures. Possible mechanism for pathological consequences of elevated homocysteine levels. J Biol Chem 1997, 272, 1935–42. [Google Scholar] [CrossRef] [PubMed]
- Chwatko, G.; Boers, G. H.; Strauss, K. A.; Shih, D. M.; Jakubowski, H. Mutations in methylenetetrahydrofolate reductase or cystathionine beta-synthase gene, or a high-methionine diet, increase homocysteine thiolactone levels in humans and mice. Faseb J 2007, 21, 1707–13. [Google Scholar] [CrossRef] [PubMed]
- Jakubowski, H.; Perla-Kajan, J.; Finnell, R. H.; Cabrera, R. M.; Wang, H.; Gupta, S.; Kruger, W. D.; Kraus, J. P.; Shih, D. M. Genetic or nutritional disorders in homocysteine or folate metabolism increase protein N-homocysteinylation in mice. Faseb J 2009, 23, 1721–7. [Google Scholar] [CrossRef] [PubMed]
- Jakubowski, H.; Boers, G. H.; Strauss, K. A. Mutations in cystathionine {beta}-synthase or methylenetetrahydrofolate reductase gene increase N-homocysteinylated protein levels in humans. FASEB J 2008, 22, 4071–6. [Google Scholar] [CrossRef]
- Perla-Kajan, J.; Stanger, O.; Luczak, M.; Ziolkowska, A.; Malendowicz, L. K.; Twardowski, T.; Lhotak, S.; Austin, R. C.; Jakubowski, H. Immunohistochemical detection of N-homocysteinylated proteins in humans and mice. Biomed Pharmacother 2008, 62, 473–9. [Google Scholar] [CrossRef]
- Borowczyk, K.; Piechocka, J.; Glowacki, R.; Dhar, I.; Midtun, O.; Tell, G. S.; Ueland, P. M.; Nygard, O.; Jakubowski, H. Urinary excretion of homocysteine thiolactone and the risk of acute myocardial infarction in coronary artery disease patients: the WENBIT trial. J Intern Med 2019, 285, 232–244. [Google Scholar] [CrossRef]
- Qi, H. H.; Sarkissian, M.; Hu, G. Q.; Wang, Z.; Bhattacharjee, A.; Gordon, D. B.; Gonzales, M.; Lan, F.; Ongusaha, P. P.; Huarte, M.; Yaghi, N. K.; Lim, H.; Garcia, B. A.; Brizuela, L.; Zhao, K.; Roberts, T. M.; Shi, Y. Histone H4K20/H3K9 demethylase PHF8 regulates zebrafish brain and craniofacial development. Nature 2010, 466, 503–7. [Google Scholar] [CrossRef]
- Feinberg, M. W.; Moore, K. J. MicroRNA Regulation of Atherosclerosis. Circ Res 2016, 118, 703–20. [Google Scholar]
- Lu, W.; Liu, X.; Zhao, L.; Yan, S.; Song, Q.; Zou, C.; Li, X. MiR-22-3p in exosomes increases the risk of heart failure after down-regulation of FURIN. Chem Biol Drug Des 2023, 101, 550–567. [Google Scholar] [CrossRef]
Figure 1.
N-Hcy-protein, Hcy-thiolactone, and Hcy downregulate Phf8, upregulate the H4K20me1 epigenetic mark, mTOR signaling, and impair autophagy in HUVEC. The cells were treated with indicated concentrations of N-Hcy-protein (N-Hcy) or Hcy-thiolactone (HTL) for 24 h at 37⁰C. Bar graphs illustrating the quantification of PHF8 (A), H4K20me1 (B), mTOR (C), pmTOR (D), BECN1 (E), ATG5 (F), Atg7 (G), p62 (H), LC3-I (I), LC3-II (J), LC3-I/LC3-II ratio (K) based on Western blot analyses are shown. GAPDH was used as a reference protein. Representative pictures of Western blots are shown in panel (L). Each assay was repeated three times in three independent experiments. Mean SD values for each treatment group are shown. P-values were calculated by one-way ANOVA with Tukey’s multiple comparisons test. * P < 0.05, ** P < 0.01, *** P < 0.001. NS, not significant.
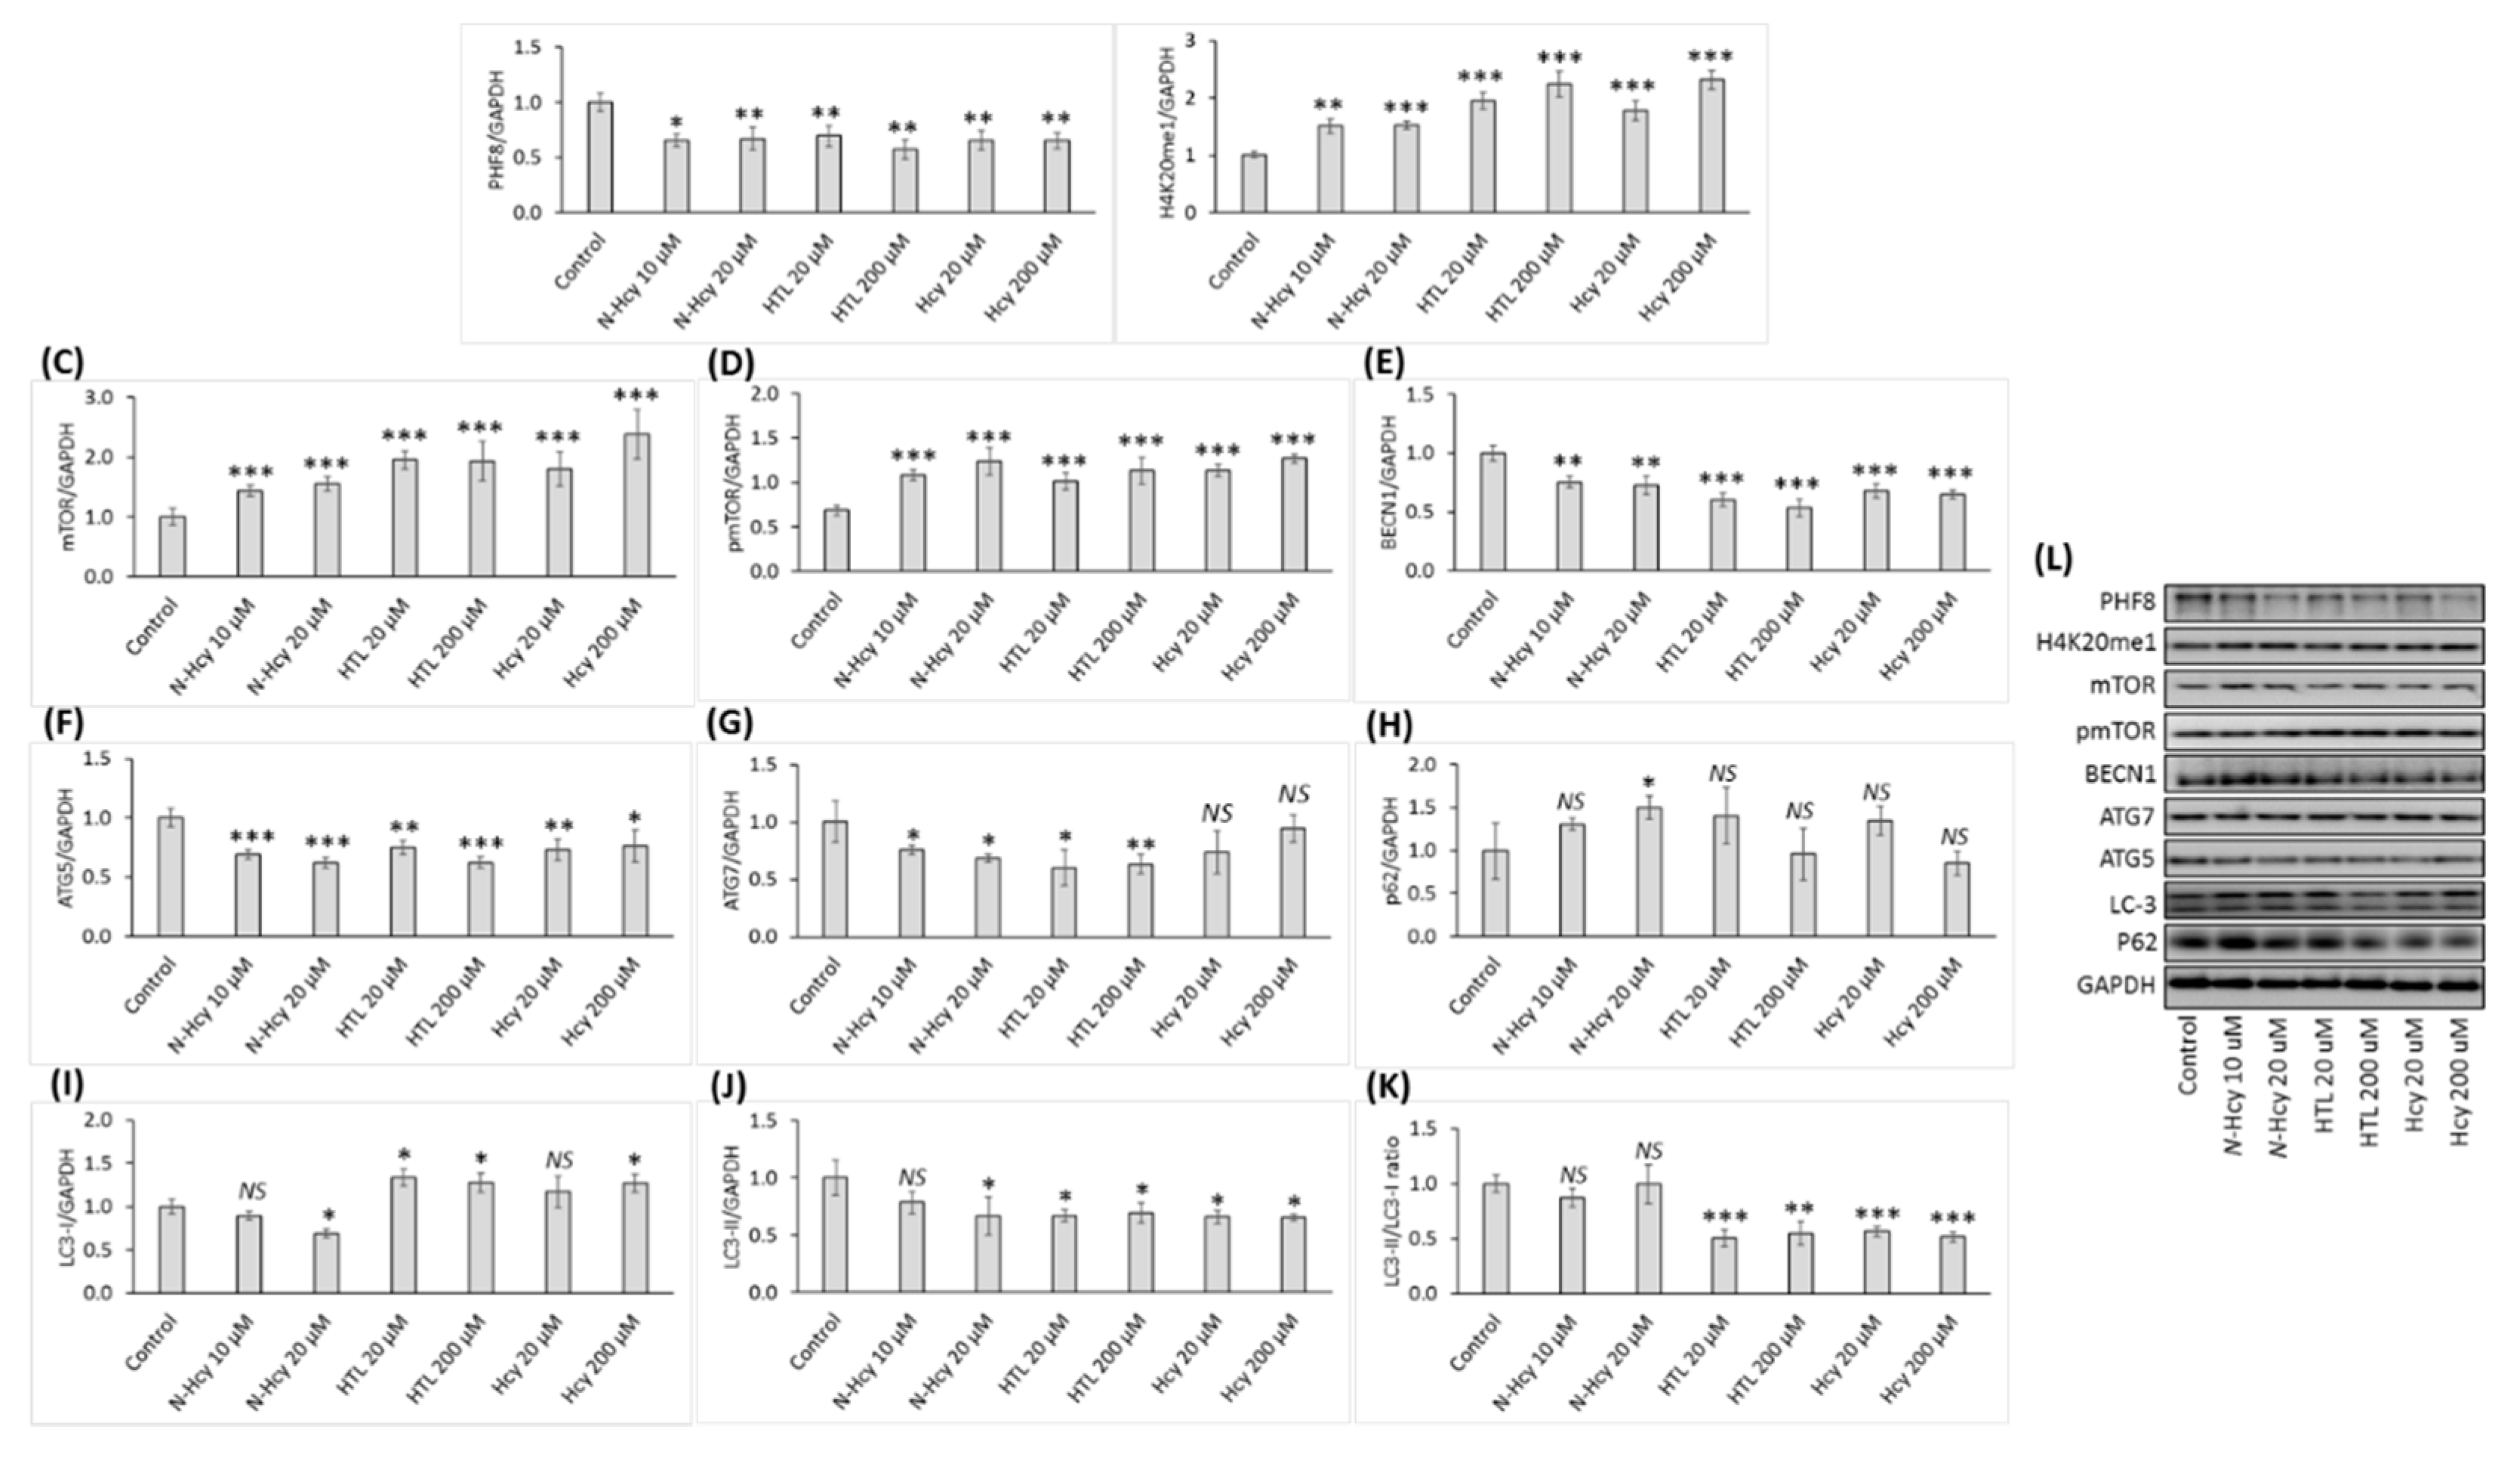
Figure 2.
Effects of N-Hcy-protein, Hcy-thiolactone, and Hcy on the expression of PHF8, miR-22-3p, and miR-1229-3p in the absence (A – C) or presence (D - I) of miR inhibitors. (A - C) HUVEC were treated with N-Hcy-protein (N-Hcy), Hcy-thiolactone (HTL), or Hcy for 24 h and the expression of PHF8 mRNA (A), miR-22-3p (B), and miR-1229-3p (C) was quantified by RT-qPCR. (D - I) HUVEC were transfected with inhibitors of miR-22-3p (D, F, G) and miR-1229-3p (E, H, I) for 4 h and then treated with N-Hcy-protein, Hcy-thiolactone, or Hcy for 24 h. The expression of miR-22-3p (D), and miR-1229-3p (E), and PHF8 mRNA (F, H) was quantified by RT-qPCR. GAPDH mRNA was used as a reference for PHF8 mRNA. 18S rRNA and U6 snRNA were used as references for miR quantification. Panels (G, I) show the expression of PHF8 protein quantified by Western blotting. GAPDH was used as a reference protein. Representative pictures of Western blots are shown in panels (J) and (K). P-values were calculated by one-way ANOVA with Tukey’s multiple comparisons test. * P < 0.05, ** P < 0.01, *** P < 0.001.
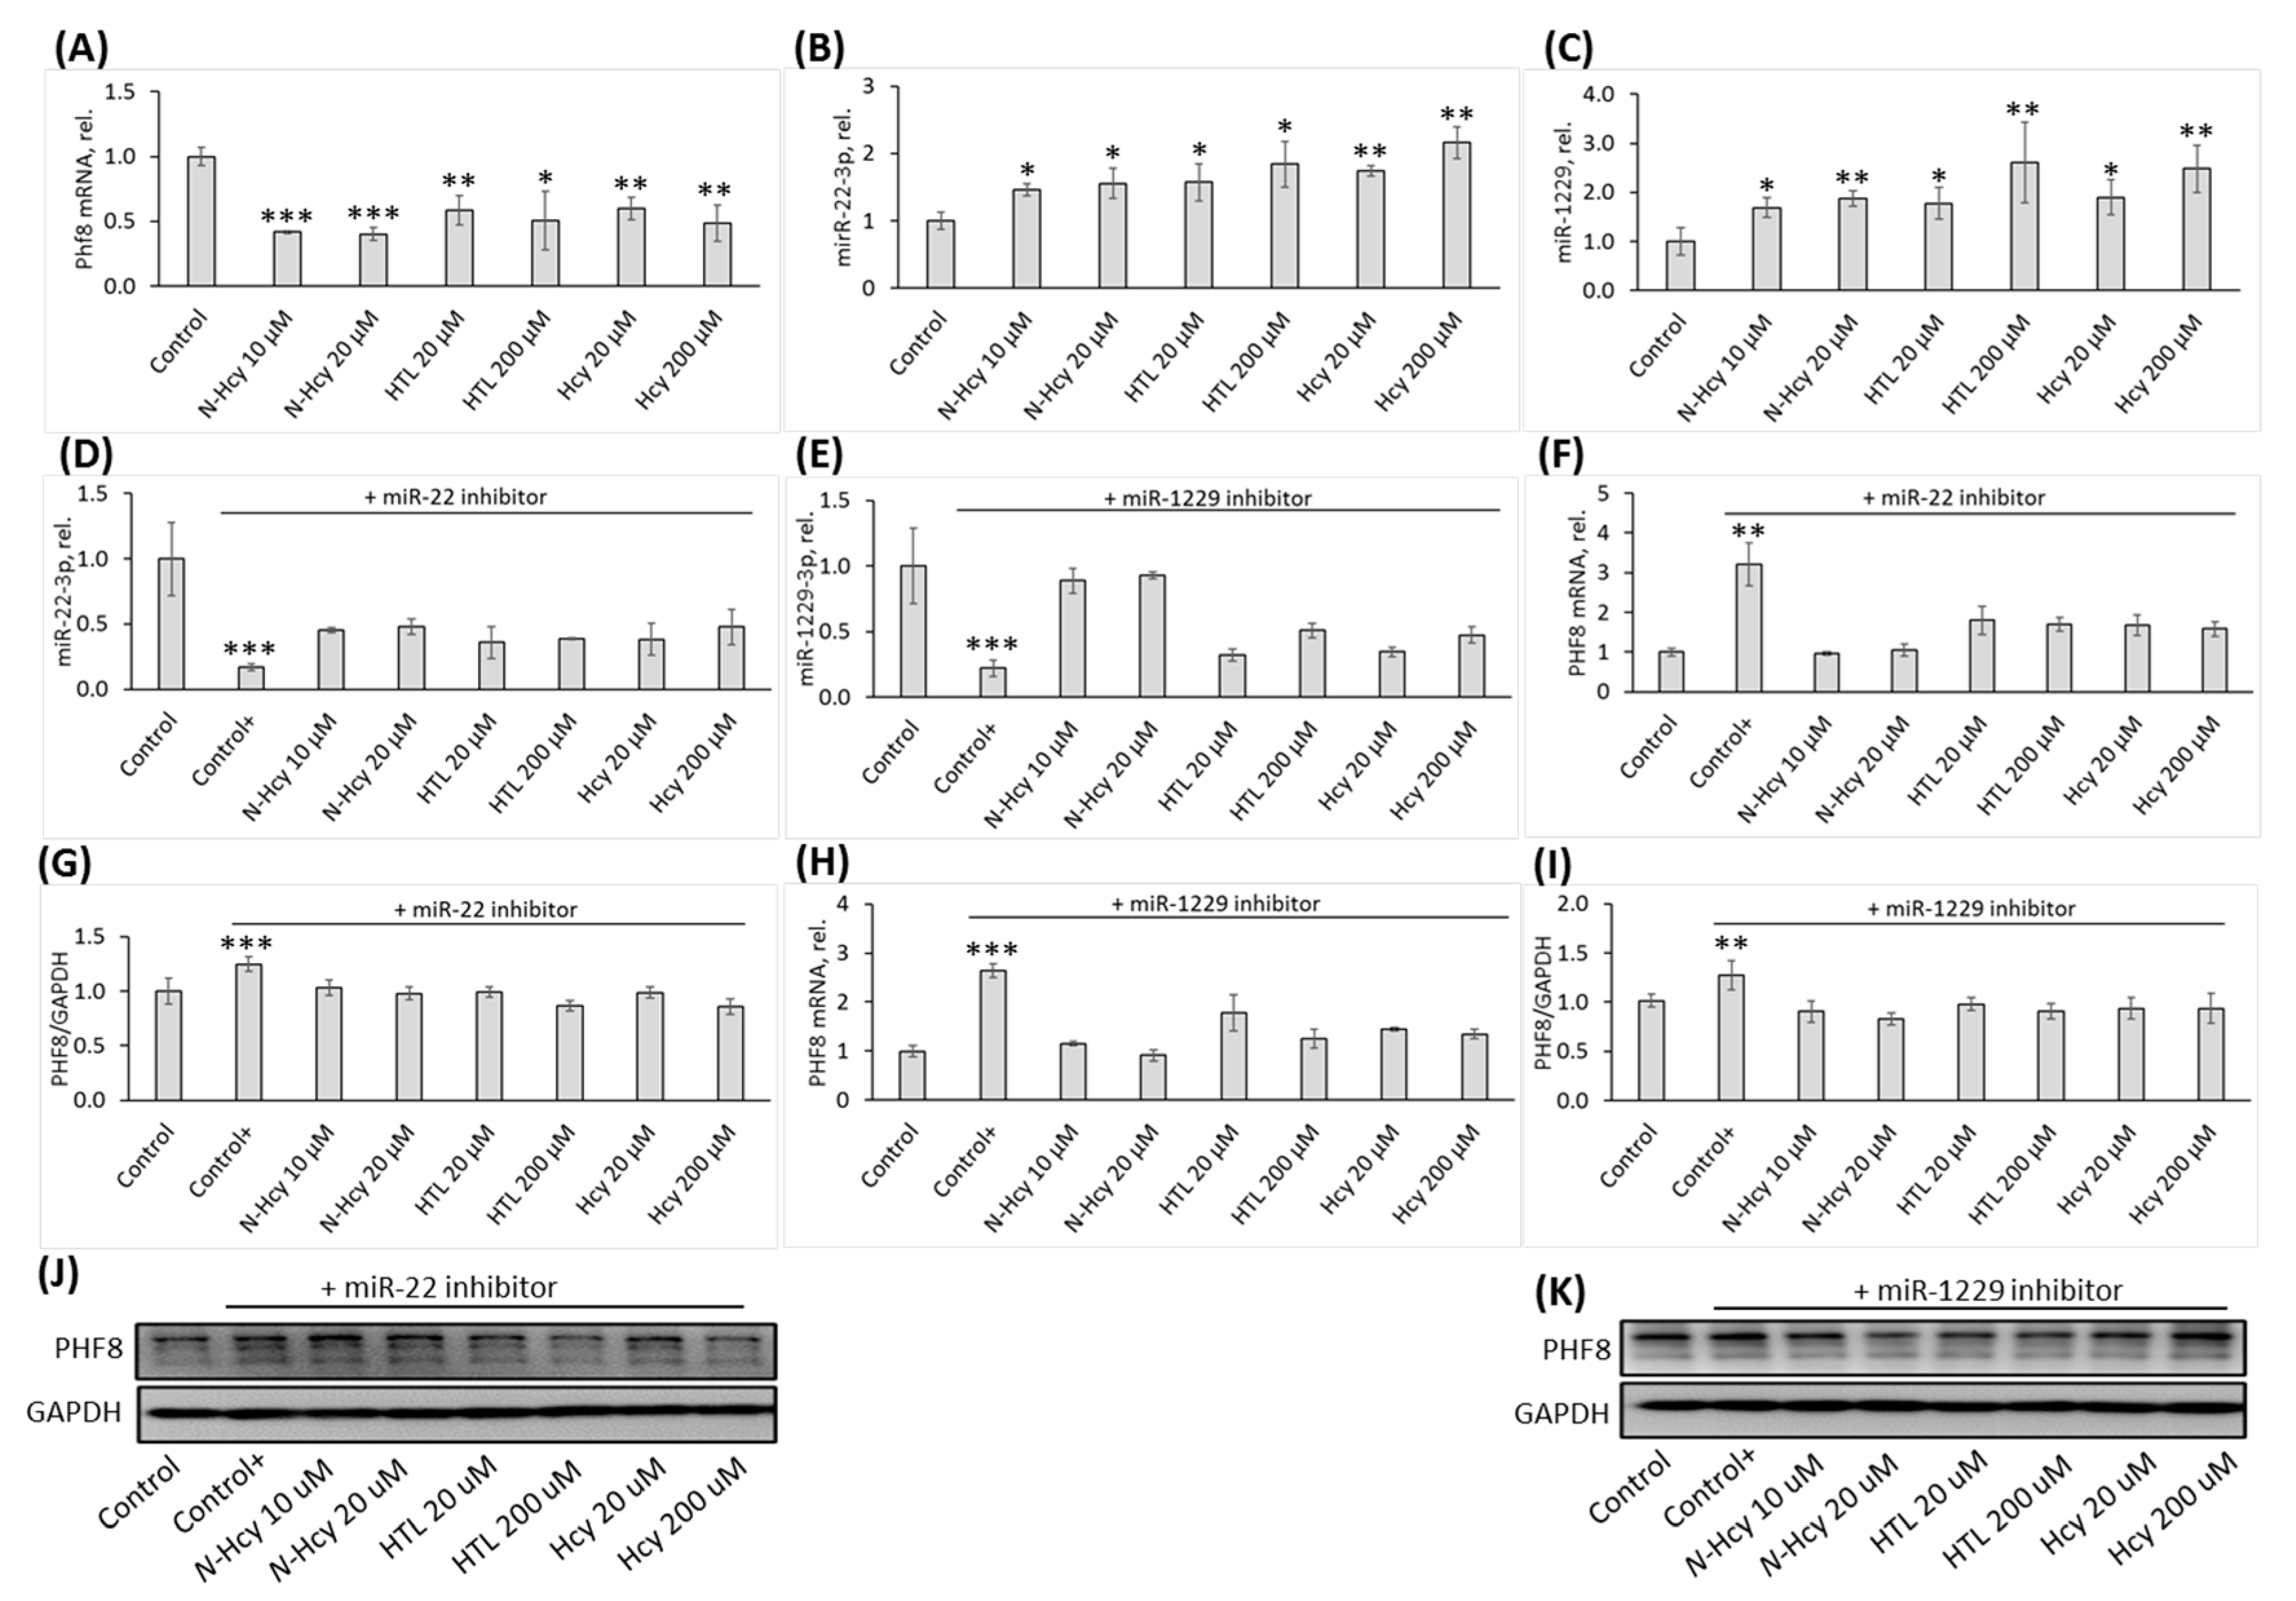
Figure 3.
The PHF8 3’UTR target sites for miR-22-3p (A) and miR-1229-3p (B) predicted by miRTarBase (https://mirtarbase.cuhk.edu.cn/~miRTarBase/miRTarBase_2022/php/index.php). The PHF8 sites for miR-22-3p and miR-1229-3p partially overlap. Target site 1702 – 1726 for miR-1229-3p shares 7 nucleotides (at position 1702 – 1708) with target site 1689 – 1708 for miR-22-3p. Target site 2180 – 2204 for miR-1229-3p shares 5 nucleotides (at position 2180 – 2184) with target site 2164 – 2184 for miR-22-3p.
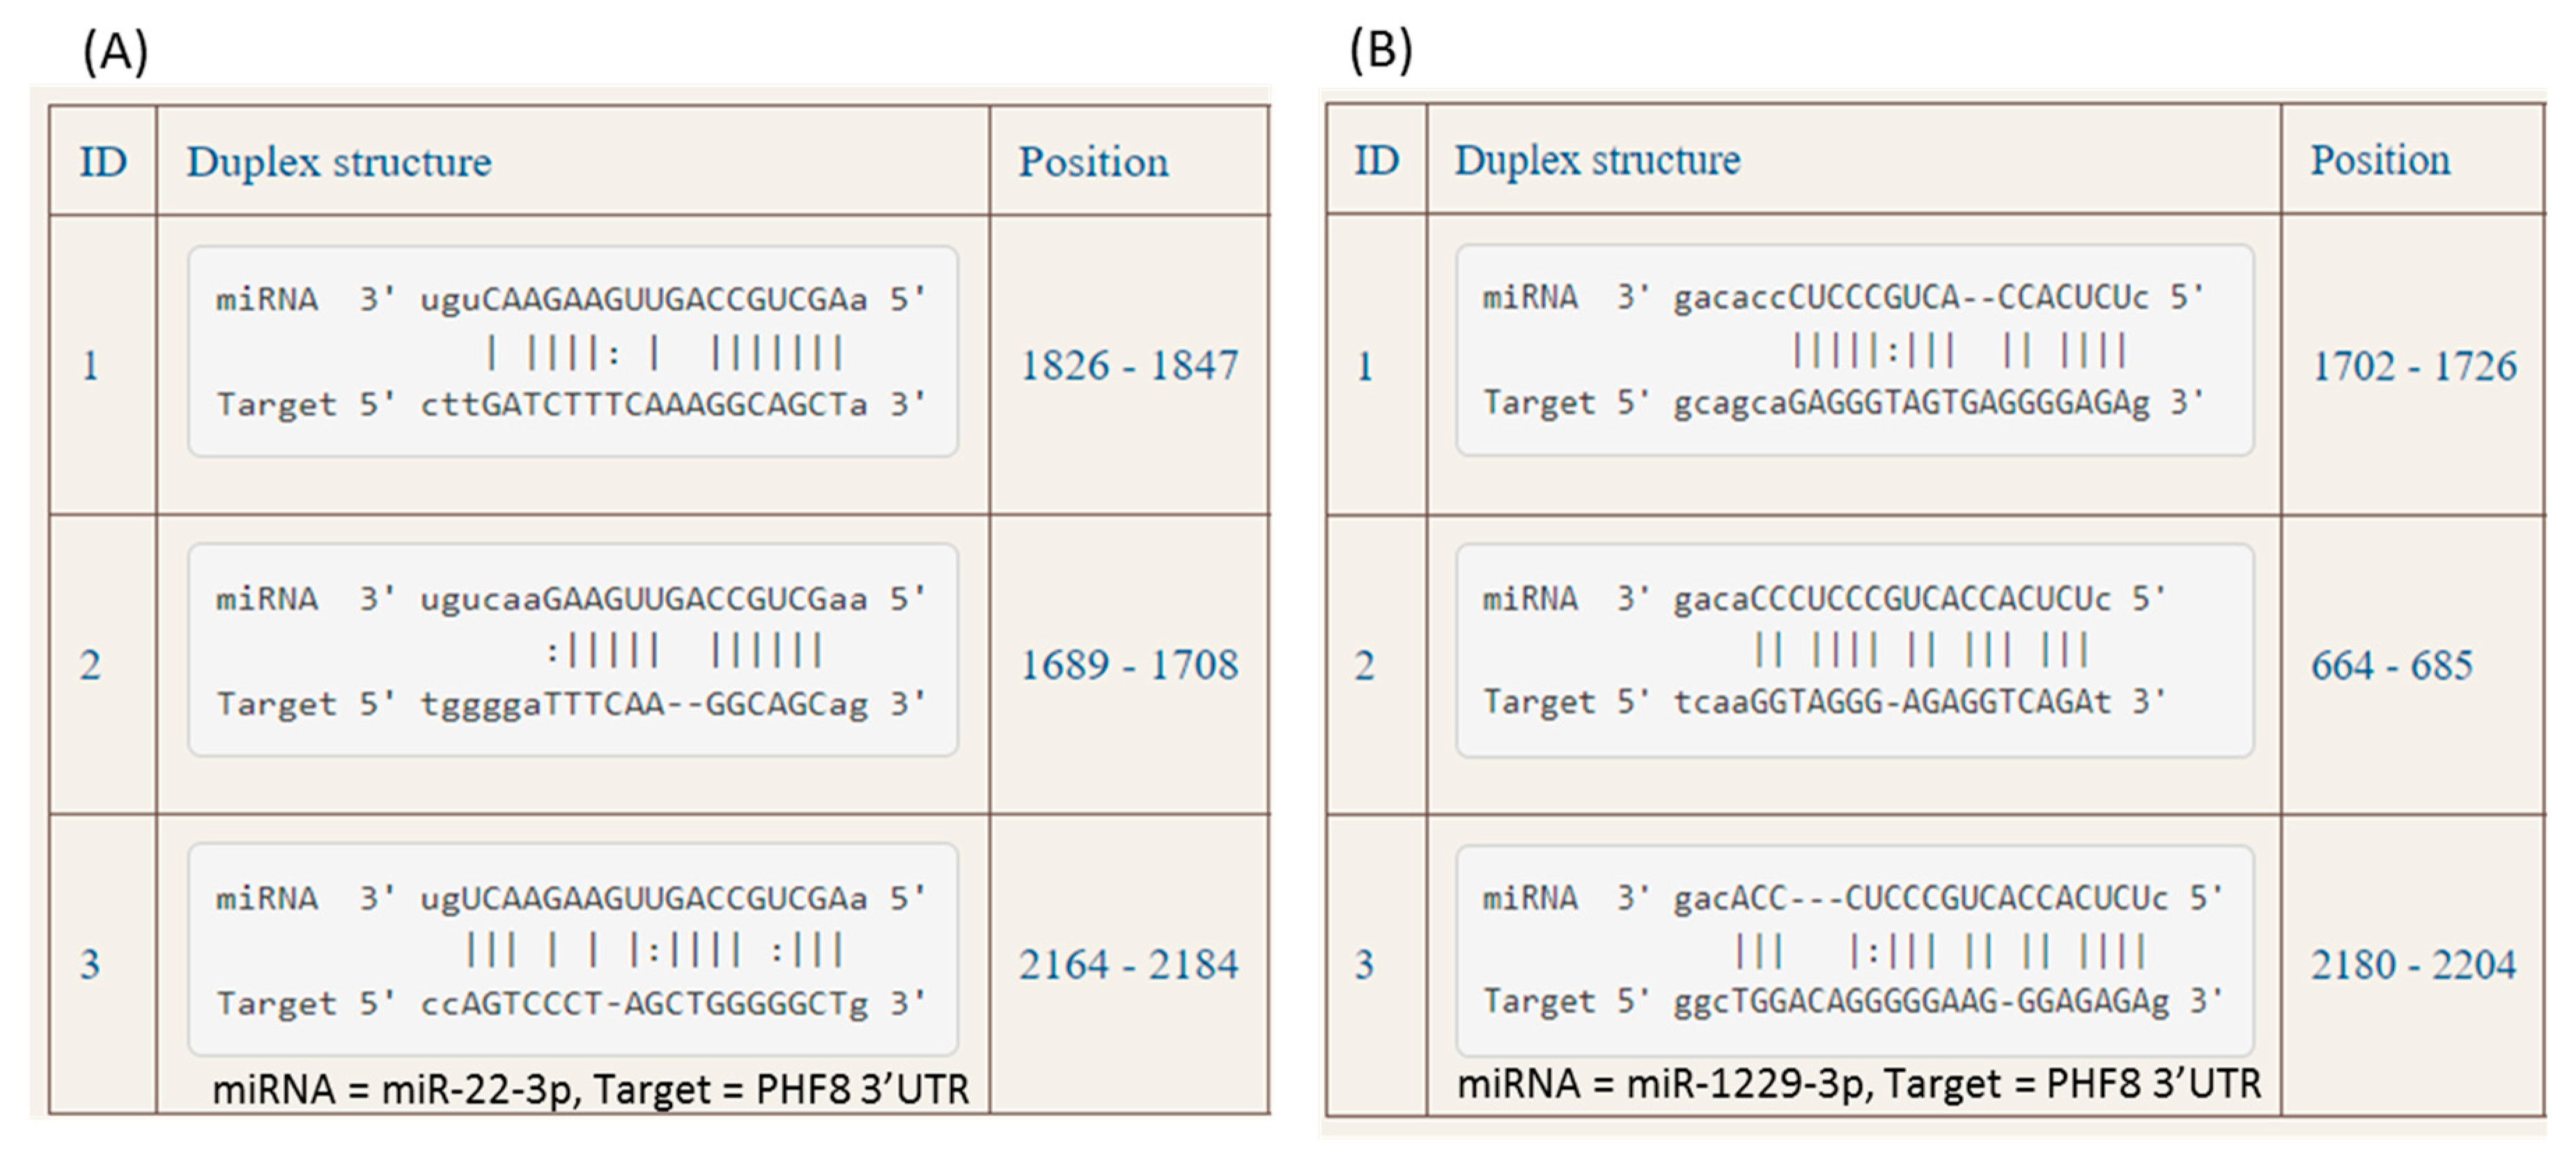
Figure 4.
The inhibitor of PHF8-targeting miR-22-3p ameliorates the influence of Hcy metabolites on the expression of mTOR- and autophagy related mRNAs (A - F) and proteins (G - L). HUVEC were transfected with the inhibitor of miR-22-3p for 4 h and then treated with N-Hcy-protein, Hcy-thiolactone, or Hcy for 24 h. The indicated mRNAs were quantified by RT-qPCR and proteins by Western blotting. GAPDH mRNA was used as a reference for mTOR (A), ATG5 (B), ATG7 (C), BECN1 (D), LC3 (E), and p62 (F) mRNAs. GAPDH protein was used as a reference for H4K20me1 (G), mTOR (H), pmTOR (I), ATG7 (J), BECN1 (K), and p62 (L) proteins. Representative pictures of Western blots are shown in panel (M). P-values were calculated by one-way ANOVA with Tukey’s multiple comparisons test. * P < 0.05, ** P < 0.01, *** P < 0.001. NS, not significant.

Figure 5.
The inhibitor of PHF8-targeting miR-1229-3p ameliorates the influence of Hcy metabolites on the expression of mTOR- and autophagy related mRNAs (A - F) and proteins (G - L). HUVEC were transfected with the inhibitor of miR-1229-3p for 4 h and then treated with N-Hcy-protein, Hcy-thiolactone, or Hcy for 24 h. The indicated mRNAs were quantified by RT-qPCR and proteins by Western blotting. GAPDH mRNA was used as a reference for mTOR (A), ATG5 (B), ATG7 (C), BECN1 (D), LC3 (E), and p62 (F) mRNAs. GAPDH protein was used as a reference for H4K20me1 (G), mTOR (H), pmTOR (I), ATG5 (J), and LC3-II (K) proteins. Panel (L) shows the LC3-II/LC3-I ratio. Representative pictures of Western blots are shown in panel (M). P-values were calculated by one-way ANOVA with Tukey’s multiple comparisons test. * P < 0.05, ** P < 0.01, *** P < 0.001. The number 0.061 above the ‘Control+’ bar in panel F, stands for a P value.
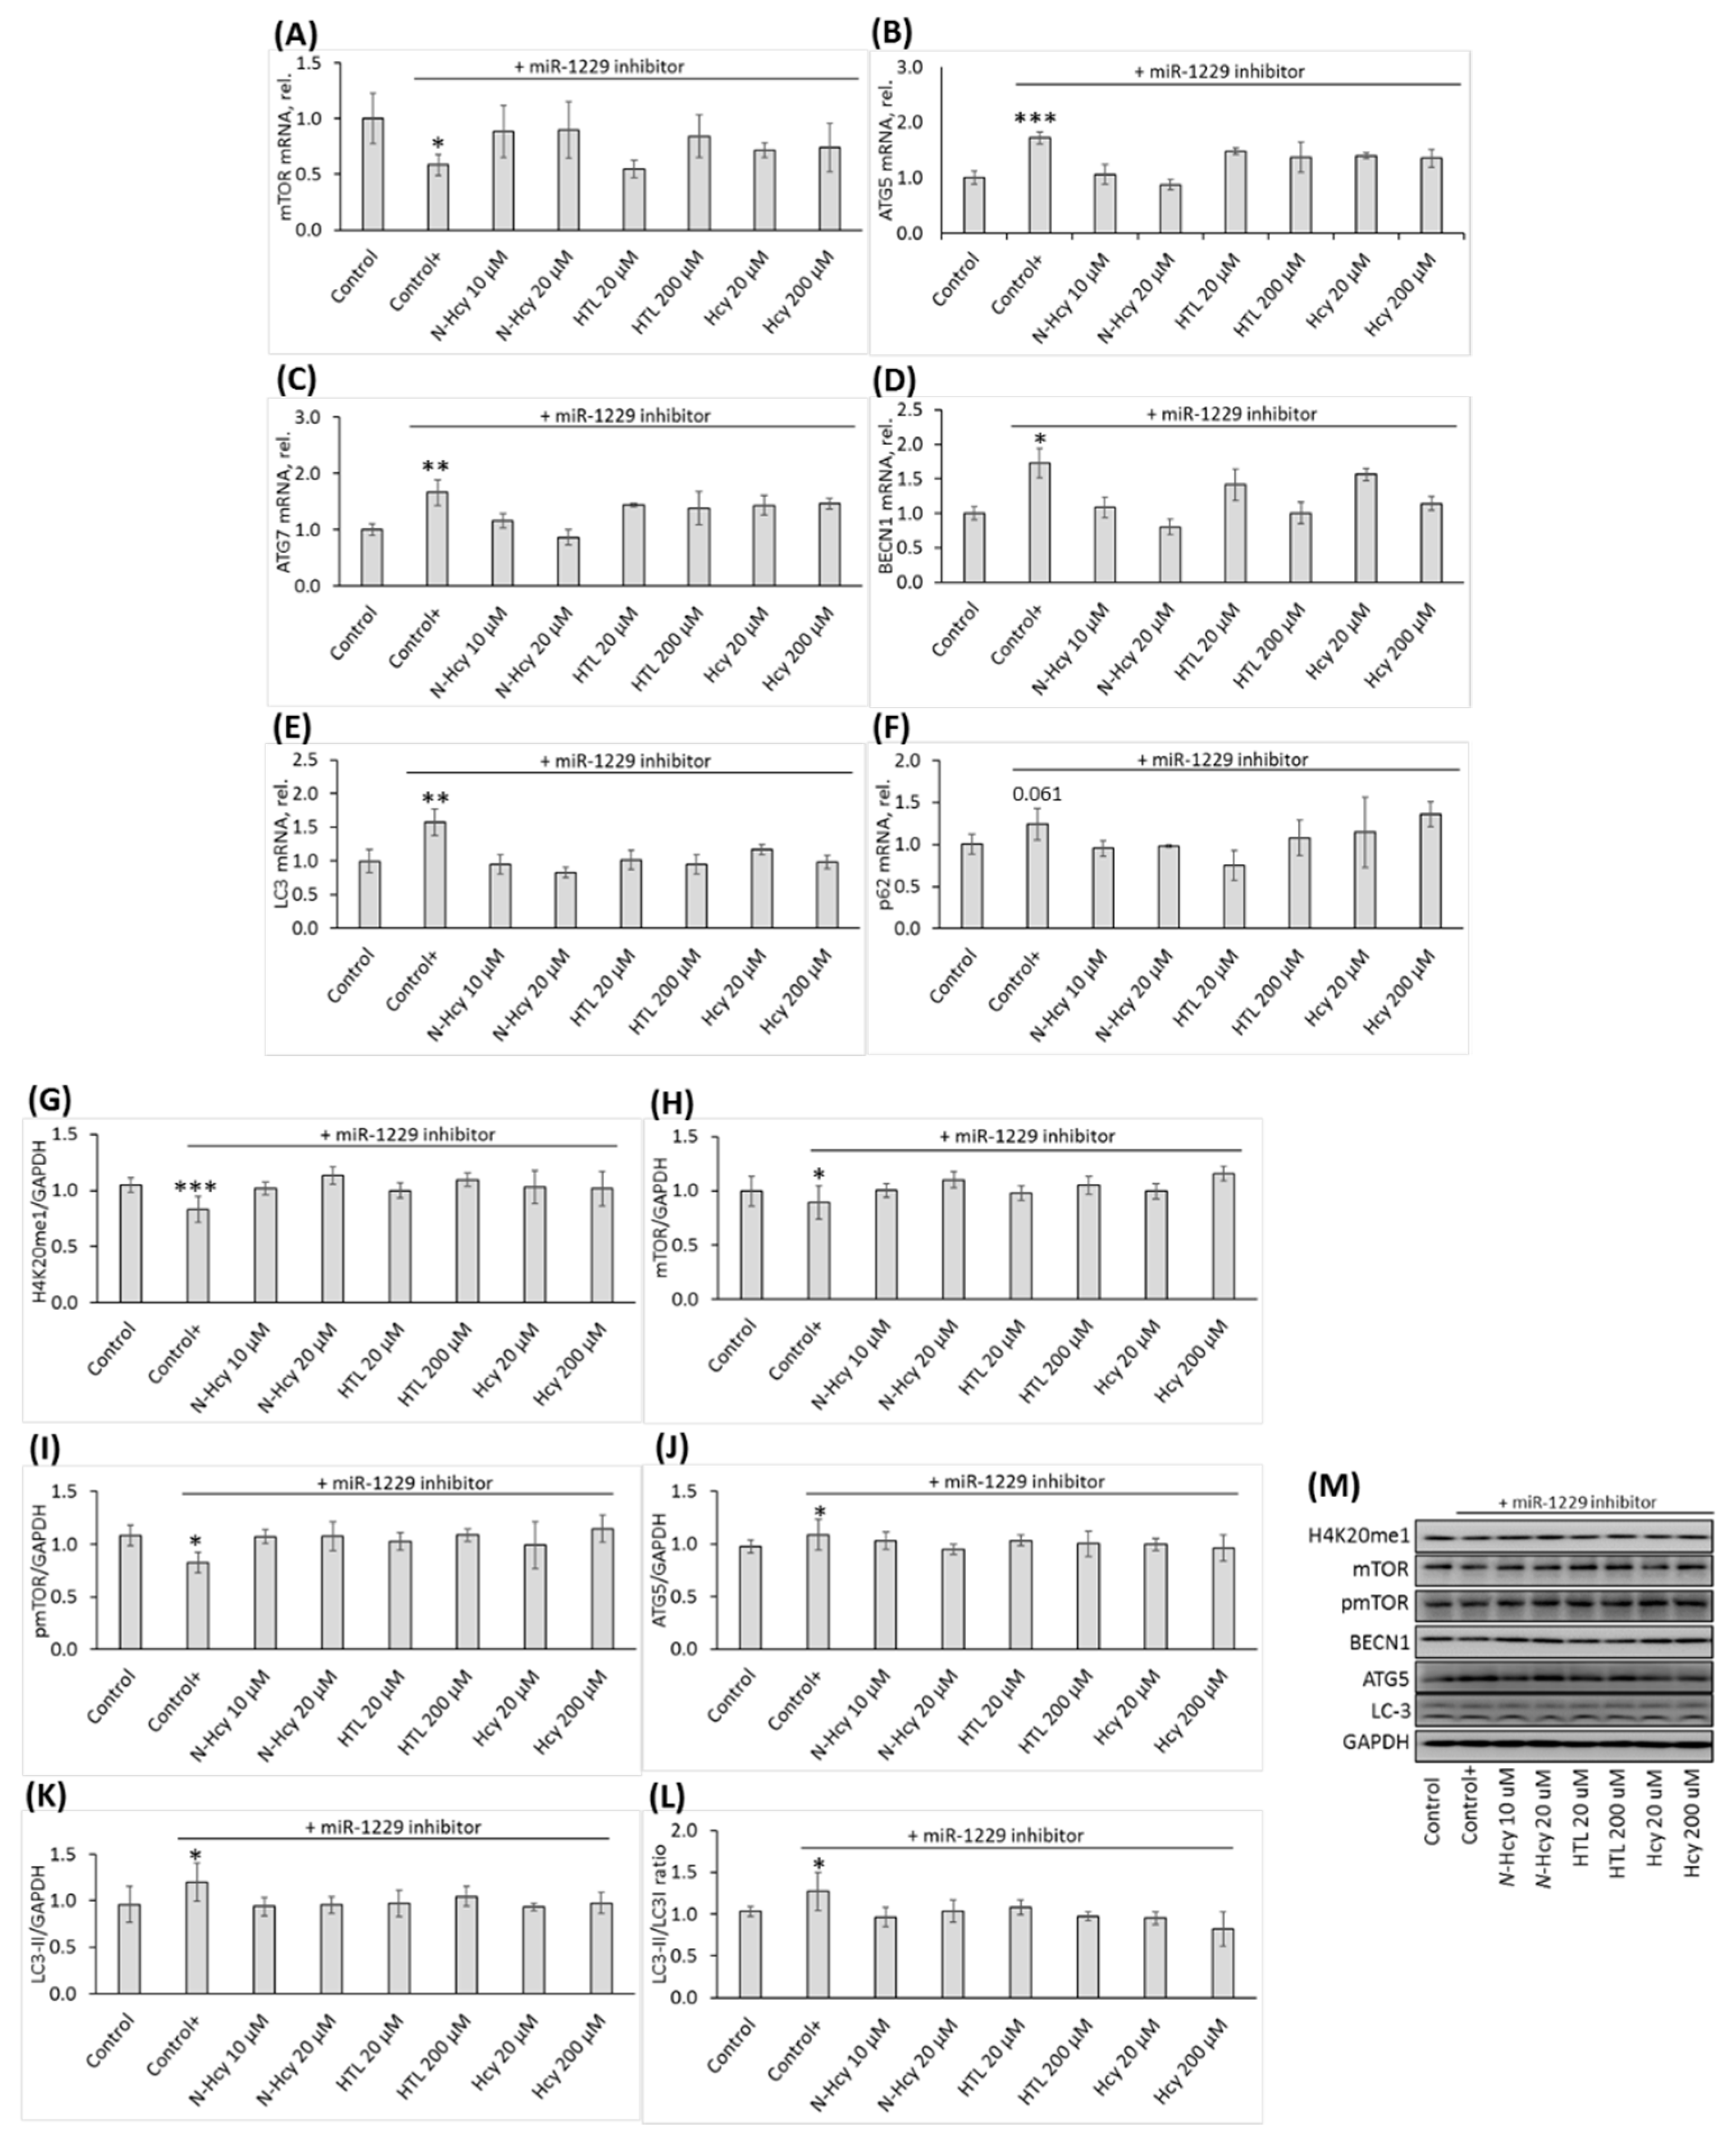

Table 1.
Primers used for PCR or RT-qPCR.
| Gene | Primer sequence |
| ATG5 | Forward: 5′-AGTAGTTGCCTGGAGGAGCG-3′ |
| Reverse: 5′-GTCTCGCCAACTCCACCTTG-3′ | |
| ATG7 | Forward: 5′-GATGAAGCTCCCAAGGACAT-3′ |
| Reverse: 5′-GTGGGAGCACTCATGTCAAA-3′ | |
| BECN1 | Forward: 5′-GGGCTCCCGAGGGATGG-3′ |
| Reverse: 5′-TTCCTCCTGGGTCTCTCCTG-3′ | |
| GAPDH | Forward: 5′-AGCCACATCGCTCAGACAC-3′ |
| Reverse: 5′-GCCAATACGACCAAATCC-3′ | |
| LC3 | Forward: 5′-CATGAGCGAGTTGGTCAAGA-3′ |
| Reverse: 5′-CCATGCTGTGCTGGTTCA-3′ | |
| mTOR | Forward: 5′-GCAGCTGCATGGGGTTTA-3′ |
| Reverse: 5′-CCCGAGGGATCATACAGGT-3′ | |
| PHF8 | Forward: 5′-TGGGAGCATGCTTCAAGG-3′ |
| Reverse: 5′-GATTTCAAAGCAGGGTCATCA-3′ | |
| P62 | Forward: 5′-GGTCGCGCTCACCTTTCT-3′ |
| Reverse: 5′-TCCTTTCTCAAGCCCCATGTT-3′ | |
| 18s rRNA | Reverse: 5′-AGGAATTCCCAGTAAGTGCG-3′ |
| Reverse: 5′-GCCTCACTAAACCATCCAA-3′ | |
| U6 snRNA | Reverse: 5′-CTCGCTTCGGCAGCACA-3′ |
| Reverse: 5′-AACGCTTCACGAATTTGCGT-3′ |
Disclaimer/Publisher’s Note: The statements, opinions and data contained in all publications are solely those of the individual author(s) and contributor(s) and not of MDPI and/or the editor(s). MDPI and/or the editor(s) disclaim responsibility for any injury to people or property resulting from any ideas, methods, instructions or products referred to in the content. |
© 2023 by the authors. Licensee MDPI, Basel, Switzerland. This article is an open access article distributed under the terms and conditions of the Creative Commons Attribution (CC BY) license (http://creativecommons.org/licenses/by/4.0/).
Copyright: This open access article is published under a Creative Commons CC BY 4.0 license, which permit the free download, distribution, and reuse, provided that the author and preprint are cited in any reuse.


