
Submitted:
26 June 2023
Posted:
27 June 2023
You are already at the latest version
Abstract
In this study, 3D printing of poly-l-lactic acid (PLLA) scaffolds reinforced with graphene oxide (GO) nanoparticles via Digital Light Processing (DLP) was investigated to mimic bone tissue. Stereolithography is one of the most accurate additive manufacturing method, but the dominant available materials used in this method are toxic. In this research, a biocompatible resin (PLLA) was synthetized and functionalized to serve the purpose. Due to the low mechanical properties of the printed product with the neat resin, graphene oxide nanoparticles in three levels (0.5, 1, and 1.5 Wt.%) were added with the aim of enhancing the mechanical properties. At first, the optimum post cure time of the neat resin was investigated. Consequently, all the parts were post-cured for three hours after printing. Due to the temperature-dependent structure of GO, all samples were placed in an oven at 85 ° C for different time periods of 0, 6, 12, and 18 hours to increase mechanical properties. The compression test of heat treated samples reveals that the compressive strength of the printed parts containing 0.5,1, and 1.5 % of GO increased by 151,162 ad 235%, respectively. Scaffolds with the designed pore sizes of 750 microns and a porosity of 40% were printed. Surface hydrophilicity test was performed for all samples showing that the hydrophilicity of the samples increased with increasing GO percentage. The degradation behavior of the samples was evaluated in a PBS environment, and it revealed that by increasing GO, the rate of component degradation increased, but the heat treatment had the opposite effect and decreased the degradation rate. Finally, besides improving biological properties, a significant increase in mechanical properties under compression can introduce the printed scaffolds as a suitable option for bone implants.
Keywords:
Additive Manufacturing
; Tissue Engineering
; DLP
; Graphene Oxide
; PLLA
1. Introduction
Bone defects and orthopedic diseases are serious issues due to the outstanding increase in population aging, life expectancy, accidents, and cancer, and have huge social and economical impacts, that significantly affect the quality of human life [1]. Each year, more than 2.2 million patients worldwide require bone graft surgery for healing major bone defects [2,3]. In addition, the dynamic structure and complex geometry of the bone cause an extension in treatment time [4,5]. Therefore, the healing of large and complex bone defects may end up incomplete [6]. Bone grafts have traditionally been employed to repair damaged bone, although their usage has been restricted due to some drawbacks. Traditional bone grafting methods can be divided into three general categories: autograft, allograft, and xenograft, and each of these methods has perks and cons. Limited supply, variable rate of degradation and absorption, risk of disease transmission in the donated tissues, and the need for reoperation to remove tissues are the disadvantages of the autografts. Disease transmission and rejection of the donated tissue/organ by the body are also disadvantages of allograft and xenograft tissues [7,8]. Tissue engineering has been one of the most viable approach for tissue regeneration, in the recent decades, to overcome the complexity of existing methodologies and has played a key role due to the increasing demand for organ transplants as well as the severe shortage of donors [9,10,11]. In general, the manufactured scaffolds have to meet some specific biological requirements. First, they have to be biocompatible and non-toxic. Besides that, scaffolds requires a proper surface for cell attachment, proliferation, and differentiation [9,10,12]. Biodegradability is also critical to allow the formation of tissue at the same time as scaffold degraded. Scaffold degradation must not release toxic substances, and the released materials have to be disposed by the body without interfering with other organs. In addition, the degradation rate of mechanical properties is very important in the under-load implants because the applied load must be gradually transferred to the regenerated tissue [13,14].
In addition to the biological properties of scaffolds, mechanical properties and scaffold morphology play a significant role in the regeneration process of tissue. The complex porosity of the scaffolds, to mimic the bone structure, has led to the restriction of fabricating methods. Traditional fabricate methods of scaffolds include electro spinning [15], gas foam [16], and solvent casting [17]. The limited ability to control the shapes and internal structure of the manufactured parts (scaffolds), and also, the use of the solvents may compromise cell survival or function are the main drawbacks of these conventional methods [18]. In the recent decades, additive manufacturing (AM) techniques have been employed to overcome the limitations of traditional methods. The intrinsic ability of AM methods to control porosity, pore size, and mechanical and chemical properties is far superior to the conventional methods. AM techniques also enable to use multi materials for the surface and/or overall volume of the scaffold to optimize mechanical and biological properties [19,20]. One of the most accurate AM methods is stereolithography. The stereolithography system includes a tank of light-sensitive liquid resin, a moving platform, a UV laser beam (SLA method) or digital light projector (DLP method), and a dynamic mirror system. The process begins with UV or digital light irradiation on a layer of light-sensitive liquid resin on the platform (UV laser beam sweeps all the path to cure a layer but in DLP the whole layer is cured at once). When the layer is completely solidified, the platform moves up (in a bottom-up method) and the next layer is generated on the initial layer as same as the previous layer. These stages are repeated to build a full 3D scaffold. Figure 1 presents the scheme of the DLP method. Finally, uncured resins are washed from the part and the final part is post-cured again with UV or digital light [21,22], if necessary, to assure complete curing. In regards to medical application, specially manufacturing scaffolds for tissue engineering, the main issues with stereolithography are the highly limited availabality (or scarcity of) biocompatible materials/resins and low mechanical properties of the final parts. Therefore, it is critical to synthetize the raw material/resin and consequently enhance the mechanical properties of the printed scaffolds. One known method of enhancing properties, practiced in the development of composite materials, is adding nano-scaled fillers into the polymeric matrices to impart unique properties due to their nanometric dimensions [23]. Graphene is a promising reinforcement for polymeric composites that has a remarkable ultimate strength of 200 times higher than steel and an one elastic modulus of TPa. Graphene particles are two-dimensional hexagonal plates made of carbon atoms with a thickness of one-single carbon atom [24,25,26]. Graphene oxide (GO) is the frequently used derivative of graphene as a reinforcement that exhibits a very stable dispersion in aqueous environments [27].
This experimental study presents a comprehensive procedure to fabricate and strengthen scaffolds that 3D-printed via DLP method. PLLA resin, that synthetized in-house, was used as the polymeric matrix, and GO as the reinforcement. The effects on the mechanical properties were investigated under various subsequent heat treatment conditions. The effect of GO and heat treatment on the degradation process and concurrent mechanical properties are presented. In addition, the morphology of the scaffolds (porosity and pore size) and their hydrophilicity at different conditions were investigated.
2. Materials and Methods
2.1. Raw materials
Functionalized PLLA was synthesized at our laboratory, as described in [28]. Graphene oxide (GO) was purchased from CBI Co, Iran. Diphenyl (2, 4, 6-trimethyl benzoyl) phosphine oxide (TPO), 2-ethyl-2-hydroxymethyl- trimethacrylate (TMPTMA), and tartrazine yellow dye, were procured from Sigma Aldrich. N-methyl pyrrolidone (NMP), and Isopropanol, Merck, were obtained and phosphate-buffered saline (PBS) was purchased from DNA biotech, Iran.
2.2. Equipment and procedure
2.2.1. Working resin preparation
A mixture was prepared with 56 wt.% of synthetized PLLA monomer, 20 wt.% of NMP as a non-reactive diluent, 20 wt.% of TMPTA as the cross-linker, and 4 wt.% of TPO as the photo-initiator were prepared via a magnetic stirrer for an hour to result in a homogenous resin. The thermal properties of the prepared working resin are presented in Table 1 [28,29] .To ensure uniform dispersion of GO particles throughout resin, samples were stirred by a magnetic stirrer for 20 min and homogenized by an ultrasonic homogenizer machine (vCLEAN1-L6, Vira Tejarat Bekr Co, Iran) for 5 min.
2.2.2. Printing parameters
A commercial DLP 3D printer (Kavosh economy, Kavosh Laser Co., Iran) with a 190 W mercury-vapor lamp and light intensity of 18mW.cm-2 and wavelength of 405 nm was utilized to print parts. Preliminary tests showed that a layer thickness of 50 microns and an exposure time of 4 seconds were the optimum printing parameters.
2.2.3. Samples manufacture
Compressive test samples: Samples were printed in a cylindrical shape with 6mm in diameter, and 6 mm in height then post cured for 3 hours. Heat treatment was conducted for all samples, in an oven at 85°C and all the samples were post cured for three hours before heat treatment.
Bio-degradation samples: To obtain the degradation profile as well as its effect on mechanical properties, cylindrical full-solid samples with a diameter of 6 mm and a height of 6 mm were printed and the effects of GO content and heat treatment on their degradation were evaluated.
Scaffolds: A cubic porous structure with dimensions of 5×5×5 mm, pores size of 750 microns, and porosity of 40% was designed (Figure 2), and then printed with the selected compositions. After printing, the parts were washed with Isopropanol for 3 minutes to remove uncured resins. In continue, to avoid incomplete curing, three hours of post-curing was performed on the samples. Then the heat treatment was performed on specimens at the different times levels that is variable for different percentages of GO.
2.3. Printed parts characterization
Mechanical properties: mechanical properties, including compressive strength and modulus, were evaluated according to ASTM D695 using a universal testing machine (SANTAM STM-20, Santam Co., Iran), with a load cell capacity of 2KN. Cross-head displacement speed was adjusted are 1 mm/min for all tests. All tests were conducted on five samples, to achieve confident results.
The effect of post curing time was evaluated in six levels (0, 1, 3, 6, 12, and 18 hours) on neat resin samples to find the optimum post curing time given in Table 2.
Two parameters were selected as variables in this research, including weight percentages of GO (0, 0.5, 1, and 1.5 wt%) and heat treatment time (0, 6, 12, and 18 hour). Table 3 lists a total of 16 experiment runs conducted in this study.
FTIR: Infrared spectroscopic analysis was carried out to determine the creation of crosslinks between GO and PLLA after heat treatment, utilizing FTIR instrument, model L1280127 from Perkin Elmer, US. FTIR spectra in the range of 450–4000 cm-1 were recorded at room temperature. The resolution was 32 cm−1 and the number of scans was eight.
Scaffold morphology: The pore size was measured by Dino-Lite Digital Microscope (Dino-Light Premier, AnMo Electronics, Taiwan) with magnifications of 150x. For measuring porosity of scaffold, the gravimetric method was performed, and calculated using following equation [30]:
where Ve and Vs are the actual volumes of ethanol (soaked into the scaffold) and scaffold. We1 is the weight of initial ethanol in the vessel and We2 is the weight of ethanol after removal of the sample (e.g., first immersed and then removed assuring that the scaffold is completely soaked with ethanol(. To ensure complete penetration of alcohol into all pores of the scaffolds, the samples, while immersed in ethanol, were placed in a vacuum chamber. Ws is the weight of the scaffold. ρe and ρs are the ethanol and scaffold densities, respectively.
MTT assay: for cytotoxicity evaluation of PLLA and PLLA/GO resins, scaffolds were printed with selected GO contents (0, 0.5, 1, and 1.5 wt.%) and MTT assay were conducted on the extraction of the samples. To prepare the extractions, samples were washed with PBS for 24 h, then soaked in diluted ethanol (70 vol.%) for 30 minutes, followed by sterilizing under UV light for 10 minutes. Finally, all samples were placed into a 5 ml culture medium with serum and incubated at 37°C for 24 hours; the final solution was then considered as 100% scaffold extraction. To evaluate the toxicity of the scaffolds, 10,000 mouse fibroblasts cells (L-929, ATCC® CRL-6364™) were cultured in a 96-well micro plate that was filled with DMEM (10 v/v% fetal bovine serum, 100 μg 𝑚𝑙−1 of streptomycin, and 100 𝑈 𝑚𝑙−1 penicillin) at 37 ° C and 5% carbon dioxide. The culture medium was exchanged with 100 ml of scaffold extraction and 5 v/v% FBS at 24, 72, and 168 hours. After cell culture, 20 μl of MTT solution (5 mgr / mlit in FBS medium) was added to each well and the culture wells were incubated for 2 hours. Isopropanol, of 100 μl in amount,was used to dissolve Formazan crystals. After complete dissolution of the crystals, optical density (OD) of each well was measured by BioTek ELX 800, manufactured by BioTek instrument Co., at 570 nm with 670 𝑛𝑚 background subtraction.
Hydrophilicity: The hydrophilicity of the scaffolds was evaluated via calculating the contact angle utilizing a Dino-Lite Digital Microscope (Dino-Light Premier, AnMo Electronics, Taiwan) with a magnifications of 150x . For this purpose, 5 drops of distilled water in the size of 10 microliter were applied on the surface of samples with a diameter of 6 mm, and the image of the first moment the droplet hit the surface of the sample was captured. The contact angle of the droplet was measured using Dino Capture 2.0 software according to Equation 1 and assuming that the water droplets were in the form of spheres.
where θ, w, and h are contact angle, width, and height of the water droplet, respectively.
Bio-degradation behavior: The prepared samples were washed in an ethylene alcohol solution containing 30% distilled water for 12 hrs and let dry for 24 hrs at room temperature, then sterilized by UV light for 15 minutes. The weight of samples was measured utilizing a digital scale with an accuracy of 0.001 g. Next, each sample was immersed in PBS solution with pH of 7.45 and kept in a shaking incubator with a linear movement (Hastaran Teb Co, Iran) for three months with examining interval periods of 1, 4, and 8 weeks). At each time interval, the predetermined samples were dried for 24 hrs at room temperature, then their weights were measured to find weight loss according to the following equation:
where is the initial weight of samples and is the weight of samples after degradation. The medium was changed every two weeks and the pH level of the extracted medium was measured using a pH meter (Model 220, Denver Instruments, USA). Compression test was conducted on all samples to evaluate the effect of degradation on the mechanical properties.
Statistical analyzes: The 2-sample t-test (Minitab 16 software) was used for statistical analyses. The mean and ± standard deviation were used to present all experimental data and a p-value<0.05 was considered significant.
3. Results and Discussion
3.1. Mechanical Properties
Post cure effect: Figure 3 shows the compression stress-strain curves of GO-free samples at different post-curing times. From these curves, compressive strength and Young modulus were calculated and are presented in Figure 4. The figures clearly demonstrate an increase in compressive strength and Young modulus by increasing post-curing time up to 3 hours and remains the same till 6 hours; after 6 hours compressive strength tends to decrease. Therefore, three hours of post-curing were found an optimum time for enhancing the compressive strength of the neat PLLA samples.
Figure 5 exhibits the surface change of GO-free printed parts after 18 hours of post-curing. The image shows cracks that were initiated after 18 hours of post-curing that clearly justify the compressive strength reduction after 6 hours of post-curing. This is due to an uneven shrinkage of the materials during heat treatment that promotes residual stress thorough the bulk of specimens.
GO and heat treatment effect: Figure 6 shows the effect of heat treatment stress-strain behavior of GO-free printed parts for four various periods of heat treatment. According to the results, compressive strength and elastic modulus decreased remarkably via increasing heat treatment time )Table 4(.
Figure 7 illustrates the effect of heat treatment/period on the compression behavior of specimens with various GO contents of 0.5, 1, and 1.5wt.% of GO. Compared to the non- heat treated specimens, the figure clearly demonstrates a dramatic increase in compressive strength via the increase in heat treatment period. The reason can be attributed to the formation of crosslinks between GO and PLLA chains due to the phenomenon of esterification [31]. Scheme of esterification and creation of cross-links between GO and PLLA is given in Figure 8. The required time to form crosslinks is directly related to the percentage of GO. These cross-links suppress the high shrinkage of the part with a higher GO content. Hence, increasing the percentage of GO content enables the samples to withstand a longer exposure to the heat treatment without crack initiation that, consequently, causes an increase in the compressive strength. The compressive strength of specimens with 0.5 and 1 wt. % of GO content peaked at 12 hours of heat treatment, after which, it decreases because of cracks initiation at 18 hours of heat treatment, but the compressive strength of the specimens that contained 1.5wt% of GO peaked at 18 hours of heat treatment; the maximum selected time.
Figure 9 shows the results of FTIR test carried out on the specimens, without and with GO content, to validate the formation of crosslink bonds between PLLA and GO molecules. According to Figure 9b, for the specimens with GO content of 1.5wt.% and 18 hours of the heat treatment, the peak value of C=O bond, at the wavelength of 1742 cm-1 and the carboxylic O-H stretch at the wavelength of 3300 cm-1 [31], have increased indicating the generation of ester bonds between GO nanoparticles and PLLA. Conversely as shown in Figure 9a, non-notable change in the peak value of C=O bonds was observed after 18 hours of heat treatment, due to the lack of GO.
3.2. Scaffold morphology
The optimal pore sizes for sound cell attachment, cell growth, bone regeneration, and vascularization have been reported to be between 300 and 500 µm [32]. According to the results presented earlier, P-h0, G0.5-12h, G1-12h, and G1.5-18h, yielded the highest compressive strength for each level of GO (Figure 6 and Figure 7). Hence, the same composition was considered for printing the scaffolds (Figure 10). The pore size variation could occur due to over curing and shrinkage initiated by heat treatment leading to smaller pore size and porosity. While the nominal pore size and porosity was set at 750 µm and 40% respectively at the design stage, the achieved pore size and porosity were in the range of 500 -750 µm and 30-40% respectively (Table 5).
3.3. MTT assay
Figure 11 demonstrates Optical Density (OD) of the specimens with 0, 0.5, 1, and 1.5 wt.% of GO content for three different time intervals (1, 2, and 7 days); DMEAM was considered as a biocompatible negative control. All specimens exhibited higher OD values than DMEAM except 1.5 wt.% of GO at 7 days. T-test was employed to calculate P-value of this sample that yielded a value higher than 0.05, thus showing no significant difference between this sample and DMEM. To ensure non-cytotoxicity of the samples according to ISO 10993-5, cell viability reduction of the scaffolds in comparison to DMEM negative control must be less than 30%. The results revealed that all of the cell viability decrease values were less than 30%, and that scaffolds have higher cell viability than DMEM in most cases, so the printed scaffolds were non-cytotoxic.
3.4. Water contact angle
Porosity and hydrophobicity can affect the water absorption capacity of the scaffold from the environment with which it is in contact. The results of performed hydrophilicity test are shown in Figure 12. According to the results, the hydrophilicity of the samples has increased with increasing GO content, so that addition of 1.5 wt. % GO has led to a 20% decrease in the surface angle of water, which can be due to the presence of large number of oxygen-containing functional groups with very high hydrophilic properties [33,34,35].
3.5. In vitro Degradation
3.5.1. Weight loss
GO effect: In order to assess the effect of GO on material degradation, the amount of weight lost during 1, 4, and 8 weeks was measured as shown in Figure 13. According to the results, increasing the GO content did not have a significant effect on the material degradation in 1 week and 4 weeks. The degradation of samples containing 1.5 wt. % GO was 26 and 33% in 1 week and 4 weeks, respectively, while the degradation of samples without GO was 22 and 30%. However, the addition of GO had increased the degradation profile over eight weeks. At eight weeks, the degradation profile of samples containing 1.5 wt. % GO oxide was approximately 40%, while the degradation of samples without GO was nearly 34%.
Heat treatment effect:Figure 14 shows the weight loss percentage of samples containing 0, 0.5, 1, and 1.5 wt. % GO at different heat treatment times, respectively. According to the results, heat treatment increased the weight loss for samples without GO after 8 weeks, that can be attributed to the presence of cracks, created during the heat treatment, which could enable liquid intrusion into the scaffold, affecting the higher surface area of scaffold [36]. However, the effect of heat treatment on samples containing GO was shown opposite to the samples containing no GO, so that the weight loss decreased with heat treatment. The samples with 0.5, 1, and 1.5 wt. % GO which were under heat treatment for18 hours lost 33.5, 31.1, and 32.8% of their weight after eight weeks, respectively. This could be attributed to the formation of strong ester bonds between the GO particles and PLLA which prevents degradation.
3.5.2. Degradation mechanism
The degradation behavior of specimens with GO content could be divided into three different mechanisms [36]. First, increasing the GO content leads to increasing hydrophilicity of scaffold as shown above, which facilitates water intrusion into the scaffold and PLLA hydrolysis. Second, there are oxygen atoms on the GO surface, which causes an oxygen linkage with the ester bonds of the PLLA. This oxygen bond can deflect the ester bonds toward the surface [37], which causes the exposure of the ester bond to water molecules and therefore their hydrolysis. The third mechanism is attributed to the geometry and structure of GO. The GO particles have a smooth sheet-like structure that could form large contact surfaces with the PLLA chains. These contact surfaces could be considered as microchannels, which cause more fluid to enter the scaffold, and promotes the ester bonds hydrolysis. On the other hand, the hydrolysis products could also be discharged through these microchannels.
3.5.3. Compressive profile
GO effect: The loss of compressive strengths of the specimens without heat treatment during 1, 4, and 8 weeks is shown in Figure 15. It shows that the largest loss in mechanical strength occurred between 1 to 4 weeks, due to high weight loss of samples during this period as shown in Figure 14. Further time, up to 8 weeks, caused further loss in mechanical strength specially with the presence of Go, attributed to the promotion of weight loss with GO.
Heat treatment effect: The loss of compressive strength of the specimens under heat treatment in 1, 4, and 8 weeks are shown in Figure 16. As shown in Figure 16a, heat treatment has increased the loss in the compressive strength of samples without GO but has decreased loss in the compressive strength of samples containing GO. It is due to the weight loss percentages of samples shown in Figure 14. According to the Figure 16b–d, the samples containing 0.5, 1, and 1.5 wt. % GO, in the first week, exhibited the highest compressive strength in 12, and 18 hours of heat treatment, similar to the initial compressive strength of the components in Figure 7, respectively. However, in the following weeks, the strengths were significantly reduced due to the mass loss.
3.5.4. pH changes
GO effect: The pH variation of the samples without heat treatment are shown in Figure 17. The pH value varies depending on competition between the buffer solution and the hydrolysis byproducts. In the early stages of degradation, by-product influence overwhelmed solution influence, so the highest pH drop occurred from 7.45 to approximately 6.19 for pure samples (about 1.26 difference) in week 1. However, for the samples contain GO, this difference was slightly subtle. Moreover, increasing the GO content had no significant effect on the pH of the environment, due to chemical reactivity, high electron mobility, nanometer thickness and strong reactivity to oxygen groups such as OH¯ of GO particles[38].
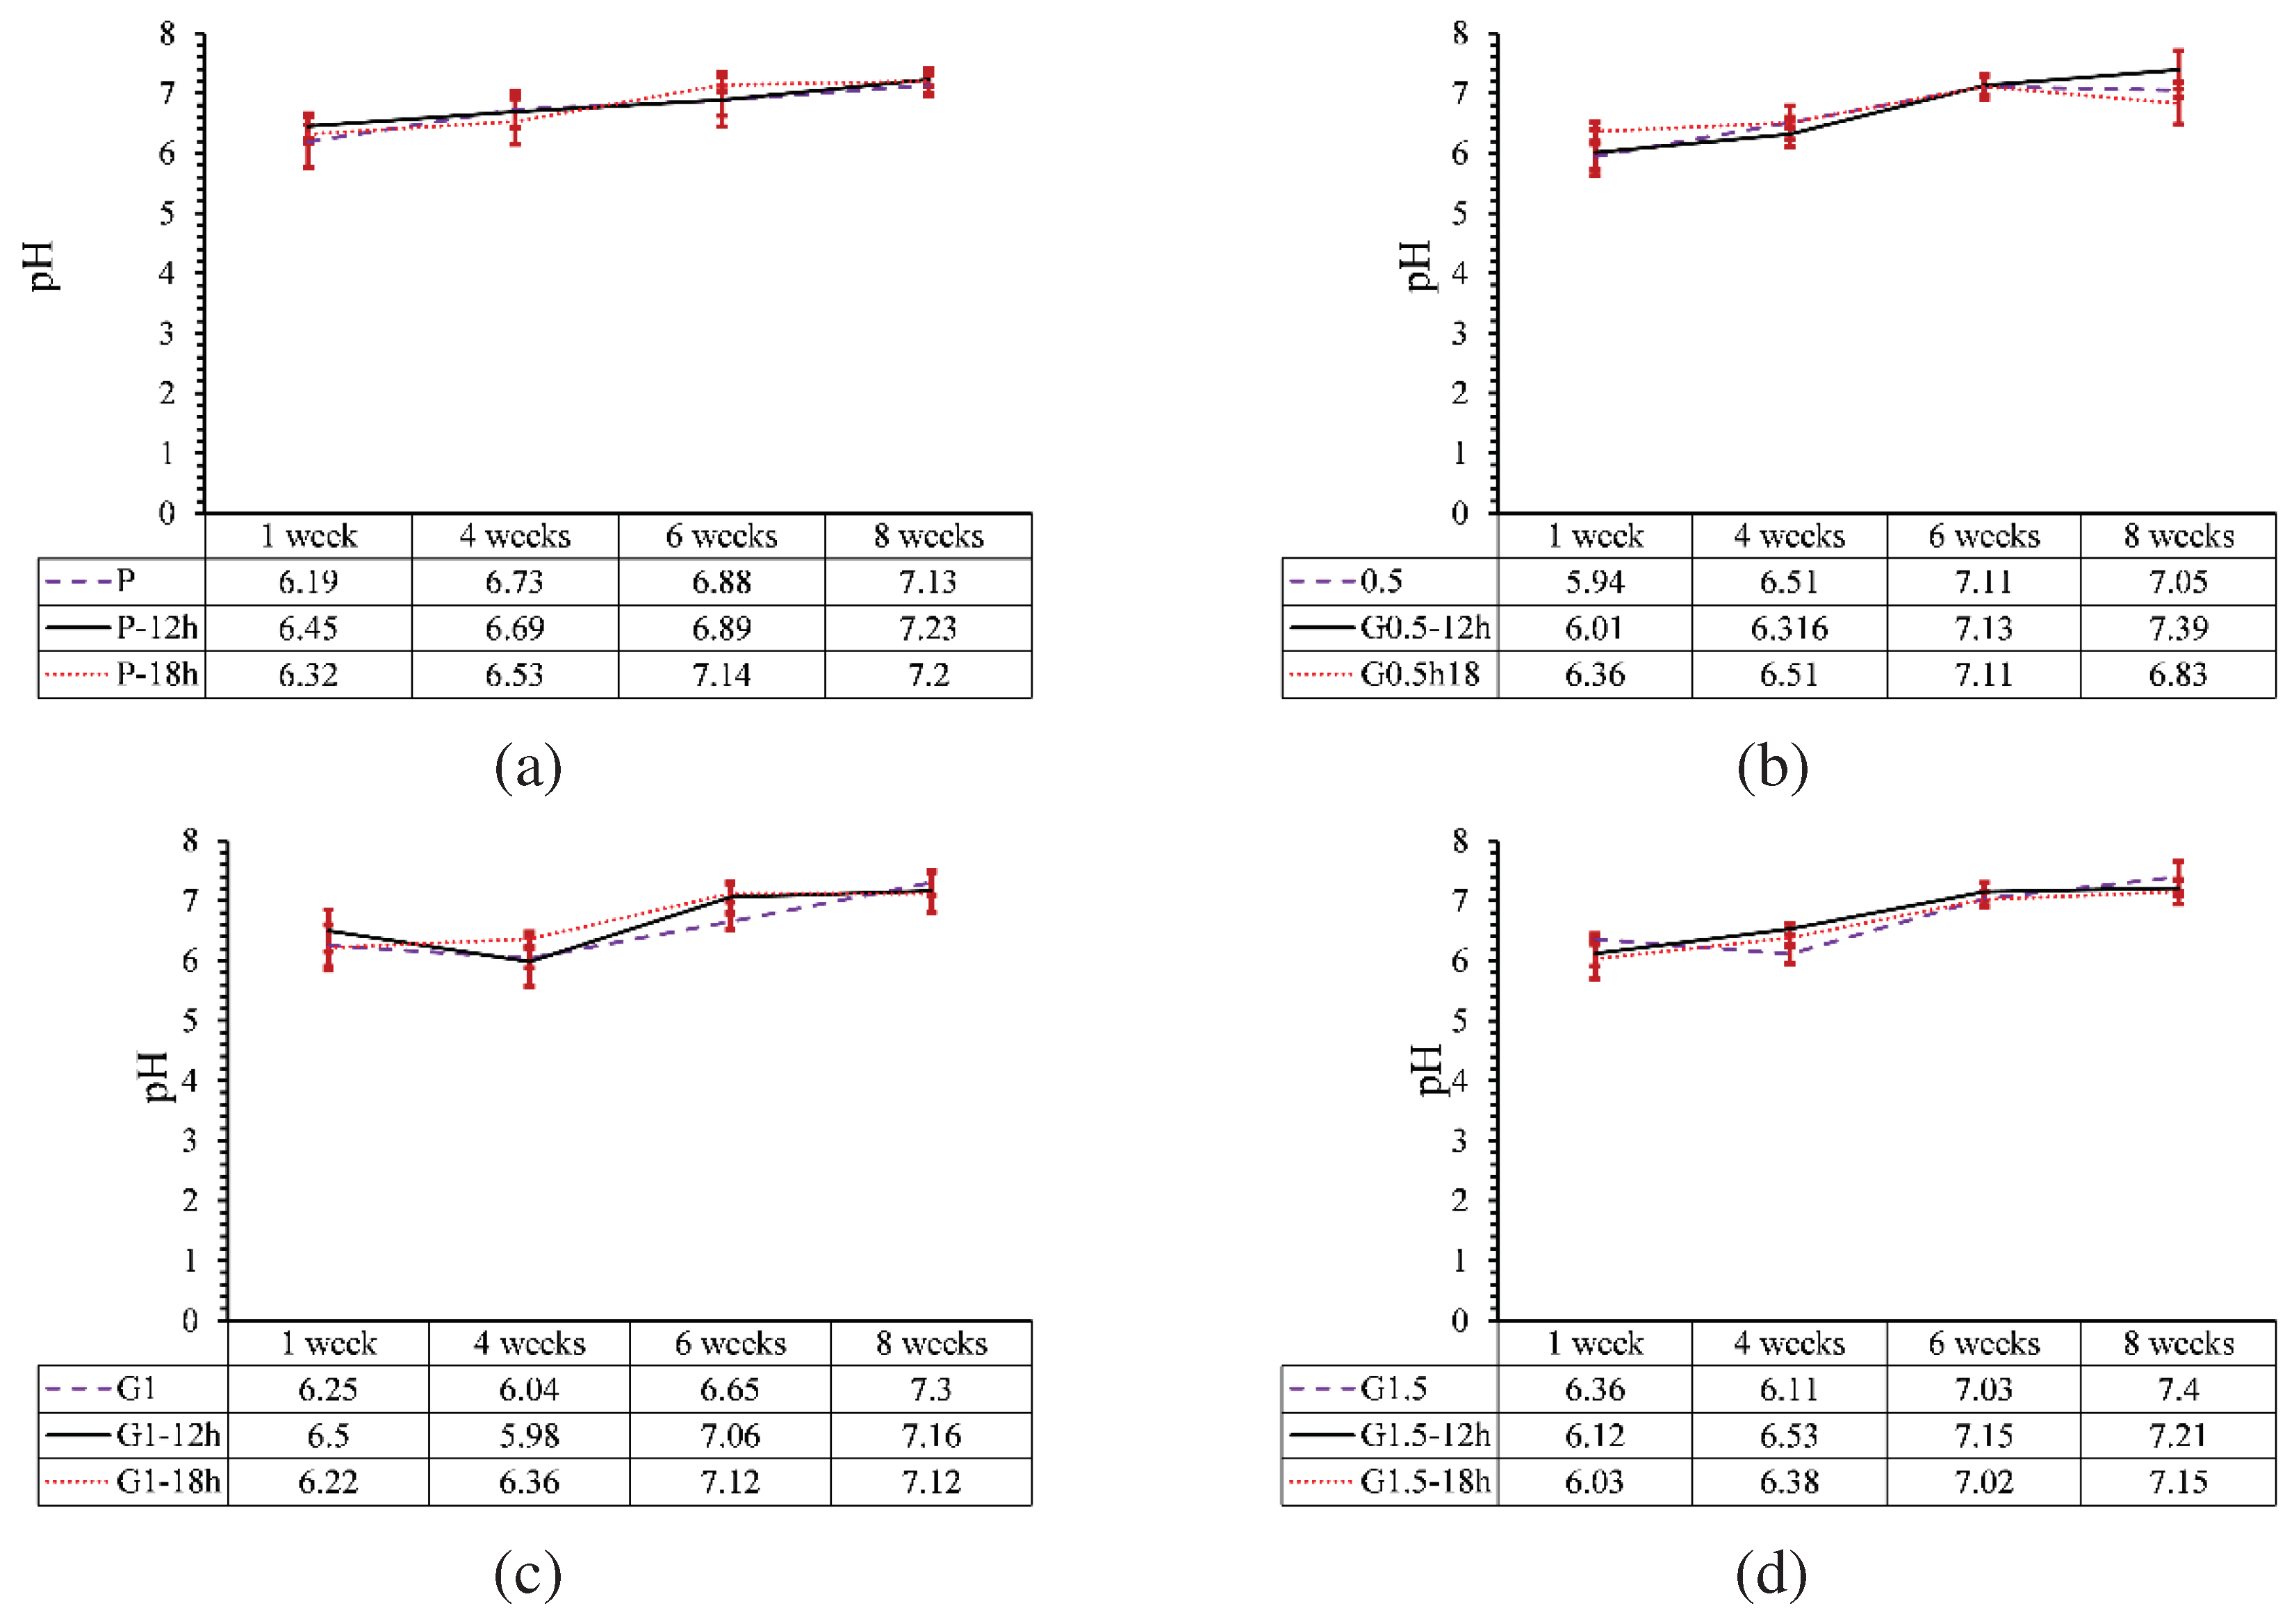
Heat treatment effect: Figure 18 illustrates the pH variation of heat-treated samples containing 0, 0.5, 1 and 1.5 wt. % GO over 1, 4, and 8 weeks. As shown in this figure, heat treatment did not have a significant effect on the pH of the sample environment. First, there is a significant reduction in pH value from 7.45 to approximately 6.2 for all samples in first week. Then, by changing the medium every two weeks, as can be seen in weight loss profile of the sample (Figure 14), degradation rate have been reduce as a result the pH reduction was decreased over the test time.
4. Conclusion
In this study, a novel strategy has been proposed to reinforce PLLA with GO nanoparticles 3D-printed via the DLP method to produce bone mimicking scaffold for tissue engineering applications. GO nanoparticles were added to PLLA in three levels of 0.5, 1, and 1.5 wt. % . All samples were post-cured and heat-treated and their mechanical properties were examined. Scaffolds with a pore size reange of 500-750 microns and a porosity range of 30-40% were successfully printed. Finally, the effect of GO content and heat treatment on the degradability and hydrophilicity were evaluated. The outcome of this study concludes the followings:
- The compression strength of parts containing 0, 0.5, 1, and 1.5% GO with heat treatment increased by 119, 151, 162 and 235%, respectively. Increasing the mechanical strength of samples containing GO was attributed to the esterification, which caused the formation of ester bonds between GO and PLLA.
- The hydrophilicity of PLLA increased with increasing GO percentage and the water contact angle had an 18% reduction.
- With the increase of GO nanoparticles, weight loss increased, which is due to increasing of hydrophilicity, and formation of microchannels between GO particles and PLLA.
- Heat treatment on samples without GO particles increased the degradation profile by 7% due to the formation of cracks in the parts.
- The effect of heat treatment on the degradation of printed parts reinforced with GO nanoparticles was opposed to the parts without GO and reduced the degradation profile of samples by 17%. Moreover, due to the low percentage of GO particles, the increase in GO content and heat treatment did not have much effect on the pH of the environment of the part.
Data Availability Statement
The raw/processed data required to reproduce these findings cannot be shared at this time as the data also forms part of an ongoing study.
Acknowledgments
The authors would like to appreciate the provided financial funds and generous supports of Tarbiat Modares University’s research deputy, under activities of “Zist Afza Sakht-e Modares” research core (grant number IG-39712).
References
- Bose, S., M. Roy, and A. Bandyopadhyay, Recent advances in bone tissue engineering scaffolds. Trends in biotechnology, 2012. 30(10): p. 546-554.
- Pinto, P., et al., Therapeutic strategies for bone regeneration: the importance of biomaterials testing in adequate animal models. Adv Compos Mater, 2016: p. 275-319.
- Agarwal, R. and A.J. García, Biomaterial strategies for engineering implants for enhanced osseointegration and bone repair. Advanced drug delivery reviews, 2015. 94: p. 53-62.
- Fillingham, Y. and J. Jacobs, Bone grafts and their substitutes. The bone & joint journal, 2016. 98(1_Supple_A): p. 6-9.
- Florencio-Silva, R., et al., Biology of bone tissue: structure, function, and factors that influence bone cells. BioMed research international, 2015. 2015.
- Marenzana, M. and T.R. Arnett, The key role of the blood supply to bone. Bone research, 2013. 1(1): p. 203-215.
- Gruskin, E., et al., Demineralized bone matrix in bone repair: history and use. Advanced drug delivery reviews, 2012. 64(12): p. 1063-1077.
- Shegarfi, H. and O. Reikeras, Bone transplantation and immune response. Journal of Orthopaedic Surgery, 2009. 17(2): p. 206-211.
- Bouët, G., et al., In vitro three-dimensional bone tissue models: from cells to controlled and dynamic environment. Tissue Engineering Part B: Reviews, 2015. 21(1): p. 133-156.
- Henkel, J., et al., Bone regeneration based on tissue engineering conceptions—a 21st century perspective. Bone research, 2013. 1(1): p. 216-248.
- Abou Neel, E.A., et al., Tissue engineering in dentistry. Journal of dentistry, 2014. 42(8): p. 915-928.
- Aravamudhan, A., et al., Natural and synthetic biomedical polymers. 2014, Elsevier Amsterdam, The Netherlands:.
- Chan, B. and K. Leong, Scaffolding in tissue engineering: general approaches and tissue-specific considerations. European spine journal, 2008. 17(4): p. 467-479.
- O'brien, F.J., Biomaterials & scaffolds for tissue engineering. Materials today, 2011. 14(3): p. 88-95.
- Gil-Castell, O., et al., In vitro validation of biomedical polyester-based scaffolds: Poly (lactide-co-glycolide) as model-case. Polymer Testing, 2018. 66: p. 256-267.
- Thavornyutikarn, B., et al., Bone tissue engineering scaffolding: computer-aided scaffolding techniques. Progress in biomaterials, 2014. 3(2-4): p. 61-102.
- Cao, H. and N. Kuboyama, A biodegradable porous composite scaffold of PGA/β-TCP for bone tissue engineering. Bone, 2010. 46(2): p. 386-395.
- Bajaj, P., et al., 3D biofabrication strategies for tissue engineering and regenerative medicine. Annual review of biomedical engineering, 2014. 16: p. 247-276.
- Torabi, K., E. Farjood, and S. Hamedani, Rapid prototyping technologies and their applications in prosthodontics, a review of literature. Journal of Dentistry, 2015. 16(1): p. 1.
- Hedayati, S.K., et al., 3D printed PCL scaffold reinforced with continuous biodegradable fiber yarn: A study on mechanical and cell viability properties. Polymer Testing, 2020. 83: p. 106347.
- Roseti, L., et al., Scaffolds for bone tissue engineering: state of the art and new perspectives. Materials Science and Engineering: C, 2017. 78: p. 1246-1262.
- Bhattacharjee, N., et al., The upcoming 3D-printing revolution in microfluidics. Lab on a Chip, 2016. 16(10): p. 1720-1742.
- Fiedler, B., et al., Fundamental aspects of nano-reinforced composites. Composites science and technology, 2006. 66(16): p. 3115-3125.
- Lee, C., et al., Measurement of the elastic properties and intrinsic strength of monolayer graphene. science, 2008. 321(5887): p. 385-388.
- Terrones, M., et al., Interphases in graphene polymer-based nanocomposites: achievements and challenges. 2011, Wiley Online Library.
- Lin, D., A laser sintered layer of metal matrix consisting of 0D, 1D and 2D nanomaterials and its mechanical behaviors. 2013, Purdue University.
- Dasari, B.L., et al., Mechanical properties of graphene oxide reinforced aluminium matrix composites. Composites Part B: Engineering, 2018. 145: p. 136-144.
- Saed, A.B., et al., Functionalized poly l-lactic acid synthesis and optimization of process parameters for 3D printing of porous scaffolds via digital light processing (DLP) method. Journal of Manufacturing Processes, 2020. 56: p. 550-561.
- Saed, A.B., et al., An in vitro study on the key features of Poly L-lactic acid/biphasic calcium phosphate scaffolds fabricated via DLP 3D printing for bone grafting. European Polymer Journal, 2020. 141: p. 110057.
- Hedayati, S.K., et al., Additive manufacture of PCL/nHA scaffolds reinforced with biodegradable continuous Fibers: Mechanical Properties, in-vitro degradation Profile, and cell study. European Polymer Journal, 2022. 162: p. 110876.
- Manapat, J.Z., et al., High-strength stereolithographic 3D printed nanocomposites: graphene oxide metastability. ACS applied materials & interfaces, 2017. 9(11): p. 10085-10093.
- Karageorgiou, V. and D. Kaplan, Porosity of 3D biomaterial scaffolds and osteogenesis. Biomaterials, 2005. 26(27): p. 5474-5491.
- Morales-Narváez, E., et al., Graphene-based biosensors: going simple. Advanced Materials, 2017. 29(7): p. 1604905.
- Kaniyoor, A., T.T. Baby, and S. Ramaprabhu, Graphene synthesis via hydrogen induced low temperature exfoliation of graphite oxide. Journal of Materials Chemistry, 2010. 20(39): p. 8467-8469.
- Geng, L.-H., et al., Investigation of poly (L-lactic acid)/graphene oxide composites crystallization and nanopore foaming behaviors via supercritical carbon dioxide low temperature foaming. Journal of Materials Research, 2016. 31(3): p. 348-359.
- Shuai, C., et al., Graphene oxide induces ester bonds hydrolysis of poly-l-lactic acid scaffold to accelerate degradation. International Journal of Bioprinting, 2020. 6(1).
- Eckhart, K.E., et al., Covalent conjugation of bioactive peptides to graphene oxide for biomedical applications. Biomaterials science, 2019. 7(9): p. 3876-3885.
- Salvo, P., et al., Graphene-based devices for measuring pH. Sensors and Actuators B: Chemical, 2018. 256: p. 976-991.
Figure 1.
Scheme of DLP method.
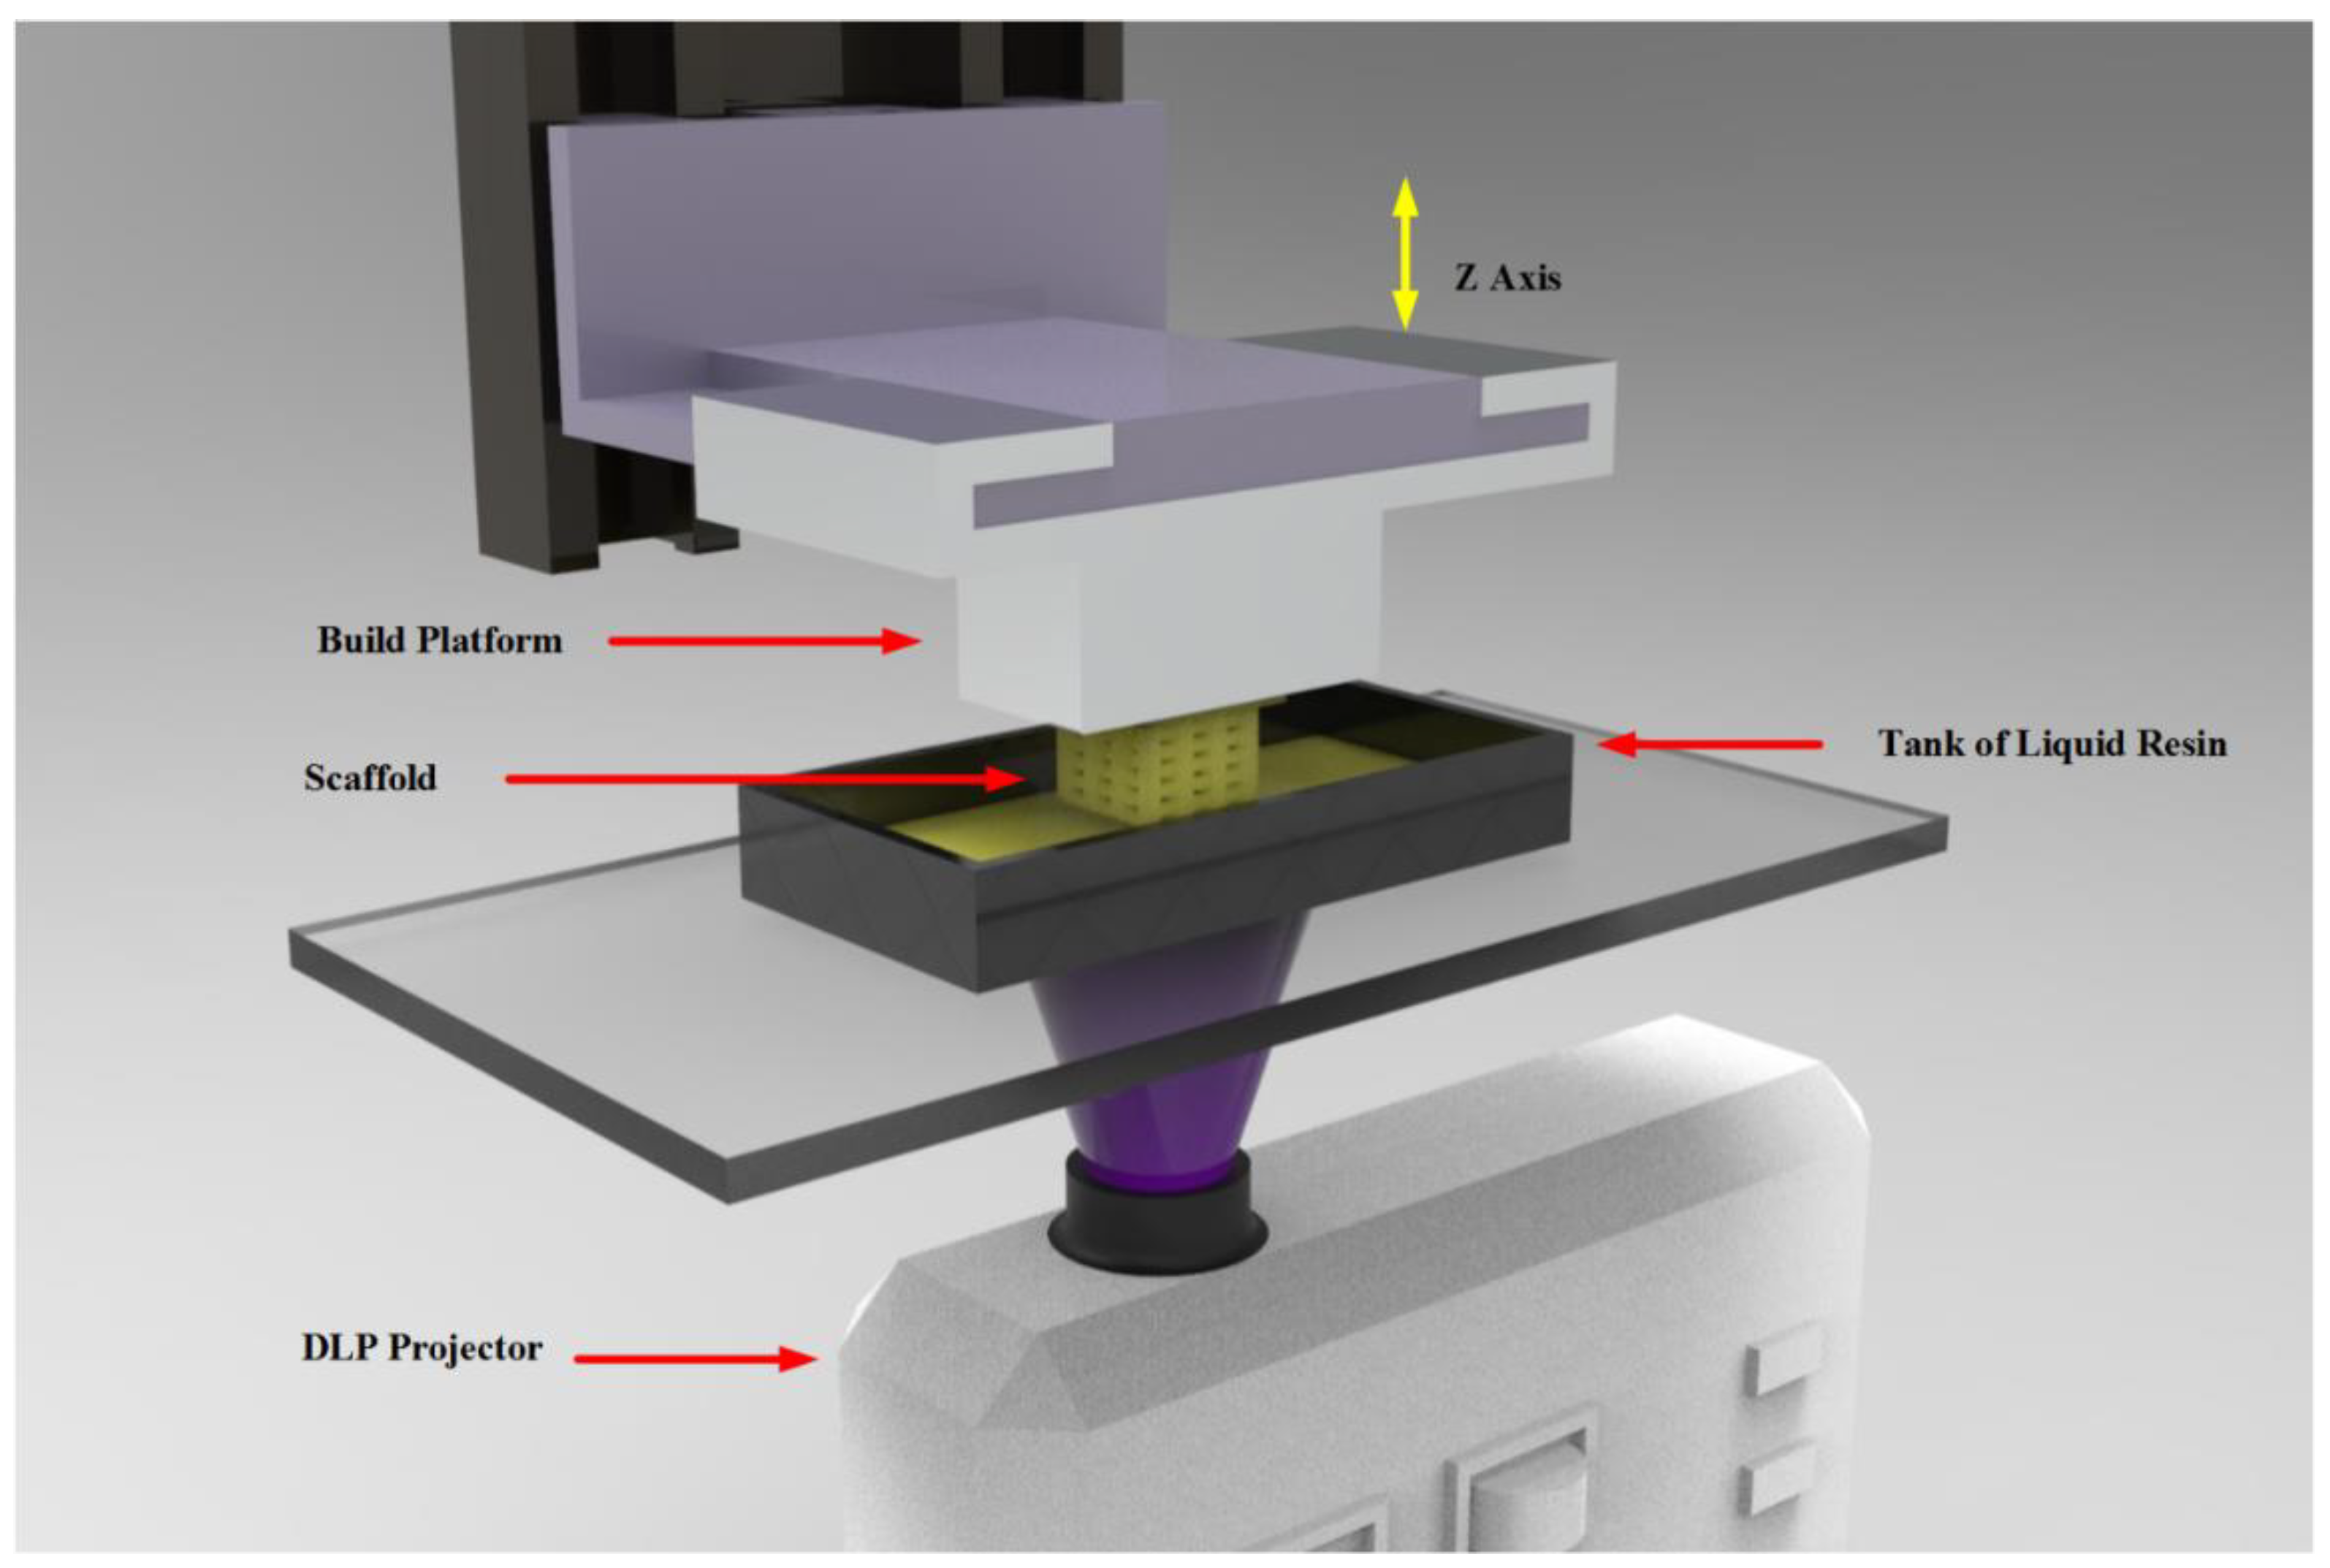
Figure 2.
The designed scaffold.
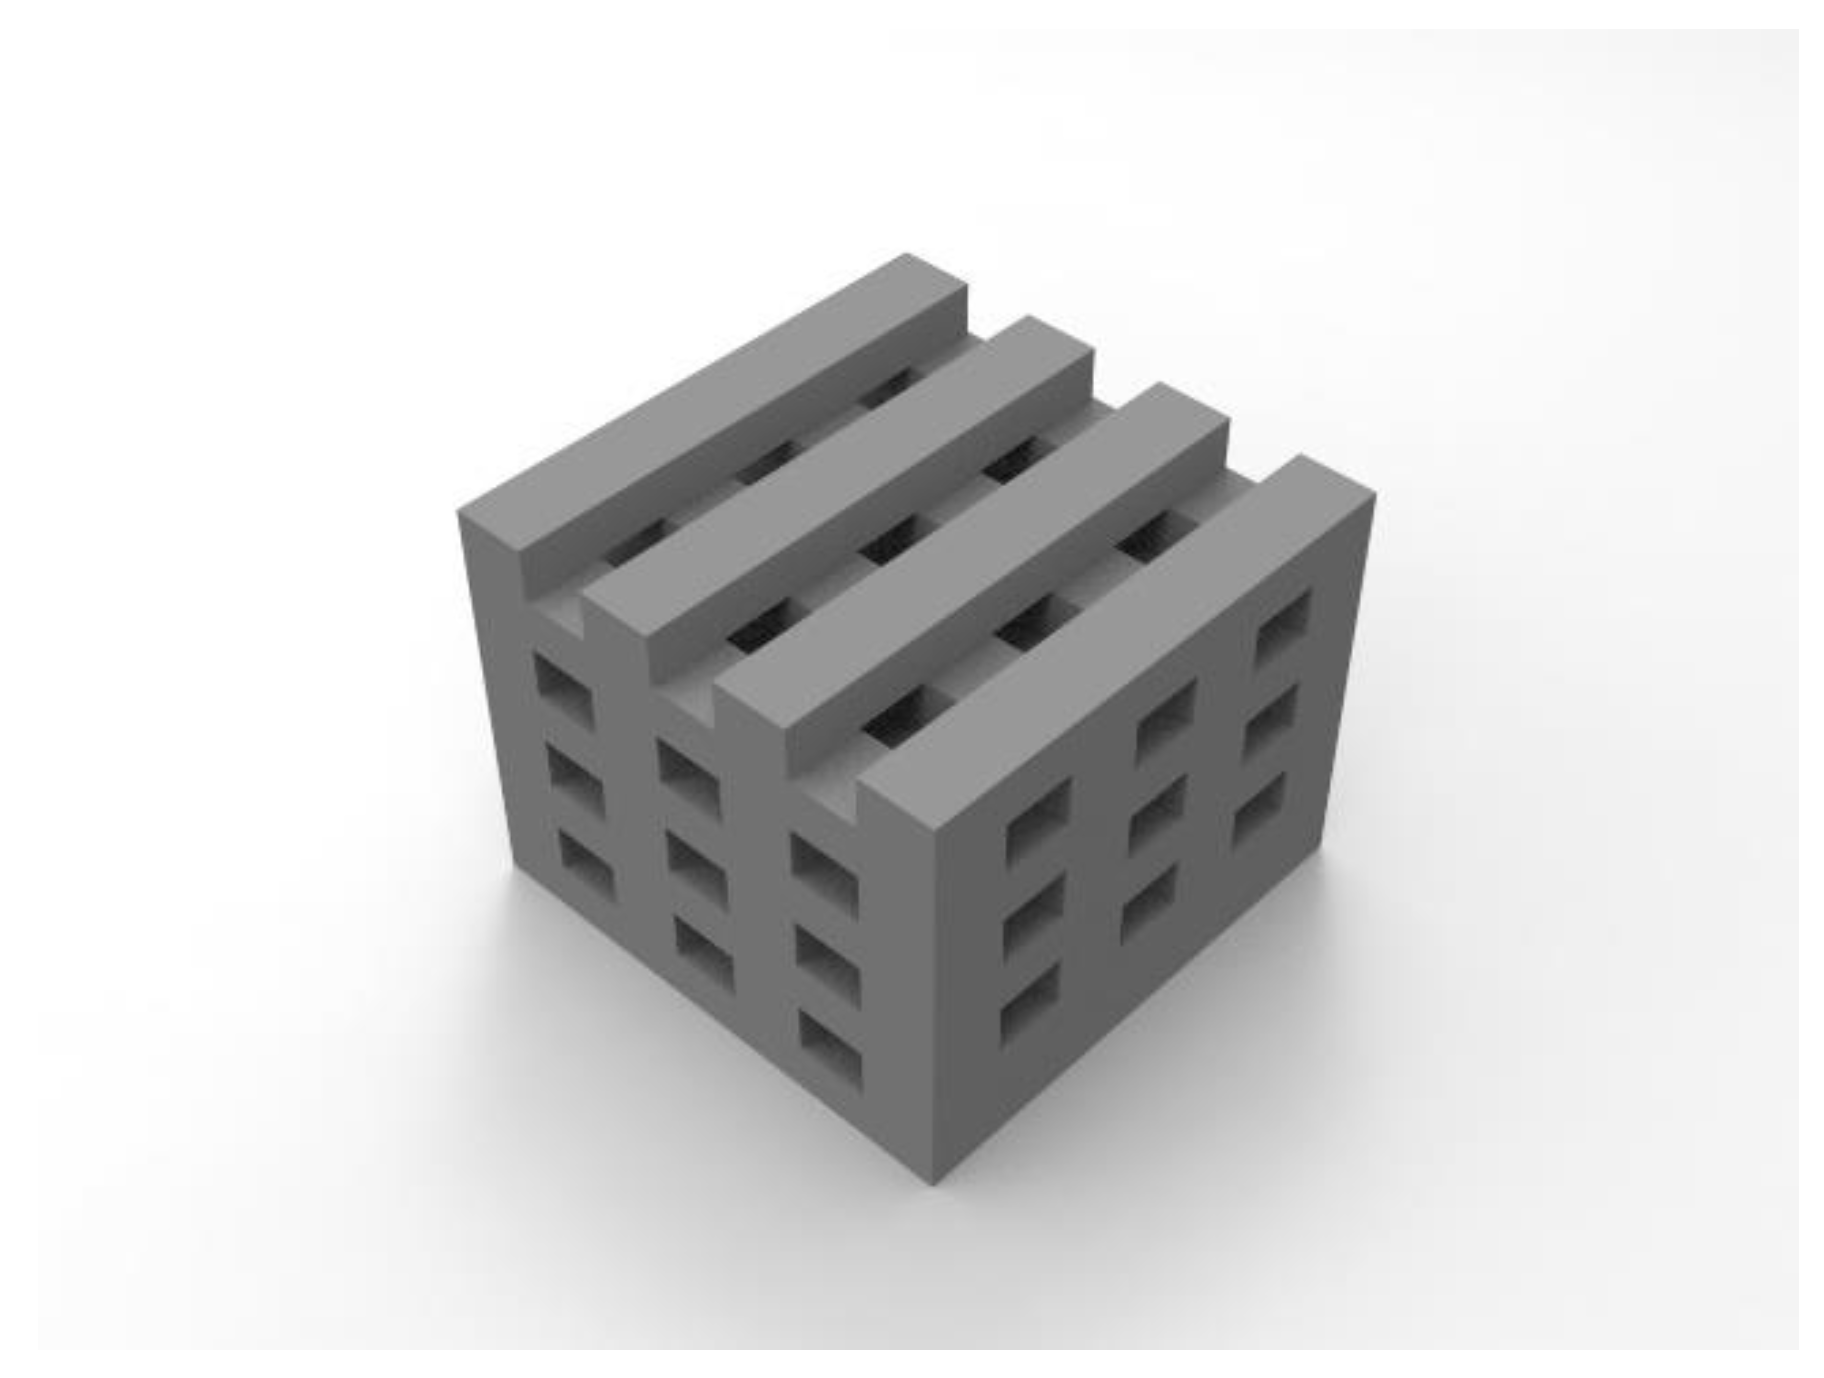
Figure 3.
Stress-strain curves of GO-free specimens for various post-curing times.
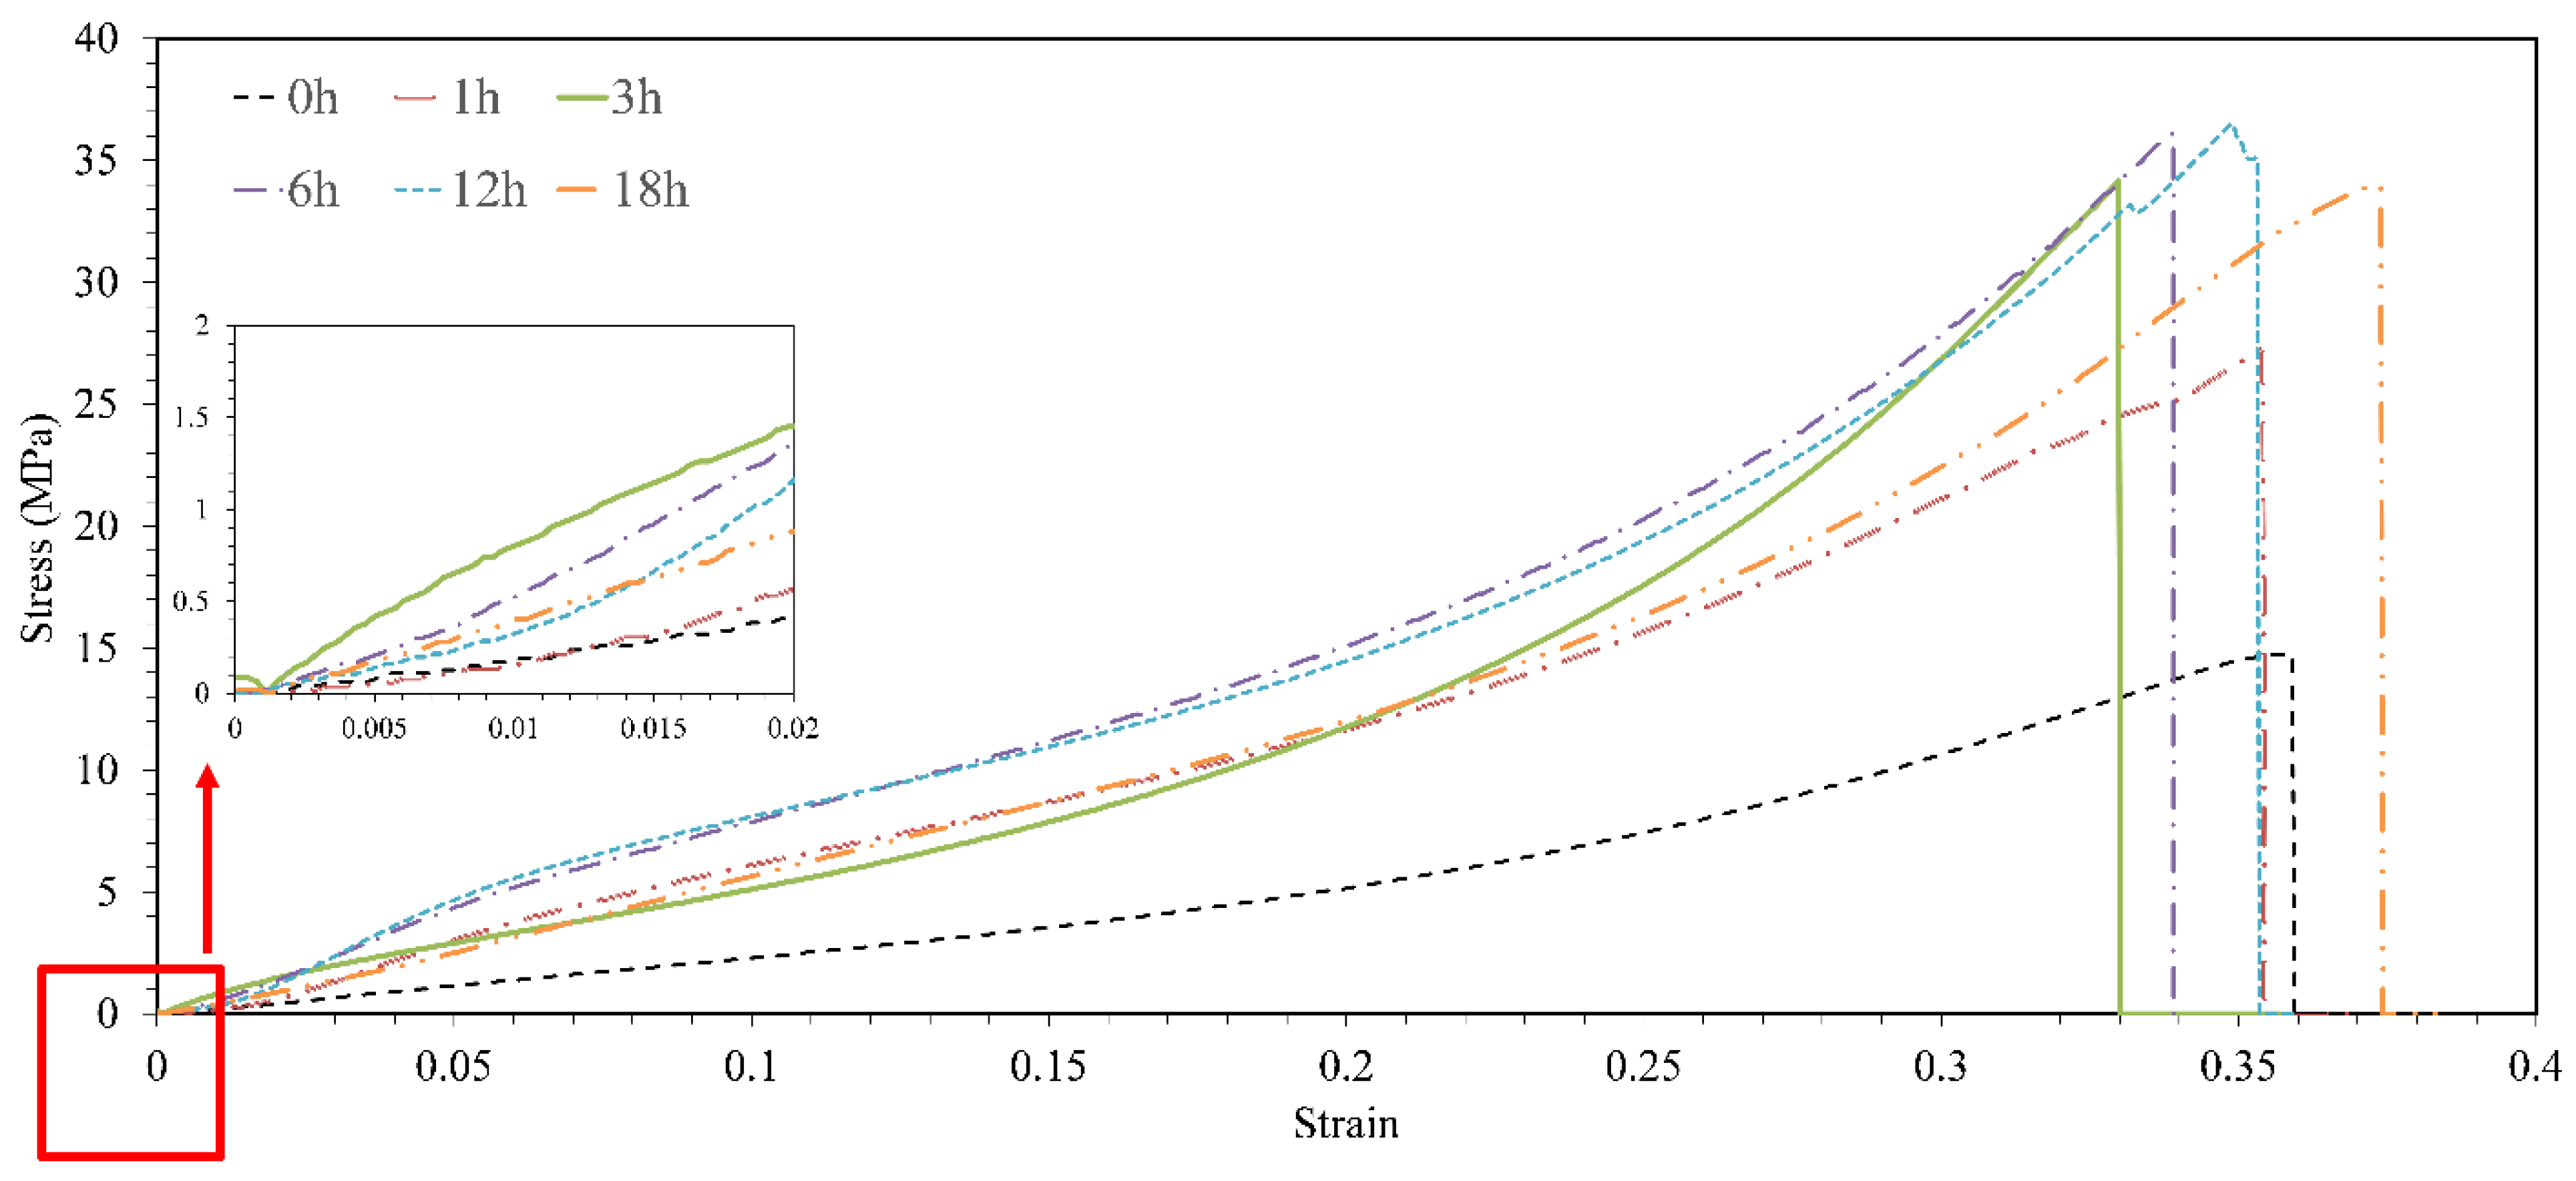
Figure 4.
Compressive strength and Young modulus of GO-free samples for various post-curing times.
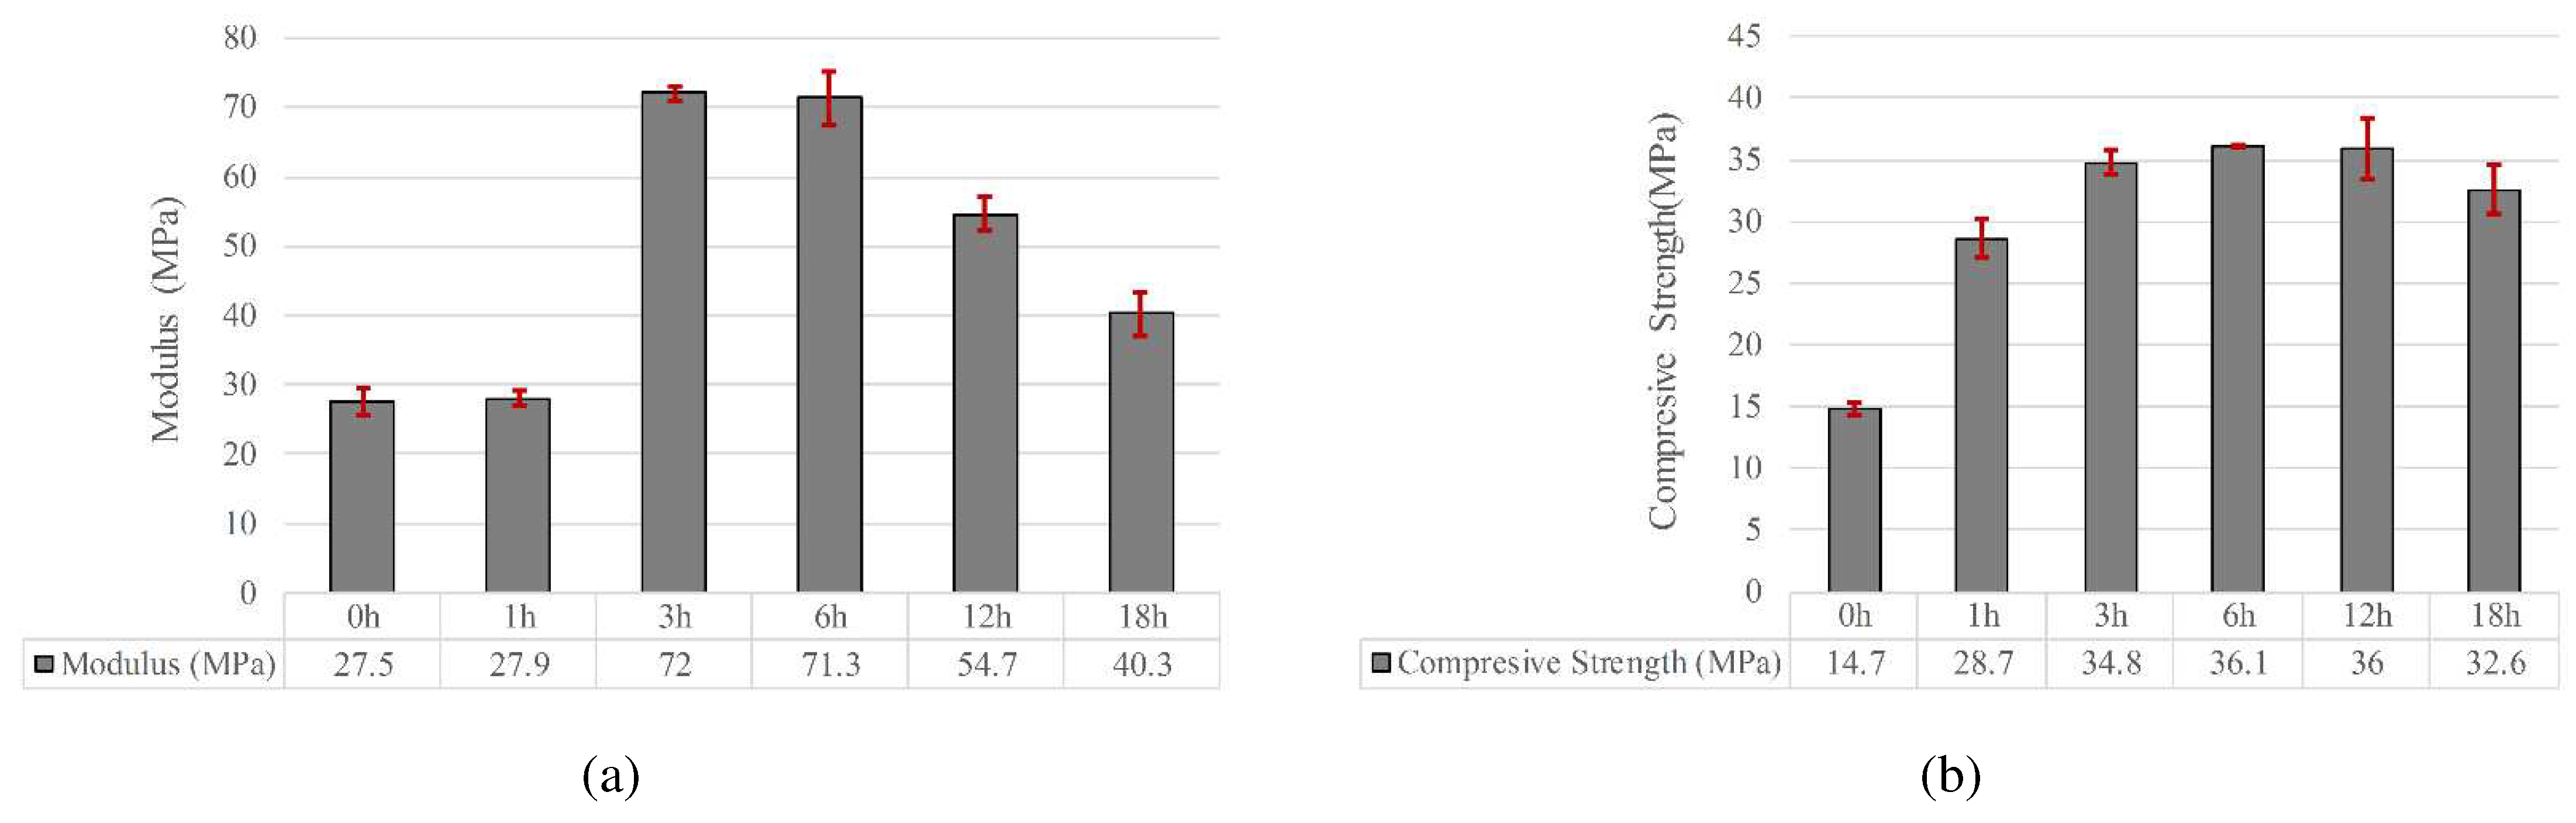
Figure 5.
(a) The surface of GO-free specimen before post cure and (b) after post cure.
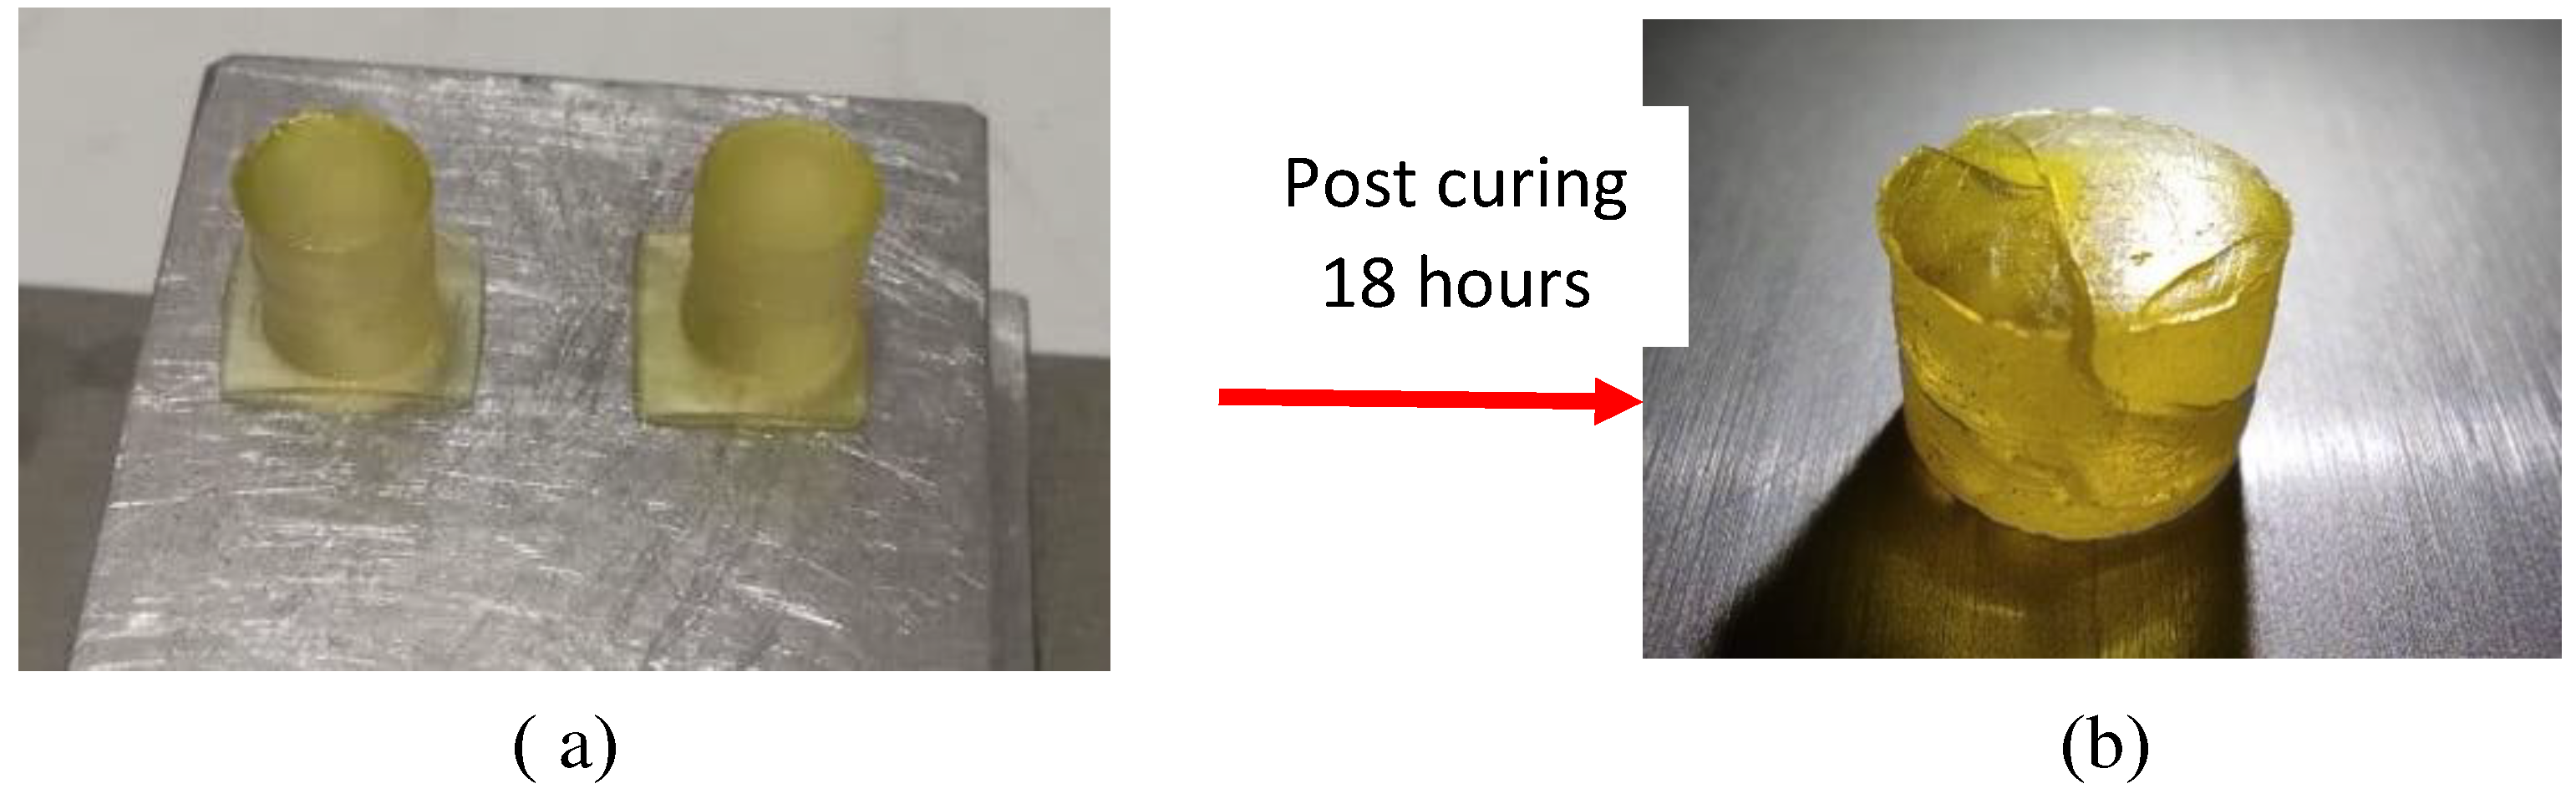
Figure 6.
Stress-strain curves of GO-free printed specimens at various heat treatment times (P: non-reinforced samples, numbers denote the heat treatment time).
Figure 6.
Stress-strain curves of GO-free printed specimens at various heat treatment times (P: non-reinforced samples, numbers denote the heat treatment time).
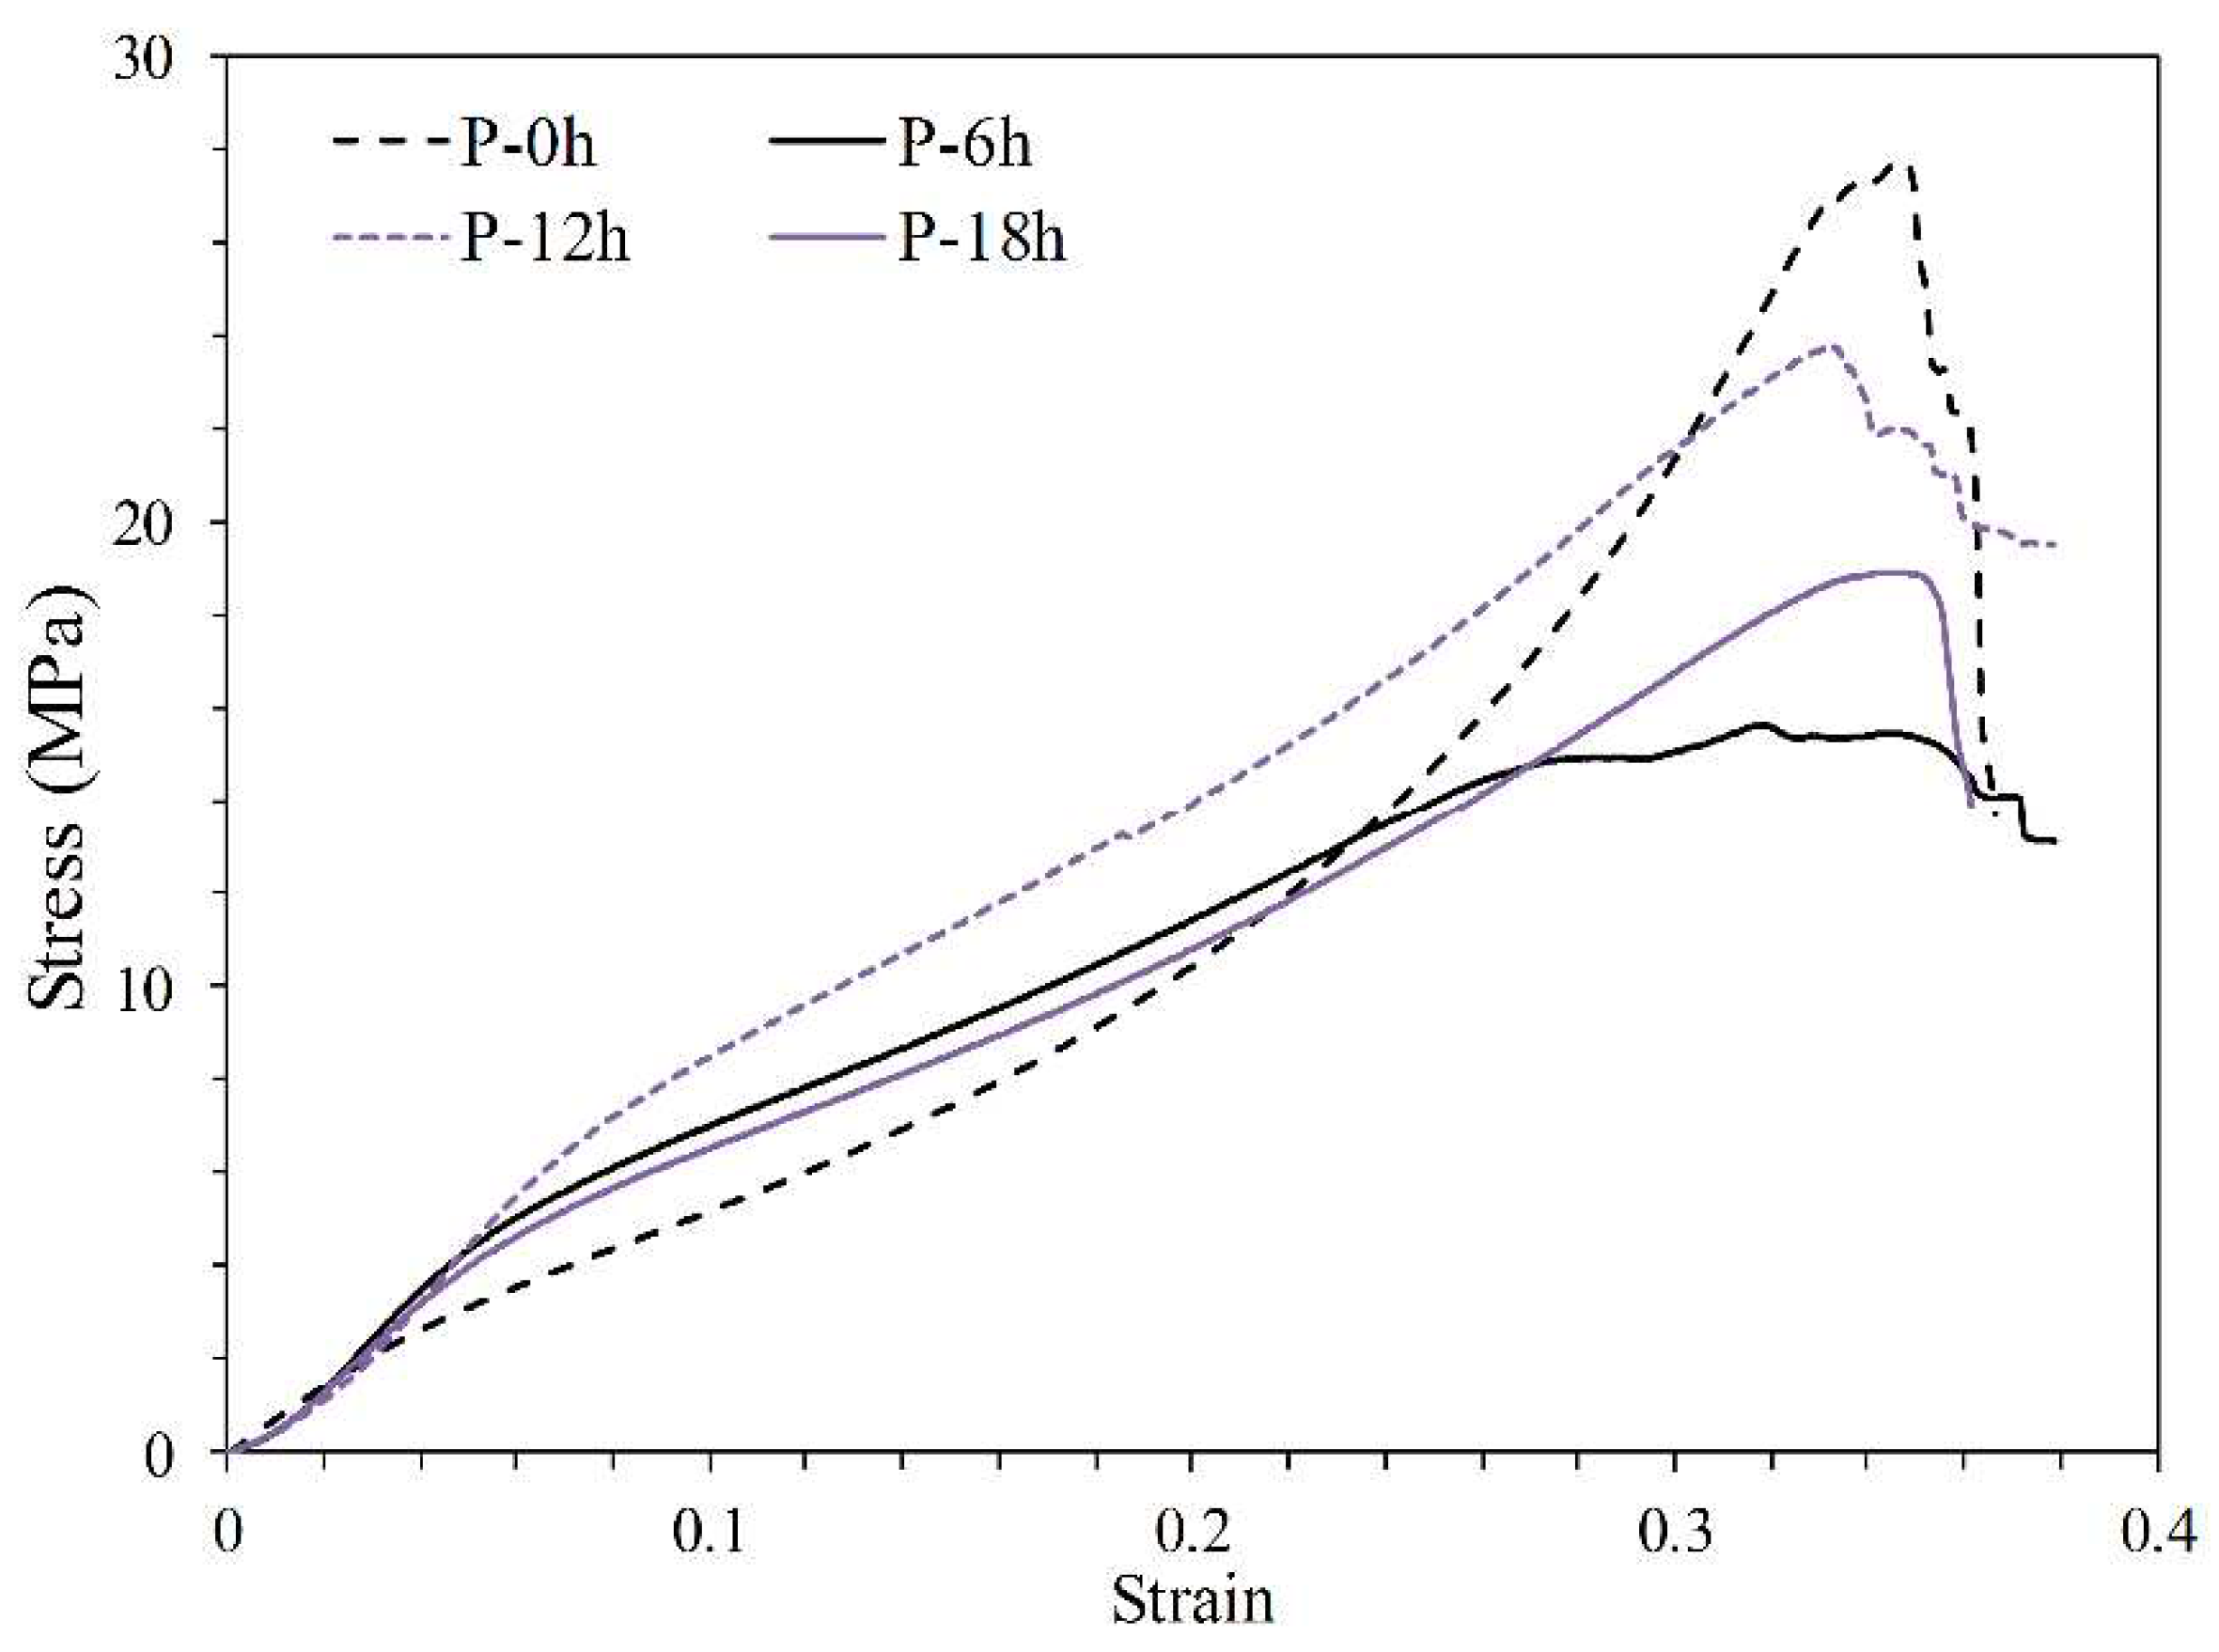
Figure 7.
Compressive strength of GO-reinforced samples at various heat treatment times;(a) 0.5wt.% of GO (b) 1wt.% of GO (c) 1.5wt.% of GO.
Figure 7.
Compressive strength of GO-reinforced samples at various heat treatment times;(a) 0.5wt.% of GO (b) 1wt.% of GO (c) 1.5wt.% of GO.
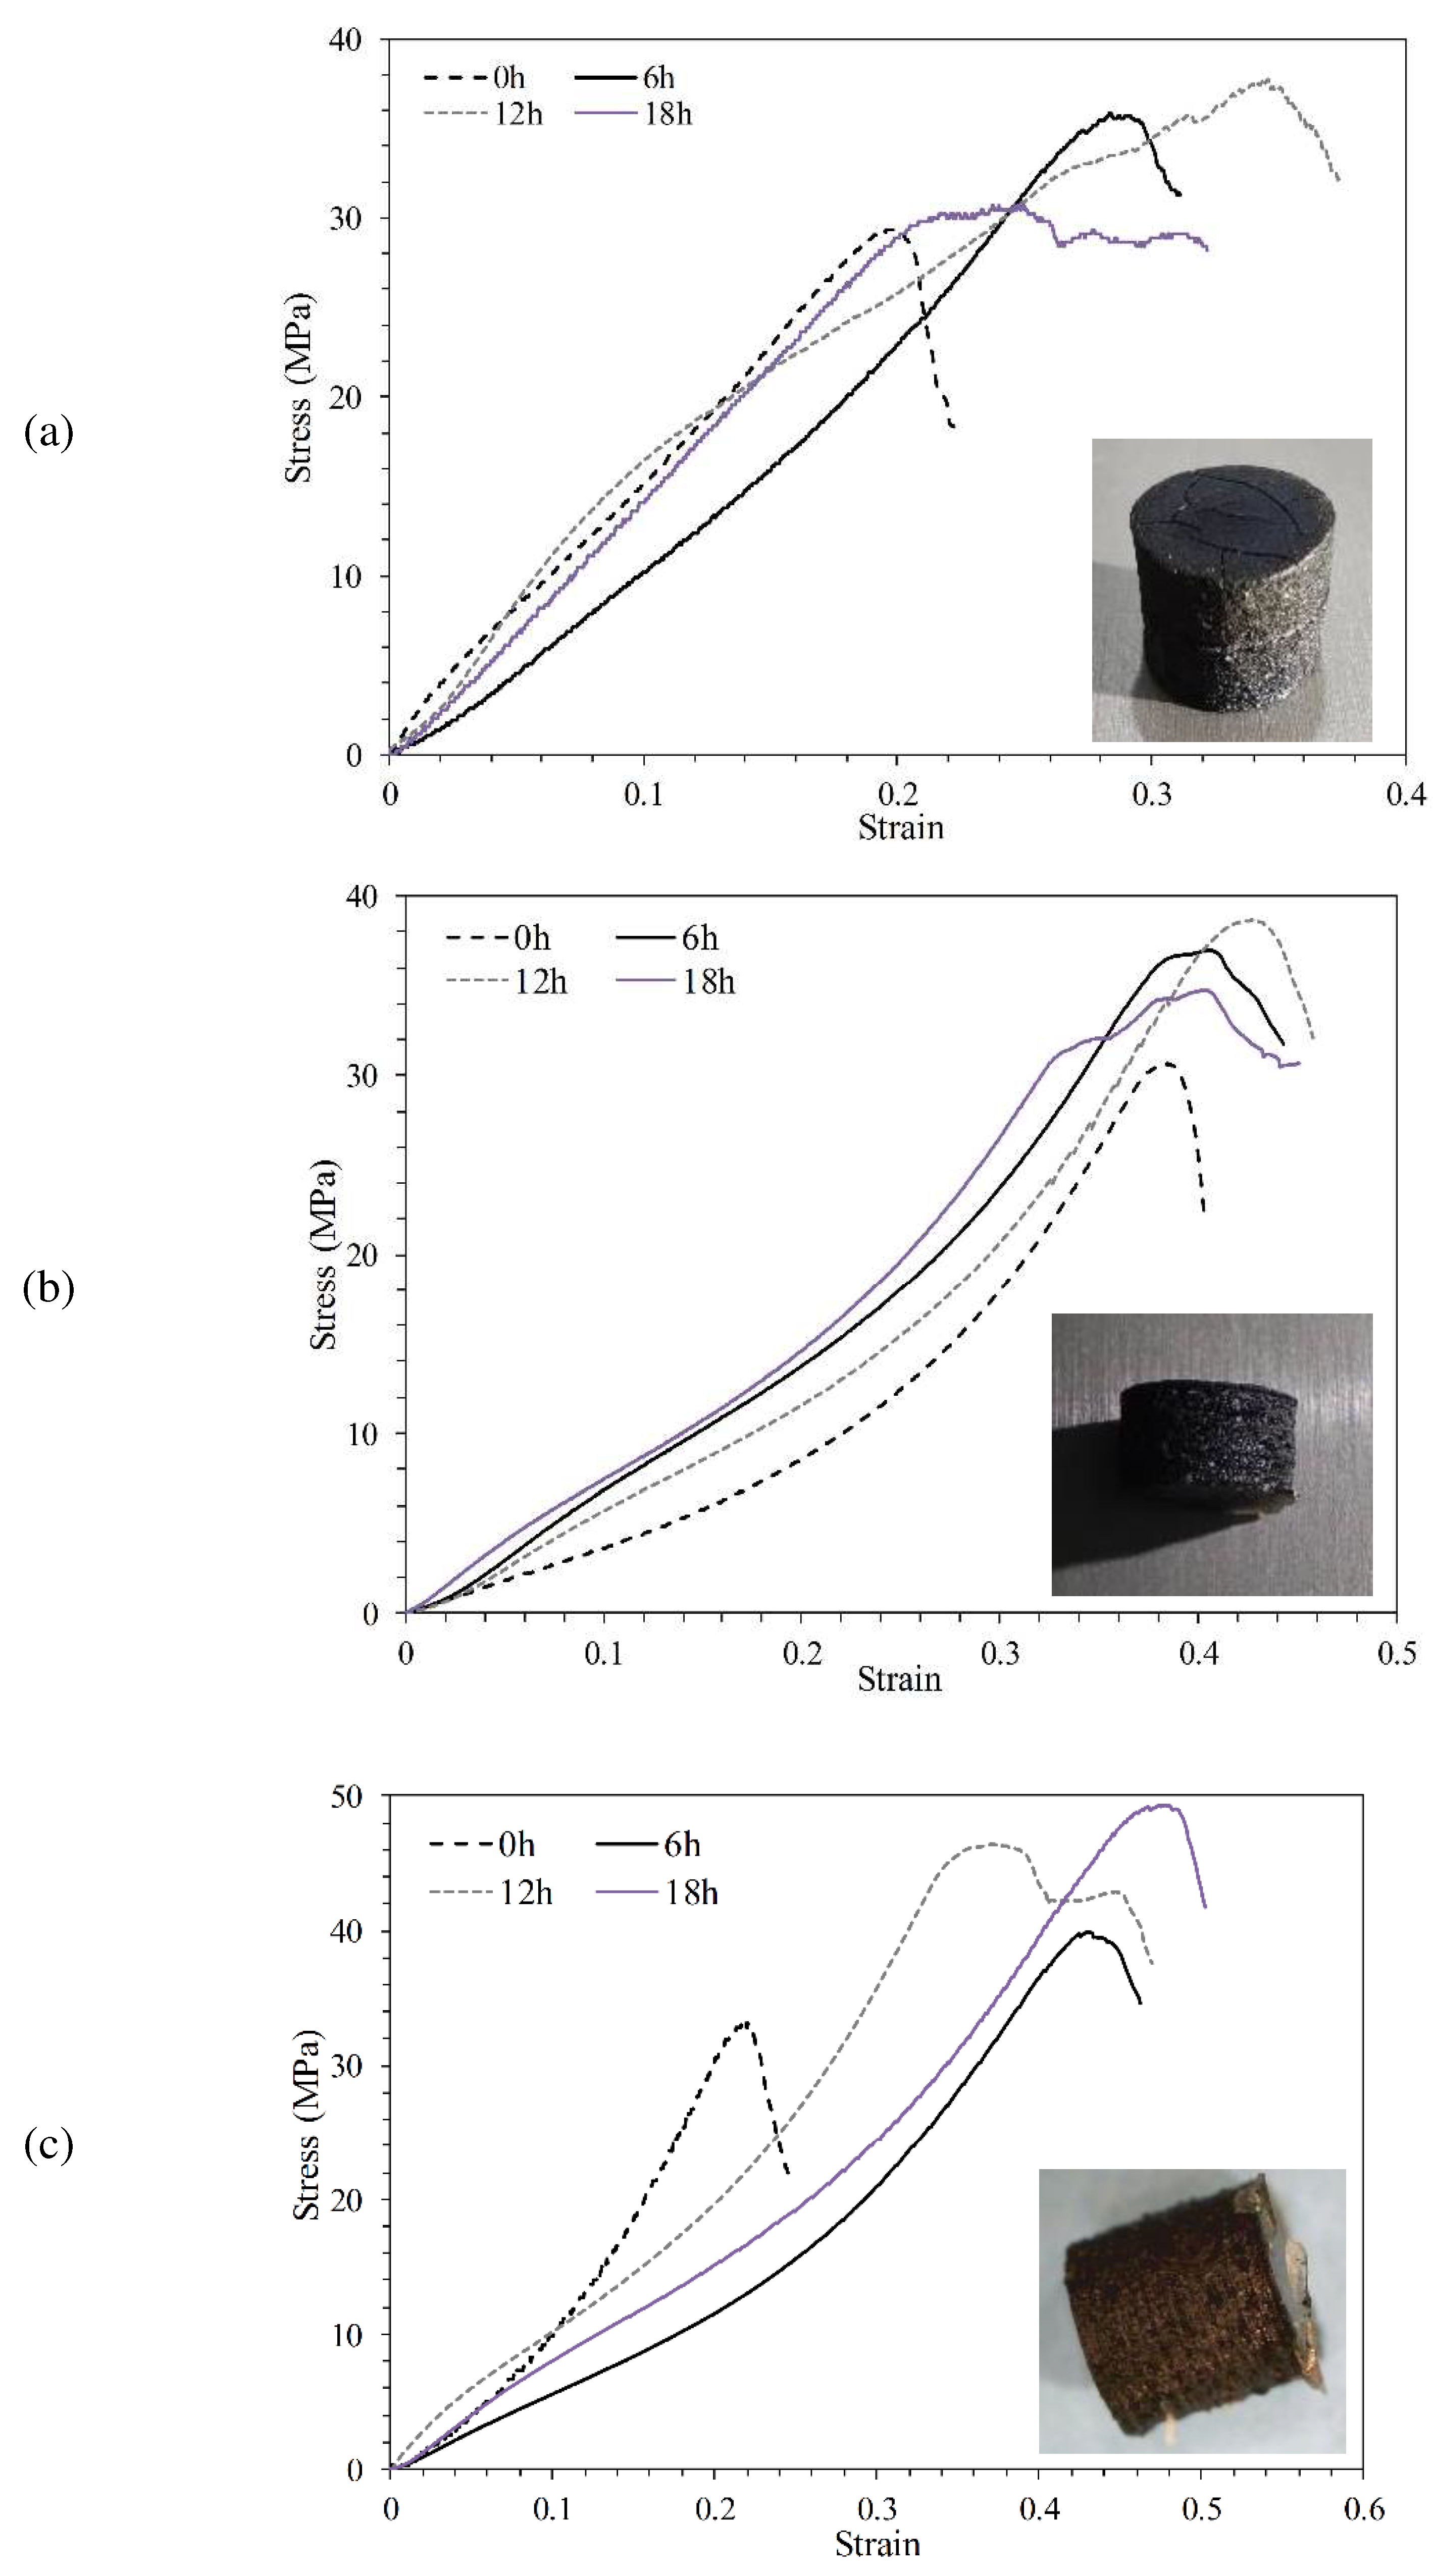
Figure 8.
Scheme of esterification and creation of cross-links between GO and PLLA [31].
Figure 8.
Scheme of esterification and creation of cross-links between GO and PLLA [31].
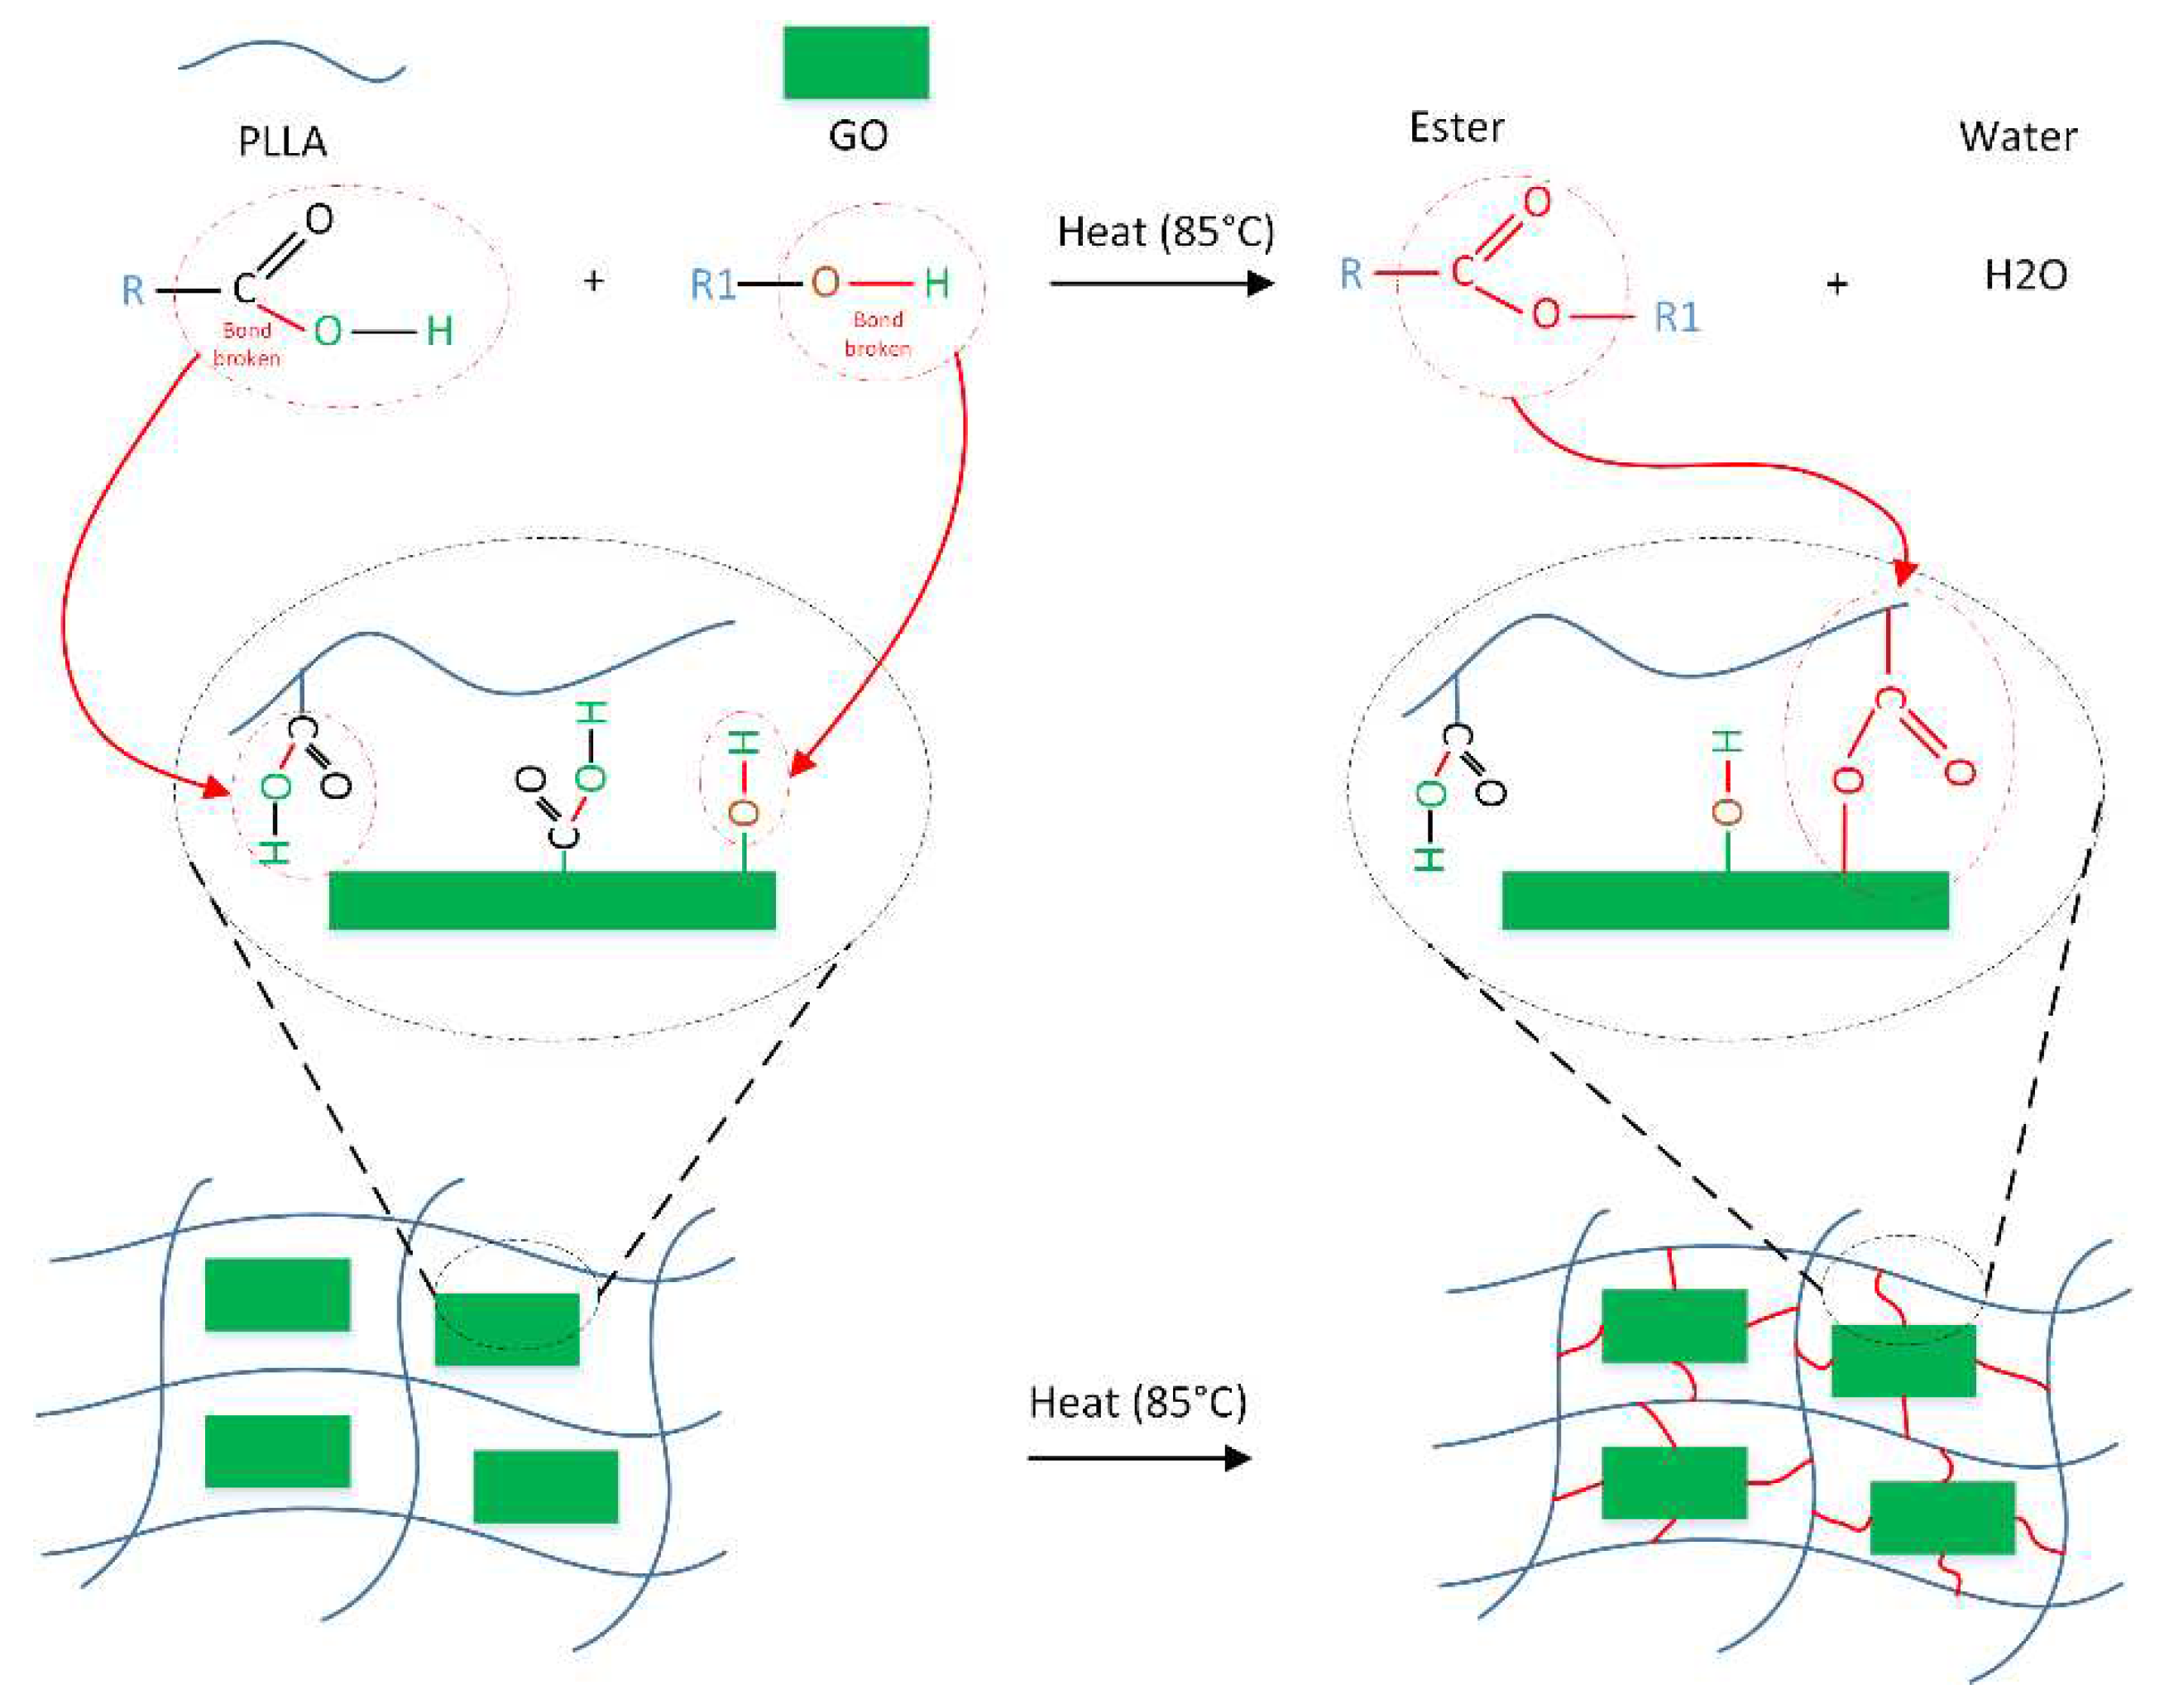
Figure 9.
FTIR results to validate the ester bond formation between PLLA and GO, at the content of (a) 0wt% (b) 1.5wt%.
Figure 9.
FTIR results to validate the ester bond formation between PLLA and GO, at the content of (a) 0wt% (b) 1.5wt%.
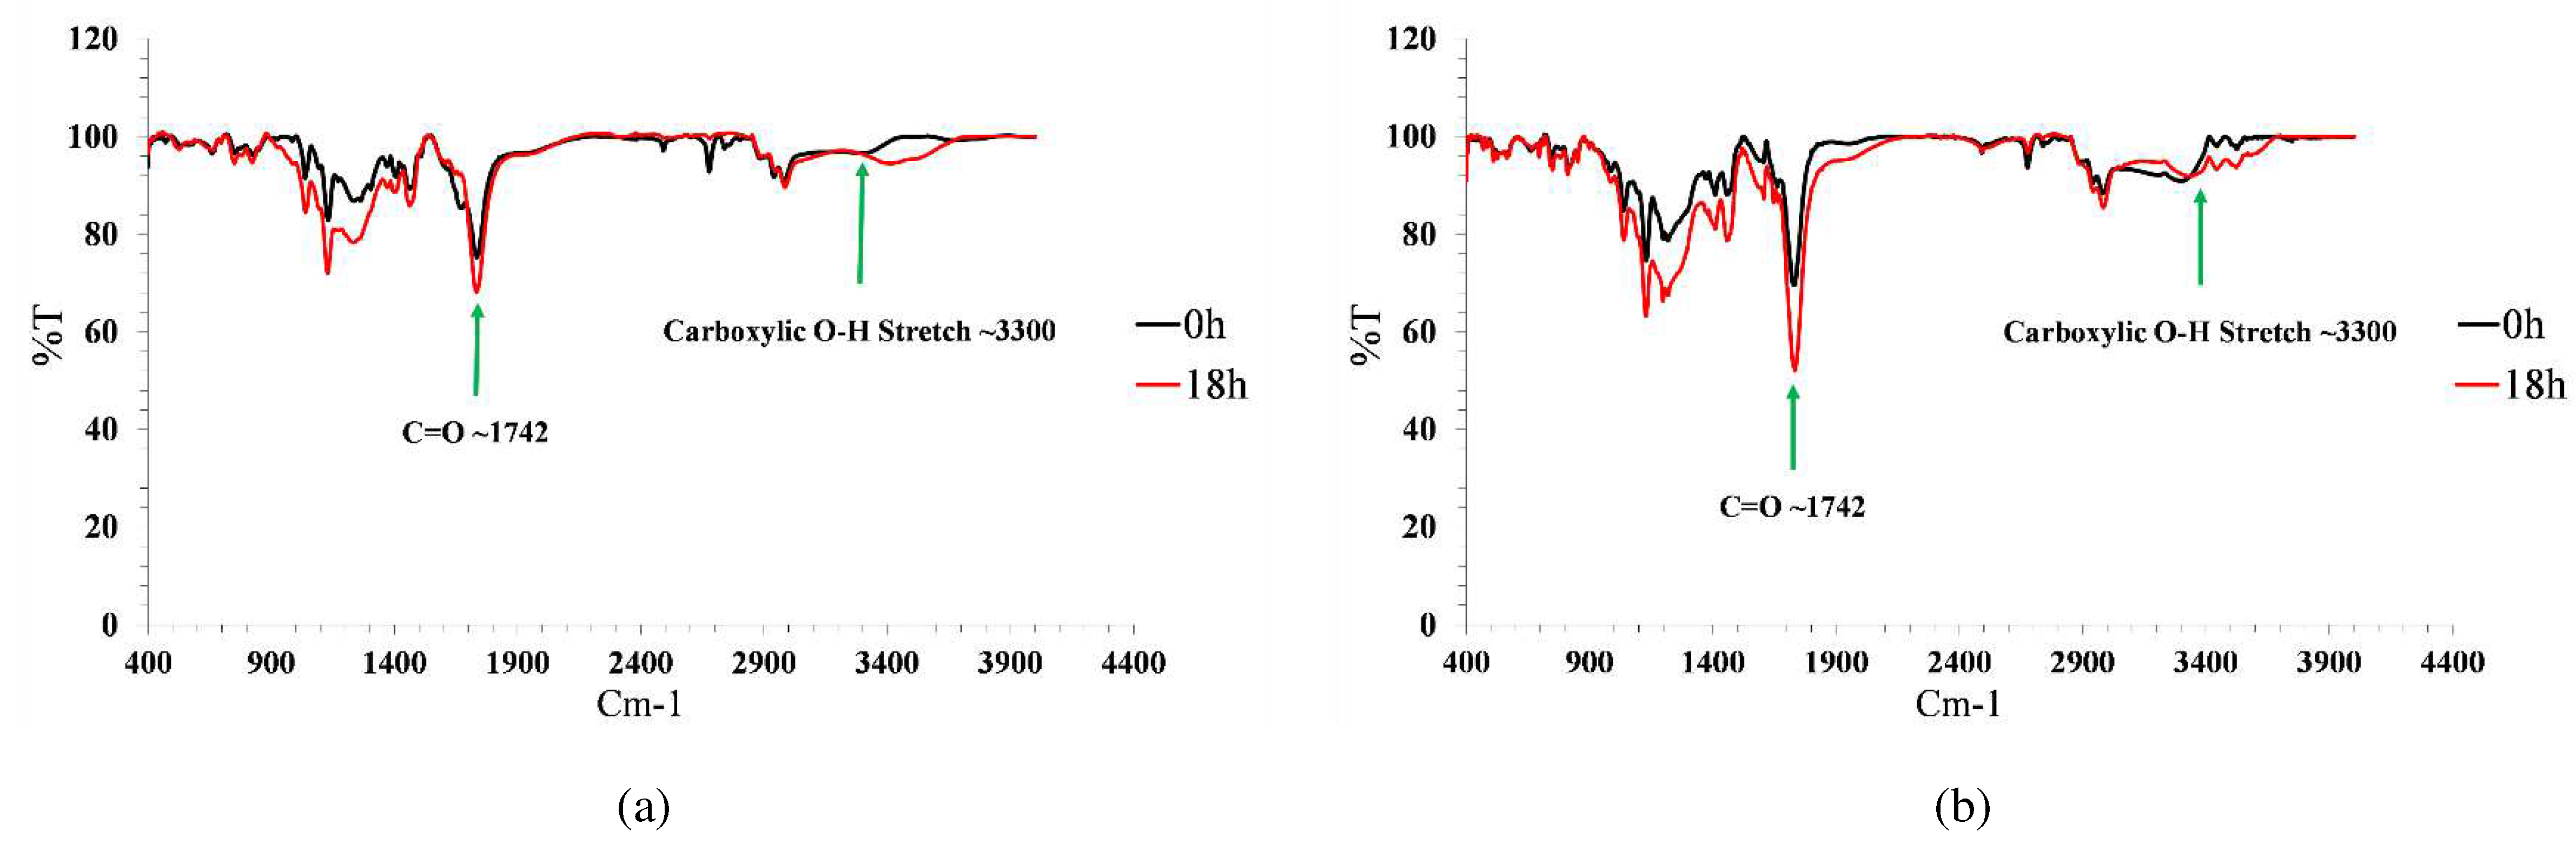
Figure 10.
Digital microscopic picture of printed scaffold (a) 0wt% of GO (b) 1.5wt% of GO.
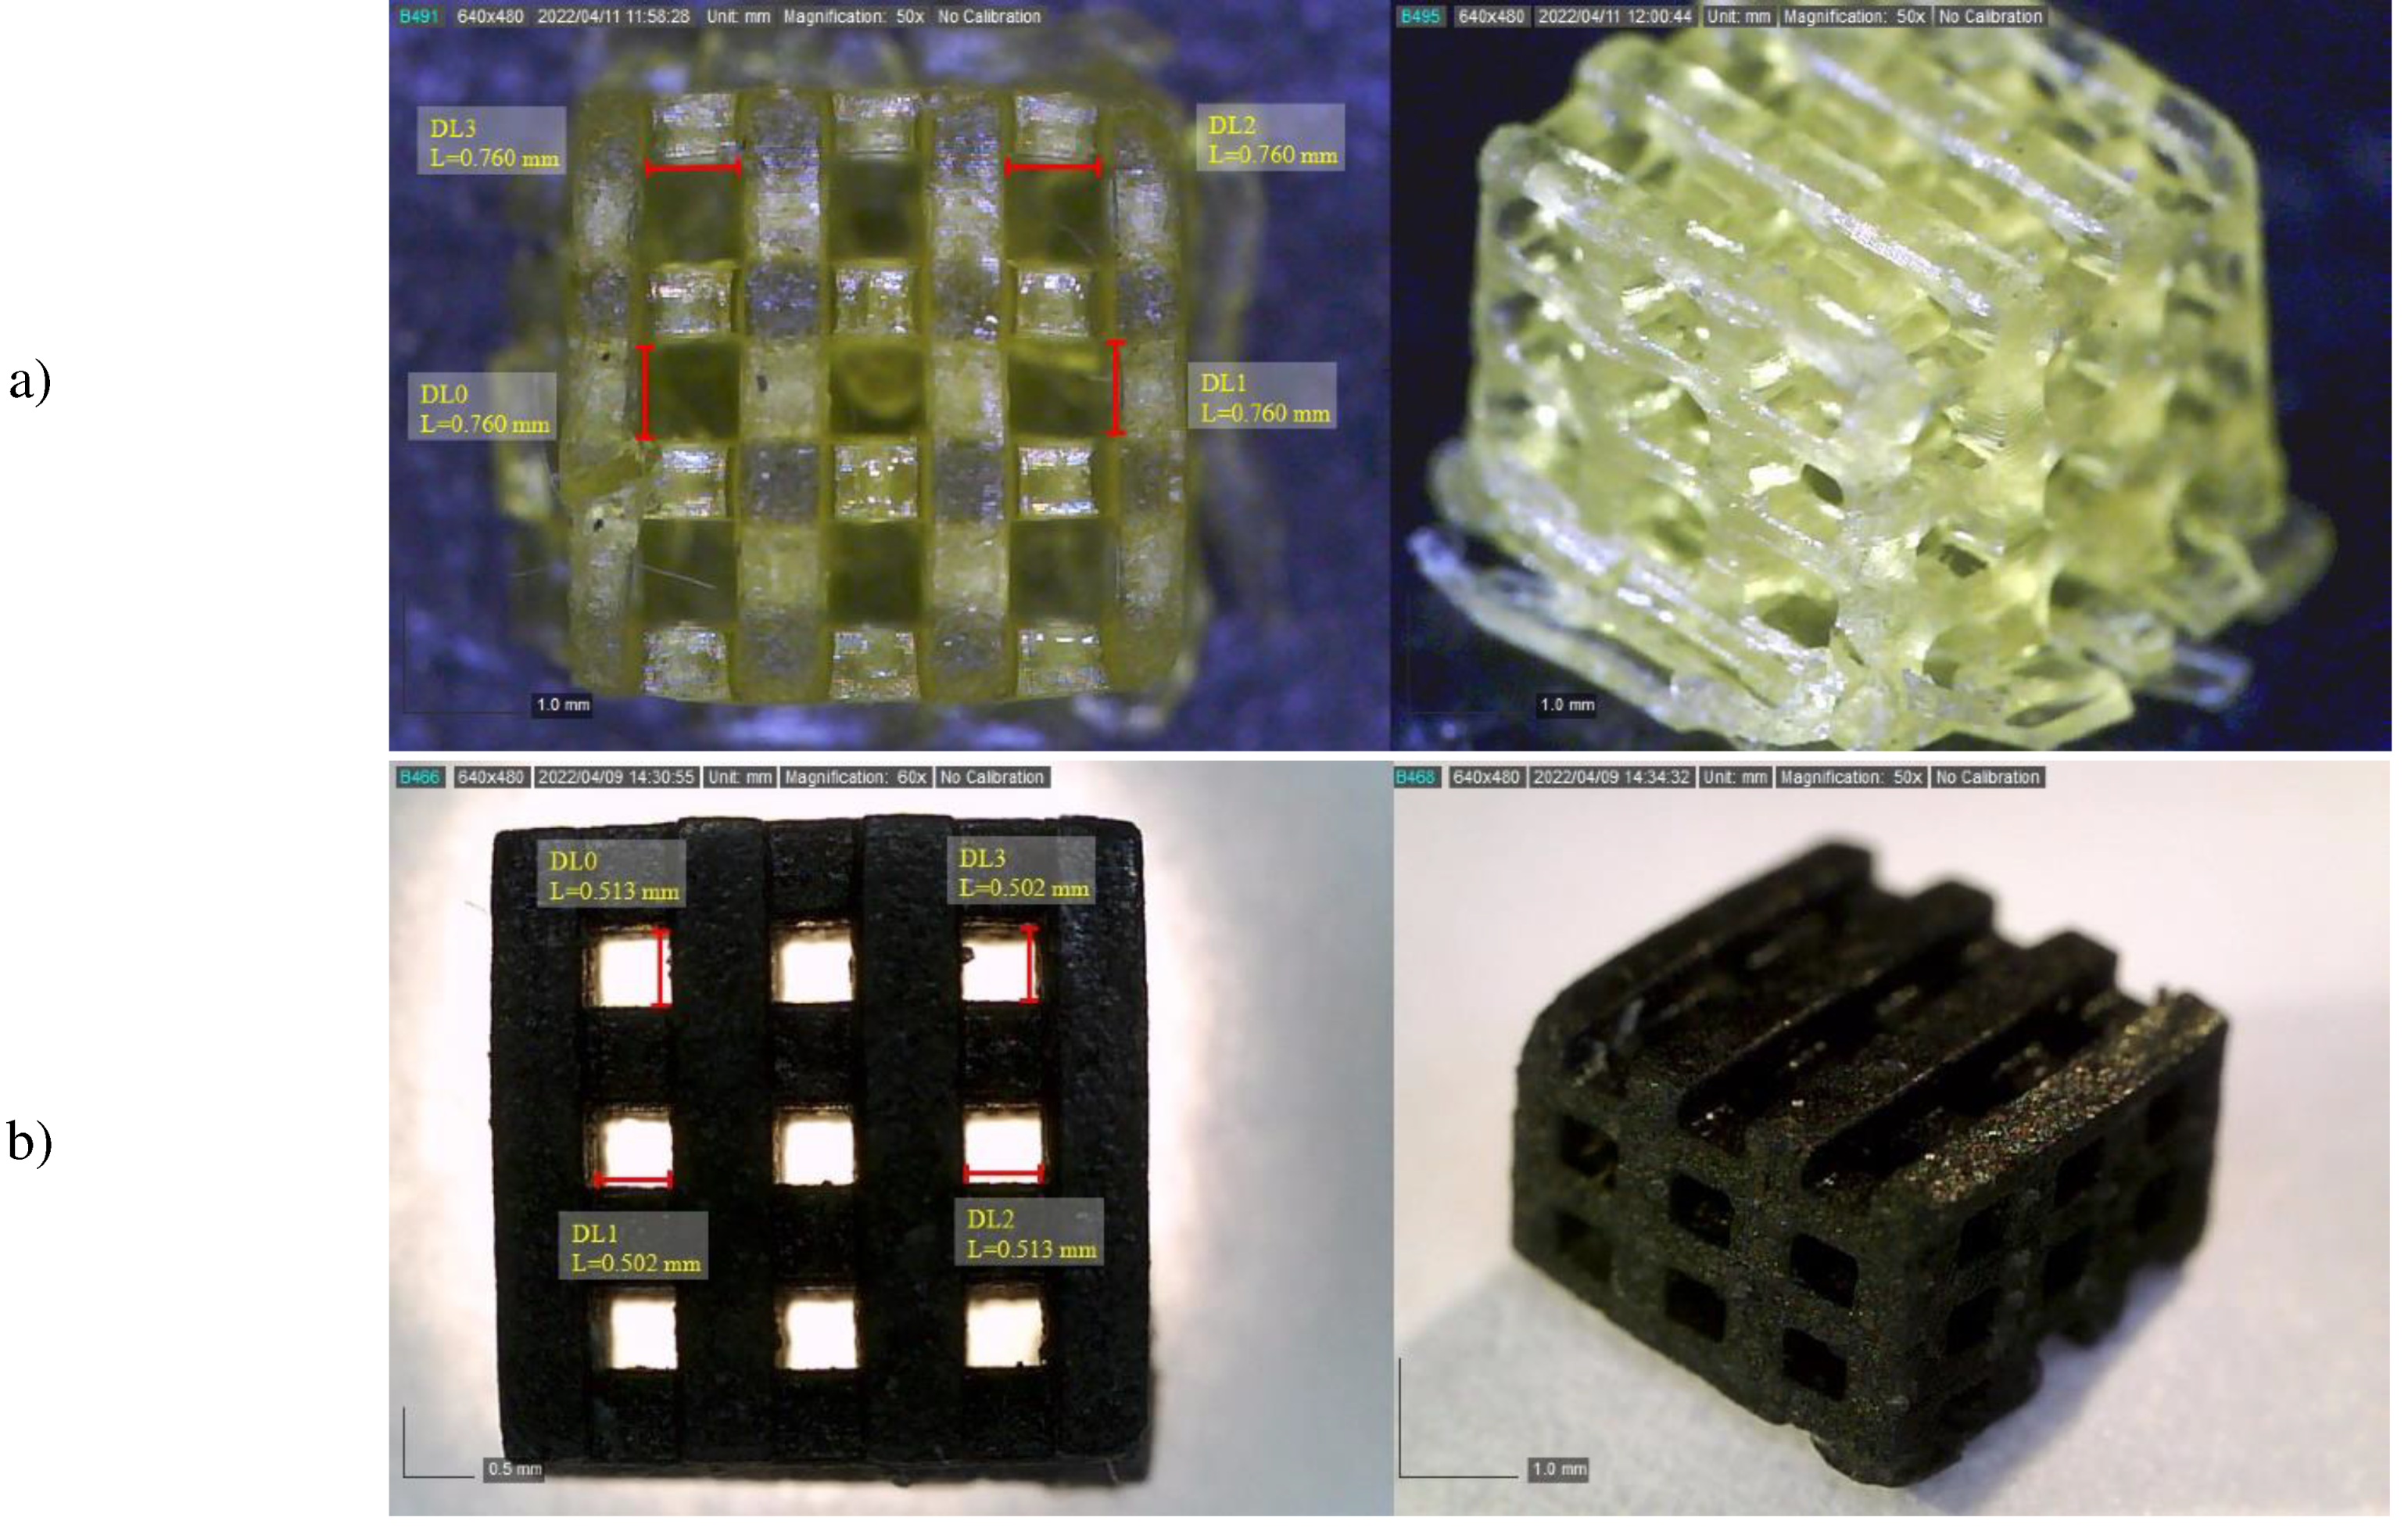
Figure 11.
Optical Density values of samples with 0, 0.5, 1, and 1.5 wt.% of GO in for three periods 1, 3 and 7 days (*: p < 0.05, and ns: not significant).
Figure 11.
Optical Density values of samples with 0, 0.5, 1, and 1.5 wt.% of GO in for three periods 1, 3 and 7 days (*: p < 0.05, and ns: not significant).
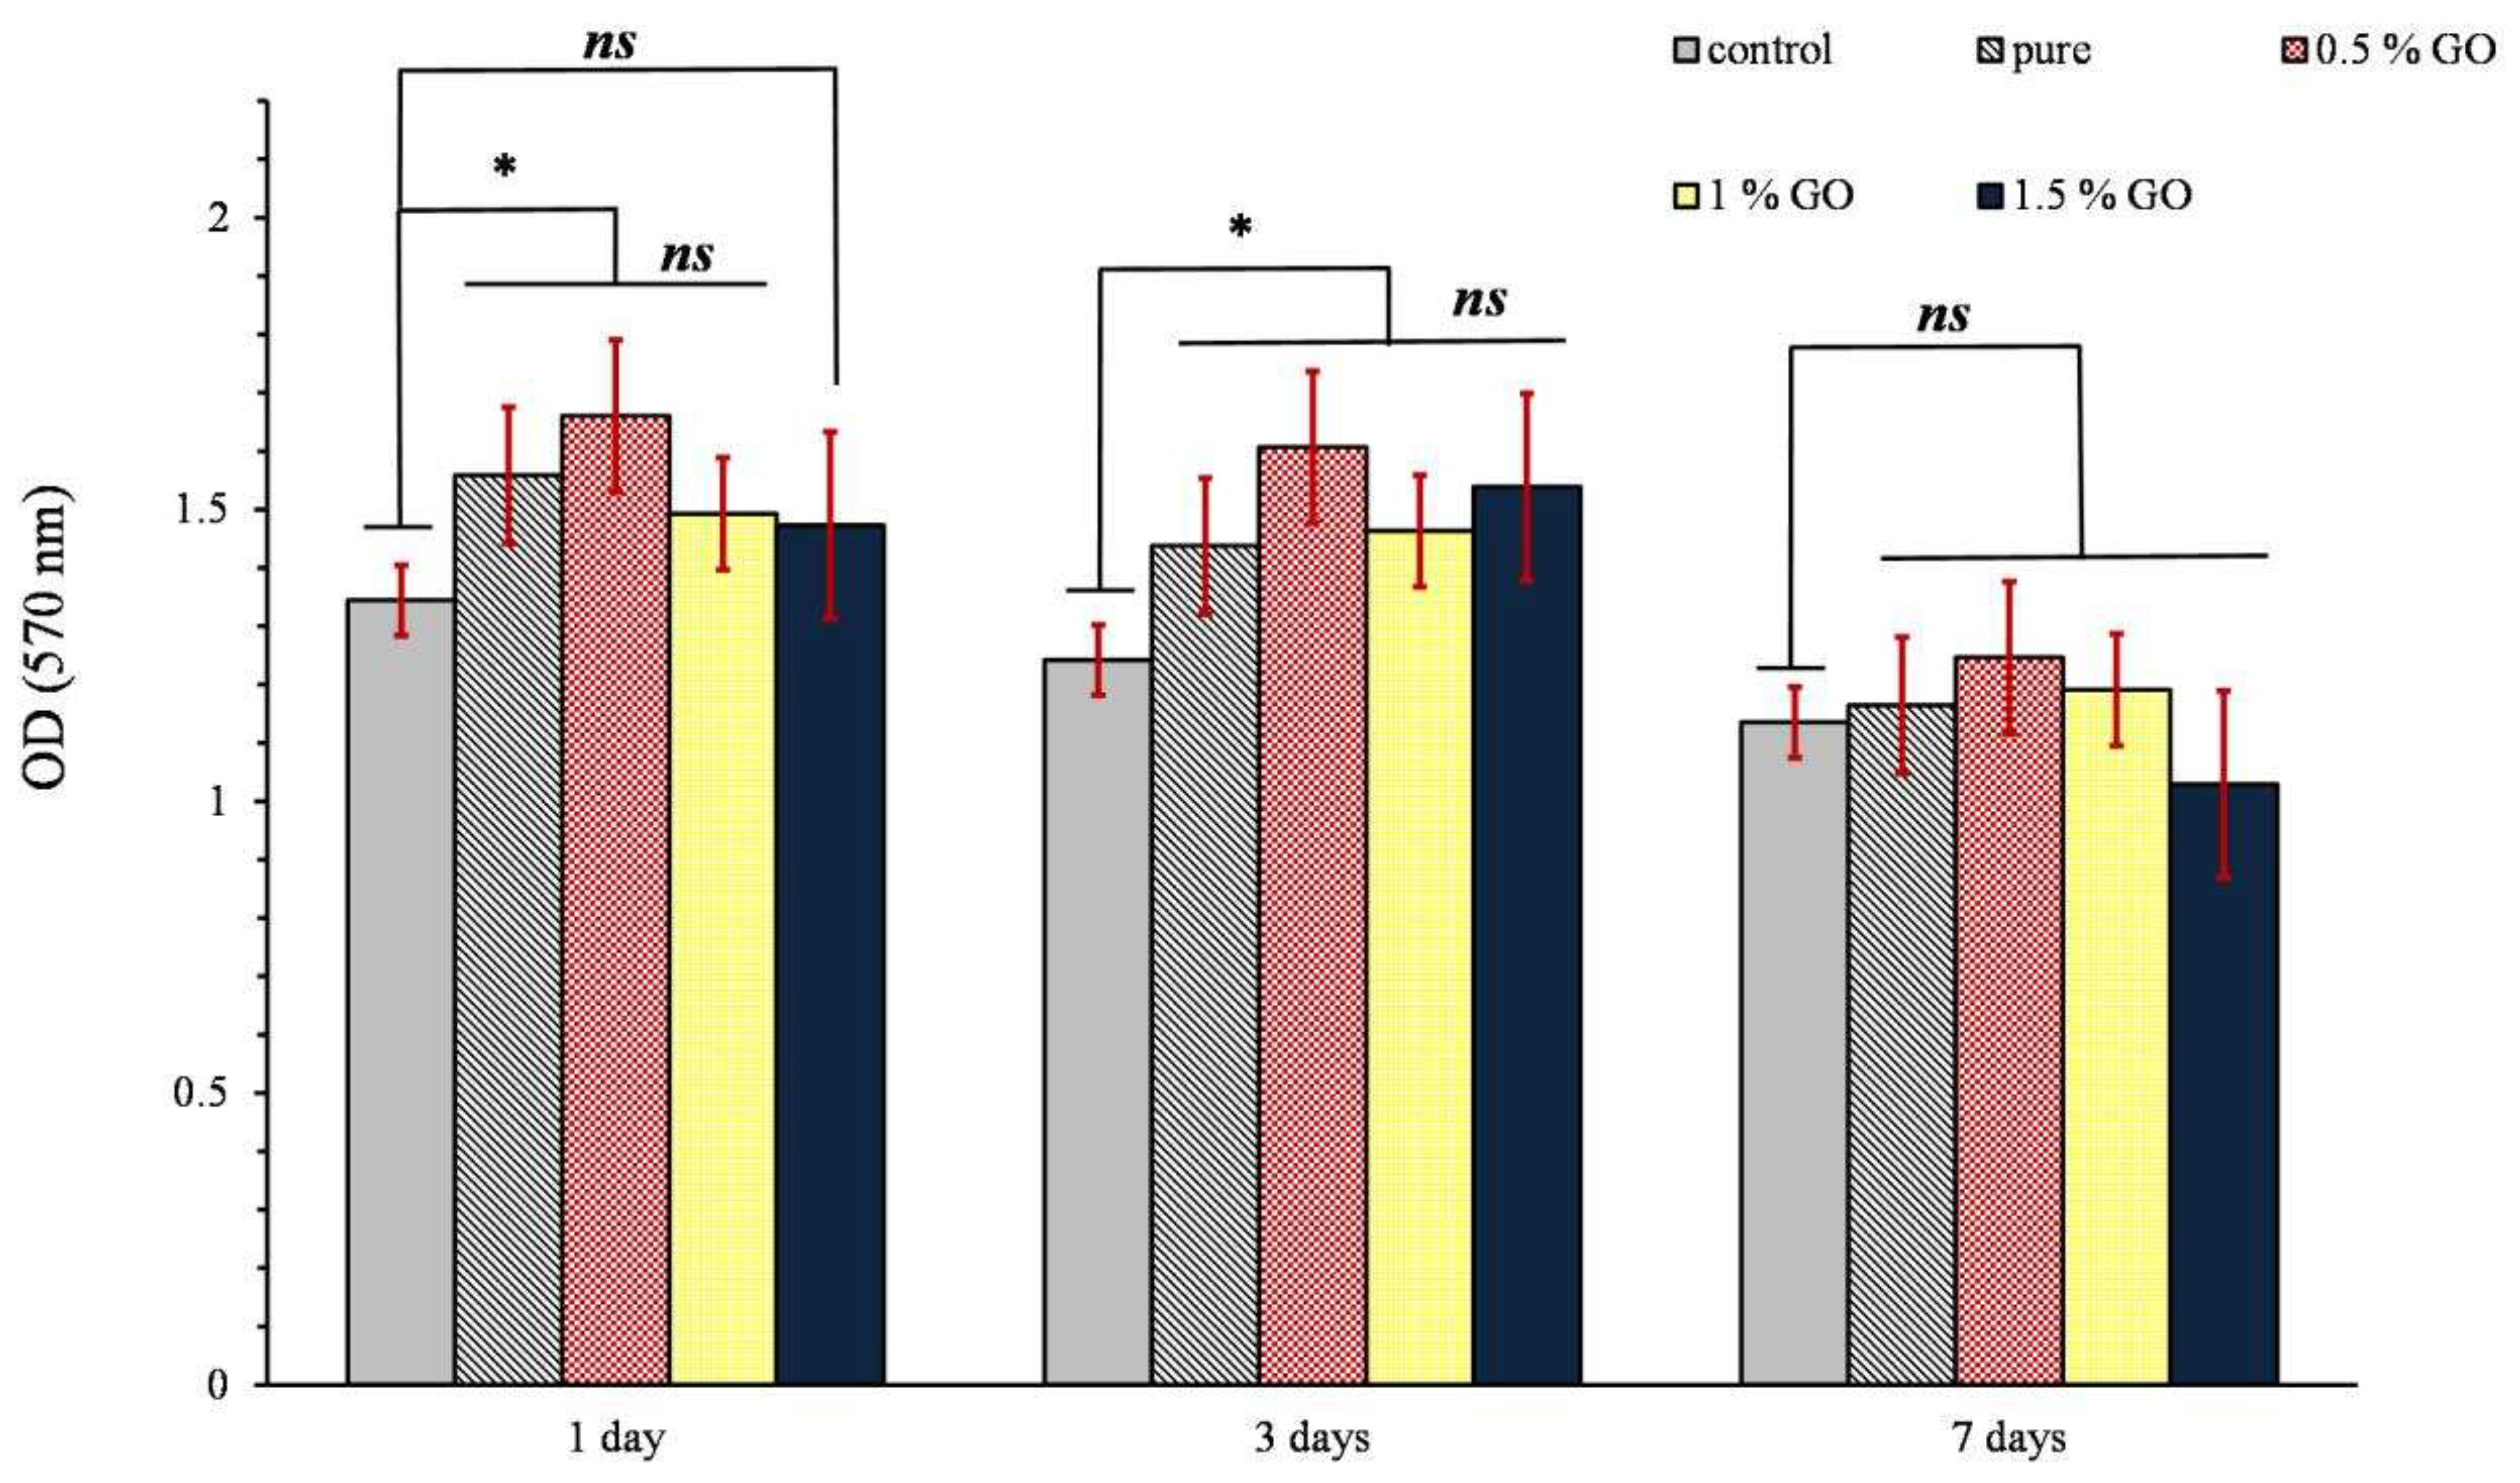
Figure 12.
Contact angle of samples containing different GO percentages.
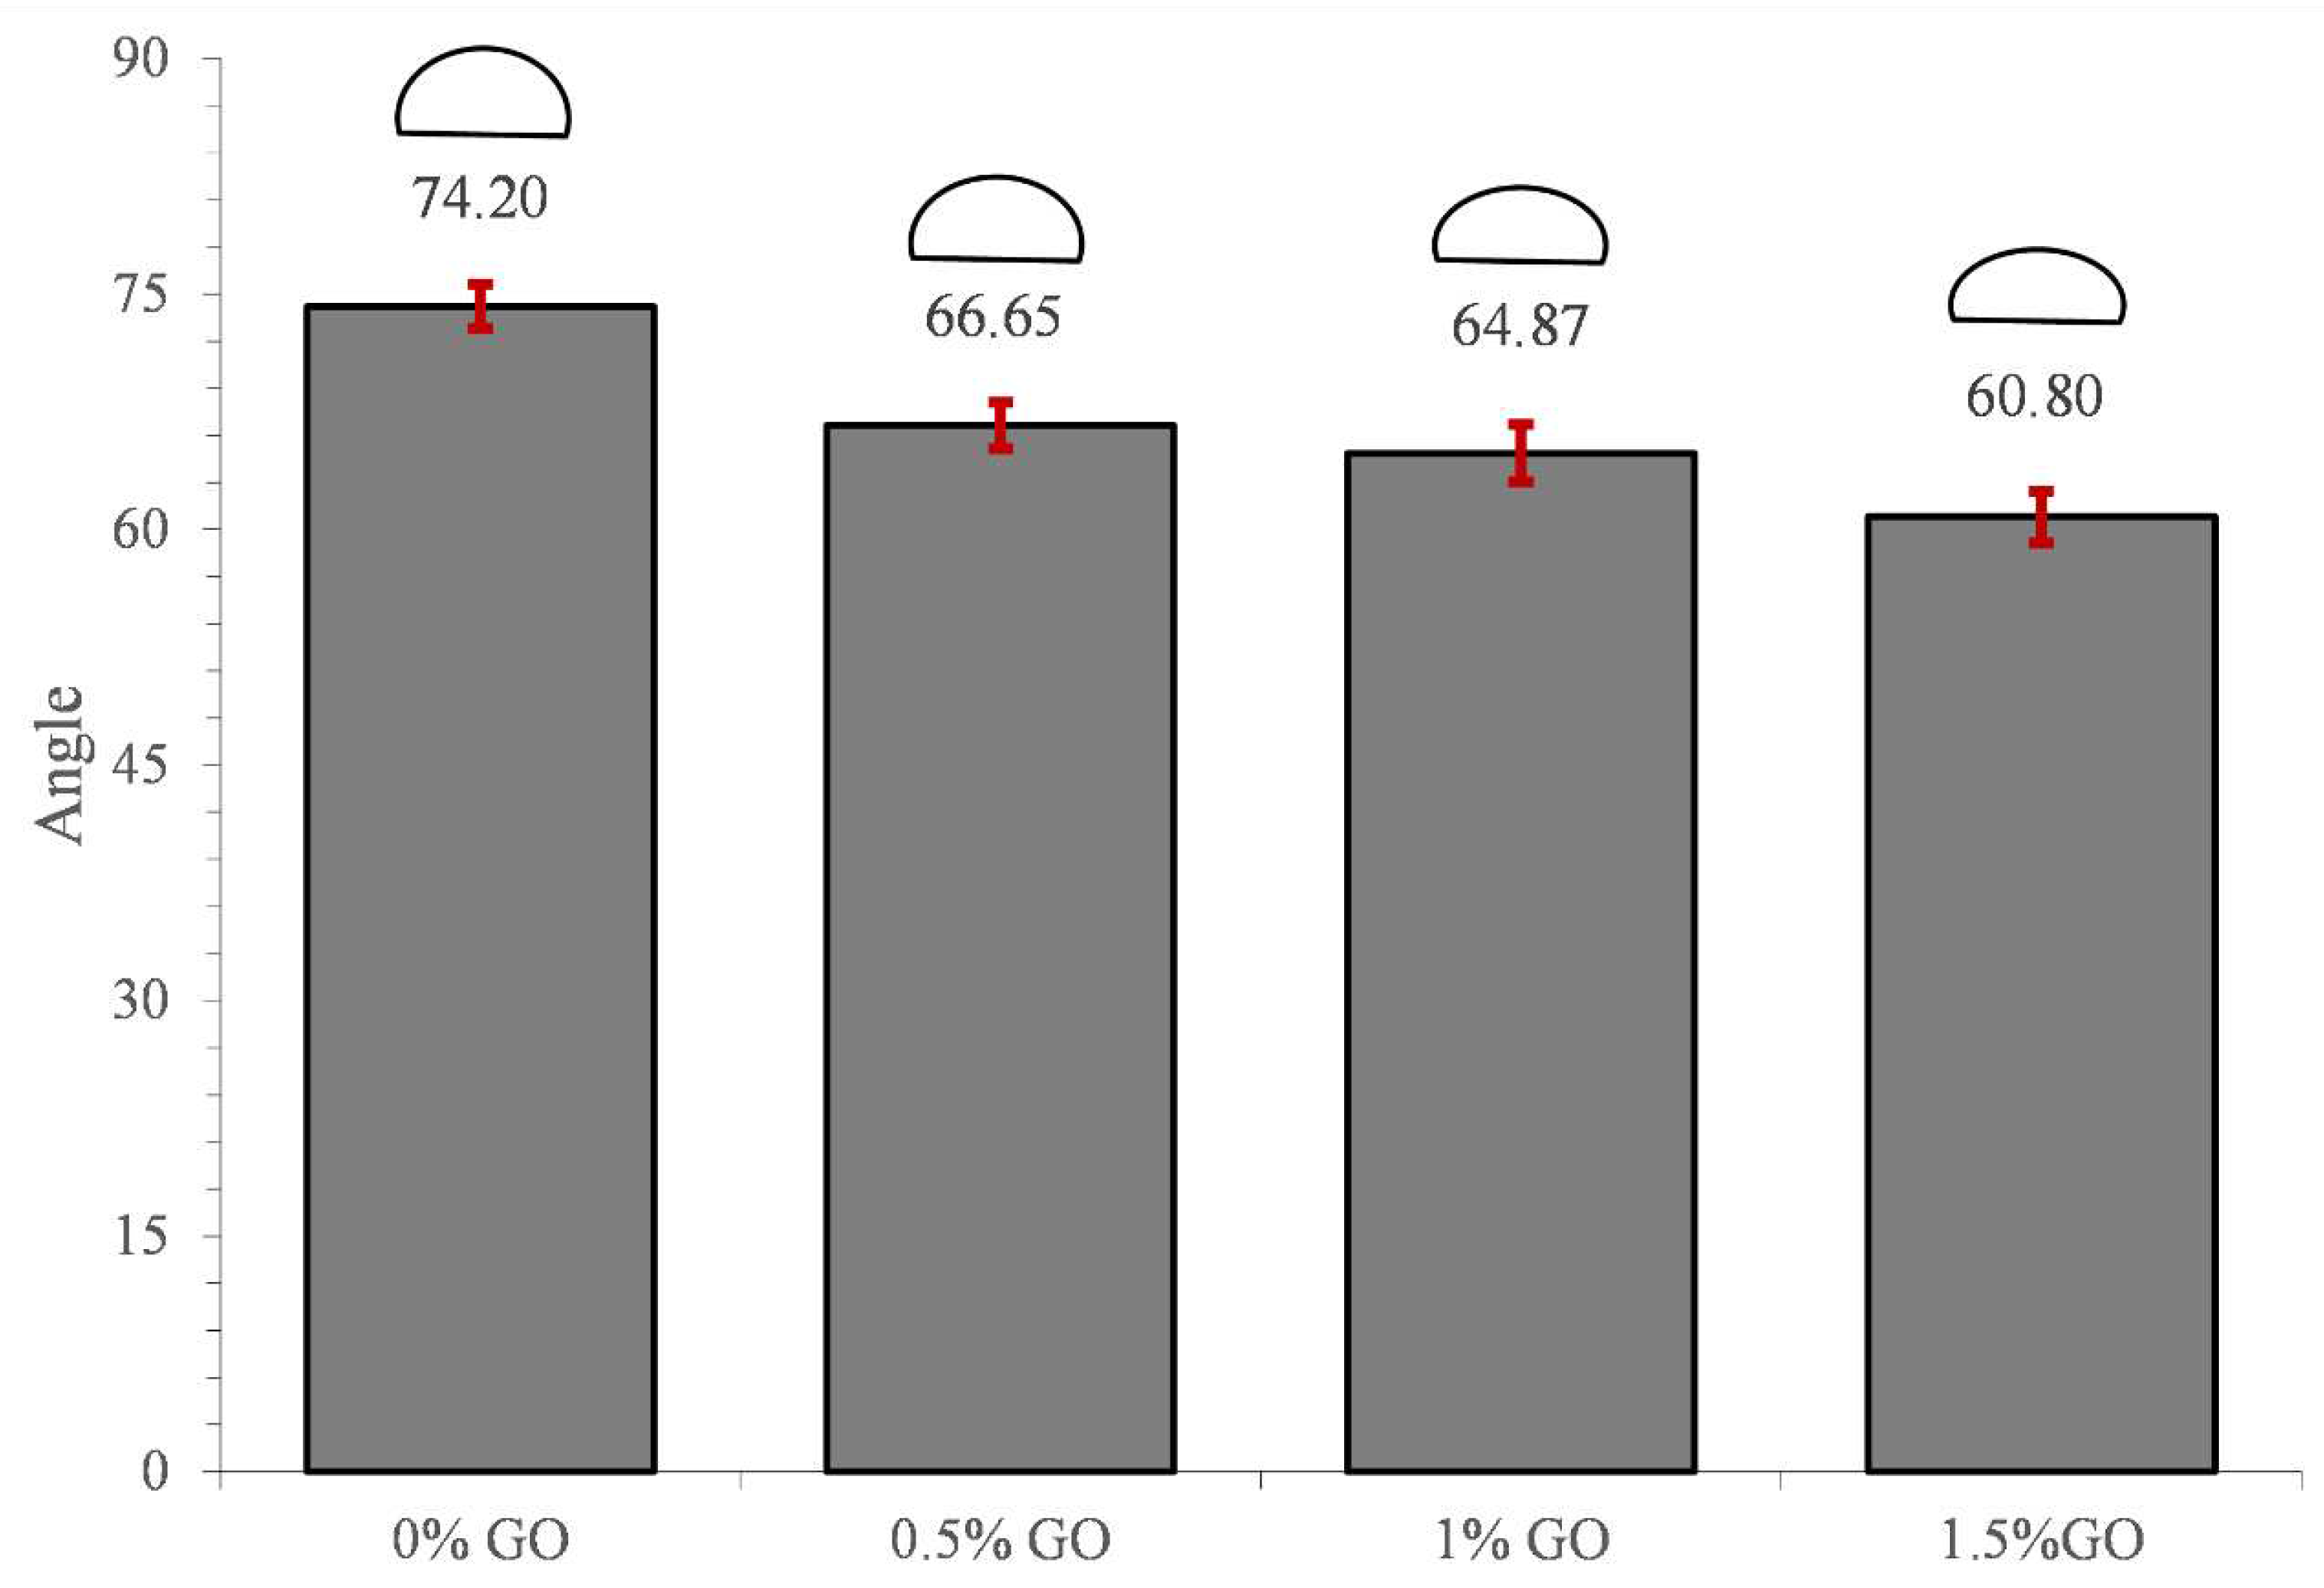
Figure 13.
Weight loss diagram without heat treatment (P: non-reinforced samples, G: GO-reinforced samples, numbers denote the GO particles contents).
Figure 13.
Weight loss diagram without heat treatment (P: non-reinforced samples, G: GO-reinforced samples, numbers denote the GO particles contents).
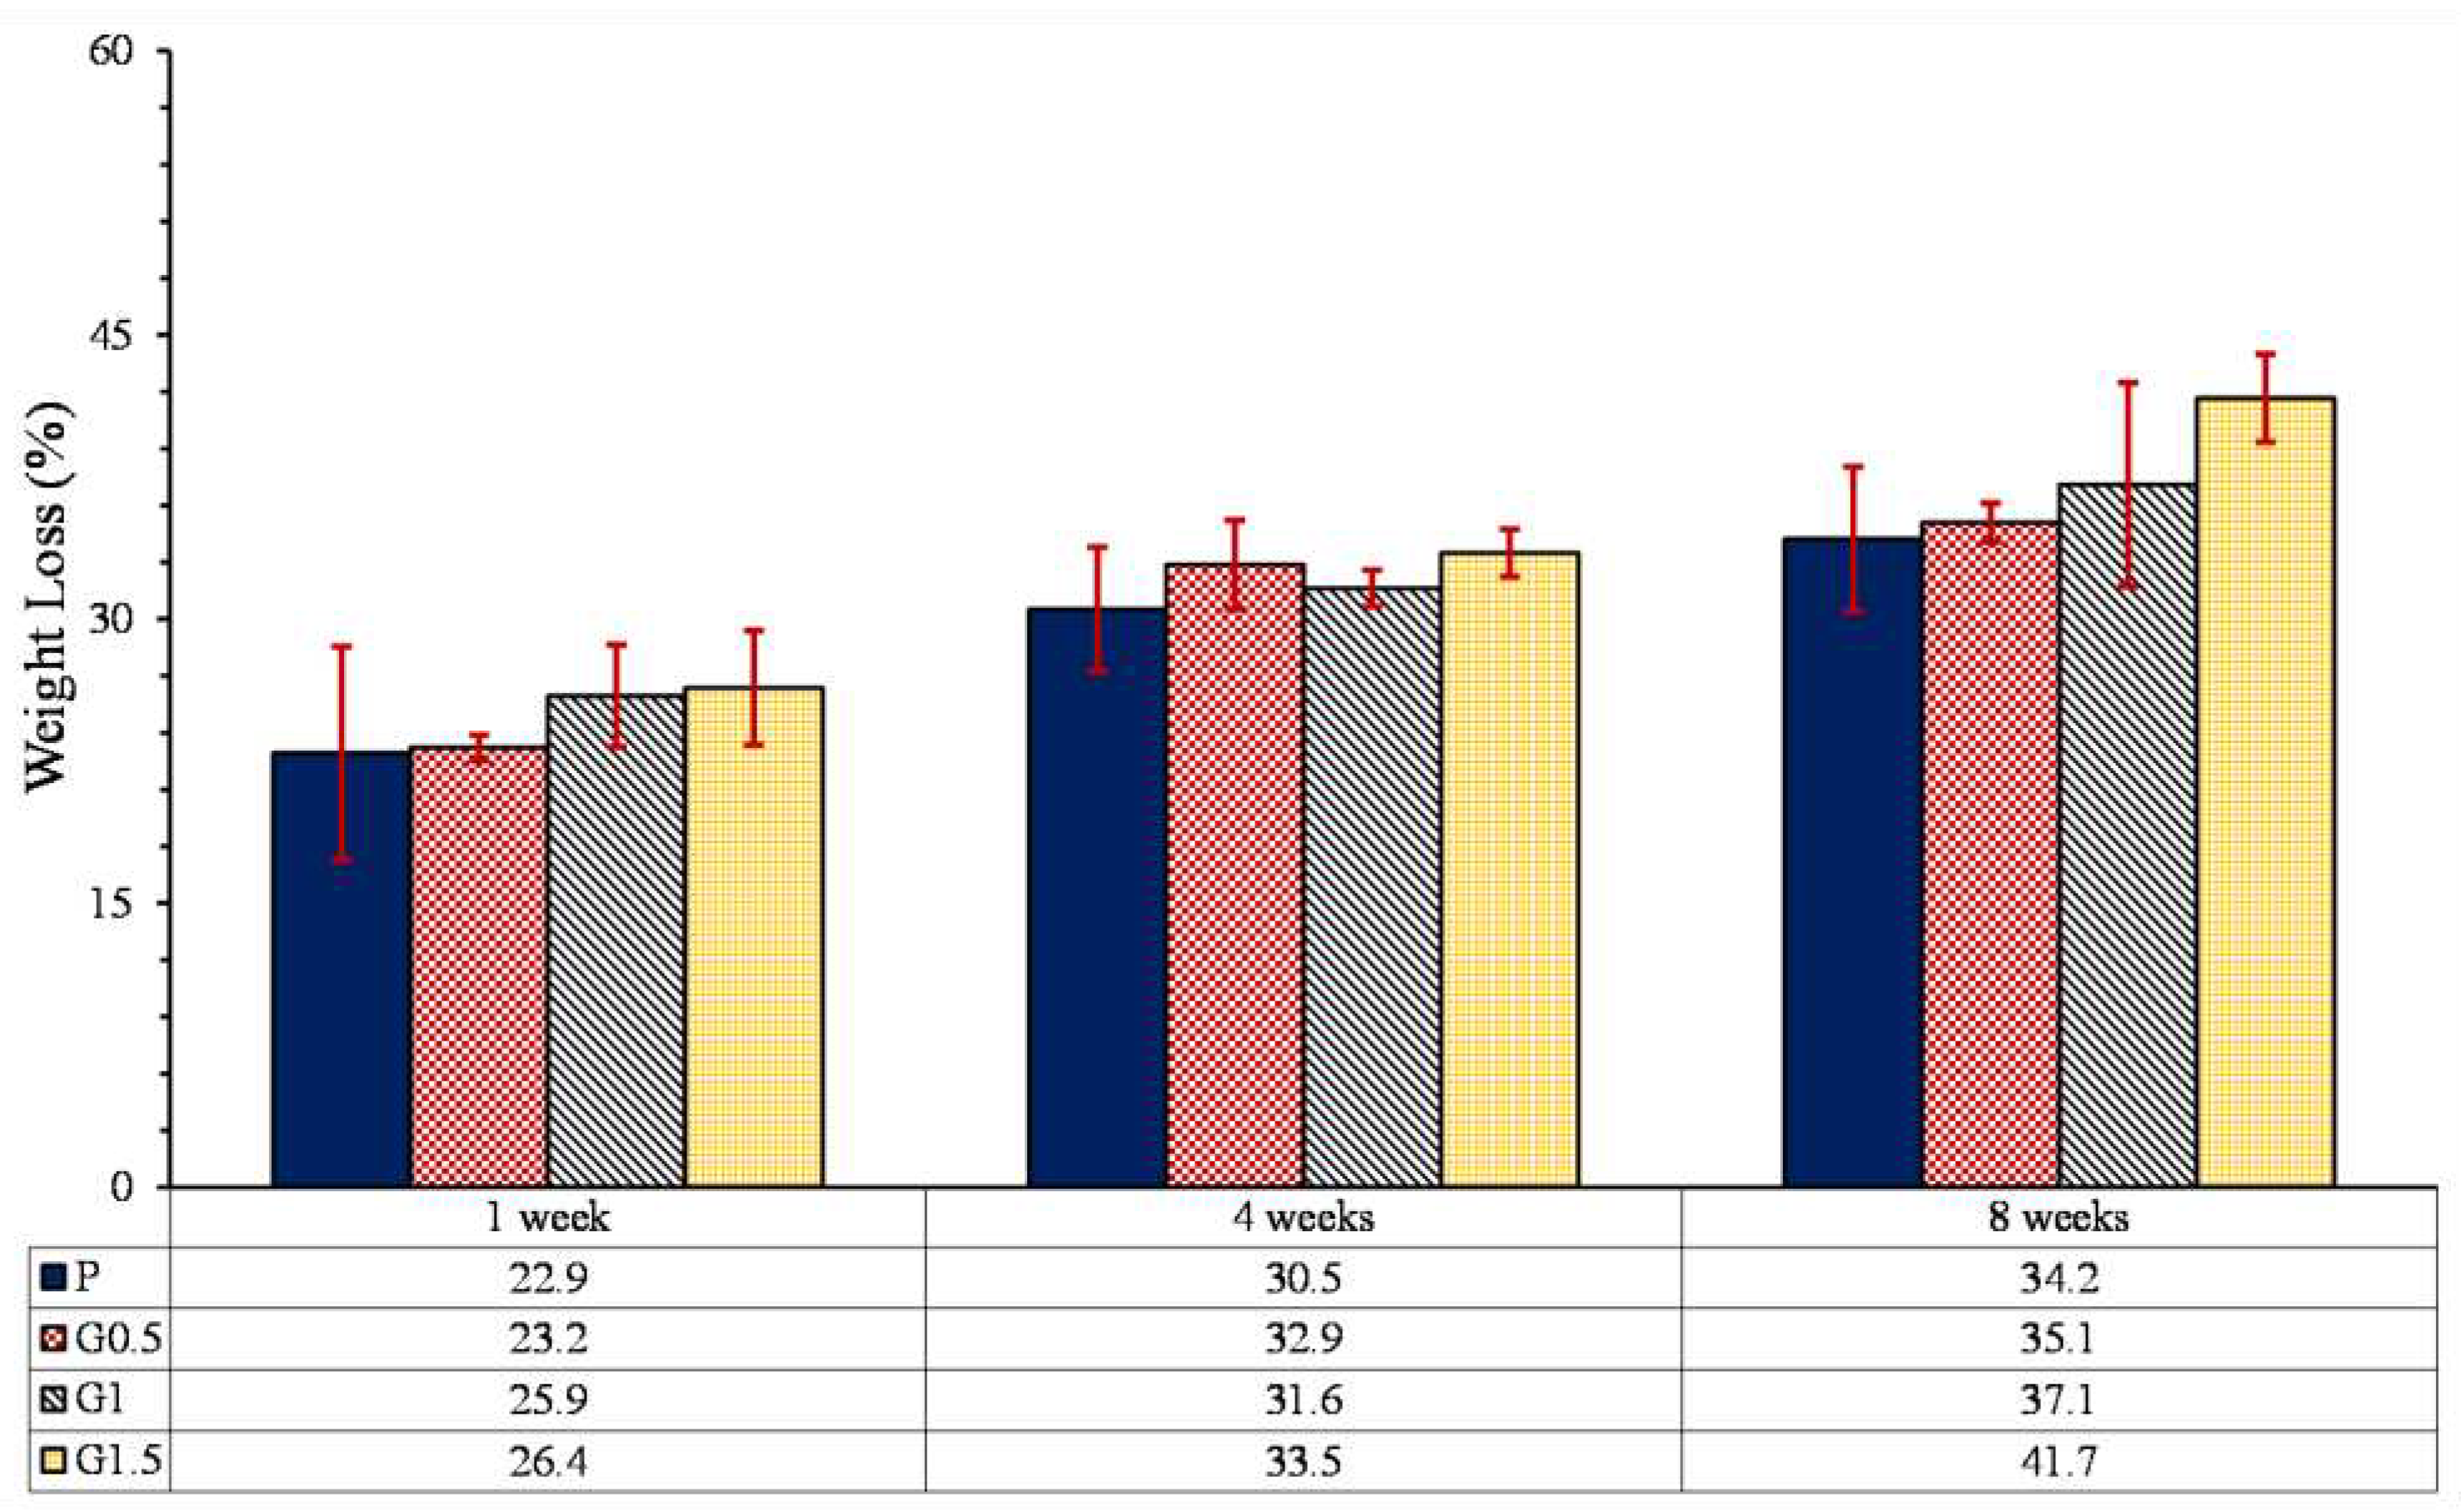
Figure 14.
Degradation profile of heat treated samples during 1, 4, and 8 weeks. (a) 0 wt. % GO (b) 0.5 wt. % GO (c) 1 wt. % GO (d) 1.5 wt. % GO (P: non-reinforced samples, G: GO-reinforced samples, numbers before dash denote the GO particles contents, numbers after dash denote time of heat treatment).
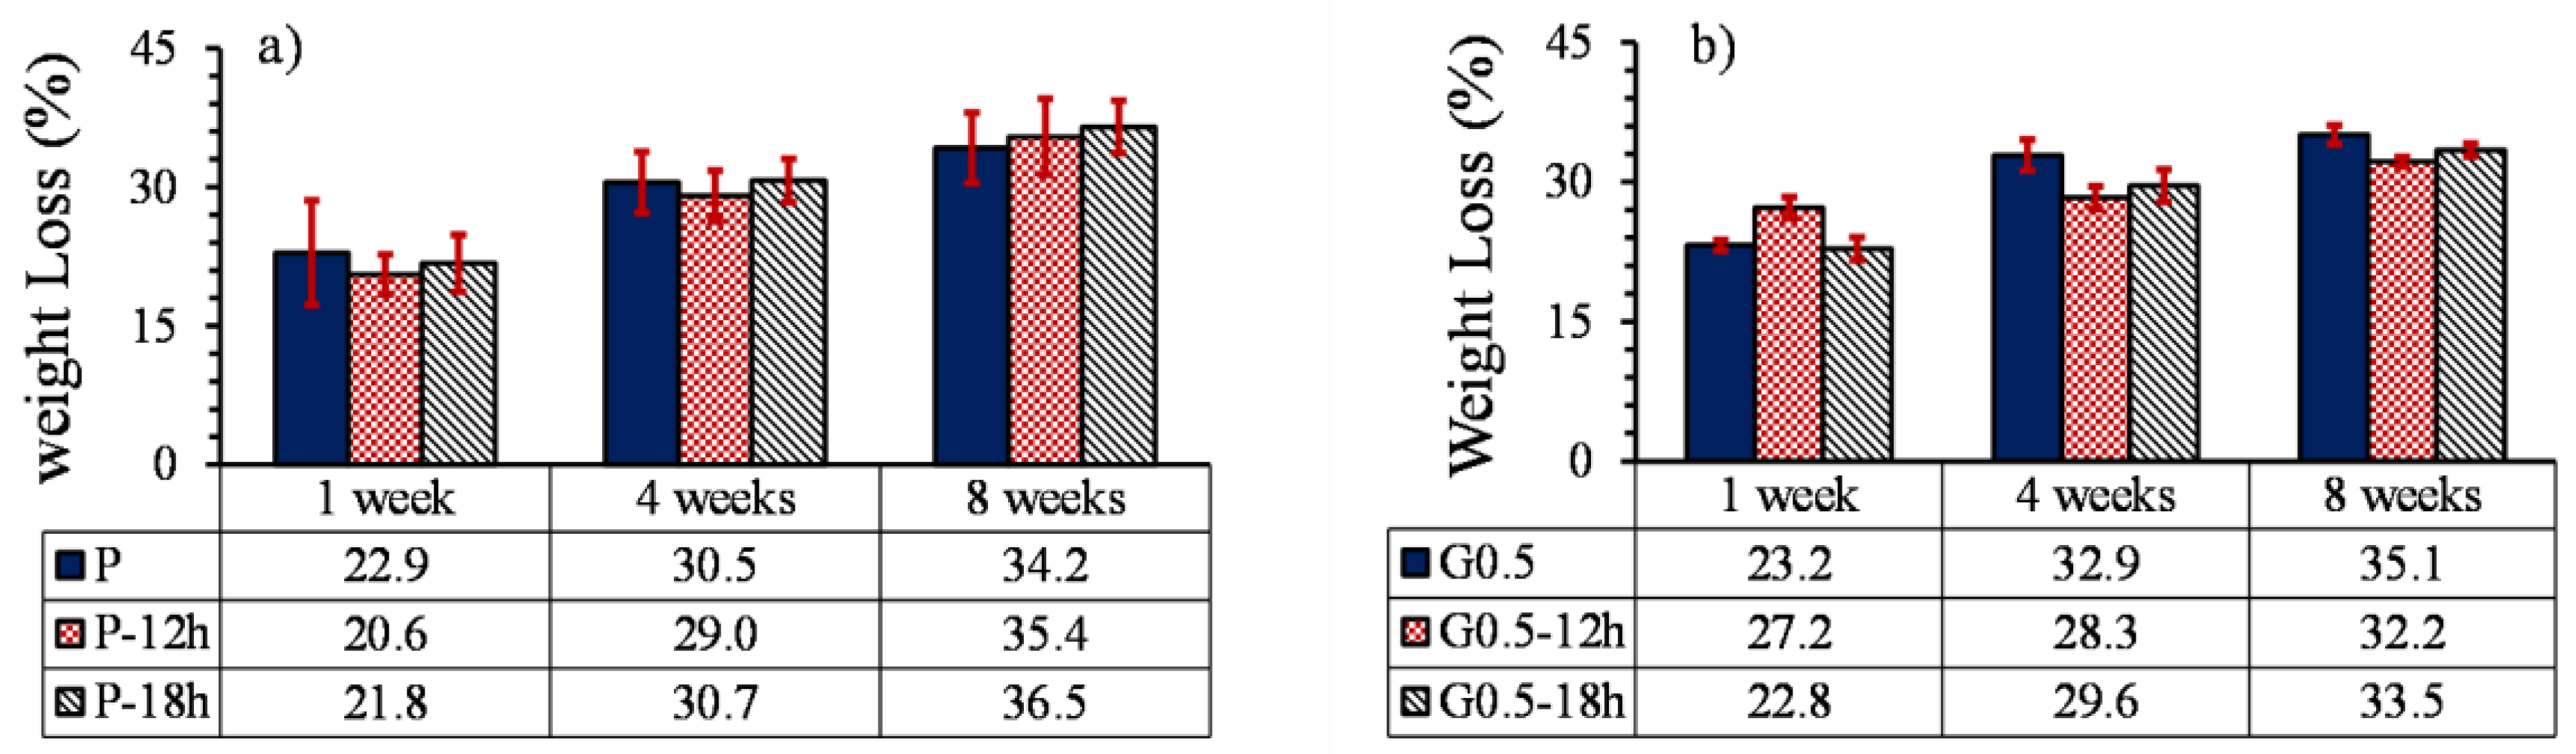
Figure 15.
The compressive strength loss of samples without heat treatment in 1, 4, and 8 weeks (P: non-reinforced samples, G: GO-reinforced samples, numbers denote the GO particles contents).
Figure 15.
The compressive strength loss of samples without heat treatment in 1, 4, and 8 weeks (P: non-reinforced samples, G: GO-reinforced samples, numbers denote the GO particles contents).
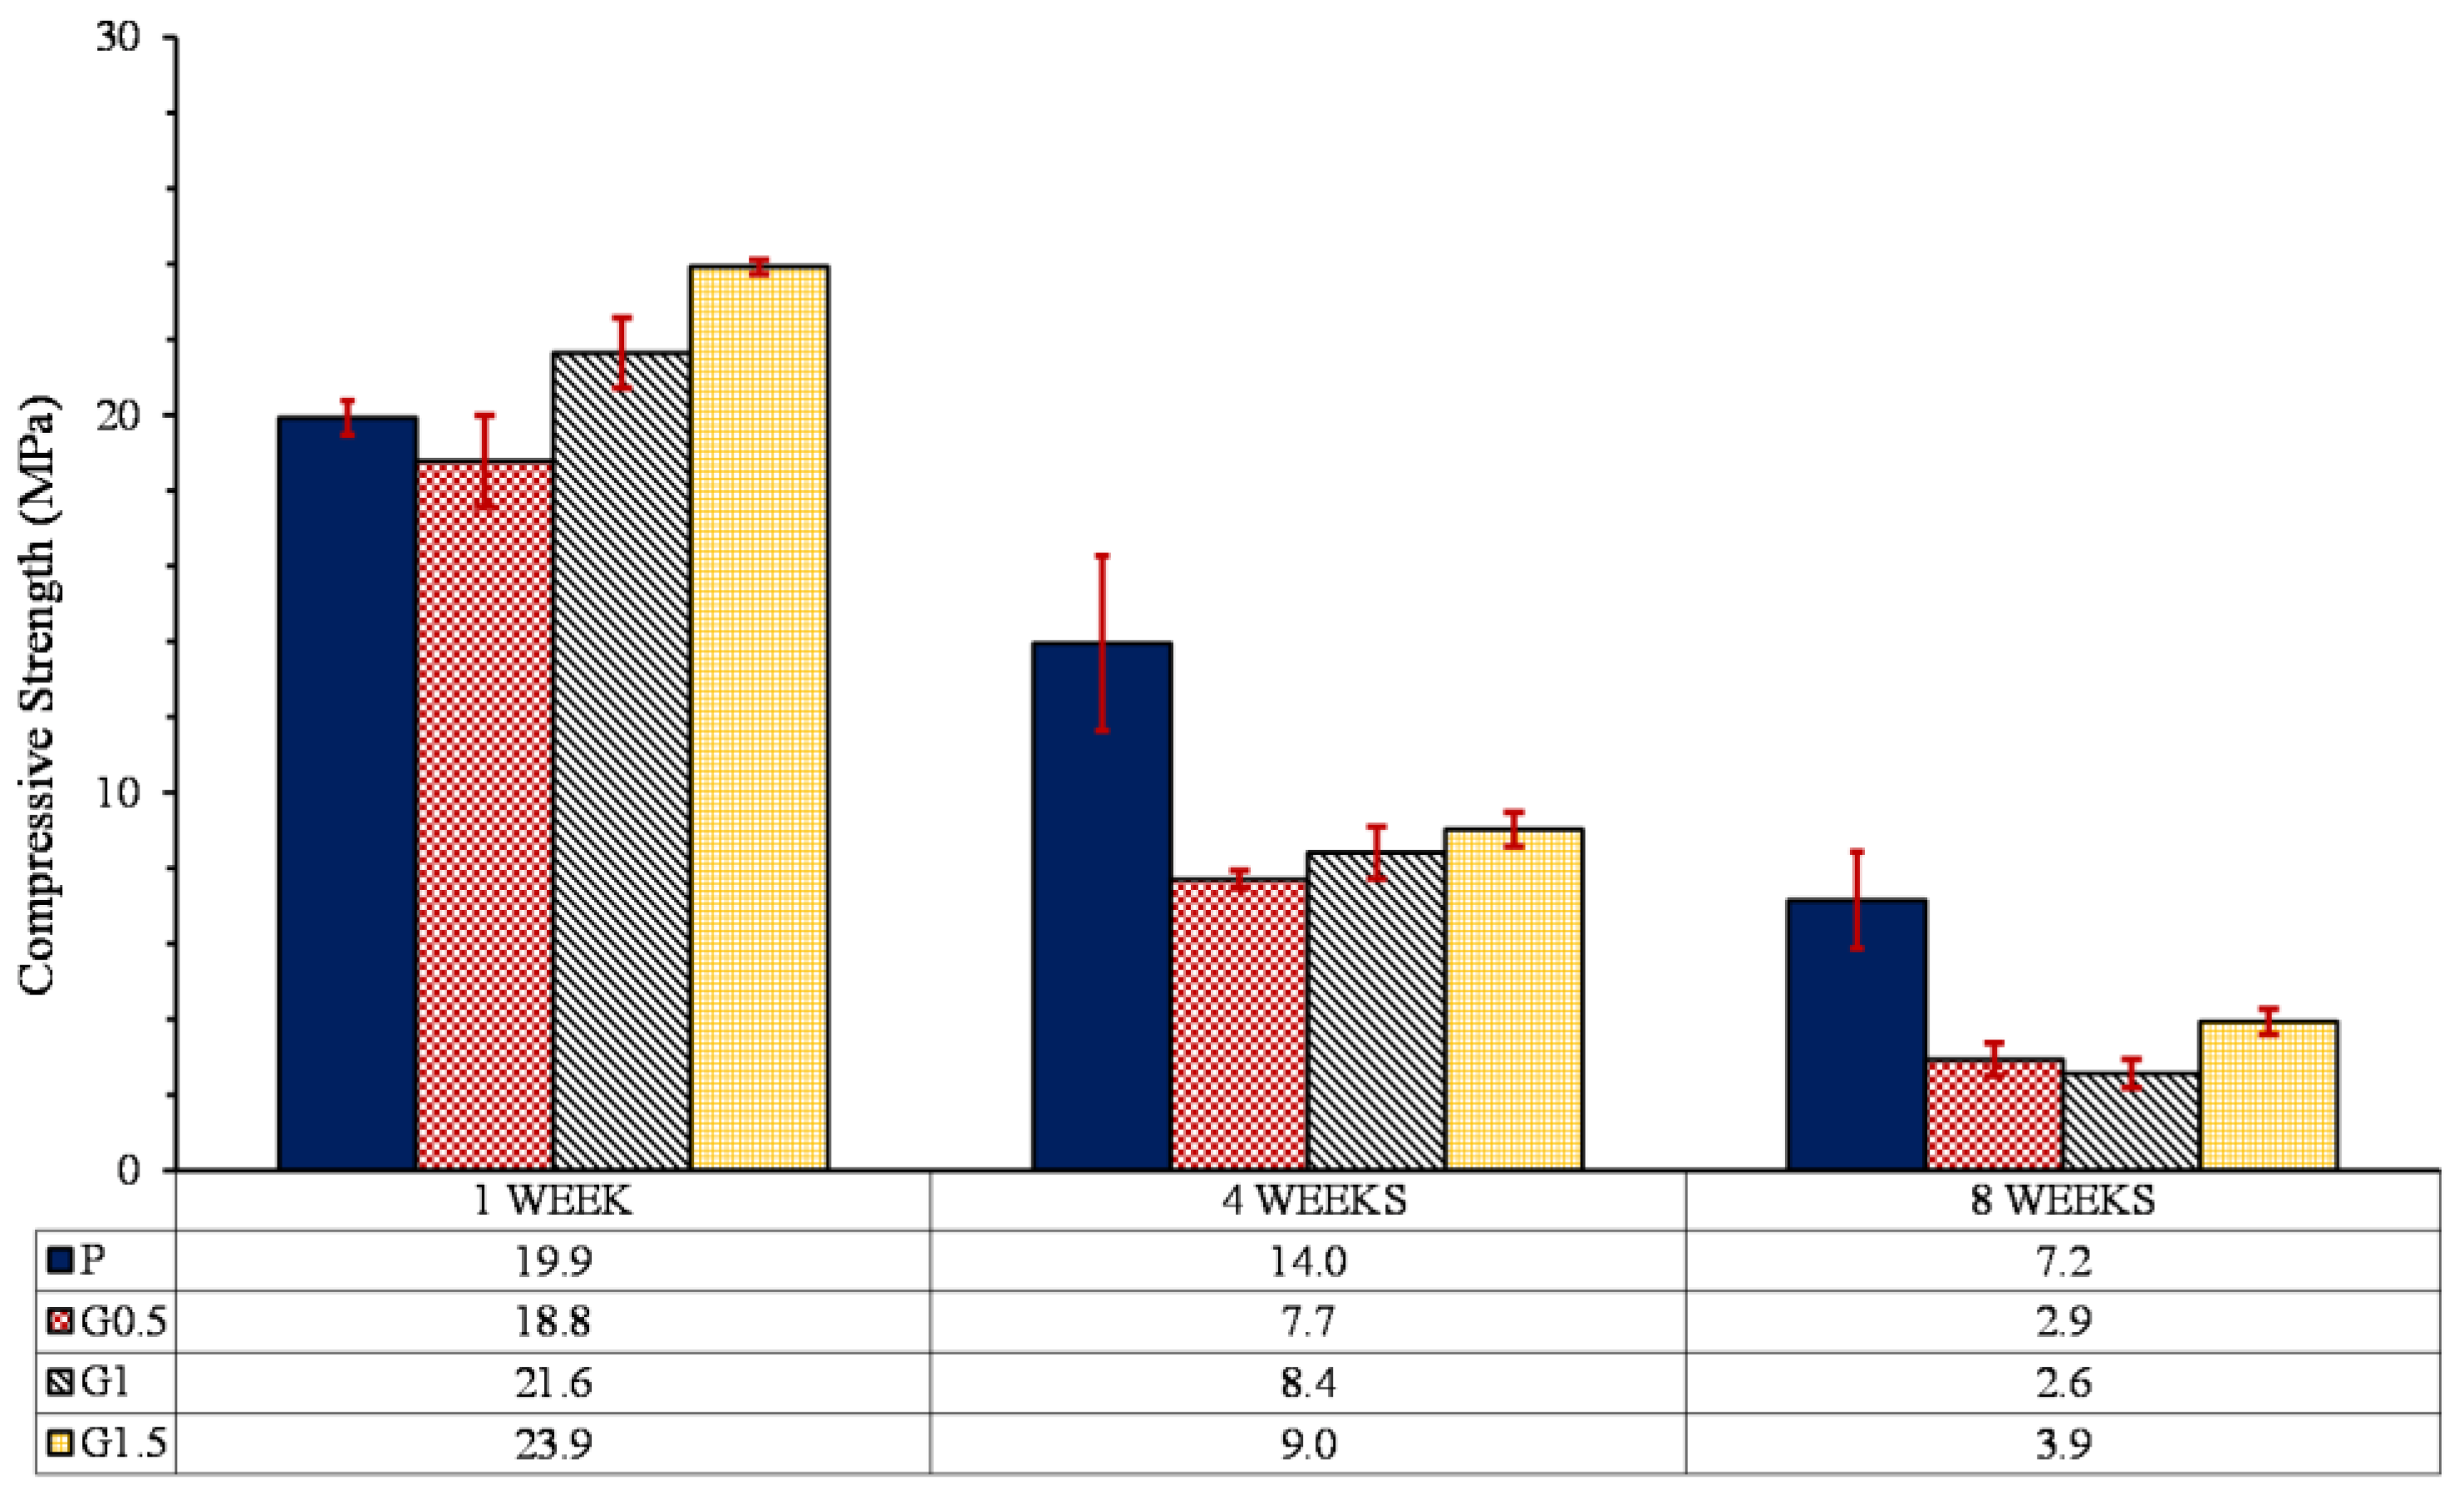
Figure 16.
Mechanical strength loss of heat treated samples over a period of 8 weeks. (a) 0 wt. % GO, (b) 0.5 wt. % GO, (c) 1 wt. % GO (d) 1.5 wt. % GO (P: non-reinforced samples, G: GO-reinforced samples, numbers before dash denote the GO particles contents, numbers after dash denote time of heat treatment).
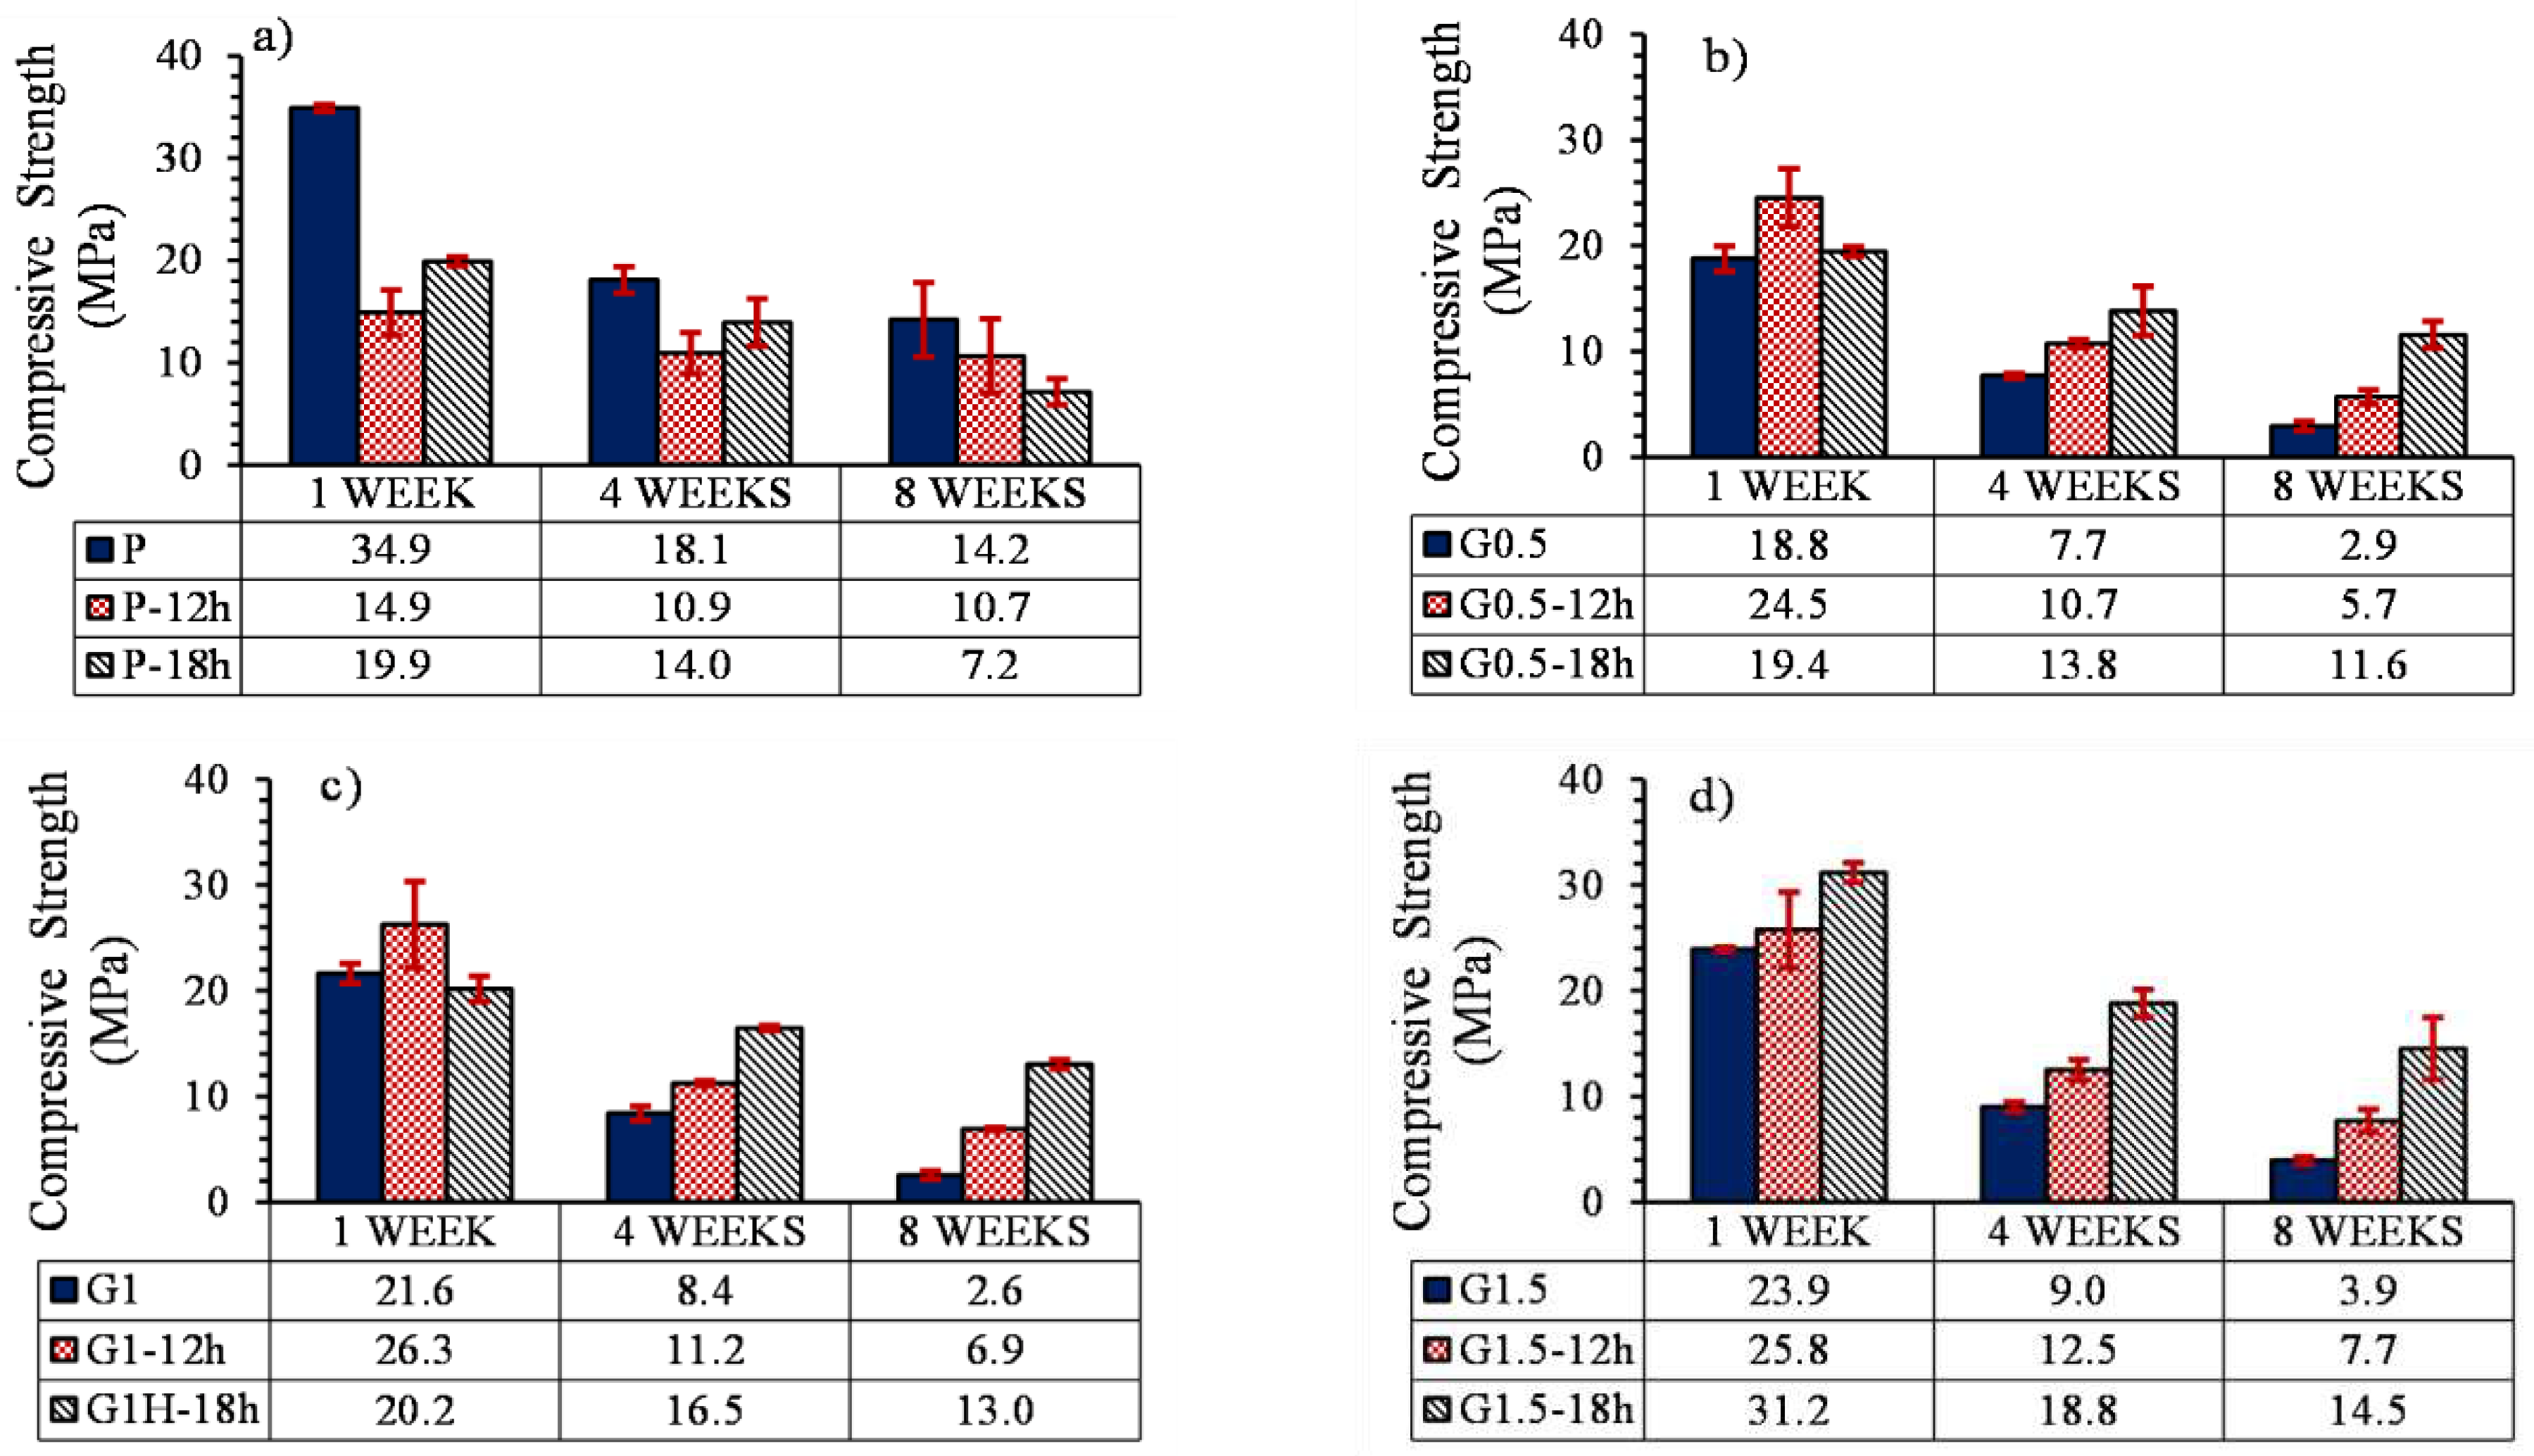
Figure 17.
The pH variation of samples without heat treatment in 1, 4, 6, and 8 weeks (P: non-reinforced samples, G: GO-reinforced samples, numbers denote the GO particles contents).
Figure 17.
The pH variation of samples without heat treatment in 1, 4, 6, and 8 weeks (P: non-reinforced samples, G: GO-reinforced samples, numbers denote the GO particles contents).
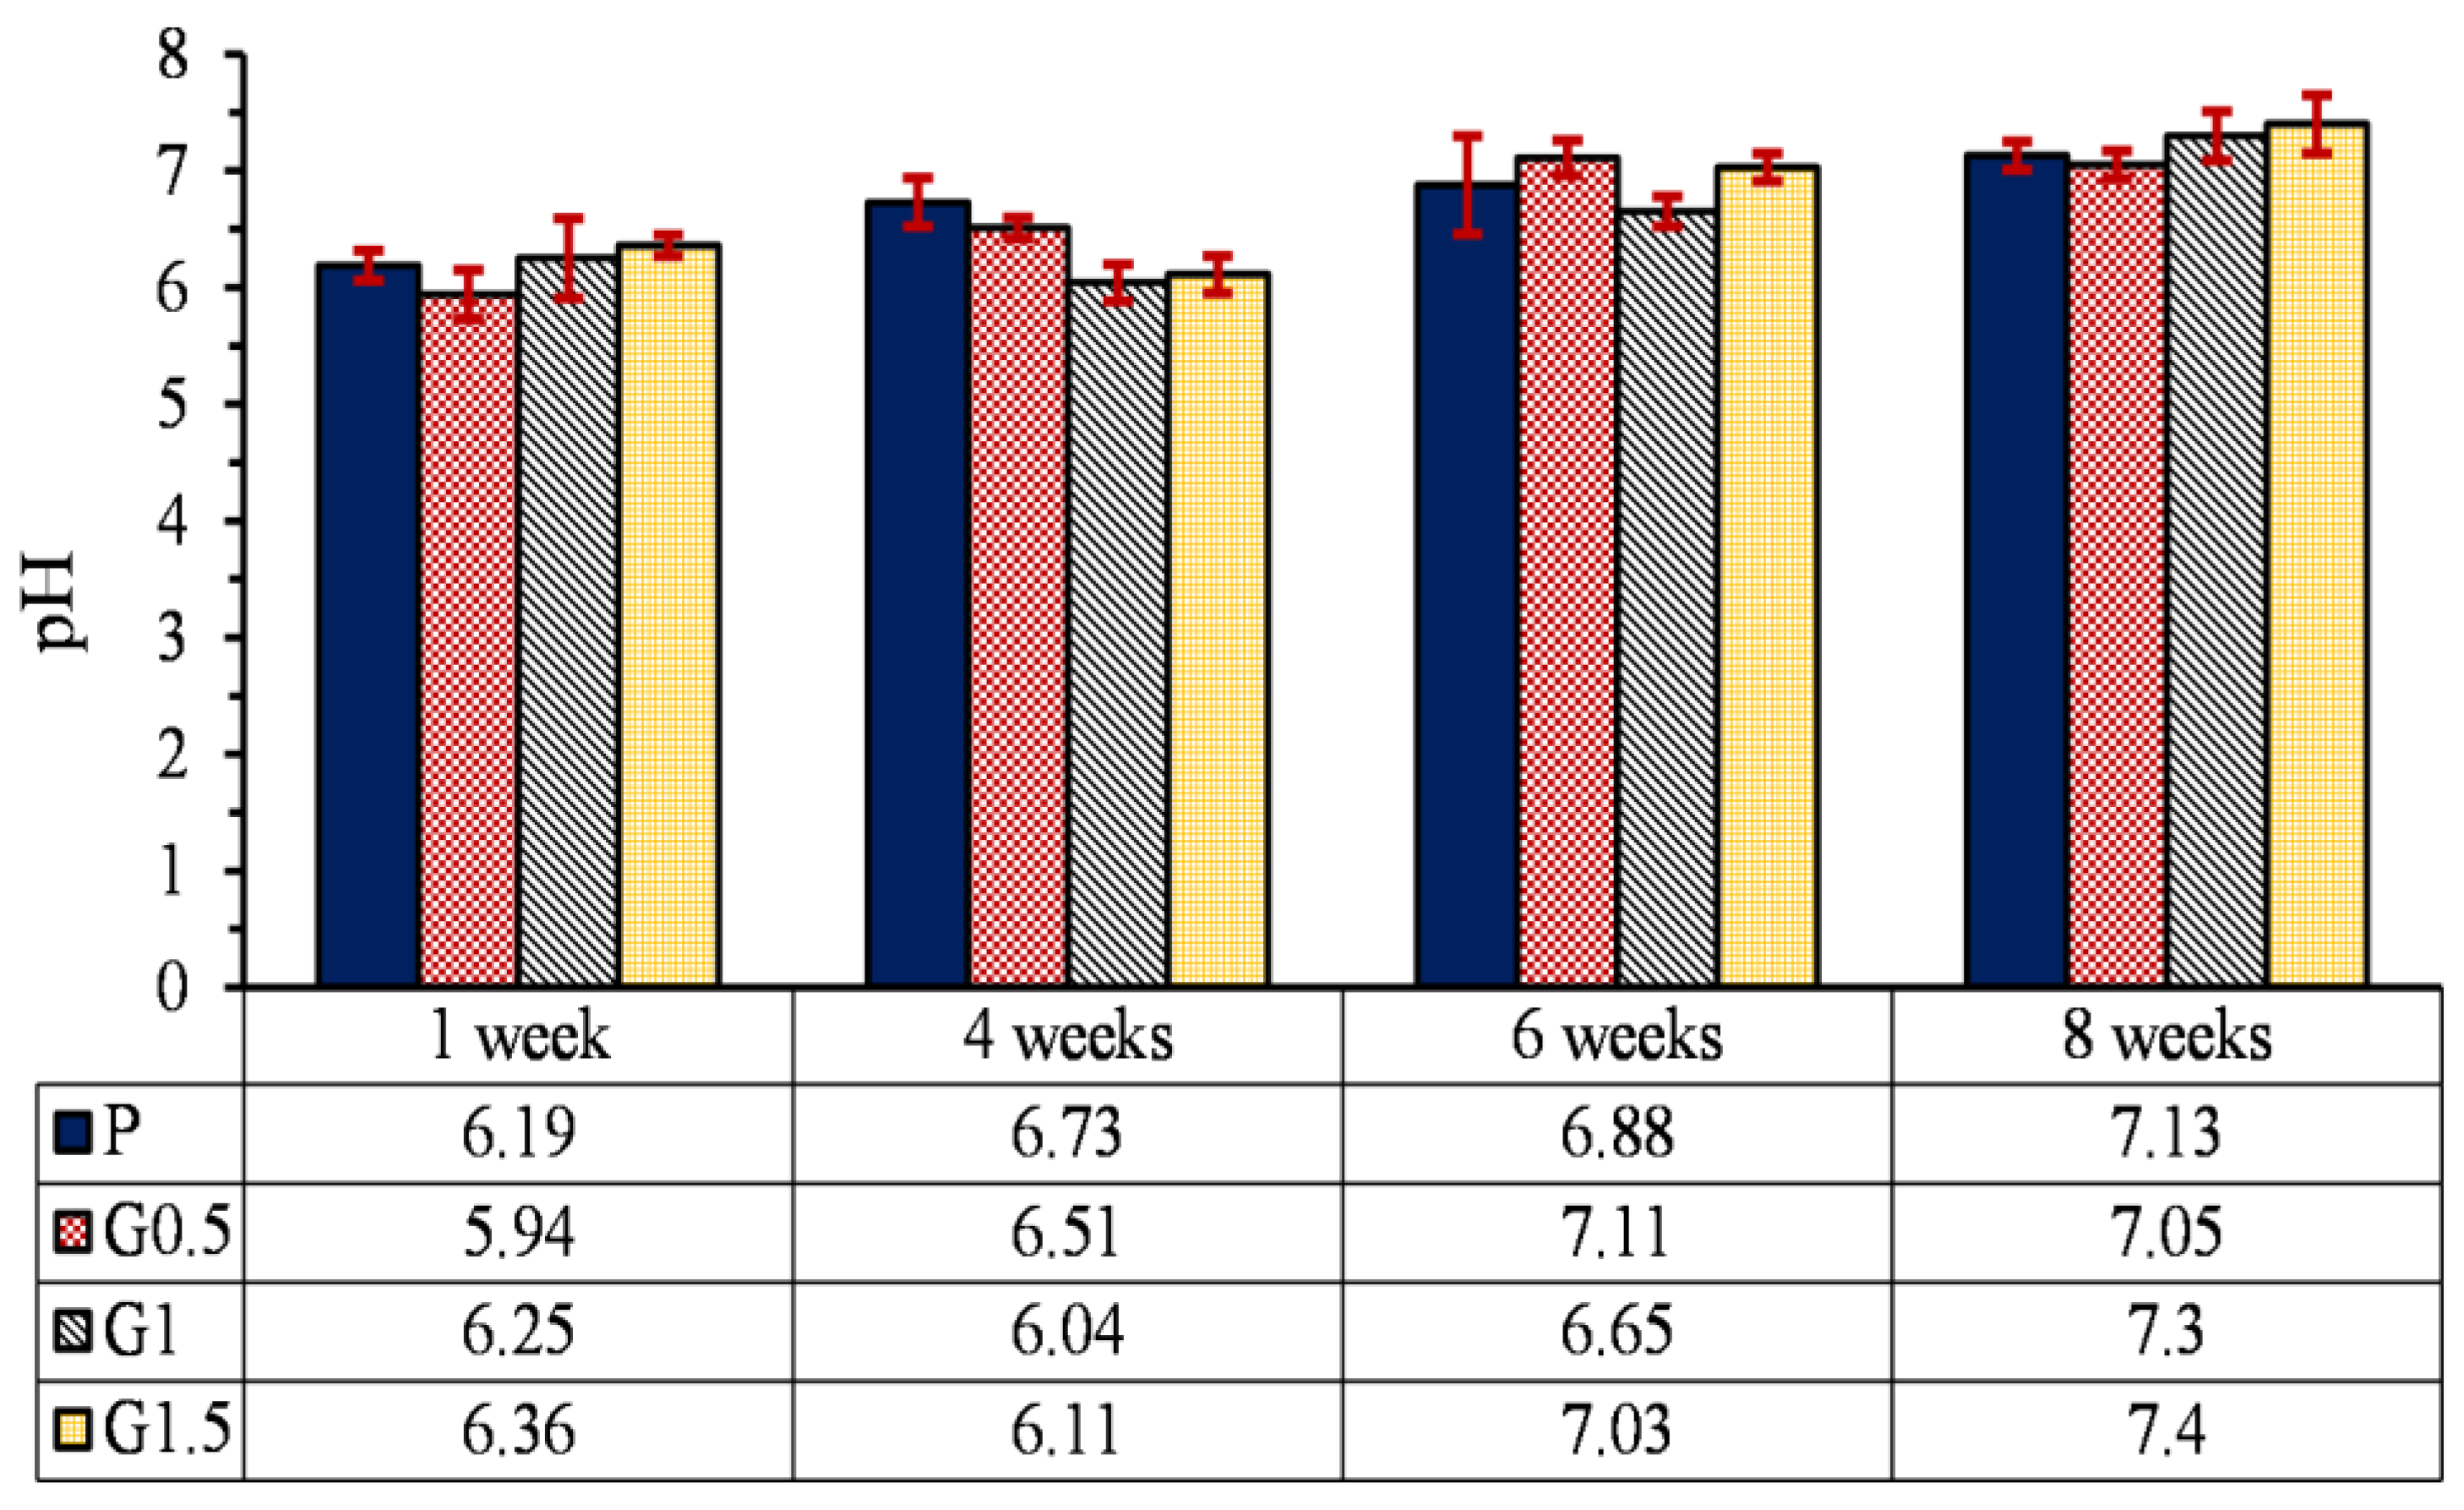
Figure 18.
pH variation of heat-treated samples in 1, 4, 6, and 8 weeks a. 0 wt. % GO, b. 0.5 wt. % GO, c 1 wt. % GO, d. 1.5 wt. % GO. (P: non-reinforced samples, G: GO-reinforced samples, numbers before dash denote the GO particles contents, numbers after dash denote time of heat treatment).
Figure 18.
pH variation of heat-treated samples in 1, 4, 6, and 8 weeks a. 0 wt. % GO, b. 0.5 wt. % GO, c 1 wt. % GO, d. 1.5 wt. % GO. (P: non-reinforced samples, G: GO-reinforced samples, numbers before dash denote the GO particles contents, numbers after dash denote time of heat treatment).

| Thermal Property | Value |
|---|---|
| Glass Transition Temperature | -27° C |
| Degradation Temperature | 100° C |
Table 2.
Selected processing parameters to produce 3D printed samples for evaluating effect of post curing time.
Table 2.
Selected processing parameters to produce 3D printed samples for evaluating effect of post curing time.
| Label | PC-0h | PC-1h | PC-3h | P-6h | PC-12h | PC-18h |
|---|---|---|---|---|---|---|
| Post curing time (h) | 0 | 1 | 3 | 6 | 12 | 18 |
Table 3.
Selected processing parameters to produce 3D printed samples for evaluating effect of heat treatment and GO percentage.
Table 3.
Selected processing parameters to produce 3D printed samples for evaluating effect of heat treatment and GO percentage.
| Label | Percentage of GO (wt%) | Heat treatment period (h) |
|---|---|---|
| P | 0 | 0 |
| P-6h | 0 | 6 |
| P-12h | 0 | 12 |
| P-18h | 0 | 18 |
| G0.5 | 0.5 | 0 |
| G0.5-6h | 0.5 | 6 |
| G0.5-12h | 0.5 | 12 |
| G0.5-18h | 0.5 | 18 |
| G1 | 1 | 0 |
| G1-6h | 1 | 6 |
| G1-12h | 1 | 12 |
| G1-18h | 1 | 18 |
| G1.5 | 1.5 | 0 |
| G1.5-6h | 1.5 | 6 |
| G1.5-12h | 1.5 | 12 |
| G1.5-18h | 1.5 | 18 |
Table 4.
Compressive strength of Go-free samples at various heat treatment times.
| Label | Compressive strength (MPa) | Young modulus (MPa) |
|---|---|---|
| P | 27.7 | 62.3 |
| P-6h | 15.6 | 86.8 |
| P-12h | 23.8 | 89.1 |
| P-18h | 18.9 | 79.6 |
Table 5.
Pore size and porosity of printed scaffolds.
| Percentage of GO (wt%) |
Pore size (µm) |
Porosity (%) |
|---|---|---|
| 0 | 740-760 | 40 |
| 0.5 | 520-560 | 37 |
| 1 | 550-590 | 36 |
| 1.5 | 500-524 | 31 |
Disclaimer/Publisher’s Note: The statements, opinions and data contained in all publications are solely those of the individual author(s) and contributor(s) and not of MDPI and/or the editor(s). MDPI and/or the editor(s) disclaim responsibility for any injury to people or property resulting from any ideas, methods, instructions or products referred to in the content. |
© 2023 by the authors. Licensee MDPI, Basel, Switzerland. This article is an open access article distributed under the terms and conditions of the Creative Commons Attribution (CC BY) license (http://creativecommons.org/licenses/by/4.0/).
Copyright: This open access article is published under a Creative Commons CC BY 4.0 license, which permit the free download, distribution, and reuse, provided that the author and preprint are cited in any reuse.


