Submitted:
27 June 2023
Posted:
27 June 2023
You are already at the latest version
Abstract
Since the 20th century, Japan has experienced a period of very rapid urbanization. Cities have experienced substantial densification and expansion, resulting in gradually elevated flood risk. Urban flooding has also occurred in most large cities in Japan, particularly in Tokyo. In response to this growing problem, much effort and resources have been spent on research and development aimed at understanding, simulating, and managing urban flood risk in Japan. The objective of this review is to summarize, discuss and share key outputs from some of the main research directions in this field, significant parts of which have been uniquely developed in Japan and only published in Japanese. After a general introduction to urban runoff modelling, in the next section, key historical works in Japan are summarized, followed by a description of the situation in Japan with respect to observations of precipitation and water level. Then, the storage function model approach is reviewed, including an extension to urban basins, as well as recent experiments with AI-based emulation in Japanese basins. Subsequently, we review the prospects of detailed hydrodynamic modelling involving high-resolution, vector-based Geographical Information System (GIS) data for the optimal description of the urban environment with applications in Tokyo. We conclude the paper with some future prospects related to urban flood risk modelling and assessment in Japan.
Keywords:
urban flood risk assessment
; USF model
; TSR model
; urban landscape GIS delineation
; rainfall data
1. Introduction
Development in urban areas greatly increases surface runoff, owing to the increase in impervious surfaces, as well as the total runoff volume flowing to the receiving watershed. In addition, the construction of storm sewer systems and the culverting of rivers during the urbanization process increase the runoff rate. The peak velocity of runoff inevitably increases as more runoff is discharged at shorter intervals, resulting in an increased risk of overflow. In conjunction with the concentration of population and property in the watershed, urbanization thus generally makes flood potential higher [e.g.,1,2,3,4].
Since the latter half of the 20th century, urbanization has progressed rapidly in both developed and developing countries. Especially in Japan, urbanization has progressed much more rapidly than in Europe and the United States [5]. Mountains and hills in watershed areas that had been forests and fields were developed one after another, and agricultural land, including paddy fields, was simultaneously converted into residential land [5]. As a result, the watersheds were transformed into urban areas with a high risk of inundation. In an urban watershed, there is a complex distribution of artificially developed impervious areas, such as houses, buildings, paved roads, and parking lots, where rainwater cannot infiltrate. Runoff pathways by storm drainage facilities, such as sewers and artificial drainage channels, as well as runoff control and flood control facilities (e.g. storage and infiltration facilities), form a very complex urban runoff system that is constantly changing [6]. In Japan, the 1958 Kano River Typhoon Event is considered as the first case of urban flooding [7], which caused extensive inundation damage not only in the lowlands but also in previously flood-free plateau areas [7,8].
In terms of flood damage in Japan, there has been a decreasing trend in human losses, although the economic losses have not decreased. The damage per unit area has exhibited an upward trend since the 2000s. Recent floods in urban areas have become more complex than past urban floods. One reason is the increasing frequency of unpredictable localized torrential rains, commonly called "guerrilla downpours" [e.g., 9,10,11], which might be considered to be an effect of urbanization [12]. Seino et al. [13] explored how urbanization affects precipitation in the Tokyo metropolitan area. The risk of pluvial flooding caused by surcharge from sewerage facilities has been shown to increase compared to fluvial flooding caused by overflow from river channels [14].
Urban flooding, especially associated with recent record-breaking rainfall events, has become one of the most pressing social issues. Thus, flood mitigation is a crucial water management strategy for reducing destructive damage. For this purpose, rainfall-runoff models are important tools that play a central role, especially in urban watersheds. Generally, the purpose of runoff analysis is to clarify the physical mechanism of the runoff process by applying the amount of precipitation (rainfall, snowfall, etc.) to predict hydrological impacts, such as floods and droughts, in the target watershed. The results are used for the planning and management of rivers and watersheds.
In terms of process description, runoff models can be classified into two main types: lumped and distributed models. The former considers the watershed as a homogeneous unit without spatial variability and the runoff process is generally expressed as ordinary differential equations of time. Distributed models explicitly consider the spatial variability of watershed characteristics and are usually expressed as partial differential equations of time and place [15,16]. In addition, semi-distributed models also exist, where a watershed is divided into sub-watersheds, each of which represented by a lumped model. Based on how the response of runoff as output to rainfall (precipitation) as input is described, models may be classified into “response models”, that simply uses a response relationship, "conceptual models", that conceptualize the response relationship, and "physical models", that model the runoff from the basic equations of physics.
The most commonly used lumped conceptual models in Japan today are the tank model [e.g., 17] and the Storage Function (SF) model [18,19]. The tank model was developed by Sugawara in 1956 [17] and the SF model was proposed by Kimura in 1961 [18,20]. The SF model is a lumped model used to simulate individual flood events and has the ability to represent nonlinearity in the runoff process with a relatively simple structural equation and fast calculation. The SF model is commonly used in watersheds with relatively large catchment areas under the jurisdiction of the Ministry of Land, Infrastructure, and Transport (MLIT), and has become the standard runoff model for flood control planning in Japan [21,22,23,24].
In contrast to lumped models, distributed models explicitly incorporate the spatial variability of watershed characteristics. With the widespread use of Geographic Information System (GIS) technology, distributed physical models have been widely used in small- to medium-sized urban watersheds, where the effects of land-use change and flood control facility development on runoff characteristics have been evaluated [25,26,27]. The main advantages of commonly used grid-based distributed models are their simple structure and their use of spatially explicit watershed information, that is generally readily available. Because of these advantages, grid-based distributed models are widely used not only in rural areas, but also in urban watersheds. In Japan, Sayama et al. [28] proposed the Rainfall-Runoff-Inundation (RRI) model, which is a 2D model capable of simultaneously analyzing rainfall-runoff and flood inundation. The RRI model has been integrated with modelling and visualization tools by the International Centre for Water Hazard and Risk Management (ICHARM) of the Public Works Research Institute (PWRI) [29] and is used not only in Japan but also in other countries.
Globally, many different basin-scale hydrological models have been developed, including the TOPMODEL [30], Xinanjiang Model [31,32], Systeme Hydrologique Europeen (SHE) [33], and Institute of Hydrology Distributed Model (IHDM) [34], and those are also commonly used in Japan. The Hydrologiska Byrån Vattenbalans (HBV) model was developed in Sweden in the 1970s, and has been widely used worldwide [35]. More recently, the Hydrological Processes for the Environment (HYPE) model [e.g., 36,37] was developed, which has been set up from the basin to the global scale and is used for operational forecasting as well as climate change impact assessment. Tanouchi et al. [21] have developed the semi-distributed HYPE model to improve the description of urban runoff.
Accurate characterization of impervious surface type and extent is required for the prediction of the corresponding impacts on watershed hydrology [38]. However, in general, the land use information used as watershed characteristics in grid-based models is simply the impervious area ratio and the runoff coefficient. Therefore, the ability to accurately represent impermeable characteristics of urban watersheds in grid-based models is limited [39]. Many models use raster-type land use data generated from aerial photographs.
With recent technological advances in GIS, digital information has become readily available for urban watersheds. In addition to grid-shaped raster land use information, vector-type polygonal (polygon shape) land use data, which can accurately represent buildings, roads, and other land features, have also been created [40]. However, there are still only a few cases in which polygon-type land use information is directly used for runoff analysis. Sample et al. [41] used GIS to facilitate urban storm water analysis using land use parcel boundaries. Rodriguez et al. [42] used a vector-based watershed description based on a so-called urban databank, which includes the categories: cadastral parcel, building, street, sewer system and river, to calculate an urban unit hydrograph. Lee et al. [43] developed a model to evaluate Low Impact Development (LID) by defining a watershed as a Hydrological Response Unit (HRE), which is a sub-watershed for calculating stormwater inflow to the sewer system. However, the area of the HRE is very big with several thousand square meters, and land-use information is averaged over the HRE.
In light of this background, we review flood runoff analysis and modelling with a focus on urban watersheds in Japan. Regarding previous research related to urban flood runoff modelling in Japan, this has already reviewed in detail in the authorized Handbook [44] and Hydroscience Formulary [16,45,46,47] published by Japan Society of Hydrology and Water Resources (JSHWR) and Japan Society of Civil Engineers (JSCE), respectively. Therefore, in this review paper we mainly focus on recent developments in urban flood runoff modelling. Following this introduction, in Section 2, we briefly describe the history of urban runoff modelling in Japan. Section 3 is devoted to observations of precipitation and water levels, which are required for accurate modelling and the current situation in Japan. Section 4 focuses on lumped modelling, the Urban Storage Function (USF) model is outlined as an example, and the hydrological data required to build the model for urban areas are described together with the prediction accuracy obtained using Artificial Intelligence (AI). Distributed physical modelling is reviewed in Section 5, including different approaches to describing the urban structure, as well as the Tokyo Storm Runoff (TSR) model as an example of a distributed model using vector-type GIS data. This paper closes with some future prospects related to urban flood runoff modelling in Japan.
2. Brief History on Urban Runoff Modelling in Japan
In Japan, Morita [48] characterized an urban watershed as a so-called "small- to medium-sized urban river basin", where most of the watershed is flat land, such as alluvial plains, flood plains, alluvial fans and hills. Normally, the entire upper, middle and lower reaches are developed into urban areas, and the watershed area is generally smaller than 100 km2.
As for urban runoff research in Japan, Kinoshita [1] was the first to comprehensively and quantitatively describe and discuss urban flood runoff mechanisms in 1967. This paper was followed by numerous studies on urban flood runoff mechanisms [e.g., 2,3], which were summarized by Kadoya [4] in 1985. There, the urban flood runoff mechanisms are characterized by: (1) an increased runoff rate during floods, (2) a reduced flood concentration time before rainwater flows into rivers, and (3) extremely large peak runoff rates due to high-intensity rainfall peaks with a short duration. Generally, most of the flood runoff models were mainly intended for mountainous and natural watersheds and were not developed with urban watersheds in mind, as pointed out in the Hydrology and Water Resources Handbook published by JSHWR in 1997 [49]. In addition, physical runoff processes in urban watersheds are not fundamentally different from those in natural watersheds. As a result, when applying a runoff model to an urban watershed, only the model parameters are usually adjusted [49].
The rational equation [e.g., 50], which is used in many small- to medium-sized river and sewage system plans in Japan, was originally proposed as a model for estimating peak flows as a basis for stormwater management in urban watersheds. Parameters such as the runoff coefficient and flood concentration time need to be calibrated for the target urban watershed. For example, in 1976, Kadoya and Fukushima [51] proposed an equation relating flood concentration time to flood magnitude based on the equivalent roughness method. The synthesized rational formula [52,53] has also been developed as a model for urban watersheds in 1998. This method creates a hydrograph by dividing an urban watershed into sub-watersheds, each characterized by area, runoff coefficient and flood concentration time, and combining the peak flows by superimposing the results from the rational equation. The quasi-linear storage model [54] developed in 1977 and the modified RRL method [55] developed in 1972 are also used as flood runoff models for urban areas, by setting flood concentration times and runoff coefficients for the urban watershed of interest [56,57].
In 1954, Iwagaki and Sueishi applied the kinematic wave theory to the analysis of hillslope runoff [58,59], and soon after, Lighthill and Whitham [60] developed the kinematic wave theory for river flow tracking. Since then, this theory has been accepted as a standard tool for modeling surface flows and various other elementary hydrological processes [61,62]. The kinematic wave model, in which the watershed is described in terms of a collection of rectangular slopes and river channels, and rainwater flow is represented by a hydraulic continuity equation and a kinematic equation, is a widely used distributed physical model in Japan (see, for example, [24,62]). As an example of applications of the kinematic wave model to urban watersheds, in 1991 Ando et al. [63] divided an urban watershed into rectangular sub-watersheds using spatially distributed rainfall and applied the kinematic wave model to each divided sub-watershed. The hydrograph reproducibility was improved by using the equivalent roughness value of the urban watershed as an input. In 1995 Fujimura et al. [64] showed that diffusion wave or dynamic wave models are more accurate than kinematic wave models for non-stationary and unsteady river channel flow calculations, although kinematic wave models are used for slope flow as well as surface flow of low-lying watersheds. In 1996, Suzuki et al. [65] developed the Doken model as a distributed model for real-time flood forecasting. The model has been incorporated into the Integrated Flood Analysis System (IFAS) for flood forecasting in watersheds with inadequate water level observations and applied in Asian countries such as Pakistan [66]. In 1997, Chikamori et al. [67] attempted to obtain model parameters such as equivalent roughness using GIS information when constructing a kinematic wave model for an urban watershed. In the Technical Standard for River Erosion Control, Research Edition by MILT [68], the rational equation [50], the SF model [18], the Kinematic Wave model [24], the quasi-linear storage model [54], the tank model [17], and the Doken model [65] are introduced as runoff models.
Since then, along with the rapid development of computer and IT technology, the analysis of flood runoff in urban watersheds has been improved in several respects. Data collection by e.g. satellites and radar is a significant advancement, as is the advancement of GIS technology [69]. Furthermore, a range of new methods based on e.g. optimization methods, network theory and AI have been applied to flood runoff analysis and modelling. Shibuo and Furumai [70] recently reviewed urban stormwater management in Japan, focusing on rainfall observations, numerical modelling and emerging technologies.
3. Rainfall and Water Level Observation System in Japan
A key component of flood runoff modelling is access to observational data. In Japan, information on rainfall and river levels is mainly provided by the Water Information and National Land Data Management Centre established by the Water Management and Land Conservation Bureau under the MLIT [71]. As of 2023, real-time river observations (water level and streamflow) and rainfall observations are provided online at 7580 and 10619 stations, respectively [72]. In particular, the recently developed crisis water level gauges have improved the river level monitoring during heavy rainfall, with approximately 6,000 stations installed from 2018 to 2020. For rainfall, in addition to these, approximately 1,300 precipitation monitoring stations have been installed by the Japan Meteorological Agency (JMA) through the Automated Meteorological Data Acquisition System (AMeDAS), with one station per 17 km2 across the country [73].
The X-band Multi-parameter (MP) network of weather radar, known as the eXtended RAdar Information Network (XRAIN), was developed in 2008 by MLIT. The network uses 16 high-performance C-band MP radars and 39 X-band MP radars specialized for rainfall observation [74]. XRAIN provides high-resolution (250 m), high-frequency (1 minute), and near-real-time rainfall information for almost the entire land area of Japan, without the need for correction by rain gauges at the ground surface. However, owing to its short wavelength, XRAIN has only a narrow observation area (80 km radius) because of attenuation caused by rainfall, and in some cases, it cannot fully penetrate heavy rainfall areas.
In urban areas, small- to medium-sized rivers are at high risk of river overflow and flood damage due to flooding caused by short periods of high-intensity rainfall. Therefore, urban runoff analysis requires very high-resolution observations to accurately capture the spatial and temporal distributions of rainfall. Schilling [75] suggested that rainfall data of at least 1-5 minute and 1 km resolutions should be used for urban drainage modelling. Fabry et.al. [76] recommended the use of higher-resolution data (1-5 minutes temporal and 100-500 m spatial) for urban hydrological applications to provide the necessary hydraulic details. In the case of localized torrential rainfall, there is often a delay of only tens of minutes from the start of the rainfall to the peak river water level, and flooding damage associated with such events is frequent in large cities in Japan [77]. For this reason, the validation of flood runoff analysis models for urban areas requires a time resolution of river observations similar to that of the rainfall observations.
In Tokyo, for example, the Tokyo Metropolitan Flood Control Integrated Information System (FCIS) plays a role in flood prevention activities by automatically collecting real-time observations of rainfall and river water levels in Tokyo and providing them to relevant organizations [78]. The FCIS began observing 10-minute rainfall in January 1978 and later increased the resolution to 1 minute. Water-level observations were initiated to inform residents of the danger of flooding due to the rapid increase in water levels caused by heavy rainfall. A total of 124 water level observation stations were established in Tokyo and 15 stations (1.67 km²/station) were established in the Kanda River basin. Rainfall observations were introduced to measure high-intensity rainfall with high resolution in time and space as well as high precision. The number of rainfall observation stations has increased annually, and as of 2022, 93 stations (19 km2/station) have been installed (Figure 1). This is a very large number, considering that there are only 10 AMeDAS stations operated by the JMA [73] in Tokyo (178 km2/station). FCIS data are expected to accurately describe the spatial variability of heavy rainfall.
4. Storage Function Model in Urban Watersheds
4.1. Conventional SF Models
SF models are event-based lumped models that are used for short-term hydrograph prediction, characterized by a relationship between storage and discharge. Kimura’s original SF model in 1961 is a method to divide effective rainfall into storage and runoff processes by separating the watershed into runoff and infiltration areas [79] and is described as the "total storage function method" in the 1985 edition of the Hydroscience Formulary [80]. In general, the relationship between storage and discharge in a watershed during a flood can be described by a two-valued function, where the relationship between storage and discharge differs between the rising and receding parts of the hydrograph, respectively, and often forms a loop [81,82]. Kimura's SF model with two parameters introduced a delay time to eliminate this loop. In 1967, Prasad [83] presented a three-parameter SF model that directly expressed the bivalence between storage and discharge by adding a term for the loop effect. In 1982, Hoshi and Yamaoka [84] developed a four-parameter SF model by adding another parameter to accurately express the bivalence of the loop effect.
Flood runoff models, including conventional SF models, generally target the direct runoff component of the total runoff, except for tank models, that incorporate rainwater loss and storage effects. Thus, general flood runoff models require effective rainfall as their input for the prediction of direct runoff. Hence, at first, the separation of baseflow from the total discharge is needed to calculate the effective rainfall when applied to the actual runoff analysis. There is no definitive method for separating direct runoff, and the calculated direct runoff will be different because of the subjective nature of the separation process [85]. As a result, the identification of model parameters may change significantly, which may cause the stability and reliability of the runoff calculations to decrease. Baba et al. [22] and Hoshi et al. [86] developed an SF model that directly uses the observed rainfall and runoff to solve the problems associated with the estimation of direct runoff. The proposal of a model concept that does not require the separation of baseflow is groundbreaking [69].
The four conventional SF models are the Linear, Kimura [18], Prasad [83], and Hoshi [86] models, and their storage equations are shown in Table 1, where s is the storage (mm), Q is the observed river discharge (mm/min), t is the time (min), k1, k2 are model parameters that express the constant of proportionality for Q and the time variation of Q, respectively, and p1, p2 are model parameters that express the exponent related to Q itself and the time variation of Q, respectively. The associated continuity equations, in which ql and qR include parameters k3, z, and α, respectively, are also listed, and they are explained in the next section 4.2. Among these models, Hoshi’s model was found to be superior owing to an additional parameter p2, which may be quantified by numerical experiments and can well define the flow characteristics based on kinematic wave theory [87]. Some simplifications in Hoshi’s storage model can lead to Prasad’s storage model [83]. If we set p2=1 in Hoshi's model, we obtain Prasad's storage model. Similarly, if we set k2=0 in Prasad's model, the model can be transformed into Kimura's model [18]. The simplest linear model can be obtained by keeping p1=1 in Kimura's model. Kimura’s SF model with one storage tank, which is widely used as a special case of Kimura's original model with a delay time of zero [87].
4.2. Urban Storage Function (USF) Model
The runoff characteristics of urban watersheds are significantly different from those of natural and mountainous watersheds, because of high proportion of impervious areas and increasing prevalence of sewerage systems. Therefore, it is difficult to accurately reproduce the hydrographs of small- to medium-sized urban rivers with short flood concentration times by using conventional SF models. Takasaki et al. [88] proposed an SF model including a two-valued function that considered the runoff characteristics of combined sewer systems. Later, Takasaki et al. [23] proposed and constructed an urban storage function (USF) model that does not require calculation of effective rainfall or separation of baseflow, but directly uses observed rainfall and runoff.
Figure 2 shows the schematic diagram of all possible inflow and outflow components of an urban watershed with a combined sewer system. Combined sewers are common in small- to medium-sized river watersheds in old cities such as the Tokyo Metropolitan District, where sewers have been in place since the 1900s [89]. The inflow components in Figure 2 are represented by rainfall R(mm/min) and urban-specific and groundwater inflows from other watersheds I(mm/min). Urban-specific inflows include leakage from water distribution pipes, irrigation flows, etc. The outflow components consist of the river discharge Q(mm/min), evapotranspiration E(mm/min), storm drainage from the watershed through the combined sewer system qR(mm/min); water extraction from the watershed for e.g. water supply and agricultural needs, etc., O(mm/min); and groundwater-related loss ql (mm/min). In addition, domestic sewage qw is depicted in Figure 2 even though it does not contribute to watershed storage s (mm).
The USF model is an empirical representation of Hoshi’s SF model shown in Table 1 in which the river discharge Q is replaced by the discharge including the storm drainage Q + qR. The associated continuity equations, that do not require the separation of baseflow for both the conventional SF models and USF model, are listed in Table 1. Here, the groundwater-related loss (ql) was defined by considering the infiltration hole height (z) by multiplying k3, which are the new parameters in the continuity equations in Table 1. Furthermore, the qR of the USF is defined by using an additional parameter α that expresses the slope of the linear relationship between the total discharge Q + qR and the drainage qR (refer to references [23] and [90] for details).
Thus, seven unknown parameters (k1, k2, k3, p1, p2, z and α) are identified in the USF model. As an optimization method for parameter identification in lumped conceptual models, global search methods using evolutionary computation methods such as genetic algorithms have diversified in recent years [91]. Among them, the effectiveness of the Shuffled Complex Evolution University of Arizona (SCE-UA) method developed by Duan et al. [92] has attracted considerable attention [93,94].
4.3. Application of the USF Model in an Urban Watershed
Takasaki et al. [23] applied the USF model to the upper Kanda River watershed (Figure 1), a typical small- to medium-sized urban watershed in Tokyo that is entirely urbanized and where urban flooding occurs frequently. The small concentration time implies that river runoff occurs within a short period of time immediately after rainfall, and it is required to use hydrological data with very short time intervals for rainfall-runoff analysis. Therefore, FCIS rainfall and water level data at 1-minute intervals described in Section 3 were used. They used the SCE-UA method for parameter identification and verified the effectiveness of the USF model, including the much-improved reproducibility of the hydrograph [23].
Padiyedath et al. [90] applied the five SF models shown in Table 1 to the upper Kanda River watershed. They also used the SCE-UA method to identify parameters to verify the performance of the SF models. As for the results, the USF model showed not only the highest hydrograph reproducibility among the five SF models, which is not surprising that the hydrograph reproducibility increases with the number of model parameters, but also the most effective SF model from an Akaike information criterion (AIC) [95] perspective. In addition, the uncertainty of the seven parameters of the USF model was evaluated in detail using a residual-based bootstrap approach [96]. Furthermore, Padiyedath et al. [97] expanded the USF model by considering the spatial distribution of rainfall over watersheds, and developed a generalized SF model able to directly estimate the water level [98].
Lumped models, such as the USF model with a relatively small number of model parameters, are suitable for real-time flood runoff forecasting by changing the model parameters sequentially. Parameter identification can be almost automated using global search methods like SCE-UA, and hydrograph reproducibility at the target point is generally higher than that of a distributed model. Takasaki et al. [99,100] applied both the particle filter method and the Kalman filter method to real-time flood runoff forecasting using the USF model in the upper Kanda River watershed, and obtained accurate forecasting results.
4.4. Runoff Prediction by USF Using XRAIN Data in an Urban Watershed
For localized torrential rainfall events in the upper Kanda River watershed (Figure 1), the USF model has also been used to evaluate hydrograph reproducibility using XRAIN rainfall data and the FCIS rain gauge data [101]. At first, 1-minute XRAIN mesh rainfall data were compared to 1-minute FCIS rain gauge data of the same mesh to check the precision of XRAIN [102,103]. The results showed that 1-minute XRAIN well corresponded to 1-minute ground observation rainfall, but the former were observed one to three minutes earlier than the ground observation, which was considered mainly due to the falling time of rain drops. Spatiotemporal correlation analysis between XRAIN and FCIS rain gauge data has also been conducted [104,105]. As for the results, for rainfall during typhoons, where the rainfall area moved clearly along with the typhoon, it was shown that radar rainfall was highly correlated with ground rainfall with a 2-minute delay time. For localized torrential rainfall, it has been shown that the spatiotemporal correlation between XRAIN and ground rainfall is much more complicated than in a typhoon case, and the peak correlation does not always occur in the same mesh as the rain gauge but in the surrounding meshes.
Regarding runoff predictability, the best performance was found for FCIS rainfall observations, whereas the performance was lower for XRAIN [101]. This study also showed that it was possible to improve runoff prediction using XRAIN by considering spatiotemporal correlation characteristics. It should be emphasized that there is a spatial uncertainty in XRAIN rainfall, as it is measured at some elevation in the atmosphere and not at ground level. This uncertainty can significantly affect runoff prediction using XRAIN, particularly in the case of localized torrential rainfall occurring near the watershed boundary in small- to medium-sized watersheds [101,105].
4.5. AI-based Flood Runoff Modelling in Urban Watershed
Machine learning using AI technology has developed remarkably in recent years. To utilize machine learning for flood forecasting, many AI-based flood runoff models have been constructed using e.g. multilayered artificial neural networks (ANN) or deep learning (DL) [69]. Many of these models have been constructed for large river watersheds [e.g. 106,107] using hourly observation data as input, and some DL applications for small- to medium-sized mountain river watersheds have used 10-minute data to construct the models [108]. On the other hand, in small- to medium-sized urban rivers, such as in Tokyo, water level and rainfall observations are carried out at 1-minute intervals as described in Section 3. It has been concluded that the combination of temporal and volume resolutions in rainfall observations is critical for successful AI modelling. In particular, the hyetographs of 1-minute observations are highly intermittent and differ from the 10-minute and hourly data in large river watersheds.
An attempt was made to emulate the USF model using ANN and DL. Fujizuka et al. [109] tested the performance of a DL model using a virtual hyetograph and a virtual hydrograph, and examined the impact of the amount of training data. The DL model was compared with a conventional ANN model on virtual datasets [110]. For both the ANN and DL models, if the number of nodes in the input layer is sufficient, the Nash–Sutcliffe coefficients of the hydrograph of both models are greater than 0.98; therefore, even the conventional ANN model can accurately emulate the USF model. However, when the total number of nodes in the intermediate layer was the same, the accuracy of the DL model was higher than that of the ANN model. Fujizuka et al. [111] also performed a comparison using actual observations, and concluded that the DL model was superior when considering the number of parameters in relation to the number of observations.
Recently, hybrid forecasting models that combine an ANN forecasting model with a flood runoff model have been proposed [112]. In conventional ANN models, water level and flow rate are used as the main input data for training and forecasting. In contrast, the hybrid forecasting model incorporates flow rate forecasts from the runoff model into the input layer of the deep ANN model. This is expected to improve the forecasting of unprecedented runoff peaks, which remains a challenge for conventional statistical models.
5. Distributed Physical Models in Urban Watersheds
5.1. Background
In recent years, most of the distributed flood runoff models developed in Japan for urban watersheds have focused on surface flooding and inundation analysis, and few have focused on runoff analysis and the generation of runoff volume directly from urban impervious areas. Since 1980, with significant improvements in numerical techniques and hydrological models for slope flow, surface flow hydrological models have become available for predicting inundation and inundation hazard maps have been prepared as flood damage reduction countermeasures. Most inundation analysis models are based on shallow water equations as applied e.g. by Iwasa et al. [113]. Toda et al. [114] used a kinematic wave model for runoff from mountainous areas near urban areas and combined it with an inundation model for urban areas that also considers drainage by sewage systems. Subsequently, a new integrated lowland inundation model was developed and used for flood inundation forecasting, considering slope runoff processes, sewer flows, surface inundation, and runoff from manholes. This model configuration has been established as a standard model for flood damage prediction by flood inundation analysis in urban watersheds.
Furthermore, hydraulic models such as InfoWorks, MOUSE and Storm Water Management Model (SWMM), which are mainly intended for the design and flow analysis of sewer pipelines, have been integrated with surface inundation models and are used to analyze flooding due to poor stormwater pipeline drainage, etc. In Japan, although these models are used in practical applications, they are not widely used for flood runoff analysis in urban watersheds because, as mentioned above, the development of flooding analysis models that take sewer pipeline flow into account has been conducted independently. As an example of an integrated sewerage and inundation model, Shibuo et al. [115] developed a comprehensive analysis model for the Tsurumi River watershed using the Water Energy-Based Distributed Hydrological Model (WEB-DHM) to calculate runoff from the upper catchment and InfoWorks to analyze the sewers and combining them into an integrated river channel and sewage model. In addition, many inundation analyses of urban watersheds have been conducted overseas using the Hydrologic Engineering Center's River Analysis System (HEC-RAS), an open source 2D hydraulic model integrated into GIS [116,117]; this model is not widely used in Japan.
5.2. Representation of Uurban Structures in Distributed Physical Models
Urban flooding processes can be described by a dual drainage model that combines a 1D hydrodynamic model of the stormwater drainage network model with a 2D hydrodynamic model of overland flow and flooding [118]. In particular, different representations of urban structures have significant effects on surface flood processes [119]. Table 2 summarizes the computational grid shapes used in different studies. The TSR model proposed by the authors modeled direct runoff generation and flood flows from the perspective of urban formation, whereas the other four models were developed to analyze urban flood inundation.
5.3. Structured Grid
Structured grid is most commonly used for surface models because of the simplicity of grid formation when analyzing ground surface flows as two-dimensional unsteady flows. The surface flow (inundation analysis) model using a structured grid was developed based on a relatively large computational grid for wide-area inundation. At the beginning of the model development, the effects of structures, road networks, etc., were considered by equivalent roughness coefficients based on land use or synthetic roughness coefficients as a function of building occupancy and inundation depth. This was done because it was difficult to take into account the influence of roads and buildings, which are likely to have a significant impact on flood flows in urban areas, in the structured grid. Later, building volume (non-flooded space) and flow disturbance by buildings were considered [120].
Currently, this is the standard method used to prepare municipal flood maps in Japan and the National Institute for Land and Infrastructure Management (NILIM) of the MLIT provides the analysis program NILIM2.0 [121]. The accuracy of inundation analysis can be improved by using high-resolution elevation data. In recent years, with advances in computer performance, analyses using 5- and 1-m mesh elevation data have been made. Inokawa and Kobayashi carried out an inundation analysis on the surface and in an underground station using a 1-m mesh and concluded that it is important to consider slight changes in the inundation level at the station [122].
5.4. Curvilinear Grid
Curvilinear grids are widely used in numerical analysis of open channel flows, including bends [123]. When this grid model is applied to an urban area, the attributes of oads and buildings can be classified for each grid if the coordinate axes are appropriately set. Compared to a structured grid, grid construction requires much more effort. Since there are only two axes, the direction of the road is restricted [123].
Fukuoka et al. focused on structures such as houses and road networks in urban areas and developed a model using a curvilinear grid for the road network, achieving highly accurate reproduction of water levels and flow velocities on roads and between city blocks of houses [124]. However, in recent studies, this coordinate system has rarely been used.
5.5. Unstructured Grid
Unstructured grids can be created according to the urban structure, for example, by applying detailed grids in regions with complex boundaries and geometries and coarsening the grids in regions that are not computationally important. However, as with a curvilinear grid, the time and effort required for grid formation are significant for unstructured grids [123].
Akiyama et al. developed a two-dimensional numerical model of flood flows based on the finite volume method (FVM) with an unstructured grid for the floodplain profile to ensure the proper representation of the road network and houses [125,126]. The flood flow in the river and the runoff on the ground were simulated simultaneously using a 2D free surface flow model based on the flux-difference splitting scheme and an unstructured FVM. For the sewer network, a dynamic network model for free-surface pressure flow based on the flux-difference splitting scheme combined with a stormwater drainage network was used. By performing inundation analysis for Iizuka City and verifying its accuracy against observations of waterlogged areas, it was shown that the model can estimate waterlogged areas with sufficient accuracy and estimate detailed inundation properties, such as overflow, internal inundation locations, and flood propagation paths.
5.6. Road Network
Inoue et al. proposed representing roads and buildings as different computational grids and developed an analysis method using a road network model that can represent flooding in real urban areas more faithfully than the method using a structured grid [127]. Road junctions were used as nodes and road segments between junctions as links; residential areas were specified as areas surrounded by the network; junctions and residential areas were defined as the analysis grid; and water depths were obtained from the continuity equation. They showed that the road network model could directly parameterize the roughness coefficients at the surface by considering the block walls.
Sekine et al. [128] proposed another flood analysis model using a road network, focusing on flow concentrations on roads and sewers in densely built-up areas. The model is characterized by its ability to faithfully model rainwater runoff from buildings into sewers. The average house in a city block, based on its roof area, was treated as a unit house in the model, and rainwater on the unit house was assumed to flow into the sewers adjacent to the city block using the kinematic wave approximation. Sekine et al. focused on three cities neighboring the 23 wards of Tokyo that were damaged by Typhoon No. 19 in 2019 and performed predictive calculations of inundation in the event of a hypothetical maximum rainfall, describing the inundation process in depressed areas and underpasses with significant inundation [129].
5.7. Urban Landscape GIS Delineation
The authors have developed the Tokyo Storm Runoff (TSR) model, that can simulate urban storm runoff and flood inundation using a vector-based watershed description [6]. The TSR model employs so-called “urban landscape GIS delineation” that realistically describes complicated urban land-use features in detail. Urban landscape GIS delineation enables an accurate representation of the infiltration and perviousness of each property, making it possible to calculate the impervious area of a target watershed with a very high accuracy. In addition, for pervious land, characteristics such as infiltration capacity can be set specifically for each land use type [40].
In Japan, 10-meter-resolution grid-based data classified by land use type is generally used in distributed runoff modelling in urban watersheds. Although there are 17 land use categories in the classification, including industrial land, commercial/business land, and general low-rise residential land, the original purpose was to obtain the basic data necessary for residential land-related policies in urban areas, and these land use categories were not compiled with differences in infiltration rates in mind. Since estimating the impervious area ratio (IAR) for each land use category is an important component of accurate runoff analysis, Koga et al. [40] overlaid this landscape GIS and grid on a typical urban watershed in Tokyo and calculated the IAR for each grid. The results revealed that the reference value of the IAR for the land use classification had an error of about 7%.
Since the urban landscape GIS considers individual buildings, roads, parking lots, and others, Araki et al. [130] added stormwater runoff control facilities for individual buildings and specific permeable paved roads in the upper Kanda River basin as attributes of their maintenance status, and examined their effectiveness in controlling flood runoff. The simulation results show that the developed model allows quantitative estimation of the efficiency of infiltration facilities.
The construction of urban landscape GIS data currently requires time-consuming manual work using GIS software [131]. Therefore, research has been conducted on automating urban landscape GIS delineation [132,133]. In addition, current GIS data only represent the planar structure of ground surface objects, and thus cannot represent the three-dimensional structure of subways, underground road tunnels, and multi-level intersections of roads and bridges, as well as buildings, especially high-rise buildings. In order to more faithfully reproduce rainfall runoff paths physically, it will be necessary to construct three-dimensional GIS data that also takes the height direction into consideration. The construction of a four-dimensional GIS that includes not only three spatial dimensions but also time has been pointed out as a challenging issue.
5.8. TSR Model
5.8.1. Outline of Tokyo Storm Runoff (TSR) Model
The Tokyo Storm Runoff (TSR) model is a distributed physical model that utilizes urban landscape GIS data (for details, see Amaguchi et al. [6]). Figure 3 shows the rainfall-runoff process for the TSR model. Rainfall in the watershed is applied to each land-use element, and rainwater that cannot infiltrate is discharged to nearby roads and further to manholes and sewer pipes based on the infiltration and imperviousness characteristics set individually. In a manhole/sewer pipe element, the water level in the manhole section is first calculated based on the inflow/outflow to/from the road and inflow/outflow to/from the connecting pipe. The flow rate is then calculated based on the water level in the manhole section and the cross-sectional characteristics of the pipe. In this calculation process, water in the manhole overflows onto the road when the water level in the manhole exceeds the ground level of the road. The overflowing water flows down the road and eventually returns into a manhole or sewer pipe with sufficient flow capacity. Thus, water entering the sewer pipes is combined with water in the sewer network and eventually flows out into the river channel. In the inundation analysis, the amount of runoff from land-use elements and the amount of overflow through manholes in the sewer system are used to calculate the water flows into residential areas when the road water level is above the surrounding ground level. The water in the residential areas flows back into the road when the water level on the road decreases.
Stormwater runoff processes in urban watersheds are highly dependent on local boundary conditions such as buildings, roads, rivers, and surface flows to sewers. Based on these boundary conditions, the TSR model calculates the direct runoff from roads, buildings, and other impervious areas that constitute a city, and simulates the transport to the ground surface, sewerage systems, and rivers. Compared to the other four representations of urban structure (grid, curvilinear, unstructured, and road network), and the associated models, the TSR model is not suitable for analyzing flooding flows with levee failures from large rivers, but it is intended for inundation phenomena such as pluvial flooding in urban areas.
5.8.2. Model Application to Urban Watershed
Amaguchi et al. [134,135] used the building element of urban landscape GIS data to set individual values for site elevation and floor elevation of buildings and made some modifications to the flooding analysis in the TSR model. This made it possible to simulate inundation conditions both inside and outside buildings. The model was set up and evaluated for the upper Kanda catchment in the Tokyo Metropolis, Japan. In the model, the parameters for the foundation height and floor height of each building, as well as the opening ratio below and above the 1st floor, were set for individual buildings based on their structure and purpose (Figure 4). This model was applied to simulate major flood events and was able to reproduce the differences in the inundation depth of individual buildings, reflecting the additional input parameters. The use of the model to evaluate inundation conditions for specific building properties was also demonstrated. The results show that the suggested approach, which is based on a detailed reproduction of all relevant elements in an urban watershed, can simulate the inundation of individual buildings (Figure 5).
6. Concluding Remarks and Future Prospects
In this review, approaches to flood runoff analysis and modelling with focus on urban rivers in Japan have been reviewed. The USF model and other lumped conceptual models predict runoff at a given point in a river using rainfall data in the target urban watershed as input. The major advantages of these methods are that the number of parameters is small, the execution time is short, and the reproducibility of the observed hydrograph is generally high.
Concerning distributed modelling, in the TSR model with urban landscape GIS delineation, all land surfaces are represented by polygons divided according to their infiltration characteristics. This concept almost eliminates the problem of excessive fine graining required in grid-based models to fully represent heterogeneity. However, current GIS data only represent the planar structure of ground surface objects, and thus cannot represent the three-dimensional structures of subways, underground road tunnels, multilevel intersections of roads and bridges, and (high-rise) buildings. To more faithfully reproduce rainfall runoff paths physically, it will be necessary to construct three-dimensional GIS data that also considers the height direction.
Furthermore, in flood runoff analysis using distributed physical models, it is important to improve observation systems for model calibration and real-time prediction of flooding and inundation. These observations include spatial real-time rainfall radar information, water levels in sewers, and inundation depth during flooding. For this purpose, technology to quickly collect and utilize accurate information. Additionally, runoff and inundation forecasts need to be transmitted in an easy-to-use format and presented in an easy-to-understand manner to different recipients. Recently, the use of drones to observe early flood damage has been proposed to help local residents decide about evacuation and efficiently promote self-help. Finally, to enable highly accurate real-time flood forecasting with sufficient lead time using any type of runoff model, accurate and reliable high-resolution rainfall forecasts are required, at least one hour ahead of an event in the case of urban watersheds.
Especially in lower urban areas, seamless coupled models will be developed that incorporate not only runoff, channel, and sewerage models but also as tidal models, which provide boundary conditions for flooding and inundation, and coastal hydraulic models to simulate storm surges, tidal waves, and tsunamis. In addition, this seamless coupled modelling will incorporate atmospheric observations and simulations, such as radar rainfall information and land surface schemes. These seamless models, or “Digital Twins,” will move beyond the scope of a single urban watershed to encompass a wide range of watersheds, including rural and mountainous watersheds (ultimately, the entire globe).
Author Contributions
Investigation, H.A. and A.K.; Writing—original draft, A.K.; Data curation, H.A., J.O., A.K. and H.T.; Methodology, H.A. and J.O.; Funding acquisition, H.A. and J.O.; Writing—review and editing, H.A., J.O. and A.K.; Supervision, H.A. All authors have read and agreed to the published version of the manuscript.
Funding
This research was funded by the Japan Society for the Promotion of Science (JSPS) and the Scandinavia-Japan Sasakawa Foundation (BR200501). This work was supported by Tokyo Metropolitan Government Advanced Research Grant Number (R4-2).
Data Availability Statement
All data are provided as tables and figures.
Acknowledgments
We gratefully acknowledge the helpful and constructive comments from three reviewers, as well as financial support from Japan Society for the Promotion of Science (JSPS) and Scandinavia-Japan Sasakawa Foundation.
Conflicts of Interest
The authors declare no conflict of interest.
References
- Kinoshita, T. Runoff changes due to urbanization. Civil Eng. Tec. Mat. 1976, 9, 11–15. (in Japanese). [Google Scholar]
- Takahashi, Y.; Izumi, K.; Ando, Y.; Kanao, K. Change of flood runoff in hilly basins by urbanization. Pro. Hyd. Conf. Jpn. Soc. Civil Eng. 1982, 26, 261–266. (in Japanese). [Google Scholar]
- Yamada, T.; Ishii, F.; Yamazaki, K.; Iwatani, K. On relation between distribution of field moisture capacity and runoff characteristics in small basins. Pro. Hyd. Conf. of Jpn. Soc. Civil Eng. 1985, 29, 25–30. (in Japanese). [Google Scholar]
- Kadoya, M. A review of the study on runoff changes due to urbanization. Doboku Gakkai Ronbunshu 1985, 363, 23–34. (in Japanese). [Google Scholar] [CrossRef] [PubMed]
- Takahashi, Y. City and water, Iwanami Shinsho: Tokyo, Japan, 1988, 1-34. (in Japanese)
- Amaguchi, H.; Kawamura, A.; Olsson, J.; Takasaki, T. Development and testing of a distributed urban storm runoff event model with a vector-based catchment. J. Hydrol. 2012, 420–421, 205–215. [Google Scholar] [CrossRef]
- Tamai, N. River Engineering, Ohmsha: Tokyo, Japan, 1999, 55-95. (in Japanese)
- Ishihara, S.; Takasaki, T.; Kawamura, A.; Amaguchi, H. Background of new development plan and future development methods of urban rivers in Tokyo metropolis. Advances in River Eng. 2014, 20, 437–442. (in Japanese). [Google Scholar]
- Kanae, S. Characteristics of localized torrential rainfall (so-called guerrilla rainfall). J. of hydrol. Syst. 2009, 73, 11–16. (in Japanese). [Google Scholar]
- Nakakita, E.; Yamaguchi, K.; Yamabe, H. A study on detecting origin of localized torrential rainfall using volume scanning radar. DPRI Annuals 2008, 52, 547–562. (in Japanese). [Google Scholar]
- Ushiyama, M. A study of relationship between “Guerilla Heavy Rainfall” and disaster. J. Jpn Soc. Civil Eng. Ser.B1 (Hyd. Eng.) 2011, 67, I_505–I_510. (in Japanese). [Google Scholar] [CrossRef]
- Fujibe, F.; Togawa, H.; Sakata, M. Long-term change and spatial anomaly of warm season afternoon precipitation in Tokyo. SOLA, 2009, 5, 17–20. [Google Scholar] [CrossRef]
- Seino, N.; Aoyagi, T.; Tsuguti, H. Numerical Simulation of Urban Impact on Precipitation in Tokyo: How does Urban Temperature Rise Affect Precipitation? Urban Clim. 2018, 23, 8–35. [Google Scholar] [CrossRef]
- Kawamura, A. Urban flooding and its countermeasures, Urban Technology (Revised Edition). Edited by Graduate School of Urban Infrastructure and Environment, Tokyo Metropolitan University, Gihodo Pub. 2016, 235-249. (in Japanese)
- Singh, V.P. Watershed modeling. In Computer Models of Watershed Hydrology, Singh, V.P. Water Res. Pub.: Colorado, USA, 1995, 1-22.
- 16. JSCE Committee on Hydroscience and Hydraulic Engineering. Hydroscience Formulary. JSCE: Tokyo, Japan, 1999, 35-47. (in Japanese)
- Sugawara, M. Rainfall-runoff analysis. Kyoritsu pub: Tokyo, Japan, 1972, 257. (in Japanese)
- Kimura, T. Storage function model (1), Civil Eng. J., Public works research center: Tokyo, Japan, 1961, 3, 36–43. (in Japanese). [Google Scholar]
- Kawamura, A. Inverse problems in hydrology. In Introduction to Inverse Problems in Civil Engineering, Jpn. Soc. Civil Eng., Maruzen: Tokyo, Japan, 2000, 24-30. (in Japanese)
- Hino, M. What have hydrologists done and what should we do? What should we do from now on? J. Jpn Soc. Hydrol. Water Res. 1996, 9, 3–16. (in Japanese). [Google Scholar]
- Tanouchi, H.; Olsson, J.; Lindstrom, G.; Kawamura, A.; Amaguchi, H. Improving urban runoff contributions in multi-basin hydrological simulation by the HYPE model using EEA Urban Atlas. Hydrology, 2019, 6. [Google Scholar] [CrossRef]
- Baba, H.; Hoshi, K.; Hashimoto, N. Synthetic storage routing model coped with loss mechanisms, Pro. Hyd. Conf. Jpn. Soc. Civil Eng. 1999, 43, 1085–1090. (in Japanese). [Google Scholar]
- Takasaki, T.; Kawamura, A.; Amaguchi, H. ; Araki, K; Storage function model considering urban runoff process. Doboku Gakkai Ronbunshuu B. 2009, 65, 3, 217-230. (in Japanese)
- Shiiba, M.; Tachikawa, Y. ; IchikawaY. Hydrology and Hydraulic engineering planning studies. Kyoto University Press, 2013, 3-51.
- Hanaki, T.; Suharyanto, A.; Sugio, S. Investigation of flood control by rainwater infiltration facilities in urbanized watershed, Pro. Hyd. Conf. of Jpn. Soc. Civil Eng. 1999, 48, 37–42. (in Japanese). [Google Scholar]
- Jia, Y.; Ni, G.; Kinouchi, T.; Yoshitani, J.; Kawahara, Y.; Suetsugi, T. Study on effects of storm-water detention facilities in an urbanized watershed using distributed model. Jpn. Soc. Civil Eng. Hyd. Conf. 2001, 45, 109–114. (in Japanese). [Google Scholar] [CrossRef]
- Amaguchi, H.; Kawamura, A. A proposal of urban runoff model considering green infrastructures and its application. J. Jan. Soc. Civil Eng., Ser.G (Environ. Res.) 2020, 76, I_319–I_325. (in Japanese). [Google Scholar] [CrossRef]
- Sayama, T.; Ozawa, G.; Kawakami, T.; Nabesaka, S.; Fukami, K. Rainfall-runoff-inundation analysis of the 2010 Pakistan flood in the Kabul River basin. Hydrol. Sci. J. 2012, 57, 298–312. [Google Scholar] [CrossRef]
- Public Works Research Institute. RRI model. http://www.icharm.pwri.go.jp/research/rri/rri_top.html. (accessed on 18 November 2022).
- Beven, K.J.; Kirkby, M.J. A physically based variable contributing area model of basin hydrology. Hydrol. Sci. Bulletin 1979, 24, 43–69. [Google Scholar] [CrossRef]
- Zhoa, R.J. The Xinanjiang model applied in China. J. Hydrol. 1992, 135, 371–381. [Google Scholar]
- Ren, L.; Yuan, F. The Xinanjiang model on a digital basin platform. In Watershed Models, Singh, V.P.; Frevert. D.K. CRC Press: Boca Raton, USA, 2006; pp. 179–208. [Google Scholar]
- Bathurst, J.C.; Wicks, J.M.; O'Connell, P.E. The SHE/SHESED basin scale water flow and sediment transport modelling system. In Computer Models of Watershed Hydrology, Singh, V.P.; Water Res. Pub.: Colorado, USA, 1995; pp. 563–594. [Google Scholar]
- Calver, A.; Wood, W.L. The Institute of Hydrology Distributed Model. In Computer Models of Watershed Hydrology, Singh, V.P.; Water Res. Pub.: Colorado, USA, 1995; pp. 595–626. [Google Scholar]
- Bergström, S. The HBV Model. In Computer Models of Watershed Hydrology, Singh, V.P.; Water Res. Pub.: Colorado, USA, 1995; pp. 443–476. [Google Scholar]
- Lindström, G.; Pers, C.P.; Rosberg, R.; Strömqvist, J.; Arheimer, B. Development and test of the HYPE (Hydrological Predictions for the Environment) model - A water quality model for different spatial scales. Hydrol. Res. 2010, 41, 295–319. [Google Scholar] [CrossRef]
- SMHI, HYPE. Available online: https://www.smhi.se/en/research/research-departments/hydrology/hype-1.7994. (accessed on 18 November 2022).
- Koga, T.; Kawamura, A.; Amaguchi, H. Study on permeable area ratio of 10m-mesh land use classification using advanced GIS delineation in the upper Kanda River basin. J. of Jan. Soc. Civil Eng., Ser.B1 (Hyd. Eng.) 2012, 68, I_505–I_510. (in Japanese). [Google Scholar]
- Amaguchi, H.; Kawamura, A.; Takasaki, T. Physically based distributed flood runoff model for an urban catchment using polygon feature GIS data. Doboku Gakkai Ronbunshuu B 2007, 63, 206–223. (in Japanese). [Google Scholar] [CrossRef]
- Koga, T.; Kawamura, A.; Amaguchi, H.; Tanouchi, H. Assessing impervious area ratios of grid-based land-use classifications on an example of an urban watershed. Hydrol. Sci. J. 2016, 61, 1728–1739. [Google Scholar] [CrossRef]
- Sample, D. J.; Heaney, J.P.; Wright, L.; Koustas, R. Geographic information systems, decision support systems, and urban storm-water management, J. Water Plan. Man. 2001, 3, 155–161. [Google Scholar] [CrossRef]
- Rodriguez, F.; Andrieu, H.; Creutin, J.D. Surface runoff in urban catchments: morphological identification of unit hydrographs from urban databanks. J. of Hydrol. 2003, 283, 146–168. [Google Scholar] [CrossRef]
- Lee, J.G.; Nietch, C.T.; Panguluri, S. Drainage area characterization for evaluating green infrastructure using the storm water management model. Hydrol. Earth Syst. Sci. 2018, 22, 2615–2635. [Google Scholar] [CrossRef]
- Japan Society of Hydrology and Water Resources. Handbook of Hydrology and Water Resources; Asakura: Tokyo, Japan, 1997; p. 636. (in Japanese) [Google Scholar]
- JSCE Committee on Hydroscience and Hydraulic Engineering. Hydroscience Formulary, 1985 ed.; JSCE: Tokyo, Japan, 1985; p. 713. (in Japanese) [Google Scholar]
- JSCE Committee on Hydroscience and Hydraulic Engineering. Hydroscience Formulary, 1971 ed.; JSCE: Tokyo, Japan, 1971; p. 616. (in Japanese) [Google Scholar]
- JSCE Committee on Hydroscience and Hydraulic Engineering. Hydroscience Formulary, 1963 ed.; JSCE: Tokyo, Japan, 1963; p. 603. (in Japanese) [Google Scholar]
- Morita, S. Urban flood risk analysis. Forum 2014, 8, 3–75. (in Japanese). [Google Scholar]
- Matsubayashi, U. Runoff mechanism and characteristics in urban areas. Handbook of hydrology and water resources, J. Jpn Soc. Hydrol. Water Res. Asakura: Tokyo, Japan, 1997, 146-148. (in Japanese)
- Ishikawa, K.; Sato, K.; Izumi, K. Applicability of rational method to the urbanized channels in Tokyo. Pro. Hyd. Conf. of Jpn. Soc. Civil Eng. 1982, 26, 267–272. (in Japanese). [Google Scholar]
- Kadoya, M.; Fukushima, A. Concentration time of flood in small or medium river basin. DPRI Annuals 1976, 19B, 143–152. (in Japanese). [Google Scholar]
- Tanioka, Y.; Fukuoka, S.; Taniguchi, M.; Koyama, Y. Characteristics of floods in small urban rivers. Doboku Gakkai Ronbunshu 1998, 586, 1–12. (in Japanese). [Google Scholar] [CrossRef] [PubMed]
- Watanabe, A.; Sasada, T.; Watanabe, N.; Yamada, T. Theoretical derivation of synthesized rational formula. J. Jan. Soc. Civil Eng., Ser.B1 (Hyd. Eng.) 2012, 74, I_973–I_978. (in Japanese). [Google Scholar]
- Hashimoto, T.; Hasegawa, T. A runoff model to evaluate land use change. Civil Eng. J. 1977, 19, 221–226. (in Japanese). [Google Scholar]
- Yamaguchi, T.; Matsubara, S.; Yamamori, T. Second report of rainfall-runoff study in an urban area -Runoff estimation by modified R.R.L. method. Civil Eng. J. 1972, 14, 34–39. (in Japanese). [Google Scholar]
- Matsubayashi, U. Runoff model for urban watersheds. Handbook of hydrology and water resources. J. Jpn Soc. Hydrol. Water Res. 1997, 148-151. (in Japanese)
- Sukegawa, N.; Kitagawa, Y. A rainfall-runoff simulation model for assessing the effect of urbanization on flood runoff. Pro. of Jan. Soc. of Civil Eng. 1982, 325, 51–59. (in Japanese). [Google Scholar] [CrossRef]
- Iwagaki, Y.; Sueishi, T. On the unsteady flow in open channels with uniform lateral inflow – Hydraulic studies on the run-off phenomena or rain water, 1st report. Doboku Gakkai Ronbunshu 1954, 39, 575–583. (in Japanese). [Google Scholar]
- Sueishi, T. On the run-off analysis by the method of characteristics hydraulic studies on the run-off phenomena of rain water, 2nd report. Doboku Gakkai Ronbunshu 1955, 29, 74–87. (in Japanese). [Google Scholar] [CrossRef]
- 60. Lighthill MJ, Whitham GB. 1955. On kinematic waves: 1. Flood movement in long rivers. Pro. of Royal Soc. 1955, Series A 229: 281-316.
- Singh, V.P. ; Jain. S.K. Rainfall-Runoff Modeling. In Handbook of Applied Hydrology, Second Edition, Singh VP (ed.). Chap. 59, McGraw-Hill Educ.: New York, US, 2017, 59-1-59-8.
- Kimura, M.; Tanaka, T.; Azechi, I.; Nakatani, K.; Yamazaki, D. , Yoshioka, H. Interdisciplinary perspective of surface water flow numerical analysis, J. Jpn Soc. Hydrol. Water Res. 2017, 30, 307–334. (in Japanese). [Google Scholar] [CrossRef]
- Ando, Y.; Nabeyama, T.; Nishijima, S. Flood runoff analysis of urban watersheds. J. Urban Res. 1991, 41, 69–89. (in Japanese). [Google Scholar]
- Fujimura, K.; Ando, Y.; Maeda, M. A study on stormwater runoff model of urban lowland basin. Pro. Hyd. Conf. of Jpn. Soc. Civil Eng. 1995, 39, 61–66. (in Japanese). [Google Scholar] [CrossRef]
- Suzuki, T.; Terakawa, Y.; Matsuura, T. Development of physics-based distributed model for operational hydrological forecasting. Civil Eng. J. 1996, 38, 26–31. (in Japanese). [Google Scholar]
- Shahzad, A.; Gabriel, H.F.; Haider, S.; Mubeen, A.; Siddiqui, M. J. Development of a flood forecasting system using IFAS: a case study of scarcely gauged Jhelum and Chenab river basins. Arab J. Geosci. 2018, 11, 383. [Google Scholar] [CrossRef]
- Chikamori, H.; Oka, T.; Takara, K.; Okubo, G. Fundamental Study on Application of Geographic Information System to Construction of Rainfall-Runoff Model of Urbanized Area, DPRI Annuals 1997 B 40(B-2), 137-144. (in Japanese).
- Ministry of Land, Infrastructure, Transport and Tourism. In Investigation guidelines for river sand and gravel management technology standards, Research Edition. Chap. 3, Ministry of Land, Infrastructure, Transport and Tourism, Tokyo, 2016.
- Kawamura, A. Status quo and perspectives of flood runoff analysis for urban watersheds, J. Jpn Soc. Hydrol. Water Res. 2018, 31, 451–466. (in Japanese). [Google Scholar] [CrossRef]
- Shibuo, Y.; Furumai, H. Advances in Urban Stormwater Management in Japan: A Review. J. Disaster Res. 2021, 16, 310–320. [Google Scholar] [CrossRef]
- Water Management and Land Conservation Bureau. https://www5.river.go.jp/, (accessed on 27 Mar. 2023.
- Water Management and Land Conservation Bureau. River disaster prevention information, https://city.river.go.jp/kawabou/reference/index01.html, (accessed on 27 Mar. 2023.
- Japan Meteorological Agency. “Automated Meteorological Data Acquisition System 2020,” https://www.jma.go.jp/jma/en/Activities/amedas/amedas.html (accessed on 10 Nov. 2022.
- Ministry of Land, Infrastructure, Transport and Tourism. X-band MP Radar Network, Available online:. Available online: http://mp-radar.bosai.go.jp/mlit.htm, (accessed on 18 Nov. 18 2022).
- Schilling, W. Rainfall data for urban hydrology: what do we need? Atmospheric Research 1991, 27, 5–21. [Google Scholar] [CrossRef]
- Fabry, F.; Bellon, A.; Duncan, M. R.; Austin, G. L. High resolution rainfall measurements by radar for very small basins: the sampling problem reexamined. J. Hydro. 1994, 161, 415–428. [Google Scholar] [CrossRef]
- Koyama, N.; Sakai, M.; Yamada, T. Study on a Water-Level-Forecast Method Based on a Time Series Analysis of Urban River Basins—A Case Study of Shibuya River Basin in Tokyo. Water 2023, 15, 161. [Google Scholar] [CrossRef]
- Tokyo Metropolitan Government. - Flood Control Integrated Information System, Available online:. Available online: https://www.kasen-suibo.metro.tokyo.lg.jp/im/uryosuii/tsim0102g_en.html (accessed on 10 November 2022).
- Shiiba, M.; Tachikawa, Y.; IchikawaY. Hydrology and Hydraulic engineering planning studies. Kyoto University Press 2013, 3–51. [Google Scholar]
- JSCE Committee on Hydroscience and Hydraulic Engineering, Hydroscience Formulary, 1985 Edition, JSCE: Tokyo, Japan. 1985, 151-172. (in Japanese)
- Kadoya, M.; Nagai, A. Runoff analysis methods (Part 10) Storage method - flood runoff analysis by the storage function model -. J. of Jpn. Soc. of Agric. Civil Eng. 1980, 48, 43–50. [Google Scholar]
- Holmes, RRJr. Streamflow Ratings. In Handbook of Applied Hydrology, Second Edition, Singh VP (ed.). Chap. 6, McGraw-Hill Education: New York, USA, 2017, 6-1-6-14.
- Prasad, R. A nonlinear hydrologic system response model. J. Hyd. Div. 1967, 93, 201–222. [Google Scholar] [CrossRef]
- Hoshi, K.; Yamaoka, T. A relationship between kinematic wave and storage routing models. Pro. Hyd. Conf. of Jpn. Soc. Civil Eng. 1982, 26, 273–278. (in Japanese). [Google Scholar]
- Padiyedath, S.G.; Kawamura, A.; Amaguchi, H.; Azhikodan, G. Baseflow esti-mation for tropical wet and dry climate region using recursive digital filters. J. Jan. Soc. Civil Eng., Ser.G (Environ. Res.) 2017, 73, 9–16. [Google Scholar]
- Hoshi, K.; Baba, H.; Hashimoto, A. Development of a storage function method for tracking floods in watershed and channel systems. Advances in River Eng. 2000, 6, 297–302. (in Japanese). [Google Scholar]
- Takasao, T.; Takara, K. Evaluation of rainfall-runoff models from the stochastic viewpoint. J. Hydrol. 1988, 102, 381–406. [Google Scholar] [CrossRef]
- Takasaki, T.; Kawamura, A.; Amaguchi, H. Development of the storage function model for urban flood considering the outflow through combined wewer system. J. Jpn Soc. Hydrol. Water Res. 2008, 21, 228–241. (in Japanese). [Google Scholar] [CrossRef]
- Ministry of Land, Infrastructure, Transport and Tourism. History of the sewerage system, https://www.mlit.go.jp/crd/city/sewerage/data/basic/rekisi.html (accessed on 31 Jan 2023). (in Japanese)
- Padiyedath, S.G.; Kawamura, A.; Takasaki, T.; Amaguchi, H.; Azhikodan, G. An effective storage function model for an urban watershed in terms of hydrograph reproducibility and Akaike information criterion. J. Hydrol. 2018, 563, 657–668. [Google Scholar] [CrossRef]
- Kawamura, A.; Marabtene, T. Evolutionary computing: Genetic algorithms. In Handbook of applied hydrology, 2nd ed,; Singh, V.P., Ed.; McGraw-Hill Education: New York, USA, 2017; pp. 13-1–13-4. [Google Scholar]
- Duan, Q.; Sorooshian, S.; Gupta, V.K. Optimal use of the SCE-UA global optimization method for calibrating watershed models. J. Hydro. 1994, 158, 265–284. [Google Scholar] [CrossRef]
- Tanakamaru, H. Parameter estimation for the tank model using global optimization, Drainage and Reclamation Eng. 1995, 178, 503-512. 178.
- Matsubara, T.; Tsuchida, K.; Hibiya, M. Study on parameter identification of distributed runoffmodel using SCE-UA method. J. Jan. Soc. Civil Eng., Ser.B1 (Hyd. Eng.) 2015, 71, I_265–I_270. (in Japanese). [Google Scholar]
- Akaike, H. Likelihood of a model and information criteria. J. Econom., 1981, 16, 3–14. [Google Scholar] [CrossRef]
- Padiyedath, S.G.; Kawamura, A.; Takasaki, T.; Amaguchi, H.; Azhikodan, G. A bootstrap approach for the parameter uncertainty of an urban-specific rainfall runoff model. J. Hydrol. 2019, 579, 1–18. [Google Scholar] [CrossRef]
- Padiyedath, S.G.; Kawamura, A.; Takasaki, T.; Amaguchi, H.; Azhikodan, G. A generalized urban storage function model considering spatial rainfall distribution. J. Jan. Soc. Civil Eng., Ser.B1 (Hyd. Eng.) 2019, 75, I_223-I_228. [Google Scholar] [CrossRef] [PubMed]
- Padiyedath, S.G.; Kawamura, A.; Amaguchi, H.; Takasaki, T. and Azhikodan G. A generalized storage function model for the water level estimation using rating curve relationship. Water Res. Man. 2020, 34, 2603–2619. [Google Scholar]
- Takasaki, T.; Kawamura, A.; Amaguchi, H.; Ishihara, S. Real-time runoff forecasting characteristics of urban storage function model using particle filter. J. Jan. Soc. Civil Eng., Ser.B1 (Hyd. Eng.) 2012, 68, I_511–I_516. (in Japanese). [Google Scholar]
- Takasaki, T.; Kawamura, A.; Amaguchi, H.; Ishihara, S. Real-time runoff forecasting characteristics of Urban Storage Function Model using Kalman filter. J. Jan. Soc. Civil Eng., Ser.B1 (Hyd. Eng.) 2013, 69, I_457–I_480. (in Japanese). [Google Scholar]
- Yonese, Y.; Kawamura, A.; Tonotsuka, A.; Amaguchi, H. Runoff characteristics using XRAIN in a small urban watershed. J. Jan. Soc. Civil Eng., Ser.B1 (Hyd. Eng.) 2018, 74, I_97–I_102. (in Japanese). [Google Scholar]
- Yonese, Y.; Kawamura, A.; Amaguchi, H.; Tonotsuka, A. Precision evaluation of X-band MP radar rainfall in a small urban watershed by comparison to 1-minute ground observation rainfall data. J. Jan. Soc. Civil Eng., Ser.B1 (Hyd. Eng.) 2016, 72, I_217–I_222. (in Japanese). [Google Scholar]
- Yonese, Y.; Kawamura, A.; Amaguchi, H.; Tonotsuka, A. Study on the precision of 1-minute X-band MP radar rainfall data in a small urban watershed. Int. J. Sustainable Dev. and Planning 2018, 13, 614–625. [Google Scholar] [CrossRef]
- Yonese, Y.; Kawamura, A.; Amaguchi, H.; Tonotsuka, A. Spatiotemporal characteristic analysis of X-band MP radar rainfall in a small urban watershed on the movement of rainfall area. J. Jan. Soc. Civil Eng., Ser.B1 (Hyd. Eng.) 2017, 73, I_217–I_222. (in Japanese). [Google Scholar]
- Tonotsuka, A.; Kawamura, A.; Yonese, Y.; Amaguchi, H. Spatiotemporal correlation characteristics of X-band MP radar rainfall in a small urban watershed focused on torrential rainfall events at each ground observation point. J. Jan. Soc. Civil Eng., Ser.G (Environ. Res.), 2017, 73, I_261–I_268. (in Japanese). [Google Scholar]
- Hitokoto, M.; Sakuraba, M.; Sei, Y. Development of the real-time river stage prediction method using deep learning, J. Jan. Soc. Civil Eng., Ser.B1 (Hyd. Eng.) 2016, 72, I_187–I_192. (in Japanese). [Google Scholar] [CrossRef] [PubMed]
- Tamura, K.; Nanou, S.; Miura, S.; Yamawaki, M.; Kaneko, H. Application of deep learning to long-term prediction of dam inflow toward efficiency of the flood control operation. J. Jan. Soc. Civil Eng., Ser.B1 (Hyd. Eng.) 2018, 74, I_1327–I_1332. (in Japanese). [Google Scholar] [CrossRef] [PubMed]
- Hida, Y.; Chiha, H.; Asaoka, Y.; Nagabayashi, H. Real-time forecasting for water levels in sewer by machine learning and inundation simulation. J. Jan. Soc. Civil Eng., Ser.B1 (Hyd. Eng.) 2017, 73, I_649-I_654. [Google Scholar] [CrossRef] [PubMed]
- Fujizuka, S.; Kawamura, A.; Amaguchi, H.; Takasaki, T. Emulation of urban runoff model by deep learning for benchmark virtual hyeto and hydrograph. J. Jan. Soc. Civil Eng., Ser.G (Environ. Res.) 2019, 75, I_289–I_296. (in Japanese). [Google Scholar] [CrossRef] [PubMed]
- Fujizuka, S.; Kawamura, A.; Amaguchi, H.; Takasaki, T. Emulation performance evaluation of urban runoff model by neural network and deep learning. J. Jan. Soc. Civil Eng., Ser.B1 (Hyd. Eng.) 2019, 75, I_229–I_234. (in Japanese). [Google Scholar] [CrossRef] [PubMed]
- Fujizuka, S.; Kawamura, A.; Amaguchi, H.; Takasaki, T. Rainfall runoff benchmark test by deep learning model using urban medium and small river basin dataset. J. Jan. Soc. Civil Eng., Ser.B1 (Hyd. Eng.) 2020, 76, I_355–I_360. (in Japanese). [Google Scholar] [CrossRef]
- Hitokoto, M.; Sakuraba, M. Hybrid deep neural network and distributed rainfall-runoff model for the real-time river stage prediction. J. Jan. Soc. Civil Eng., Ser.B1 (Hyd. Eng.) 2017, 73, I_22–I_34. (in Japanese). [Google Scholar] [CrossRef]
- Iwasa, Y.; noue, K.; Mizutori, M. Hydraulic analysis of overland flood flows by means of numerical method, DPRI Annuals 1980, B, 23(B-2): 305-317 (in Japanese).
- Toda, K.; Inoue, K.; Murase, S.; Ichikawa, Y.; Yokoo, H. Inundation analysis due to heavy rainfall in urban area. Doboku Gakkai Ronbunshu 2000, 663, 1–10. (in Japanese). [Google Scholar] [CrossRef]
- Shibuo, Y.; Lee, S.; Sanuki, H.; Yoshimura, K.; Tajima, Y.; Sato, S.; Furumai, H. Development of couped river and sewer network model for improved water level prediction in urban rivers. J. Jan. Soc. Civil Eng., Ser.B1 (Hyd. Eng.) 2018, 74, I_1357–I_1362. (in Japanese). [Google Scholar]
- Rangari, V.A.; Umamahesh, N.V.; Bhatt, C.M. Assessment of inundation risk in urban floods using HEC RAS 2D. Mod. Earth Sys. and Env. 2019, 5, 1839–1851. [Google Scholar] [CrossRef]
- Mustafa A, Szydłowski M. Application of different building representation techniques in HEC-RAS 2-D for urban flood modeling using the Toce River experimental case. PeerJ. 2021, 2, 9:e11667. [Google Scholar]
- Rosenzweig, B.R.; Cantis, P.H.; Kim, Y.; Cohn, A.; Grove, K.; Brock, J.; Yesuf, P.; Mistry, P.; Welty, C. The value of urban flood modeling, Earth’s Future 2020, 9, e2020EF001739.
- Amaguchi, H.; Tsubaki, R. On the inundation prediction, present state and matters to be resolved. Advances in River Eng. 2015, 21, 425–430. (in Japanese). [Google Scholar]
- Miura, S.; Kawamura, I.; Kimura, I.; Miura, A. Study on inundation flow analysis method in densely populated urban area on alluvial fan. J. Jan. Soc. Civil Eng., Ser.B1 (Hyd. Eng.) 2011, 67, I_979–I_984. (in Japanese). [Google Scholar] [CrossRef] [PubMed]
- Nakamura, T.; Sasaki, Y.; Mizukusa, K. A guide of application for flood analysis models in the urban areas, Technical note of NILM 2004, No. 202.
- Inokawa, N.; Kobayashi, K. Analysis of flooding in underground space using 1m mesh elevation data and study of evacuation risk. J. Jan. Soc. Civil Eng., Ser.B1 (Hyd. Eng.) 2022, 78, I_1415–I_420. (in Japanese). [Google Scholar] [CrossRef]
- Kawaike, K.; Inoue, K.; Hayashi, H.; Toda, K. Development of inundation flow model in urban area. Doboku Gakkai Ronbunshu 2002, 698, 1–10. (in Japanese). [Google Scholar] [CrossRef]
- Fukuoka, S.; Kawashima, M.; Yokoyama, H.; Mizuguchi, M. The numerical simulation of flood-induced flows in urban residential area and the study of damage reduction. Doboku Gakkai Ronbunshu 1998, 600, 23–36. (in Japanese). [Google Scholar] [CrossRef]
- Akiyama, J.; Shigeeda, M.; Tanabe, T. Dynamic network model for free-surface-pressurized flows and its applicability to sewer network in the urban area. Advances in River Eng. 2008, 14, 425–430. (in Japanese). [Google Scholar]
- Akiyama, J.; Shigeeda, M.; Kozono, Y. Numerical model for rainfall-runoff and flood inundation processes and its application for Iizuka city. Pro. Hyd. Conf. of Jpn. Soc. Civil Eng. 2010, 54, 919–924. (in Japanese). [Google Scholar]
- Inoue, K.; Kawaike, K.; Hayashi, H. Inundation flow modeling in urban area. Pro. Hyd. Conf. of Jpn. Soc. Civil Eng. 1999, 43, 533–538. (in Japanese). [Google Scholar] [CrossRef]
- Sekine, M. Numerical analysis of inundation in the region of downtown Tokyo with residence area. J. Jan. Soc. Civil Eng., Ser.B1 (Hyd. Eng.) 2011, 67, 70–85. (in Japanese). [Google Scholar] [CrossRef]
- Sekine, M.; Kamata, T.; Hosono, Y.; Shibuya, Y. Inundation process in three cities of Musashino, Mitaka, and Chofu for the largest possible torrential rainfall. J. Jan. Soc. Civil Eng., Ser.B1 (Hyd. Eng.) 2022, 78, I_427–I_432. (in Japanese). [Google Scholar] [CrossRef] [PubMed]
- Araki, T.; Amaguchi, H.; Kawamura, A.; Takasaki, T. Development of a groundwater recharge model for an urban catchment using urban landscape GIS delineation and its simulation for actual catchment. J. of Jan. Soc. Civil Eng., Ser.B1 (Hyd. Eng.) 2012, 68, 109–124. (in Japanese). [Google Scholar]
- Tanouchi, H.; Amaguchi, H.; Kawamura, A.; Nakagawa, N. Development of an automated construction algorithm of advanced delineation GIS data using 1:2500 topological map. J. Jan. Soc. Civil Eng., Ser.B1 (Hyd. Eng.) 2013, 69, I_523–I_528. (in Japanese). [Google Scholar]
- Tanouchi, H.; Amaguchi, H.; Kawamura, A.; Nakagawa, N.; Koga, T. Study on an automated construction method of minute road segments aiming at urban storm runoff analysis. Theory and Applications of GIS 2014, 22, 25–34. (in Japanese). [Google Scholar] [CrossRef]
- Tanouchi, H.; Amaguchi, H.; Kawamura, A.; Koga, T.; Hagiwara, Y. Automated construction method of polygonal blocks for an urban watershed. J. Jpn Soc. Hydrol. Water Res. 2015, 26, 298–303. (in Japanese). [Google Scholar] [CrossRef]
- Amaguchi, H.; Nagasaka, T.; Kawamura, A.; Takasaki, T.; Nakagawa, N. A proposal of storm runoff model considering process of building inundation for an urban catchment. Advances in River Eng. 2013, 19, 211–216. (in Japanese). [Google Scholar]
- Amaguchi, H.; Kawamura, A. Development of a storm runoff model considering process of individual building inundation. Int. J. Safety and Security Eng. 2016, 6, 570–581. [Google Scholar] [CrossRef]
Figure 1.
Map of FCIS and AMeDAS stations in Tokyo Metropolis (top) and a zoomed-in map of FCIS stations and XRAIN grid in the upper Kanda River Watershed (bottom).
Figure 1.
Map of FCIS and AMeDAS stations in Tokyo Metropolis (top) and a zoomed-in map of FCIS stations and XRAIN grid in the upper Kanda River Watershed (bottom).
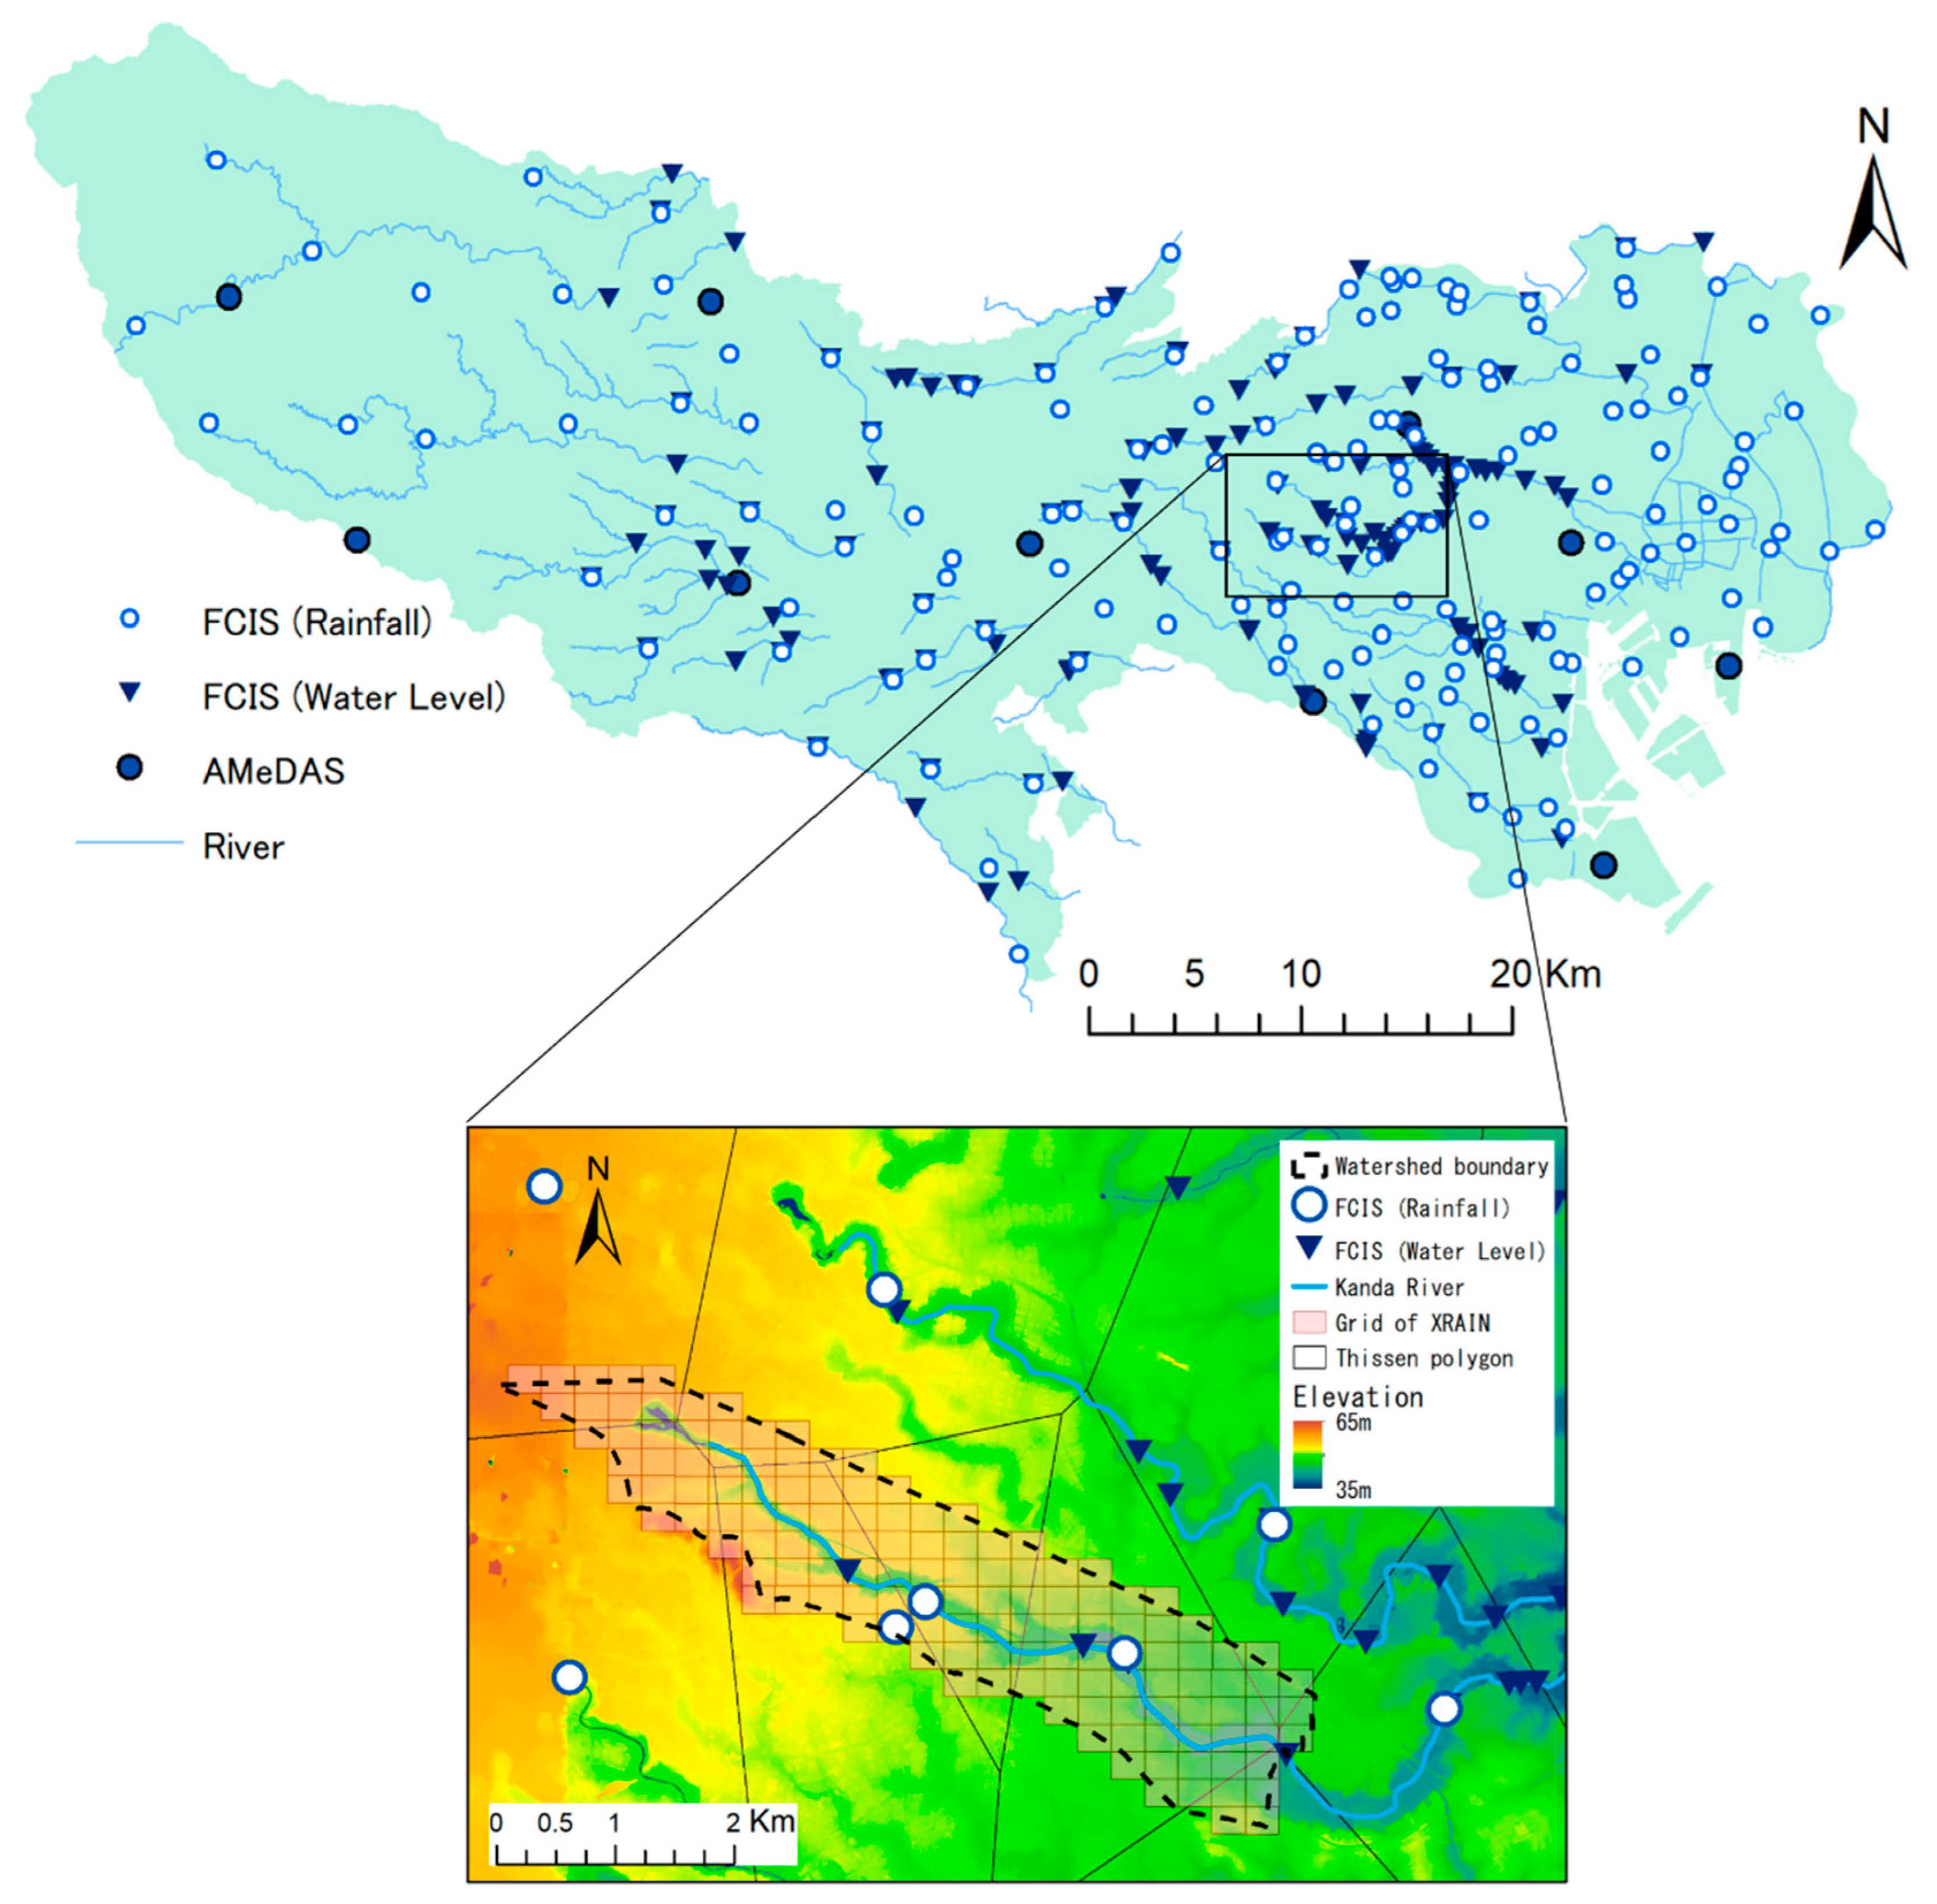
Figure 2.
Schematic diagram of all inflow and outflow components of an urban watershed with combined sewer system.
Figure 2.
Schematic diagram of all inflow and outflow components of an urban watershed with combined sewer system.
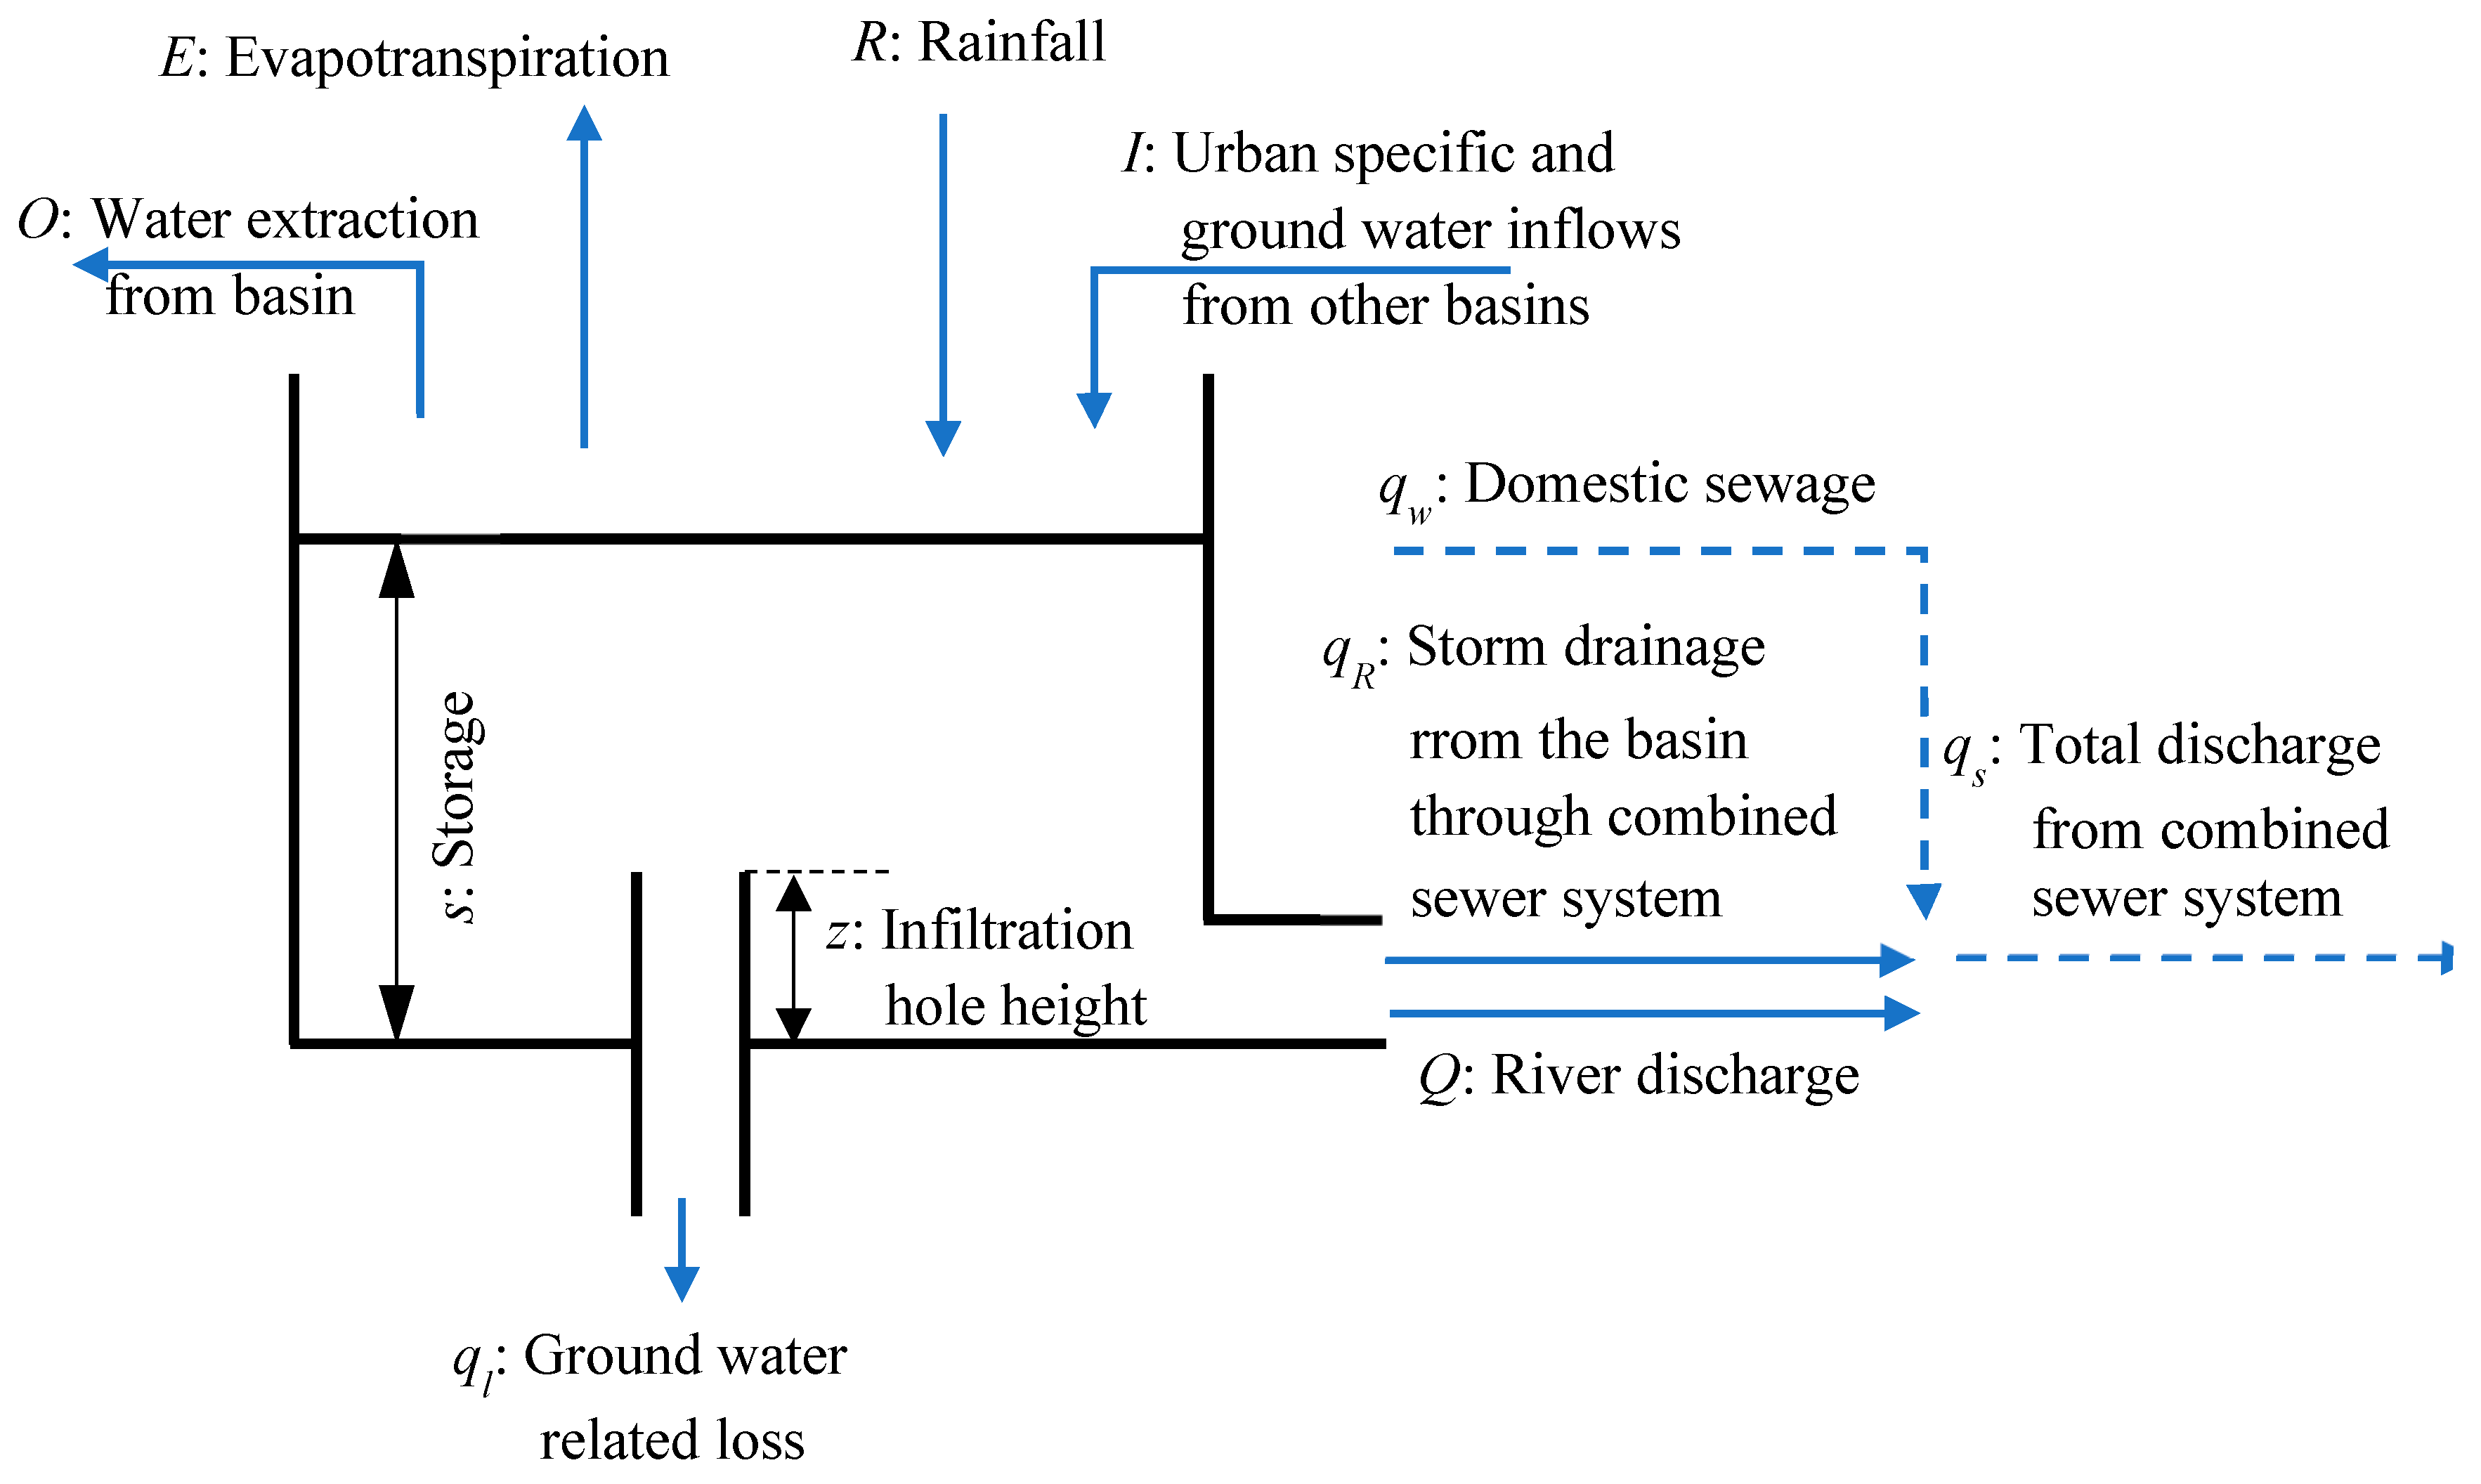
Figure 3.
Schematic of the rainfall-runoff process.
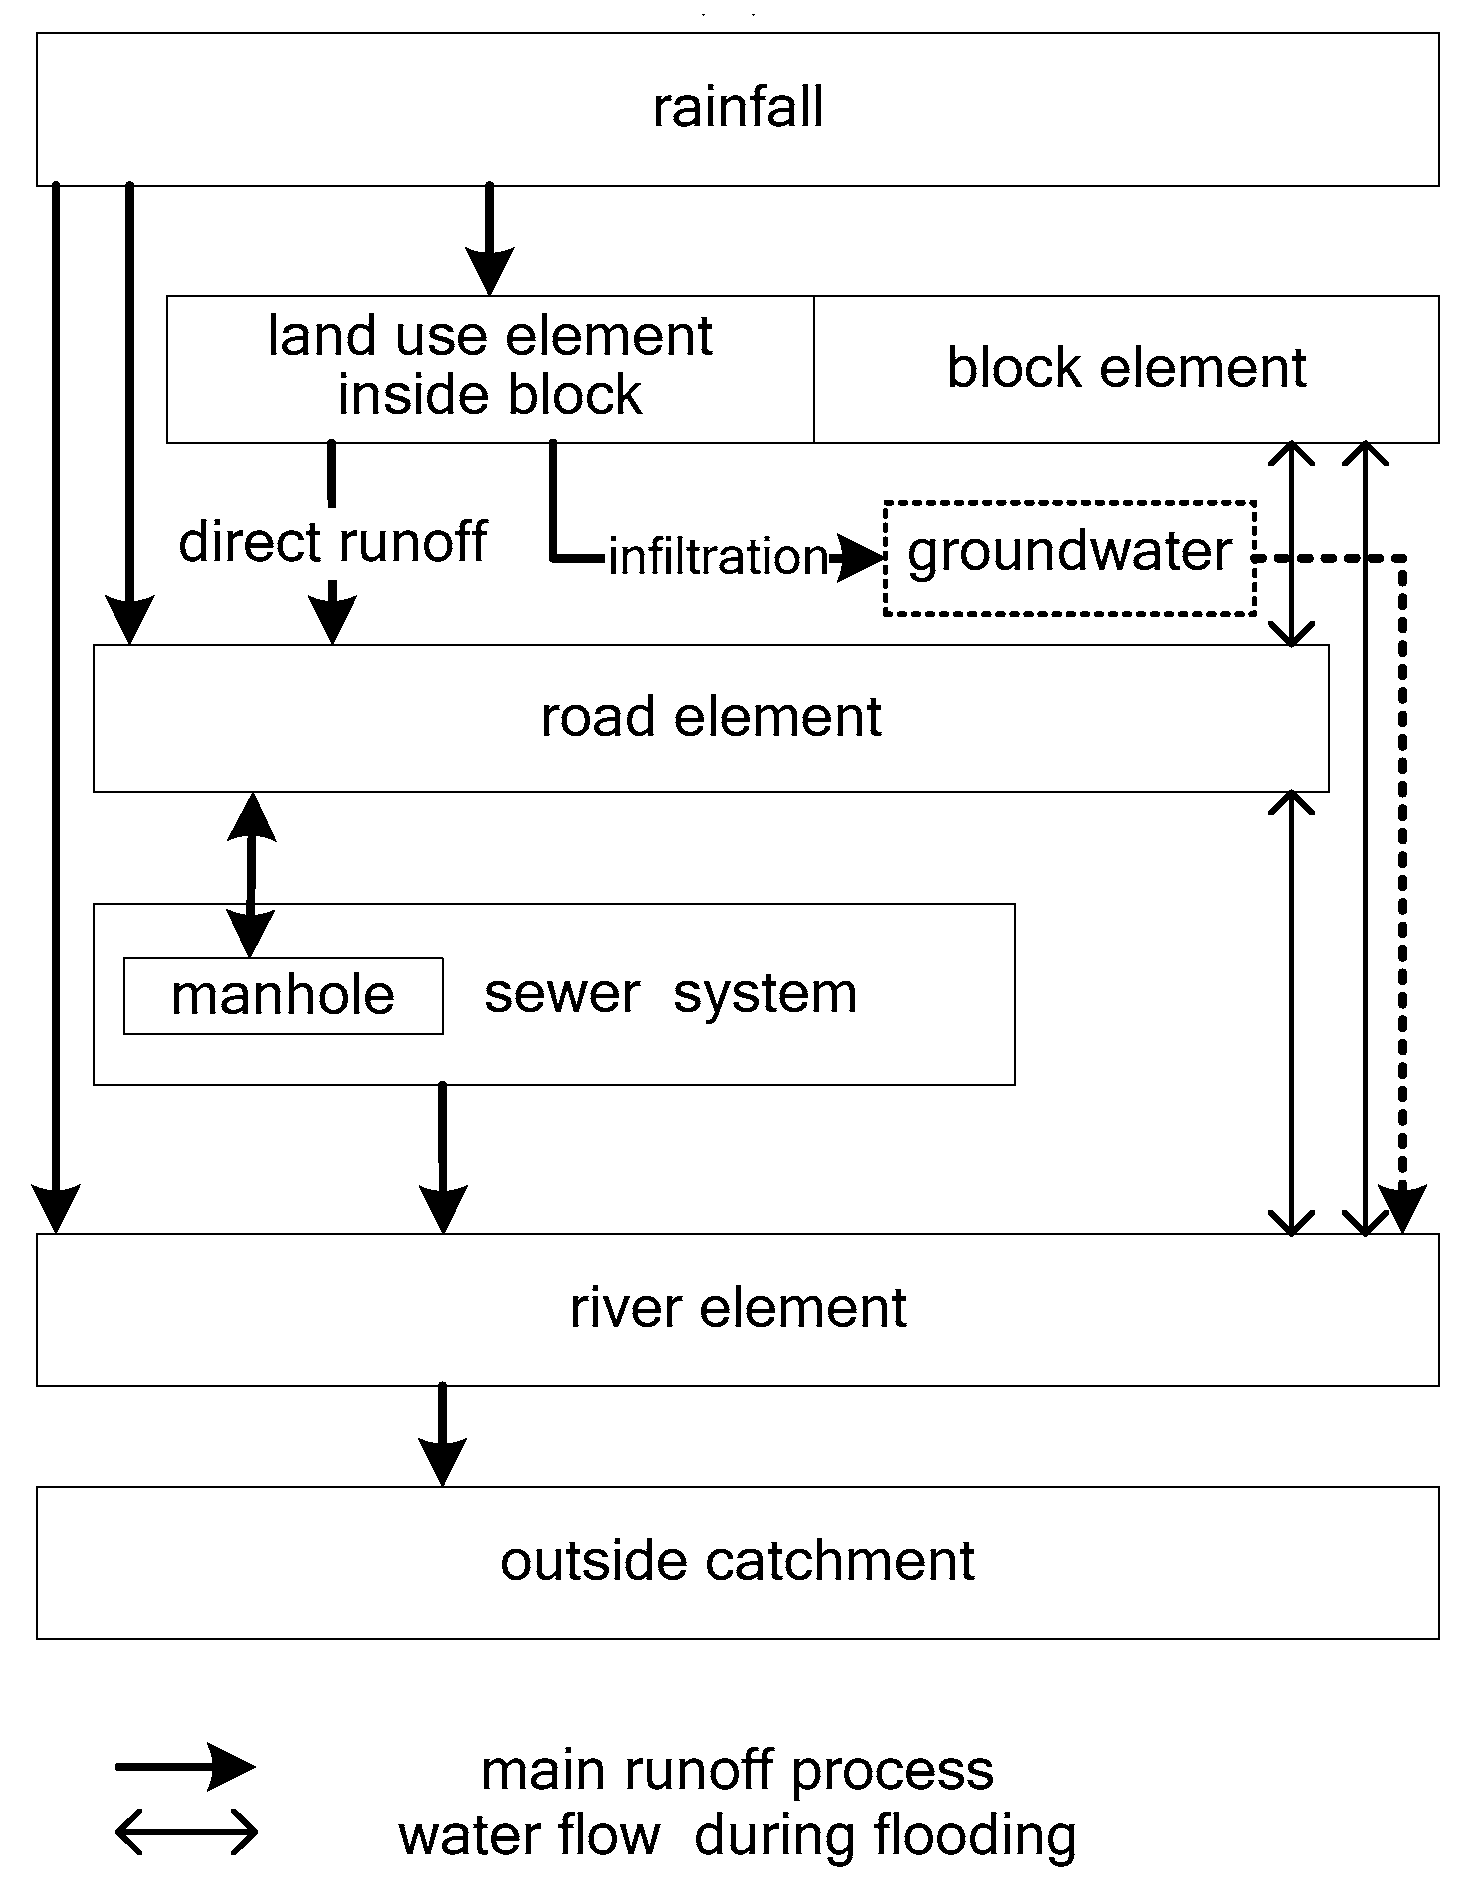
Figure 4.
Parameters used for building inundation.
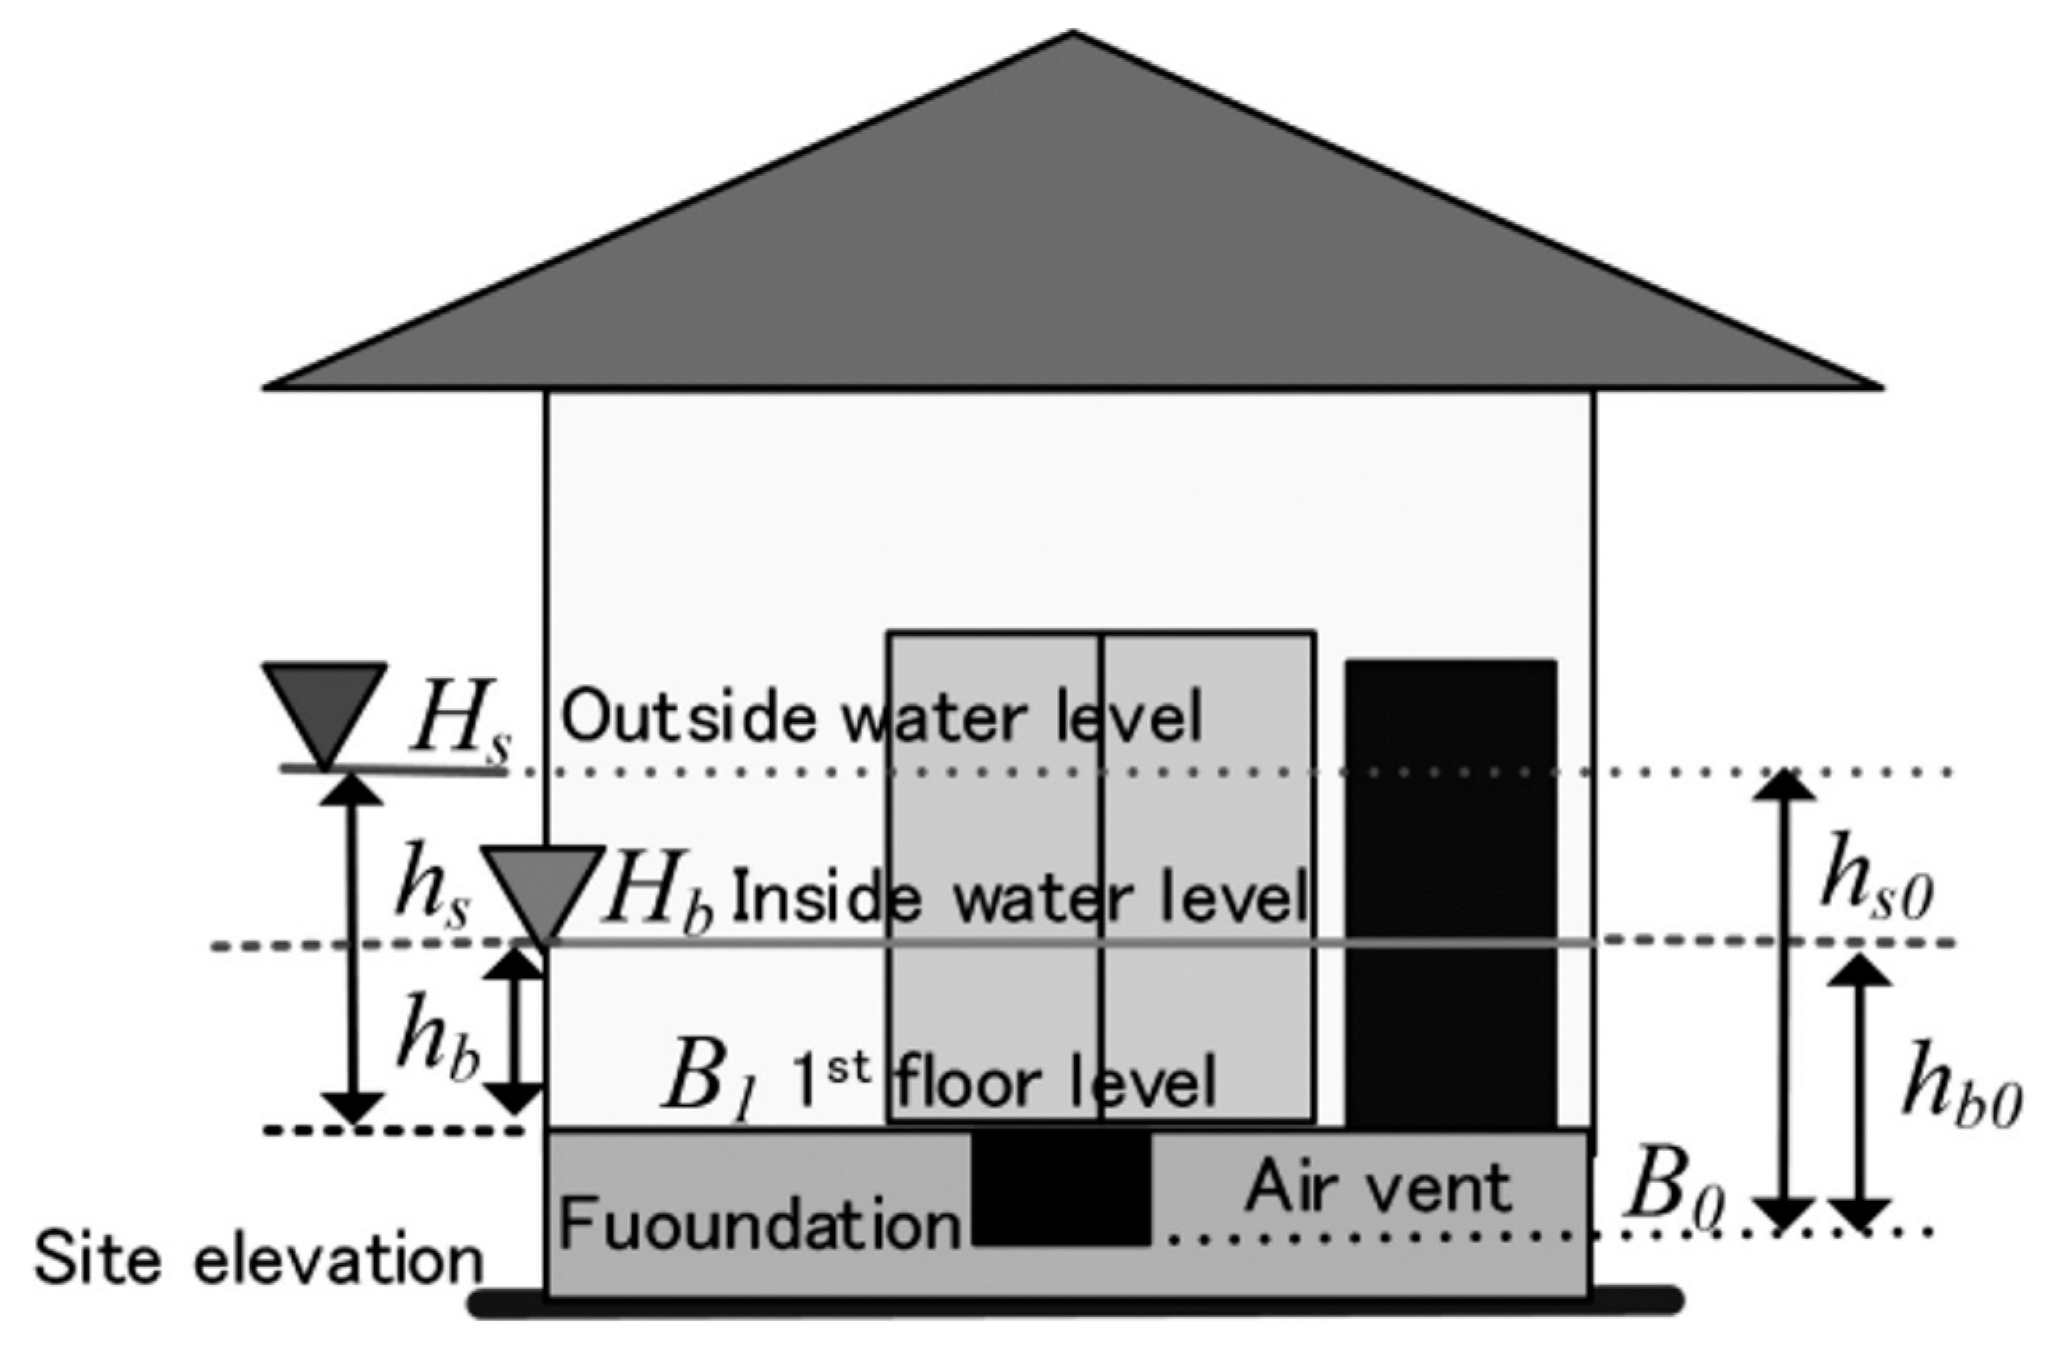
Figure 5.
Example of inundation analysis result in the upper Kanda River watershed.
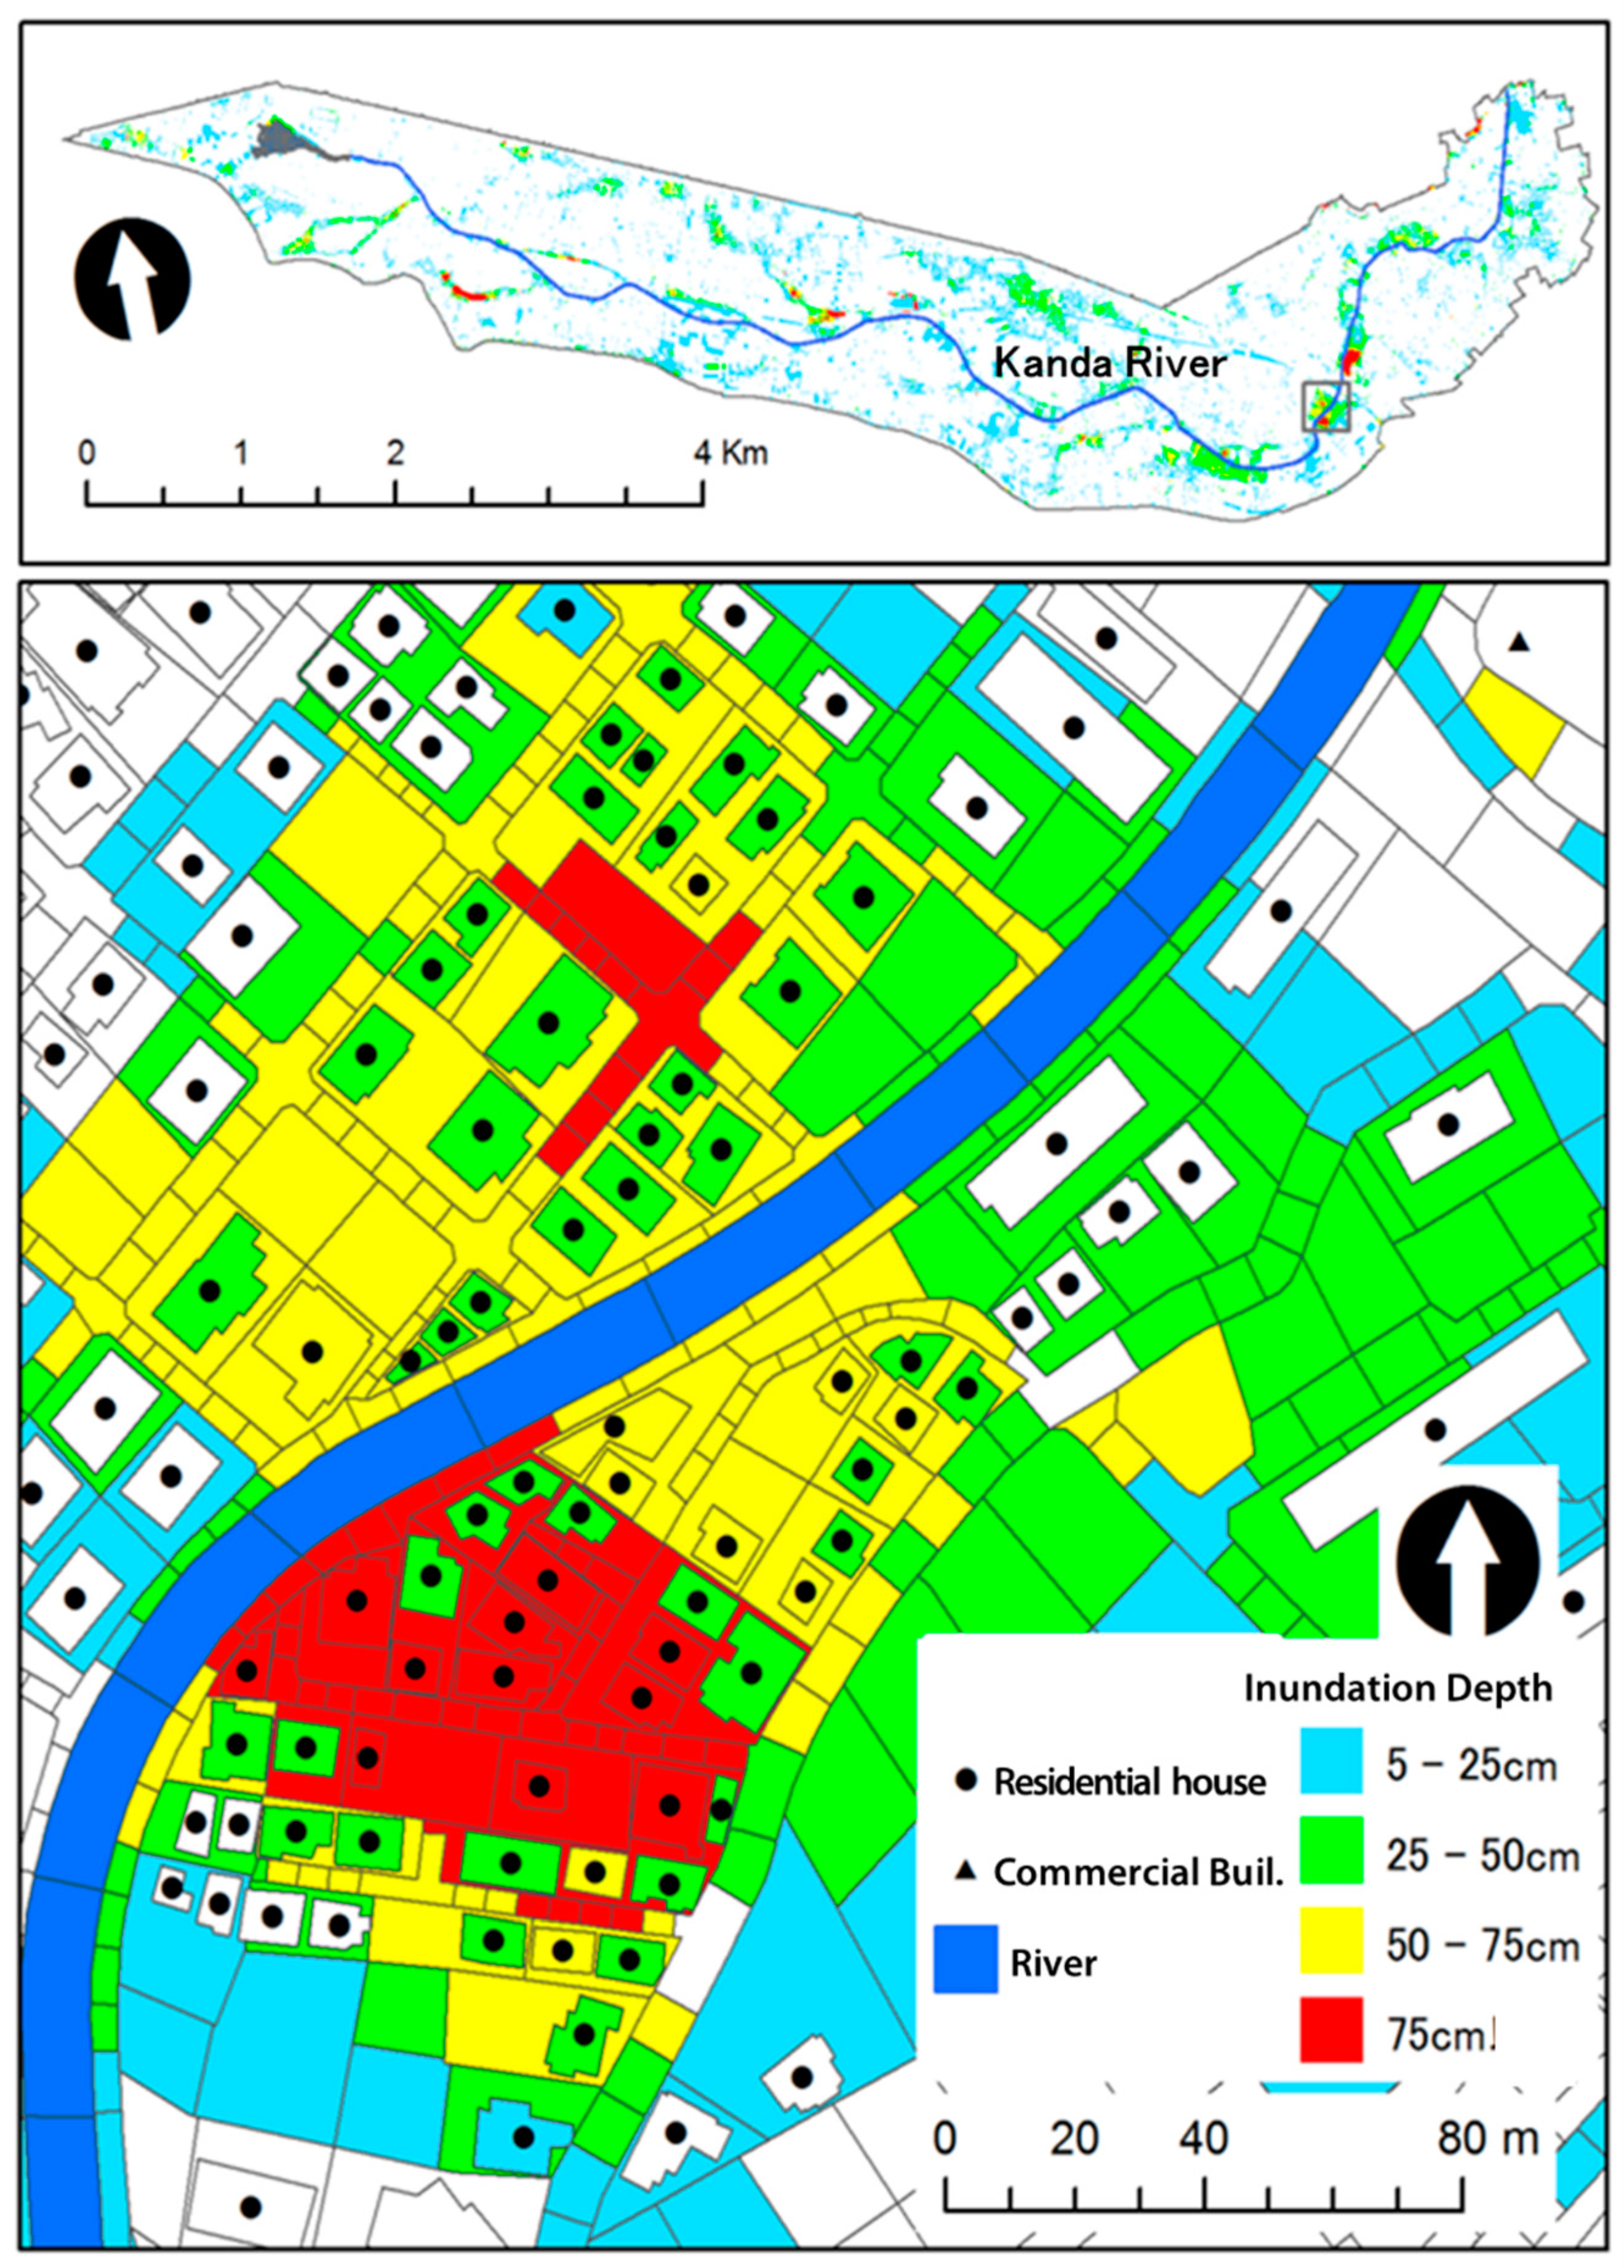

Table 1.
Storage function models with their associated continuity equations.
| (PAR represents a parameter) | |||
| No. | Models | Storage equation | Continuity equation |
| 1 | Linear (3-PAR) |
||
| 2 | Kimura (4-PAR) |
||
| 3 | Prasad (5-PAR) |
||
| 4 | Hoshi (6-PAR) |
||
| 5 | USF (7-PAR) |
||
Table 2.
Representations of urban structure in GIS.
| Geometry | Image |
Characteristics (a) Objective, (b) Features, (c) Landuse, (d) Handling of buildings, (e) Surface flow equations |
| Structured Grid [120,121,122] |
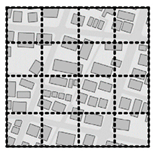 |
(a) Flood analysis. (b) Model data can be created and calculated efficiently. (c) Usually expressed as a percentage of impermeable area. If the resolution is sufficiently high below 10 m, land use information may be specified in the calculation grid. (d) The impact of building blockage effect is considered by building coverage ratio and conveyance reduction facters.If the resolution is fine enough, the height of the building may be set in the grid. (e) 2D diffusive wave model. |
| Curvilinear Grid [123,124] |
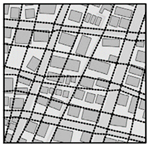 |
(a) Flood analysis. (b) Capable of creating grids suitable for urban structures along road. Ideally, the road network in the targeted catchment should be like a grid. If the road network is complex, model data preparation becomes more difficult. (c) Usually expressed as a percentage of impermeable area. (d) Resistance is calculated separately for bottom friction, resistance due to plane vortices behind the house and hydrodynamic forces on the buildings. (e) 2D diffusive wave model. |
| Unstructured Grid [125] |
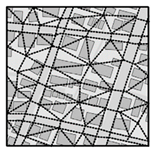 |
(a) Flood analysis. (b) Represents complex terrain and boundaries on fewer grids. Manual processing, requires GIS data and a mesh generation software. (c) Usually expressed as a percentage of impermeable area. If the resolution is fine (less than 20 m), a Digital Surface Model (DSM) may be set for the elevation of the residential block. (d) Buildings of the same scale as the computational grid are subjected to a boundary-fitting process, while smaller buildings are subjected to a spatial averaging process, with the object group as drag. (e) 2D full shallow-water equations. |
| Road Network [127,128] |
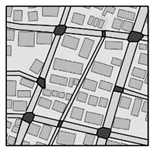 |
(a) Flood analysis. (b) Capability to represent complex road networks. The ground surface consists of roads and Residential grids. Relatively easy in a GIS enviironment. (c) Initially developed as a flood inundation model from rivers, rainfall-runoff processes and infiltration processes are not considered. Recently developed models set average building area percentages. (d) Roughness coefficients of large values are set against the flow between the road and the residentail block. (e) 1D Saint-Venant equations. |
| Urban Landscape Delineation [6] |
 |
(a) Flood runoff and inundation analysis. (b) Unlike other grids, polygon data is created for roads, buildings, permeable and impermeable ground, etc., classified according to permeability characteristics, with roads, for example, further divided into segments. It is possible to give detailed attributes to individually subdivided polygons (e.g. building structure, use, number of floors, presence of storage facilities, etc.). (c) Land use and grid geometry are consistent. (d) Parameters are set to take into account the building flooding process. (e) 1D Saint-Venant equations. |
Disclaimer/Publisher’s Note: The statements, opinions and data contained in all publications are solely those of the individual author(s) and contributor(s) and not of MDPI and/or the editor(s). MDPI and/or the editor(s) disclaim responsibility for any injury to people or property resulting from any ideas, methods, instructions or products referred to in the content. |
© 2023 by the authors. Licensee MDPI, Basel, Switzerland. This article is an open access article distributed under the terms and conditions of the Creative Commons Attribution (CC BY) license (http://creativecommons.org/licenses/by/4.0/).
Copyright: This open access article is published under a Creative Commons CC BY 4.0 license, which permit the free download, distribution, and reuse, provided that the author and preprint are cited in any reuse.


