
Submitted:
23 June 2023
Posted:
27 June 2023
You are already at the latest version
Abstract
Laminitis is considered as an important underlying cause of lameness diseases, yet its specific pathogenesis remains unclear. Autophagy is an intracellular degradation mechanism that controls recycling of membrane-associated integrin and may aid in the progression of metabolic diseases. But the significance of autophagy for initiation and development of laminitis is unknown. The present study aimed to explore autophagy activity in the laminar tissue of dairy cows with oligofructose-induced laminitis. Twelve healthy non-pregnant Holstein cows were randomly divided to 2 groups of 6 cows each, entitled the control group and the oligofructose overload group (OF group), respectively. At 0 h, cows in OF group were gavaged with oligofructose (17 g/kg BW) dissolved in warm deionized water (20 mL/kg BW) through oral rumen tube, and dairy cows in control group were gavaged with the same volume of deionized water by the same method. At -72 h before perfusion as well as 0 h, 6 h, 12 h, 18 h, 24 h, 36 h, 48 h, 60 h, and 72 h after perfusion, clinical evaluations in both groups were monitored. After 72 h, laminar tissues of dairy cows in both groups were collected to examine genes and proteins. We found the significantly higher (P<0.05) levels of mRNA ATG5, ATG12, and Becilin1, but P62 and mTOR were extensively lower (P<0.01) in the laminar tissue of the OF group than the control group. Protein expression level of Becilin-1 was higher significantly (P<0.05), and the protein expression level of LC3II was lower significantly (P<0.05) in OF group than control group. However, the expression of P62 reduced (P>0.05) non-significantly in OF group than control group. The distribution of Beclin1 protein in laminar tissue increased (P<0.01) significantly, and distribution of P62 protein decreased (P<0.05) significantly in OF group than control group. In conclusion, laminar tissue damage occurred during the onset of laminitis, which promoted the occurrence of autophagy, and confirmed that autophagy was involved in the regulation and pathogenesis of laminitis in dairy cows.
Keywords:
autophagy
; acute laminitis
; dairy cows
; laminar tissue
; oligofructose
1. Introduction
Laminitis, a sterile, diffuse, serous dermal inflammation, is one of the main causes of dairy cow lameness [1]. The prevalence of claw diseases contributes significantly to economic losses in the dairy sector [2]. Laminitis in cows is generally classified as clinical laminitis and subclinical laminitis (SCL), while clinical laminitis is classified as acute laminitis, subacute laminitis, and chronic laminitis (CL). SCL and CL have a significant negative impact on milk yield in dairy cows. SCL can result in bovine sole ulceration, sole bleeding, and white line disease [3]. If not detected and treated promptly, it can quickly progress to CL. Furthermore, cows with CL might damage structure of lamellae, consisting of two interdigital layers, epidermal and dermal lamellae [1]. The third phalanx (P3) is joined to the inside hooves wall by lamellae in the capsule structure. Detachment of epidermal and dermal lamellae causes sinking and rotation of P3 within the capsule, resulting in significant lameness and pain [4]. The basement membrane (BM) is an interface between two layers, and an important component of the extracellular matrix (ECM). Separation and breakdown of BM were typical histological changes primarily inducing the impaired epidermal attachment leading to laminitis in dairy cow [5,6]. The underlying molecular pathway is still unknown. As a result, early detection and treatment are necessary in cows.
In clinical studies, dairy cow laminitis is usually secondary to numerous diseases, such as pleuropneumonia, metritis, and ruminal acidosis [7]. Many of these disorders are caused by the production of LPS, and other toxic chemicals, such as HIS or LA, can also flow through the systemic blood circulation and reach the hoof, causing laminitis [8]. By simulating similar clinical conditions, experimental models have been developed for bovine laminitis. The oligofructose (OF) overload model is more widely and consistently used rather than other inducing models [9,10]. This model may indicate the same histological and pathophysiological alterations seen clinically in cows suffering from laminitis [11,12]. Sousa et al. (2020) reported that excessive oligofructose can result in serious clinical problems, such as acute laminitis and respiratory adaptations for metabolic acidosis [13]. Until now, the OF overload model has been extensively used in equine for laminitis investigations, compared to laminitis in bovine [14,15].
Cellular survival is based on recycling, especially during sudden physiological alterations [16]. Recycling controls the amount of intracellular components. Autophagy (Greek for "self-eating") is a well conserved recycling process that involves lysosome-mediated breakdown of cellular components [17]. Few studies have reported autophagy in dairy cows, despite its widespread study in vitro and other animal models. Autophagy is essential for upholding the stability of intracellular material and metabolism. Autophagy may contribute significantly to the progression of metabolic disorders. Recent studies have confirmed that autophagy is increased in the livers of dairy cows with clinical ketosis and fatty liver, indicating that autophagy plays a significant role in maintaining metabolic stability in the cow's liver [18,19]. To keep cells in a state of equilibrium, autophagy is normally only minimally produced under normal physiological settings [20]. Yet, autophagy is adaptively increased when cells are exposed to external stimuli like bacteria and toxins to engulf bacteria or intracellular toxic compounds like reactive oxygen species, hence maintaining cell homeostasis [21]. Nonetheless, irregular autophagy leads to the accumulation of autophagic vesicles that lead to cell death [22]. According to recent research by Zhang et al., SARA promotes autophagy in the livers of dairy cows given a high-concentrate diet. It is believed that autophagy in hepatocytes is adaptively increased to deal with the oxidative damage to the liver caused by SARA [23]. Regrettably, no reports have been made on studies of autophagy in the laminar tissue of laminitis cows and equine laminitis.
To our knowledge, no study on the autophagy status of laminar tissue in dairy cows with oligofructose-induced laminitis has been done. Therefore, the current investigation was primarily based on determination of laminar tissue autophagy status in dairy cows with oligofructose-induced laminitis at gene and protein level, and to provision of significant therapeutic targets for this disease in the future. We hypothesized that oral oligofructose challenge may induce autophagy in laminar tissue of laminitic dairy cows hooves.
2. Materials and Methods
2.1. Experimental animals
Twelve clinically sound, non-pregnant Chinese Holstein dairy cows [24], excluding a history of serious hoof lesions, 18-26 months old (20.67±3.01 mo), weighing 335-403 kg (379.71±19.87 kg), and with body condition score (BCS) [25] ranging from 2.7-3.3 (3.00±0.23) were selected from the Wan-Dashan Dairy Farm (Heilongjiang Harbin, China). The average age in months, or body condition score and body weight between the two groups of dairy cows have no significant difference. The cows were reared in the large animal laboratory of Northeast Agricultural University's Animal Hospital. The ground was rubberized, and the cows were free to drink water and eat hay grass ad libitum. The surroundings were kept clean and sanitary. During the thirty-day acclimation period, the cows' hooves were trimmed in advance, and the cows were led to walk every day and trained to accept physiological parameters and related scoring checks. After the acclimation period ended, the experimental animals had no discomfort before the experiment began.
2.2. Experimental design and treatment
A total of 12 experimental dairy cows were randomly divided into 2 groups of 6 individuals: an OF overload group and a control group. According to the body weight of cows in the OF-treated group, the low-dose solution (0.85 g/kg of oligofructose (Shandong Shenglong Technology Co., Ltd.) dissolved in 0.1 L/100 kg of warm deionized water) and the high-dose solution (17 g/kg of oligofructose dissolved in 2 L/100 kg of warm deionized water) were prepared. Three days before the high-oral dose of OF aqueous solution (-72 h), the OF-treated cows were given a low-dose OF solution (0.85 g/kg OF dissolved in 0.1 L/100 kg warm deionized water), while 0.1 L/100 kg warm deionized water were given to the control cows via a stomach tube. On the day of the high-oral dose of OF aqueous solution (0 h), the OF-treated cows received 17 g/kg BW of oligofructose dissolved in 20 mL/kg BW of warm deionized water, while the control cows were administered 20 mL/kg BW of warm deionized water at 0 h (on the day of the high-oral dose) via a stomach tube following the method described by [9,10].
Considering the animal welfare, supportive treatments such as 1.96 mL/kg BW of calcium borogluconate (19.6 mg of Ca/mL; Harbin Peace Veterinary Medicine Co., Ltd. P.R. China) were given at 18 h, and 15 mL/kg BW of Ringer lactate (Heping Animal Medicine Co., Ltd. Harbin, P.R. China) and 126 mg/kg BW of sodium bicarbonate (Heping Animal Medicine Co., Ltd. Harbin, P.R. China) were given at 18 h and 24 h following administration of OF in dairy cows.
2.3. Clinical examination of dairy cows
The cows in the control group and OF-treated group were recommended for the clinical examination comprising respiration rate, heart frequency, rectal temperature, hoof temperature, hoof shell temperature, rumen contraction rate, rumen pH (pH meter; Benchtop; Mettler Toledo Inc., Switzerland), eating and drinking routine, feces consistency, weight shift, wrist (tarsal) joint swelling score, hoof crown band swelling score, digital artery pulsation score, blood pressure (electronic sphygmomanometer), hoof pain score, and claudication score at -72 h, 0 h, 6 h, 12 h, 18 h, 24 h, 36 h, 48 h, 60 h, and 72 h [9,10]. During claudication stage, cows were allowed to walk and trot by traction in a straight line and then to try circle movement on the same ground at the Animal Hospital, Northeast Agricultural University Harbin, P.R. China. The claudication scores of each cow were evaluated by the three expert licensed veterinarians according to the Sprecher scoring method as shown in (Table 1). When all the expert veterinarians evaluated a score of ≥ 2 in a cow, then it was inspected as lame. After 72 h of OF overload, a dose of 20 mg/kg of phenytoin sodium and pentobarbital sodium (Fatal-plus; 20 mg/kg IV) were administered intravenously to all animals to be euthanized [10].

Table 1.
Claudication scoring system Sprecher et al. [24].
Table 1.
Claudication scoring system Sprecher et al. [24].
| Score | Description | Assessment criteria |
|---|---|---|
| 1 | Normal | The cow walks and stands with a level-backed stance. It has a normal gait. |
| 2 | Mildly lame | The cow stands with a straight back and walks with a stretched back. It has a normal gait. |
| 3 | Moderately lame | An arched back can be seen whether standing or walking. Cows walk in a short stride with one or more limbs/hoofs. |
| 4 | Lame | An arched back is constantly visible, and gait is best described as one purposeful step at a time. The cow favors one or more limbs or hooves. |
| 5 | Severely lame | The cow also exhibits an incapability or reluctance to transfer weight on one or more of its limbs or hoofs. |
2.4. Laminar tissue sampling
After 72 h of oligofructose overload, when the clinical observations of cows in the treated group met the criteria for acute laminitis in dairy cows [9,10], the cows in the control and treatment groups were euthanized, and hoof tissue samples were collected. According to the method explained in [11], the left hind hoof of the diseased animals was isolated within 5–10 minutes, placed in an ice box, and brought back to the laboratory as soon as possible. The cow’s hoof wall was sectioned by using a band saw to uncover the laminar tissue, which was then isolated from the hoof shell. The laminar tissue was sectioned into tiny tissue pieces (1-2 mm2), followed by frosted in liquid nitrogen and stored at -80˚C. The residual hoof tissue was embedded in a 10% formalin-phosphate buffer and fixed overnight (room temperature). The whole procedure was done on ice. Operators wear sterile gloves and disposable masks to avoid tissue contamination. Usually, the laminar wall runs along the entire axial, abaxial, and dorsal sides of the hoof, measuring 3–7 cm from the coronet area to the sole corium. The isolated laminar tissue wall follows 2 cm under the coronet and contains the axial and abaxial parts of the laminar wall tissue. The original laminar tissue measured 6 cm in length and 3 cm in width.
2.5. RNA isolation and cDNA synthesis
Following the manufacturer's instructions, total RNA was collected from laminar tissue of 12 cows utilizing the RNA Miniprep-Kit (Invitrogen, Carlsbad, USA). The laminar tissue samples (100 mg) were homogenized with 1 mL of TRIzol reagent (Invitrogen, Carlsbad, USA). The entire RNA without DNA, protein, and isopropanol precipitates were extracted with chloroform and rinsed with 75% ethanol in a non-DNAse/RNAse centrifuge tube. Using an ultranucleic acid protein detection kit (NO-ONE, Gene Company, USA), the purity and concentration of the extracted total RNA were assessed. The integrity of each RNA sample was confirmed by 1% agarose gel electrophoresis (Bio-Rad Laboratories, Hercules, CA, USA). The collected RNA tissue samples were diluted to 1ug/uL by quantifying optical density. The total RNA (1ug) was collected from each tissue sample following the manufacturer's instructions for Prime-Script™ RT Kit (Takara, Dalian, Liaoning, China). Reverse transcription was performed to obtain cDNA. Complementary DNA (cDNA) was diluted 1:3; diluted with DEPC water and stored at -20˚C for RT-qPCR analysis. DEPC water is formed from dH2O with DEPC and then autoclaved to eliminate DEPC.
2.6. RT-qPCR
The primers utilized in this study for detecting the genes including GAPDF, ATG5, ATG12, P62, Beclin-1, and mTOR were designed from the Shanghai Sheng Gong Biotechnology, Co., Ltd. (BBI Life Sciences, Shanghai, China) (Table 2). The specificity of each primer sequence was determined by Blast Computer Program from (NCBI) National Center for Biotechnology Information database (Bethesda, Maryland, USA).
Table 2.
Primer sequences.
| Genes | Ref Seq accession No. | Primer sequences (5`-3`) |
|---|---|---|
| ATG-5 | NM_001034579.2 | Forward: ACACCTTTGCAGTGGCTGAGTG Reverse: TCTGTTGGTTGCGGGATGATGC |
| ATG-12 | NM_001076982.1 | Forward: GAGCGAACCCGAACCATCCAAG Reverse: AGGGTCCCAACTTCCTGGTCTG |
| Becilin-1 | NM_001033627.2 | Forward: GCAGGTGAGCTTCGTGTGTCAG Reverse: GCTGGGCTGTGGCAAGTAATGG |
| mTOR | XM_002694043.6 | Forward: GCACGTCAGCACCATCAACCTC Reverse: CAGCCGCCGCAGCCATTC |
| P-62 | NM_176641.1 | Forward: CCAGGAGGTGCCCAGAAACATG Reverse: AGGCGGAGCATAGGTCGTAGTC |
| GAPDH | DQ402990 | Forward: GGGTCATAAGTCCCTCCACGA Reverse: GGTCATAAGTCCCTCCACGA |
RT-qPCR was executed by the Green chimeric florescence detection technique of SYBR Premix Ex Taq TM ‖ Kit (Takara, Dalian, Liaoning, China) with Light Cycler 480 RT-PCR system (Roche, Germany). The (20 uL) PCR reaction mixture contained (2 uL) cDNA template and (18 uL) PCR major blend. Then, PCR major blend comprised (6.4 uL) DEPC water, (10 uL) SYBR green florescence dye, and (1.6 uL) miscellaneous primer solution (10 uM for each forward and reverse primer). The ultimate primer concentration was 0.4 uM/uL. PCR settings were used: pre-denaturation, 1 cycle, 95°C, 30 sec; quantitative analysis, 40 cycles of 95°C 5s and 60°C 30 sec; melting curve analysis, 95°C 5s, 65°C 15 sec, 95°C 5 sec 1 cycle Cycling; cooling, 1 cycle at 50°C for 30 seconds. Ct values for each gene were assessed by Light Cycler 480 software 2.0 (Roche, Germany) and Abs Quant/Fit points method. According to the △△Ct method, with GAPDH as the housekeeping gene, the PCR efficiency of each gene was analyzed.
2.7. Western blot
The laminar tissue sample (100mg) was standardized with 1mL RIPA lysate buffer (Beyotime Biotechnology, Shanghai, China). RIPA lysate buffer contained 0.1% SDS, 1% deoxycholate, and 1% Triton-X-100. During homogenization, the tissue was treated with 10 uL of the protease inhibitor PMSF (Beyotime Biotechnology, Shanghai, China), and then the sample was processed in a grinder at 4 °C for 4 minutes. The sample was then centrifuged at 12000 rcf/min for 15 minutes. The BCA method (Beyotime Biotechnology, Shanghai, China) was utilized to calculate the total protein concentration. The amount of protein in the tissue sample was determined (2.5 ug/uL) by sodium dodecyle sulphate (SDS-PAGE) protein loading buffer and physiological saline in boiled water for 5min. Each well received a 9uL protein sample. Following separation on a 10% polyacrylamide gel, the total amount of protein (25ug) was shifted to nitrocellulose (NC) filter membrane (Pall Life Sciences Inc. Pensacola, FL, USA) by semi-dry method (300 mA, 1.5 h). For blocking, the membrane was placed in 5% skimmed milk in TBS (Tris-buffer saline; Leagene Biotechnolgy, Beijing, China) with Tween-20 (0.1% Tween-20 TBS; TBST; Leagene Biotechnolgy, Beijing, China) for 2h at ambient temperature with rocking. After blocking, the membranes were then coated with the primary antibody overnight at 4 °C. The specific primary antibodies with dilutions utilized as Beclin-1 (1:1000), P62 (1:1000), and LC3-II (1:1000), and β-actin at 1:2000 dilution, from (BIOSS Antibodies Beijing Biosynthesis Biotechnology Co., LTD. P.R. China). Subsequently washing with TBST three times (15 min each), the NC membranes were transferred to a diluted secondary antibody and shaken for 2 h at room temperature for incubation. The HRP-conjugated goat anti-rabbit IgG secondary antibody (dilution 1:5000) in TBST buffer was bought from (BIOSS Antibodies Beijing Biosynthesis Biotechnology co., LTD. P.R. China). After washing with TBST three times (15 min each), the protein bands in the NC membranes were seen by western blot ECL substrate (Meilun Biotechnology Co., LTD, Dalian, China) luminescent liquid and measured by densitometry using ImageJ software. The internal reference protein β-actin (1:2000 dilution; BBI Life sciences Shanghai, China) was used.
2.8. Immunohistochemistry
Immunohistochemistry was used to identify Becilin-1 and P62 expression in laminar tissue. Laminar samples of tissues were sliced into suitable sizes, put in 4 percent paraformaldehyde for 24 h, then incorporated and sectioned. The slices were dewaxed in an 80 C oven overnight, and then submerged in a 3 percent hydrogen peroxide solution for 10 minutes in the darkened room for intrinsic peroxidase blockage, accompanied by antigen restoration in a pressurized cooker utilizing sodium citrate antigen restoration solution. Samples were coated with BSA for 20 minutes at ambient temperature, subsequently incubated with the primary antibodies (1:200, Becilin-1; 1:200, P62, Novus Biologicals, USA) for a further 24 hours at 4°C, and then exposed to streptavidin-labeled HRP for an additional 30 minutes at room temperature. After that, each section was DAB and hematoxylin stained, fixed with mild glue, and oven dried. To determine the staining level of tissue slices in each group, the stained samples were inspected under a microscope and assessed with Image-Pro Plus 6.0 software (Media Cybernetics, USA).
2.9. Statistical Analysis
The data was analyzed utilizing GraphPad Prism version 7 software (Version 7.04, Graph Pad software Inc., San Diego, CA, USA). The experimental data were analyzed with normal distribution. All data were evaluated using an independent student-T test and Bonferroni’s multiple comparison tests with a significance level of 5%. Experimental data are indicated as mean ± SD.
3. Results
3.1. Clinical manifestation of dairy cow laminitis
All OF group dairy cows presented clinical manifestations of unique acute ruminal and systemic acidosis symptoms, such as severe watery diarrhea, in-appetence lack of food intake, anorexia, depression, swelling of carpal (tarsal) joints, swollen hoof coronary band, change in weight shift, increased heart rate, increased diastolic blood pressure, elevated hoof temperature, increased body temperature, decreased breathing rate, hyperactivity of digital (toe) arteries, slowed rumen contraction, hoof pain, decreased rumen pH, transient fever, and lameness [26,27,28]. Control cows indicated no signs of systemic disease. All these symptoms were the same as those reported by [9,10,11]. During claudication assessment, clinical signs of laminitis were initially observed at 24 hours after OF overload and continued to increase until 60 hours, at which point this study found a maximal limp score of 3–5, which confirms the acute laminitis. These claudication scores were constant from 60 h to 72 h, and this study didn’t find any further significant change (Table 3). Therefore, the animals were then euthanized for further experimental requirements. All these symptoms were the same as those reported by Danscher et al [10], who observed acute laminitis at 60–120 h of OF-overload.
Table 3.
Results of claudication score.
| Time | Control cows (n=6) | OF-treated cows (n=6) | ||||||||||
|---|---|---|---|---|---|---|---|---|---|---|---|---|
| 1 | 2 | 3 | 4 | 5 | 6 | 1 | 2 | 3 | 4 | 5 | 6 | |
| -72h | 1 | 1 | 1 | 1 | 1 | 1 | 1 | 1 | 1 | 1 | 1 | 1 |
| 0h | 1 | 1 | 1 | 1 | 1 | 1 | 1 | 1 | 1 | 1 | 1 | 1 |
| 6h | 1 | 1 | 1 | 1 | 1 | 1 | 1 | 1 | 1 | 2 | 1 | 1 |
| 12h | 1 | 1 | 1 | 1 | 1 | 1 | 2 | 1 | 1 | 2 | 1 | 1 |
| 18h | 1 | 1 | 1 | 1 | 1 | 1 | 2 | 2 | 1 | 3 | 2 | 2 |
| 24h | 1 | 1 | 1 | 1 | 1 | 1 | 2 | 2 | 2 | 3 | 3 | 3 |
| 36h | 1 | 1 | 1 | 1 | 1 | 1 | 2 | 3 | 2 | 3 | 3 | 3 |
| 48h | 1 | 1 | 1 | 1 | 1 | 1 | 3 | 3 | 2 | 3 | 3 | 3 |
| 60h | 1 | 1 | 1 | 1 | 1 | 1 | 4 | 4 | 3 | 5 | 4 | 5 |
| 72h | 1 | 1 | 1 | 1 | 1 | 1 | 4 | 4 | 3 | 5 | 4 | 5 |
3.2. Autophagy-associated genes expression in laminar tissue of laminitis dairy cow
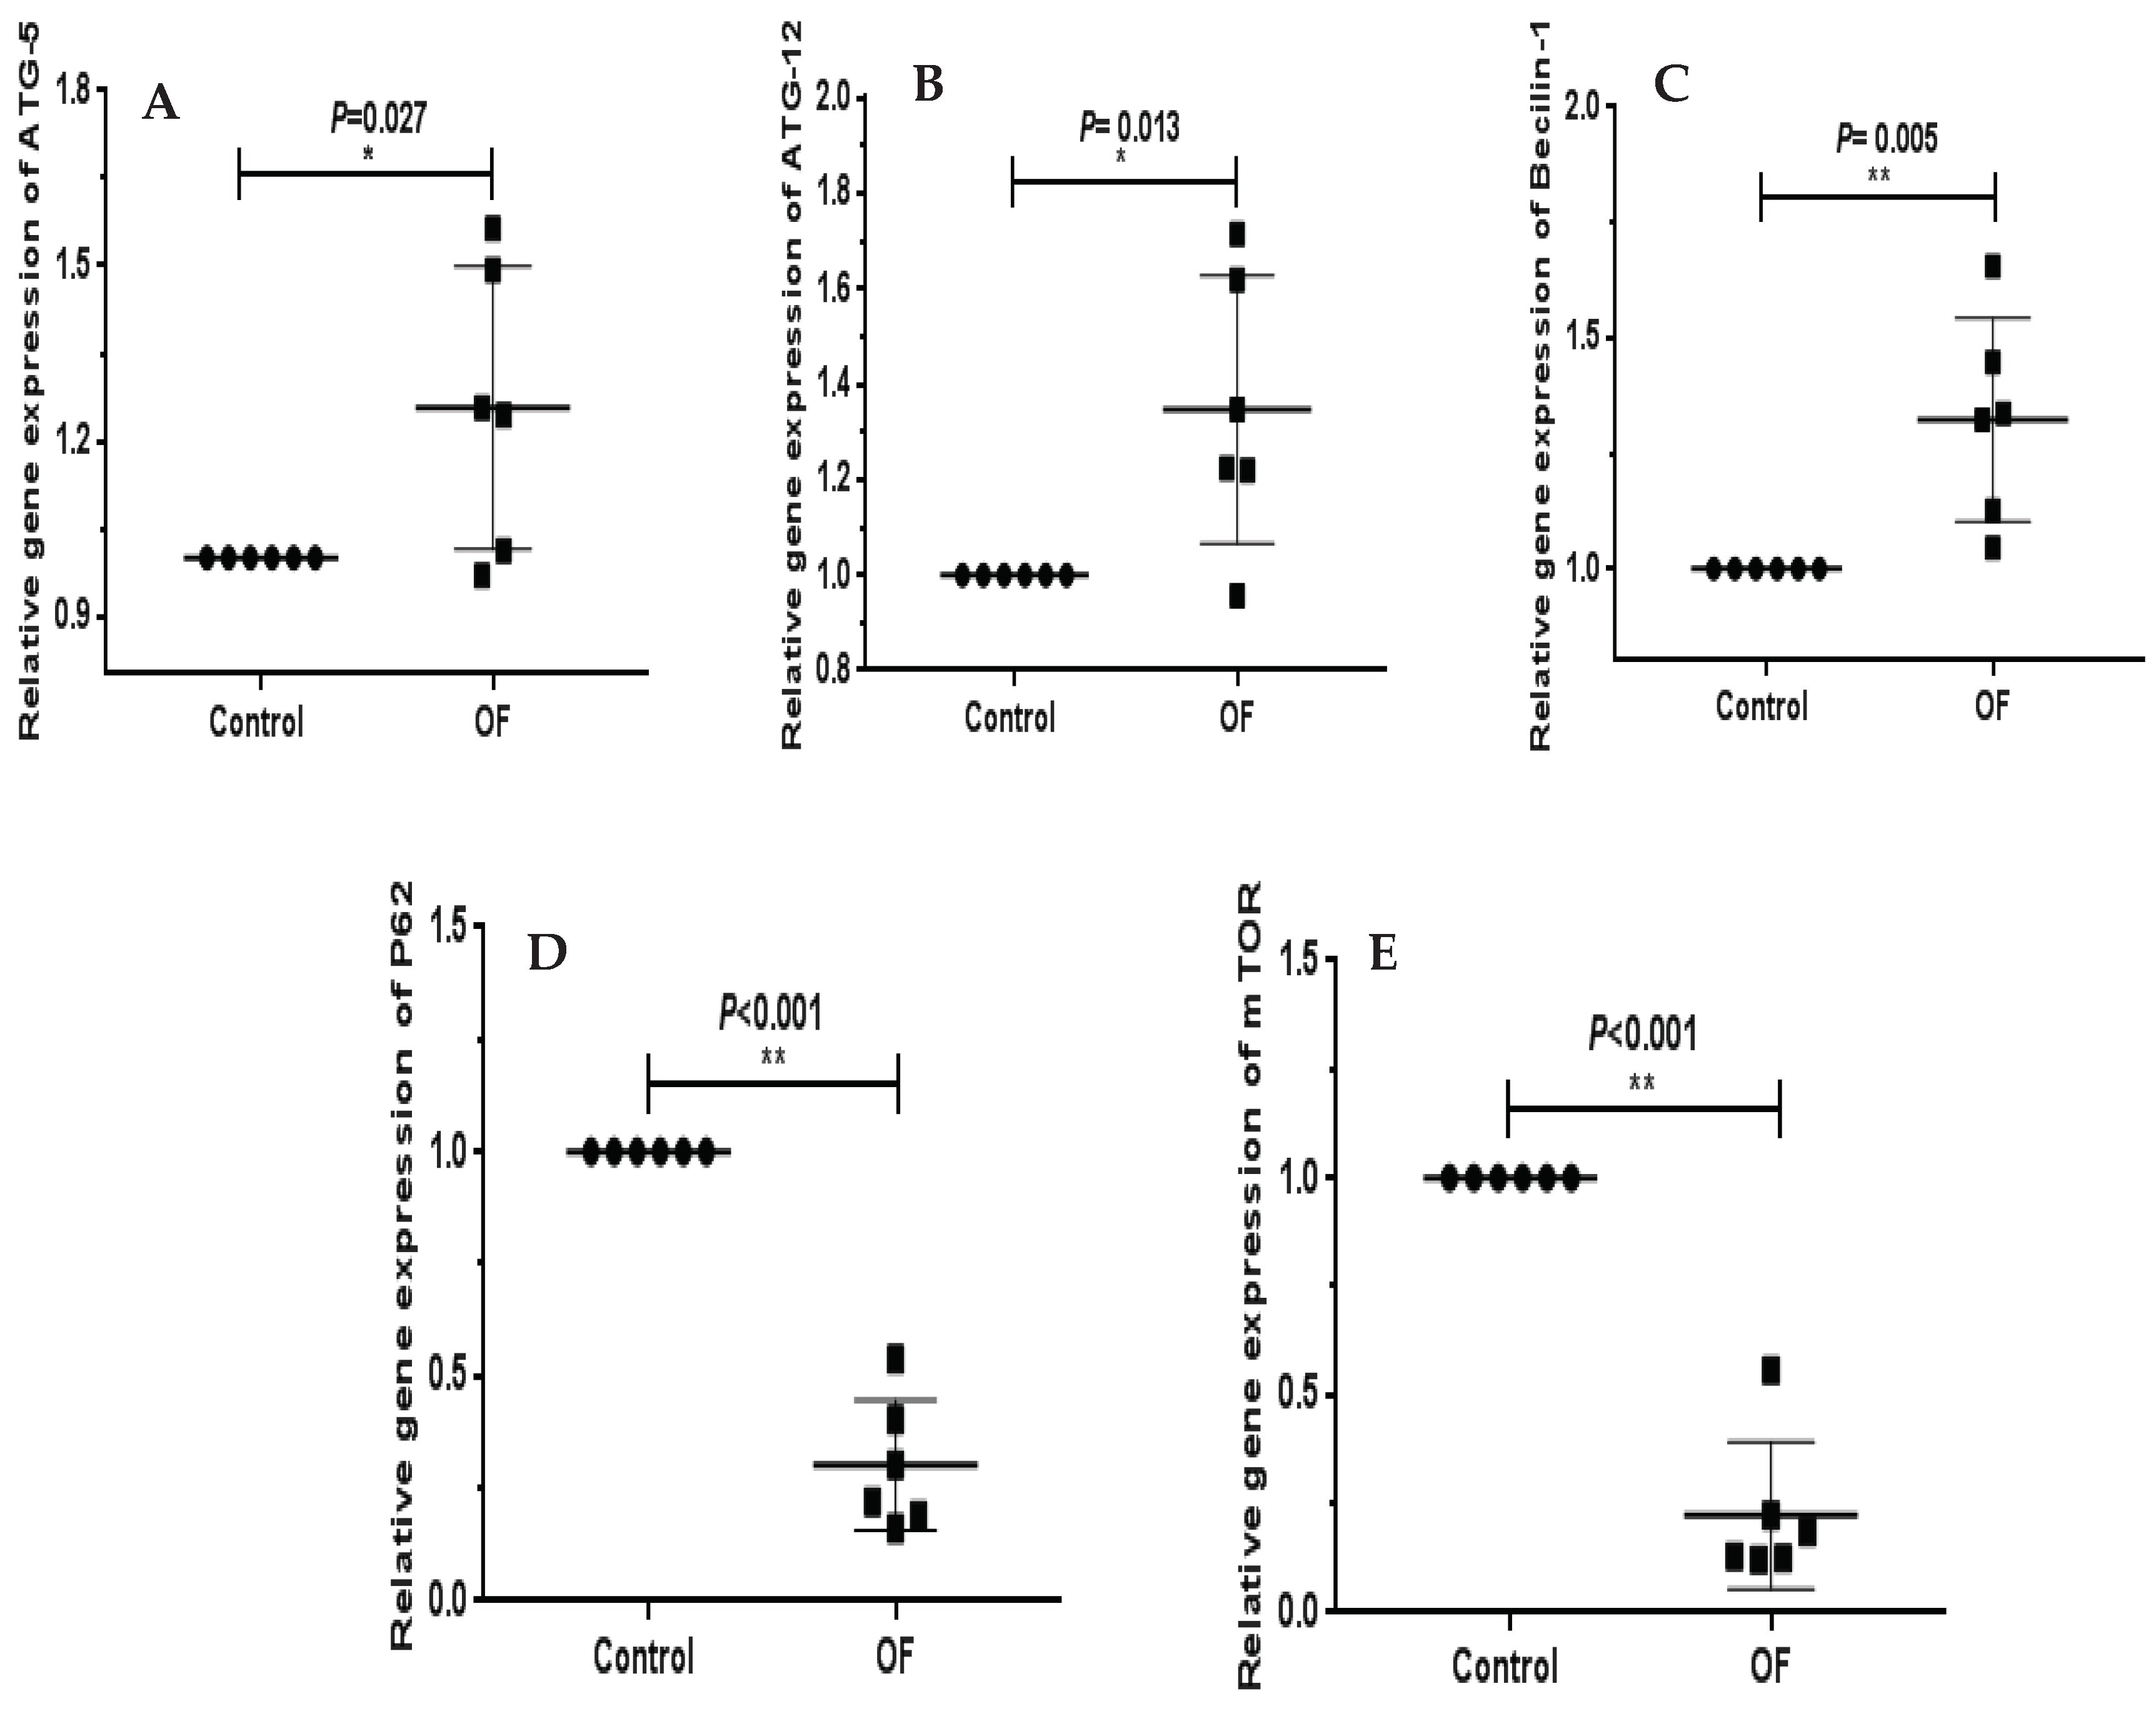
The autophagy-associated genes expressions including Beclin-1, ATG5, ATG12, P62 and mTOR in control and OF groups are indicated in Figure 1. The mRNA expression level of Becilin-1 (P=0.005) was extremely significantly higher in laminar tissue of OF group than in control group (P<0.01). Similarly, ATG5 (P=0.027) and ATG12 (P=0.013) mRNA expressions in sick animals increased significantly (P<0.05) in the OF group's laminar tissue than in the control group. In this study, mRNA expression of P62 (P=0.001) and mTOR (P=0.001) significantly decreased (P<0.01) in sick cows than in control cows. These findings indicated that increased or decreased expression of genes may be linked to autophagy in sick animals confirming that autophagy was induced in laminar tissue of laminitic dairy cows.
Figure 1.
RT-qPCR results of mRNA concentration of autophagy stress related genes including, ATG12, ATG5, Becilin1, P62 and mTOR in laminar tissue of the both groups. The mRNA expression of P62 (D), Becilin1 (C) and mTOR (E); ‘**’ showed differences were more significantly in laminar tissue of OF group with acute laminitis as compared to control group (P<0.01). ATG5 (A) and ATG12 (B) genes expression; ‘*’ indicated differences were significant in the OF group as compared to the control group (P<0.05).
3.3. Autophagy-associated proteins expression in laminar tissue of laminitis dairy cow
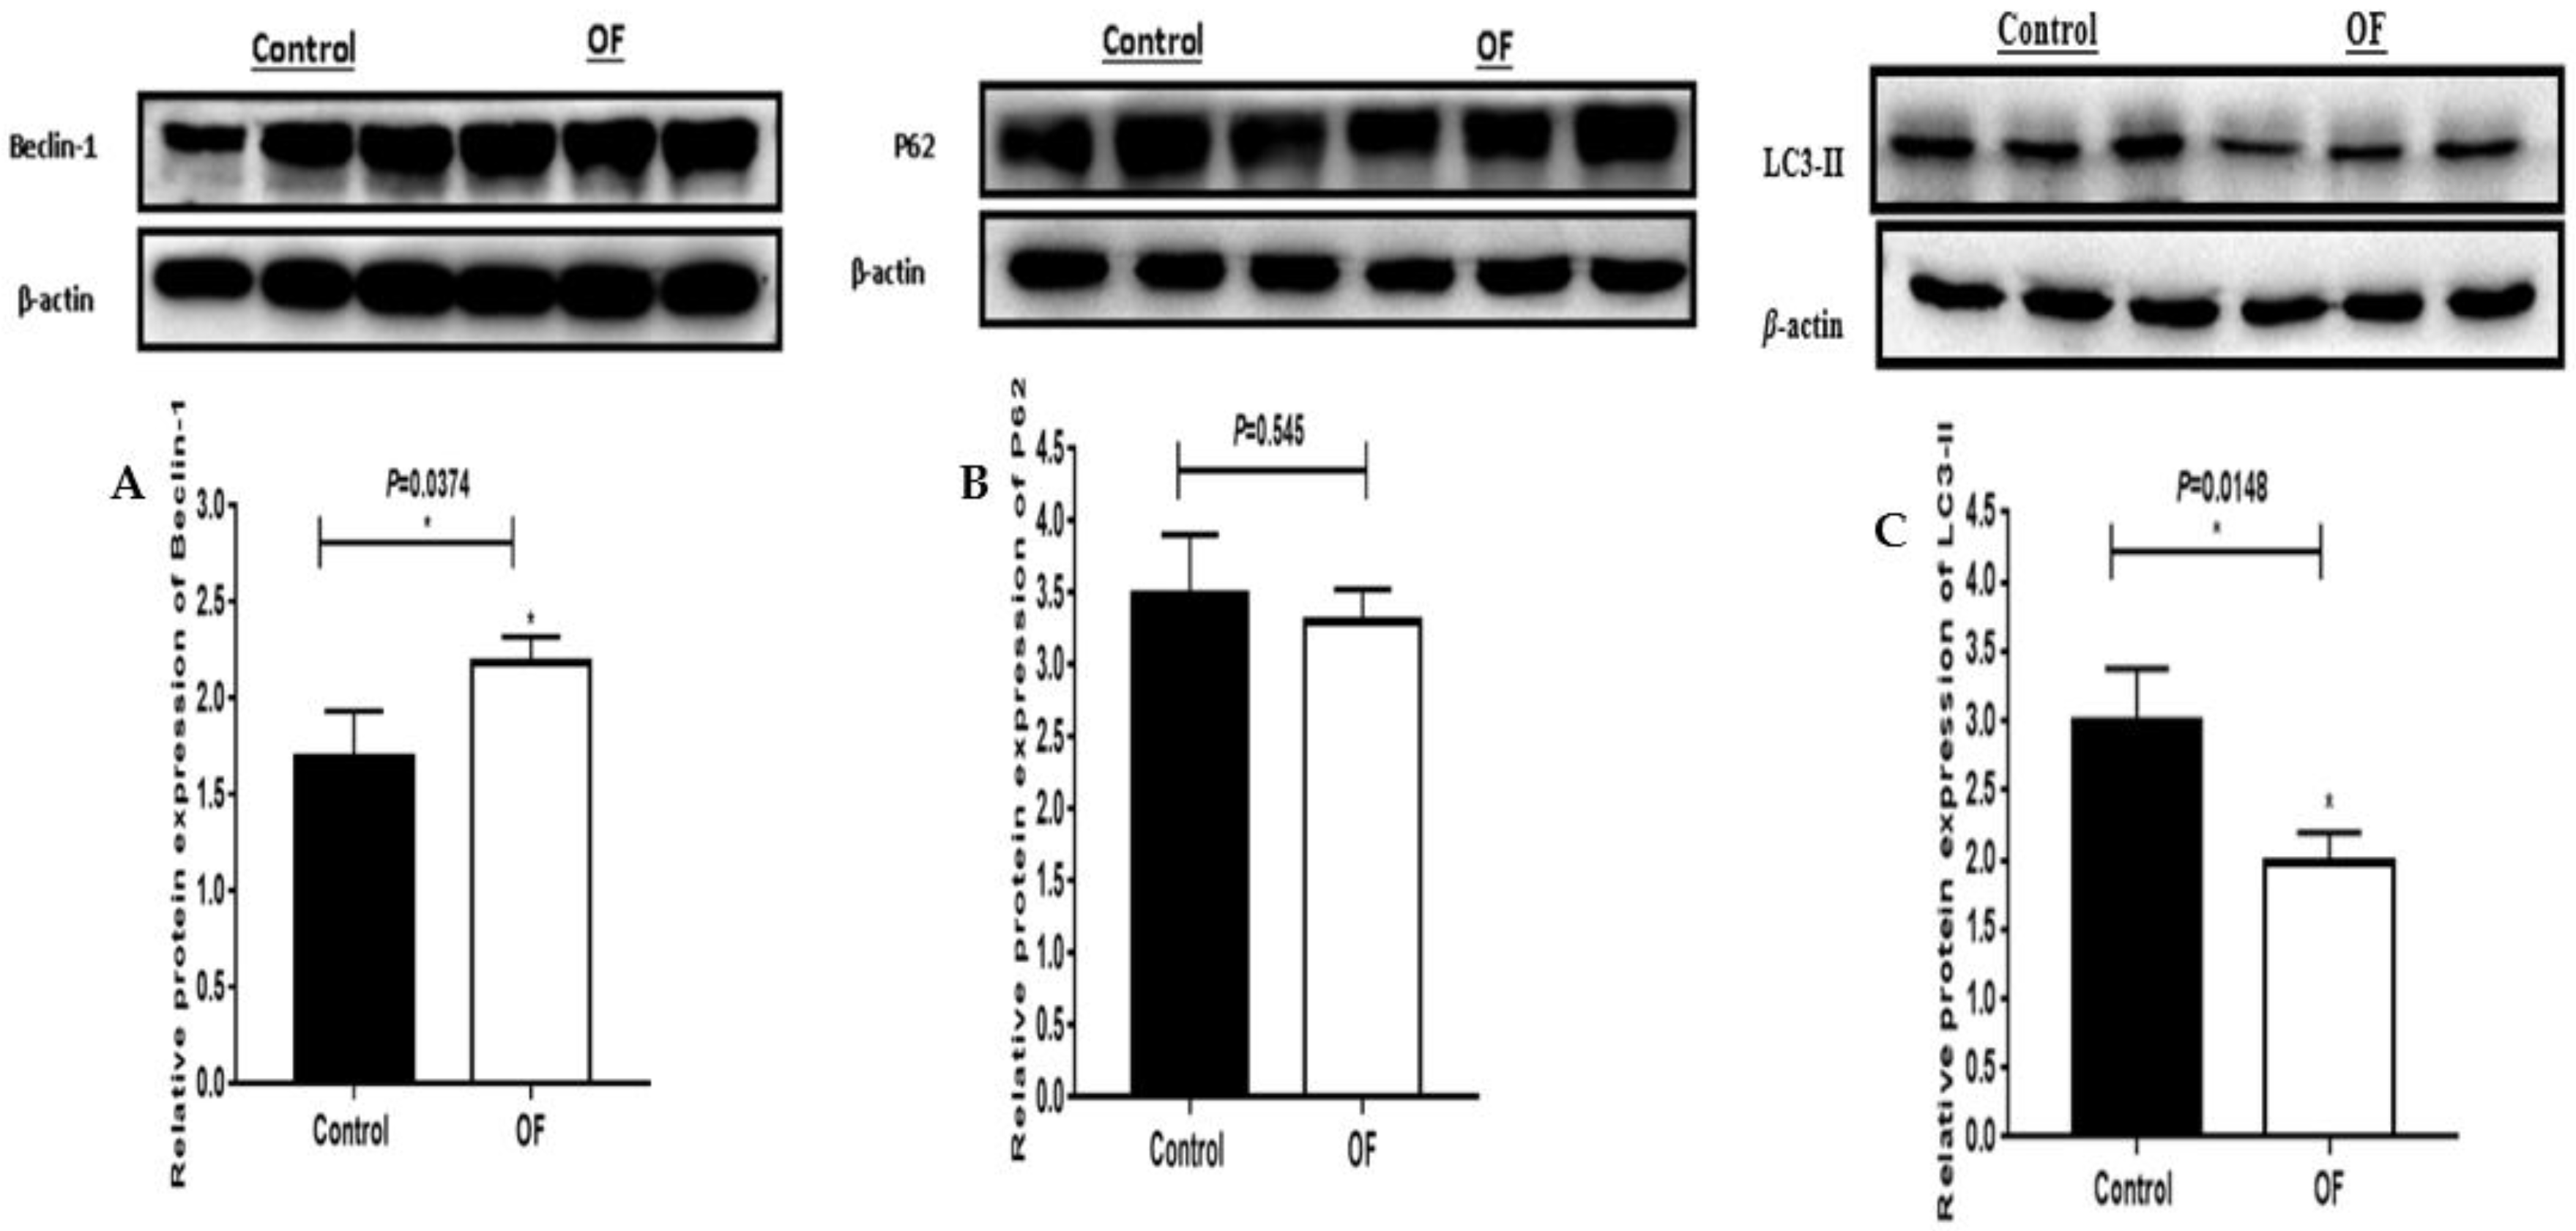
Autophagy-associated proteins expression such as Beclin-1, P62 and LC3II in OF and control groups are indicated in Figure 2. The expression of Beclin-1 protein (P=0.0374) increased significantly (P<0.05) in the OF group's laminar tissue as compared to the control group. The LC3-II protein expression (P=0.0148) decreased significantly (P<0.05), while the P62 protein expression (P=0.545) decreased non-significantly (P>0.05) in the OF group's laminar tissue than in the control group. These findings indicated that increased or decreased expression of proteins may be linked to autophagy in sick animals.
Figure 2.
western blot results of autophagy related proteins expression including, Becilin1, LC3II, and P62 in the laminar tissue of the both groups. The protein expression of Becilin1 (A) and LC3II (C); ‘*’ showed differences were significant in OF group with acute laminitis compared with the control group (P<0.05). P62 protein expression B); indicated the differences were non-significant in the OF group as compared to the control group (P>0.05).
3.4. Immuno-expression of Becilin1 and P62 proteins in laminar tissue of laminitis dairy cow
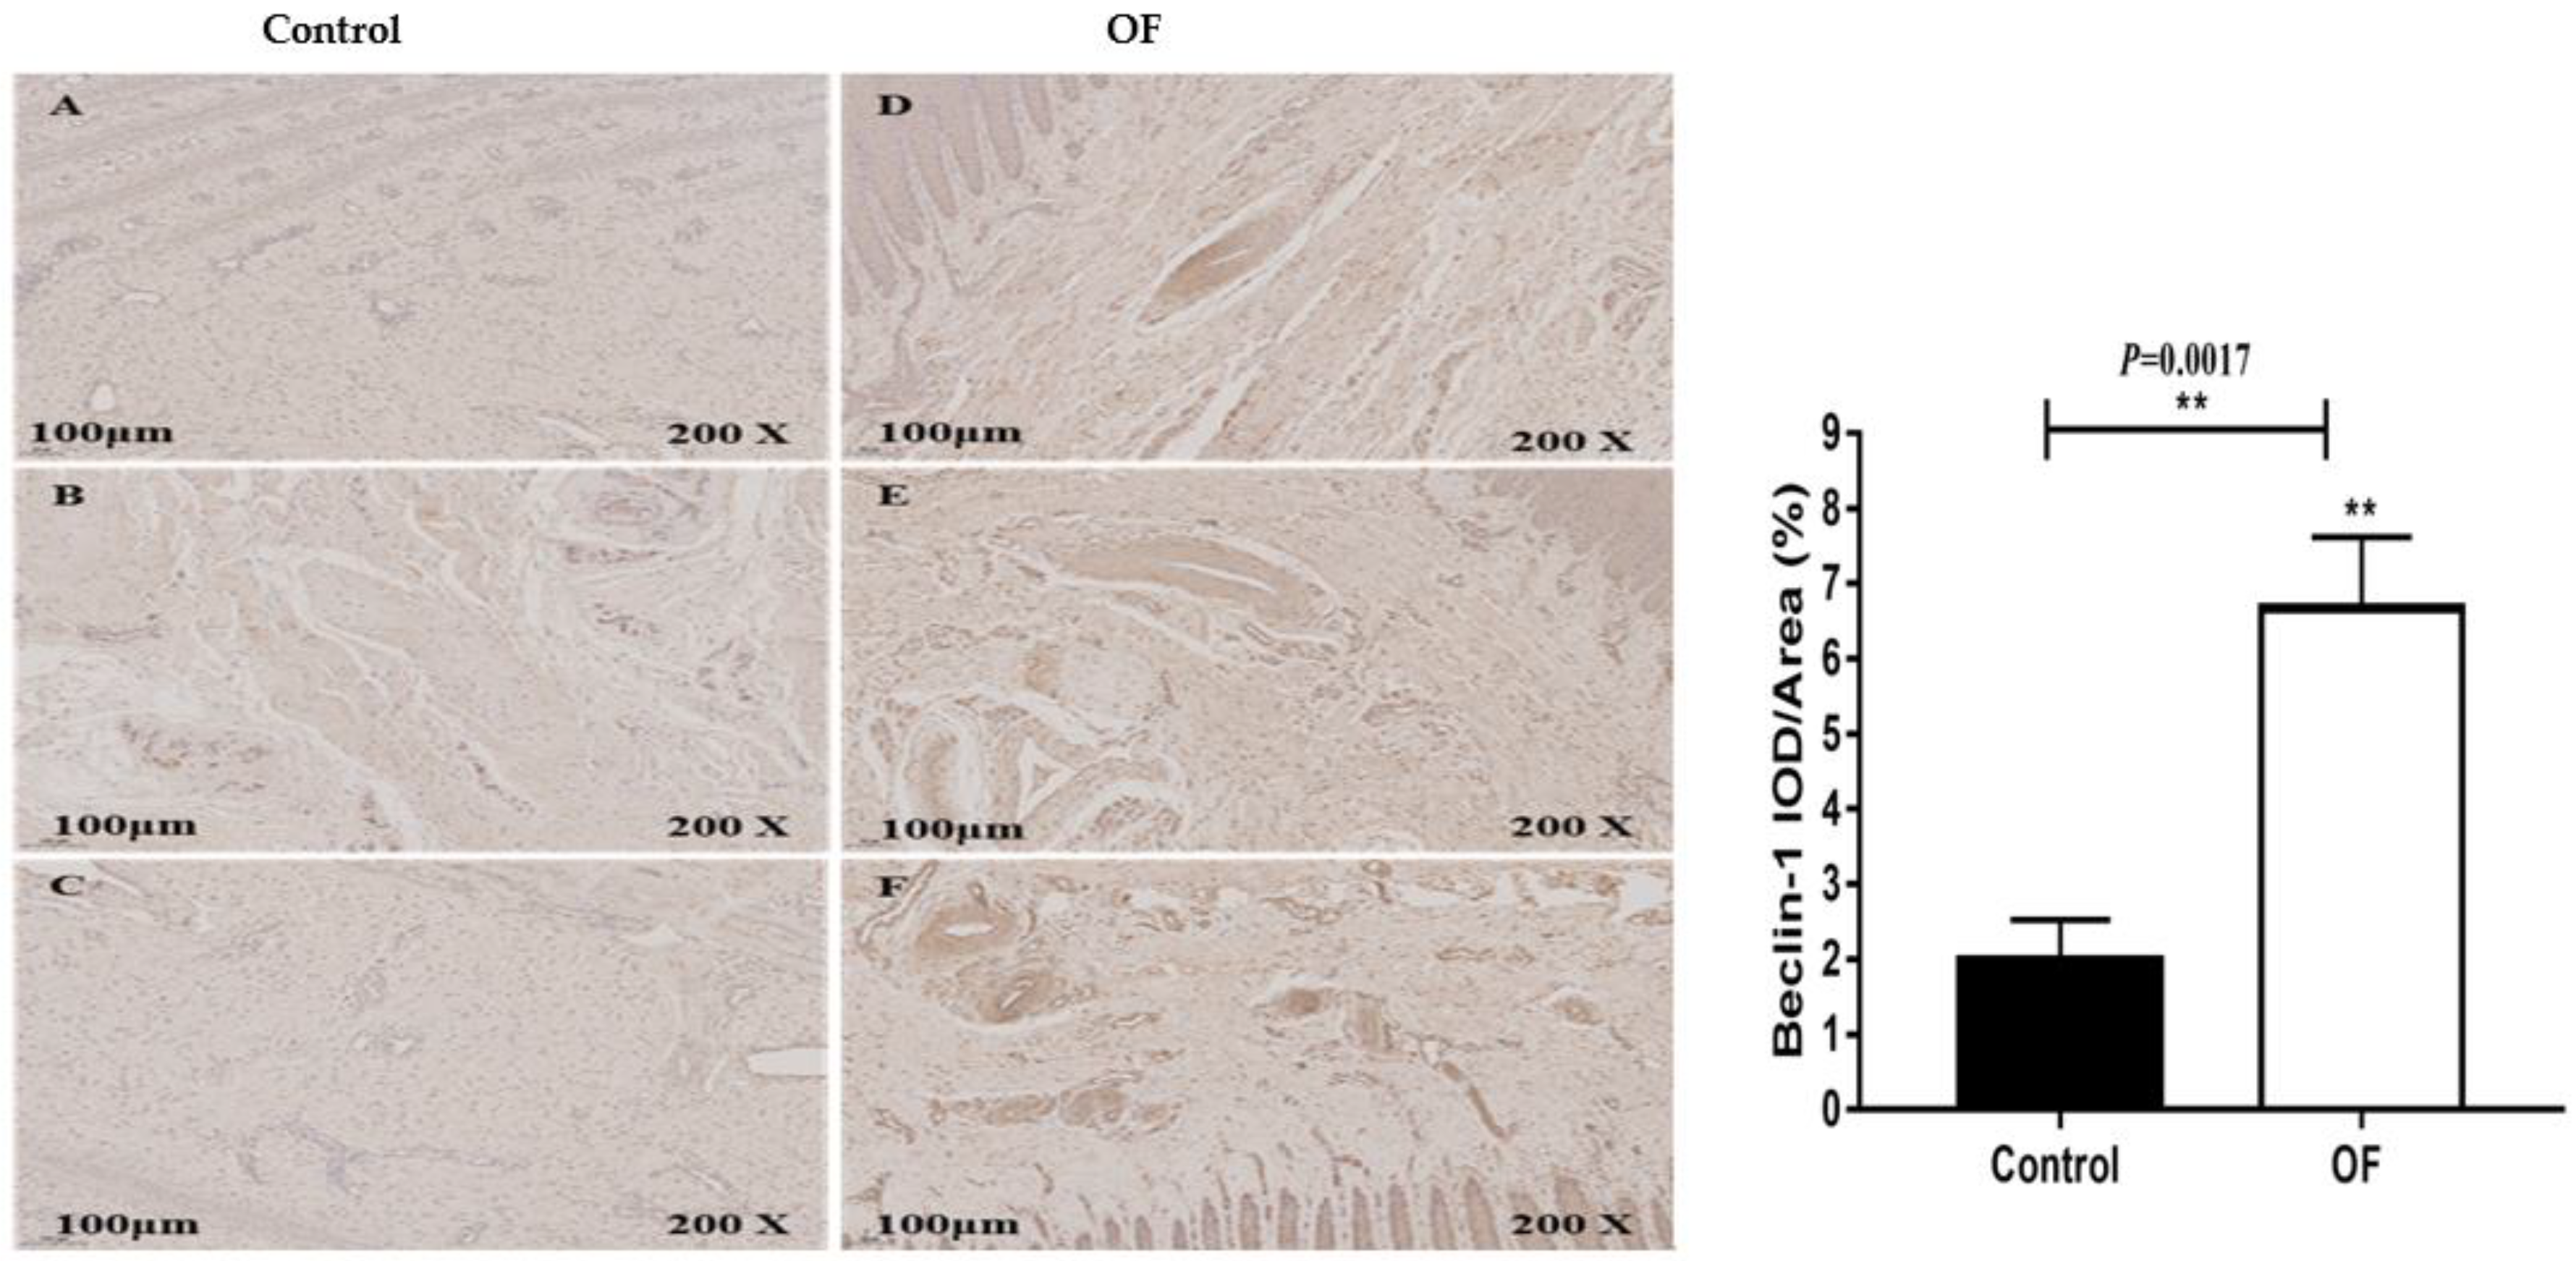
The immunohistochemical results of Beclin-1 protein expression in the laminar tissue of cows indicated that the mean Beclin-1 staining in the cytoplasm of the laminar tissue of the OF group was 6.67 %, while it was 2 % in the control tissue. Statistically, the expression of Beclin-1 protein (P=0.0017) was increased significantly (P<0.01) in the cytoplasm of the OF group's laminar tissue as compared to the control group, as illustrated in Figure 3.
Figure 3.
Immunohistochemical staining of Beclin-1 in laminar tissues: Scale=100μm, 200X, (A, B, and C) control cows; (D, E, and F) OF-treated cows.
Figure 3.
Immunohistochemical staining of Beclin-1 in laminar tissues: Scale=100μm, 200X, (A, B, and C) control cows; (D, E, and F) OF-treated cows.
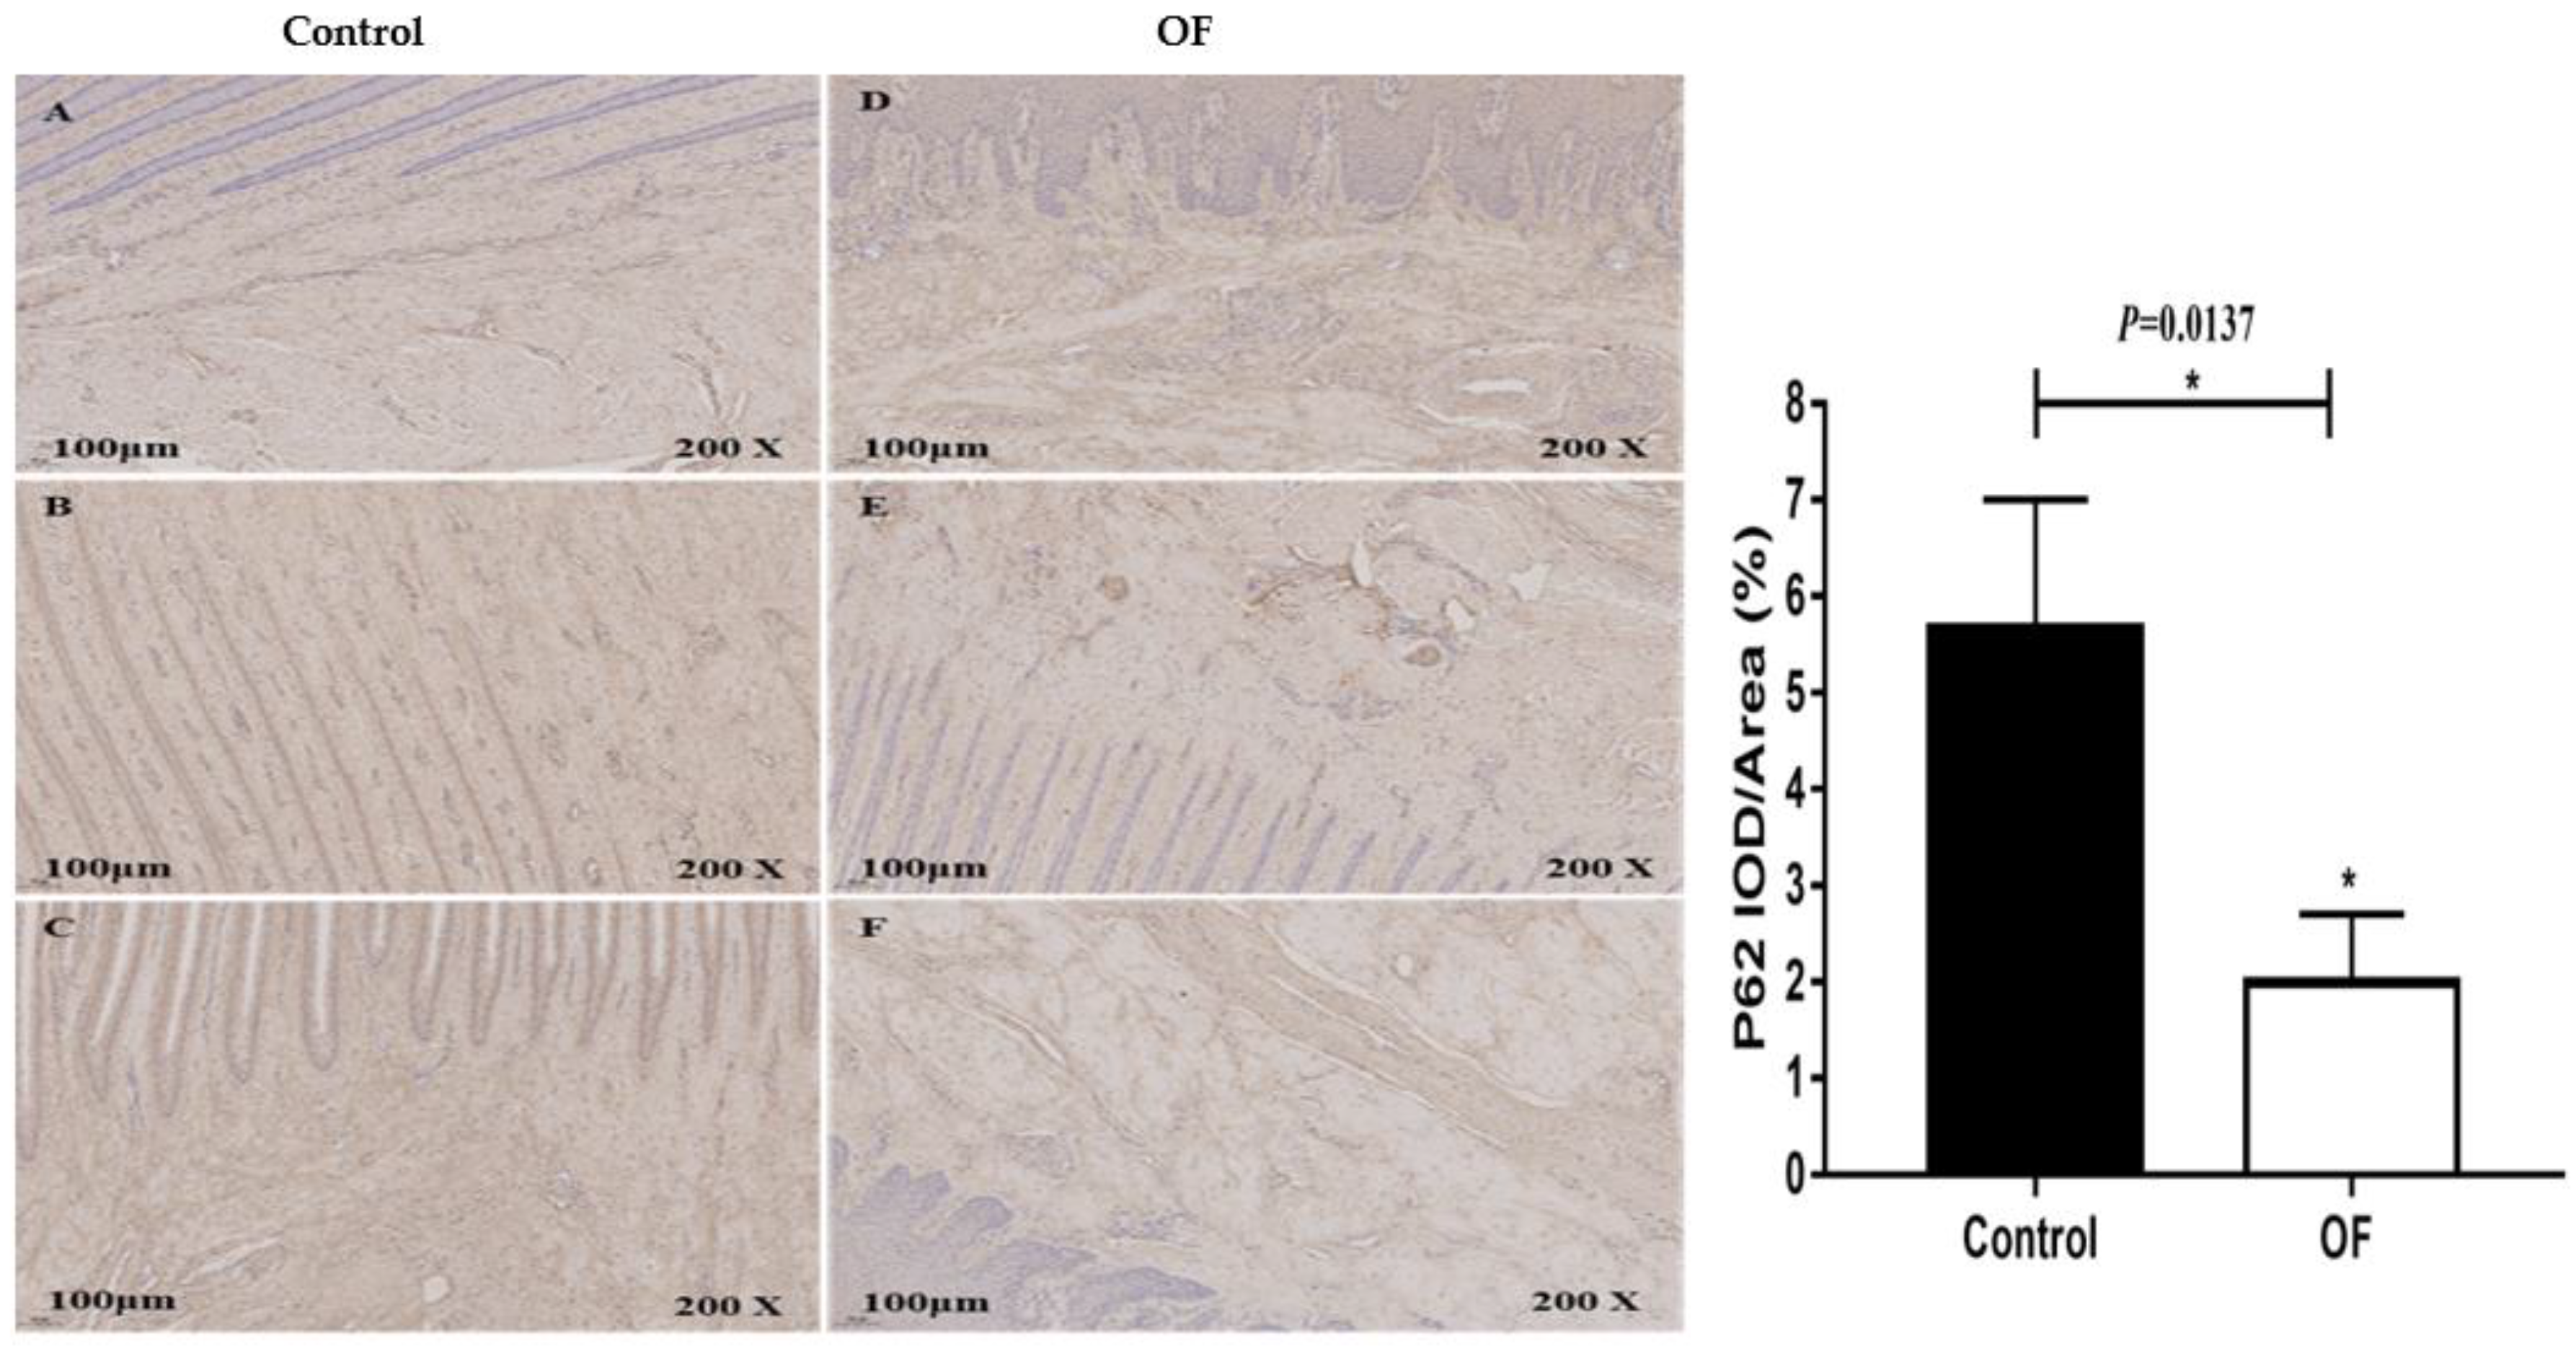
The immunohistochemical results of P62 protein expression in the laminar tissue of cows indicated that the mean P62 staining in the cytoplasm of the laminar tissue of the OF-treated group was 2 %, while it was 5.66 % in the control tissue. Statistically, the expression of P62 protein decreased significantly (P<0.05) in the cytoplasm of the OF group's laminar tissue as compared to the control group (P=0.0137), as illustrated in Figure 4.
Figure 4.
Immunohistochemical staining of P62 in laminar tissues: Scale=100μm, 200X, (A, B, and C) control cows; (D, E, and F) OF-treated cows.
Figure 4.
Immunohistochemical staining of P62 in laminar tissues: Scale=100μm, 200X, (A, B, and C) control cows; (D, E, and F) OF-treated cows.
4. Discussion
Cow laminitis was first documented as a ubiquitous aseptic inflammation of the dermal lamellae of the claw [29]. Following that, researchers suggested an expanded concept of cow laminitis as local manifestations of systemic disease in the hoof [7]. In clinical cases, cow laminitis is usually the result of a severe systemic inflammatory condition, such as rumen acidosis, septic pleuropneumonia, metritis, and so on. In this investigation, we utilized the model of oligofructose overload-induced laminitis because it closely resembles practical settings with current dairy operations, where a high-energy diet regularly causes rumen acidosis in milking cattle [30]. This model might also show the conventional histological and pathophysiological alterations that occur in clinical bovine laminitis. Furthermore, this method was easier to utilize and build in laboratory cow laminitis, and it showed higher accuracy versus other inducing models [10]. Excessive oligofructose consumption, which may quickly decrease the pH of rumen fluids, affects the performance of the intestinal barrier and kills many gram-negative bacteria. The GI tract releases free lipopolysaccharide (LPS), which enters the bloodstream and causes systemically inflammatory responses and organ damage such as laminitis [26], rumenitis [32], and severe synovitis [33].
In our previous publications, we have demonstrated that bovine laminitis has been established effectively utilizing the OF-induced method, and laminitic cows achieved clinical characteristics of distinct acute ruminal and systemic acidosis manifestations as well as recognizable histological signs in the laminar tissue, such as BM damage and separation, the sagging of the epidermal lamellae along with modifications to the basal cell shape [26,27,28]. We used the similar sample of laminar tissue from the prior work and assessed autophagy markers at the gene and protein levels.
Autophagy is a mechanism that is maintained the intracellular breakdown system by which amino acids are reused within cells, and plays numerous physiological roles for instance in proliferation, differentiation, and upkeep of cellular homeostasis [34]. This process is regarded as involving the development of autophagosomes, double-membrane vesicles that sequester the products that are cytoplasmic in the lysosome [35]. But unregulated autophagy can result in the building of autophagic vacuoles that can lead to cellular death [35]. Major proteins involved in a system that controls autophagy in cells of all organisms, from yeast to humans, are produced by genes in the ATG (Autophagy-related) family [36,37]. The discovery of these proteins allowed researchers to identify Signalling systems that contribute to the activation and control of this process. For the key biochemical markers, two proteins, beclin1 (Atg6), and LC3 (Atg8) as well as ATG7, are thought to be involved in autophagy. Becilin-1 is one of the major autophagy parameters in mammals and has been implicated in mammalian autophagy [38]. Becilin-1 binds PI3KC3 (Vps34) to create complexes with proteins [39] that regulate intracellular transport and the formation of autophagosomes [40]. The formation of autophagosome membranes is activated by the creation of the Becilin-1 complex. Becilin-1 also modulates activity, which is certainly autophagic [40,41]. Therefore, Becilin1 contributes to the growth of lipid bilayer membranes and the enlistment of other autophagy-related proteins. Especially, LC3II, ATG5, and ATG12 tend to be enlisted and provide stimulation for the development of autophagosomes.
The activity of autophagy mandates two ubiquitin-like reformation systems consisting of the ATG8 (LC3) reformation system and the ATG12-ATG5 reformation system. LC3 has been identified as the only mammalian protein with stable autophagosome membrane binding. ATG4 quickly shears the carboxyl terminus of the newly synthesized LC3 protein, resulting in the cytosolically localized LC3I. During ubiquitination processing, LC3I is changed to bind to PE located on the autophagosome membrane, resulting in membrane-bound LC3II that is confined within the autophagosome. The protein LC3II, which may be identified in autophagosomes and whose quantity is directly connected to the extent of autophagy, is one of the protein markers of autophagy. In response to ATG10, ATG7 activates ATG12, which then attaches to ATG5 to create the ATG12-ATG5 complex. The ATG5-ATG12 complex, acting as an E3 enzyme, stimulates the production of ATG8-PE during ubiquitin-binding processes. For autophagosome formation to occur, the ATG8-PE and ATG16-ATG5-ATG12 complexes must first be formed [42]. P62 serves as an autophagy feedback regulator by encasing and recognizing degraded substrates in the autophagosome, eventually declining as autophagy increases [43,44]. The versatile protein P62, also known as SQSTM1, is essential for signaling and selective autophagy. Specifically, P62 is an adaptor protein that interacts with LC3-II to direct ubiquitinated cargos toward autophagy-specific destruction [45]. Under typical physiological conditions, the regulator known as mTOR both activates and suppresses autophagy. The stimulation of mTOR may restrict the regulation of autophagy. When metabolic stress occurs, mTOR expression is downregulated, its activity is suppressed, and autophagy is triggered [46].
Consequently, this study also examined the autophagy-associated genes expression including ATG5, Beclin1, ATG12, P62, and mTOR; Beclin1, P62, and LC3II proteins expression; and the immunohistochemical expression of P62 and Beclin-1 proteins in the laminar tissue to investigate the changes in autophagy activity in the lamellae of the cow's hoof with OF overload-induced laminitis. This study observed a rise in Beclin-1, ATG5, and ATG12 genes expression and reduction in p62 and mTOR genes expression, a reduction in protein expression of P62 and LC3II, and increased protein expression of Beclin-1 within the laminar tissues with OF overload-induced bovine laminitis. However, the results of the immunohistochemistry analysis of P62 and Beclin-1 showed that the quantity of positive cells with Beclin-1 was increased, while the quantity of P62 positive cells decreased in the laminar tissue of laminitic cows. Similar observations were reported in the livers of dairy cattle with SARA [23], mildly obese livers [47], and the mammary glands of dairy cows with hyperketonemia [48]. This demonstrably showed that autophagy overexpression was induced in the laminar tissue with OF-induced dairy cow laminitis.
5. Conclusions
In conclusion, a model of acute laminitis in dairy cows was successfully established by the oligofructose overload method, and the OF group dairy cows showed characteristic clinical manifestations of acute laminitis. The findings of current study demonstrate that autophagy shows a role in the regulation of the pathogenesis of acute laminitis in dairy cows, which directly or indirectly lead to the damage of laminar tissue in dairy cows. These research findings suggest a solid theoretical basis and crucial knowledge for the sensible prevention as well as management of acute laminitis in dairy cows.
Author’s Contributions
M.A.H., H.B.W. conceived and conducted the experiments, analyzed the data, and wrote the manuscripts. J.F.D., L.T. and Z.X.H. performed some part of experiment. M.A.H. and J.F.D. evaluated the part of data. H.B.W. and Z.J.T. designed the experiments and participate in the conception and revised the manuscript. S.G.B and H.A. review and editing the English grammar of manuscript. All authors read and approved the final this manuscript.
Institutional Review Board Statement
This study and all the procedures were approved in accordance with the rules and regulations of Animal Ethical Review Committee (Approval No: SRM-13) at the Department of Veterinary Surgery, College of Veterinary Medicine, Northeast Agricultural University Harbin, P.R. China.
Data Availability Statement
All data generated or analyzed during the study are included in this published article. The datasets used and/or analyzed in the current study are available from the corresponding author on reasonable request.
Acknowledgments
This work was supported by the National Key R&D Program of China (Project No.2017YFD0502200) and Heilongjiang Provincial Funding for National Subjects (GX18B023). The funders had no role in the study’s design, data collection and analysis, decision to publish, or preparation of the manuscript.
Conflicts of Interest Statement
The authors declare no conflict of interest. The funders had no role in the design of the study; in the collection, analyses, or interpretation of data; in the writing of the manuscript, or in the decision to publish the results.
References
- Boosman, R.; Nemeth, F.; Gruys, E. Bovine laminitis: Clinical aspects, pathology and pathogenesis with reference to acute equine laminitis. Vet. Q. 1991, 13, 163–171. [Google Scholar] [CrossRef] [PubMed]
- Dolecheck, K.; Bewley, J. Animal board invited review: Dairy cow lameness expenditures, losses and total cost. Animal. 2018, 12, 1462–1474. [Google Scholar] [CrossRef] [PubMed]
- Kyaw-Tanner, M.; Pollitt, C.C. Equine laminitis: increased transcription of matrix metalloproteinase-2 (MMP-2) occurs during the developmental phase. Equine. Vet. J. 2004, 36, 221–225. [Google Scholar] [CrossRef] [PubMed]
- Vermunt, J. “Subclinical” laminitis in dairy cattle. N. Z. Vet. J. 1992, 40, 133–138. [Google Scholar] [CrossRef]
- Alvergnas, M.; Strabel, T.; Rzewuska, K.; Sell-Kubiak, E. Claw disorders in dairy cattle: effects on production, welfare and farm economics with possible prevention methods. Livest. Sci. 2019, 222, 54–64. [Google Scholar] [CrossRef]
- Potterton, S.L.; Bell, N.J.; Whay, H.R.; Berry, E.A.; Atkinson, O.C.; Dean, R.S.; Main, D.C.; Huxley, J.N. A descriptive review of the peer and non-peer reviewed literature on the treatment and prevention of foot lameness in cattle published between 2000 and 2011. Vet. J. 2012, 193, 612–616. [Google Scholar] [CrossRef] [PubMed]
- Greenough, P.R. Bovine Laminitis and Lameness: A Hands on Approach. Philadelphia, PA: Elsevier Health Sciences. 2007.
- Tian, M.Y.; Fan, J.H.; Zhuang, Z.W.; Dai, F.; Wang, C.Y.; Hou, H.T.; Ma, Y.Z. Effects of silymarin on p65 NF-κB, p38 MAPK and CYP450 in LPS-induced hoof dermal inflammatory cells of dairy cows. BMC Vet. Res. 2019, 15, 1–8. [Google Scholar] [CrossRef] [PubMed]
- Thoefner, M.B.; Pollitt, C.C.; Van-Eps, A.W.; Milinovich, G.J.; Trott, D.J.; Wattle, O.; Andersen, P.H. Acute bovine laminitis: a new induction model using alimentary oligofructose overload. J. Dairy. Sci. 2004, 87, 2932–2940. [Google Scholar] [CrossRef]
- Danscher, A.M.; Enemark, J.M.D.; Telezhenko, E.; Capion, N.; Ekstrom, C.T.; Thoefner, M.B. Oligofructose overload induces lameness in cattle. J. Dairy. Sci. 2009, 92, 607–616. [Google Scholar] [CrossRef]
- Thoefner, M.B.; Wattle, O.; Pollitt, C.C.; French, K.R.; Nielsen, S.S. Histopathology of oligofructose-induced acute laminitis in heifers. J. Dairy. Sci 2005, 88, 2774–2782. [Google Scholar] [CrossRef]
- Mendes, H.M.; Casagrande, F.P.; Lima, I.R.; Souza, C.H.; Gontijo, L.D.; Alves, G.E.; Vasconcelos, A.C.; Faleiros, R.R. Histopathology of dairy cows' hooves with signs of naturally acquired laminitis. Pesquisa. Vet. Brasil. 2013, 33, 613–619. [Google Scholar] [CrossRef]
- Sousa, R.D.S.; Oliveira, F.L.C.; Dias, M.R.B.; Minami, N.S.; Amaral, L.; Santos, J.A.A.D.; Barreto, J.R.A.; Minervino, A.H.H.; Ortolani, E.L. Characterization of oligofructose-induced acute rumen lactic acidosis and the appearance of laminitis in zebu cattle. Animals. 2020, 10, 429. [Google Scholar] [CrossRef]
- Leise, B.S.; Faleiros, R.R.; Watts, M.; Johnson, P.J.; Black, S.J.; Belknap, J.K. Laminar inflammatory gene expression in the carbohydrate overload model of equine laminitis. Equine. Vet. J. 2011, 43, 54–61. [Google Scholar] [CrossRef] [PubMed]
- Dern, K.; van-Eps, A.; Wittum, T.; Watts, M.; Pollitt, C.; Belknap, J. Effect of continuous digital hypothermia on lamellar inflammatory signaling when applied at a clinically-relevant timepoint in the oligofructose laminitis model. J. Vet. Int. Med. 2018, 32, 450–458. [Google Scholar] [CrossRef]
- Singh, R.; Cuervo. A. M. Autophagy in the cellular energetic balance. Cell. Metab. 2011, 13, 495–504. [Google Scholar] [CrossRef] [PubMed]
- Dikic, I.; Elazar, Z. Mechanism and medical implications of mammalian autophagy. Nat. Rev. Mol. Cell Biol. 2018, 19, 349–364. [Google Scholar] [CrossRef]
- Shen, T.; Xu, F.; Fang, Z.; Loor, J.J.; Ouyang, H.; Chen, M.; Jin, B.; Wang, X.; Shi, Z.; Zhu, Y.; Liang, Y. Hepatic autophagy and mitophagy status in dairy cows with subclinical and clinical ketosis. J. Dairy. Sci. 2021, 104, 4847–4857. [Google Scholar] [CrossRef]
- Chen, M.; Loor, J.J.; Zhai, Q.; Liang, Y.; Yu, H.; Du, X.; Shen, T.; Fang, Z.; Shi, Z.; Wang, X.; Zhu, Y. Enhanced autophagy activity in liver tissue of dairy cows with mild fatty liver. J. Dairy. Sci. 2020, 103, 3628–3635. [Google Scholar] [CrossRef]
- Rabinowitz, J.D.; White, E. Autophagy and metabolism. Science 2010, 330, 1344–1348. [Google Scholar] [CrossRef]
- Levine, B.; Kroemer, G. Autophagy in the pathogenesis of disease. Cell 2008, 132, 27–42. [Google Scholar] [CrossRef]
- AM, M.N.L.B.C.; Klionsky, D.J. Autophagy fights disease through cellular self-digestion. Nature. 2008, 451, 1069–1075. [Google Scholar]
- Zhang, H.; Xue, Y.; Xie, W.; Wang, Y.; Ma, N.; Chang, G.; Shen, X. Subacute ruminal acidosis downregulates FOXA2, changes oxidative status, and induces autophagy in the livers of dairy cows fed a high-concentrate diet. J. Dairy. Sci. 2023, 106, 2007–2018. [Google Scholar] [CrossRef] [PubMed]
- Sprecher, D.E.; Hostetler, D.E.; Kaneene, J.B. A lameness scoring system that uses posture and gait to predict dairy cattle reproductive performance. Theriogenology. 1997, 47, 1179–1187. [Google Scholar] [CrossRef] [PubMed]
- Edmonson, A.J.; Lean, I.J.; Weaver, L.D.; Farver, T.; Webster, G. A body condition scoring chart for Holstein dairy cows. J. Dairy. Sci. 1989, 72, 68–78. [Google Scholar] [CrossRef]
- Ding, J.; Li, S.; Jiang, L.; Li, Y.; Zhang, X.; Song, Q.; Hayat, M.A.; Zhang, J.T.; Wang, H. Laminar inflammation responses in the oligofructose overload induced model of bovine laminitis. Front. Vet. Sci. 2020, 7, 351. [Google Scholar] [CrossRef] [PubMed]
- Ding, J.; Shi, M.; Wang, L.; Qi, D.; Tao, Z.; Hayat, M.A.; Liu, T.; Zhang, J.T.; Wang, H. Gene Expression of Metalloproteinases and Endogenous Inhibitors in the Lamellae of Dairy Heifers With Oligofructose-Induced Laminitis. Front. Vet. Sci. 2020, 7, 597827. [Google Scholar] [CrossRef] [PubMed]
- Hayat, M.A.; Ding, J.; Li, Y.U.; Zhang, X.; Zhang, J.I.; Li, S.; Wang, H.B. Determination of the activity of selected antioxidant enzymes during bovine laminitis, induced by oligofructose overload. Med Weter. 2020, 76, 289–295. [Google Scholar] [CrossRef]
- Nilsson, S.A. Clinical, morphological and experimental studies of laminitis in cattle. Acta. Vet. Scand. 1963, 4, 1–304. [Google Scholar]
- Plaizier, J.C.; Khafipour, E.; Li, S.; Gozho, G.N.; Krause, D.O. Subacute ruminal acidosis (SARA), endotoxins and health consequences. Animal. Feed. Ence. Technol. 2012, 172, 9–21. [Google Scholar] [CrossRef]
- Khafipour, E.; Krause, D.O.; Plaizier, J.C. A grain-based subacute ruminal acidosis challenge causes translocation of lipopolysaccharide and triggers inflammation. J. Dairy. Ence. 2009, 92, 1060–1070. [Google Scholar] [CrossRef]
- Zhao, C.; Liu, G.; Li, X.; Guan, Y.; Wang, Y.; Yuan, X.; Sun, G.; Wang, Z.; Li, X. Inflammatory mechanism of Rumenitis in dairy cows with subacute ruminal acidosis. BMC Vet. Res. 2018, 14, 1–8. [Google Scholar] [CrossRef] [PubMed]
- Hidalgo, A.I.; Carretta, M.D.; Alarcón, P.; Manosalva, C.; Müller, A.; Navarro, M.; Hidalgo, M.A.; Kaehne, T.; Taubert, A.; Hermosilla, C.R.; Burgos, R.A. Pro-inflammatory mediators and neutrophils are increased in synovial fluid from heifers with acute ruminal acidosis. BMC Vet Res. 2019, 15, 1–10. [Google Scholar] [CrossRef] [PubMed]
- Cao, W.; Li, J.; Yang, K.; Cao, D. An overview of autophagy: Mechanism, regulation and research progress. Bulletin. Du. Cancer. 2021, 108, 304–322. [Google Scholar] [CrossRef] [PubMed]
- Mizushima, N.; Levine, B.; Cuervo, A.M.; Klionsky, D.J. Autophagy fights disease through cellular self-digestion. Nature. 2008, 451, 1069–1075. [Google Scholar] [CrossRef]
- Levine, B.; Klionsky, D.J. Development by self-digestion: molecular mechanisms and biological functions of autophagy. Develop. Cell. 2004, 6, 463-–477. [Google Scholar] [CrossRef]
- Meijer, A.; Codogno, P. Regulation and role of autophagy in mammalian cells. Int. J. Biochem. Cell Biol. 2004, 36, 2445–2462. [Google Scholar] [CrossRef]
- Kaur, S.; Changotra, H. The beclin 1 interactome: Modification and roles in the pathology of autophagy-related disorders. Biochimie 2020, 175, 34–49. [Google Scholar] [CrossRef]
- Wang, S.; Wuniqiemu, T.; Tang, W.; Teng, F.; Bian, Q.; Yi, L.; Qin, J.; Zhu, X.; Wei, Y.; Dong, J. Luteolin inhibits autophagy in allergic asthma by activating PI3K/Akt/mTOR signaling and inhibiting Beclin-1-PI3KC3 complex. Int. Immunopharmacol. 2021, 94, 107460. [Google Scholar] [CrossRef]
- Kim, J.; Kim, Y.C.; Fang, C.; Russell, R.C.; Kim, J.H.; Fan, W.; Liu, R.; Zhong, Q.; Guan, K.L. Differential regulation of distinct Vps34 complexes by AMPK in nutrient stress and autophagy. Cell. 2013, 152, 290–303. [Google Scholar] [CrossRef]
- Russell, R.C.; Tian, Y.; Yuan, H.; Park, H.W.; Chang, Y.Y.; Kim, J.; Kim, H.; Neufeld, T.P.; Dillin, A.; Guan, K.L. ULK1 induces autophagy by phosphorylating Beclin-1 and activating VPS34 lipid kinase. Nature. Cell. Bio. 2013, 15, 741–750. [Google Scholar] [CrossRef]
- Hanada, T.; Noda, N.N.; Satomi, Y.; Ichimura, Y.; Fujioka, Y.; Takao, T.; Inagaki, F.; Ohsumi, Y. The Atg12-Atg5 conjugate has a novel E3-like activity for protein lipidation in autophagy. J. Bio. Chemi. 2007, 282, 37298–37302. [Google Scholar] [CrossRef]
- He, C.; Klionsky, D.J. Regulation mechanisms and signaling pathways of autophagy. Ann. Rev. Gen. 2009, 43, 67–93. [Google Scholar] [CrossRef] [PubMed]
- Hurley, J.H.; Young, L.N. Mechanisms of autophagy initiation. Ann. Rev. Bio. 2017, 86, 225–244. [Google Scholar] [CrossRef] [PubMed]
- Gonzalez-Rodriguez, A.; Mayoral, R.; Agra, N.; Valdecantos, M.P.; Pardo, V.; Miquilena-Colina, M.E.; Vargas-Castrillón, J.; Lo-Iacono, O.; Corazzari, M.; Fimia, G.M.; Piacentini, M. Impaired autophagic flux is associated with increased endoplasmic reticulum stress during the development of NAFLD. Cell. Death. Disease. 2014, 5, e1179–e1179. [Google Scholar] [CrossRef]
- Debnath, J.; Walker, S.J.; Brugge, J.S. Akt activation disrupts mammary acinar architecture and enhances proliferation in an mTOR-dependent manner. J. Cell. Bio. 2003, 163, 315–326. [Google Scholar] [CrossRef] [PubMed]
- Chen, M.; Loor, J.J.; Zhai, Q.; Liang, Y.; Yu, H.; Du, X.; Shen, T.; Fang, Z.; Shi, Z.; Wang, X.; Zhu, Y. Enhanced autophagy activity in liver tissue of dairy cows with mild fatty liver. J. Dairy. Sci. 2020, 103, 3628–3635. [Google Scholar] [CrossRef]
- Li, X.; Li, G.; Du, X.; Sun, X.; Peng, Z.; Zhao, C.; Xu, Q.; Abdelatty, A.M.; Mohamed, F.F.; Wang, Z.; Liu, G. Increased autophagy mediates the adaptive mechanism of the mammary gland in dairy cows with hyperketonemia. J. Dairy. Sci. 2020, 103, 2545–2555. [Google Scholar] [CrossRef]
Disclaimer/Publisher’s Note: The statements, opinions and data contained in all publications are solely those of the individual author(s) and contributor(s) and not of MDPI and/or the editor(s). MDPI and/or the editor(s) disclaim responsibility for any injury to people or property resulting from any ideas, methods, instructions or products referred to in the content. |
© 2023 by the authors. Licensee MDPI, Basel, Switzerland. This article is an open access article distributed under the terms and conditions of the Creative Commons Attribution (CC BY) license (http://creativecommons.org/licenses/by/4.0/).
Copyright: This open access article is published under a Creative Commons CC BY 4.0 license, which permit the free download, distribution, and reuse, provided that the author and preprint are cited in any reuse.


