1. Introduction
The coal reserves in eastern China are on the decrease, and the mining depth and difficulty in mining there are becoming severe. Because they feature simple structures, rich reserves [
1], and shallow burial depths, the western coal fields have become key mining areas in China [
2]. Compared with the strata in the east, the strata in the western mining areas feature poor cementation, low strength, and easy disintegration. The bulk of the overburden strata can hardly be seen after coal mining, and the discontinuous development of deformations in the strata is obvious. Breakages and caving of the rock strata near the coal seam quickly pass to the upper strata, and water-carrying fracture zones are clearly developed. When mining-induced fractures develop into bedrock aquifers or even surface aquifers, water from the aquifers will flow downward through mining-induced fractures [
3], thus aggravating the negative impacts caused by water shortages in mining areas and ecologically fragile areas (such as groundwater loss, land desertification, etc.) [
4,
5].
To solve these problems, experts in the field have used many methods to study the movements of rock strata, laws of fracture formation in mining areas [
6,
7,
8], and fracture laws [
9]. J. C. Wei (
2017) [
10] used physical modeling and numerical calculations to study the formation of mining-induced fracture zones. He found that the maximum height of a fracture zone was logarithmically related to the depth of a coal mine and that the maximum height of a fracture zone was 27 times the thickness of the mined coal seam, which is much greater than in mining areas in eastern China. Based on the measured data and simulation results, S. Y. Xu et al. (2020) [
11] obtained the migration and failure characteristics of thick uncemented overburden after mining. They found that the subsidence of the caving zone showed a symmetrical distribution along the course, while the subsidence of the broken zone and the bending zone was inclined to one side. Based on the geological and hydrogeological conditions of a mining area, Liu (2012) [
12] created a refined model for detailing the rock texture, rock properties, and the impacts of mining activities in the mining area, analyzed the law of evolution of groundwater seepage after mining, and predicted the water inrush with the roof of the working face. Xu (2008) [
13] compared the distribution characteristics of surface fractures before and after mining. By monitoring the movement of overburden strata and the groundwater level, the deformation of a cemented overburden aquifer was analyzed, and the deformation limit was estimated.
These studies evidently signal that extensive mining in western China will inevitably cause the transfer of water resources, damage the water storage structures of aquifers, and cause the seepage or loss of groundwater. Meanwhile, China has strengthened its protection of water resources in the ecologically fragile areas of western China, so the concepts of "water-conservation mining" [
14] and "green mining" [
15] have increasingly attracted the attention of scholars. Therefore, many experts have proposed specialized theories and methods [
16,
17,
18,
19,
20] in which underground reservoir [
21] theories are easily applied in practice. Cavities within rocks at goafs that are left after coal mining were used for water storage. Artificial dam bodies were used to connect coal security pillars and form reservoir dams. Facilities for transporting mine water into reservoirs and for water intake were constructed. Water that was purified naturally in goaf rocks served as the source of water for an underground mine reservoir [
22]. Based on these studies, it is clear that good knowledge of the distribution characteristics of overburden fractures and the law of water transport in weakly cemented strata are the keys for achieving water conservation in mining and underground reservoir construction [
23].
With the example of the 52505 working face of the Daliuta coal mine, similar conditions for overburden strata were simulated with the Water Inrush and Sand Burst Disaster Simulation System [
24] with the aim of understanding the fracture distribution characteristics and the law of water transport in the strata under the coupling effect of the stress field and seepage field. Based on the results of a COMSOL numerical simulation, the law of changes in seepage inside an overburden was further studied to offer guidance for water-preserved mining [
25,
26] in Western China, as well as for the selection and maintenance of underground reservoirs there.
2. Engineering Background
The overburden strata at the 52505 working face of the Daliuta coal mine mainly comprise middle and lower Jurassic Series Yanan Formations; the overburden thickness ranges from 70 meters to 200 meters, and its burial depth ranges from 82 meters to 209 meters; there are no fault structures within the working face. The average thickness of the coal seam is 7.2 meters, and it has an inclination of 1 to 3 degrees. The aquifer of the working face consists of overlying middle and lower Jurassic Series Yanan Formation J1-2y, which contains fracture-confined water. The aquifer is one of sandstone with poor water yield properties. The aquifer is thick, and part of its area is rich in well-developed fractures that can yield much water. During the excavation of the roadway at the open-off cut of the working face, the top side had a large amount of water, the normal water inflow was expected to be 200 m
3/h, and the maximum water inflow was 800m
3/h. This is unfavorable for the recovery of the working face. The overburden at the working face’s open-off cut is adjacent to the Boniuchuan area, and it had considerable roof-water spray during the excavation. The distribution characteristics of the overlying strata are shown in
Table 1.
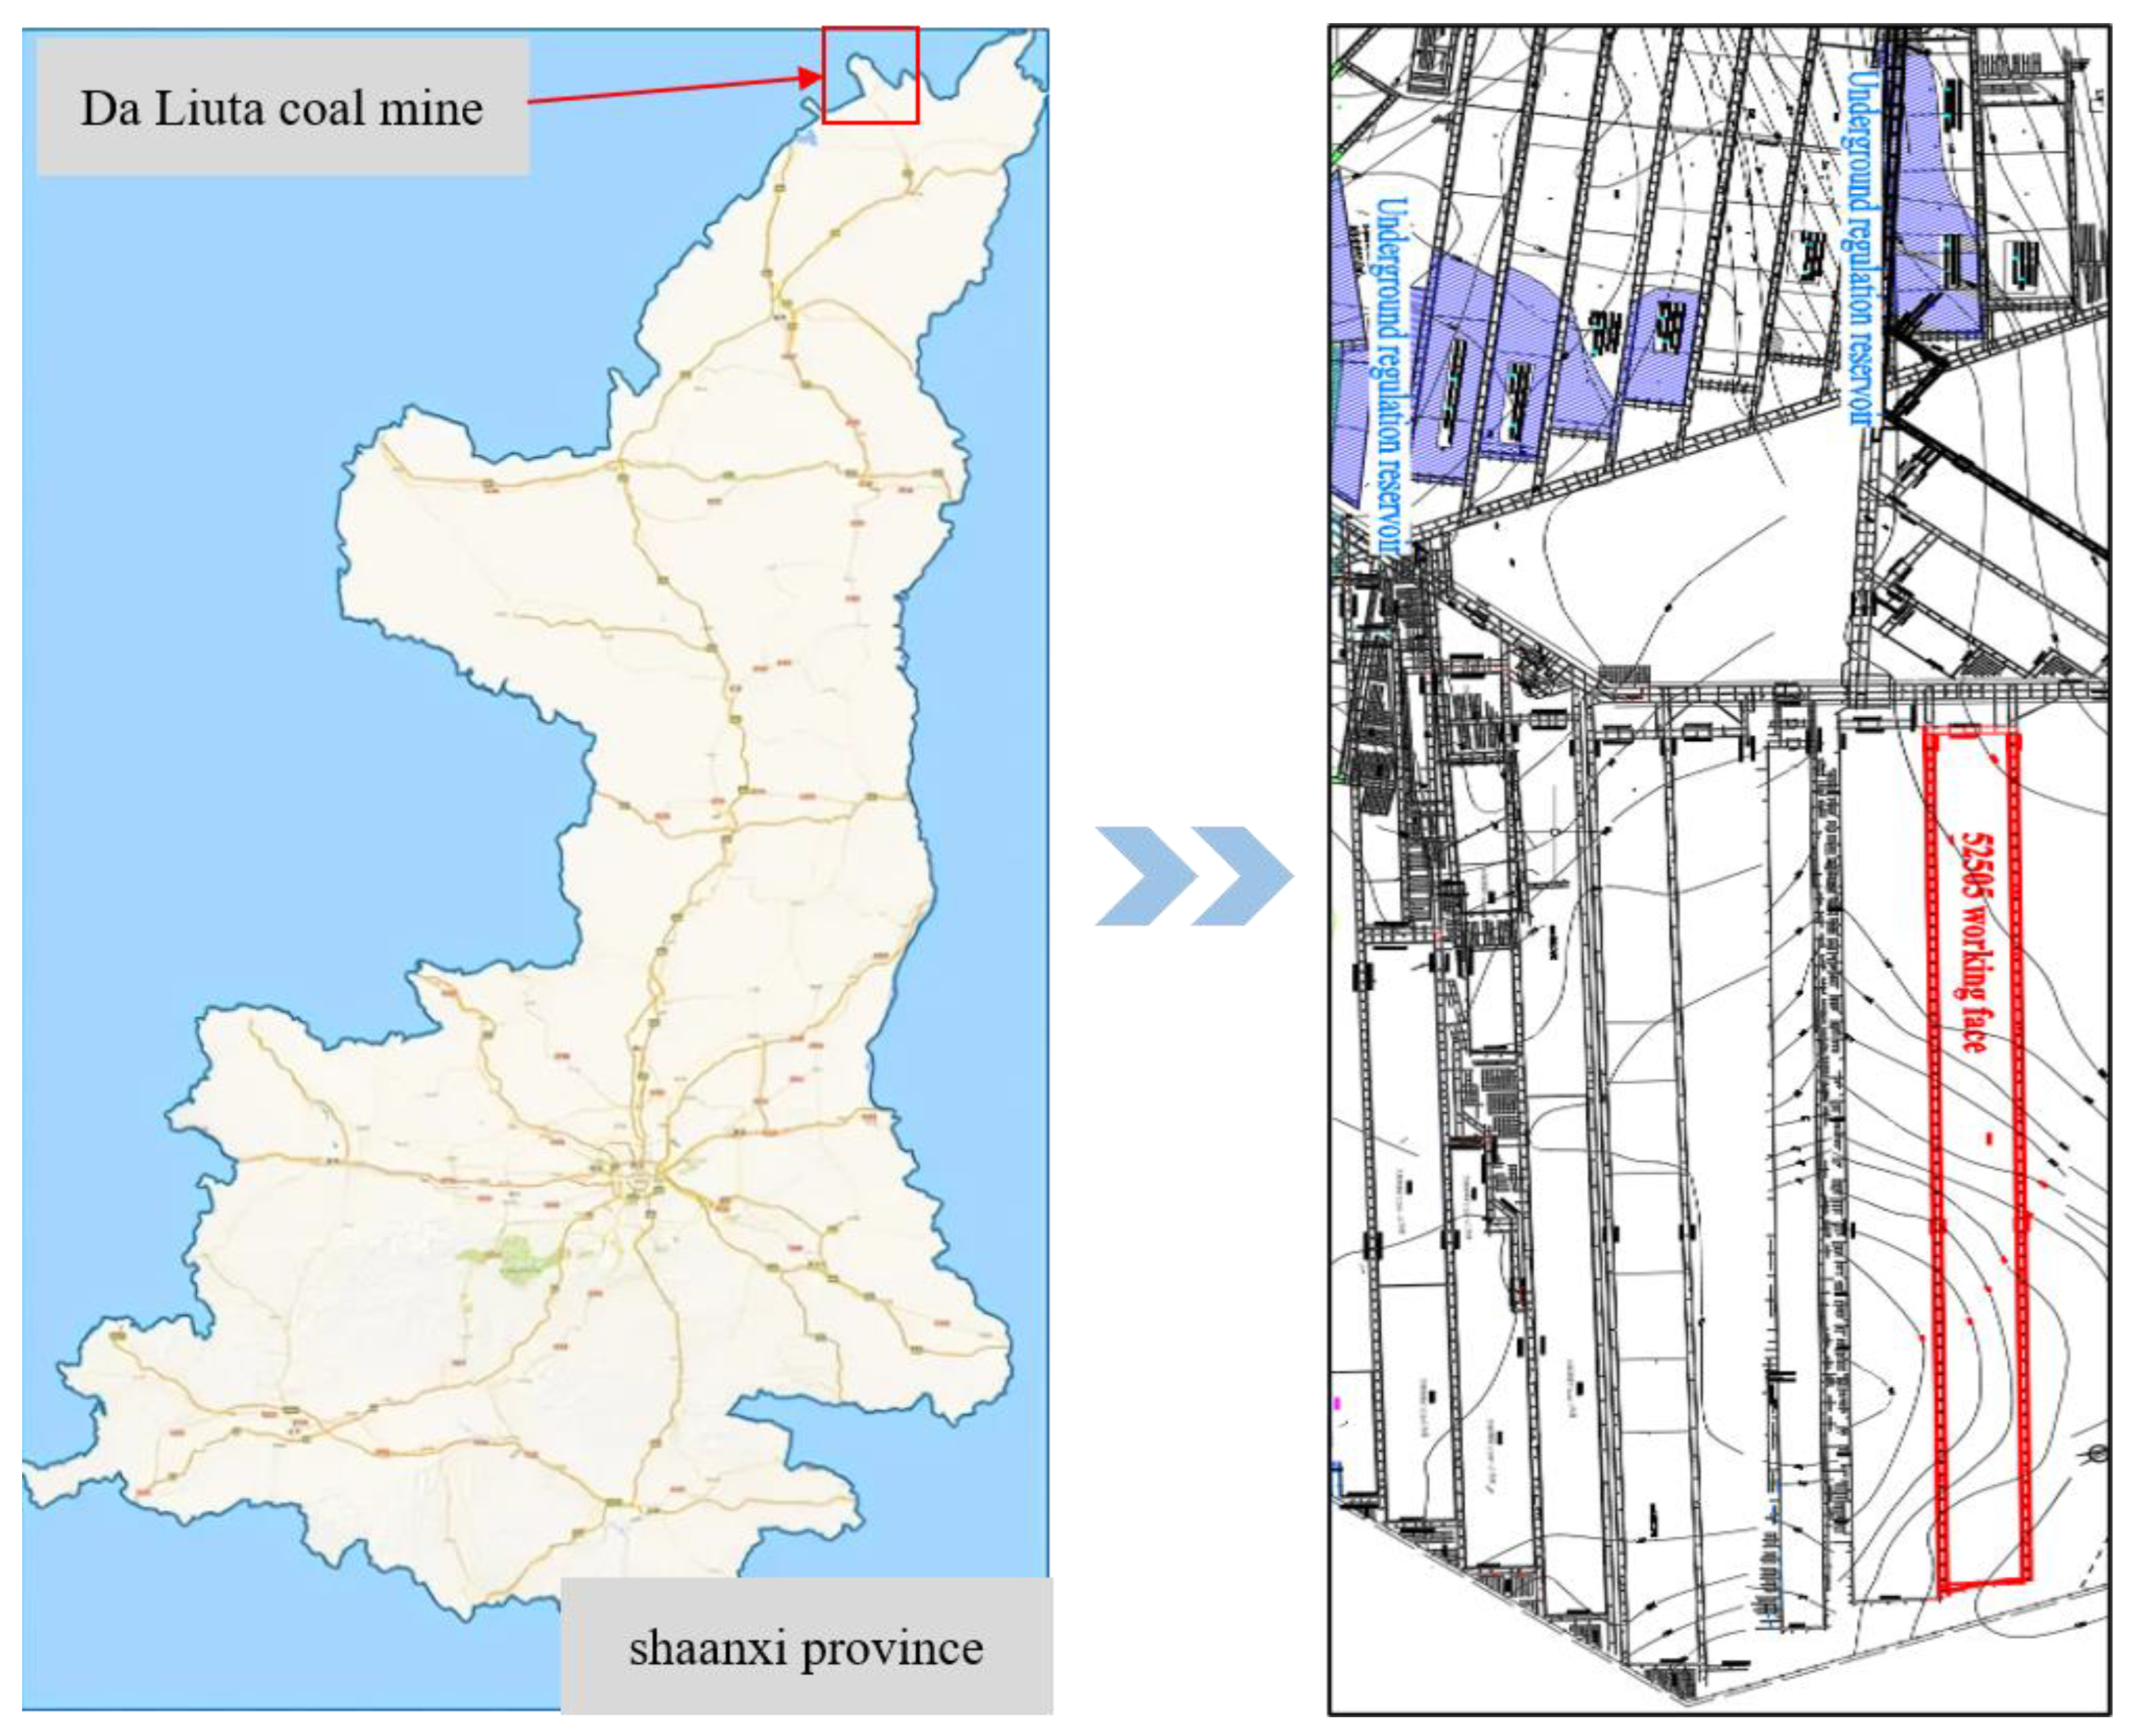
Figure 1.
Diagram of the orientation of the mining area’s working face and underground reservoir.
Figure 1.
Diagram of the orientation of the mining area’s working face and underground reservoir.
Given these geological conditions, the recovery rate, the high cost, and the impact on the environment, existing water-conserving coal mining technologies are inapplicable in the Daliuta coal mine due to its shallow burial depth and considerable mining height because if the mining height is restricted, a coal column will be left, and the excavated area will be filled. To alleviate the contradiction between the protection of water resources in coal mining and the high demand for coal resources, a new mining technology has been adopted in the Daliuta coal mine by using goafs as underground reservoirs for water purification and recycling. The goaf of the 52505 working face is used as an underground reservoir to alleviate the loss of groundwater between the working face’s goaf overburden and the northern strata. Therefore, it is very important to study the fracture distribution and the law of water transport in water-conducted fractures for the site selection, construction, and maintenance of underground regulation reservoirs.
3. Experimental Design
3.1. Equipment Selection
In this study, the Mining Overburden Water Inrush and Sand Collapse Disaster Simulation System was used for testing, as shown in
Figure 2. The test system mainly consisted of a test bench, pressurized water tank, flow system, servo-controlled displacement system, energy storage tank, and other systems. The test bench of the simulation system was 1200 mm in length, 400 mm in width, and 700 mm in height. The energy storage tank was cylindrical and had an effective volume of 0.07 m
3. The simulation system could be used for the real-time monitoring and acquisition of the displacement, load, water pressure, and water quantity during tests. The data acquisition frequency settings were enabled, and the default acquisition frequency was 10 times per second. The dual-control servo system enabled the control of the water pressure and water quantity ① to provide a stable water supply for the pressurized water tank and ② to maintain a constant water pressure in the pressurized water tank. The dual-control servo system was able to provide a maximum water pressure of 0.8 mpa, with an accuracy of 0.01 mpa; the maximum flow rate was 150L/h, with an accuracy of ±1.0%. A pressure head and a pressurized water tank were arranged above the test bench, and the servo-controlled displacement system lowered the pressure head to the test bench with an adjustment so that the test bench would form a closed space. The pressurized water tank was connected with the water storage tank by a high-pressure hose, and water was injected into the model at a constant pressure of 0.1 mpa through a hydraulic system to fill the test model with permeable water.
Given the sealing requirements for the test bench and the impact of the properties of weakly cemented strata, this test was used to simulate on-site mining with a pullable steel plate. The artificial mine was replaced with a pullable steel plate, which allowed the spatial structure of the overburden strata, internal water-conducted fractures, and fluid migration pathways to be naturally formed under the action of mining-induced force and water pressure. A transparent tempered glass plate was installed at the front of the test bench, which enabled intuitive observation of the whole process of overburden deformation and failure, crack development and expansion, and water flow migration in the working face of the mine.
3.2. Identification of similar materials
Presently, in most traditional simulations, aggregates of river sand, gypsum, blanc fixe, and iron powder are mixed with auxiliary adjusting materials, such as quartz, lime, alcohol, and clay, in certain proportions [
27,
28]. These materials are easily softened or deformed and disintegrated when they are exposed to water, and their original physical and mechanical properties are damaged. Thus, they cannot meet the requirements of fluid–structure coupling tests [
24]. By referring to the literature [
3], river sand, paraffin, calcium carbonate, hydraulic oil, and petroleum jelly were selected to constitute similar materials in this test, and the properties of each component are shown in
Table 2.
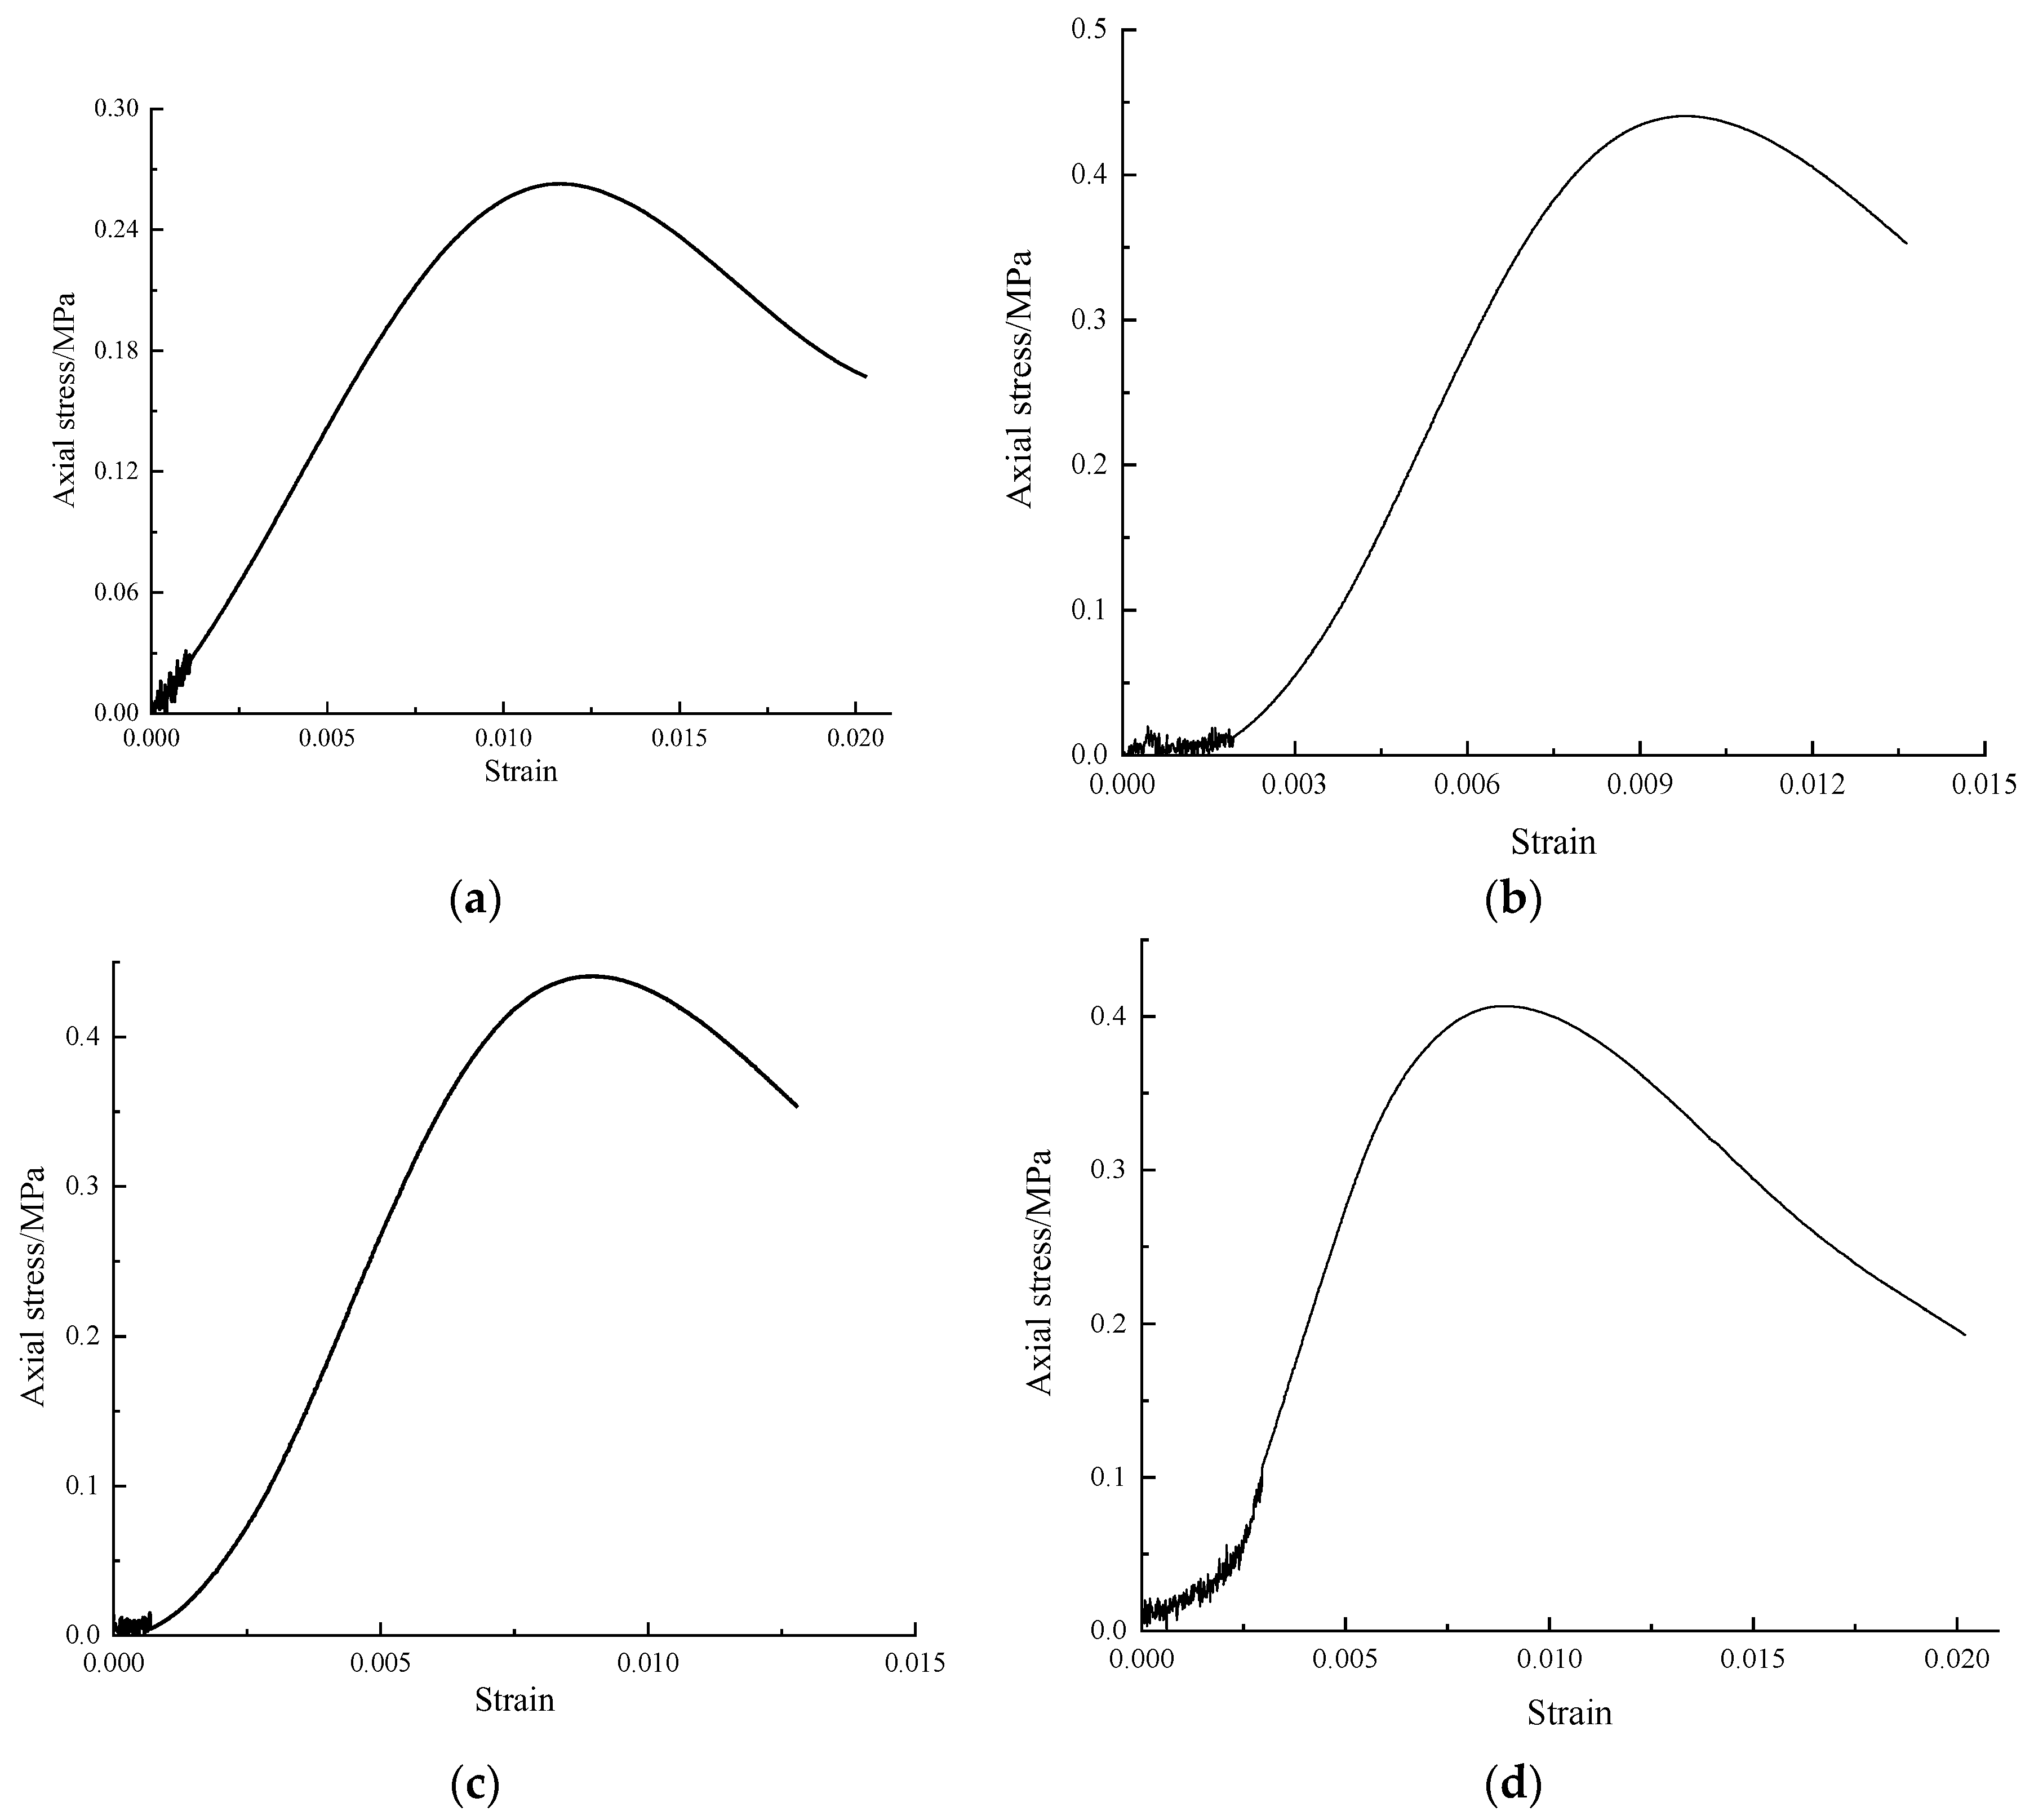
Immersion and infiltration tests were performed on specimens made of similar materials, and the results showed the expected decrease in compressive strength (
Figure 3). Meanwhile, the proportions of these similar materials were determined as follows: sand:paraffin = 40:0.5 to 1.5; calcium carbonate:vaseline:hydraulic oil = 1:0.8 to 1.2:0.8 to 1.3. The compressive strength of these materials ranged from 0.04 MPa to 0.6 MPa, and their permeability coefficients ranged from 2.87×10
−7 to 9.37×10
−5 cm/s. The proportions of these components needed to make them similar to the rock strata were determined based on the tested similarity ratio and substantial laboratory test results. The mechanical properties of these materials were similar to those of the actual roof rock, and they fit well with the low strength and non-hydrophilicity required for the test.
3.3. Design of the Experimental Model
3.3.1. Experimental Design
The working face of the Daliuta coal mine was tilted, with a width of 301.3 meters, an advancement distance of 4268.8 meters, and a designed height of 6.7 meters (
; the reader is referred to the geological and mining conditions of the working face and the effective bench size of the simulation system (length:width:height = 1200:400:700 mm)). Based on the theory of the similarity between the physical model and the actual geological situation of the study area, the similarity ratios were determined [
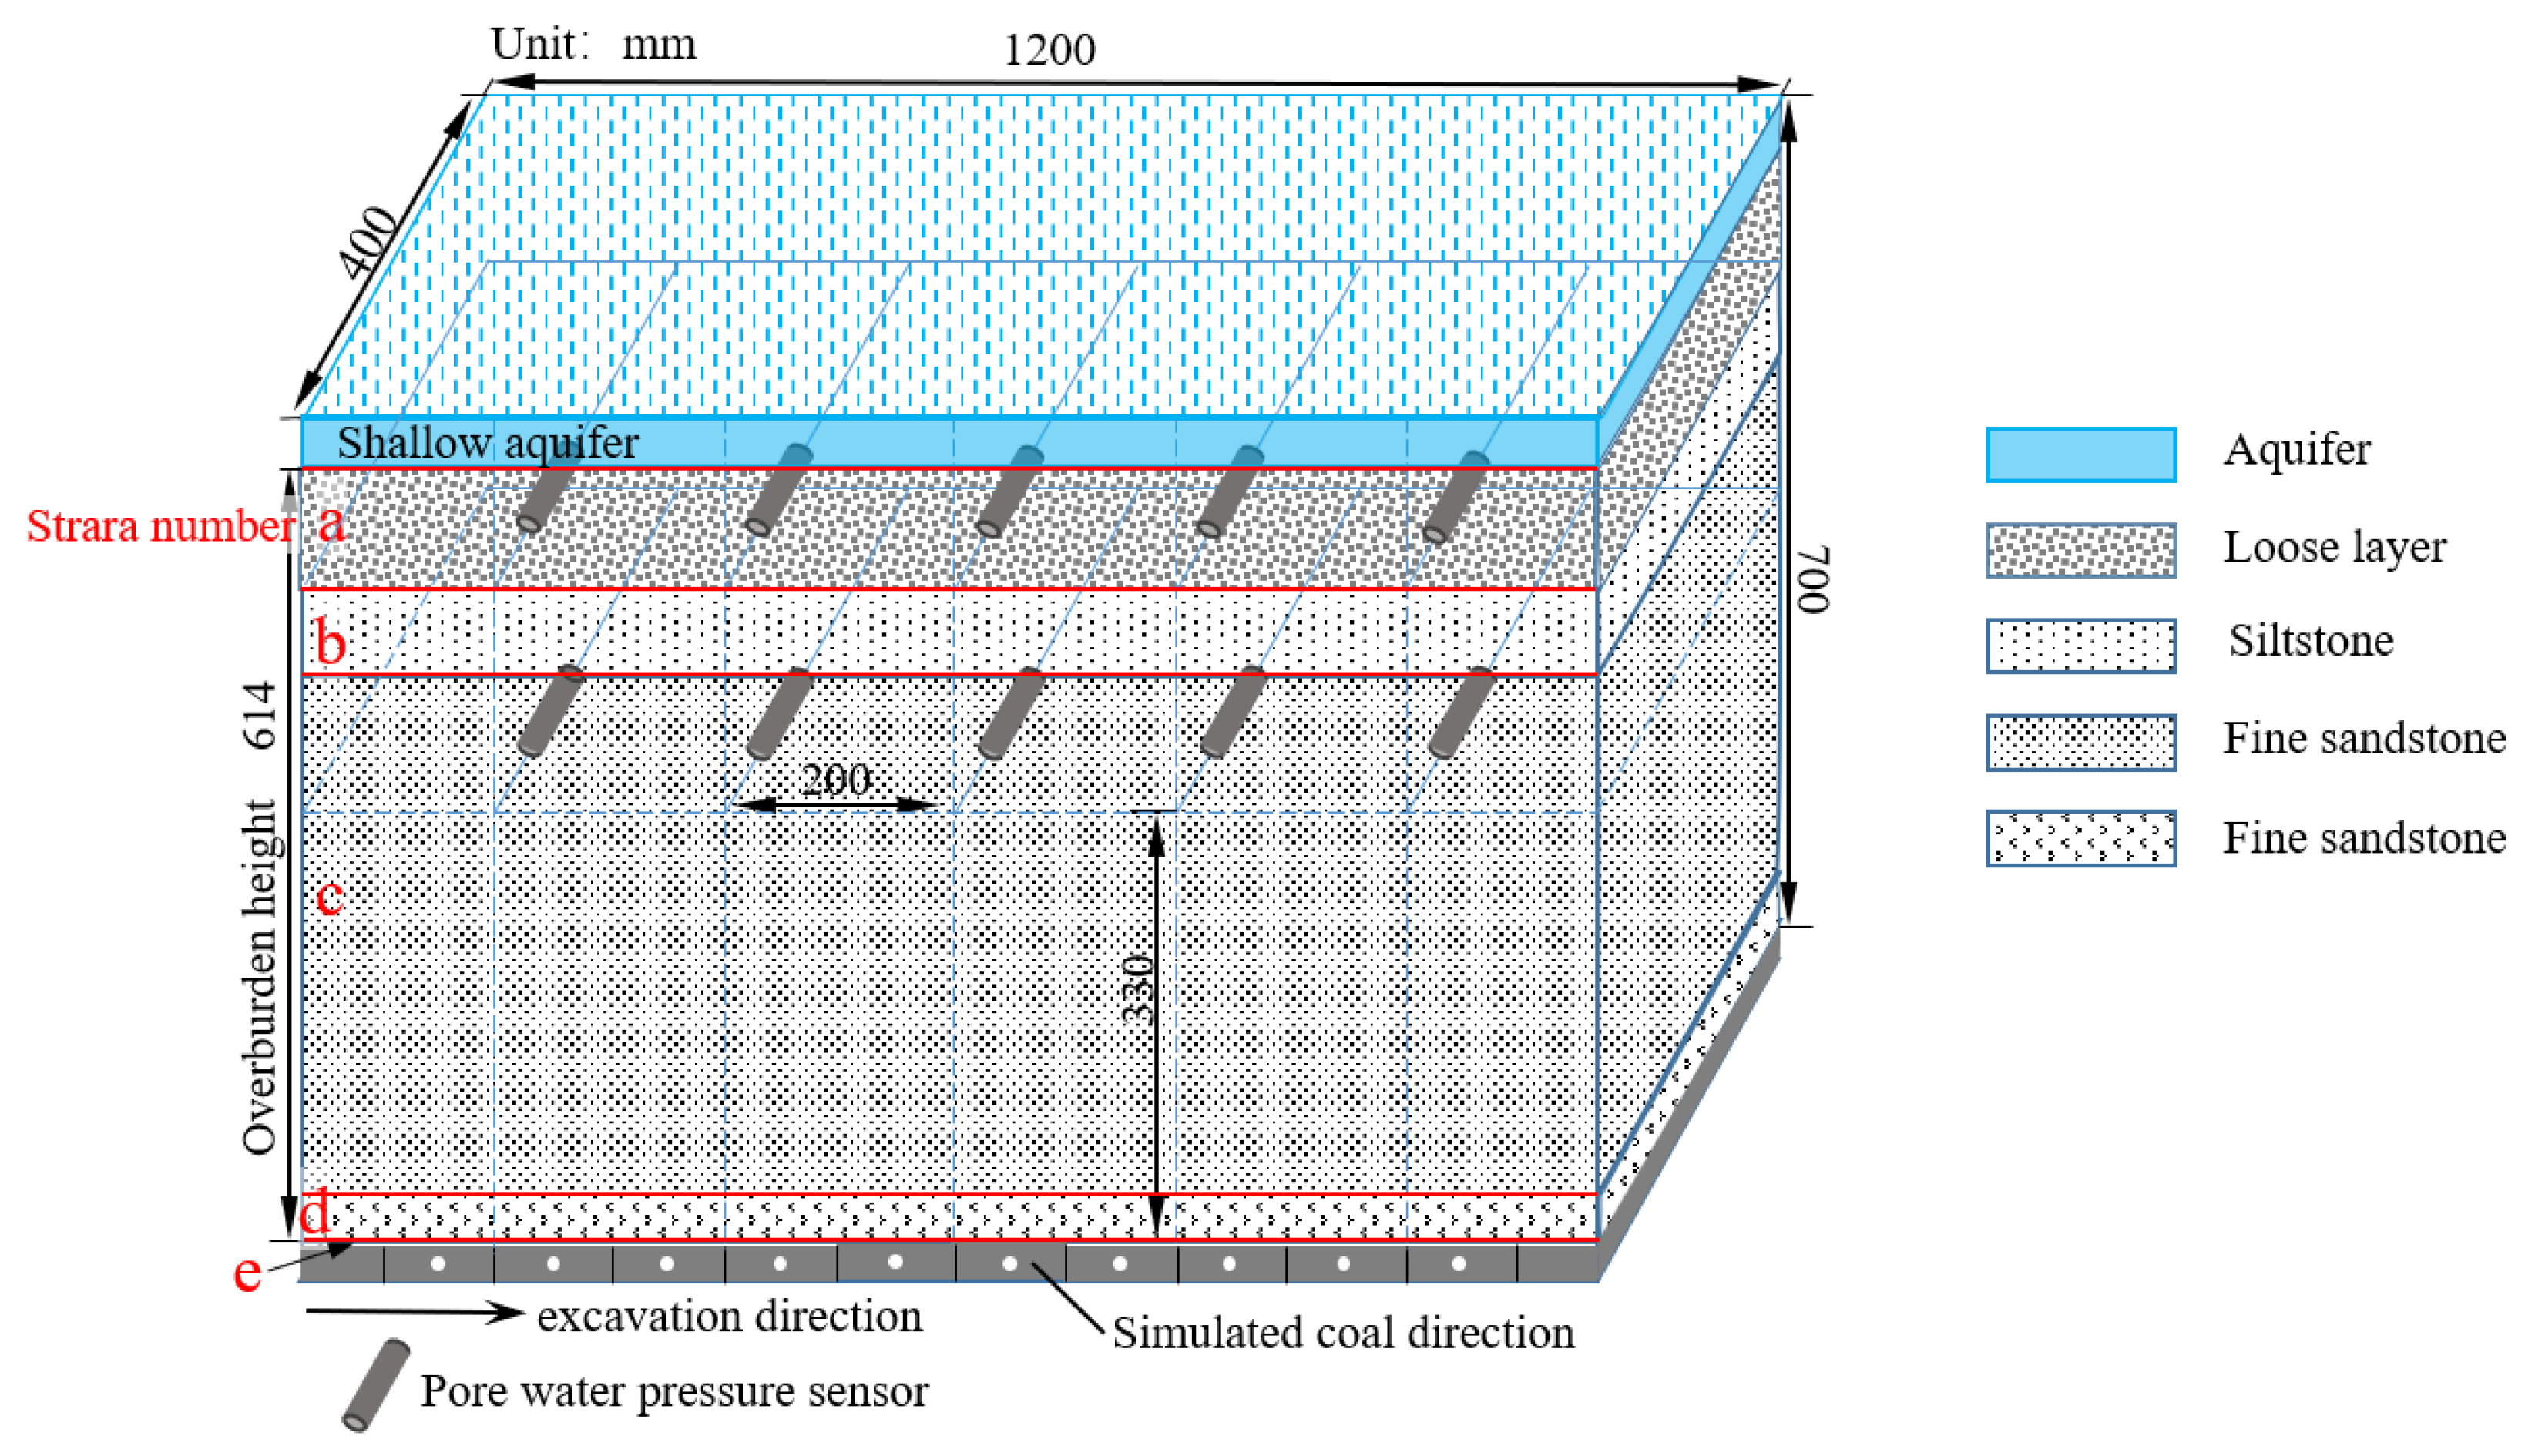
29]. Given the geometric similarity coefficient of this test, four strata (b to e) and one loose water-bearing sand layer (a) were laid upward on the roof of a coal seam. To eliminate the boundary effect of the test model, a 73 mm×400 mm pullable steel plate was placed on each side. A pullable steel plate with a size of 1200 mm×30 mm was placed on the back of the model in the tilting direction, and no operations thereof were used during the test. The relevant parameters and conditions during the test are shown in
Table 3.
Figure 4 shows a simplified 3D model of the rock strata, where the overburden strata of the working face mainly consisted of four layers. Layer A consisted of the uncemented formation, aeolian sand, and sandy clay. The layer thickness was 30 meters, its density was 1960 kg/m
3, its compressive strength was 3.88 mpa, its elastic modulus was 0.4 gpa, and its Poisson ratio was 0.27. According to the theory of the simulation's similarity, the heights of each layer in the simulation were set to 10 cm, 6.67 cm, 40 cm, 4.23 cm, and 0.43 cm. The ratios of the components (sand, paraffin, petroleum jelly, and calcium carbonate) in each simulated layer were 40:0.5:1:1, 40:0.8:1:1, 40:1.2:1:1, 40:0.8:1:1, and 40:0.8:1:1 (mass ratio).
In the model, 10 pore water pressure sensors (P1 to P10) were arranged according to the test design. The BS-1 resistance strain pressure sensor that was used for pore the measurement of water pressure had a length of 85 mm and a radius of 32 mm. P1 to P5 were arranged in the b-1 layer of siltstone; P6 to P10 were arranged in the d-6 layer of fine siltstone. The spacing between neighboring sensors was 200 mm, and the distance from the sensors to the edge was 200 mm. The details of the sensor arrangement are shown in
Figure 4.
3.3.2. Model Arrangement
(1) Before the arrangement of the model, the pullable steel plate that was used for the coal seam simulation was reset, and the water pressure sensors were placed in the experimental chamber through the grooves on each side. The experimental chamber was sealed with a transparent glass plate.
(2) The paraffin, hydraulic oil, petroleum jelly, and other raw materials required for their similarity were weighed and poured into a constant-temperature mixer together with sand; then, they were heated to 80 degrees Centigrade and stirred while heating.
(3) They were stirred well before being poured into the test bench to create a pavement. Once the pavement comprising the materials for each layer was completed, they were artificially compacted. Every pair of neighboring layers was separated by mica powder and rice paper (featuring strong permeability, water softening, and breakage, thus providing no support) as a natural boundary layer. This separating layer had the following functions: intensifying the movement of the overburden strata and causing fracture extension through the layering of the strata. With the help of the rice paper and mica powder, the model could be disassembled into different layers to facilitate the recording of the distribution and characteristics of the fractures inside the model.
(4) Once the pavement for the model was completed, it was allowed to stand for 2 to 5 days, and water was injected into the model at a constant pressure. When water storage was found in the upper part of the model, this indicated that the model was saturated with permeable water, and the test’s requirements were met.
4. Analysis of the Experimental Results
4.1. Movement characteristics and water migration law of the overburden
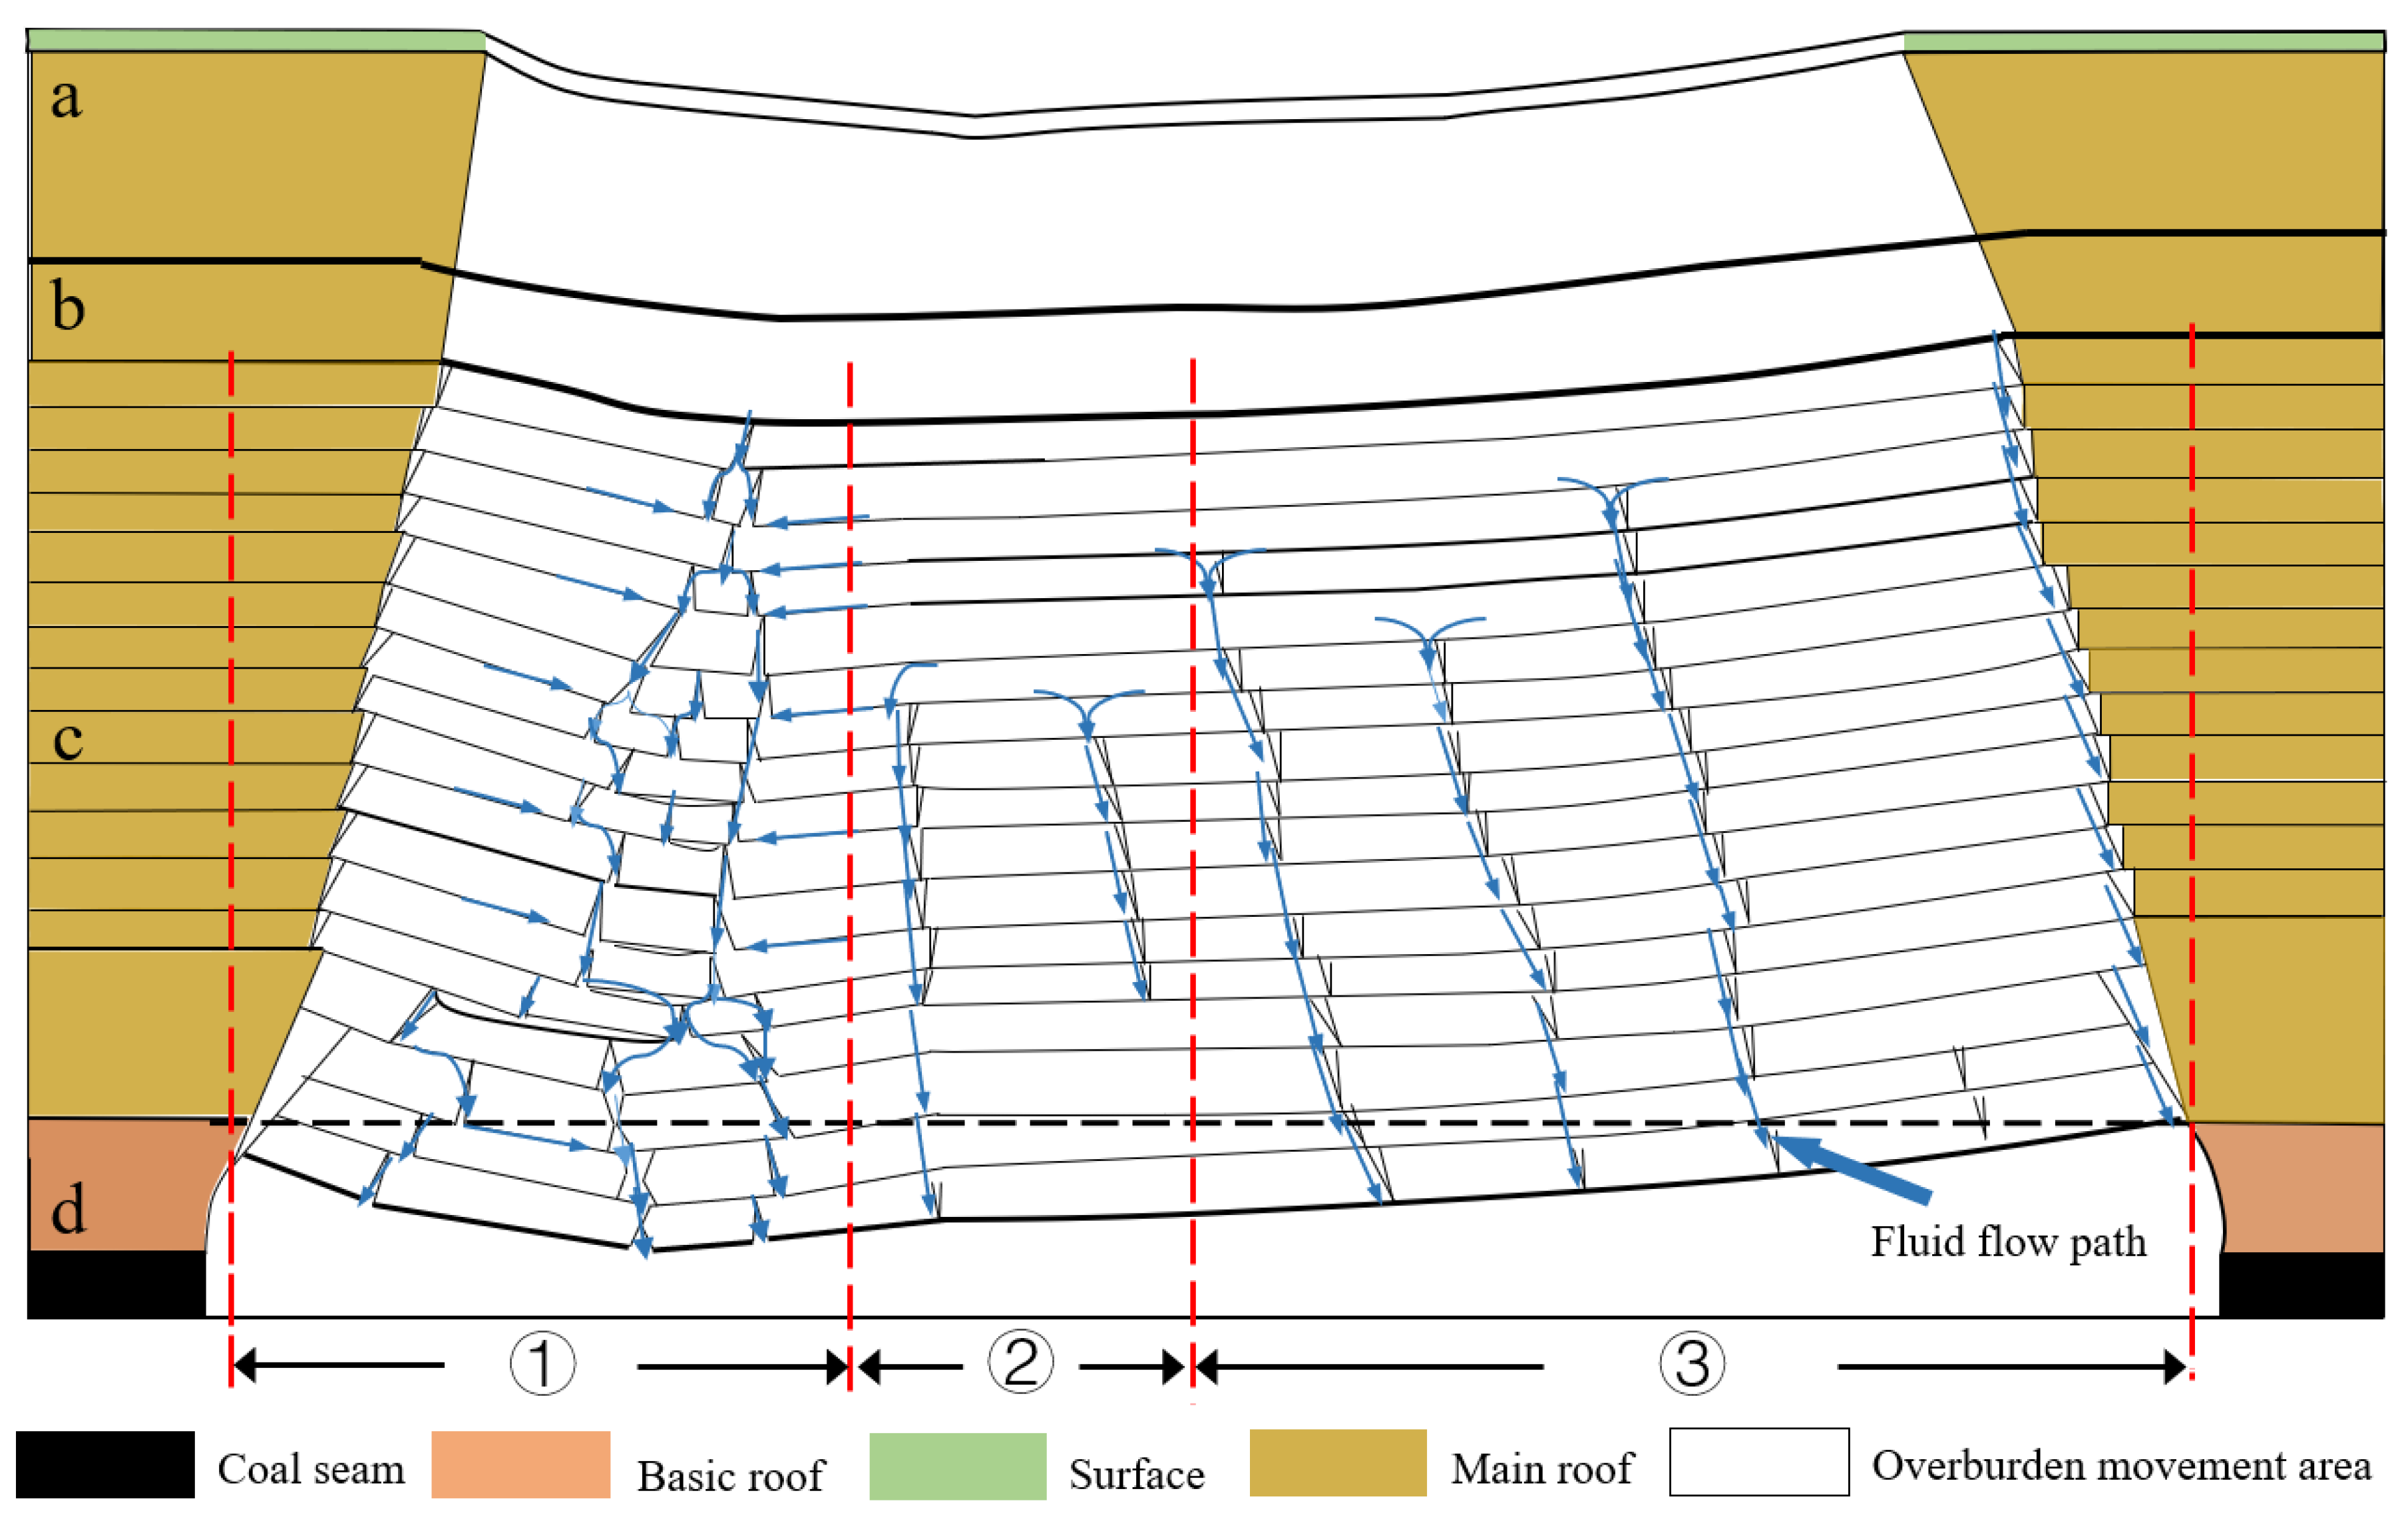
Based on the test that was designed, the migration of water on the overburden’s surface was observed and recorded, and a schematic diagram of the fracture distribution and fluid migration path in the overburden were drawn, as shown in
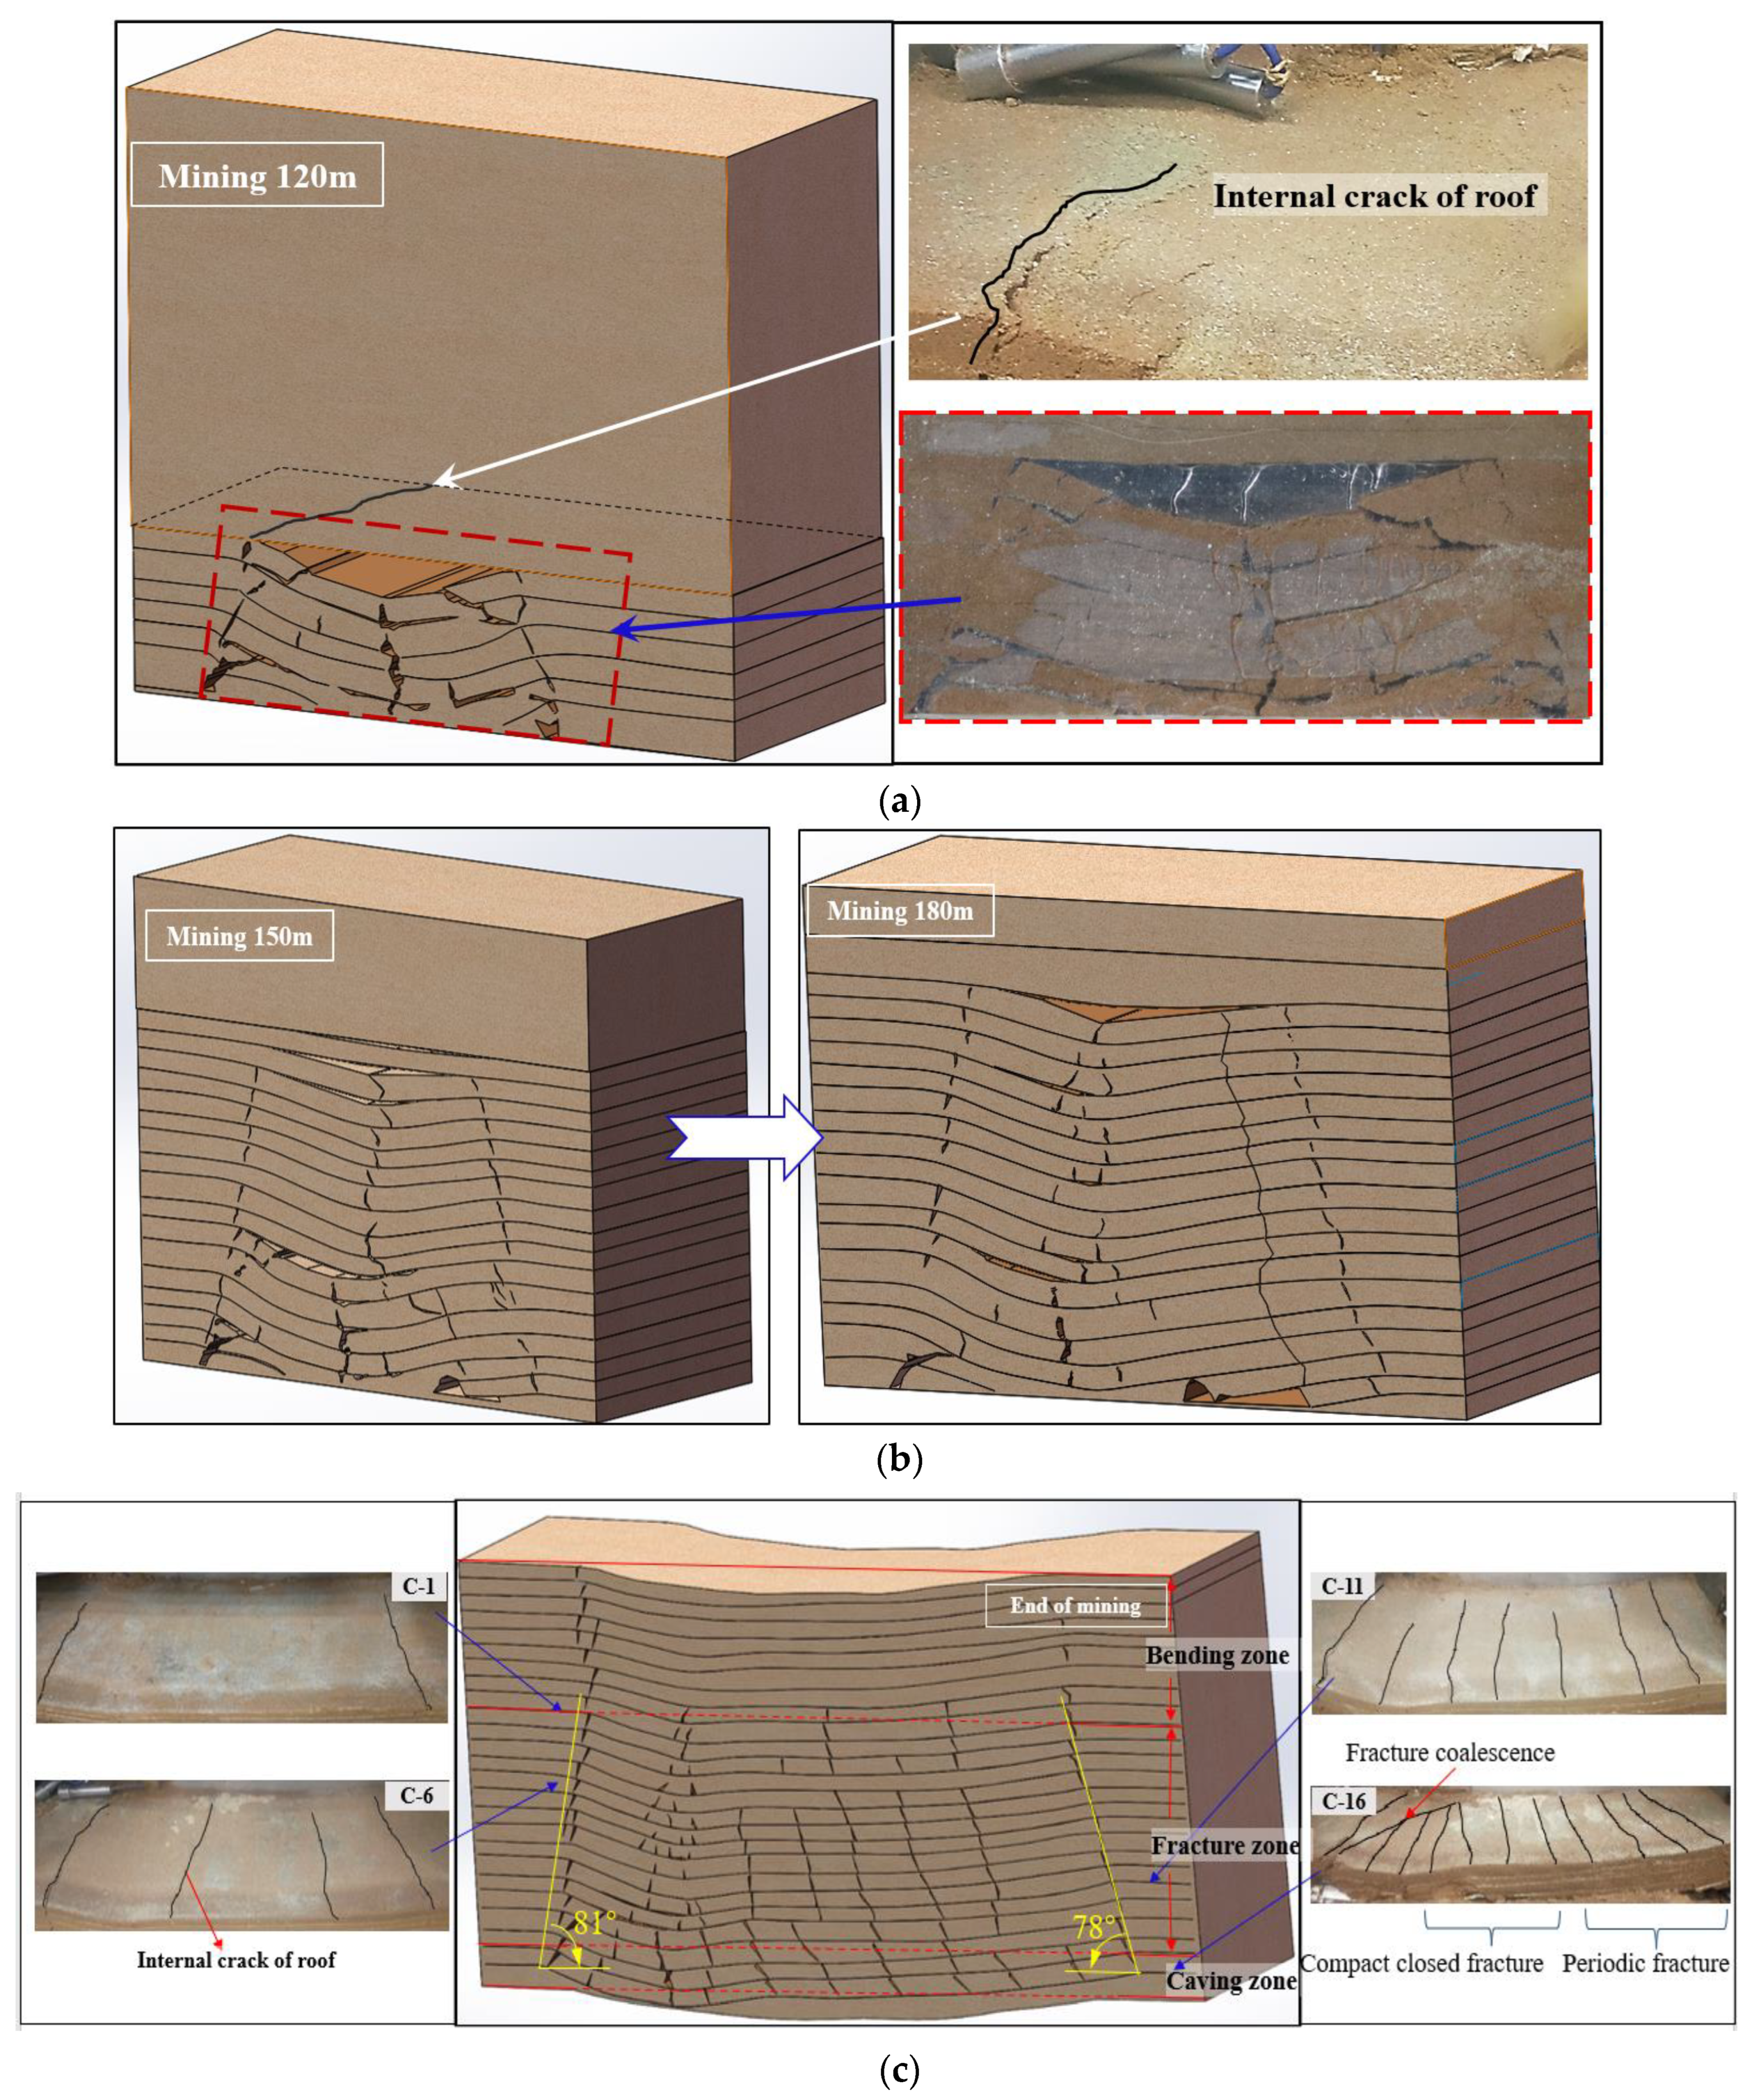
Figure 5. When the working face was completely mined, under the joint action of the movement of rock strata and seepage water pressure, three kinds of flow paths were formed in the overburden. Based on the flow magnitude in the three flow paths, they were classified as follows: dense-fracture area (1), compact closed area (2), and periodic fracture formation area (3). The compact closed area was found to have the maximum surface subsidence.
After excavation to 120 meters, the rock beams in the roof were subjected to tensile failure over the stress limit, thus forming a "trapezoidal” caving area with penetrating fractures in the center. In this case, the seepage water in the collapsed area and its surroundings flowed into the goaf along the through-crack. After mining to 150 meters, the fracture in the strata extends outward in the shape of a trapezoid, new penetrating fractures were formed, and an obvious separation between the rock strata above the fractures occurred. In this case, the two penetrating fractures become the main flow paths for seepage water in the caving strata and its surroundings. After mining to 180 meters, the roof strata periodically fell as mining went on, thus forming mining-induced fractures with considerable heights above the working face, and the water flow in the fractures significantly increased. In the early stages of mining, the penetrating fractures in the caving area extended upward and shrank, the mining-induced fractures began to close, and the water flow decreased due to the compression of the movement of the rock strata. After mining to 210 meters, the mining-induced fractures extended to the surface. Under the joint action of seepage water, surface subsidence eventually occurred. The maximum surface subsidence was seen above the compact closed area. As the working face continued to advance from 240 meters to 300 meters during the mining, periodical breakage of the rock strata led to mining-induced fractures, and the surface subsidence area continued to increase, but the subsidence magnitude decreased with the progress of recovery of the working face.
Under the influence of weakly cemented strata and seepage water, the height of the penetrating fractures in the overburden rapidly increased after the initial caving of the basic roof in the initial fracturing stage. During the periodic fracturing stage, the increase in the height of the penetrating fractures receded, and large mining-induced fractures formed above the recovered working face. Periodic fractures and reciprocating movements that pressed against the mining-induced fractures formed during the initial mining stage to close the fractures, and finally, a "concave" overburden was formed, with the penetrating fractures in the caved space being the axis.
4.2. Fracture distribution characteristics in mining-induced overburden rock
After completing the simulated excavation, the similar materials used in the simulation were removed layer by layer, and the internal fracture texture of the rocks in each layer was observed and recorded. In combination with the evolution of the morphology of the overburden surface fractures during the excavation, a 3D network diagram of the mining-induced overburden fractures was drawn, as shown in
Figure 6. According to the development degree and number of fractures in the strata, the mining-induced overburden can could be roughly categorized into three layers from bottom to top: the caving zone (layer c19 to layer e2), the fracture zone (layer c2 to layer c19), and the bending zone (layer a1 to layer c1 layer), as shown in
Figure 6c.
The rock strata in the caving zone were completely destroyed, and a large number of irregular argillaceous rocks were formed. Broken fractures, stratification fractures, and a large number of blocks were densely distributed over the whole goaf. Affected by the movement of broken strata and stress on the strata, the fracture area comprised two kinds of fractures: (1) penetrating fractures, which were formed after the basic roof caving during early movement of the strata, were mainly found during the first half of coal seam mining, and were longitudinally embedded in the central penetrating fractures and the surrounding discrete and tiny fractures, which were densely and sparingly distributed; (2) mining-induced fractures, which were formed by periodic fractures and reciprocating movements of the rock strata. These fractures were distributed in a relatively uniform and ordered way. The horizontal distance between the fractures was similar to the excavation distance, and the longitudinal distance between the fractures was that of the continuous and high fractures. The bending zone is located above the fracture zone and reached the surface. Bending deformations of the rock dominated, and the main fractures were on both sides of the deformation, which eventually led to surface subsidence.
Fracture zones in the western region are affected by the nature of the weakly cemented rock strata and seepage water, and they have a greater height. After the initial caving of the roof, all kinds of fractures in the overburden quickly developed in the longitudinal direction. The longitudinal fracture angles at both ends of the working face were 81° and 78°, resulting in an extensive distribution of transverse fractures in the overburden and, finally, forming the characteristics of mining-induced fractures in the weakly cemented rock strata of the western region.
4.3. Characteristics of water pressure changes in mining-induced overburden rock
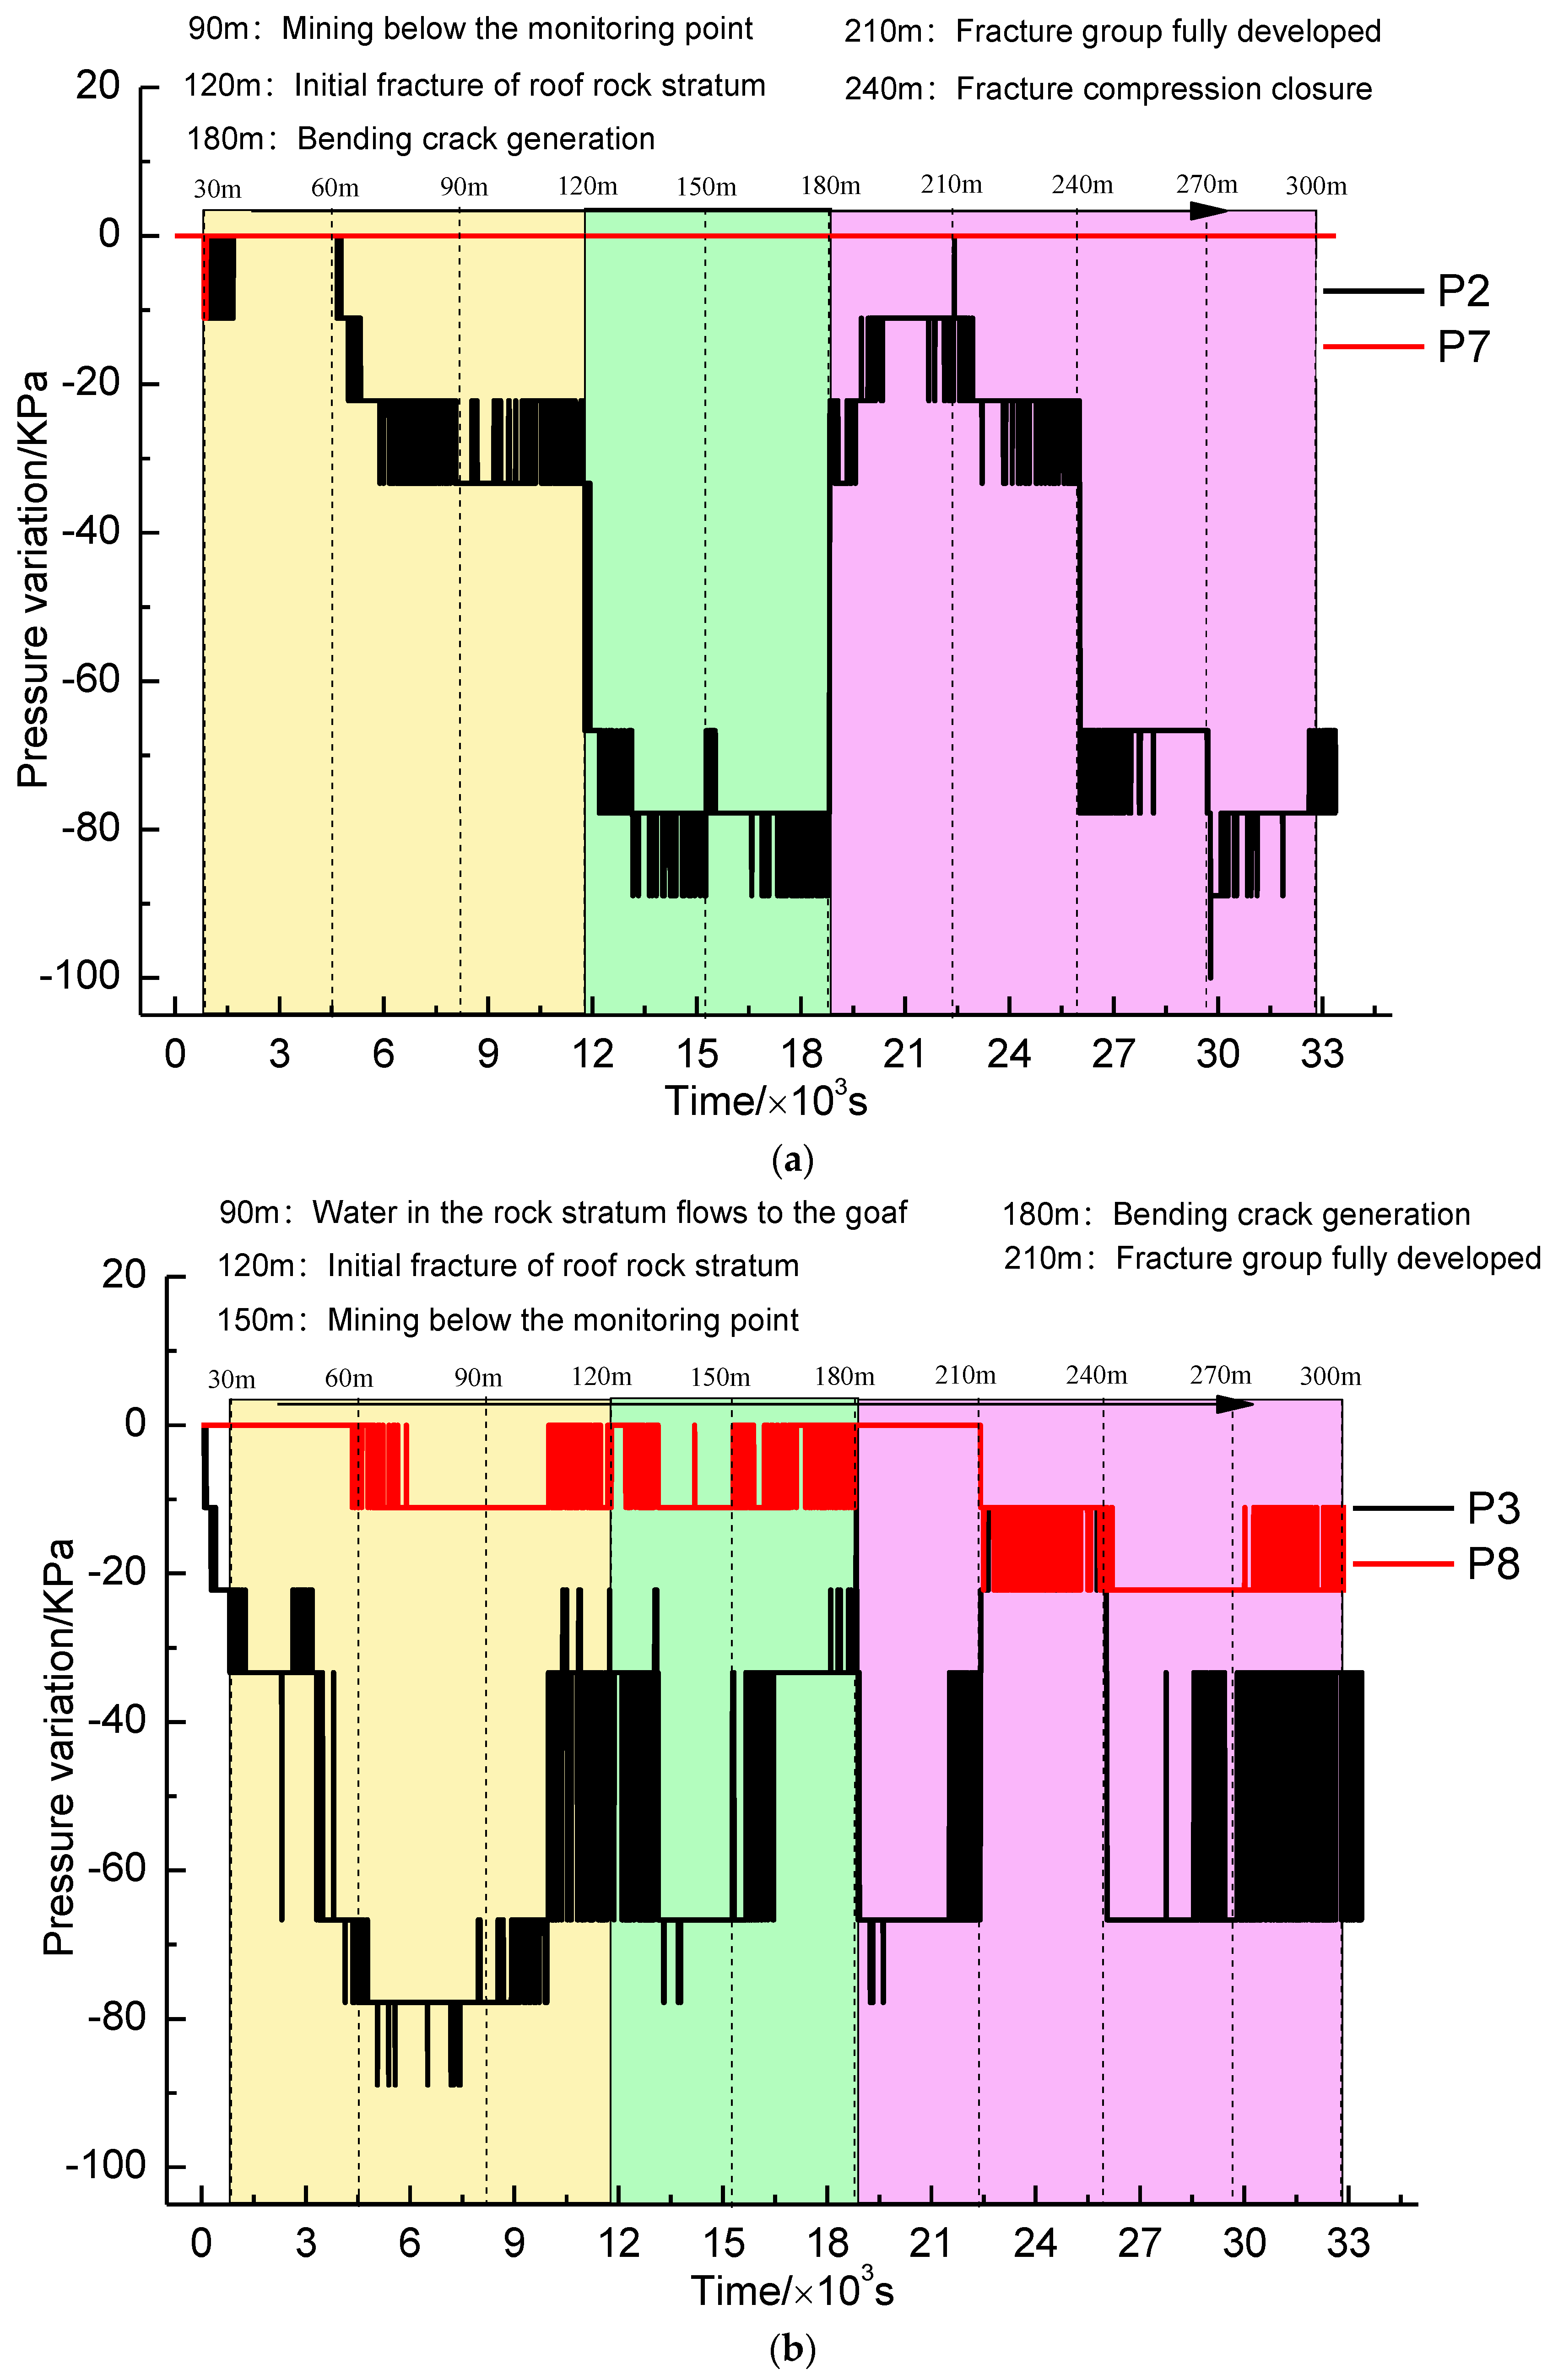
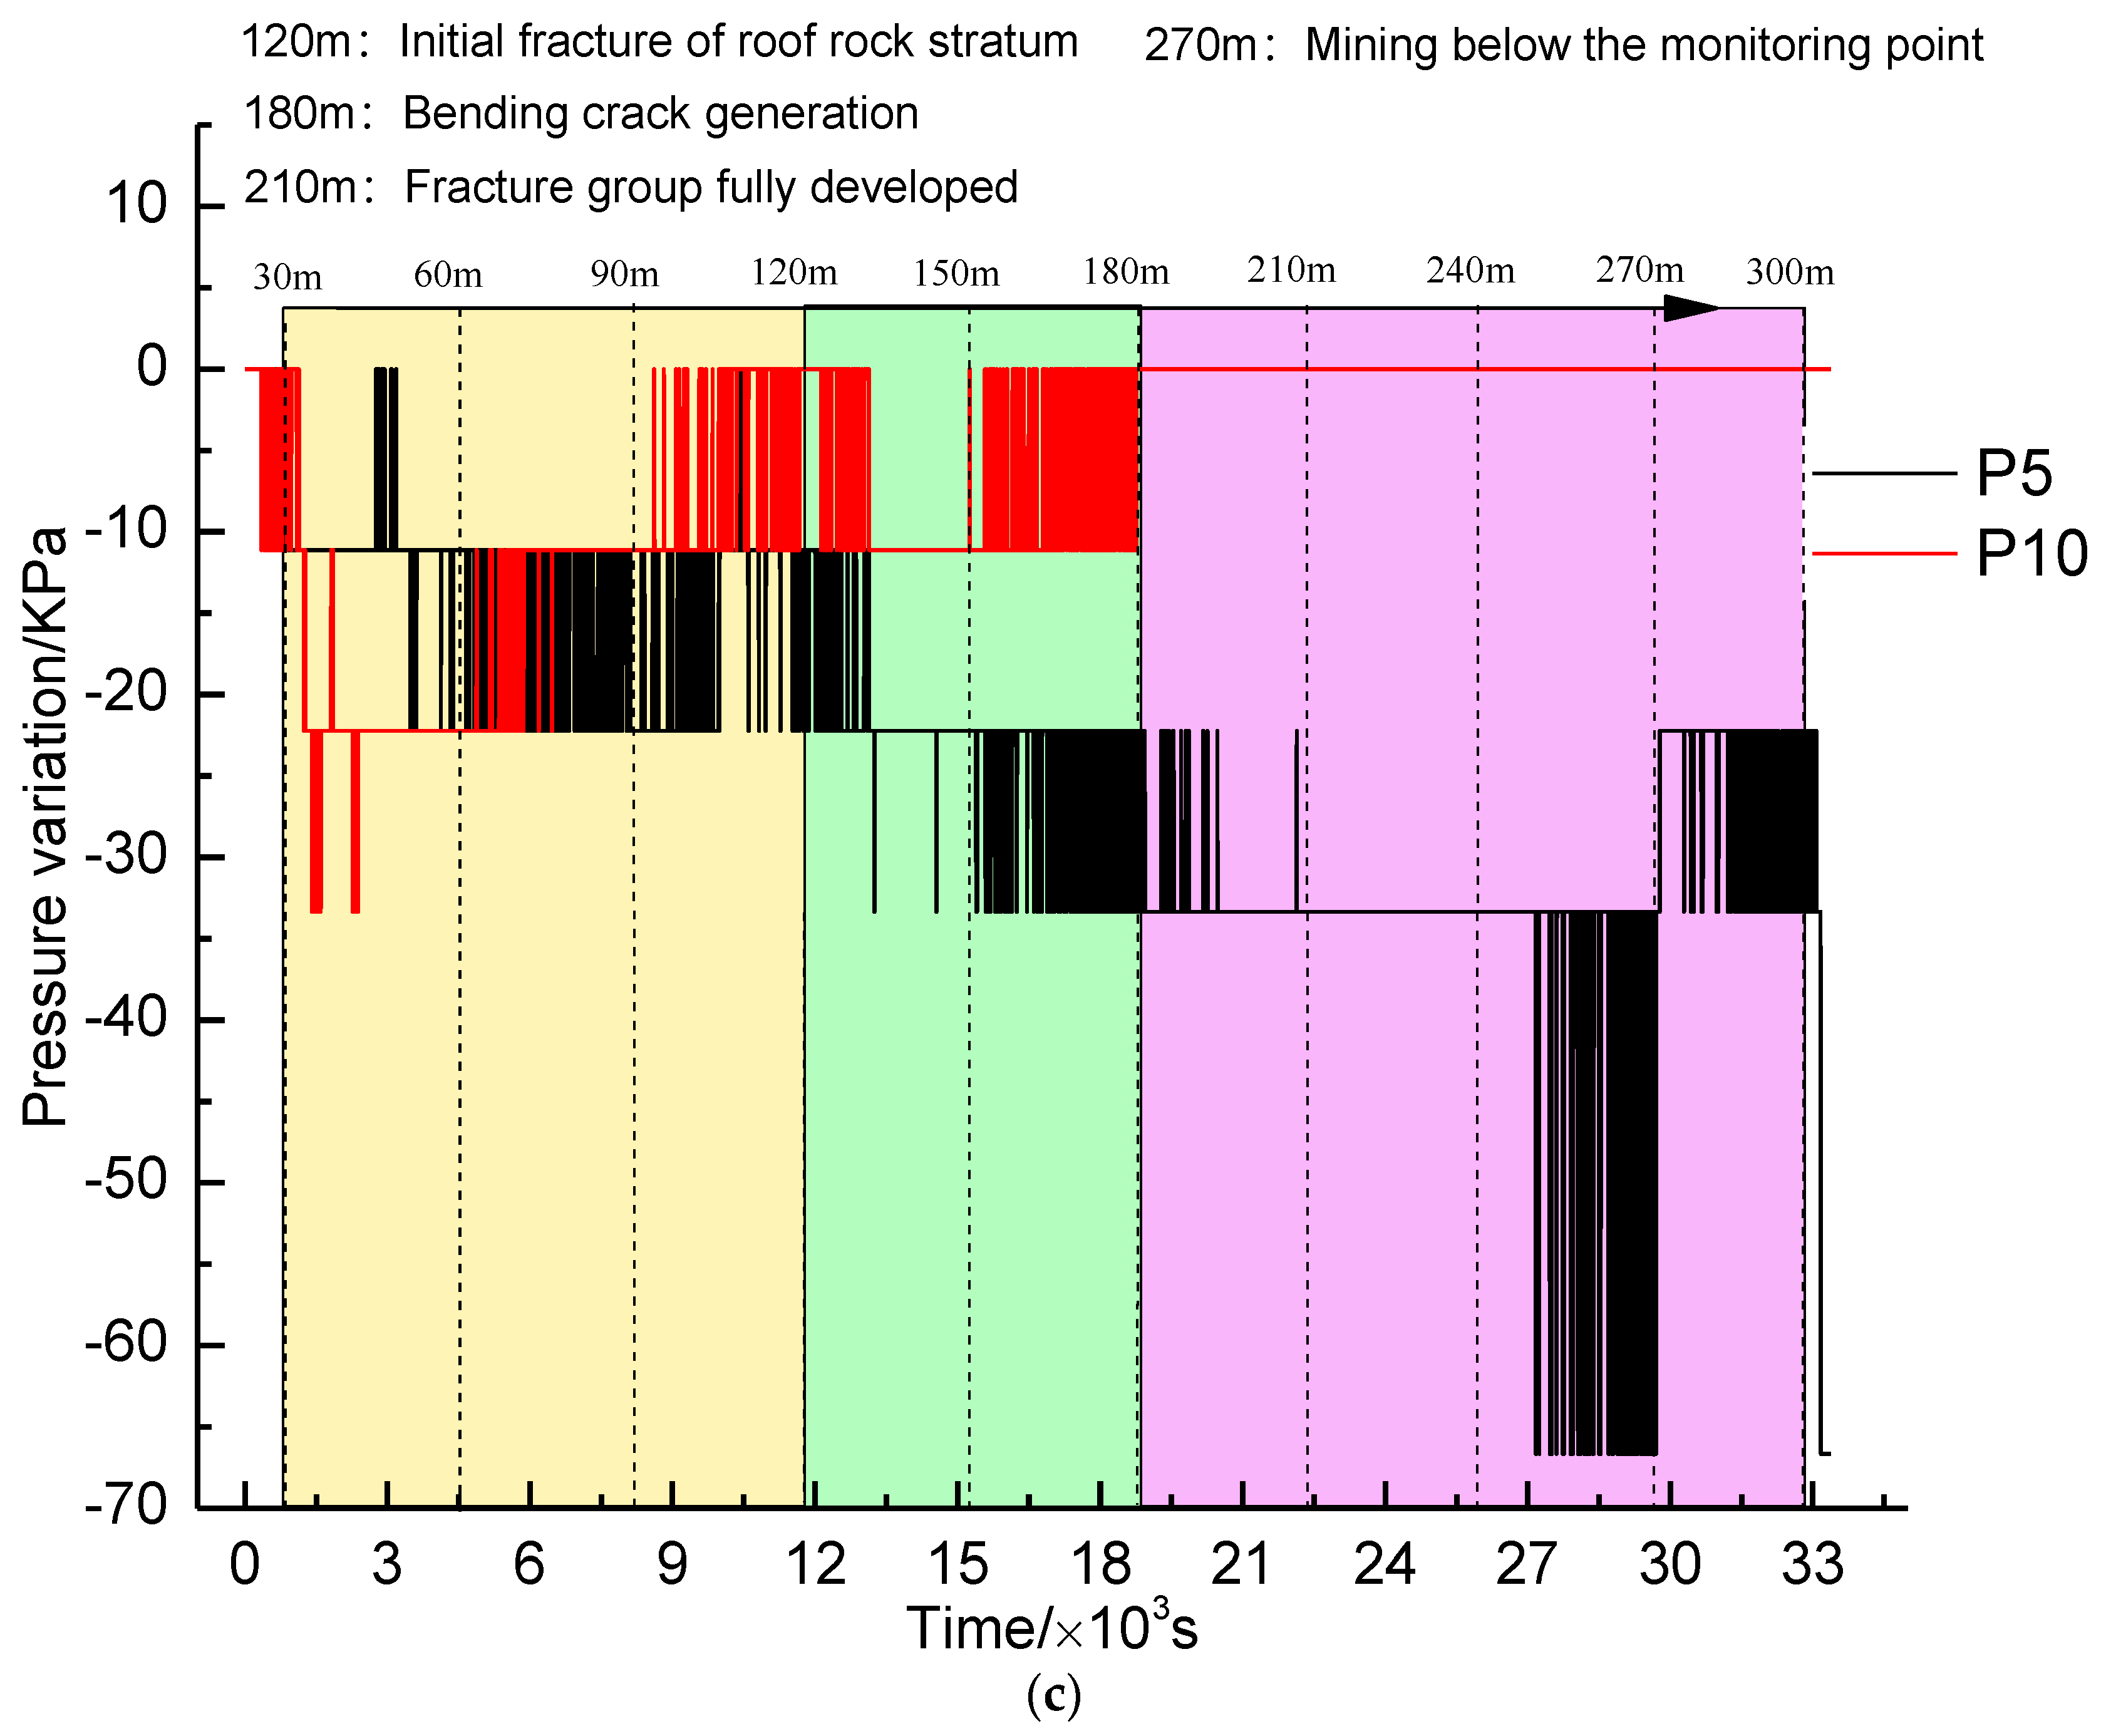
Figure 7 shows the curves of the water pressure variations recorded by some of the sensors during the test, and the dotted lines represent the excavation times and the distance advanced by the working face during the test. Based on the analysis of the water pressure variation curves in all areas of the overburden, as shown in
Figure 7, it can be seen that the water pressure in the overburden displayed a periodic change under the influence of coal mining.
As shown in
Figure 7b, the water pressure data for the two monitoring points with the same vertical height basically shared the same variation trends, but the ranges of variation of the two were significantly different, indicating that the development of fractures and the migration of water flow in the longitudinal direction of the overburden displayed great connectivity during the process of excavation. According to the variation trends of all of the water pressure data, the excavation could be roughly divided into three stages. The following is a specific analysis of each stage.
(1) In the first stage (mining to 120 meters), the overall water pressure of the overburden significantly decreased, and the water pressure showed the most evident decrease when mining to 60 meters. This indicated that the excavation and load-off caused micro-fractures in the roof of the goaf, and the migration path of the fluid in the overburden was changed. When overburden caving occurred, the rock beam in the roof was caved in to form penetrating fractures. Considerable seepage water flowed to the goaf through the penetrating fractures, resulting in a significant decrease in the water pressure in the initial stage.
(2) In the second stage (120 meters to 180 meters), the water pressure in the front working face increased by 70 KPa after mining to 180 m. Due to the intensification of layer separation, water converged in the mining-induced fracture and flowed through monitoring point P2, resulting in an increase of the water pressure. During this stage, the water pressure in the middle of the overburden displayed cyclical fluctuation with the distance advanced by the recovery of the working face, with the same fluctuation. This indicated that the water-conducted fractures within the overburden were vulnerable to sedimentation and closing under the joint action of the movement of rock strata and migration of water; in this case, the water pressure rose. The water-conducted fractures then expanded under the influence of mining and current scour, and repeated occurrence of this would lead to cyclical water pressure changes.
(3) In the third stage (180 meters to 270 meters), the pressure of the water in the overburden gradually decreased, and the roof strata protruded towards the rear goaf under the influence of mining damage, resulting in the closure of the broken fractures under compression and increased water flow in the mining-induced fractures in the rear overburden.
The penetrating fractures that formed after the roof caving became the main migration path of the seepage water in the early mining stage (left and middle positions of the model), resulting in high water flow and pressure on the left side and low water flow and pressure in the middle. When is the area was excavated to the middle of the overburden, mining-induced fractures formed by the roof’s movement became another main water diversion path, which led to a significant increase in the water pressure above the working face. At the same time, the roof’s movement compressed the front penetrating fracture, resulting in a continuous increase in the water flow in the mining-induced fracture, while the water flow in the penetrating fractures decreased. During the mining of the rear overburden (right side of the model), the seepage water in the overburden was mainly affected by the movement of the rock strata in front, and the fluid migration in the mining-induced fractures above the working face was especially obvious.
5. Numerical simulation
5.1. Establishment of the numerical simulation
To study the details of the changes in fluid migration in the overburden, this section describes a combination of the COMSOL simulation software and the establishment of a coal seam mining model by adopting the actual geological conditions of the overburden in the working face. COMSOL is a finite element software that is used to solve multi-field coupling problems, and it can combine the stress field with the seepage field and simulate the fluid migration law in a mining overburden well. To better reflect the actual changes, some assumptions were made in this simulation: (1) The same strata and coal seam were regarded as homogeneous and isotropic media without considering the impact of the interfaces between strata. (2) Fractures and joints existing in the original rock mass prior to the excavation were ignored. However, proper attenuation was carried out in the setting of the rock layers’ parameters. (3) The flow of groundwater in porous media was studied by using Darcy's law.
In this numerical simulation, a 2D method was used, and the physical parameters of the model and their actual equivalents are shown in
Table 3. The water pressure at the surface (180 meters above the top of the coal seam) was set, and the seepage and soil erosion of the surface reservoir were simulated. The total of 56,412 units were subdivided by COMSOL's free triangular grid generator, and the goaf was controlled with the material switch.
Through the interactive modeling environment of COMSOL Multiphysics, the integrated graphics modeling environment was able ensure the effective conversion of the model boundary. The setting of a symmetrical boundary not only increased the efficiency of the operation, but also increased the accuracy of the operation. Therefore, the boundary condition was that in the solid mechanics model, the model was free surface except for the ground, which was a fixed constraint, and the gravity of the model was given as a load with a formula. In the Dancy flow model, the four sides were set to have no flow conditions, and an upper boundary was added with water pressure and compensated ground stress.
5.2. Analysis of the simulation results
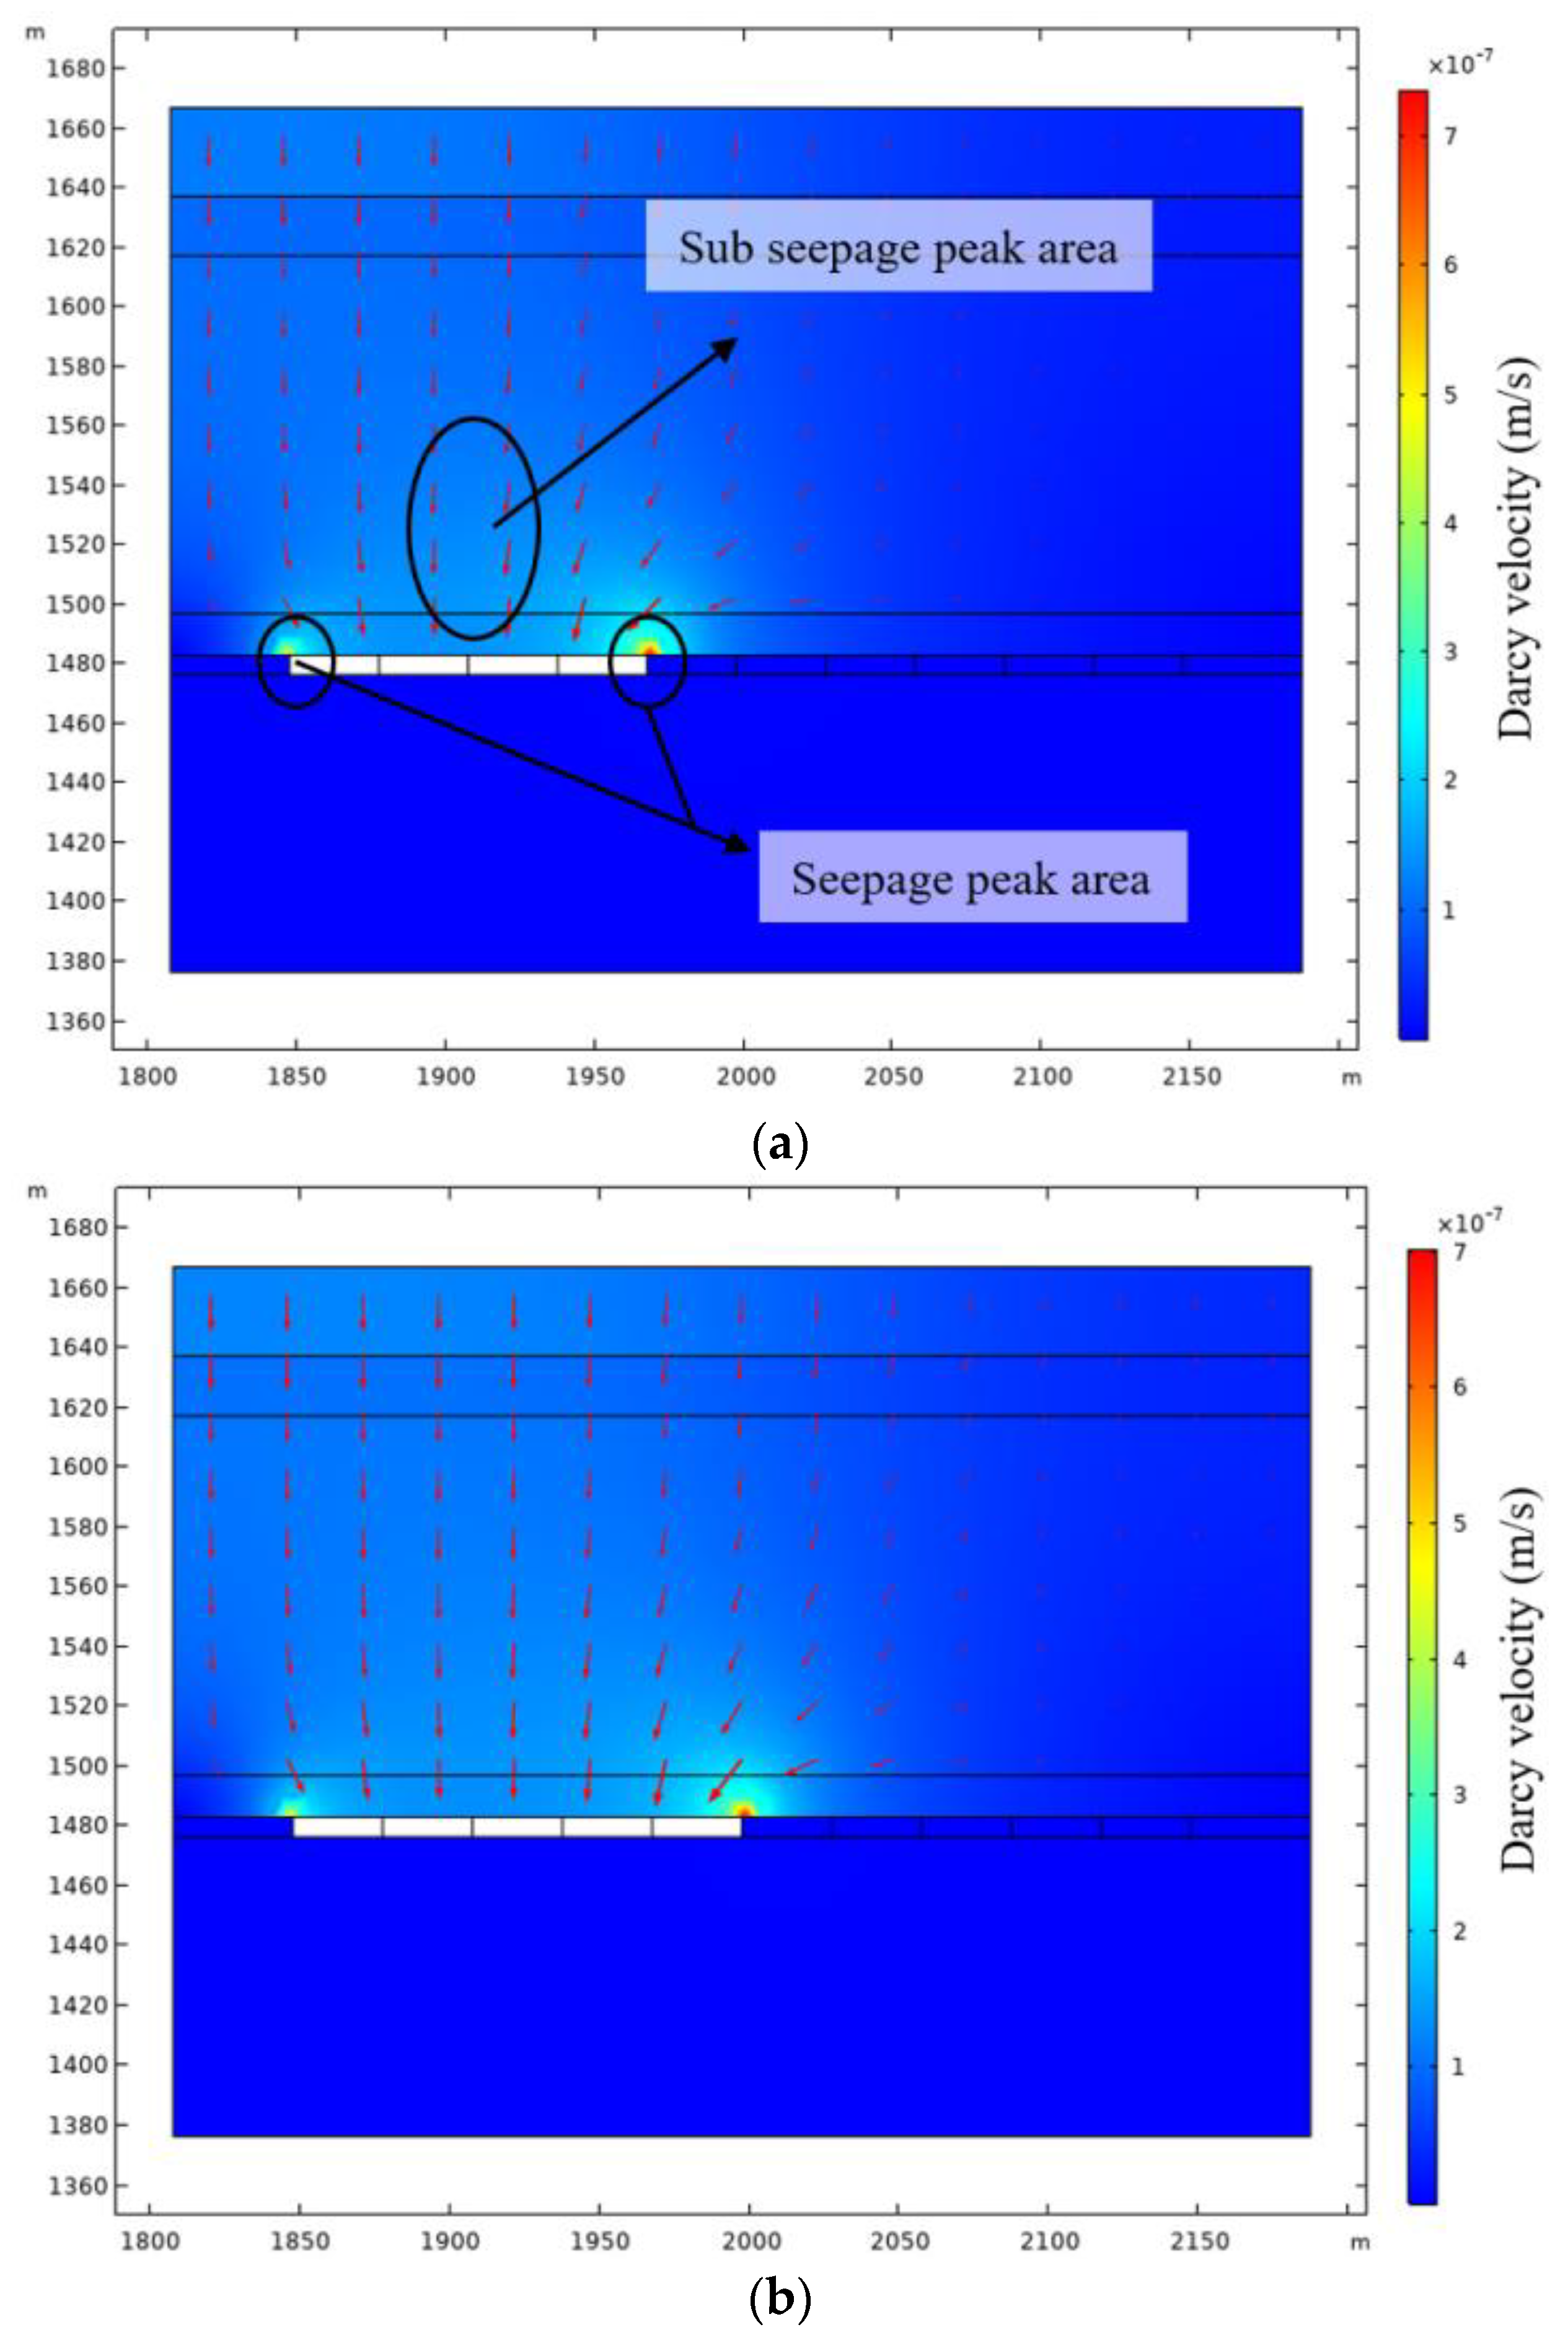
Figure 8 shows a cloud map of the seepage velocity in the overburden of the working face after mining. After coal seam excavation, an arched zone of decreased water pressure appeared in the overburden above the goaf. If the rock was seriously damaged, the internal fractures were connected to attenuate the water pressure. Therefore, the water pressure attenuation in the overburden could reflect the overburden’s failure to a certain extent. It can be seen in
Figure 8a,b that, after coal mining, an obvious peak seepage zone formed at both ends of the goaf, and a secondary peak seepage zone formed in the central goaf. It was learned from the water pressure in the whole excavation that the growth of the area in which the water pressure was attenuated slowed down significantly after the distance advanced by the working face reached 120 meters. In combination with the distribution characteristics of the fractures in the mining-induced overburden, it could be seen that the areas at both ends of the working face easily became water-inrush channels and caused water-inrush accidents under the influence of mining.
Figure 9 shows the flow velocity curve of the fluid in the middle section of the "three zones" in the overburden when the working face was excavated to advancement distances of 30 meters, 120 meters, and 150 meters, respectively. The seepage velocity in the three zones of the mining-induced overburden showed distinguishable characteristics. As the working face advanced, the seepage velocity in the bending zone (Line A) and the fracture zone (Line B) gradually increased, while the velocity in the caving zone (Line C) slowly decreased. The bending zone in the overburden was the least affected by mining disturbances, and there was an effect of hysteresis on the change in seepage. With the progression of the mining, the seepage velocity in the bending zone generally displayed a steady decline. During the initial mining (30 meters) of the working face in the fracture zone, the seepage velocity increased and then steadily decreased. During the middle stage of the mining (120 and 150 meters), the peak seepage appeared at a 135-meter distance from the goaf, and the seepage velocity showed the greatest drop above the recovery of the working face. The caving zone was the most affected by mining disturbances, and the change in the seepage in the caving zone was relatively complex. The peak seepage area mainly appeared within the mining area of the working face as it advanced.
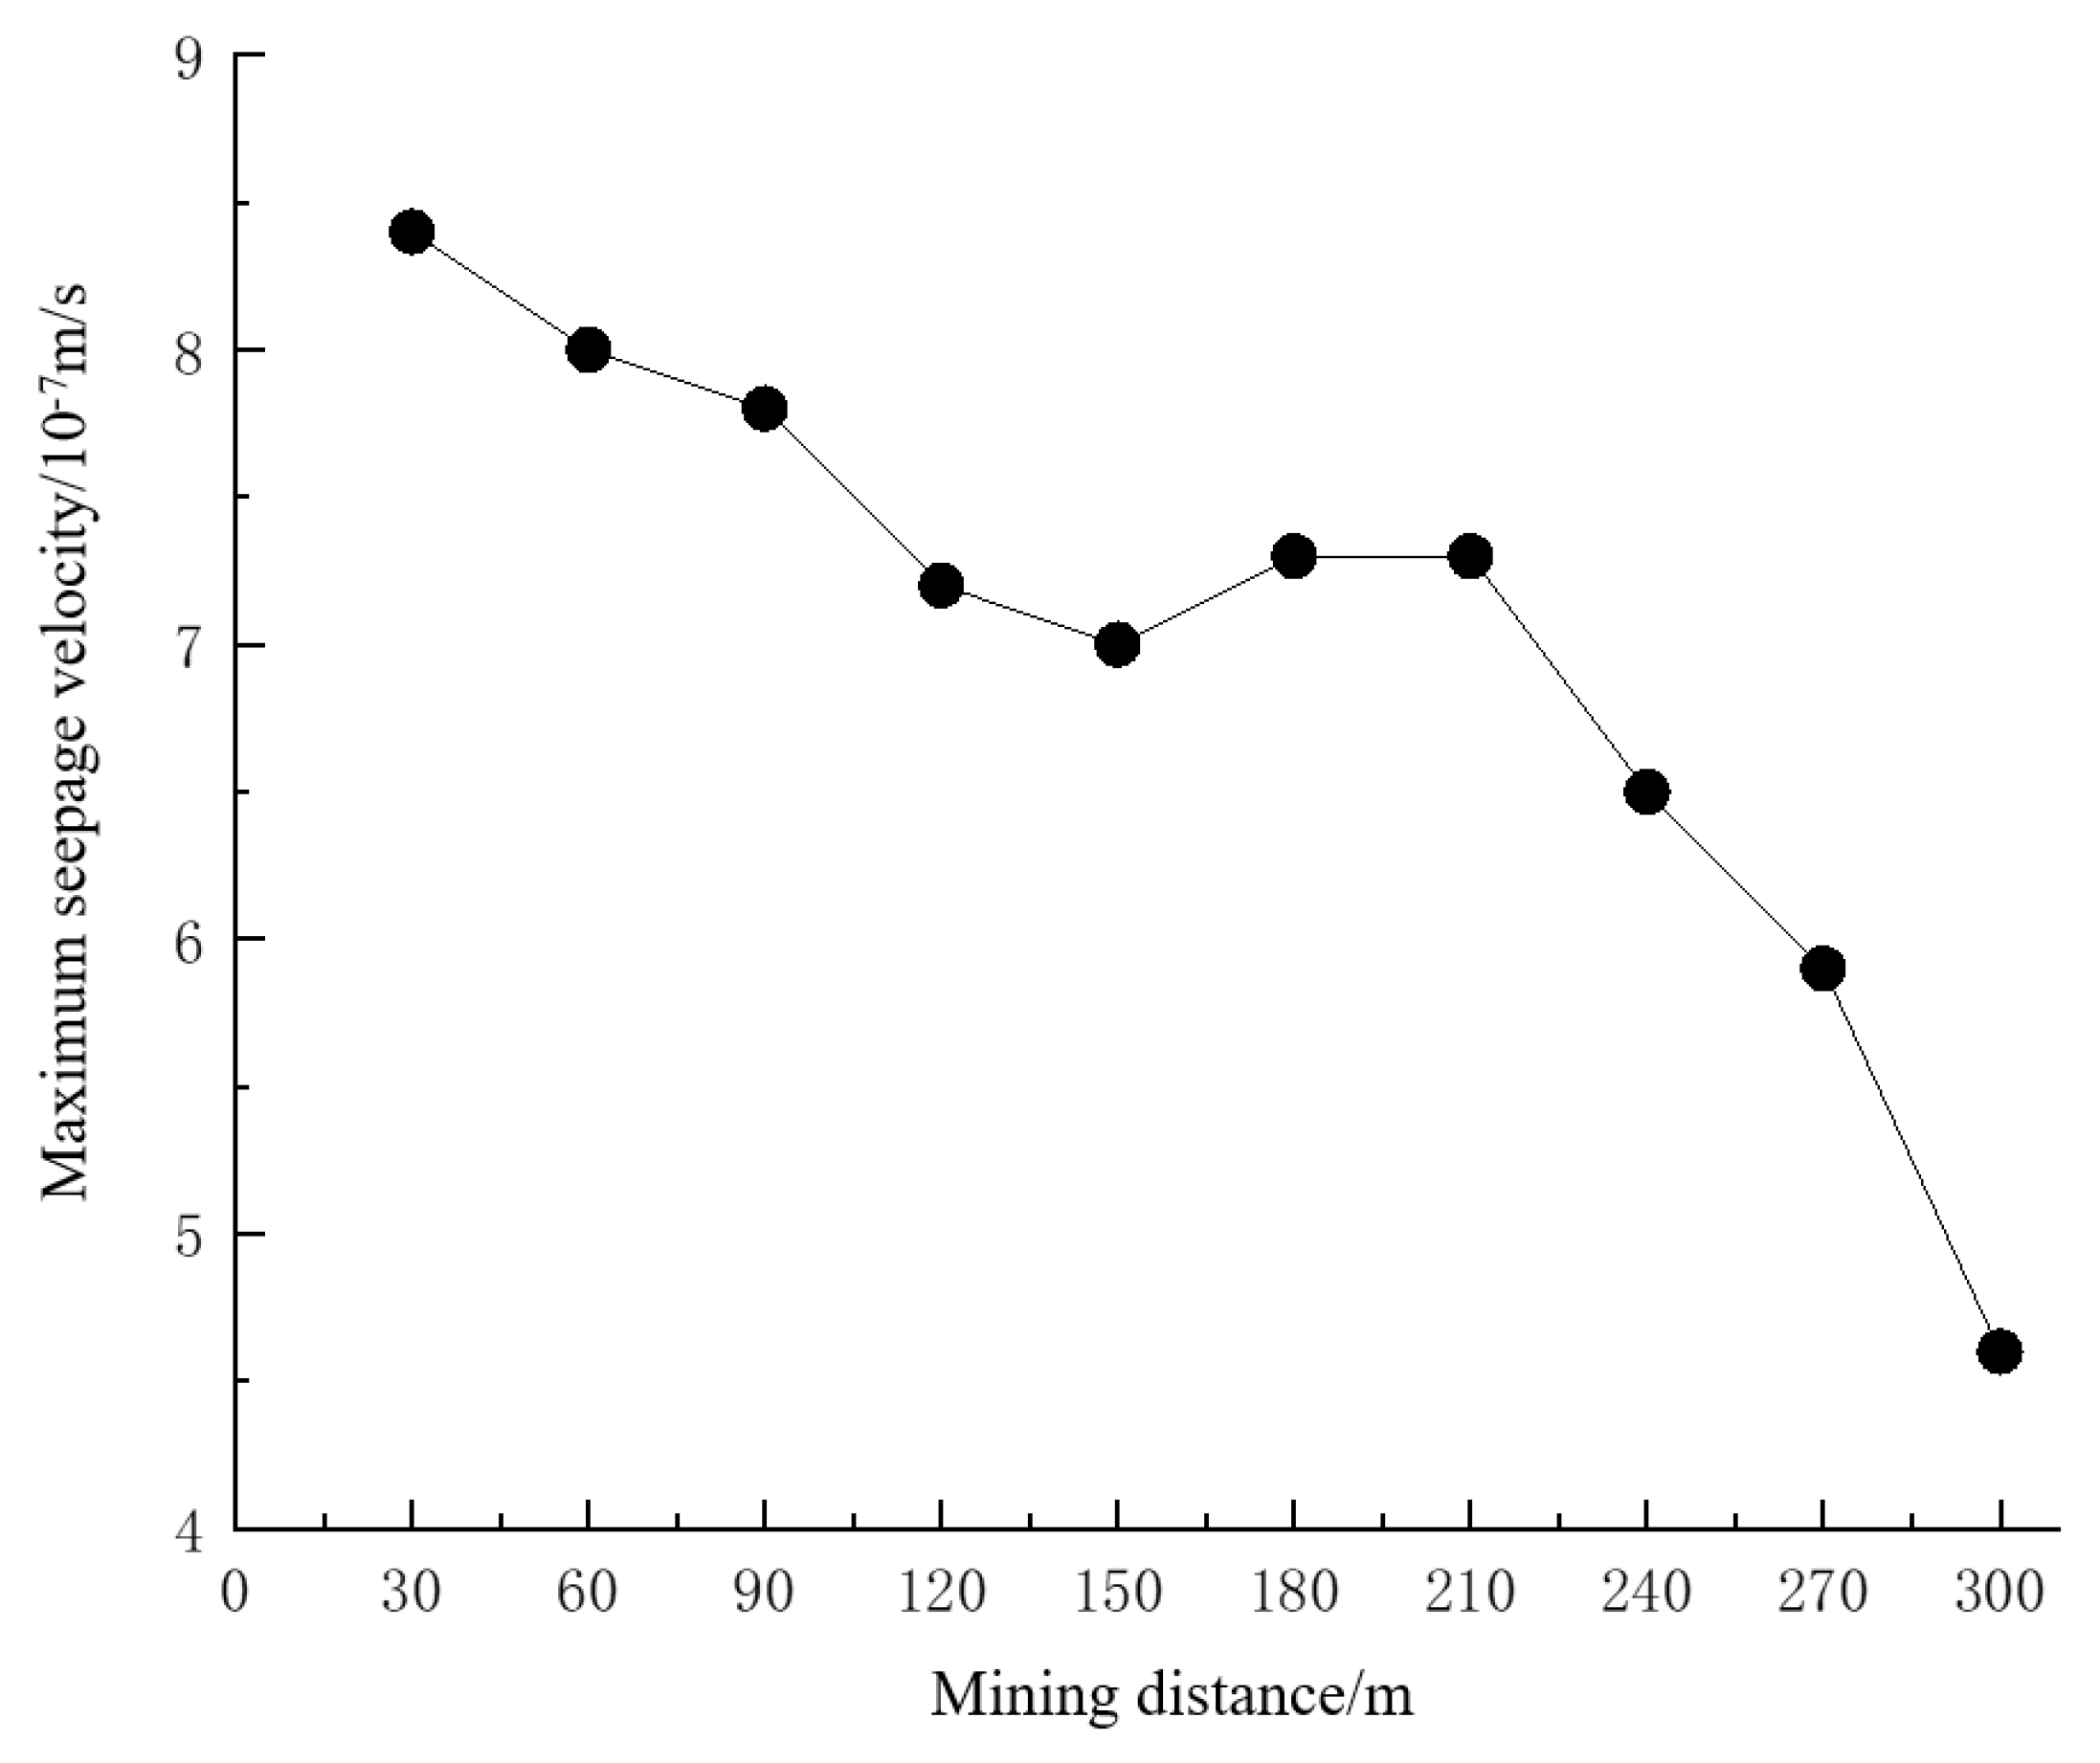
Figure 10 shows the maximum seepage velocity curve for the working face at different advancement distances. By combining this with
Figure 8, it can be seen that the maximum seepage velocity was at the working face’s open-off cut, and the central overburden of the goaf and the fluid seepage velocity in the overburden continuously decreased after the excavation of the coal seam. When the working face advanced to a 120-meter distance, the seepage velocity decreased the most, indicating that the jump in the seepage velocity was caused by the closure of the overburden fractures in the working face. Afterward, when the working face advanced to a 210-meter distance, the seepage velocity in the overburden remained stable within a certain range, indicating that the seepage velocity in the overburden would remain stable within a certain range after its initial change. Subsequently, the seepage velocity in the overburden rapidly decreased as the working face advanced.
The results of this study clarify the characteristics of the dynamic development of water-conducting fissures in an overburden during the process of mining a working face; the law of the evolution of an overburden’s water migration and seepage path was explored, and the law of migration of the overburden and water body in an actual mining process in a coal mine was studied to provide a reference for the actual calculation of water inflows in coal mines.
6. Conclusion
(1) Based on the test results, a 3D network diagram of mining-induced overburden fractures was drawn. According to the extent of development and quantities of fractures in the strata, the mining-induced overburden was divided into three zones, in which the fracture zone included the penetrating fractures formed by roof caving and the mining-induced fractures formed by periodic fractures; all kinds of fractures in the overburden rapidly developed in the longitudinal direction, forming longitudinal fractures on opposite sides of the working face with angles of 81° and 78°, respectively. Eventually, the mining-induced overburden fracture distribution of the weakly cemented rock strata peculiar to the western region of China was formed.
(2) There was significant fracture development and water migration in the longitudinal direction of the overburden. Once the roof of the coal seam caved for the first time, the height of the penetrating fractures in the overburden rapidly increased, and these fractures became the main water channels. Cyclical changes involving extension and closure occurred in the mining-induced fractures, which were subject to the combined influence of overburden movement and water migration. Eventually, when the working face was fully mined, three kinds of flow paths were formed within the overburden. They were referred to as the dense-fracture area, compact closed area, and periodic fracture formation area based on their flow magnitudes. Penetrating fractures in the overburden and the mining-induced fractures over the working face became the main fluid migration channels.
(3) The results of the COMSOL numerical simulation showed that the seepage velocities in the three zones of the mining-induced overburden had obviously different characteristics, and the seepage velocities in the bending zone and fracture zone gradually increased with the advancement of the working face. At both ends of the roof of the goaf, a peak seepage zone appeared, and in the middle part of the roof of the goaf, a sub-peak seepage zone appeared. Once the advancement distance of the working face was over 120 meters, the attenuation of pressure and increase in seepage velocity significantly slowed down. By combining these two facts, it can be seen that water-inrush accidents were more likely to happen at the two ends of the goaf below the working face.
Author Contributions
Conceptualization, Yangyang.Li and Shichuan.Zhang.; methodology, Weihong.Yang ; software, Xuexian.Han ; validation,Junxi.Liu and Shilong.Song ; formal analysis, Shichuan.Zhang ; in-vestigation, Yangyang.Li ; resources, Xuexian.Han ; data curation, Junxi.Liu ; writing—original draft preparation, Shichuan.Zhang ; writing—review and editing, Xuexian.Han ; visualization, Xuexian.Han ; supervision, Yangyang.Li ; project administration, Yangyang.Li ; funding acquisition, Shichuan.Zhang. All authors have read and agreed to the published version of the manuscript.
Funding
This research was funded by the Open Fund of State Key Laboratory of Water Resource Protection and Utilization in Coal Mining (No. GJNY-20-113-19), National Natural Science Foundation of China (No. 52004147, 51974173), Natural Science Founda-tion of Shandong Province (No. ZR2020QE129).
Data Availability
The data used to support the findings of this study are available from the corresponding author upon request.
Conflicts of Interest
The authors declared that they have no conflict of interest to this work.
References
- Shahbaz, M.,Farhani, S., and Ozturk, I. (2013), “Coal consumption, industrial production and co2 emissions in china and india”. Environmental Sciences and Pollution Research 22(5): 3895-3907. [CrossRef]
- Huang, X. C. , Fan, C., Wang, R. and Yan, G. Q.(2019), “Study on gas emission prediction of steeply inclined coal applied horizontal slice mining”, Joural of Engineering Science and Technology Review, 12(2): 17-26. [CrossRef]
- Zhang, S.C. , Shen, B.T., Zhang, X.G., Li, Y.Y., Sun, W.B. and Zhao, J.H. (2020), “Modelling the coupled fracture propagation and fluid flow in jointed rock mass using FRACOD”, Geomechanics and Engineering 22(6): 529-540. [CrossRef]
- Howladar, M. F. (2013), “Coal mining impacts on water environs around the Barapukuria coal mining area, Dinajpur, Bangladesh” Environmental Earth Sciences, 70(1):215-226. [CrossRef]
- B.T. Shen,, Barton, N. (2018), “Rock fracturing mechanisms around underground openings”, Geomechanics and Engineering 16(1): 529-540. [CrossRef]
- Ma, L. Q. , Jin, Z. Y., Liang, J. M., Sun, H., Zhang, D. S. and Li, P.(2015), “Simulation of water resource loss in short-distance coal seams disturbed by repeated mining”, Environmental Earth Sciences, 74(7):5653-5662. [CrossRef]
- Bai, E. , Guo, W. B., Zhang, D. S., Tian, Y., Guo, M. J. and Zhao, G. B.(2019), “Using the Magnetotelluric Method for Detecting Aquifer Failure Characteristics under High-Intensity Mining of Thick Coal Seams”, Energies, 12(22):4397. [CrossRef]
- Fan, K. F. , He, J. H., Li, W. P. and Chen, W. C. (2022), “Dynamic evolution and identification of bed separation in overburden during coal mining”, 55(7):4015-4030. [CrossRef]
- He, X. , Zhang, C., Han, P. H. and Song, Z. Y.(2020), “Overburden Damage Degree-Based Optimization of High-Intensity Mining Parameters and Engineering Practices in China's Western Mining Area”, Geofluids, 2020(4):1-21. [CrossRef]
- J. C. Wei,, Wu, F. Z., Yin, H. Y., Guo, J. B., Xie, D. L., Xiao, L. L., Zhi, H. F. and Lefticariu, L.(2017), “Formation and Height of the Interconnected Fractures Zone after Extraction of Thick Coal Seams with Weak Overburden in Western China”, Mine Water & the Environment, 36(1):1-8. [CrossRef]
- S. Y. Xu,., Zhang, Y. B., Shi, H., Wang, K., Geng, Y. P. and Chen, J. F.(2008), “Physical Simulation of Strata Failure and Its Impact on Overlying Unconsolidated Aquifer at Various Mining Depths”, Water, 10(5):650. [CrossRef]
- Liu, X. L. and Wang, S.Y.(2012), “Mine Water Inrush Forecasting during the Mining under Waters”, Disaster Advances, 5(4):876-881. http://hdl.handle.net/1959.13/1303867.
- Xu, Z. H. , Li, Q. S., Li, X. B. and Caggiano, A.(2020), “Overburden Migration and Failure Characteristics in Mining Shallow Buried Coal Seam with Thick Loose Layer”, Advances in Materials Science and Engineering, 2020(1):1-12. [CrossRef]
- Ma, K. , Yang, T.H., Zhao, Y., Hou, X.A., Liu, Y.L., Hou, J.X., Zheng, W.X., Ye, Q. (2022), “Mechanical model for analyzing the water-resisting key stratum to evaluate water inrush from goaf in roof”, Geomechanics and Engineering 28(3): 299-311. [CrossRef]
- Zhang, J.X. , Zhang, Q., Spearing, A.J.S., Miao, X.A., Guo, S. and Sun, Q. (2017), “Green coal mining technique integrating mining-dressing-gas draining-backfilling-mining”, International Journal of Mining Science and Technology 27(1): 17-27. [CrossRef]
- Bian, Z. , Miao, X., Lei, S., Chen, S.E., Wang, W. and Struthers, S.(2012), “The challenges of reusing mining and mineral-processing wastes”, Science, 337(6095), 702-703. [CrossRef]
- Zhang, D. S. , Fan, G. W., Liu, Y. D. and Ma, L. Q.(2010), “Field trials of aquifer protection in longwall mining of shallow coal seams in China”, International Journal of Rock Mechanics & Mining Sciences, 47(6):908-914. [CrossRef]
- Yuan, S. C. , Sun, B. T., Han, G. L., Duan, W. Q. and Wang, Z. X. (2022), “Application and prospect of curtain grouting technology in mine water safety management in china: a review”, Water, 14(24):4093. [CrossRef]
- Yuan, S. C. , Sun, W. H., Han, G. L. and Duan, W. Q. (2022), “An optimized combination of mine water control, treatment, utilization, and reinjection for environmentally sustainable mining: a case study”, Mine Water and the Environment, 14(3): 828-839. [CrossRef]
- W, Q. , Fan, S. K., Zhou, W. F. and Liu, S. Q. (2013), “Application of the analytic hierarchy process to assessment of water inrush: A case study for the No. 17 coal seam in the Sanhejian coal mine, China”, Mine Water and the Environment, 32(3): 229-238. [CrossRef]
- Gu, D. Z. (2015), “Theory framework and technological system of coal mine underground reservoir”, China Coal Soc, 040(002):239-246. [CrossRef]
- Wang, Q. Q. , Li, W. P., Li, Tao., Li, X. Q. and Liu, S. L.(2018), “Goaf water storage and utilization in arid regions of northwest China: A case study of Shennan coal mine district”, Journal of Cleaner Production. [CrossRef]
- Li, Y.Y. , Zhang S.C., Yang Y.M., Chen H.R., Li Z.K. and Ma Q. (2022). “Study on the water bursting law and spatial distribution of fractures of mining overlying strata in weakly cemented strata in West China”, Geomechanics and Engineering 28(6): 000-000. [CrossRef]
- Zhang, J. , Wang, X.D. (2017), “Permeability-increasing effects of hydraulic flushing based on flow-solid coupling”, Geomechanics and Engineering 13(2): 285-300. [CrossRef]
- Fan, L. M. and Ma, X. D.(2018), “A review on investigation of water-preserved coal mining in western China” International Journal of Coal Science & Technology, 5(4):411-416. [CrossRef]
- Pasanai, K. . (2014). “Multiband coupling effect on density of states and tunneling conductance spectra of ferromagnetic material”, Journal of Magnetism & Magnetic Materials 357(MAY): 35-40. [CrossRef]
- Daouadji, T.H. , Hadji, L.(2015), “Analytical solution of nonlinear cylindrical bending for functionally graded plates”, Geomechanics and Engineering 9(5): 631-644. [CrossRef]
- Li, T. , Chen, G.B., Qin, Z.C., Li, Q.H., Cao, B. and Liu, Y.L.(2020), “The gob-side entry retaining with the high-water filling material in Xin'an Coal Mine”, Geomechanics and Engineering 22(6): 541-552. [CrossRef]
- Gong, Y. F. , Zhu, G. W., Jiang, Y. P. and Shi, D. J. (2022), “Experimental study on the proportion of similar materials for different geological structures of coal seams”, Journal of Mining Science and Technology 7(3): 267-274. [CrossRef]
|
Disclaimer/Publisher’s Note: The statements, opinions and data contained in all publications are solely those of the individual author(s) and contributor(s) and not of MDPI and/or the editor(s). MDPI and/or the editor(s) disclaim responsibility for any injury to people or property resulting from any ideas, methods, instructions or products referred to in the content. |
© 2023 by the authors. Licensee MDPI, Basel, Switzerland. This article is an open access article distributed under the terms and conditions of the Creative Commons Attribution (CC BY) license (http://creativecommons.org/licenses/by/4.0/).
