Submitted:
21 June 2023
Posted:
21 June 2023
You are already at the latest version
Abstract
Imidacloprid is the first-generation neonicotinoid insecticide. But, the long-term use of im-idacloprid as a pesticide has caused severe water pollution. Recently, the toxicity of imidacloprid to aquatic organisms has received increasing attention. This study aimed to investigate the ab-sorption and distribution of imidacloprid in various tissues (gills, intestine, liver, muscle, brain, and gonads) of goldfish through short-term and continuous exposure tests for 28 days. The re-sults of short-term exposure indicated that the concentration of imidacloprid and its metabolites in tissues at the transfer stage decreased steadily after 1 day of 40 mg/l imidacloprid water treatment and was below the detection limit after 3 days. Continuous exposure for 28 days at various treatment concentrations showed that the concentrations of imidacloprid and its metab-olites differed significantly among the different tissues of the goldfish. In the 20 mg/l treatment group (S1), the highest concentration of imidacloprid was found in the liver (12.04 μg /gtissue), followed by the intestine (9.91 μg /gtissue), muscle (6.20 μg /gtissue), gill (6.11 μg /gtissue), gonads (5.22 μg /gtissue), and brain (2.87 μg /gtissue). In the 40 mg/l treatment group (S2), the order of tissue concentrations was similar to that of the S1 group, with the highest concentration observed in the liver (12.04 μg/gtissue), followed by the intestine (9.91 μg/gtissue), muscle (6.20 μg/gtissue), gill (6.11 μg/gtissue), gonads (5.22 μg/gtissue), and brain (2.87 μg/gtissue). Fur-thermore, the study detected 5-hydroxyimidacloprid, imidacloprid urea, and 6-chloronicotinic acid in imidacloprid metabolites in all tissues, while imidacloprid was detected only in the intes-tine and liver. Overall, the results of this study contribute to a better understanding of the met-abolic behavior of imidacloprid in organisms and provide new data to support the assessment of imidacloprid toxicity in fish.
Keywords:
Imidacloprid
; Goldfish
; Metabolites
; Tissue Distribution
; Toxicity
1. Introduction
Imidacloprid is the first-generation neonicotinoid insecticide developed by Bayer Crop Science, Germany [1]. It is mainly used for the control of aphids, leaf hoppers, thrips and other stinging mouthparts pests. The mechanism of its insecticidal action is to act on the nicotinic acetylcholine receptors in the postsynaptic membrane of the insect nervous system and its surrounding nerves, so that the insects can maintain continuous excitement, paralysis and then die [2,3]. The effect of imidacloprid is relatively fast, and it will have a strong control effect on pests 1 day after the drug. Compared with traditional pesticides, imidacloprid has the advantages of high efficiency, high selectivity and lasting effect on target pests, and it has been widely used all over the world soon after its launch.
However, in the application process of imidacloprid, only a small amount of the effective components is absorbed by crops (about 5%), most of which will enter the soil and eventually enter the water environment with infiltration, runoff and other methods [4]. Due to the water solubility, stability, and persistence of imidacloprid, their residues have been detected in water bodies worldwide [5]. Struger et al. conducted three consecutive years of sampling and detection in the surrounding surface waters of 15 agricultural active areas in southwestern Ontario, Canada, from 2012 to 2014, and the results showed that the detection rate of imidacloprid exceeded 90% in more than half of the areas. In 75% of samples collected in two regions, the concentration of imidacloprid exceeded the local legal limit level (230ng/l) [6]. In California, Starner Keith et al. collected and tested 75 surface water samples from rivers, creeks and drains around farmland, and the results showed that imidacloprid was detected in 67 samples, with the maximum residue of 3.29μg/l and the average concentration of 0.77μg/l [7]. Similarly, imidacloprid residues have been detected in water bodies of various basins in China, such as the Yangtze River and the Yellow River, with detection concentrations ranging between 2.08 ng/l and 121.71 ng/l and an average detection concentration of 41.89 ng/l [8]. In conclusion, imidacloprid has been detected in lakes, rivers, groundwater and other water bodies at home and abroad to varying degrees, and some areas even exceed the standard seriously. The contamination of imidacloprid in aquatic environment may cause potential health hazards to aquatic organisms. Fish are an important part of aquatic life, so it is necessary to assess the potential harm of imidacloprid to fish.
Researchers previously believed that imidacloprid had low toxicity to nontarget organisms and lacked teratogenic, carcinogenic and mutagenic effects [9]. Until Whitehorn et al. discovered that the use of imidacloprid could significantly inhibit the reproductive ability of bumblebee populations, bringing attention to the safety of imidacloprid on nontarget organisms [10]. Subsequently, more and more studies have shown that imidacloprid has certain effects on non-target organisms. For example, low concentration of imidacloprid can induce intestinal histological damage and intestinal oxidative stress in zebrafish, significantly increase the levels of superoxide dismutase (SOD) and catalase (CAT), and slightly induce intestinal flora imbalance and specific bacterial changes [11]. Topal et al. studied the neurotoxicity of imidacloprid on the brain tissue of rainbow trout. The results showed that under the treatment of 10mg/l and 20mg/l imidacloprid, the activity of acetylcholinesterase (AChE) decreased and the activity of 8-hydroxy-2-deoxyguanosine (8-OHdG)(a marker related to cellular oxidative stress) increased in the brain tissue of rainbow trout. Moreover, oxidative stress parameters of rainbow trout were changed, thus showing neurotoxicity to rainbow trout [12]. Lonare et al. found that imidacloprid was hepatotoxic to rats and could also cause damage to the reproductive system of male rats. In addition, studies have shown that imidacloprid can also slow down the growth rate [13], reduce activity [14], damage DNA [15] and other effects on non-target organisms.
Goldfish (Carassius auratus Linnaeus), a Chinese species of Cyprinidae, was selected for this study to better reflect the impact of imidacloprid on environmental organisms. Previous research has identified the metabolites of imidacloprid in goldfish, including imidacloprid-urea, imidacloprid-olefin, 5-hydroxyimidacloprid, and 6-chloronicotinic acid [16]. This study aims to investigate the tissue distribution of imidacloprid and its metabolites in goldfish after exposure, providing new data support for the toxicity study of imidacloprid and a better understanding of its metabolic behavior in organisms.
2. Materials and Methods
2.1. Chemicals, instruments and animals
Reagents used in the experiment included imidacloprid (purity 95.00%) from Shanghai Yuanye Biotechnology Co., Ltd, imidacloprid standard (purity 98.00%) from Shanghai Anpu Experimental Technology Co., Ltd, and imidacloprid-urea methanol standard solution (100.00 mg/l), imidacloprid-olefin methanol standard solution (100.00 mg/l), 5-hydroxyimidacloprid methanol standard solution (100.00 mg/l), and 6-chloronicotinic acid methanol standard solution (100.00 mg/l) from Tianjin Alta Technology Co., Ltd. Chromatographic grade methanol and ethyl acetate were obtained from Millipore, and purified water was provided by Watson Co., Ltd. Anhydrous magnesium sulfate (analytical grade) was sourced from China Pharmaceutical Group Co., Ltd, and diatomite was from Shanghai McLean Biochemical Technology Co., Ltd.
The instruments utilized in the experiment included an Albrecht sciex5500+ high-performance liquid phase triple quadrupole tandem mass spectrometer, a Sartorius BSA124S one ten-thousandth scale from Sedolis, Germany, and an LC-DCY-12SF water bath nitrogen blowing instrument from Shanghai Lichen Instrument Technology Co., Ltd.
The test organism for the experiment was 3-month-old goldfish purchased from Hangzhou Fengqi Flower and Bird Market. The goldfish were domesticated in the laboratory for over a week prior to the formal experiment, with tap water treated by aeration dechlorination and meeting the provisions of the fishery water quality standard (GB11607-1989) used as the test water [17]. The goldfish were examined for the absence of imidacloprid and its metabolites in their bodies before exposure. The domestication conditions were maintained at a pH of 7.0-8.5, temperature of 20.9 ± 0.4°C, and dissolved oxygen of 6.9 ± 0.2 mg/l.
2.2. Exposure experiment
For the short-term exposure test, 60 domesticated goldfish were placed into a 20 L culture barrel with 15 L of test water containing 40 mg/l imidacloprid. After one day of exposure, the goldfish were transferred to clean water for purification, with breeding density maintained at 4 tails/L and test water renewed daily. Uneaten food and feces were removed from the tank shortly after feeding to prevent food absorption and adsorption. Five goldfish were randomly selected from the experimental group at 0 h, 0.5 d, 1 d, 1.5 d, and 3 d after transfer for dissection, with each fish as an independent sample. The goldfish were anesthetized on ice, and the liver, intestine, muscle, gill tissue, brain tissue, and gonad were dissected and stored at -80°C until analysis.
In the continuous exposure experiment, domesticated goldfish were randomly divided into a control group and two treatment groups with imidacloprid concentrations of 20 mg/l and 40 mg/l. The treatment concentrations were determined based on the LC50 value of imidacloprid on goldfish obtained in an earlier stage. The feeding conditions were consistent with the short-term exposure test. Goldfish were sampled and dissected before the start of the experiment and at 2 h, 6 h, 1 d, 3 d, 5 d, 7 d, 14 d, and 28 d of exposure, with the sampling process being identical to that of the exposure test.
2.3. Sample pretreatment
Goldfish tissue samples were placed into a 20 ml centrifuge tube and mixed with 12 ml ethyl acetate aqueous solution (v/v=2/1). The mixture was vortexed for 1 minute, and then 1 g anhydrous MgSO4 and 0.5 g diatomite were added, followed by another vortex and mixing for 1 minute. The sample was sonicated at room temperature for 10 minutes and then centrifuged at 4000 r/min at 4°C for 10 minutes. The upper layer supernatant was collected, dried using nitrogen gas, reconstituted with 1 ml of methanol, and subjected to membrane analysis.
2.4. Instrument Conditions
The HPLC column used was an Eclipse C18 column (1.8 μm, 3.0 × 100 mm, Agilent, USA) with a column temperature of 40°C, injection volume of 2 µL, and flow rate of 5 μL/s. The mobile phase consisted of 0.1% formic acid water (aqueous phase) and methanol (organic phase) using gradient elution. The elution procedure was as follows (Table 1).
Mass spectrometry was performed using an electrospray ion source (ESI) in positive ion mode, and select ion reaction monitoring mode (SRM) was used for scanning. The spray voltage was set at 4000 V, and the temperature was maintained at 200℃. High-purity nitrogen was used as both the sheath gas and auxiliary gas at a pressure of 60 psi, while the ion transport capillary temperature was set at 450℃. The collected fragments are summarized below(Table 2).
2.5. Detection limit, precision and recovery
The method used in this study was evaluated for its detection limit, limit of quantification, precision, and recovery, and the results showed that it met the detection requirements with good reproducibility and high precision (Table 3).
2.6. Data analysis
Data analysis was performed using Microsoft Excel 2019 software, and the mean value and standard deviation were calculated and analyzed by T-test.
3. Results
3.1. Concentration changes of imidacloprid and its metabolites in goldfish under short-term exposure
Figure 1 illustrates the concentration changes of imidacloprid and its metabolites in goldfish tissues under short-term exposure. Imidacloprid accumulated in goldfish after one day of exposure, with the highest concentration in the liver (23.411 μg/gtissue), followed by the intestine (16.20 μg/gtissue), muscle (8.61 μg/gtissue), gill (7.36 μg/gtissue), gonads (7.41 μg/gtissue), and brain (7.15 μg/gtissue). After transfer to clean water, the concentration of imidacloprid and its metabolites in all tissues showed a decreasing trend, and after 3 days, the content in all tissues was lower than the detection limit.
3.2. Concentration changes of imidacloprid in goldfish under continuous exposure
The changes in imidacloprid concentration in different tissues of goldfish with exposure time are presented in Figure 2 during the continuous exposure treatment test. There were significant differences in the distribution of imidacloprid in muscle, liver, intestine, brain tissue, muscle, and gonad (P < 0.05). In the high concentration treatment group, imidacloprid accumulation increased rapidly in each tissue at the beginning of the treatment, reaching a peak on day 5. Subsequently, from day 5 to day 28, the accumulation rate of imidacloprid in each tissue declined and eventually reached a steady state. The intestinal tract and muscle even showed a downward trend between days 5 and 14. Finally, after 28 days of exposure, the accumulation of imidacloprid in goldfish tissues from high to low was liver (12.040 μg/g tissue), intestine (9.91 μg/g tissue), muscle (6.20 μg/g tissue), gill (6.11 μg/g tissue), gonads (5.22 μg/g tissue), and brain (2.87 μg/g tissue). In the low concentration treatment group, the accumulation of imidacloprid was similar to that in the high concentration treatment group. It accumulated rapidly in tissues from 0 to 5 days and gradually decreased from 5 to 28 days. The amount of imidacloprid accumulated in various tissues from high to low was intestine (6.93 μg/g tissue), liver (6.10 μg/g tissue), muscle (4.20 μg/g tissue), gonads (3.93 μg/g tissue), gill (2.81 μg/g tissue), and brain (2.30 μg/g tissue).
3.3. Dynamic changes in imidacloprid metabolites in different tissues of goldfish under continuous exposure
3.3.1. Concentration changes in imidacloprid metabolites in gill tissues
Figure 3 illustrates the presence of imidacloprid-urea, 6-chloronicotinic acid, and 5-hydroxyimidacloprid in the gill tissue of goldfish following exposure to imidacloprid. In the high concentration treatment group, the concentration of imidacloprid urea increased in the gill tissue, ultimately reaching 435.59 ng/g tissue at 28 days. The accumulation of imidacloprid urea was relatively gradual during the first 3 days, with a rapid increase to 374.30 ng/g tissue at day 5, followed by a slow increase to its maximum concentration between days 5-28. The concentration of 6-chloronicotinic acid initially decreased, subsequently increased, and then decreased again in the gill tissue. At days 0-3, its concentration declined from 6.85 ng/g tissue to 3.40 ng/g tissue, followed by an increase to a maximum of 10.92 ng/g tissue at day 5, which then decreased to 4.47 ng/g tissue by day 28. The maximum accumulation of 5-hydroxyimidacloprid was observed at 761.24 ng/g tissue at 6 hours, followed by a downward trend until day 28, with a final concentration of 140.48 ng/g tissue.
In the low concentration treatment group, the accumulation of imidacloprid urea exhibited a similar trend as observed in the high concentration group, with a slight increase from 0-3 d, followed by a decline after peaking at 278.26 ng/g tissue in 3-7 d. The accumulation of imidacloprid urea was 167.51 ng/g tissue at 28 d. In the 0-28 d period, the content of 6-chloronicotinic acid exhibited two peaks at 6 h and 5 d posttreatment, with concentrations of 3.18 ng/g tissue and 8.37 ng/g tissue, respectively. The final accumulation was 1.57 ng/g tissue at 28 d. The maximum accumulation of 5-hydroxyimidacloprid reached 148.22 ng/g tissue at 6 h and showed a downward trend from 6 h-5 d. Once it decreased to a certain concentration, the content of 5-hydroxyimidacloprid suddenly increased on the 7th day and then began to decline. Ultimately, the concentration of 5-hydroxyimidacloprid was 37.69 ng/g tissue on the 28th day.
3.3.2. Dynamic changes in imidacloprid metabolites in the intestine
Figure 4 illustrates that in addition to imidacloprid urea, 5-hydroxyimidacloprid and 6-chloronicotinic acid, imidacloprid was detected in the intestine after imidacloprid exposure. The maximum accumulation of these metabolites, from high to low, was observed for 5-hydroxyimidacloprid, imidacloprid urea, 6-chloronicotinic acid, and IMI imidacloprid. In the high concentration treatment group, imidacloprid urea showed an increasing trend until 1 day, reaching a maximum value of 422.77 ng/g tissue, followed by a gradual decline, and finally stabilized at a concentration of 249.23 ng/g tissue. The dynamics of accumulation of 6-chloronicotinic acid were more complex, with an initial increase and subsequent decrease observed in 2 h-1 d, 1-7 d, and 7-28 d, respectively. The maximum accumulation was observed at 14 d (30.37 ng/g tissue), while the final concentration was 2.67 ng/g tissue at 28 d. The content of 5-hydroxyimidacloprid peaked value of 999.02 ng/g tissue at 6 h, followed by a declining trend, reaching a certain level at 3 d, then increasing to 461.78 ng/g tissue at 3-5 d, and finally stabilizing at a concentration of 149.23 ng/g tissue at 28 d. The content of imidacloprid-olefin ene increased until 3 days, then decreased to 6.05 ng/g tissue on the 5th day, and then gradually increased again. Finally, the content of imidacloprid-olefin was 9.23 ng/g tissue at 28 d.
In the low concentration treatment group, the accumulation of imidacloprid urea was comparable to that in the high concentration treatment group, with an accumulation of 183.54 ng/g tissue observed at 28 days. The concentration of 6-chloronicotinic acid demonstrated an overall increase within the first 5 days, with a maximum of 12.24 ng/g tissue on day 5, followed by a decline. The final concentration of 6-chloronicotinic acid was 5.49 ng/g tissue at 28 days, which was higher than that observed in the high concentration treatment group. The concentration of 5-hydroxyimidacloprid was similar to that in the high concentration treatment group, with a maximum accumulation of 488.64 ng/g tissue and a final concentration of 83.54 ng/g tissue at 28 days. The accumulation dynamics of imidacloprid were similar to those of 6-chloronicotinic acid, with a maximum accumulation of 3.53 ng/g tissue.
3.3.3. Dynamic changes in imidacloprid metabolites in the liver
The results depicted in Figure 5 indicate that the metabolites of imidacloprid in the liver are consistent with those in the intestine. In the high concentration treatment group, the maximum content of each metabolite was in the following order: imidacloprid-urea, 5-hydroxyimidacloprid, imidacloprid-olefin, and 6-chloronicotinic acid. The accumulation dynamics of imidacloprid urea and 5-hydroxyimidacloprid were similar, with their concentrations reaching a maximum at 6 h after exposure, 952.38 ng/g tissue and 653.13 ng/g tissue, respectively, and then reaching a relative equilibrium state from 6 h to 28 d. Finally, the concentration distribution was 206.33 ng/g tissue and 156.27 ng/g tissue at 28 d. The content of 6-chloronicotinic acid showed a zigzag upward trend within 0-7 d, reached a maximum accumulation of 18.79 ng/g tissue at 7 d, and began to decline. The final concentration was 12.24 ng/g tissue at 28 d, which was lower than that of the low concentration treatment group. The concentration of imidacloprid increased from 0 to 3 days, reaching a maximum of 49.65 ng/g tissue at 3 days and remaining relatively stable after the concentration decreased at 5 days.
In the low concentration treatment group, the metabolites of imidacloprid in the liver were found to follow the same pattern as that of the high concentration treatment group. The maximum accumulation amounts of each metabolite in the low concentration group were 5-hydroxyimidacloprid, imidacloprid urea, imidacloprid-olefin, and 6-chloronicotinic acid, in descending order. The concentration changes of imidacloprid-urea and 5-hydroxyimidacloprid were similar to those in the high concentration group, with maximum accumulation amounts of 271.29 ng/g tissue and 423 ng/g tissue, respectively, at 6 h. The content of 6-chloronicotinic acid showed an increasing trend before 14 days, reaching a maximum of 13.76 ng/g tissue at 14 days and then decreasing at 28 days. The concentration of imidacloprid showed an upward trend in the first day, accumulated to the maximum value of 28.32 ng/g tissue, and began to decrease in the following 1-5 days. The concentration then stabilized at 24.32 ng/g tissue from 7-28 days.
3.3.4. Dynamic changes in imidacloprid metabolites in muscle
Figure 6 illustrates the accumulation dynamics of three metabolites of imidacloprid in goldfish brain tissue. The metabolites' maximum content in the brain tissue was 5-hydroxyimidacloprid, imidacloprid urea, and 6-chloronicotinic acid, in descending order. In the high concentration treatment group, the concentration of imidacloprid urea in goldfish muscle tissue fluctuated, with a maximum accumulation of 289.50 ng/g tissue at 28 d. The concentration of 6-chloronicotinic acid in muscle tissue ranged between 3.06-18.86 ng/g tissue. The concentration of 5-hydroxyimidacloprid reached its maximum of 650.35.45 ng/g tissue at 6 h, then decreased to a certain level and remained relatively stable, with a final concentration of 189.50 ng/g tissue at 28 d. In the low concentration treatment group, the accumulation dynamics of imidacloprid urea and 5-hydroxyimidacloprid were similar to those in the high concentration treatment group. However, in the low concentration treatment group, the concentration of 6-chloronicotinic acid first increased and then decreased, reaching a maximum accumulation of 14.03 ng/g tissue.
3.3.5. Dynamic changes in imidacloprid metabolites in brain tissue
Figure 7 presents the accumulation dynamics of imidacloprid metabolites in goldfish brain tissue. Three metabolites of imidacloprid were detected in the brain tissue, with 5-hydroxyimidacloprid, imidacloprid urea, and 6-chloronicotinic acid being the metabolites with the highest accumulation. In the high concentration treatment group, imidacloprid urea showed an increasing trend within 0-5 d, reaching a maximum accumulation of 314.76 ng/g tissue at 5 d, and then decreased to a lower level at 14 d and 28 d. The concentration of 6-chloronicotinic acid peaked at 10.51 ng/g tissue on the first day and then decreased to a stable level. The maximum accumulation of 5-hydroxyimidacloprid was 640.83 ng/g tissue at 6 h, and its concentration then decreased, with a final concentration of 249.21 ng/g tissue at 28 d. In the low concentration treatment group, the three metabolites showed a trend of increasing first and then decreasing. The maximum content of imidacloprid urea was 121.91 ng/g tissue on the 7th day, after which its concentration decreased. 6-Chloronicotinic acid reached a maximum of 5.28 ng/g tissue on the 5th day, and the maximum accumulation of 5-hydroxyimidacloprid was 386.76 ng/g tissue at 6 h.
3.3.6. Dynamic changes in imidacloprid metabolites in gonads
In the gonads of goldfish, the concentration of imidacloprid urea is significantly lower than that of other tissues, with its maximum content amounting to only one-tenth of that observed in other tissues. In the high concentration treatment group, imidacloprid urea exhibited a steady rise before 0-5 d, followed by a sharp increase to a maximum value of 37.97 ng/g tissue on the 7th day, and subsequently returned to normal levels between the 14th and 28th days. 6-Chloronicotinic acid showed two peaks of 15.98 ng/g tissue and 17.98 ng/g tissue at 6 h and 7 d, respectively. The concentration of 5-hydroxyimidacloprid increased initially and then decreased, reaching a maximum accumulation of 385.21 ng/g tissue at 7 days. In the low concentration treatment group, the concentrations of imidacloprid urea, 6-chloronicotinic acid, and 5-hydroxyimidacloprid reached their maximum levels at 6 h, with concentrations of 12.22 ng/g tissue, 12.22 ng/g tissue, and 183.07 ng/g tissue, respectively. Subsequently, the concentrations of these three metabolites decreased from 6 h to 28 d.
4. Discussion
In the short-term exposure experiment, it was observed that the content of imidacloprid and its metabolites in all tissues was below the detection limit three days after transfer, which is consistent with the degradation rate of imidacloprid in rats. After oral administration of imidacloprid to rats, it was found that the initial half-life of imidacloprid was approximately 3 hours, while the final half-life ranged from 26 to 118 hours, and the residual amount of imidacloprid in tissues was less than 1% after 48 hours. Similarly, Poliserpi et al. reported that the concentration of imidacloprid in the tissues of Agelaioides badius was below the detection limit after 48 hours of oral administration of imidacloprid in the United States [18]. These findings suggest that imidacloprid undergoes rapid degradation in organisms. The accumulation of chemicals in organisms is often dependent on their solubility, where better water solubility leads to poorer accumulation ability [19]. Due to its better water solubility, imidacloprid and its metabolites have a faster degradation rate in goldfish. In contrast, the concentration of imidacloprid in gills increased at 1-1.5 days. The gill is the primary sensing organ of fish for pollutants in water, and due to the lack of metabolic enzymes around it, the concentration of imidacloprid in gill tissue should increase with increasing exposure time [20]. Subsequently, water samples were collected at 1-1.5 days, and a certain amount of imidacloprid was detected in the water samples at 1.5 days (unpublished data). This could be due to imidacloprid absorbed by goldfish being excreted through the intestine and then reabsorbed by the gills, resulting in a transient rise in the concentration of imidacloprid in the gills.
The continuous exposure test revealed that goldfish accumulated the highest concentration of imidacloprid in their intestine and liver. This result is consistent with previous studies, such as Yi Yang et al.'s research, which found that after thiamethoxam exposure, zebrafish had the highest concentration of thiamethoxam in their liver and intestine, suggesting that the hepatointestinal system is a primary site of accumulation for exogenous drugs [21]. Similarly, Yang Bin IHM's study reported that the highest accumulation of imidacloprid in crucian carp was found in the liver [22]. Therefore, it can be inferred that the accumulation pathway through hepatointestinal recycling may play an important role in imidacloprid absorption in fish. Furthermore, the accumulation dynamics of imidacloprid in the intestine, liver, gill tissue, and brain tissue were relatively straightforward, with their content increasing with the duration of exposure. In contrast, the accumulation in muscle and gonad was more complex. Previous research has indicated that imidacloprid accumulates in the muscle tissue of Procambarus clarkii, likely due to the high lipid content of the muscle composition and imidacloprid's lipophilicity. The presence of metabolic enzymes in muscle tissue leads to the degradation of imidacloprid into low-toxicity metabolites, which enter the bloodstream and are excreted from the body [20]. The gonad is located on the dorsal wall of the body cavity of goldfish, near the end of the intestine. The accumulation of imidacloprid in the gonad may be affected by multiple factors, including the intestine and blood, resulting in complex accumulation dynamics.
Subsequently, we analyzed the timing of the maximum accumulation of imidacloprid metabolites in each tissue and the ratio between the maximum accumulation and absorbed imidacloprid. The results are presented in Table 4. It is evident that 5-hydroxyimidacloprid had the highest concentration in all tissues, followed by imidacloprid urea. Only a small amount of imidacloprid was detected as 6-chloronicotinic acid and imidacloprid-olefin, with the latter only present in the liver and intestine. This distribution indicated that imidacloprid urea and 5-hydroxyimidacloprid were the primary metabolites of imidacloprid in goldfish, while 6-chloronicotinic acid and imidacloprid were secondary metabolites. This differs from Suchail et al.'s research on the distribution and metabolism of imidacloprid in bees, where imidacloprid-urea and 6-chloronicotinic acid were the main metabolites, especially in the midgut and rectum. imidacloprid-olefin and 4,5-dihydroxyimidacloprid were preferentially produced in the head, chest, and abdomen, which are rich in acetylcholine receptors [23]. The differences in this experiment's distribution may be attributed to the concentration of imidacloprid used in the treatment and the differences in metabolic pathways between vertebrates and nonvertebrates. Byren and Nishiwaki's research showed that the primary metabolites of imidacloprid after metabolism in houseflies and bees were 5-hydroxyimidacloprid, 4,5-dihydroxyimidacloprid, 6-chloronicotinic acid, imidacloprid-olefin, and imidacloprid urea. See Figure 9 for the metabolic pathways [24,25].
In this study, the highest ratio of the total content of metabolites detected in the liver to imidacloprid was observed at 6 h after exposure, indicating that the liver is likely the earliest metabolic site for imidacloprid in goldfish. The intestine was also found to be an important site for imidacloprid metabolism. These findings are consistent with a previous study by Yang et al., which showed that the metabolism of thiamethoxam in zebrafish occurred in both the liver and intestine and that its metabolic pathway involved N-demethylation and nitro reduction [26]. After exogenous drugs enter the organism, phase I and phase II metabolism occur under the action of catalytic enzymes in the body. Phase I metabolism mainly involves hydroxylation, desaturation, dealkylation, and nitro reduction, among other reactions. The cytochrome CYP450 enzyme, which exists in the liver, is an important oxidative metabolic enzyme that catalyzes these reactions [27]. The structure of imidacloprid, shown in Figure 10, contains chemical reaction sites located on the methylene bridge chain (I structure), the pharmacophore nitroimine (II structure), and the six-membered ring (III structure), which can undergo a series of metabolic reactions under the action of catalytic enzymes in vivo. Based on these observations, we hypothesize that the possible metabolic pathway of imidacloprid in goldfish involves a dehydrogenation reaction in the I structure to generate imidacloprid-olefin, followed by hydroxylation and nitro reduction reactions to generate 5-hydroxyimidacloprid, imidacloprid urea, and 6-chloronicotinic acid, as shown in Figure 11. These metabolites enter tissues through the circulatory system for enrichment or exclusion.
Upon detoxification and metabolism, the biological activity of imidacloprid metabolites will decrease, but in some cases, imidacloprid may produce more active metabolites. For instance, Suchail's study revealed that the two secondary metabolites of imidacloprid in bees, imidacloprid alkenyl and 5-hydroxyimidacloprid, may have a greater relationship with the toxicity of imidacloprid. The toxicity of imidacloprid alkenyl is twice that of imidacloprid and 10 times that of 5-hydroxyimidacloprid [28]. Additionally, studies have reported that the toxicity of imidacloprid-olefin to Bemisia tabaci and Myzus persicae is approximately 10 times and 16 times higher than that of imidacloprid, respectively, indicating that imidacloprid alkenyl has higher toxicity than the parent compound [29]. In this study, a small amount of imidacloprid-olefin was detected in the intestine and liver of goldfish, and further exploration of its subsequent effects on the intestine and liver can help clarify the toxicity mechanism of imidacloprid-olefin. Moreover, metabolites with nitroimine pharmacophores, such as hydroxylated imidacloprid and alkenylimidacloprid, are toxic to bees, while imidacloprid urea and 6-chloronicotinic acid, which are metabolites without pharmacodynamic groups, are nontoxic to bees [30]. The biological activities of imidacloprid and its metabolites, from high to low, are olefinic imidacloprid, imidacloprid, 4-hydroxyimidacloprid, 5-hydroxyimidacloprid, and 4,5-dihydroxyimidacloprid. Thus, the biological activity of imidacloprid is produced by the interaction of parent and metabolites. In-depth studies on the differences in the metabolic pathways of imidacloprid in target and nontarget organisms, as well as its metabolic differences in different parts of the same organism, can provide a better understanding of its toxic mechanism and provide ideas and references for the standardized use of imidacloprid.
5. Conclusion
In this study, HPLC‒MS was used to investigate the tissue distribution of imidacloprid and its metabolites in goldfish after short-term and continuous exposure. The results of the short-term exposure experiments indicated that after transferring the exposed goldfish to an imidacloprid-free aqueous solution, the concentrations of imidacloprid and its metabolites in various tissues decreased and were below the detection limit after 3 days. The concentrations of imidacloprid and its metabolites varied among different treatment concentrations in the continuous exposure experiments. Among the imidacloprid metabolites, 5-hydroxyimidacloprid and imidacloprid urea accumulated in equivalent amounts in various tissues, followed by 6-chloronicotinic acid. imidacloprid-olefin was detected only in the intestine and liver. These results allowed us to propose a possible metabolic pathway of imidacloprid in goldfish. This study contributes to our understanding of the metabolic behavior of imidacloprid in organisms and provides new data to support the investigation of its toxicity.
Author Contributions
Conceptualization, Liezhong Chen; methodology, Wanghui Xu; software, Wanghui Xu, Lulu Zhang; validation, Jiayin Hou; resources, Wanghui Xu, Lulu Zhang and Jiayin Hou; data curation, Lulu Zhang; writing—original draft preparation, Wanghui Xu; writing—review and editing, Liezhong Chen; supervision, Xiaohua Du; funding acquisition, Liezhong Chen. All authors have read and agreed to the published version of the manuscript.
Funding
This work was supported by the National Key R&D Program of China, 2018YFD0200100, 2021YFD1700103, and 2022YFD1700304.
Informed Consent Statement
Not applicable.
Data Availability Statement
The data presented in this study are available on request from the corresponding author.
Conflicts of Interest
The authors declare no conflict of interest.
References
- Peter Jeschke, Ralf Nauen, Michael Schindler, Alfred Elbert, Overview of the Status and Global Strategy for Neonicotinoids [J]. Journal of Agricultural and Food Chemistry, 2011,59:(7)2897-2908. [CrossRef]
- Dave Goulson, David Kleijn, REVIEW: An overview of the environmental risks posed by neonicotinoid insecticides [J]. Journal of Applied Ecology, 2013,50:(4)977-987. [CrossRef]
- John E. Casida, Neonicotinoids and Other Insect Nicotinic Receptor Competitive Modulators: Progress and Prospects, in: M.R. Berenbaum (Ed.), Annual Review of Entomology, Vol 632018, pp. 125-144.
- Michelle L. Hladik, Anson R. Main, Dave Goulson, Environmental Risks and Challenges Associated with Neonicotinoid Insecticides [J]. Environmental Science & Technology, 2018,52:(6)3329-3335. [CrossRef]
- J. C. Anderson, C. Dubetz, V. P. Palace, Neonicotinoids in the Canadian aquatic environment: A literature review on current use products with a focus on fate, exposure, and biological effects [J]. Science of the Total Environment, 2015,505:409-422. [CrossRef]
- J. Struger, J. Grabuski, S. Cagampan, E. Sverko, D. McGoldrick, C. H. Marvin, Factors influencing the occurrence and distribution of neonicotinoid insecticides in surface waters of southern Ontario, Canada [J]. Chemosphere, 2017,169:516-523. [CrossRef]
- Starner Keith, Goh Kean S, Detections of the neonicotinoid insecticide imidacloprid in surface waters of three agricultural regions of California, USA, 2010-2011 [J]. Bulletin of environmental contamination and toxicology, 2012,88:(3). [CrossRef]
- Xu Meijia, Huang Huiting, Li Na, Li Fang, Wang Donghong, Luo Qian, Occurrence and ecological risk of pharmaceuticals and personal care products (PPCPs) and pesticides in typical surface watersheds, China [J]. Ecotoxicology and Environmental Safety, 2019,175:289-298. [CrossRef]
- Zhang Qi, Zhao Cheng, Lu Xiaoxia, Yu Bo, Huang Yuting, Advances in Research on Toxic Effects of Neonicotinoid Insecticides on Non-target Organisms [J]. Asian Journal of Ecotoxicology, 2019,15:(1)56-71. [CrossRef]
- Penelope R. Whitehorn; Stephanie O’Connor; Felix L. Wackers; Dave Goulson, Neonicotinoid Pesticide Reduces Bumble Bee Colony Growth and Queen Production [J]. Science, 2012,336:(6079)351-352.
- Ting Luo, Xiaoyu Wang, Yuanxiang Jin, Low concentrations of imidacloprid exposure induced gut toxicity in adult zebrafish (Danio rerio) [J]. Comp Biochem Physiol C Toxicol Pharmacol, 2021,241:108972. [CrossRef]
- Ahmet Topal, Gonca Alak, Mustafa Ozkaraca, Ash Cilingir Yeltekin, Selim Comakli, Gurdal Acil, Mine Kokturk, Muhammed Atamanalp, Neurotoxic responses in brain tissues of rainbow trout exposed to imidacloprid pesticide: Assessment of 8-hydroxy-2-deoxyguanosine activity, oxidative stress and acetylcholinesterase activity [J]. Chemosphere, 2017,175:186-191. [CrossRef]
- Swapnil S. Phugare, Jyoti P. Jadhav, Biodegradation of Acetamiprid by Isolated Bacterial Strain Rhodococcus sp. BCH2 and Toxicological Analysis of Its Metabolites in Silkworm ( Bombax mori ) [J]. CLEAN – Soil, Air, Water, 2015,43:(2). [CrossRef]
- Decourtye Axel, Devillers James, Cluzeau Sophie, Charreton Mercedes, Pham-Delègue Minh-Hà, Effects of imidacloprid and deltamethrin on associative learning in honeybees under semi-field and laboratory conditions [J]. Ecotoxicology and environmental safety, 2004,57:(3). [CrossRef]
- Weili Ge, Saihong Yan, Jinhua Wang, Lusheng Zhu, Aimei Chen, Jun Wang, Oxidative stress and DNA damage induced by imidacloprid in zebrafish (Danio rerio) [J]. Journal of Agricultural and Food Chemistry, 2015,63:(6)1856-62. [CrossRef]
- Xu Wanghui, Hou Jiayin, Zhou Zhongjing, Yu Jianzhong, Zhang Lulu, Du Xiaohua, Chen Liezhong, A method for detection of imidacloprid and its metabolites in Carassius auratus Linnaeus [J]. Modern Agrochemicals 2023,phrase indicating stage of publication(in press).
- Fisheries Water Quality Standards Revision Section, Water quality standard for fisheries GB 11607-1989 [S]. China National Environmental Protection Bureau,1989.
- Poliserpi María Belén, Cristos Diego, PérezIglesias Juan Manuel, Brodeur Julie Céline, Tissue distribution and sublethal effects of imidacloprid in the South American grayish baywing (Agelaioides badius) [J]. Chemosphere, 2021,284. [CrossRef]
- Jin H.J., Yang R., shuihuanjing zhong huaxuepin de shengwu jilei yu jiance(Bioaccumulation and monitoring of chemicals in the water environment) [J]. Huanjing jiance guanli yu jishu, 1990,(04)12-18.
- Li Siqi.Evaluation of The Safety Of Imidacloprid And Its Metabolites Under The Integrated Rice And Procambarus Clarkii Breeding Model [D]. Huazhong Agricultural University,2020.
- Yi Yang, Limin Su, Ying Huang, Xiao Zhang, Chao Li, Jia Wang, Lingyun Fan, Shuo Wang, Yuan H. Zhao, Bio-uptake, tissue distribution and metabolism of a neonicotinoid insecticide clothianidin in zebrafish [J]. Environmental Pollution, 2022,292. [CrossRef]
- Yang Bin Ihm, Chan Sub Kim, Hee Dong Lee, Mihye Jeong, Dae Kyu Kim, Kee Sung Kyung, Behavior of the Insecticide Imidacloprid in Crucian Carp (Carassius auratus L.) and Its Toxic Effects on Organs [J]. The Korean Journal of Pesticide Science, 2006,10:(4).
- Séverine Suchail, Georges de Sousa, Roger Rahmani, Luc Belzunce, In vivo distribution and metabolisation of 14C-imidacloprid in different compartments of Apis mellifera L [J]. Pest Management Science, 2004,60:(11)1056-1062. [CrossRef]
- F. J. Byrne, S. Castle, N. Prabhaker, N. C. Toscano, Biochemical study of resistance to imidacloprid in B biotype Bemisia tabaci from Guatemala [J]. Pest Management Science, 2003,59:(3)347-52. [CrossRef]
- S Suchail, L. Debrauwer, L. P. Belzunces, Metabolism of imidacloprid in Apis mellifera [J]. Pest Management Science, 2004,60:(3)291-6. [CrossRef]
- Y. Yang, L. Su, Y. Huang, X. Zhang, C. Li, J. Wang, L. Fan, S. Wang, Y. H. Zhao, Bio-uptake, tissue distribution and metabolism of a neonicotinoid insecticide clothianidin in zebrafish [J]. Environ Pollut, 2022,292:(Pt A)118317. [CrossRef]
- Wang Rui, Xiang Qian, Chen Kun, Fang Yi, Advance in search for influence of CYP450 genetic polymorphism to drugmetabolism [J]. The Chinese Journal of Clinical Pharmacology, 2004,20:(2)134-138.
- Séverine Suchail, David Guez, Luc P. Belzunces, Characteristics of imidacloprid toxicity in twoApis melliferasubspecies [J]. Environmental Toxicology and Chemistry, 2000,19:(7)1901-1905. [CrossRef]
- Fan Yinjun, Shi Xueyan, Gao Xiwu, Research progresses on the metabolism of neonicotinoids imidacloprid and thiamethoxam [J]. Chinese Journal of Pesticide Science, 2012,14:(6)587-596.
- Ralf Nauen, Klaus Tietjen, Klaus Wagner, Alfred Elbert, Efficacy of Plant Metabolites of Imidacloprid against Myzus persicae and Aphis gossypii (Homoptera: Aphididae) [J]. Pesticide Science, 1998,52:(1)53-57.
Figure 1.
Concentration changes of imidacloprid and its metabolites in goldfish under short-term exposure(treatment concentration: 40mg/l), a: imidacloprid, b: imidacloprid-urea, c: 6-chloronicotinic acid, d: 5-hydroxyimidacloprid.
Figure 1.
Concentration changes of imidacloprid and its metabolites in goldfish under short-term exposure(treatment concentration: 40mg/l), a: imidacloprid, b: imidacloprid-urea, c: 6-chloronicotinic acid, d: 5-hydroxyimidacloprid.
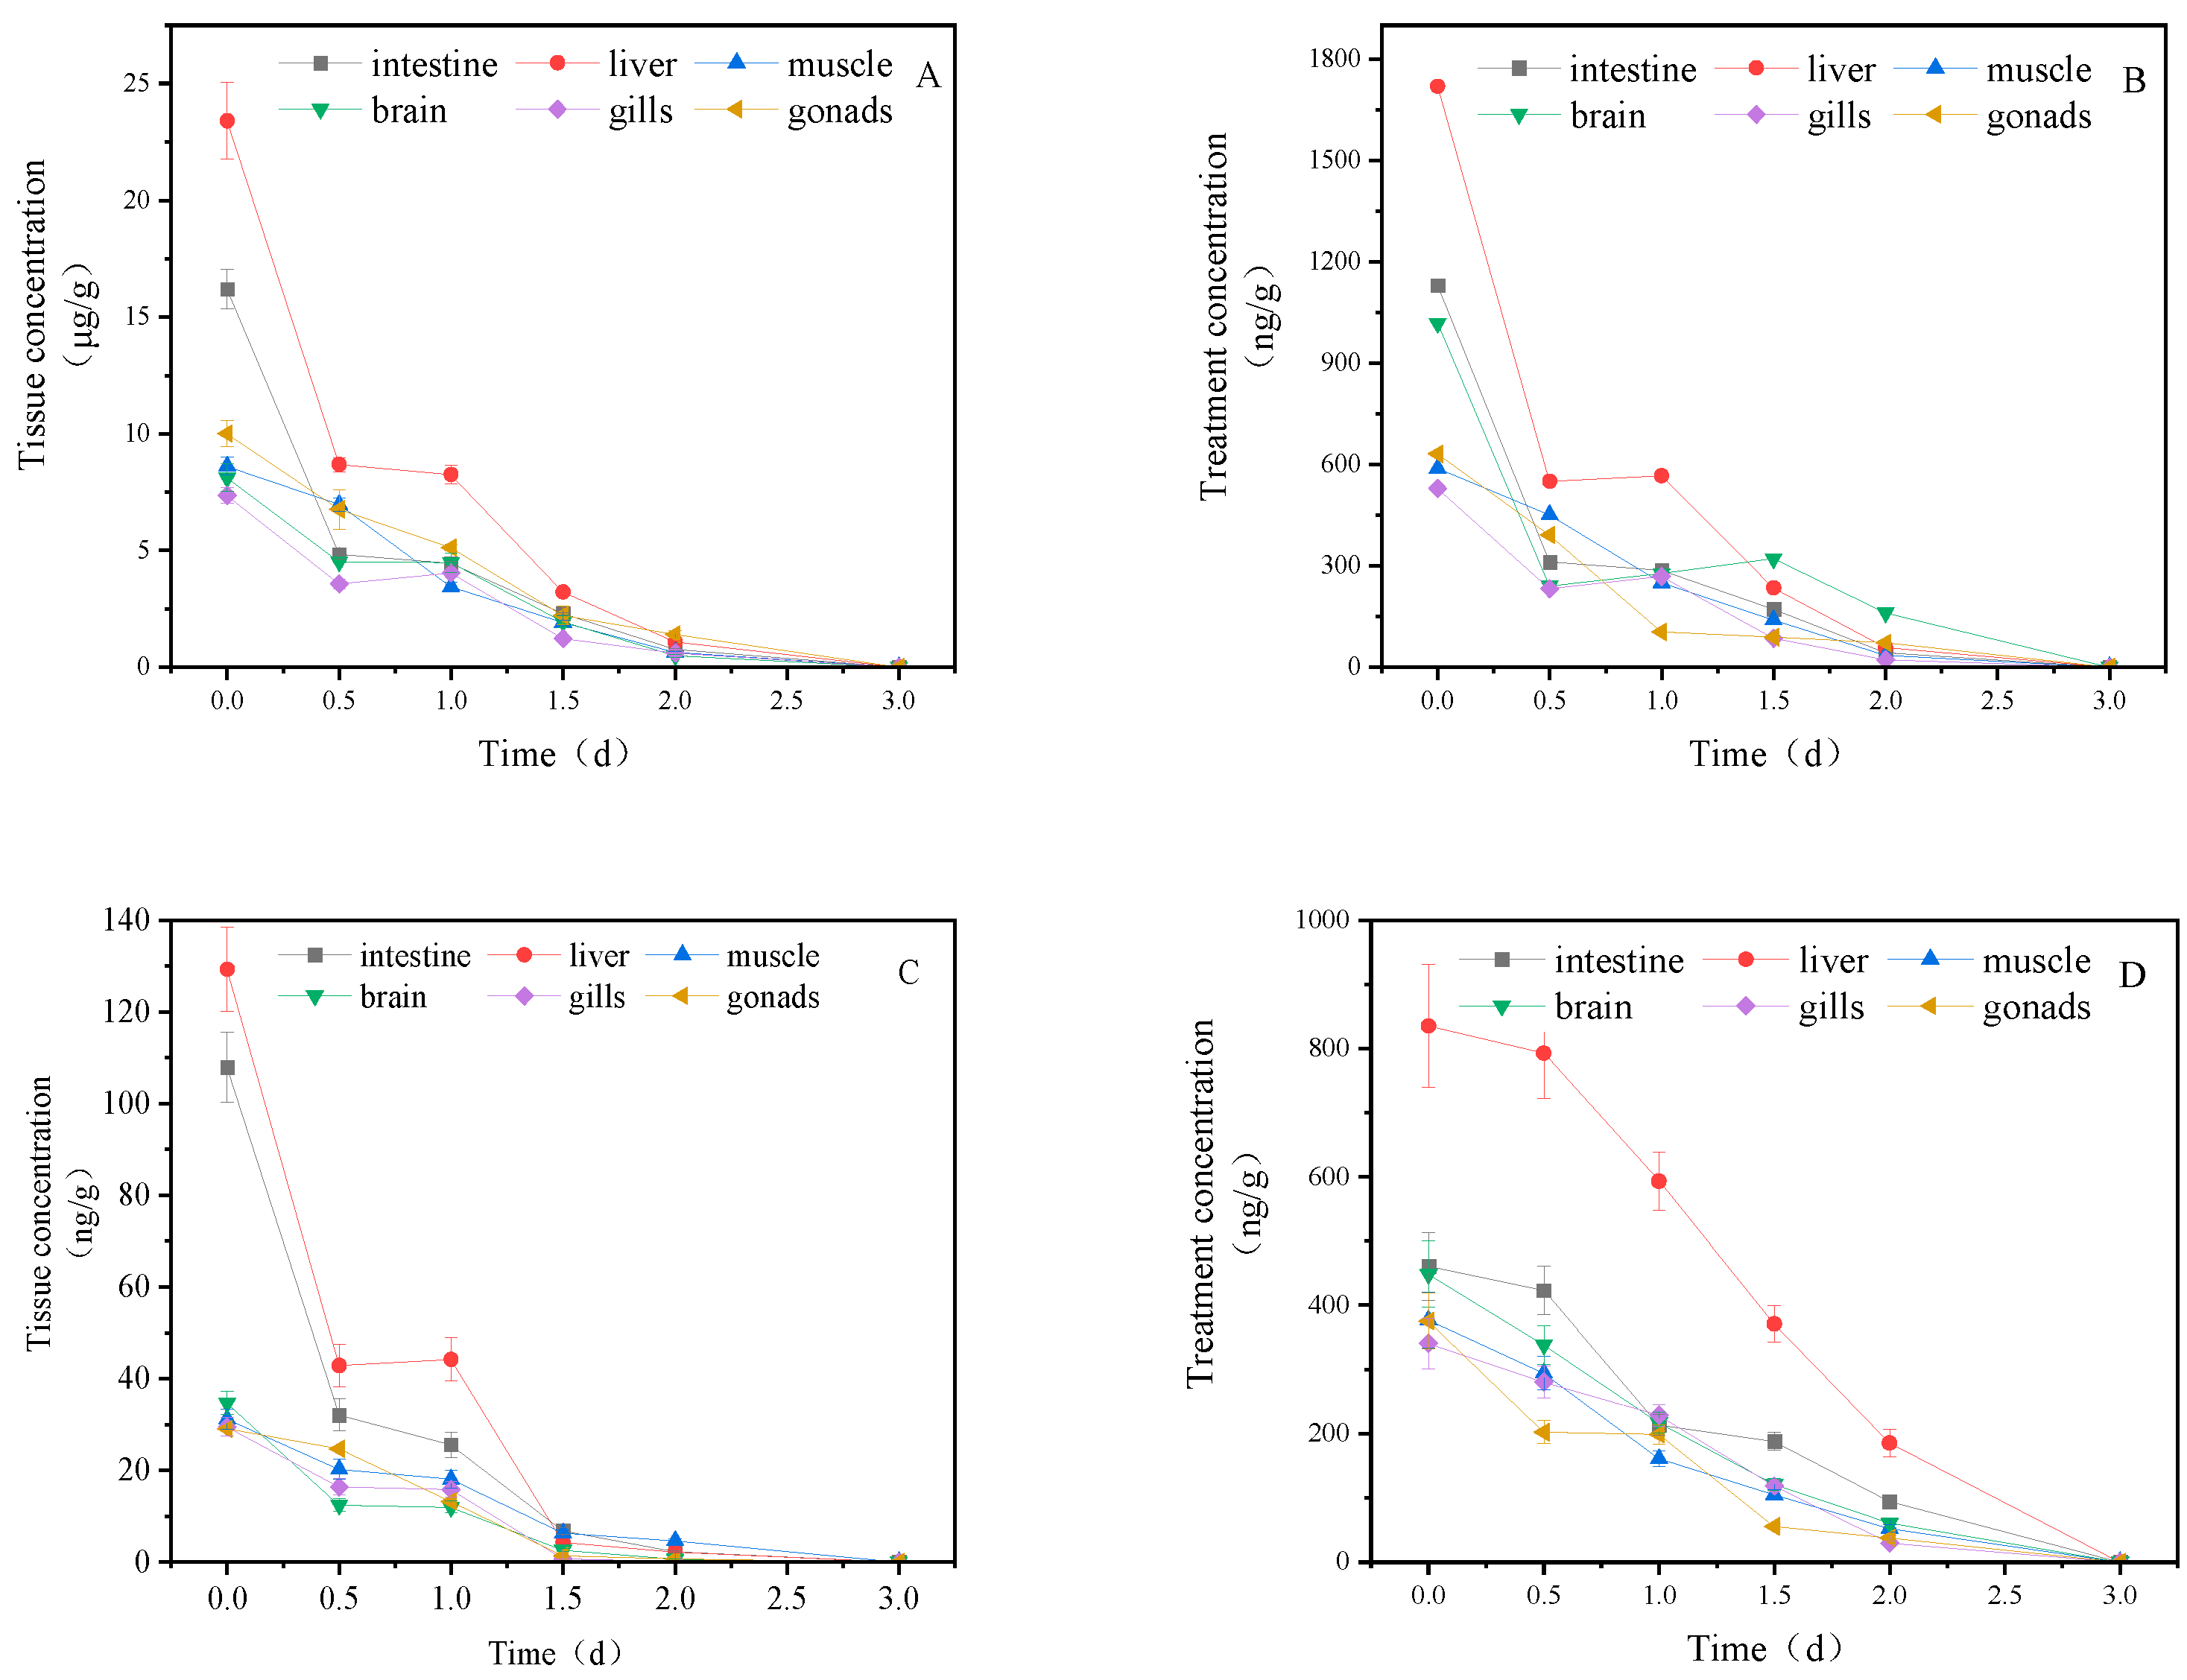
Figure 2.
Concentration changes imidacloprid in goldfish under continuous exposure(Treatment concentration: S1:20mg/l; S2:40mg/l).
Figure 2.
Concentration changes imidacloprid in goldfish under continuous exposure(Treatment concentration: S1:20mg/l; S2:40mg/l).
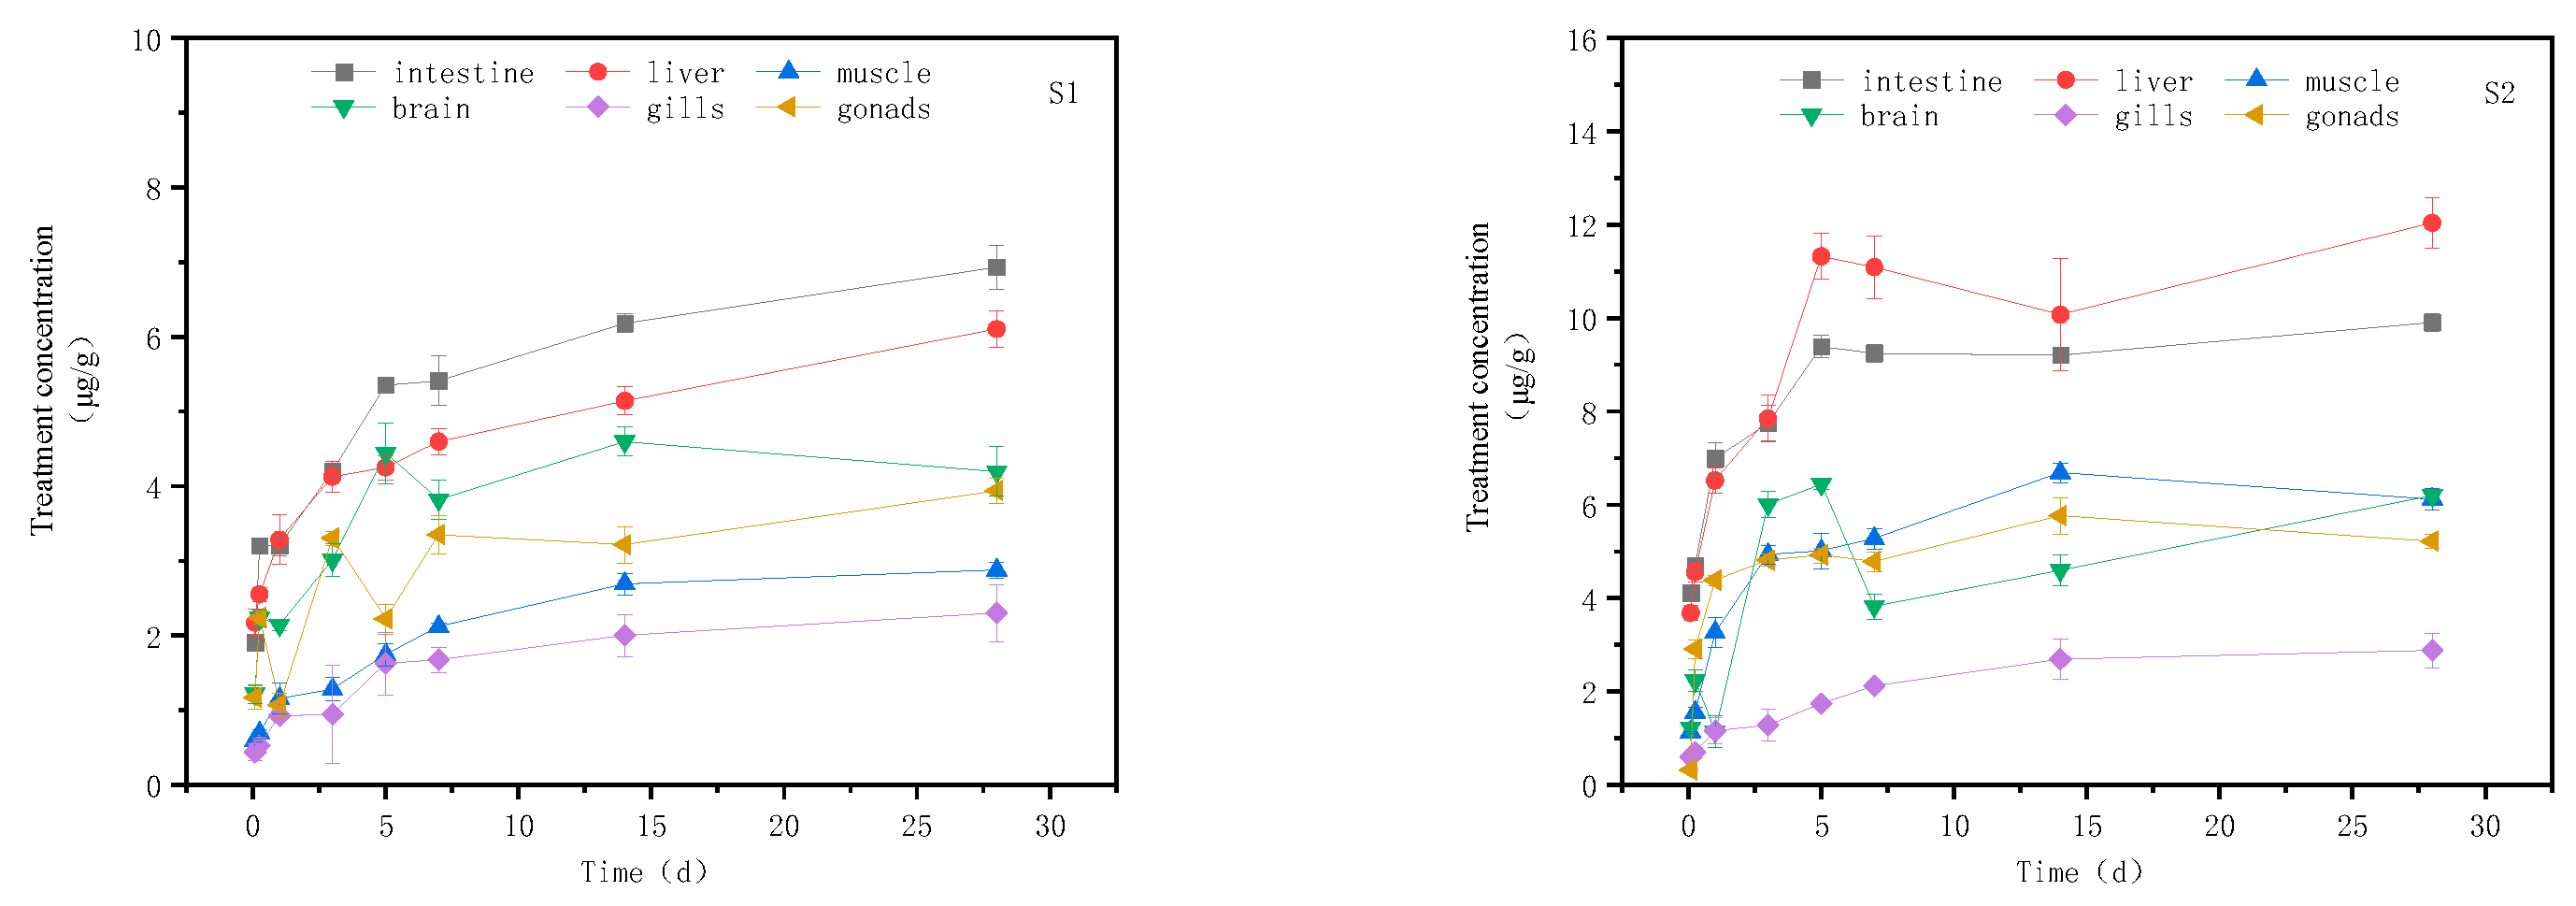
Figure 3.
Concentration changes in imidacloprid metabolites in gill tissues(Treatment concentration: S1:20mg/l; S2:40mg/l), a: imidacloprid urea, b: 6-chloronicotinic acid, c: 5-hydroxyimidacloprid.
Figure 3.
Concentration changes in imidacloprid metabolites in gill tissues(Treatment concentration: S1:20mg/l; S2:40mg/l), a: imidacloprid urea, b: 6-chloronicotinic acid, c: 5-hydroxyimidacloprid.
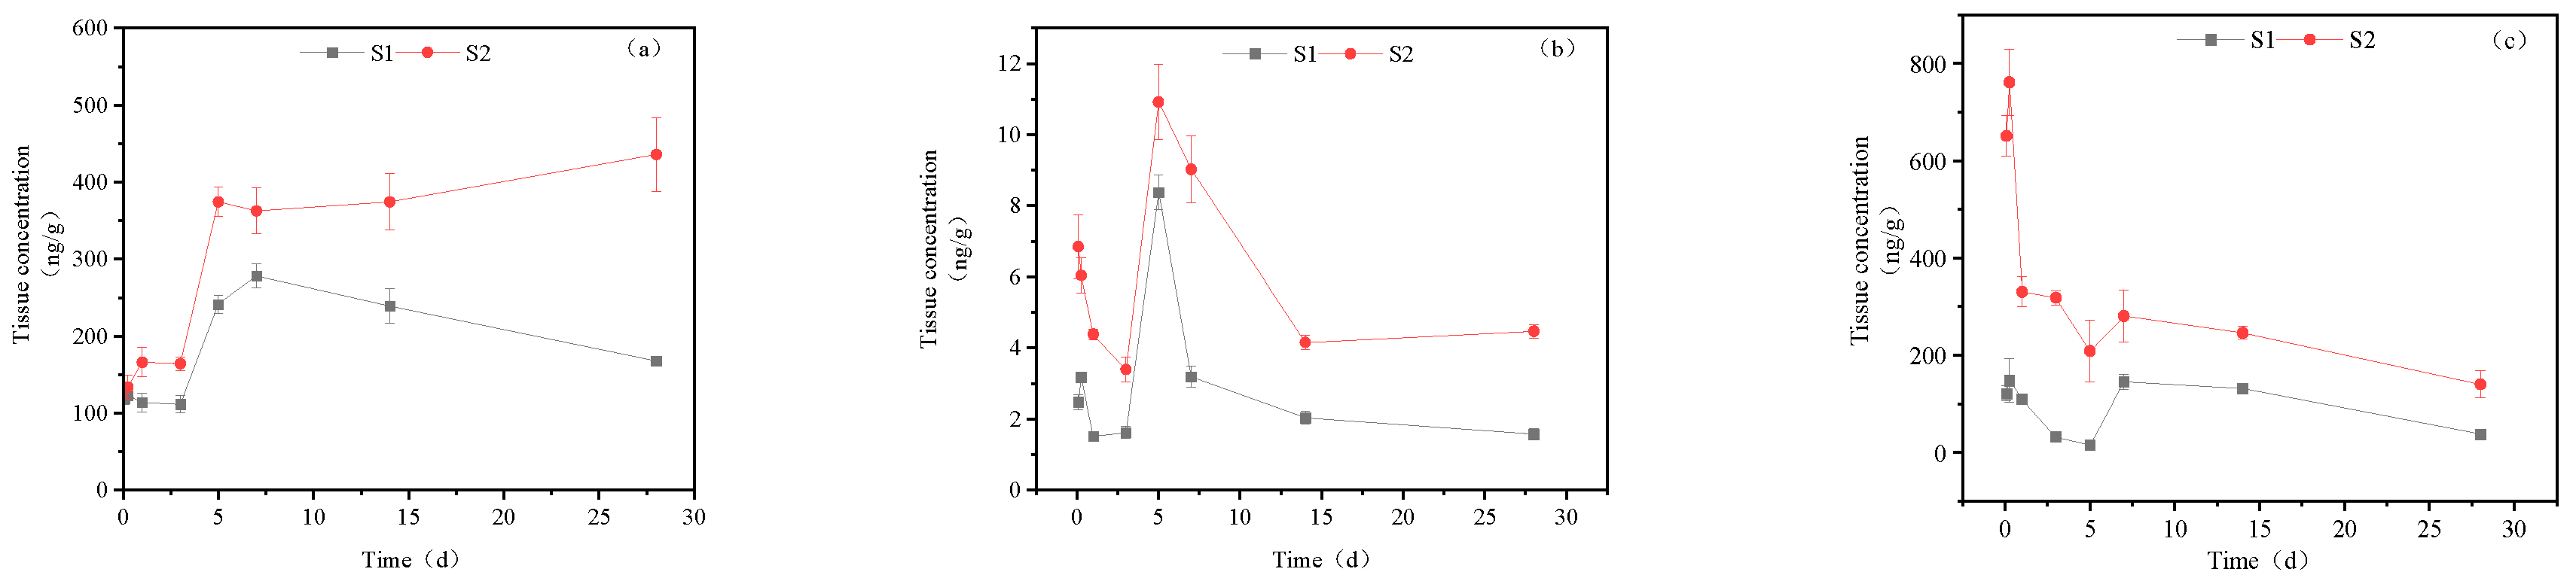
Figure 4.
Concentration changes in imidacloprid metabolites in intestine (Treatment concentration: S1:20mg/l; S2:40mg/l), a: imidacloprid urea, b: 6-chloronicotinic acid, c: 5-hydroxyimidacloprid, d: imidacloprid-olefin.
Figure 4.
Concentration changes in imidacloprid metabolites in intestine (Treatment concentration: S1:20mg/l; S2:40mg/l), a: imidacloprid urea, b: 6-chloronicotinic acid, c: 5-hydroxyimidacloprid, d: imidacloprid-olefin.
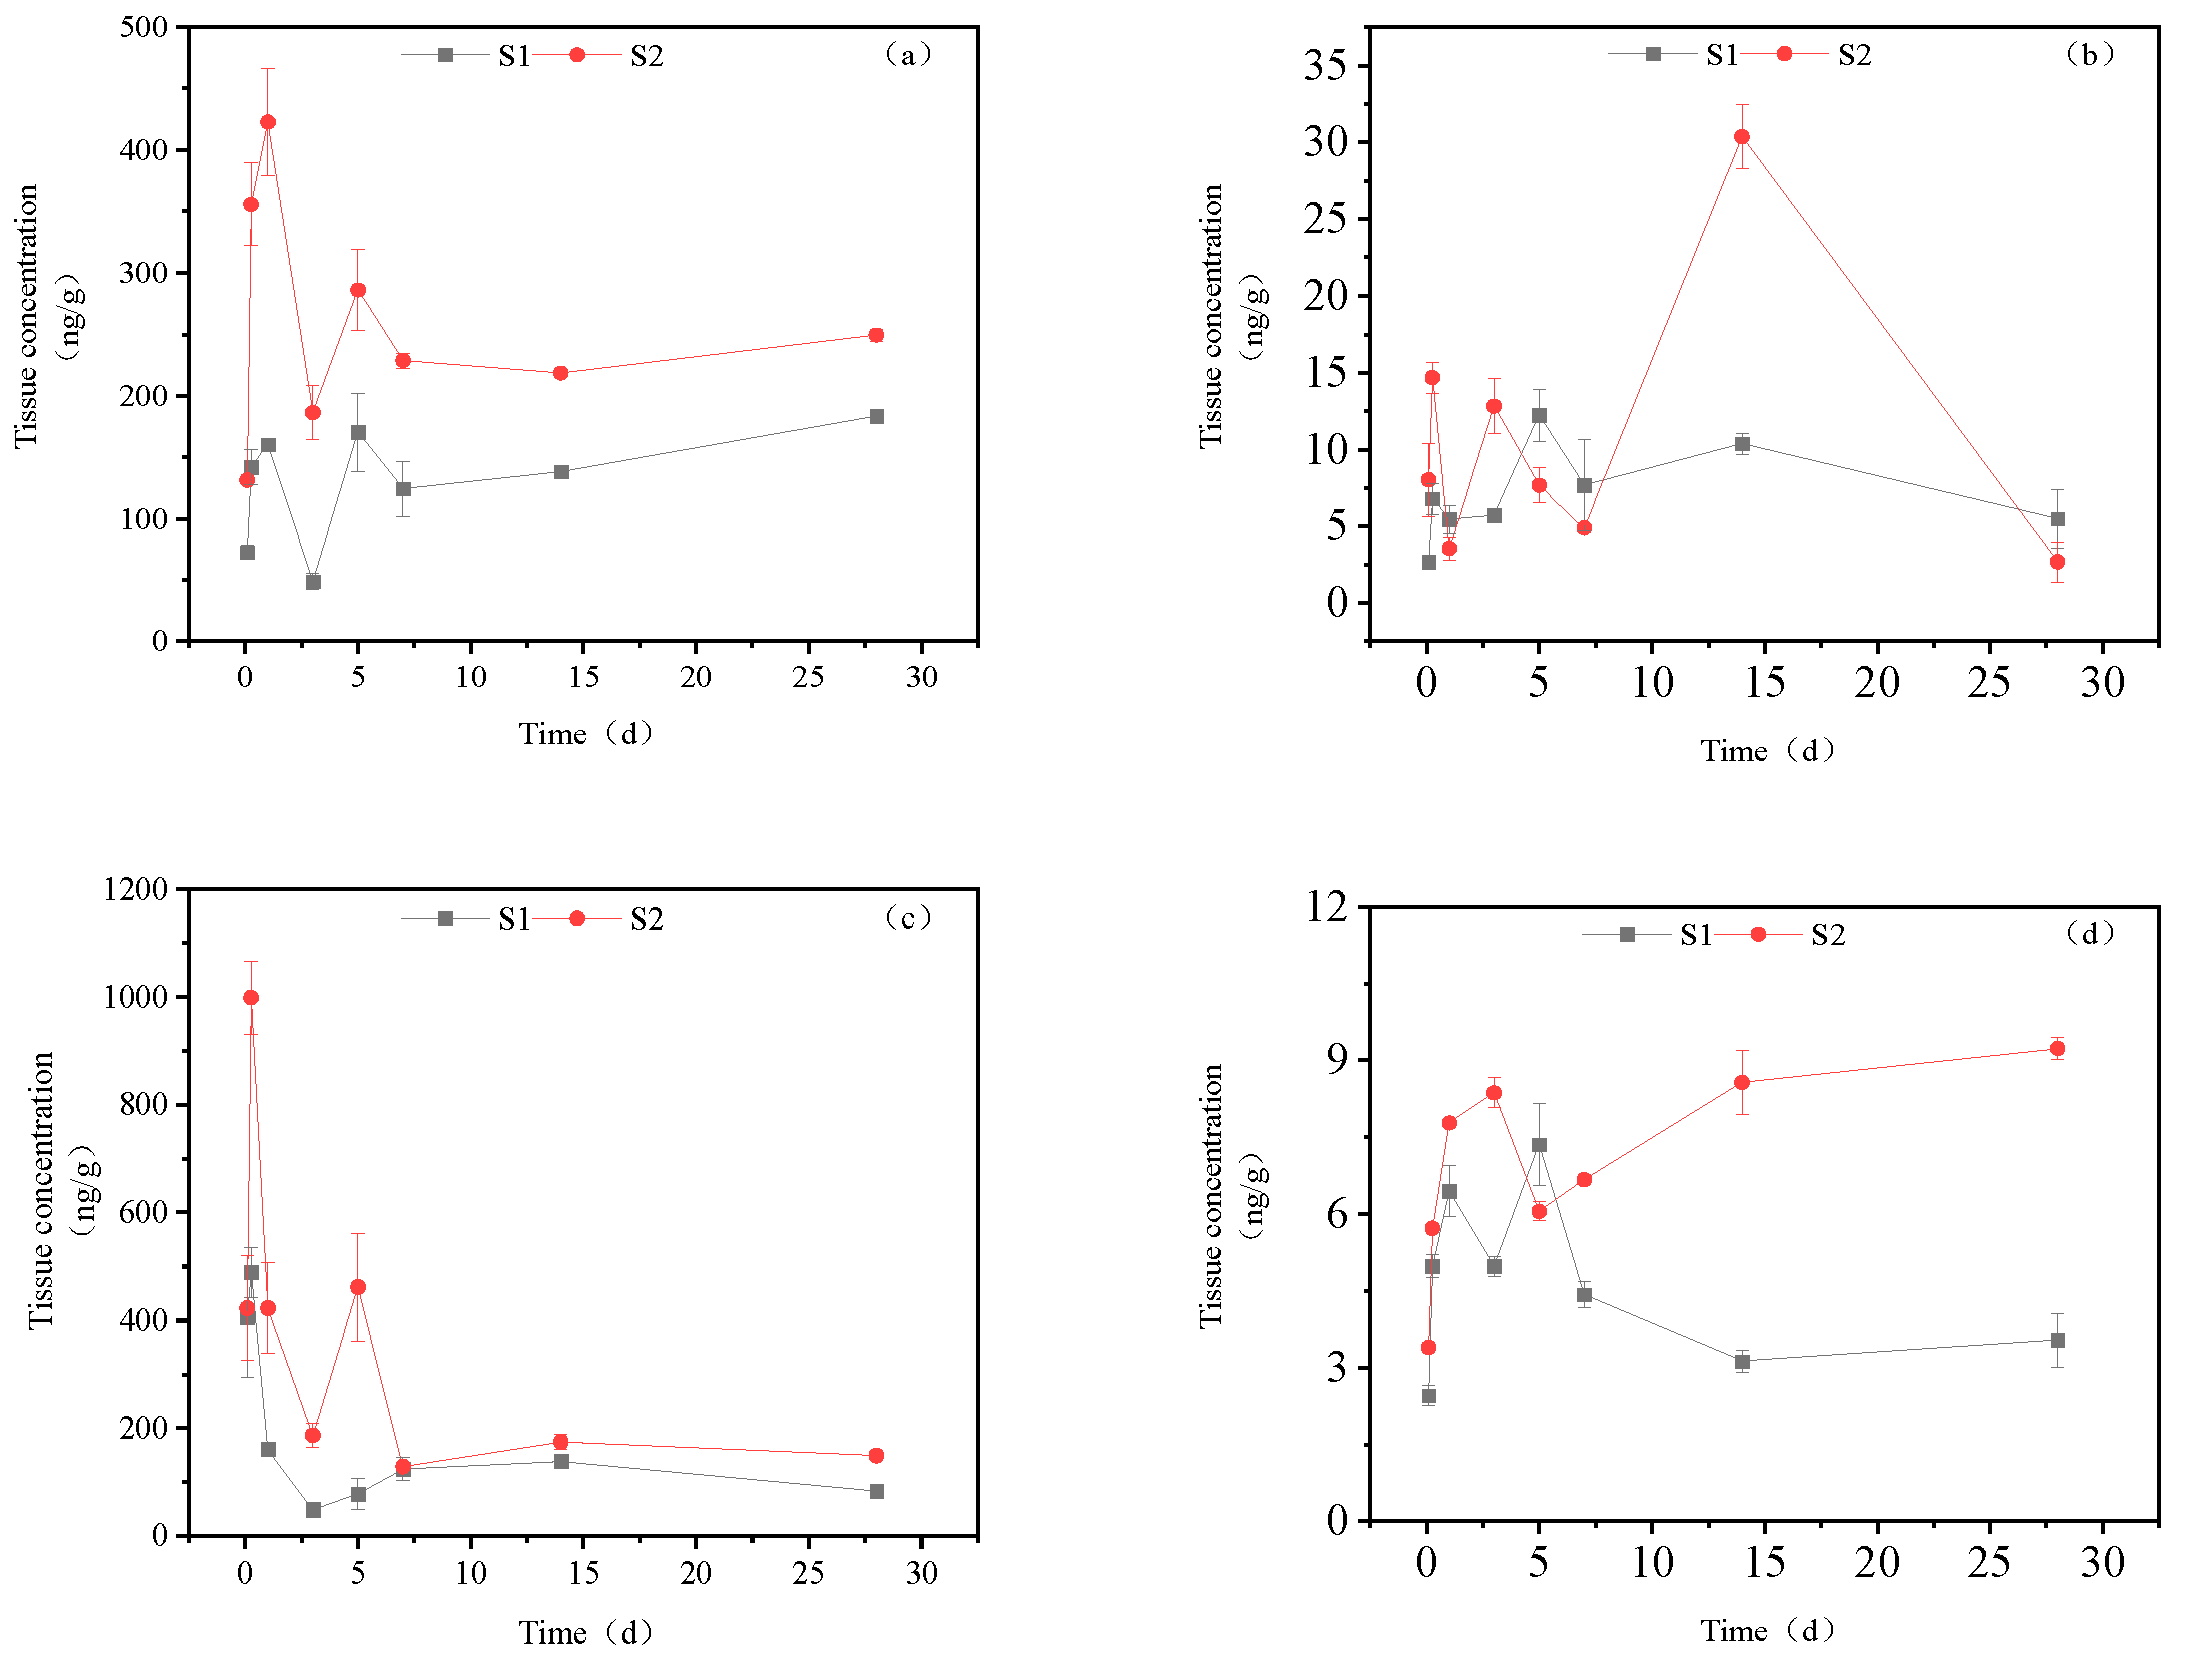
Figure 5.
Concentration changes in imidacloprid metabolites in intestine (Treatment concentration: S1:20mg/l; S2:40mg/l), a: imidacloprid urea, b: 6-chloronicotinic acid, c: 5-hydroxyimidacloprid, d: imidacloprid-olefin.
Figure 5.
Concentration changes in imidacloprid metabolites in intestine (Treatment concentration: S1:20mg/l; S2:40mg/l), a: imidacloprid urea, b: 6-chloronicotinic acid, c: 5-hydroxyimidacloprid, d: imidacloprid-olefin.
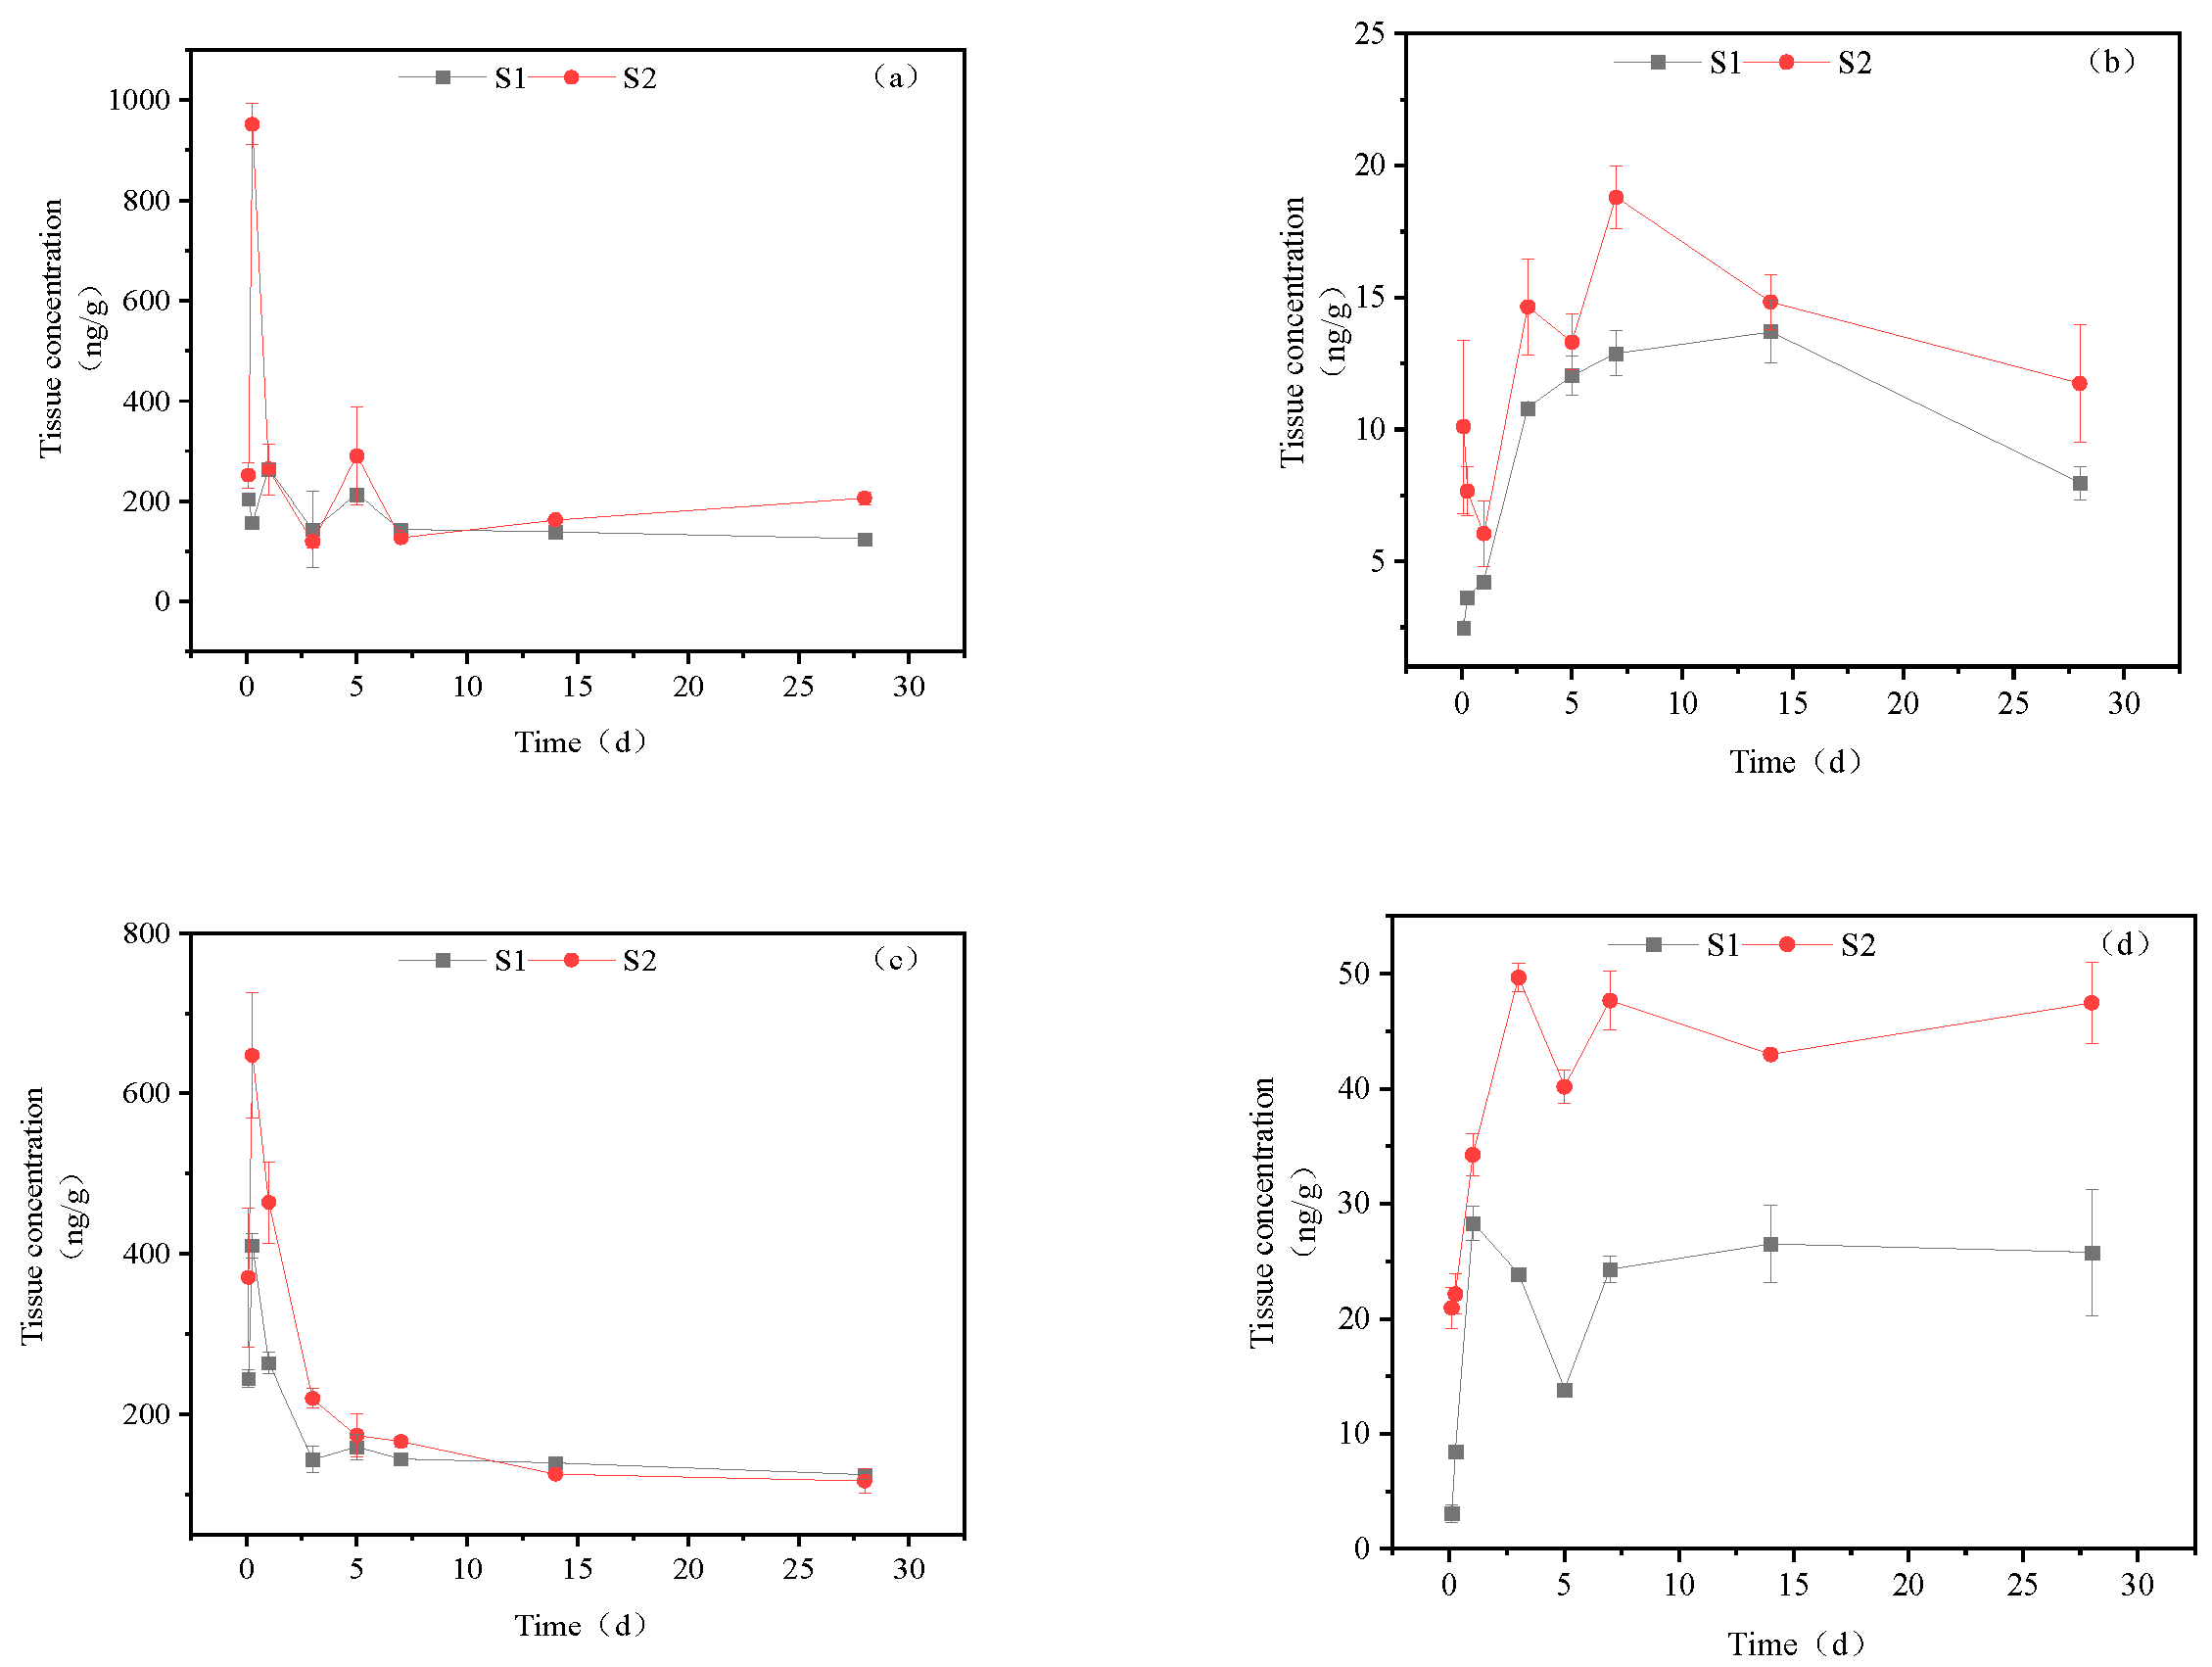
Figure 6.
Concentration changes in imidacloprid metabolites in muscle (Treatment concentration: S1:20mg/l; S2:40mg/l), a: imidacloprid urea, b: 6-chloronicotinic acid, c: 5-hydroxyimidacloprid.
Figure 6.
Concentration changes in imidacloprid metabolites in muscle (Treatment concentration: S1:20mg/l; S2:40mg/l), a: imidacloprid urea, b: 6-chloronicotinic acid, c: 5-hydroxyimidacloprid.
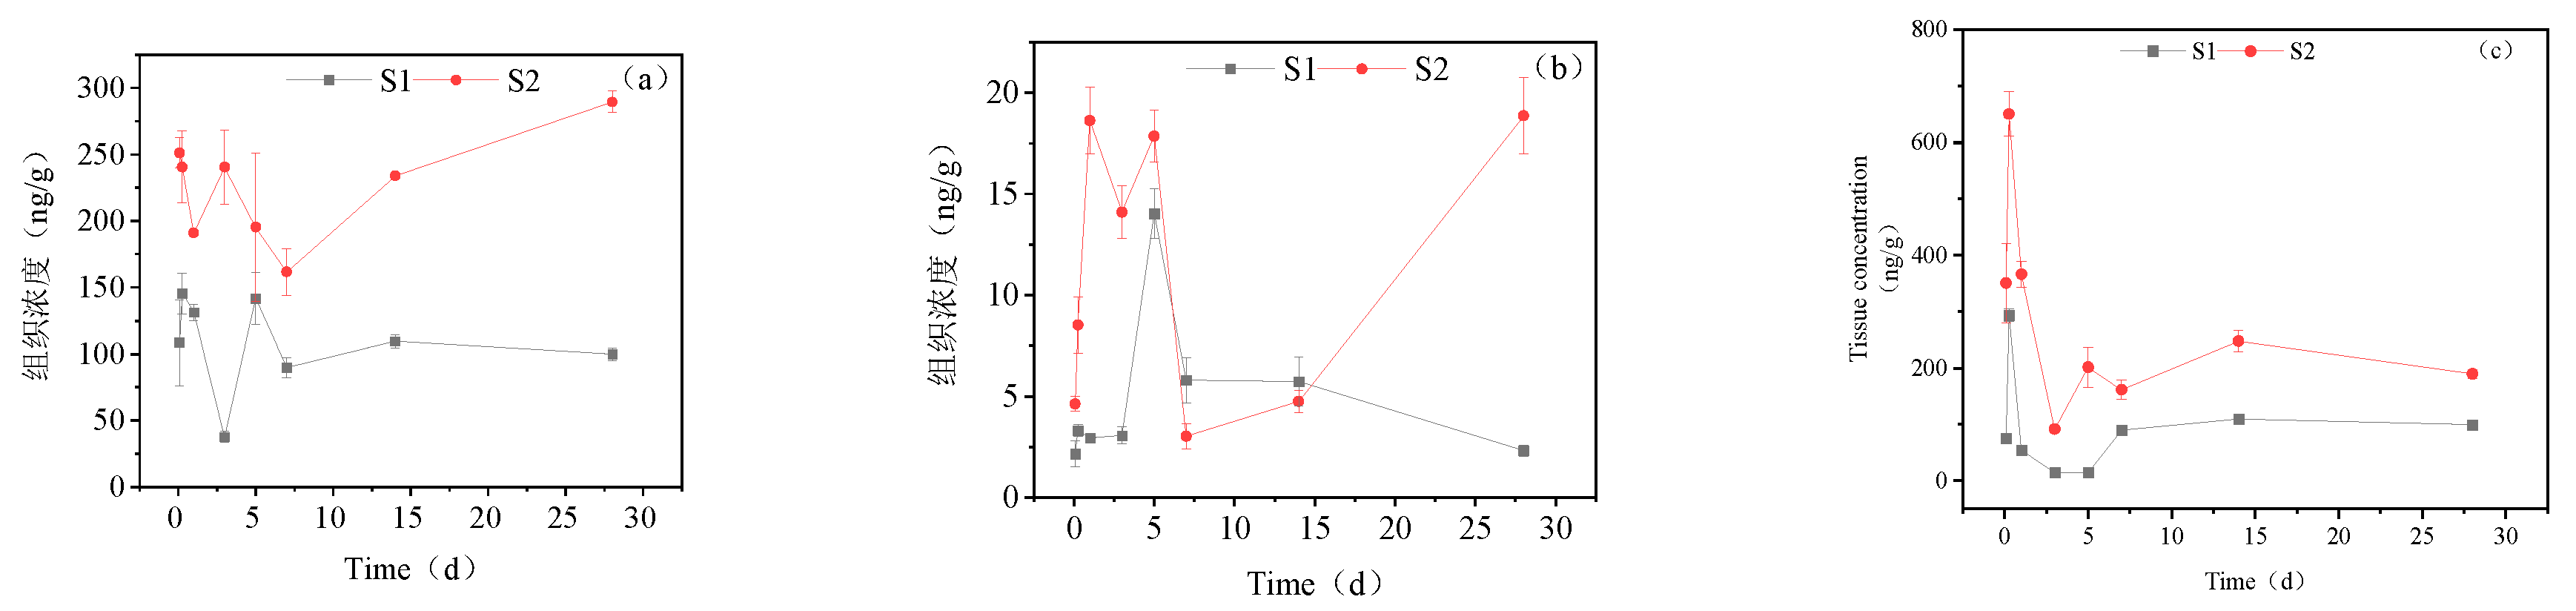
Figure 7.
Concentration changes in imidacloprid metabolites in brain tissue (Treatment concentration: S1:20mg/l; S2:40mg/l), a: imidacloprid urea, b: 6-chloronicotinic acid, c: 5-hydroxyimidacloprid.
Figure 7.
Concentration changes in imidacloprid metabolites in brain tissue (Treatment concentration: S1:20mg/l; S2:40mg/l), a: imidacloprid urea, b: 6-chloronicotinic acid, c: 5-hydroxyimidacloprid.
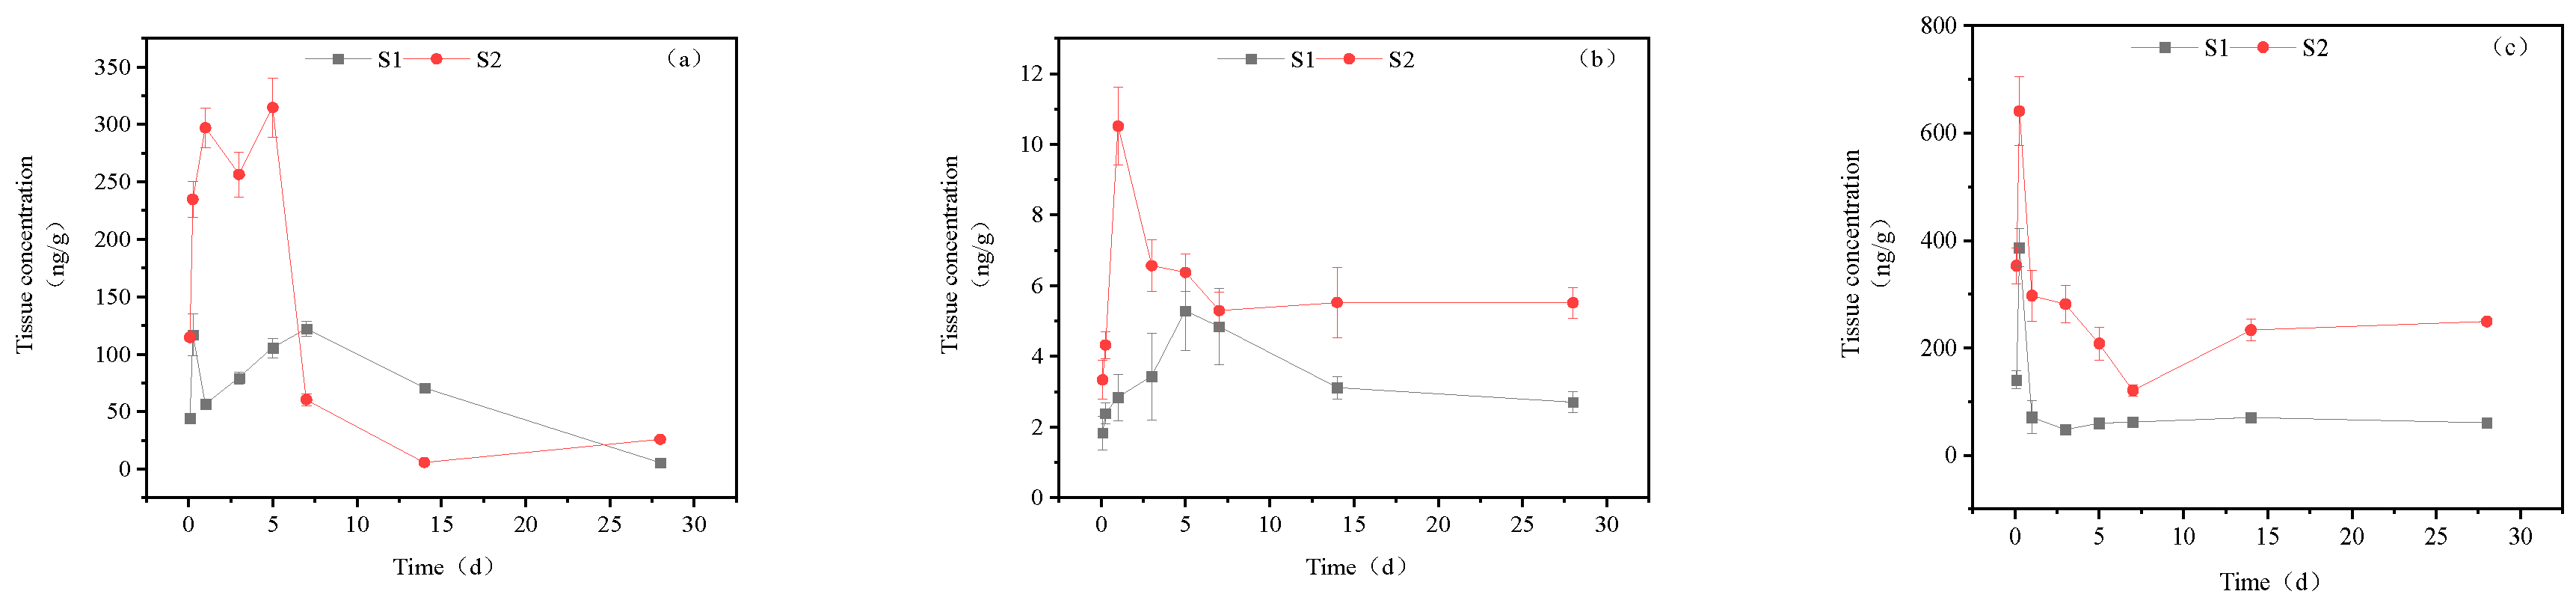
Figure 8.
Concentration changes in imidacloprid metabolites in gonads (Treatment concentration: S1:20mg/l; S2:40mg/l), a: imidacloprid urea, b: 6-chloronicotinic acid, c: 5-hydroxyimidacloprid.
Figure 8.
Concentration changes in imidacloprid metabolites in gonads (Treatment concentration: S1:20mg/l; S2:40mg/l), a: imidacloprid urea, b: 6-chloronicotinic acid, c: 5-hydroxyimidacloprid.
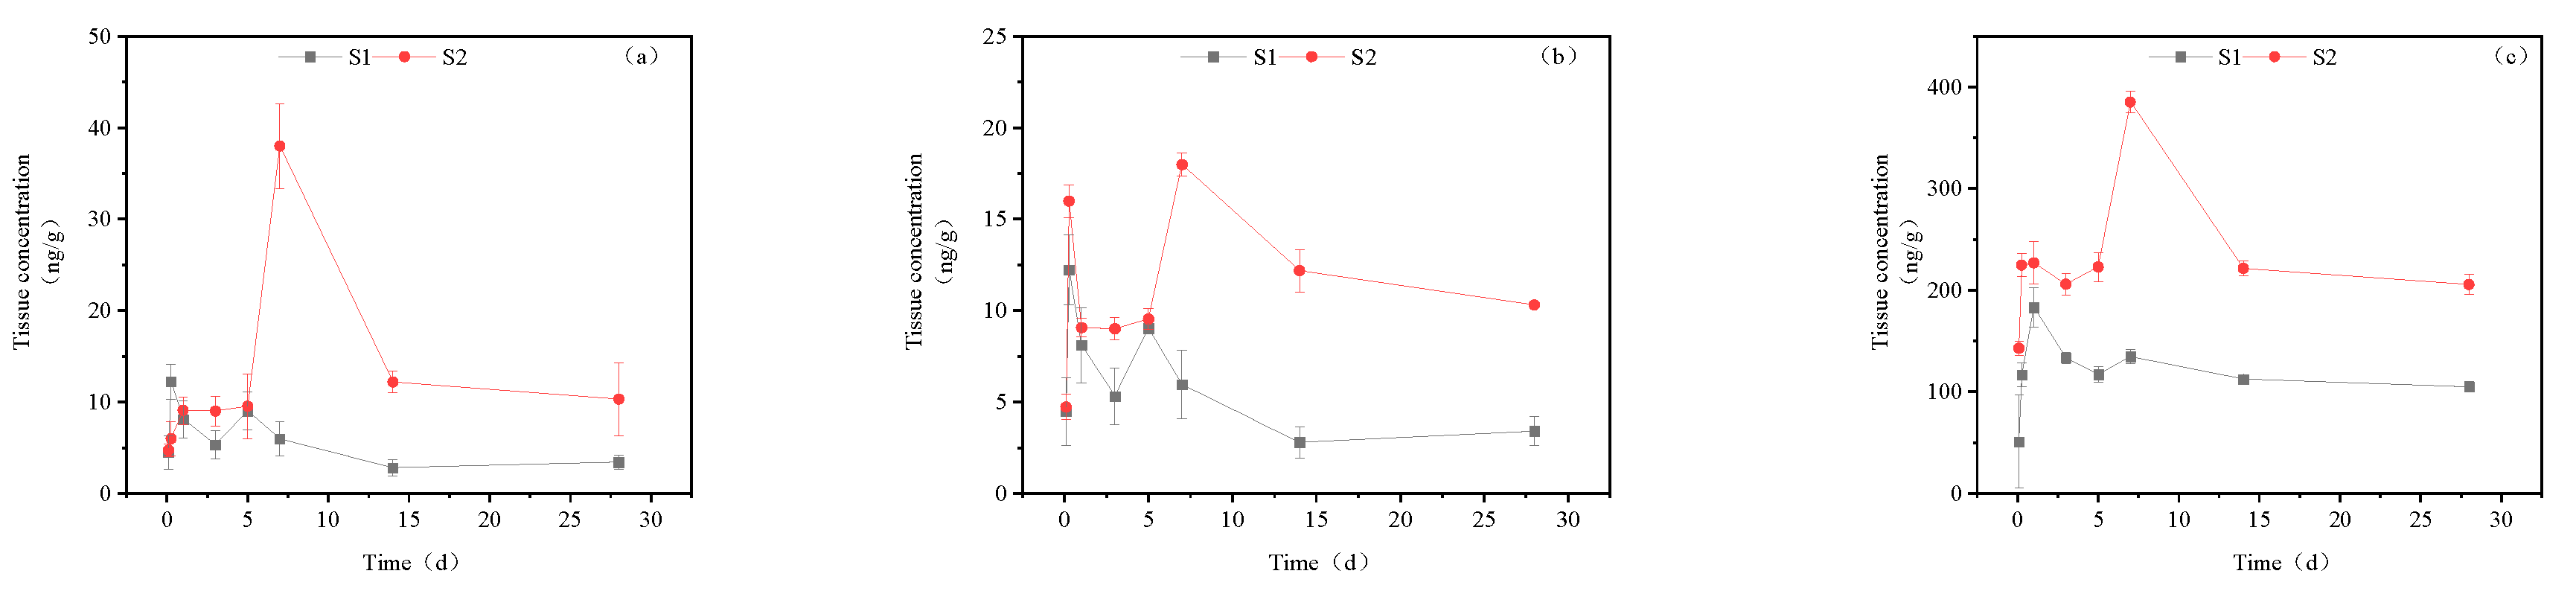
Figure 9.
Metabolic pathways of imidacloprid in housefly (a) and honeybee (b).
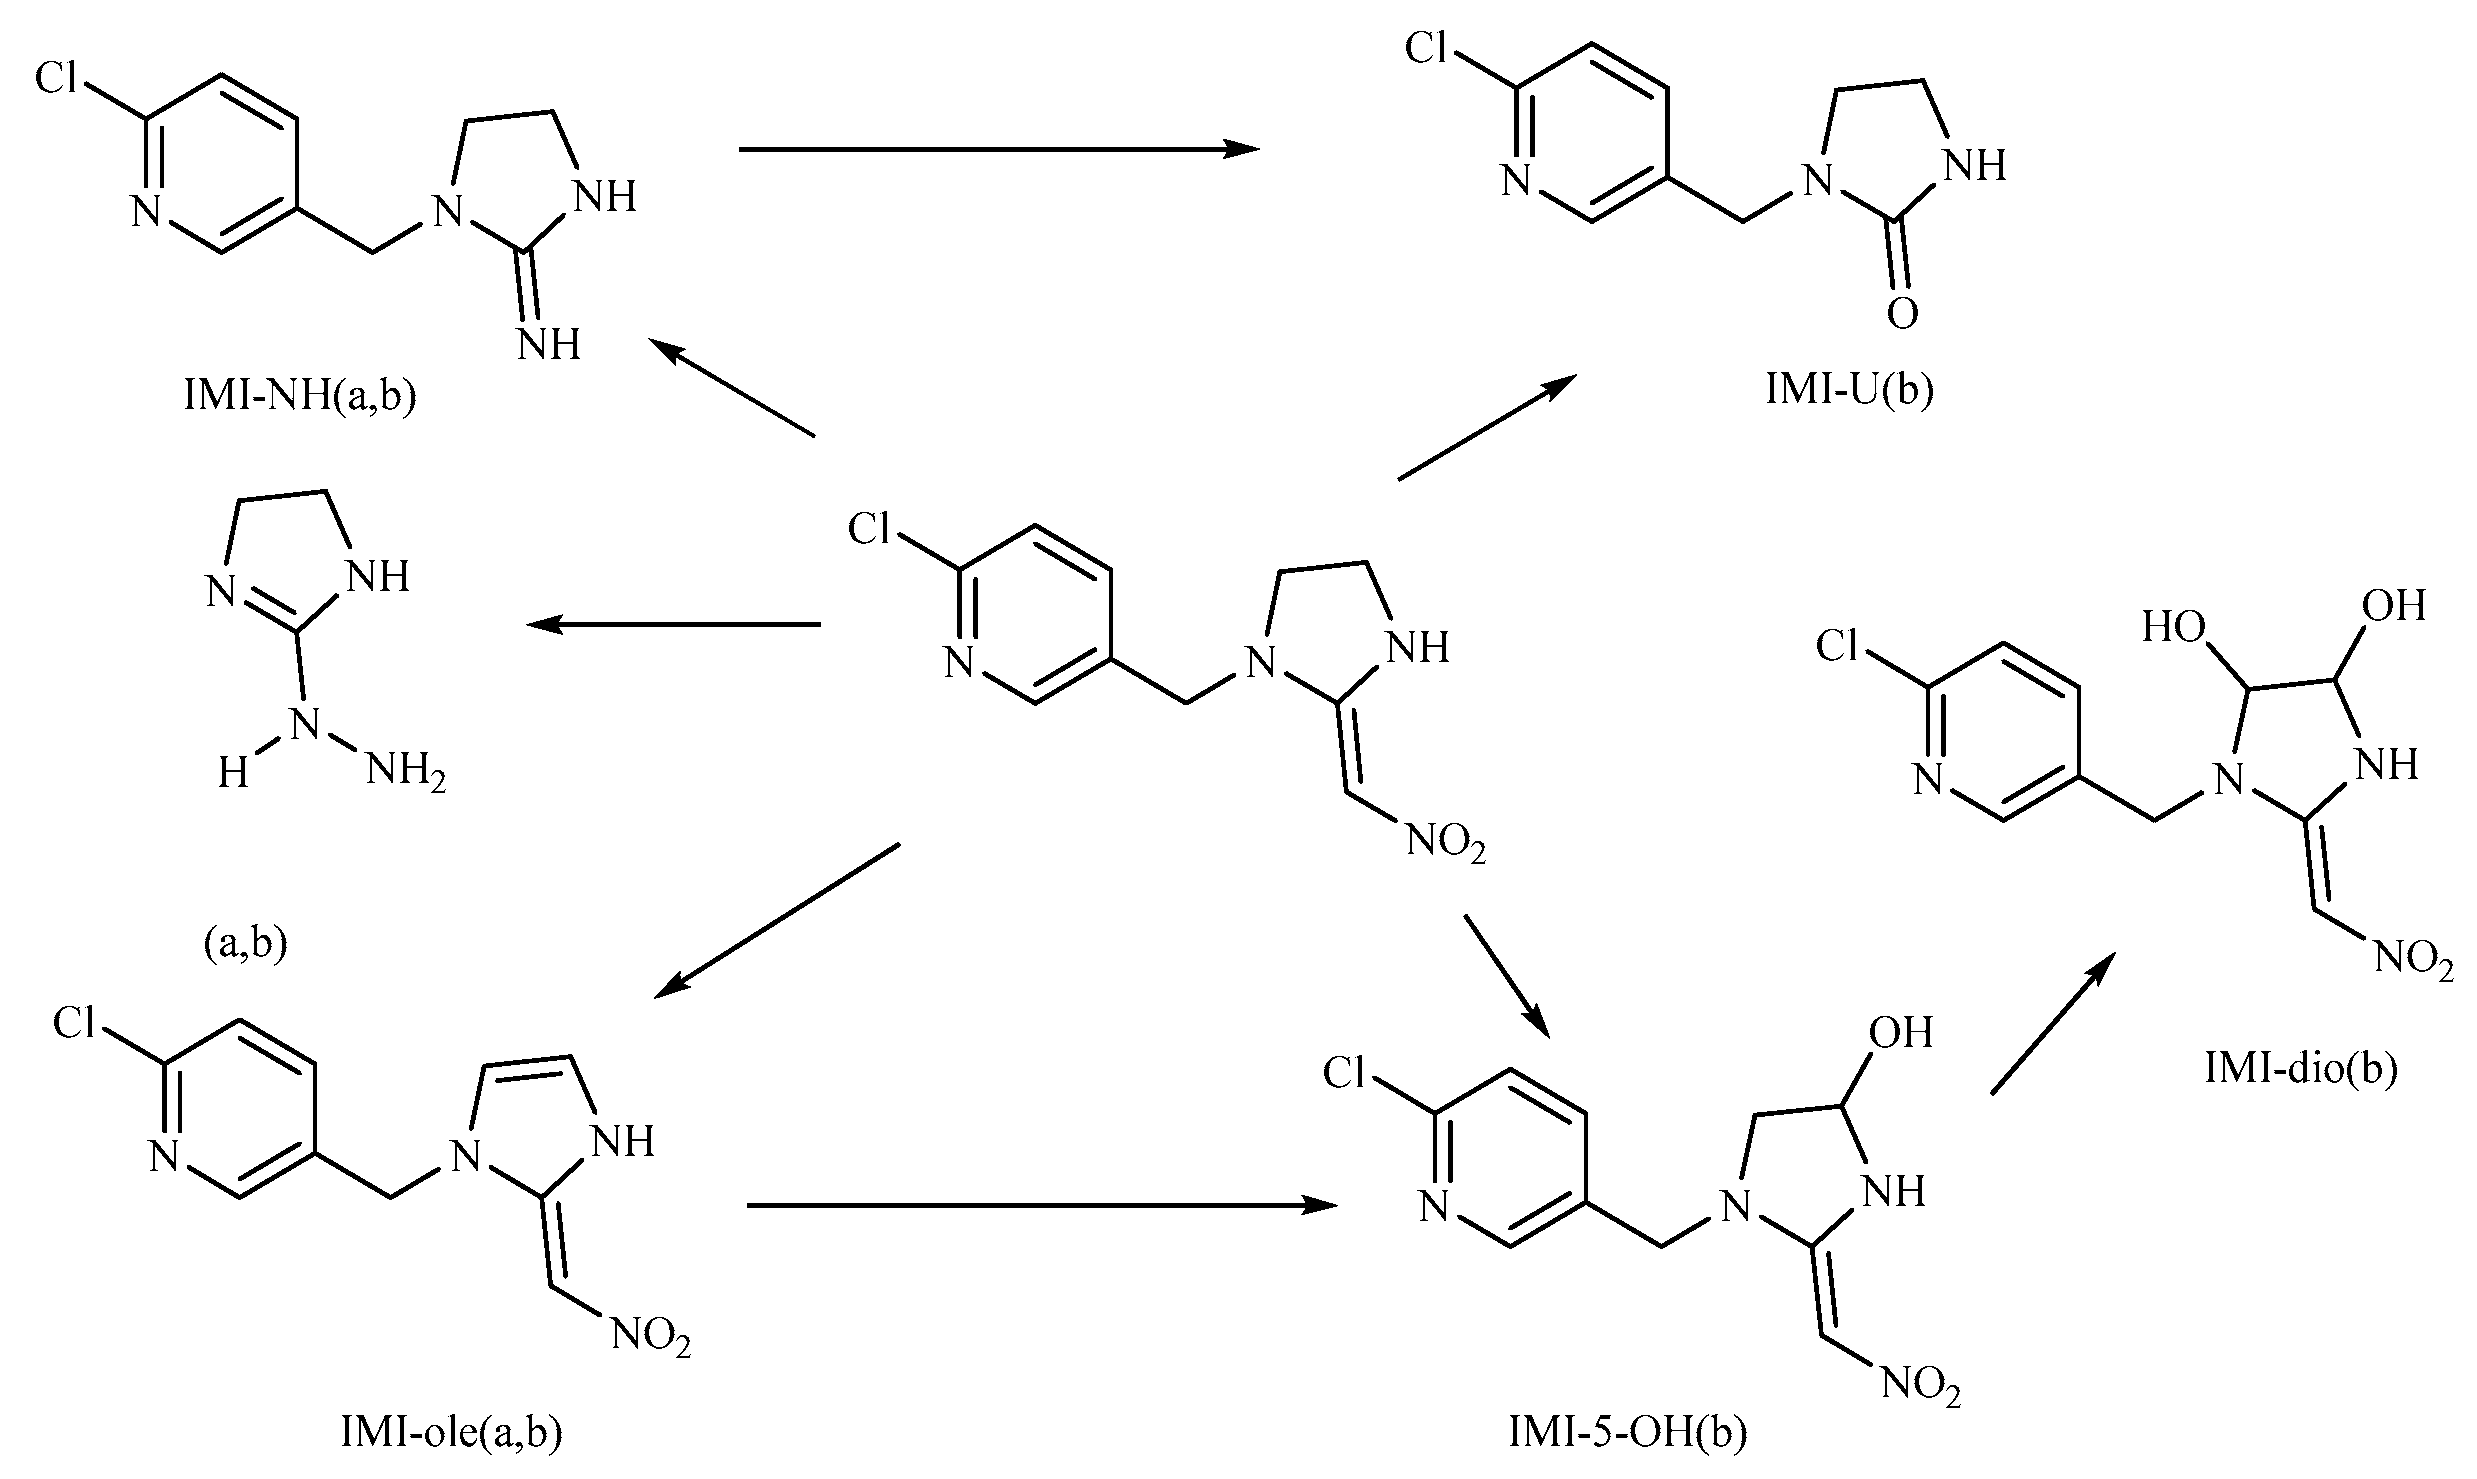
Figure 10.
Structure of imidacloprid.
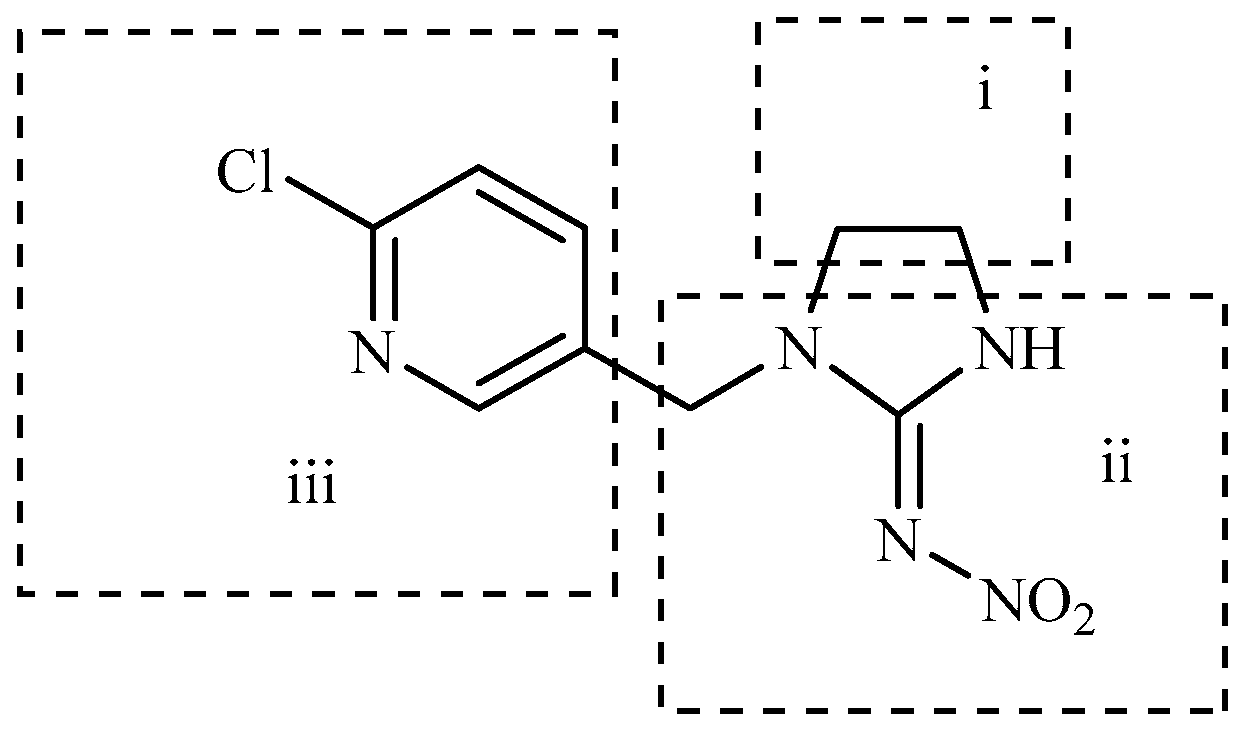
Figure 11.
Possible metabolic pathways of imidacloprid in goldfish.

Table 1.
Gradient elution procedure.
| Time/min | aqueous phase % | organic phase /% |
|---|---|---|
| 0-5 | 80 | 20 |
| 5 | 60 | 40 |
| 6 | 40 | 60 |
| 7 | 80 | 20 |
| 8 | 80 | 20 |
Table 2.
Fragment parameters were collected by mass spectrometry.
| Detection object | Parent ion | Daughter ion |
|---|---|---|
| Imidacloprid | 256.2 | 175.3 |
| Imidacloprid- urea | 212.2 | 128.1 |
| Imidacloprid- olefin | 254.2 | 171.0 |
| 5-hydroxyimidacloprid | 272.2 | 225.3 |
| 6-chloronicotinic acid | 155.9 | 112.1 |
Table 3.
Detection limit, precision and recovery of imidacloprid and its metabolites.
| object | LOD(limit of detection) (μg/l) | LOQ(limit of quantitation) (μg/l) | precision/% | recovery/% | RSD/% |
|---|---|---|---|---|---|
| Imidacloprid | 0.001 | 0.00334 | 3.41 | 96.08 | 6.523 |
| Imidacloprid- urea | 0.0099 | 0.032907 | 1.98 | 99.77 | 4.172 |
| Imidacloprid- olefin | 0.0011 | 0.003519 | 3.79 | 85.25 | 7.355 |
| 5-hydroxyimidacloprid | 0.0068 | 0.022718 | 2.84 | 87.24 | 8.825 |
| 6-chloronicotinic acid | 0.0056 | 0.018682 | 2.64 | 100.23 | 2.805 |
Table 4.
The metabolites of imidacloprid.
| Metabolite | Maximum accumulation | Time | Ratio | |
|---|---|---|---|---|
| Intestine | Imidacloprid- urea | 432.34 | 24h | 7.47% |
| Imidacloprid- olefin | 9.37 | 28d | 0.10% | |
| 6-chloronicotinic acid | 31.27 | 14d | 0.32% | |
| 5-hydroxyimidacloprid | 1021.25 | 6h | 35.64% | |
| liver | Imidacloprid- urea | 952.38 | 6h | 25.81% |
| Imidacloprid- olefin | 38.28 | 28d | 0.32% | |
| 6-chloronicotinic acid | 18.79 | 14d | 0.18% | |
| 5-hydroxyimidacloprid | 653.13 | 6h | 23.60% | |
| gill | Imidacloprid- urea | 430.67 | 28d | 9.72% |
| 6-chloronicotinic acid | 10.97 | 5d | 0.23% | |
| 5-hydroxyimidacloprid | 784.34 | 6h | 42.68% | |
| Muscle | Imidacloprid- urea | 298.39 | 28d | 3.99% |
| 6-chloronicotinic acid | 18.85 | 1d | 0.16% | |
| 5-hydroxyimidacloprid | 758.45 | 6h | 19.34% | |
| Brain | Imidacloprid- urea | 319.24 | 5d | 7.30% |
| 6-chloronicotinic acid | 10.74 | 1d | 0.06% | |
| 5-hydroxyimidacloprid | 654 | 6h | 21.80% | |
| gonad | Imidacloprid- urea | 38.92 | 7d | 0.41% |
| 6-chloronicotinic acid | 18.34 | 6h | 0.59% | |
| 5-hydroxyimidacloprid | 389.56 | 7d | 5.58% |
Disclaimer/Publisher’s Note: The statements, opinions and data contained in all publications are solely those of the individual author(s) and contributor(s) and not of MDPI and/or the editor(s). MDPI and/or the editor(s) disclaim responsibility for any injury to people or property resulting from any ideas, methods, instructions or products referred to in the content. |
© 2023 by the authors. Licensee MDPI, Basel, Switzerland. This article is an open access article distributed under the terms and conditions of the Creative Commons Attribution (CC BY) license (http://creativecommons.org/licenses/by/4.0/).
Copyright: This open access article is published under a Creative Commons CC BY 4.0 license, which permit the free download, distribution, and reuse, provided that the author and preprint are cited in any reuse.


