Submitted:
17 June 2023
Posted:
19 June 2023
You are already at the latest version
Abstract
For a long time, there has been interest in the relationship between personality traits and life satisfaction. However, many previous studies suffer from small sample sizes or selective sampling, sometimes leading to biased or imprecise results. The current study, which focuses on the trait of extraversion, attempts to overcome these limitations by using a large-scale German survey of more than 40,000 individuals aged 10 to 72. As the descriptive and regression results clearly show, there is a statistically significant relationship between extraversion and several dimensions of current life satisfaction. Depending on the type of satisfaction, the unstandardized regression coefficients range from 0.18 to 0.33. To gain further insight, age is added as an explanatory variable to test whether these associations change as a person ages. The results show that the effect sizes sometimes differ by age but remain robust and statistically significant. In conclusion, the study adds to the literature by providing convincing evidence that extraversion and life satisfaction are positively associated, at least in Western and industrialized countries, and that there are interaction effects with age.
Keywords:
extraversion
; age
; life satisfaction
; happiness
; well being
; correlation analysis
; regression analysis
; functional form
1. Introduction
More than 50 years ago, researchers attempting to understand the influence of personality traits on life satisfaction (also often termed well-being or simply happiness) pointed out that extraversion deserves special attention and is a predictor of satisfaction (Wilson, 1967). Since then, numerous studies have been spawned to investigate this topic further. We have seen studies with various populations and sample sizes from different social and cultural contexts, using different measurements and methods to paint a complete picture of the situation (Costa & McCrae, 1980). While the big questions are apparently answered, and we can confidently state that satisfaction and extraversion are associated with each other, open questions still deserve further attention. This study has two main goals: first, demonstrating the association between extraversion and various sub-dimension of satisfaction precisely to understand which kinds of satisfaction are related in more detail. Second, to test how these associations change with the age of individuals. Often, samples are selective and only contain a relatively small group of individuals, so it is difficult to state whether associations will be stable when other populations are investigated. As age is of particular relevance and it is known that many mechanisms change over time as humans mature, the question arises whether associations are stable over time. Answering these questions appears relevant for more insight. To do so, a large sample of more than 40,000 individuals surveyed in Germany between 2010 and 2019 can be utilized. To our knowledge, this is one of the largest samples ever available to investigate posed research questions. This has multiple benefits: a large sample increases precision as standard errors decrease, and it is easier to pinpoint the actual size of associations. Furthermore, this sample, containing individuals aged 10 to 72, includes individuals from all stages in the life course, which enables us to state how associations change with age. Summarized, the presented analyses deliver robust and reliable results that are relevant to explain in more detail how various dimensions of life satisfaction and extraversion are related and how these associations change with the age of individuals.
2. Previous research findings
While comprehensive meta-studies report statistically significant associations between extraversion and satisfaction with correlations between 0.25 and 0.35 (Heller et al., 2004; Steel et al., 2008), others point out that many included studies suffer the problem of rather special samples, such as only from western nations or with small sizes. To give some examples, Jovanović (2019) reports a correlation of 0.26 for 500 US high-school students, other student samples, also from different cultural backgrounds, report similar effect sizes (Li, 2021). Another study used a sample of 158 Amazon’s Mechanical Turk Service and reports a correlation of 0.41 (Smith & Konik, 2022). Multinational analyses with more than 33 countries support this finding (Cheng et al., 2016). A larger sample with about 4,000 individuals recruited online finds a correlation of 0.38 (Fors Connolly & Johansson Sevä, 2021). To overcome some of these restrictions, a newer study gathered data from four different cultural contexts with a large number of participants. The total of six samples from North American, the United Kingdom, Japan, and Germany reveals that associations are the strongest for North America (around 0.20), followed by the UK, Japan, and smallest for Germany (around 0.08). With rather large sample sizes (ranging from 1,000 to more than 18,000), this study demonstrates that contexts do apparently play a significant influence on how extraversion and life satisfaction are associated (Kim et al., 2018). Summarized, previous study make it clear that extraversion and satisfaction are associated, even if effect sizes sometimes differ between samples and contexts.
However, regarding the second research question, that is, how the association changes with age, there is much less evidence available. The question arises why one would suspect a changing association. Apparently, extraversion is related to satisfaction since individuals with higher extraversion are more likely to experience positive emotions and also have better social skills, which can be a source of positive social interactions (Kim et al., 2018). One could hypothesize that children profit more from higher extraversion since they do not have social networks outside their family to start with and making friends will lead to higher satisfaction levels. Older individuals often only need to maintain their social networks, which does not require high levels of extraversion. While this is no proof, these arguments support the notion that the relation between extraversion and life satisfaction changes with age. However, empirically, there is very little evidence available yet.
One rather small study with participants from an African capital aged 60 to 69 reports much lower associations, which might be a hint that these associations decrease in older individuals (Bedaso & Han, 2021). One study surveyed US veterans over a time span of 22 years and concludes that extraversion does predict satisfaction and that initially higher levels indicating a high and flat satisfaction trajectory (Mroczek & Spiro, 2005). These results are supported by another study that finds that initial extraversion predicts higher well-being 40 years later (Gale et al., 2013). That extraversion can still be of influence in individuals older than 80 years is also reported by another study (Berg et al., 2009). However, no comprehensive studies are available at the moment that attempt to model explicitly whether the association between extraversion and satisfaction is constant over the entire life course using population studies. Consequently, this apparent research gap will be filled by the following empirical analyses.
3. Data, variables, and statistical approach
3.1. Data
The following empirical analyses make use of the National Education Panel Study (NEPS), established in 2008, one of the most ambitious projects to investigate the role education takes in the life course of individuals (Blossfeld & Roßbach, 2019).1 The NEPS has been implemented as a multicohort-sequence study, meaning that individuals from different stages in their life course are surveyed repeatedly to gather panel data. The surveys include a wide range of questions about overall life, education, many relevant psychological measurements and constructs, and even comprehensive performance tests, rendering the NEPS a suitable data source. Since information about personality traits (Big Five) and various dimensions of life satisfaction are included, posed research questions can be answered. To be concrete, the following analyses will utilize four starting cohorts to reach a large sample and include individuals from all stages in the life course. Starting cohort 3 sampled lower secondary school students who were at the start of the study around ten years old and had just entered secondary school, which is grade 5 in the German system. They have transitioned from primary schooling to any tier of secondary schooling. Next, starting cohort 4 is used, which initially sampled students in upper secondary school (grade 9 at the start of the survey). They were about four years older than the students in starting cohort 3. Next, starting cohort 5 is used, which sampled students in universities or universities of applied sciences at the very start of their studies. Hence, on average, these individuals were around 20 years old at the time of the study (while older individuals can also be included, as the selection was not made on age but on enrollment at a tertiary institution). Finally, starting cohort 6 is used, which is the adult cohort of the NEPS. This is a general adult population survey with no restrictions. Using all mentioned NEPS starting cohorts together creates a large sample with 41,353 unique participants (final sample size after removing cases with missing information). Note that due to the panel design of the NEPS, some cohorts include repeated measurements, meaning that the same individuals were surveyed multiple times. For an overview, see Table 1. It must also be made transparent that in some NEPS cohorts, refreshment samples were drawn, meaning that later waves can contain individuals who have been surveyed before but also first-time respondents. The final number of observations, including repeated measurements, is 57,505. Due to the low number of missing values (item nonresponse), listwise deletion is applied has been applied, and this is the number of cases that is available for the following analyses.
3.2. Operationalization
Extraversion is measured by the Big Five inventory, which has been implemented in all NEPS cohorts under consideration. The 10-item short version, adapted for a German population, is used (Rammstedt & John, 2007). This well-tested and established instrument provides a convenient way of measuring all five dimensions quickly. The resulting variable of interest, extraversion, is measured on a scale with values from 1 (low extraversion) to 5 (high extraversion) with nine distinct values. This instrument uses two items to measure extraversion. It shows a high correlation to the standard 9-item instrument (extraversion only, r=0.90), and the test-retest stability (8 weeks) is also high (r=0.87). Overall, while it is known that a short instrument can lead to slightly attenuated effects (Credé et al., 2012), the overall quality is fine.
Life satisfaction has been measured using five different items to capture a broader range of areas of life and how happy subjects are with them. The items are as follows: “First of all, I would like to ask you some questions about your current satisfaction with various aspects of your life. Please answer on a scale from 0 to 10. '0' means that you are ‚completely unsatisfied’, '10' means that you are ‚completely satisfied’. You can gradate your answer with the numbers in between. All in all, how satisfied are you with your life at the moment? / How satisfied are you with what you have? By that I mean money, income, and things you own. / How satisfied are you with your health? / How satisfied are you with your family life? / How satisfied are you with your acquaintances and friends?” This instrument is based on previous surveys for the general population and has been well-established (TNS Infratest, 2006). It is relevant since it provides quasi-metric variables and includes various dimensions of human life. This allows more insight. Age is measured in years at the time of the survey.
3.3. Strategy of analysis
To answer posed research question, multiple statistical analyses will be conducted. First, a purely descriptive approach is chosen to visualize how extraversion and various dimensions of life satisfaction are related. This is achieved using scatterplots, which are also quite relevant to judge whether these relations are linear, which is relevant for the following statistical analyses. In the next step, a correlation matrix is presented to quantify these relations in more detail. Afterward, linear (OLS) regression models are estimated where each satisfaction variable is the dependent variable and extraversion is the independent variable. To account for the fact that some individuals were repeated multiple times, which creates dependent observations, standard errors are clustered by person to correct for this aspect and avoid wrong inference. To compute unbiased standard errors, OLS assumes that observations are independent of each other. This assumption is violated with the data used. Consequently, the assumption is relaxed to that clusters are independent of each other. Multiple responses by the same individual do, hence, not lead to incorrect inference. Finally, the regression models are extended to include age as a further explanatory variable as the interaction between age group and extraversion is added. A visual interpretation has been chosen for a clear and concise option to visualize how the association between satisfaction and extraversion differs by age. All analyses are conducted in Stata 16.1.
4. Results
First, some descriptive findings are presented. The distributions of the key variables are visualized in Figure 1.
As the histograms show, extraversion is rather normally distributed. This does not hold for the satisfaction variables, which are rather skewed and sometimes reach ceiling effects. This means that the satisfaction values are relatively high in the sample. The age distribution is depicted in the appendix in Figure A1. It shows that there are many participants below 20 years (student cohorts), yet there is enough information available over the entire age range. The adult population alone comprises more than 20,000 observations.
Detailed numerical results are presented in Table 2 where descriptive statistics are shown for the entire sample but also split by cohort.
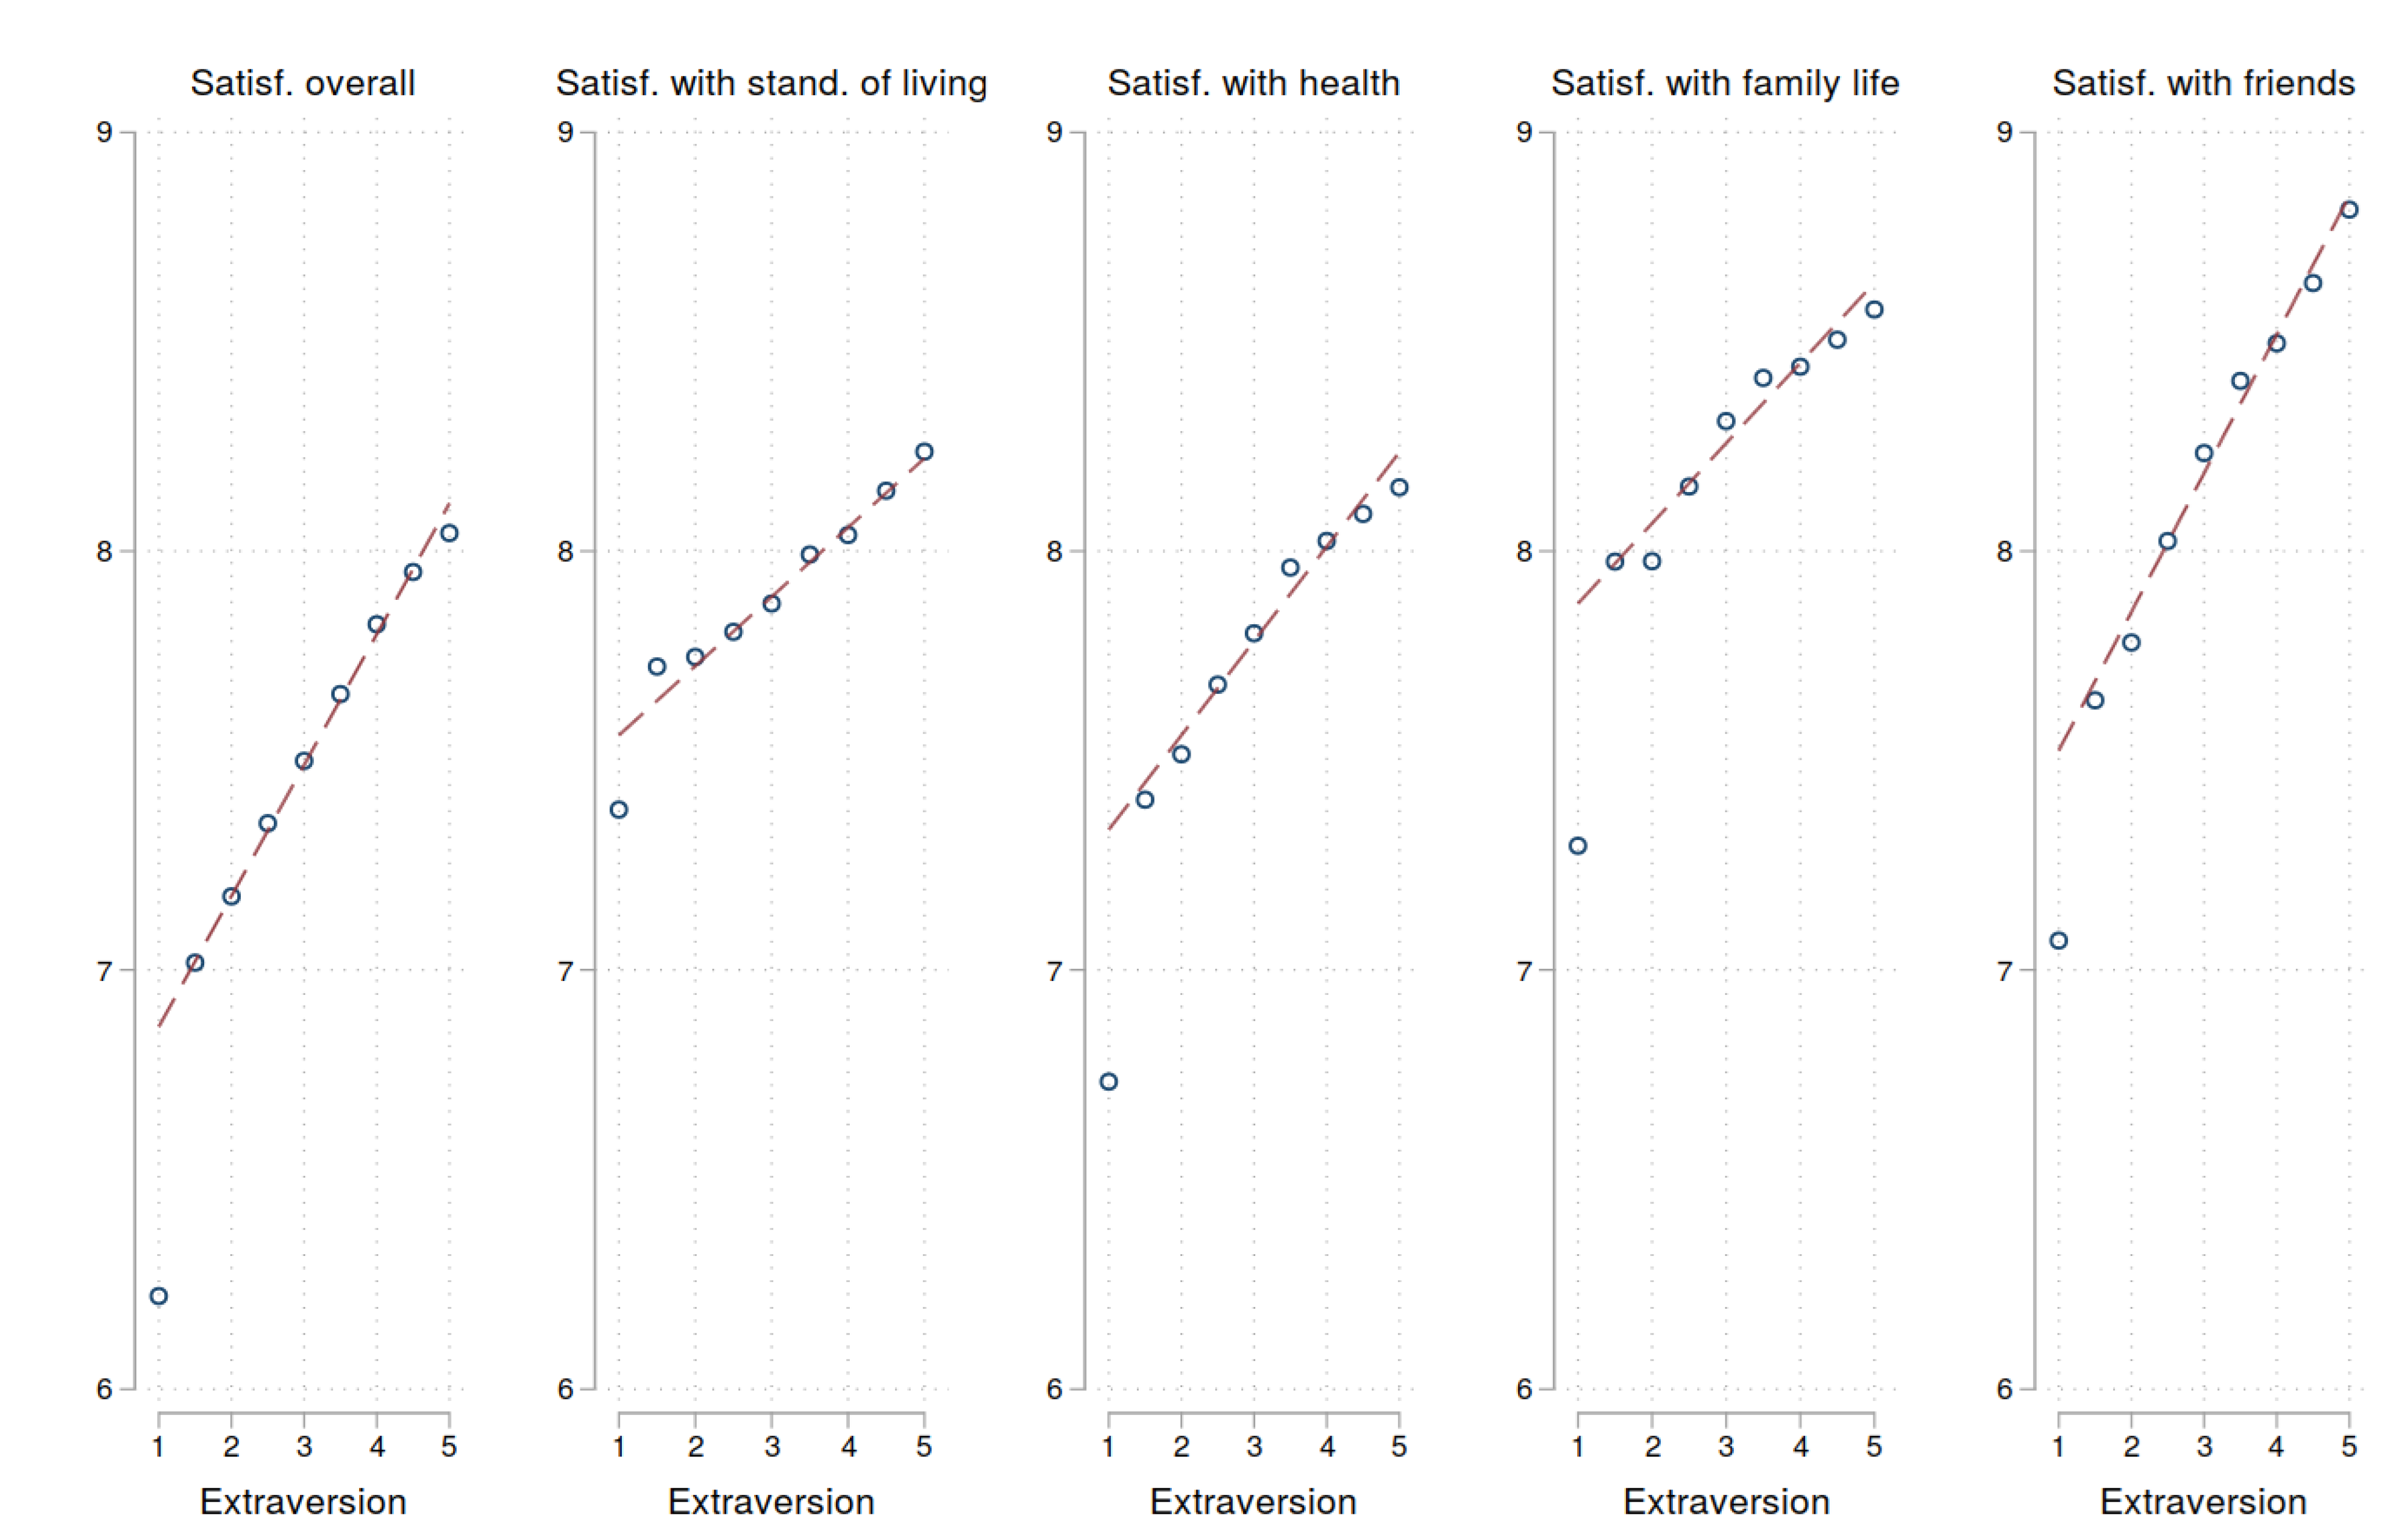
To continue with the relationship between extraversion and satisfaction variables, a descriptive overview is given using scatterplots in Figure 2.
As the findings clearly indicate, the relationship between extraversion and various dimensions of life satisfaction are positive and highly linear. The higher the extraversion, the larger the reported satisfaction, on average. The only exception to this are individuals with very low values of extraversion (1.0). Their satisfaction is not on the otherwise linear trend but much lower. However, as the number of observations with such a low value is rather low (fewer than 1% of the total sample), the uncertainty is respectively large. As the overall trend is, however, clearly linear, the following analyses that usually assume linear relations, such as correlation analyses or OLS regression, are adequate. Next, a correlation table is presented in Table 3.
Of particular interest is the association between extraversion and various dimensions of satisfaction. For overall satisfaction with life, this value is 0.161 and hence stronger than for most other dimensions, except for satisfaction with friends, where it is rather comparable in effect size. For the three dimensions standard of living, health and family life, the correlations are only about half as large, with values between 0.083 and 0.099. When the various cohorts are examined, it turns out that correlations can vary. The main reason is that cohorts are mostly stratified by age. This aspect will be investigated in much more detail below in the regression analyses.
Next, OLS regression models are estimated. Of special interest is the regression coefficient for extraversion. Unstandardized regression coefficients are reported in Table 4. 95% confidence bands are reported in brackets. Note that the NEPS cohort has been included as a control variable to account for mode effects, yet results only change a little when omitting this variable.
The interpretation for the first dependent variable, overall life satisfaction, follows. If the extraversion reported by an individual increases by 1 point on the scale from 1 to 5, the overall life satisfaction increases by about 0.3 points. This result is statistically highly significant as the reported confidence band does not include 0. It becomes clear that a positive association between extraversion and all dimensions and life satisfaction is present. The strongest associations are visible for overall satisfaction and satisfaction with friends.
Finally, it is of particular interest to investigate how the association between satisfaction and extraversion depends on the age of a person. This relation is modeled using interactions between extraversion and age. To account for potential nonlinearities, higher-order terms for age are included up to the fourth order to enable a rather detailed functional form. As before, the cohort is also included as a control variable. As the number of interactions is large and challenging to interpret numerically, marginal effect plots are generated. They show the unstandardized regression coefficient of extraversion and how it depends on age (Figure 3). Complete regression tables are reported in the appendix (Table A1).
For overall satisfaction, the association is highest for children and then falls continuously up to middle ages, from where on it is then constant and stable. The decline of the association is extraordinary, as it starts at almost 0.50 and then falls to 0.20 at age 40. Hence, the association halves for older individuals. For satisfaction with living, a slightly similar yet much less pronounced shape is visible. Regarding satisfaction with health, there is apparently almost no variation with age, as the curve is highly stable. For satisfaction with family, the shape is somewhat different. Here, the association is lowest in children and then increases up to the age of about 40, from where it is slightly decreasing for the older participants. Finally, regarding satisfaction with friends, the association between extraversion and satisfaction is apparently relatively stable over time and only decreases in individuals aged 50 and older. Overall, it should be acknowledged that cases numbers are smaller in very old individuals, which results in larger confidence bands, which does, however, not obstruct the interpretation of the results.
Summarized, the association between satisfaction and extraversion can vary enormously by age, which gives new insight to this question. As the sample size is large, confidence bands are relatively narrow and effects can be estimated with more precision.
5. Discussion and limitations
The statistical analyses have clearly shown that the Big Five trait extraversion and life satisfaction with various sub-dimensions is associated. On average, the higher the scored extraversion of an individual, the higher the satisfaction. This holds for all dimensions, while the association with overall satisfaction and satisfaction with friends in the largest. This makes sense as it is well known that individuals with high extraversion have higher social skills and can make friends more easily. As social contacts are relevant for satisfaction, a strong association appears logical. One could even assume that there is a causal relationship, even if this cannot be proven with the data available. While the first research focus did successfully corroborate earlier studies, the second is even more interesting. As the results clearly outline, the association between satisfaction and extraversion does depend on the age of the respondent. For overalls satisfaction the findings are the strongest, and it is obvious that younger respondents have a stronger association than older ones. Apparently, having a high extraversion is especially important for younger people as here the influence on satisfaction is the largest. Interestingly, this finding, albeit relatively robust, does not hold for all dimensions of satisfaction as for satisfaction with family, the finding is even reversed.
These results are of greatest interest to understand how psychological traits are related to satisfaction. Many studies attempt to understand what conditions must be met so that humans can lead happy and content lives. Some of these are subject to interventions, others not. If one assumes that personality traits are relatively stable over time and not easily changed, extraversion might not be a target to enhance satisfaction. Nevertheless, the results appear rather interesting to understand why some humans are happier than others. Contexts, in this case, age, are of further relevance to gain more insight. These results are relevant to understand in more detail how satisfaction can be achieved and that further research can profit from these results. At least for a single country, Germany, the results appear to be rather robust and stable given the large sample. Replication studies from other countries and cultures are highly desirable to test especially whether the age-depending associations also hold in other settings.
Lastly, the limitations of the current analyses must be made transparent. First, reported are associations or regression coefficients but not causal effects. As the two constructs were measured at the same point in time, the arrow of causality is unclear. Furthermore, while one can assume that personality traits are rather stable and are harder to be influenced, spurious correlations cannot be ruled out. Investigating questions of causality requires a rather different framework of analysis and probably also different data. Second, while the NEPS provides a very large sample, it is not representative of the overall German population due to selection and attrition effects. It is well known that the sample becomes more selective the longer panel studies last, since dropouts are usually not at random. However, as some analyses were stratified on age, it can be, at least, ruled out that age is a biasing factor. The correlations hold for all age groups (while effect sizes can sometimes differ). Third, extraversion was measured using a two-item instrument. While this is a well-established and tested instrument, it is also known that these short instruments can lead to attenuation effects (Credé et al., 2012). While this is a limitation, it cannot be overcome with the data available. However, as the effect sizes are rather large, it is unlikely that using a more precise instrument will lead to much different results as the associations are very stable and present in all age groups. Fourth, it should be made clear that no individual trajectories were modeled but effects for the current population. This means that the analyses are not able to disentangle cohort effects from age effects. For example, the apparently decreasing association between extraversion and overall satisfaction could be either due to the effects of aging but also due to the effects of being born in a very special time and historical context. Of course, it would require somewhat different data and observing individuals for their entire lives to make more comprehensive statements, which is not possible at the moment.
Funding
This research did not receive any specific grant from funding agencies in the public, commercial, or not-for-profit sectors.
Acknowledgments
Special thanks to Hannah Bolten for supporting the review of the literature.
Declaration of Interest
none.
Ethical statement
All procedures followed were in accordance with the ethical standards of the responsible committee on human experimentation (institutional and national) and with the Helsinki Declaration of 1975, as revised in 2000. Informed consent was obtained from all patients for being included in the study.
Appendix
Figure A1.
Age distribution in the sample Note: N=57,505.
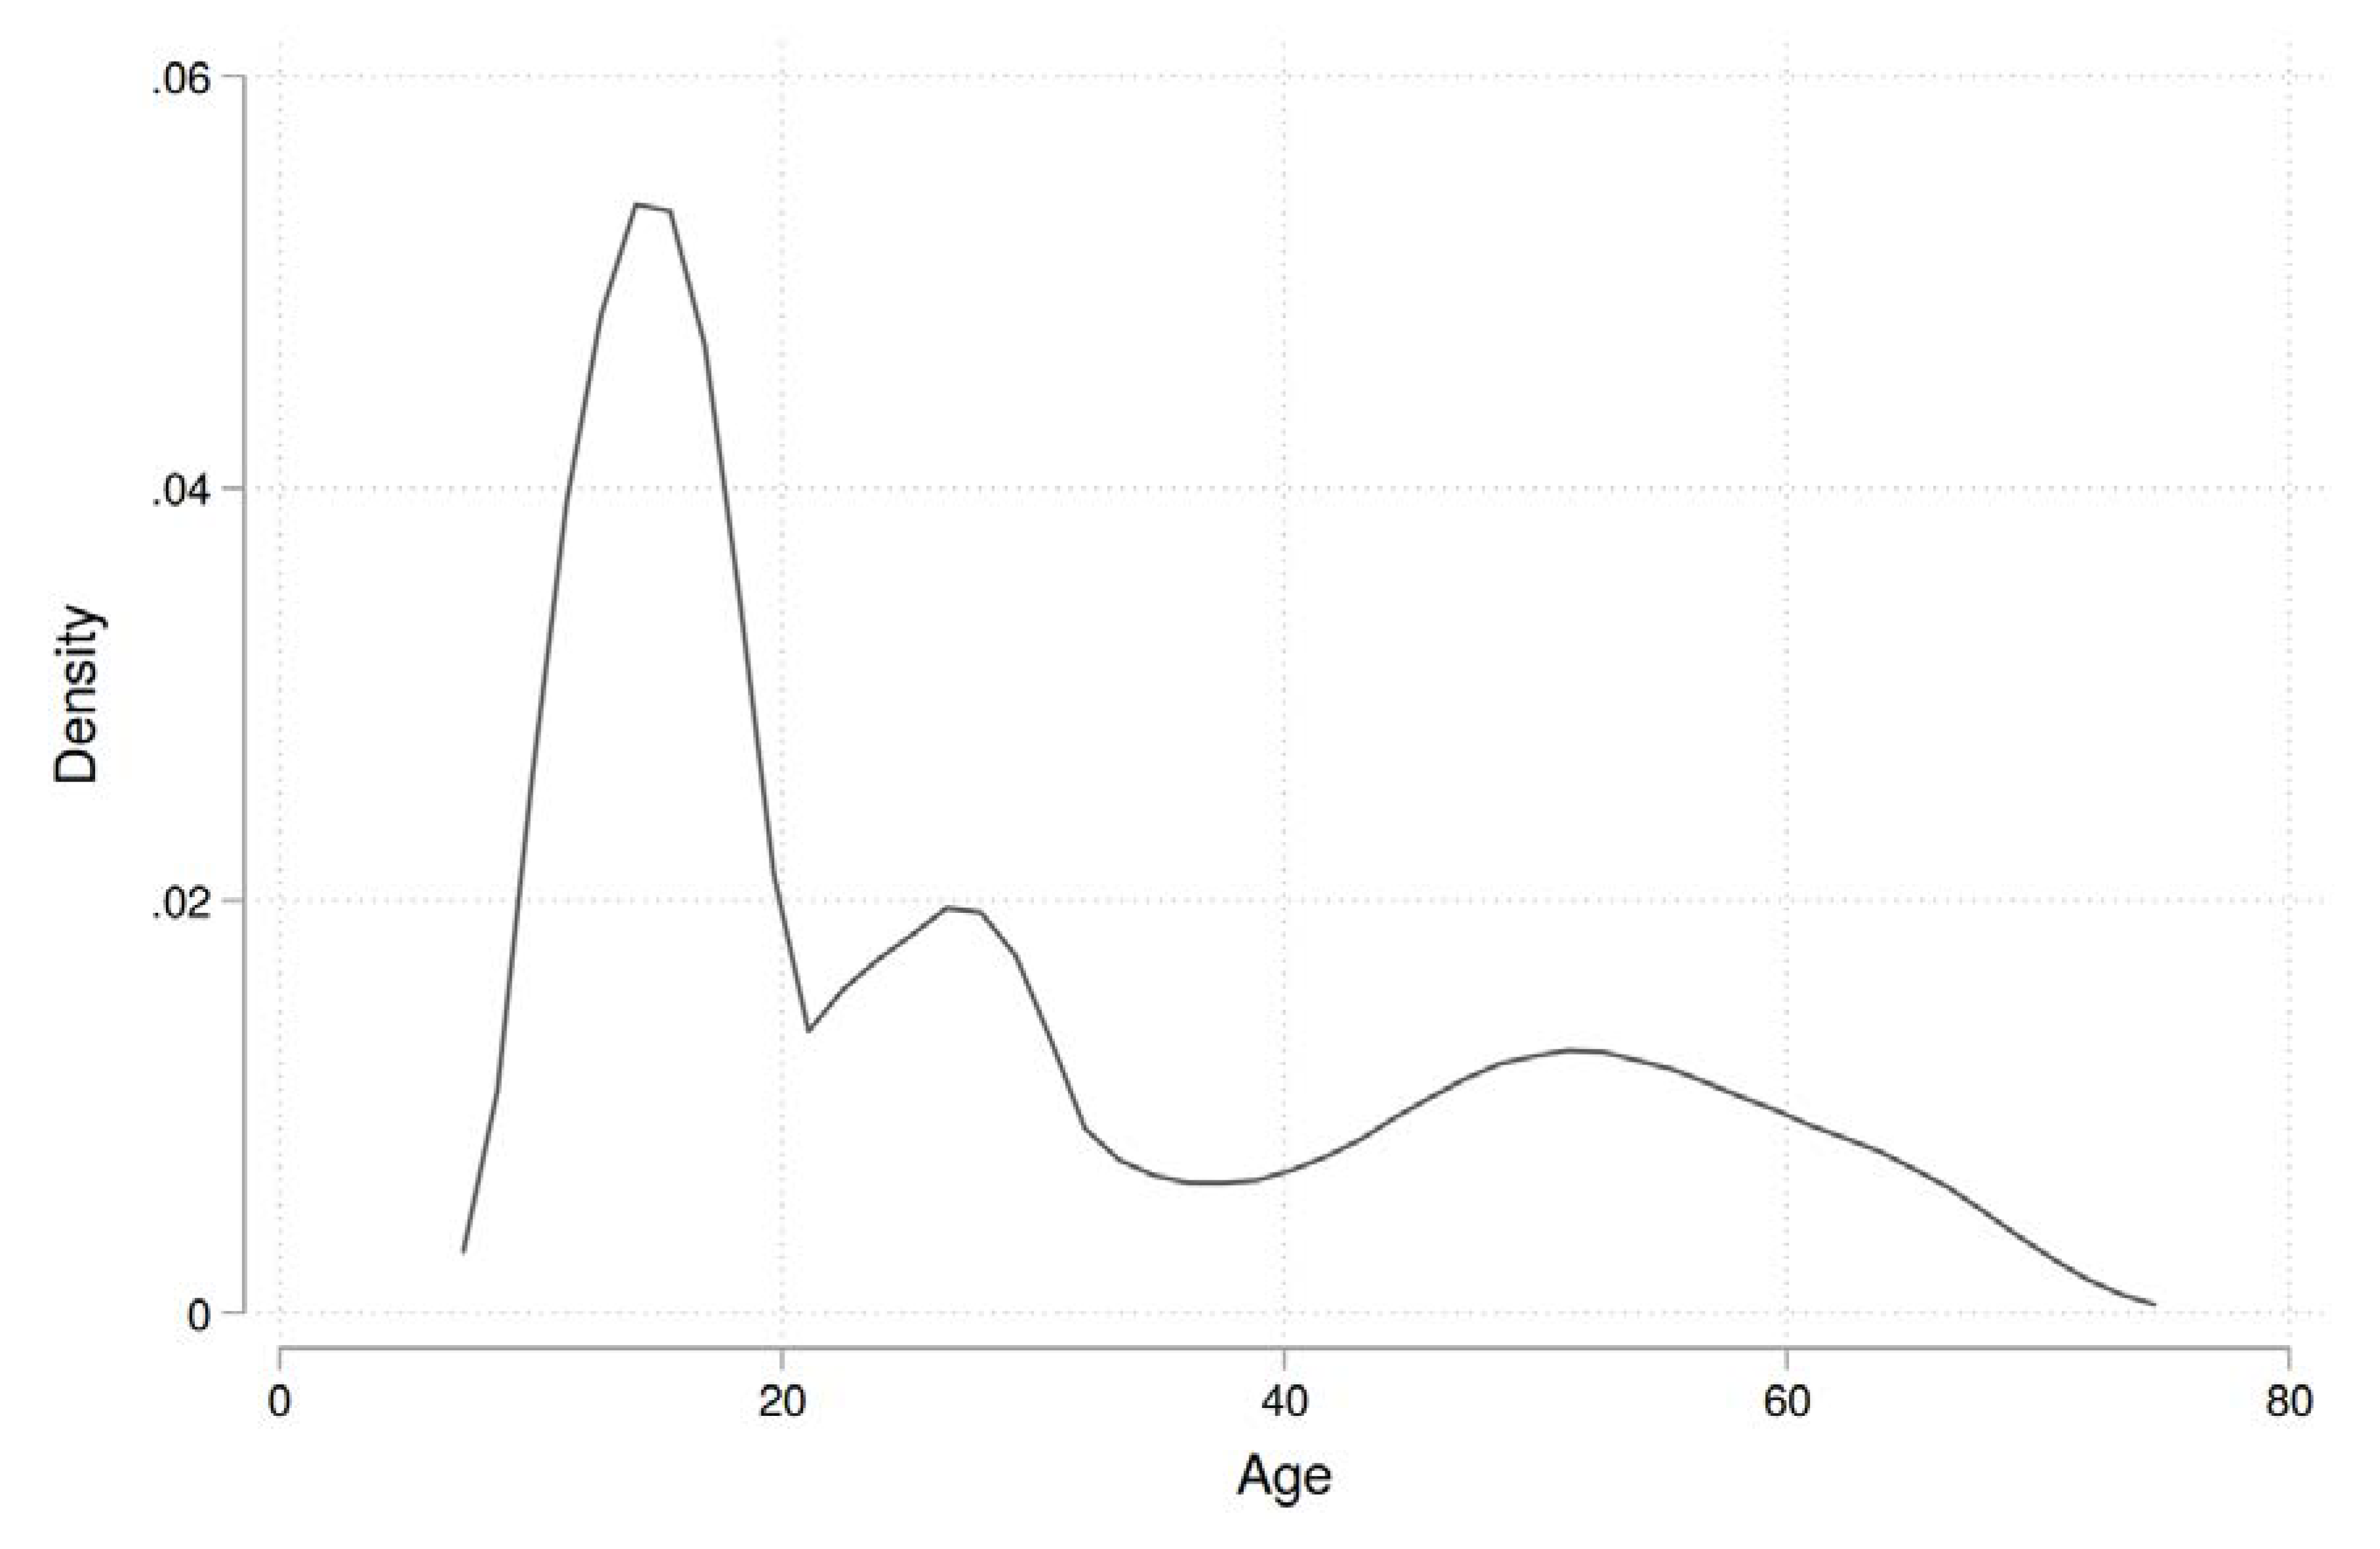

Table A1.
OLS regression results (Interaction models).
| Satisfaction overall | Satisfaction with standard of living | Satisfaction with health | Satisfaction with family life | Satisfaction with friends | |
| Extraversion | 0.776** | 0.521* | 0.342 | -0.171 | 0.501* |
| (2.96) | (1.97) | (1.13) | (-0.59) | (1.97) | |
| Age | 0.346** | 0.093 | -0.049 | -0.162 | 0.016 |
| (2.72) | (0.72) | (-0.33) | (-1.15) | (0.13) | |
| Extraversion * Age | -0.039 | -0.029 | -0.019 | 0.033 | -0.025 |
| (-1.10) | (-0.80) | (-0.47) | (0.85) | (-0.74) | |
| Age * Age | -0.010 | -0.002 | 0.001 | 0.003 | -0.002 |
| (-1.74) | (-0.35) | (0.14) | (0.53) | (-0.38) | |
| Extraversion * Age * Age | 0.001 | 0.001 | 0.001 | -0.001 | 0.001 |
| (0.59) | (0.35) | (0.50) | (-0.52) | (0.75) | |
| Age * Age * Age | 0.000 | 0.000 | -0.000 | -0.000 | 0.000 |
| (1.12) | (0.09) | (-0.16) | (-0.22) | (0.42) | |
| Extraversion * Age * Age * Age | -0.000 | -0.000 | -0.000 | 0.000 | -0.000 |
| (-0.33) | (-0.02) | (-0.55) | (0.34) | (-0.68) | |
| Age * Age * Age * Age | -0.000 | 0.000 | 0.000 | 0.000 | -0.000 |
| (-0.73) | (0.12) | (0.18) | (0.07) | (-0.36) | |
| Extraversion * Age * Age * Age * Age | 0.000 | -0.000 | 0.000 | -0.000 | 0.000 |
| (0.21) | (-0.22) | (0.59) | (-0.25) | (0.57) | |
| Cohort | |||||
| Lower secondary | Ref. | Ref. | Ref. | Ref. | Ref. |
| Upper secondary | -0.160*** | -0.228*** | 0.029 | -0.182*** | 0.084*** |
| (-6.27) | (-9.45) | (1.08) | (-6.37) | (3.66) | |
| University students | -0.167*** | -0.529*** | 0.245*** | 0.144** | -0.083 |
| (-3.96) | (-10.98) | (4.45) | (2.74) | (-1.86) | |
| Adult cohort | -0.249*** | -0.644*** | 0.109 | 0.257** | -0.126 |
| (-3.95) | (-8.63) | (1.30) | (3.27) | (-1.86) | |
| Constant | 3.068** | 6.610*** | 8.134*** | 9.724*** | 7.533*** |
| (3.23) | (6.91) | (7.47) | (9.28) | (8.10) | |
| Observations | 57,505 | 57,505 | 57,505 | 57,505 | 57,505 |
| Individuals | 41,353 | 41,353 | 41,353 | 41,353 | 41,353 |
| R2 | 0.034 | 0.027 | 0.080 | 0.011 | 0.056 |
Source: NEPS SC 3/4/5/6. Standard errors in parentheses. Standard errors clustered by individual. Unstandardized coefficients. Note that some coefficients are so small that they are difficult to report in table form due to rounding. * p < 0.05, ** p < 0.01, *** p < 0.00.
References
- Bedaso, T. S., & Han, B. (2021). Attitude toward Aging Mediates the Relationship between Personality and Mental Health in Older Adults. Healthcare, 9(5), 594. [CrossRef]
- Berg, A. I., Hoffman, L., Hassing, L. B., McClearn, G. E., & Johansson, B. (2009). What matters, and what matters most, for change in life satisfaction in the oldest-old? A study over 6 years among individuals 80+. Aging and Mental Health, 13(2), 191–201.
- Blossfeld, H., & Roßbach, H. (2019). Education as a Lifelong Process: The German National Educational Panel Study (NEPS)(2nd edn, Edition ZfE, Vol. 3). VS Verlag für Sozialwissenschaften.
- Cheng, C., Cheung, M. W.-L., Montasem, A., & 44 members of the International Network of Well-Being Studies. (2016). Explaining Differences in Subjective Well-Being Across 33 Nations Using Multilevel Models: Universal Personality, Cultural Relativity, and National Income: Subjective Well-Being Across 33 Nations. Journal of Personality, 84(1), 46–58. [CrossRef]
- Costa, P. T., & McCrae, R. R. (1980). Influence of extraversion and neuroticism on subjective well-being: Happy and unhappy people. Journal of Personality and Social Psychology, 38(4), 668–678. [CrossRef]
- Credé, M., Harms, P., Niehorster, S., & Gaye-Valentine, A. (2012). An evaluation of the consequences of using short measures of the Big Five personality traits. Journal of Personality and Social Psychology, 102(4), 874.
- Fors Connolly, F., & Johansson Sevä, I. (2021). Agreeableness, extraversion and life satisfaction: Investigating the mediating roles of social inclusion and status. Scandinavian Journal of Psychology, 62(5), 752–762. [CrossRef]
- Gale, C. R., Booth, T., Mõttus, R., Kuh, D., & Deary, I. J. (2013). Neuroticism and Extraversion in youth predict mental wellbeing and life satisfaction 40 years later. Journal of Research in Personality, 47(6), 687–697. [CrossRef]
- Heller, D., Watson, D., & Ilies, R. (2004). The Role of Person Versus Situation in Life Satisfaction: A Critical Examination. Psychological Bulletin, 130(4), 574–600. [CrossRef]
- Jovanović, V. (2019). Adolescent life satisfaction: The role of negative life events and the Big Five personality traits. Personality and Individual Differences, 151, 109548. [CrossRef]
- Kim, H., Schimmack, U., Oishi, S., & Tsutsui, Y. (2018). Extraversion and life satisfaction: A cross-cultural examination of student and nationally representative samples. Journal of Personality, 86(4), 604–618. [CrossRef]
- Li, M. (2021). The Contributions of Indigenous Personality and Parenting Style to Life Satisfaction Development in Chinese Adolescents. Frontiers in Psychology, 12, 702408. [CrossRef]
- Mroczek, D. K., & Spiro, A. (2005). Change in Life Satisfaction During Adulthood: Findings From the Veterans Affairs Normative Aging Study. Journal of Personality and Social Psychology, 88(1), 189–202. [CrossRef]
- Rammstedt, B., & John, O. P. (2007). Measuring personality in one minute or less: A 10-item short version of the Big Five Inventory in English and German. Journal of Research in Personality, 41(1), 203–212. [CrossRef]
- Smith, C. A., & Konik, J. (2022). Who is satisfied with life? Personality, cognitive flexibility, and life satisfaction. Current Psychology, 41(12), 9019–9026. [CrossRef]
- Steel, P., Schmidt, J., & Shultz, J. (2008). Refining the relationship between personality and subjective well-being. Psychological Bulletin, 134(1), 138–161. [CrossRef]
- TNS Infratest. (2006). Leben in Deutschland. Befragung 2006 zur sozialen Lage der Haushalte. Personenfragebogen für alle. https://www.bibsonomy.org/bibtex/29002fad45344844099cf1fd328e96128/renditen-group.
- Wilson, W. R. (1967). Correlates of avowed happiness. Psychological Bulletin, 67(4), 294–306. [CrossRef]
| 1 | Concrete datasets are the following: 10.5157/NEPS:SC3:12.0.0; 10.5157/NEPS:SC4:12.0.0; 10.5157/NEPS:SC5:17.0.0; 10.5157/NEPS:SC6:13.0.0. The NEPS is carried out by the Leibniz Institute for Educational Trajectories (LIfBi, Germany) in cooperation with a nationwide network. |
Figure 1.
Distribution of central variables. Source: NEPS SC 3/4/5/6. N = 57,505.
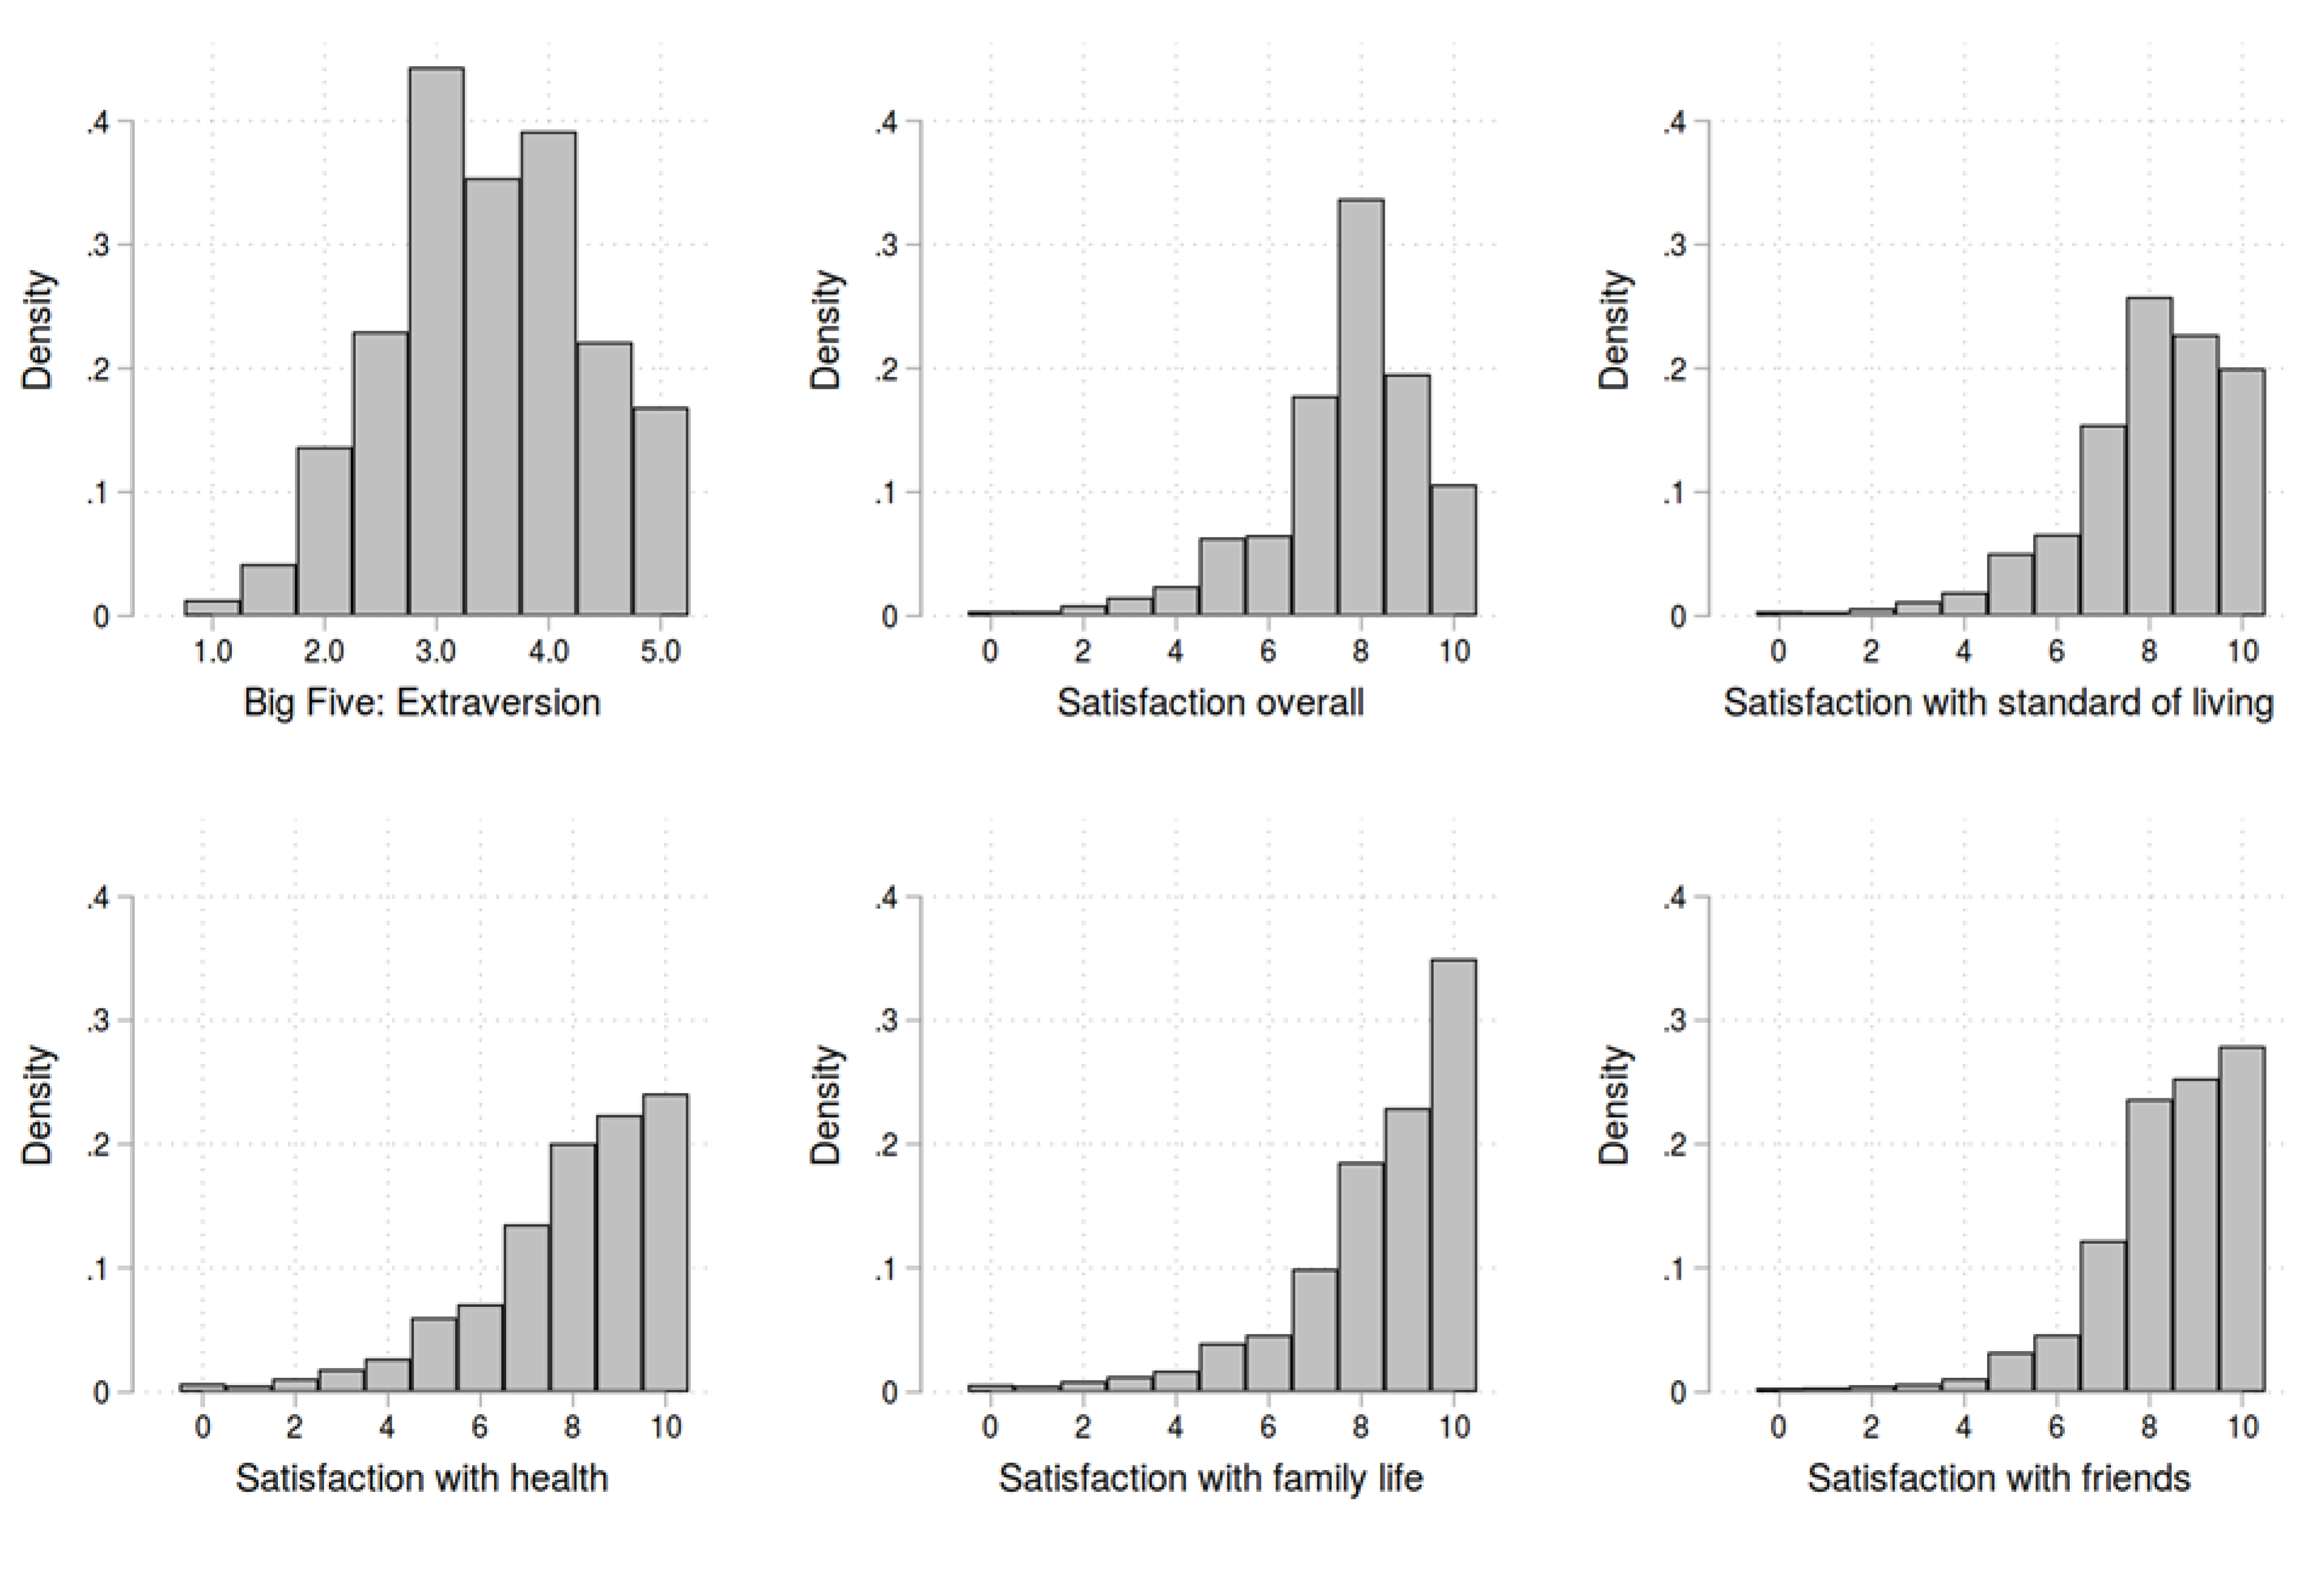
Figure 2.
Graphical association between extraversion and various dimensions of life satisfaction . Source: NEPS SC 3/4/5/6. N = 57,505. Graph created using binscatter (https://michaelstepner.com/binscatter/).
Figure 2.
Graphical association between extraversion and various dimensions of life satisfaction . Source: NEPS SC 3/4/5/6. N = 57,505. Graph created using binscatter (https://michaelstepner.com/binscatter/).
| Mean | SD | Median | Min | Max | |
| Total sample (N=57,505) | |||||
| Female participant | 0.52 | 0 | 1 | ||
| Age | 29.4 | 17.5 | 25 | 10 | 72 |
| Extraversion | 3.45 | 0.89 | 3.50 | 1 | 5 |
| Satisfaction overall | 7.63 | 1.73 | 8 | 0 | 10 |
| Satisfaction with standard of living | 7.97 | 1.77 | 8 | 0 | 10 |
| Satisfaction with health | 7.89 | 2.04 | 8 | 0 | 10 |
| Satisfaction with family life | 8.34 | 1.93 | 9 | 0 | 10 |
| Satisfaction with friends | 8.34 | 1.67 | 9 | 0 | 10 |
| Lower secondary cohort (N=14,363) | |||||
| Female participant | 0.50 | 0 | 1 | ||
| Age | 14.9 | 2.52 | 14 | 10 | 28 |
| Extraversion | 3.39 | 0.86 | 3.50 | 1 | 5 |
| Satisfaction overall | 7.63 | 1.98 | 8 | 0 | 10 |
| Satisfaction with standard of living | 8.30 | 1.82 | 9 | 0 | 10 |
| Satisfaction with health | 8.27 | 2.02 | 9 | 0 | 10 |
| Satisfaction with family life | 8.48 | 2.06 | 9 | 0 | 10 |
| Satisfaction with friends | 8.53 | 1.76 | 9 | 0 | 10 |
| Upper secondary cohort (N=13,505) | |||||
| Female participant | 0.50 | 0 | 1 | ||
| Age | 14.7 | 0.72 | 15 | 12 | 20 |
| Extraversion | 3.44 | 0.88 | 3.50 | 1 | 5 |
| Satisfaction overall | 7.50 | 2.03 | 8 | 0 | 10 |
| Satisfaction with standard of living | 8.08 | 1.94 | 9 | 0 | 10 |
| Satisfaction with health | 8.31 | 2.13 | 9 | 0 | 10 |
| Satisfaction with family life | 8.31 | 2.28 | 9 | 0 | 10 |
| Satisfaction with friends | 8.63 | 1.87 | 9 | 0 | 10 |
| University student cohort (N=9,075) | |||||
| Female participant | 0.60 | 0 | 1 | ||
| Age | 27.2 | 3.80 | 26 | 22 | 70 |
| Extraversion | 3.69 | 0.86 | 4 | 1 | 5 |
| Satisfaction overall | 7.91 | 1.16 | 8 | 0 | 10 |
| Satisfaction with standard of living | 7.78 | 1.49 | 8 | 0 | 10 |
| Satisfaction with health | 8.17 | 1.52 | 8 | 0 | 10 |
| Satisfaction with family life | 8.36 | 1.52 | 9 | 0 | 10 |
| Satisfaction with friends | 8.30 | 1.32 | 8 | 1 | 10 |
| Observations | Adult cohort (N= 20,562) | ||||
| Female participant | 0.51 | 0 | 1 | ||
| Age | 50.2 | 10.9 | 51 | 26 | 72 |
| Extraversion | 3.39 | 0.91 | 3.50 | 1 | 5 |
| Satisfaction overall | 7.59 | 1.52 | 8 | 0 | 10 |
| Satisfaction with standard of living | 7.73 | 1.67 | 8 | 0 | 10 |
| Satisfaction with health | 7.22 | 2.01 | 8 | 0 | 10 |
| Satisfaction with family life | 8.26 | 1.73 | 9 | 0 | 10 |
| Satisfaction with friends | 8.02 | 1.55 | 8 | 0 | 10 |
Source: NEPS SC 3/4/5/6.
Figure 3.
OLS regression coefficients (unstandardized) by age and dimensions of life satisfaction. Source: NEPS SC 3/4/5/6. N = 57,505. 95% confidence bands included. Standard errors clustered by individual. Control variable: NEPS cohort. For each subgraph, the y-axis measures the association between extraversion and satisfaction via the OLS regression coefficient.
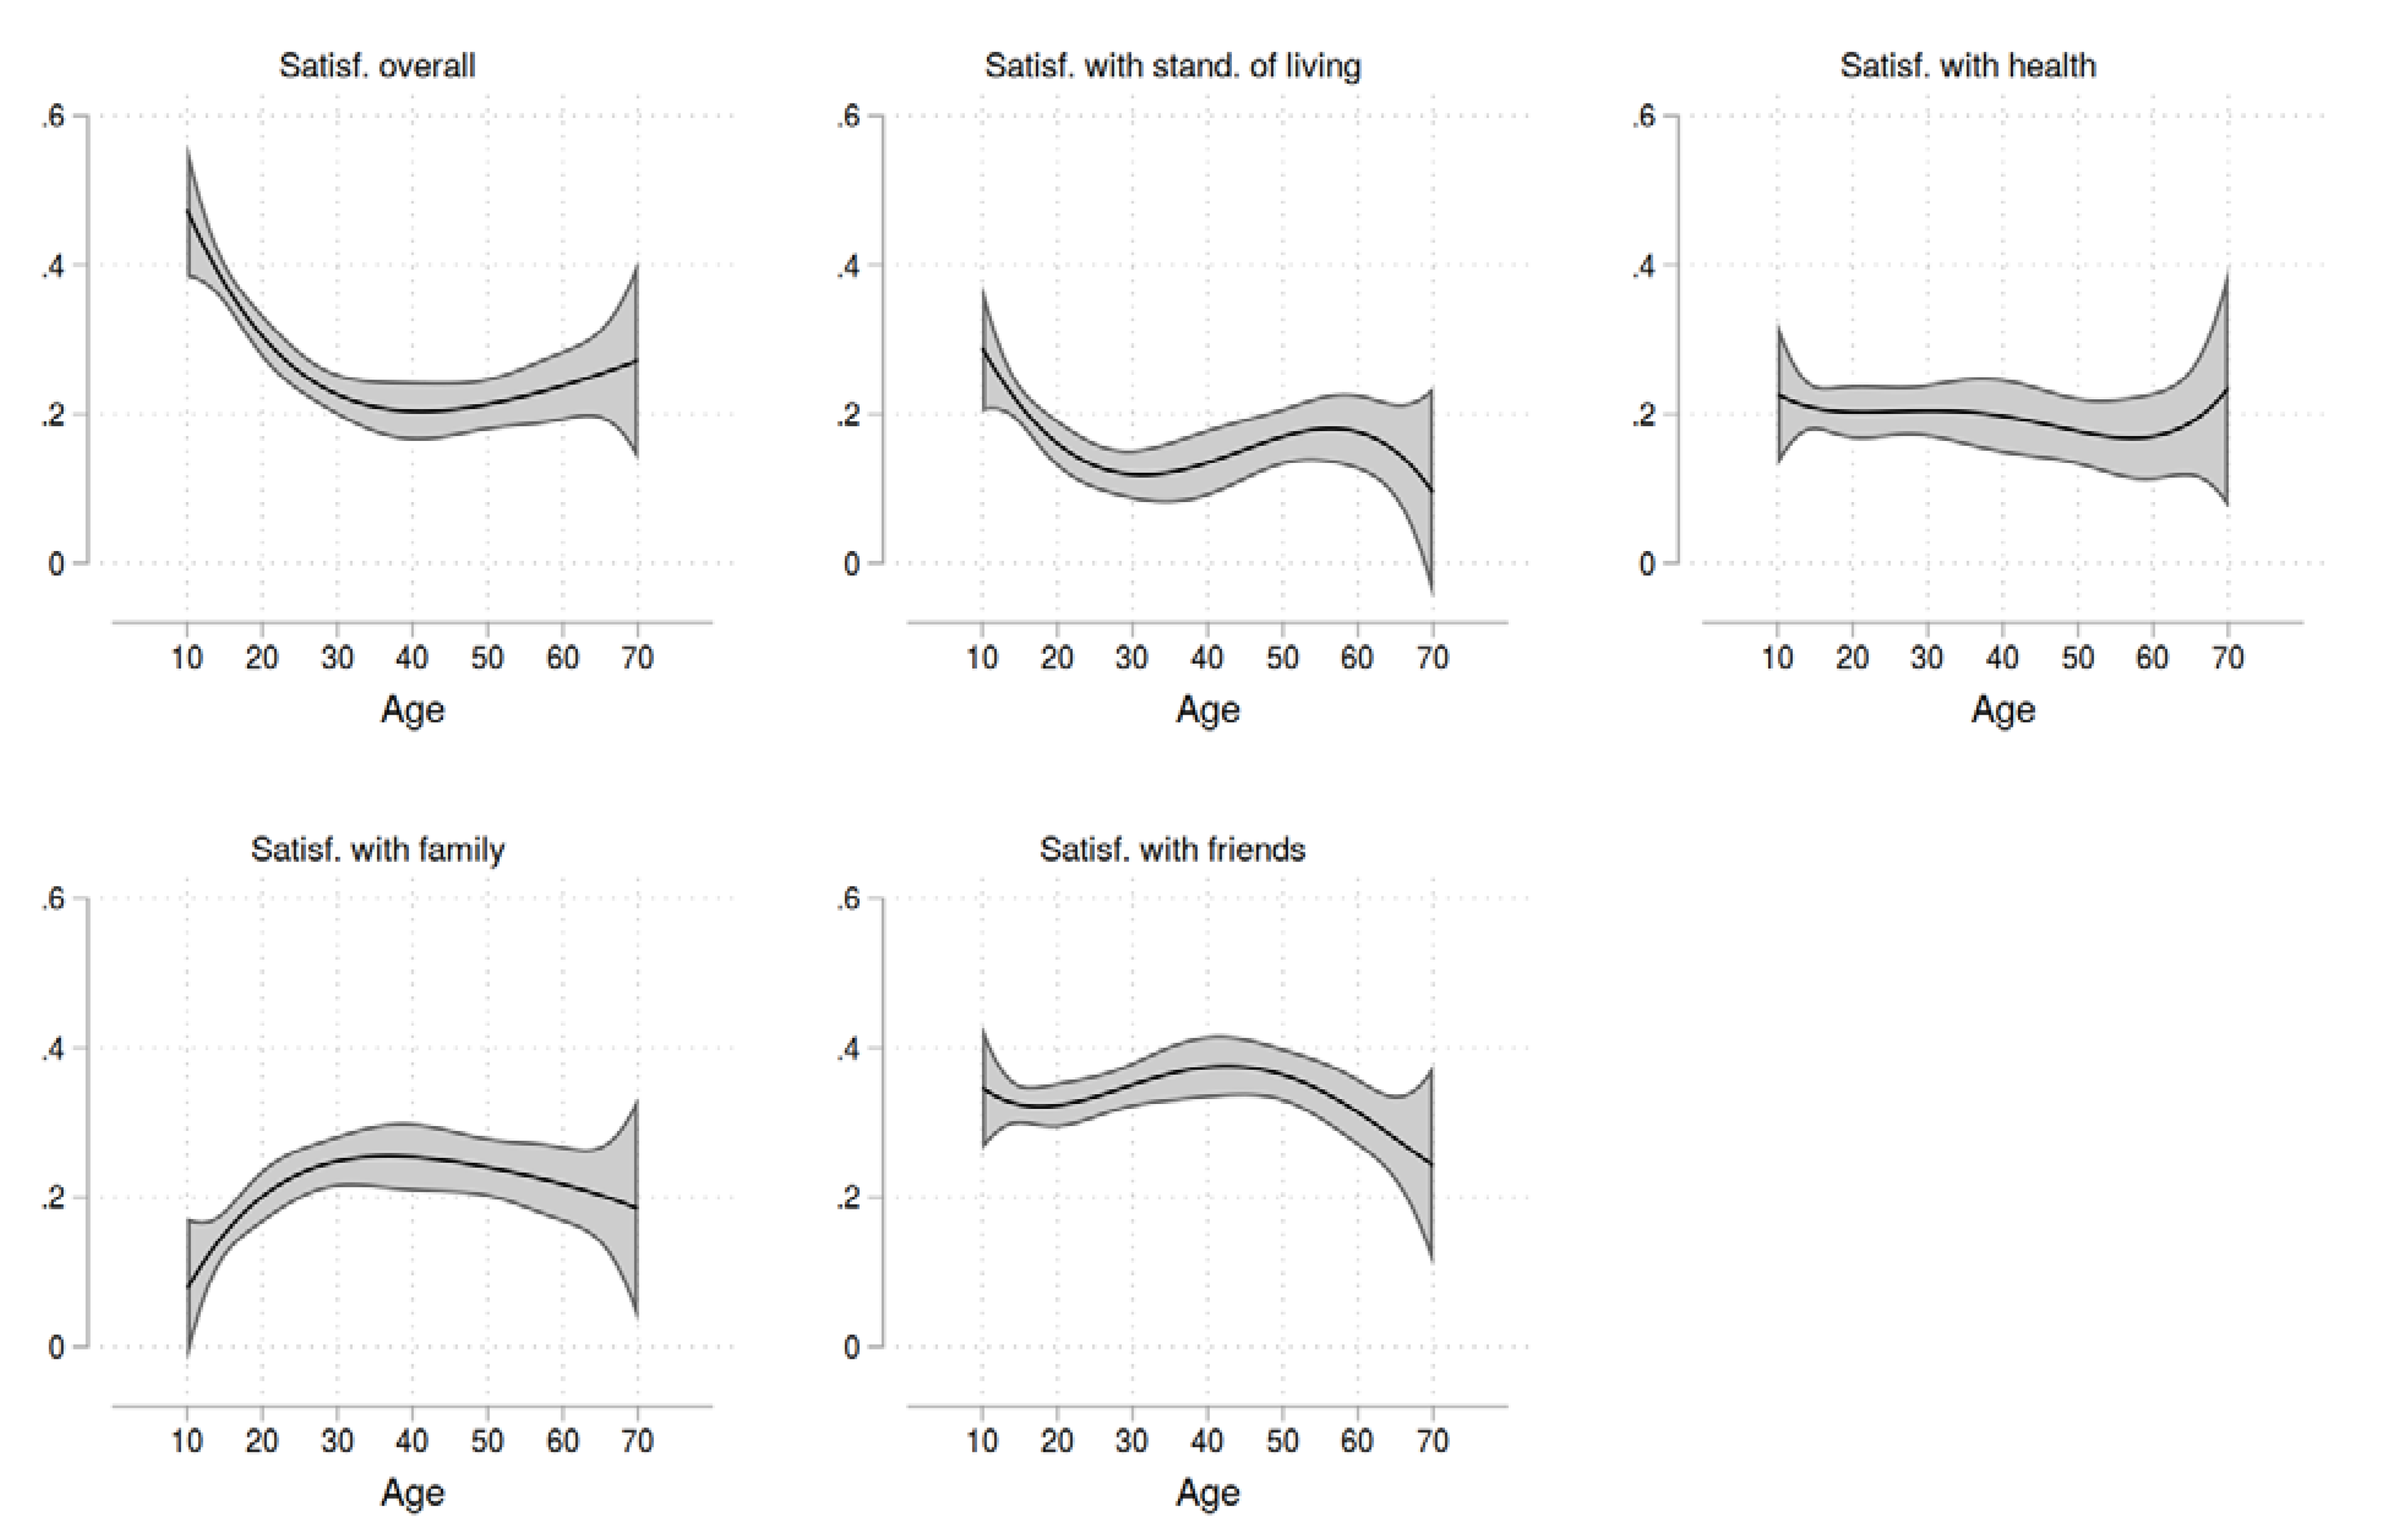
Table 1.
Number of participants with relevant data available in the NEPS by cohort and year.
| Time of survey | Lower secondary students (SC3) | Upper secondary students (SC4) | Tertiary students (SC5) | General population (SC6) |
| 2010 | 13,505 | |||
| 2012/13 | 5,669 | 11,455 | ||
| 2014/15 | 4,854 | |||
| 2015/16 | 9,107 | |||
| 2016/17 | 9,075 | |||
| 2018/19 | 3,840 | |||
| Total | 57,505 | |||
Note: only years are shown where surveys were conducted and relevant variables are available.
Table 2.
Descriptive overview.
| Mean | SD | Median | Min | Max | |
| Total sample (N=57,505) | |||||
| Female participant | 0.52 | 0 | 1 | ||
| Age | 29.4 | 17.5 | 25 | 10 | 72 |
| Extraversion | 3.45 | 0.89 | 3.50 | 1 | 5 |
| Satisfaction overall | 7.63 | 1.73 | 8 | 0 | 10 |
| Satisfaction with standard of living | 7.97 | 1.77 | 8 | 0 | 10 |
| Satisfaction with health | 7.89 | 2.04 | 8 | 0 | 10 |
| Satisfaction with family life | 8.34 | 1.93 | 9 | 0 | 10 |
| Satisfaction with friends | 8.34 | 1.67 | 9 | 0 | 10 |
| Lower secondary cohort (N=14,363) | |||||
| Female participant | 0.50 | 0 | 1 | ||
| Age | 14.9 | 2.52 | 14 | 10 | 28 |
| Extraversion | 3.39 | 0.86 | 3.50 | 1 | 5 |
| Satisfaction overall | 7.63 | 1.98 | 8 | 0 | 10 |
| Satisfaction with standard of living | 8.30 | 1.82 | 9 | 0 | 10 |
| Satisfaction with health | 8.27 | 2.02 | 9 | 0 | 10 |
| Satisfaction with family life | 8.48 | 2.06 | 9 | 0 | 10 |
| Satisfaction with friends | 8.53 | 1.76 | 9 | 0 | 10 |
| Upper secondary cohort (N=13,505) | |||||
| Female participant | 0.50 | 0 | 1 | ||
| Age | 14.7 | 0.72 | 15 | 12 | 20 |
| Extraversion | 3.44 | 0.88 | 3.50 | 1 | 5 |
| Satisfaction overall | 7.50 | 2.03 | 8 | 0 | 10 |
| Satisfaction with standard of living | 8.08 | 1.94 | 9 | 0 | 10 |
| Satisfaction with health | 8.31 | 2.13 | 9 | 0 | 10 |
| Satisfaction with family life | 8.31 | 2.28 | 9 | 0 | 10 |
| Satisfaction with friends | 8.63 | 1.87 | 9 | 0 | 10 |
| University student cohort (N=9,075) | |||||
| Female participant | 0.60 | 0 | 1 | ||
| Age | 27.2 | 3.80 | 26 | 22 | 70 |
| Extraversion | 3.69 | 0.86 | 4 | 1 | 5 |
| Satisfaction overall | 7.91 | 1.16 | 8 | 0 | 10 |
| Satisfaction with standard of living | 7.78 | 1.49 | 8 | 0 | 10 |
| Satisfaction with health | 8.17 | 1.52 | 8 | 0 | 10 |
| Satisfaction with family life | 8.36 | 1.52 | 9 | 0 | 10 |
| Satisfaction with friends | 8.30 | 1.32 | 8 | 1 | 10 |
| Observations | Adult cohort (N= 20,562) | ||||
| Female participant | 0.51 | 0 | 1 | ||
| Age | 50.2 | 10.9 | 51 | 26 | 72 |
| Extraversion | 3.39 | 0.91 | 3.50 | 1 | 5 |
| Satisfaction overall | 7.59 | 1.52 | 8 | 0 | 10 |
| Satisfaction with standard of living | 7.73 | 1.67 | 8 | 0 | 10 |
| Satisfaction with health | 7.22 | 2.01 | 8 | 0 | 10 |
| Satisfaction with family life | 8.26 | 1.73 | 9 | 0 | 10 |
| Satisfaction with friends | 8.02 | 1.55 | 8 | 0 | 10 |
Source: NEPS SC 3/4/5/6.
Table 3.
Correlation matrix of key variables (Pearson’s r).
| Extraversion | Age | Satisfaction overall | Satisfaction with standard of living | Satisfaction with health | Satisfaction with family life | Satisfaction with friends | |
| Total sample (N=57,505) | |||||||
| Extraversion | 1.000 | ||||||
| Age | -0.026 | 1.000 | |||||
| Satisfaction overall | 0.161* | -0.002 | 1.000 | ||||
| Satisfaction with standard of living | 0.083* | -0.098* | 0.510* | 1.000 | |||
| Satisfaction with health | 0.099* | -0.264* | 0.447* | 0.372* | 1.000 | ||
| Satisfaction with family life | 0.088* | -0.035* | 0.539* | 0.409* | 0.373* | 1.000 | |
| Satisfaction with friends | 0.176* | -0.148* | 0.438* | 0.366* | 0.361* | 0.467* | 1.000 |
| Lower secondary cohort (N=14,363) | |||||||
| Extraversion | 1.000 | ||||||
| Age | 0.034* | 1.000 | |||||
| Satisfaction overall | 0.168* | 0.109* | 1.000 | ||||
| Satisfaction with standard of living | 0.104* | 0.025 | 0.513* | 1.000 | |||
| Satisfaction with health | 0.098* | -0.023 | 0.454* | 0.388* | 1.000 | ||
| Satisfaction with family life | 0.086* | -0.020 | 0.551* | 0.455* | 0.439* | 1.000 | |
| Satisfaction with friends | 0.153* | -0.022 | 0.480* | 0.384* | 0.396* | 0.489* | 1.000 |
| Upper secondary cohort (N=13,505) | |||||||
| Extraversion | 1.000 | ||||||
| Age | -0.001 | 1.000 | |||||
| Satisfaction overall | 0.160* | -0.053* | 1.000 | ||||
| Satisfaction with standard of living | 0.094* | -0.057* | 0.540* | 1.000 | |||
| Satisfaction with health | 0.073* | -0.065* | 0.463* | 0.424* | 1.000 | ||
| Satisfaction with family life | 0.030* | -0.051* | 0.563* | 0.488* | 0.445* | 1.000 | |
| Satisfaction with friends | 0.154* | -0.030* | 0.484* | 0.438* | 0.408* | 0.472* | 1.000 |
| University student cohort (N=9,075) | |||||||
| Extraversion | 1.000 | ||||||
| Age | -0.017 | 1.000 | |||||
| Satisfaction overall | 0.192* | -0.065* | 1.000 | ||||
| Satisfaction with standard of living | 0.081* | -0.050* | 0.395* | 1.000 | |||
| Satisfaction with health | 0.130* | -0.093* | 0.406* | 0.249* | 1.000 | ||
| Satisfaction with family life | 0.147* | -0.044* | 0.459* | 0.218* | 0.328* | 1.000 | |
| Satisfaction with friends | 0.242* | -0.052* | 0.383* | 0.187* | 0.260* | 0.433* | 1.000 |
| Adult cohort (N=20,562) | |||||||
| Extraversion | 1.000 | ||||||
| Age | -0.041* | 1.000 | |||||
| Satisfaction overall | 0.136* | -0.037* | 1.000 | ||||
| Satisfaction with standard of living | 0.080* | 0.045* | 0.551 | 1.000 | |||
| Satisfaction with health | 0.090* | -0.171* | 0.486* | 0.325* | 1.000 | ||
| Satisfaction with family life | 0.122* | -0.012 | 0.531* | 0.352* | 0.281* | 1.000 | |
| Satisfaction with friends | 0.198* | -0.030* | 0.395* | 0.312* | 0.261* | 0.460* | 1.000 |
Source: NEPS SC 3/4/5/6. N = 57,505. * p < 0.001. N refers to the numbers of observations, which can be larger than the number of individuals.
Table 4.
OLS regression results.
| Satisfaction overall | Satisfaction with standard of living | Satisfaction with health | Satisfaction with family life | Satisfaction with friends | |
| Extraversion | 0.302*** | 0.177*** | 0.205*** | 0.194*** | 0.334*** |
| [0.284,0.319] | [0.159,0.195] | [0.185,0.226] | [0.174,0.214] | [0.317,0.351] | |
| Cohort | |||||
| Lower secondary | Ref. | Ref. | Ref. | Ref. | Ref. |
| Upper secondary | -0.146*** | -0.226*** | 0.0296 | -0.183*** | 0.0832*** |
| [-0.196,-0.0953] | [-0.273,-0.179] | [-0.0236,0.0827] | [-0.238,-0.127] | [0.0381,0.128] | |
| Tertiary students | 0.188*** | -0.571*** | -0.158*** | -0.185*** | -0.331*** |
| [0.144,0.232] | [-0.618,-0.525] | [-0.208,-0.107] | [-0.236,-0.134] | [-0.373,-0.289] | |
| Adult cohort | -0.0376 | -0.566*** | -1.049*** | -0.223*** | -0.514*** |
| [-0.0819,0.00667] | [-0.610,-0.522] | [-1.101,-0.998] | [-0.272,-0.174] | [-0.554,-0.473] | |
| Constant | 6.607*** | 7.700*** | 7.573*** | 7.827*** | 7.400*** |
| [6.534,6.679] | [7.628,7.771] | [7.491,7.655] | [7.746,7.907] | [7.331,7.468] | |
| Observations | 57,505 | 57,505 | 57,505 | 57,505 | 57,505 |
| Individuals | 41,353 | 41,353 | 41,353 | 41,353 | 41,353 |
| R2 | 0.029 | 0.026 | 0.068 | 0.010 | 0.055 |
Source: NEPS SC 3/4/5/6. 95% confidence intervals in brackets. Standard errors clustered by individual. Unstandardized coefficients. * p < 0.05, ** p < 0.01, *** p < 0.001.
Disclaimer/Publisher’s Note: The statements, opinions and data contained in all publications are solely those of the individual author(s) and contributor(s) and not of MDPI and/or the editor(s). MDPI and/or the editor(s) disclaim responsibility for any injury to people or property resulting from any ideas, methods, instructions or products referred to in the content. |
© 2023 by the authors. Licensee MDPI, Basel, Switzerland. This article is an open access article distributed under the terms and conditions of the Creative Commons Attribution (CC BY) license (http://creativecommons.org/licenses/by/4.0/).
Copyright: This open access article is published under a Creative Commons CC BY 4.0 license, which permit the free download, distribution, and reuse, provided that the author and preprint are cited in any reuse.


