1. Introduction
The Internet of Things (IoT) applications span many domains, from smart cities to intelligent transportation, homes, and healthcare. The realization of the IoT requires delivering reliable services. Sensors' physical location and sensing coverage are two primary services of IoT applications.
A. Localization in IoT Networks
The IoT constructs a large-scale network that is comprised of different sensing-enabled nodes. Wireless sensor networks (WSNs) are considered one of the leading IoT enablers. A WSN may consist of thousands of low-cost and low-power sensor nodes. There are many applications for WSNs such as military surveillance, wildlife tracking, and environment monitoring. Determining sensors' physical location is vital for reliable IoT-based services. Localization of sensors is the basis of data collection and route planning to deliver data to the target station. For example, autonomous vehicles would have server safety issues without an accurate location as crashes increase, and inaccurate reports from sensors embedded in wildfire monitoring systems would deem the service poor. Finding the location of a sensor can be classified as anchor-based or anchor-free localizations. Anchors are nodes with more capabilities than sensors, as they know their actual location. That is why anchor nodes can be used as references to locate the unknown locations of sensors.
On the other hand, anchor-free localization uses other tools such as relative positioning, mapping, and embedded GPS client. In this paper, we localize IoT sensors using the anchor-based method. In this context, we aim to use time of arrival (ToA) or time difference of arrival (TDoA) with the path loss model of signals measured at the receiving sensor.
B. Sensing Coverage in IoT Networks
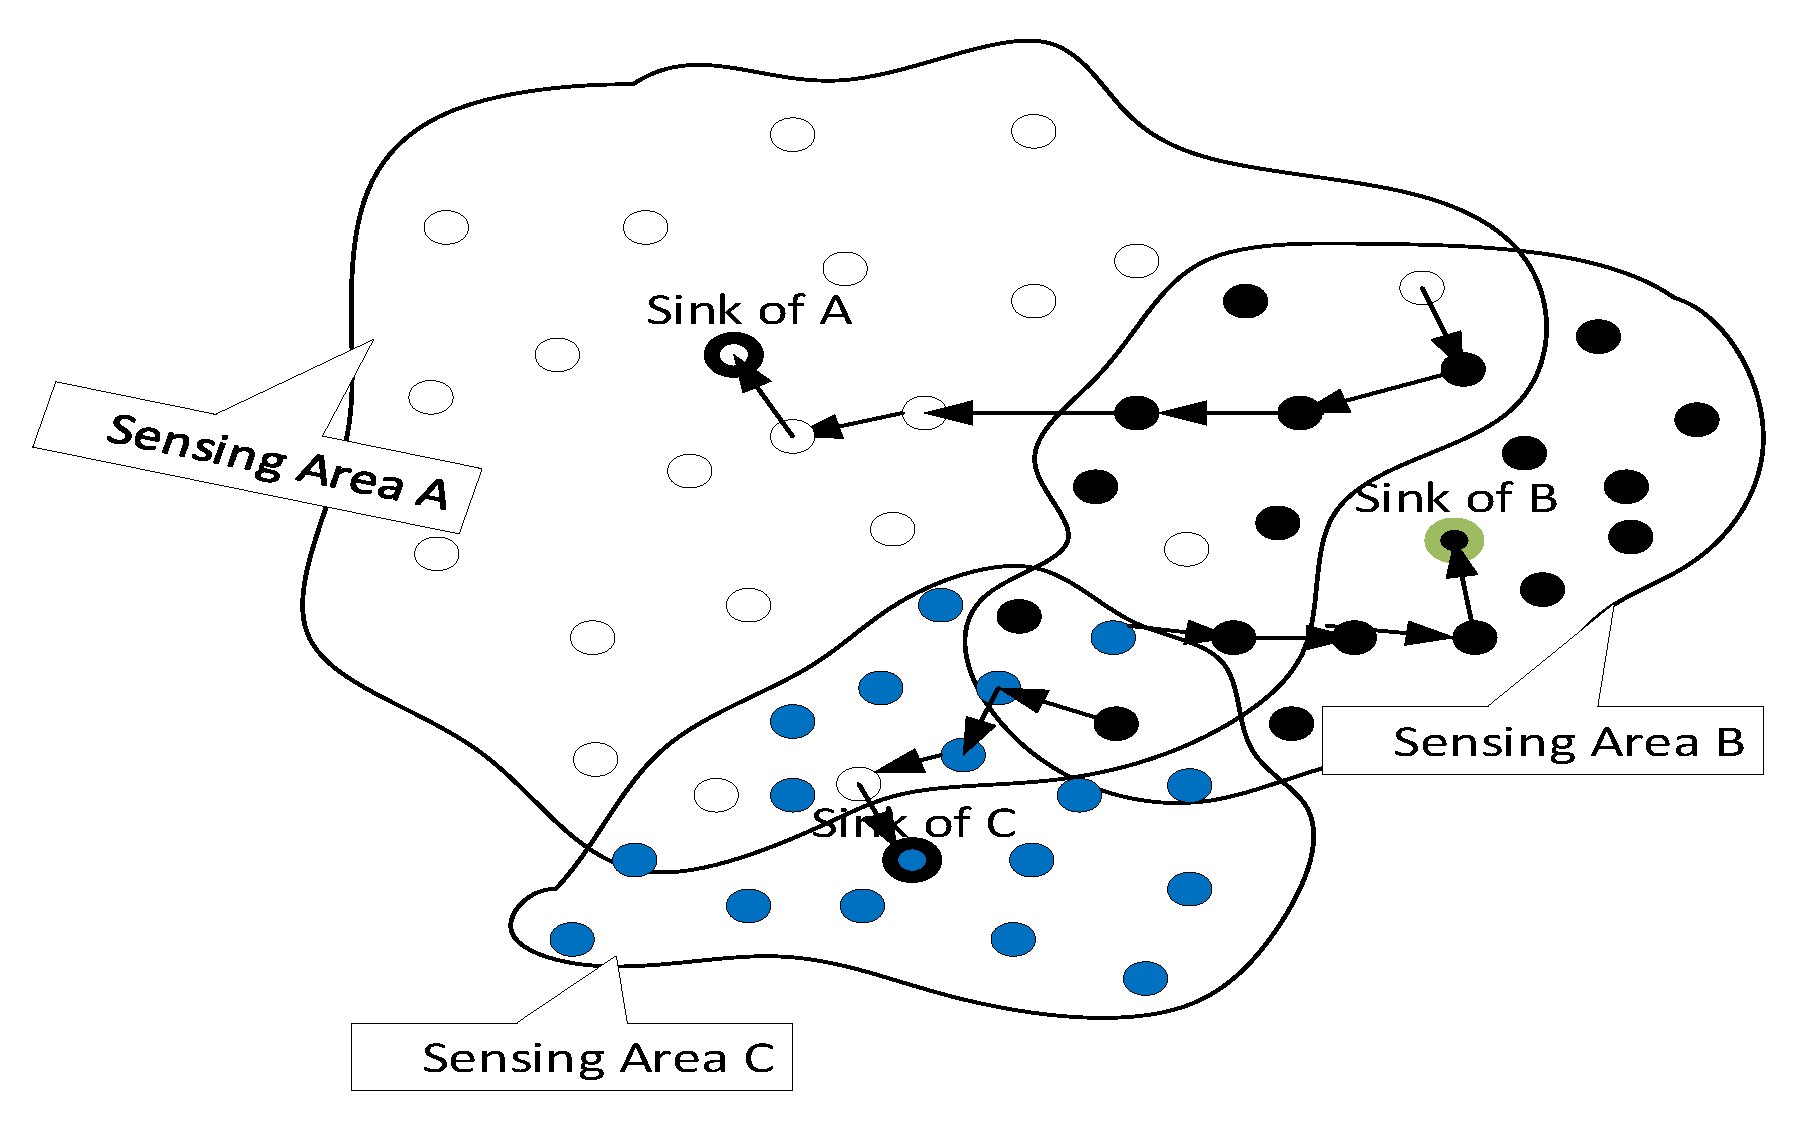
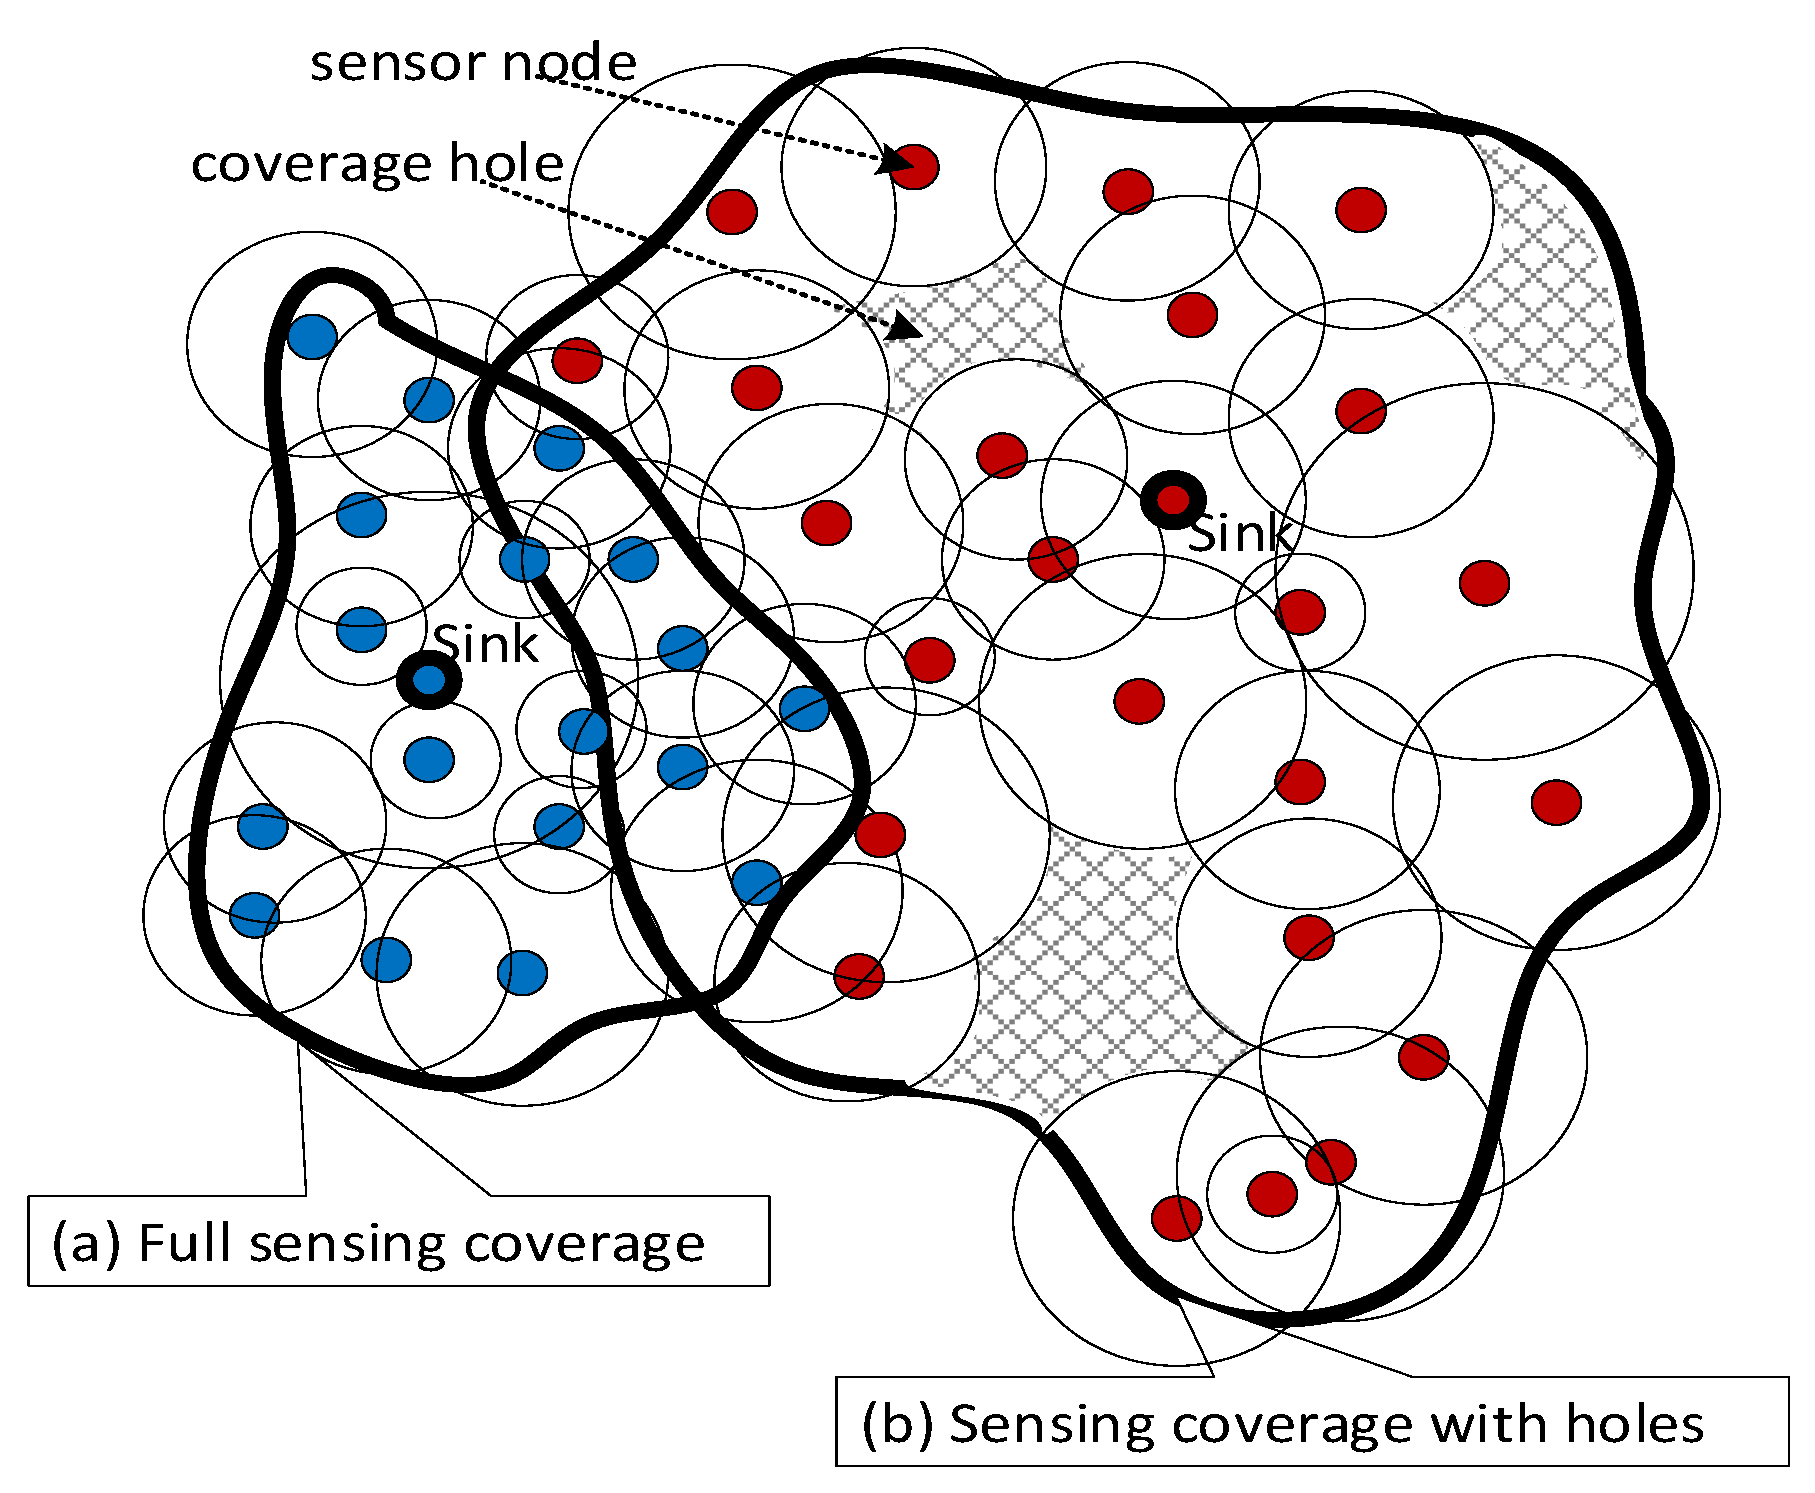
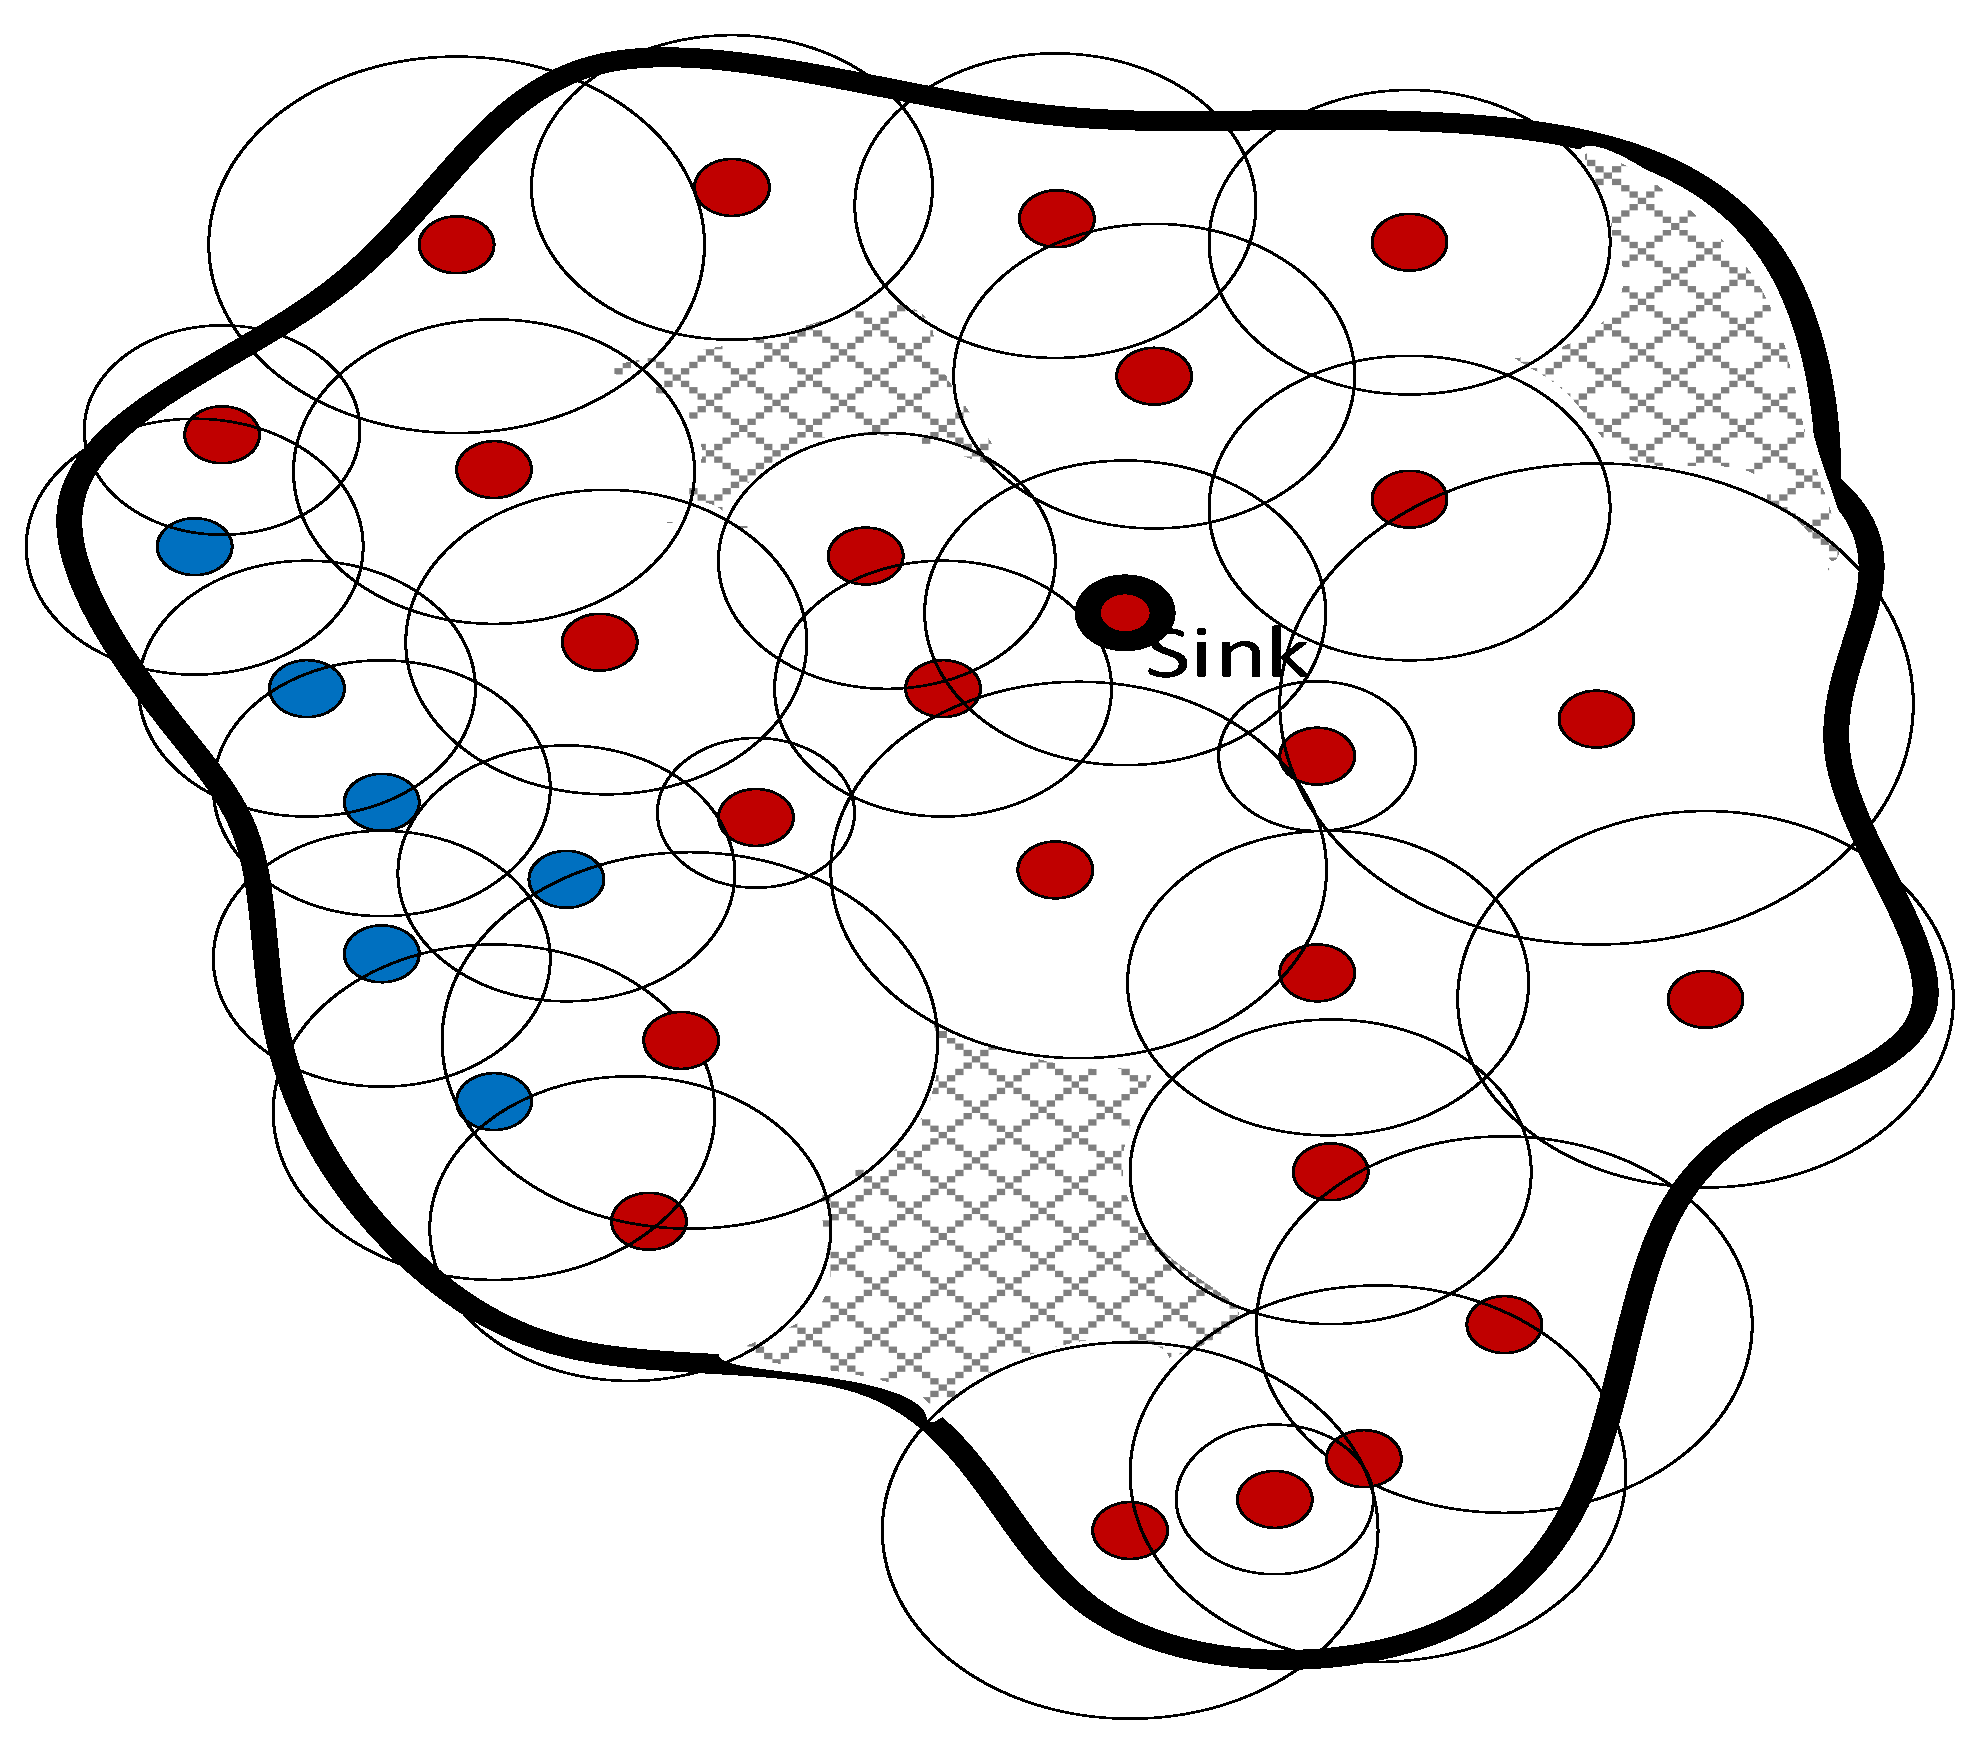
A point in a sensing field is covered if it is within sensing proximity of one of the sensor nodes. That is if the Euclidian distance between this point and any sensor node is less than the sensing range. As a result, the sensing field could have full coverage or partial coverage. However, the partial coverage can be mitigated using cooperative sensor networks— deployed sensor nodes could belong to several owners. For example, consider heterogeneous temperature sensors deployed in a region and belong to three different sensing providers, sensing areas A, B, and C, as shown in
Figure 1. These collective sensors can be viewed as shared resources. Their cooperation can provide a better quality of service (QoS). The use of such shared resources can be further enhanced with participatory sensors such as smartphones.
C. Deployment Methods in IoT Networks
The deployment strategies of sensor and anchor nodes vary according to the application, the target area size, the availability of information about the density and sensor locations, and whether or not the target region is accessible. In general, there are two deployment strategies: deterministic and random.
1). Deterministic Deployment
This deployment type depends on predefined parameters such as the shape of the network, the sensor's location, the distance between sensors, and the density. The deterministic deployment of sensors allows more control over their constrained resources. Most schemes dealing with deterministic deployment choose energy consumption as the most important metric to optimize [
2,
3,
4]. An example of this deployment type is grid-based deployment: hexagon, square, and equilateral triangle. Equilateral triangle grid-based deployment guarantees complete coverage and requires a minimum number of sensing nodes [
5]. The Art Gallery problem is a traditional problem of this type of deployment [
6]. In this problem, one seeks to place a minimum number of sensor cameras such that every point in the gallery is monitored by at least one sensor camera.
2). Random Deployment
Unlike deterministic deployment, random deployment has no available information about the network's shape or the sensors' location. This deployment type is ideal for a large-scale network such as harsh and inaccessible areas like forests, mountains, and dangerous areas, viz., leaking chemical plants and nuclear plants. However, random deployment does not guarantee full sensing coverage [
7]. Keeping all sensors active depletes their energy faster, consequently disconnecting the network. Thus, sensing reports may not be collected from some areas in the network. Therefore, a sleep mode is vital in this network to prolong its lifespan [
8,
9].
D. 1-hop vs. Multihop Communications
In wireless communications, a longer transmission distance requires higher transmission power. As a result, sensors with a low power supply use a short transmission range to save energy. Consequently, the aggregated sensing data is sent from a source node to a destination via multi-hops of intermediate nodes or relays. On the other hand, sensor nodes with a continuous power supply can communicate with a sink node via 1-hop communication (i.e., peer-to-peer communication).
E. The Relationship Between Localization and Sensing Coverage
Determining the existence of coverage holes and delineating them is a primary challenge in the IoT setting. Coverage holes occur when there is partial coverage in the sensing field. IoT applications vary in their sensing coverage requirements. For example, some applications require single-sensing coverage, meaning at least one sensor should monitor any point in the target region. In contrast, other applications require high coverage and, hence, require “
k” sensors to monitor each point in the region [
10].
On the other hand, there are several ways to estimate a sensor's location. Unfortunately, GPS is not usually one of them due to power limitations and to keep the costs of sensors low. Alternatives are anchor-based and anchor-free approaches. The former approach is widely used due to its accuracy. While the latter approach provides coarse-grain localization accuracy. In this paper, we adopt the anchor-based method.
The quality of sensing coverage is directly related to the validity of sensing reports aggregated at the sink node. However, these reports are affected by multiple error components, such as measurement error and anchor misplacement. Error components impact the estimation of the sensors' location. Hence, sensor nodes stamp inaccurate locations to their aggregated reports, reducing the quality of sensing service.
F. The Impact of Anchor Misplacement
Anchor misplacement refers to the problem where the anchor node is in a specific position but thinks it is in a different position [
11]. For example, an anchor node B falsely perceives that it is in a particular position while it is in a different one. Many factors cause this problem, such as cyberattacks, soil erosion, a possible anchor displacement due to animal/human activities, or it could be mere human error. Localizing sensor nodes using misplaced/inaccurate anchor nodes leads to localization errors of sensor nodes [
11,
12]. Similarly, coverage quality would be affected as erroneously estimated sensor locations contribute to invalid sensing reports. Thus, the existence of anchor misplacement makes the sensing coverage worse. For example, anchor misplacement could cause a smart agriculture system to falsely irrigate the perceived dry regions or spray pesticides on healthy plants.
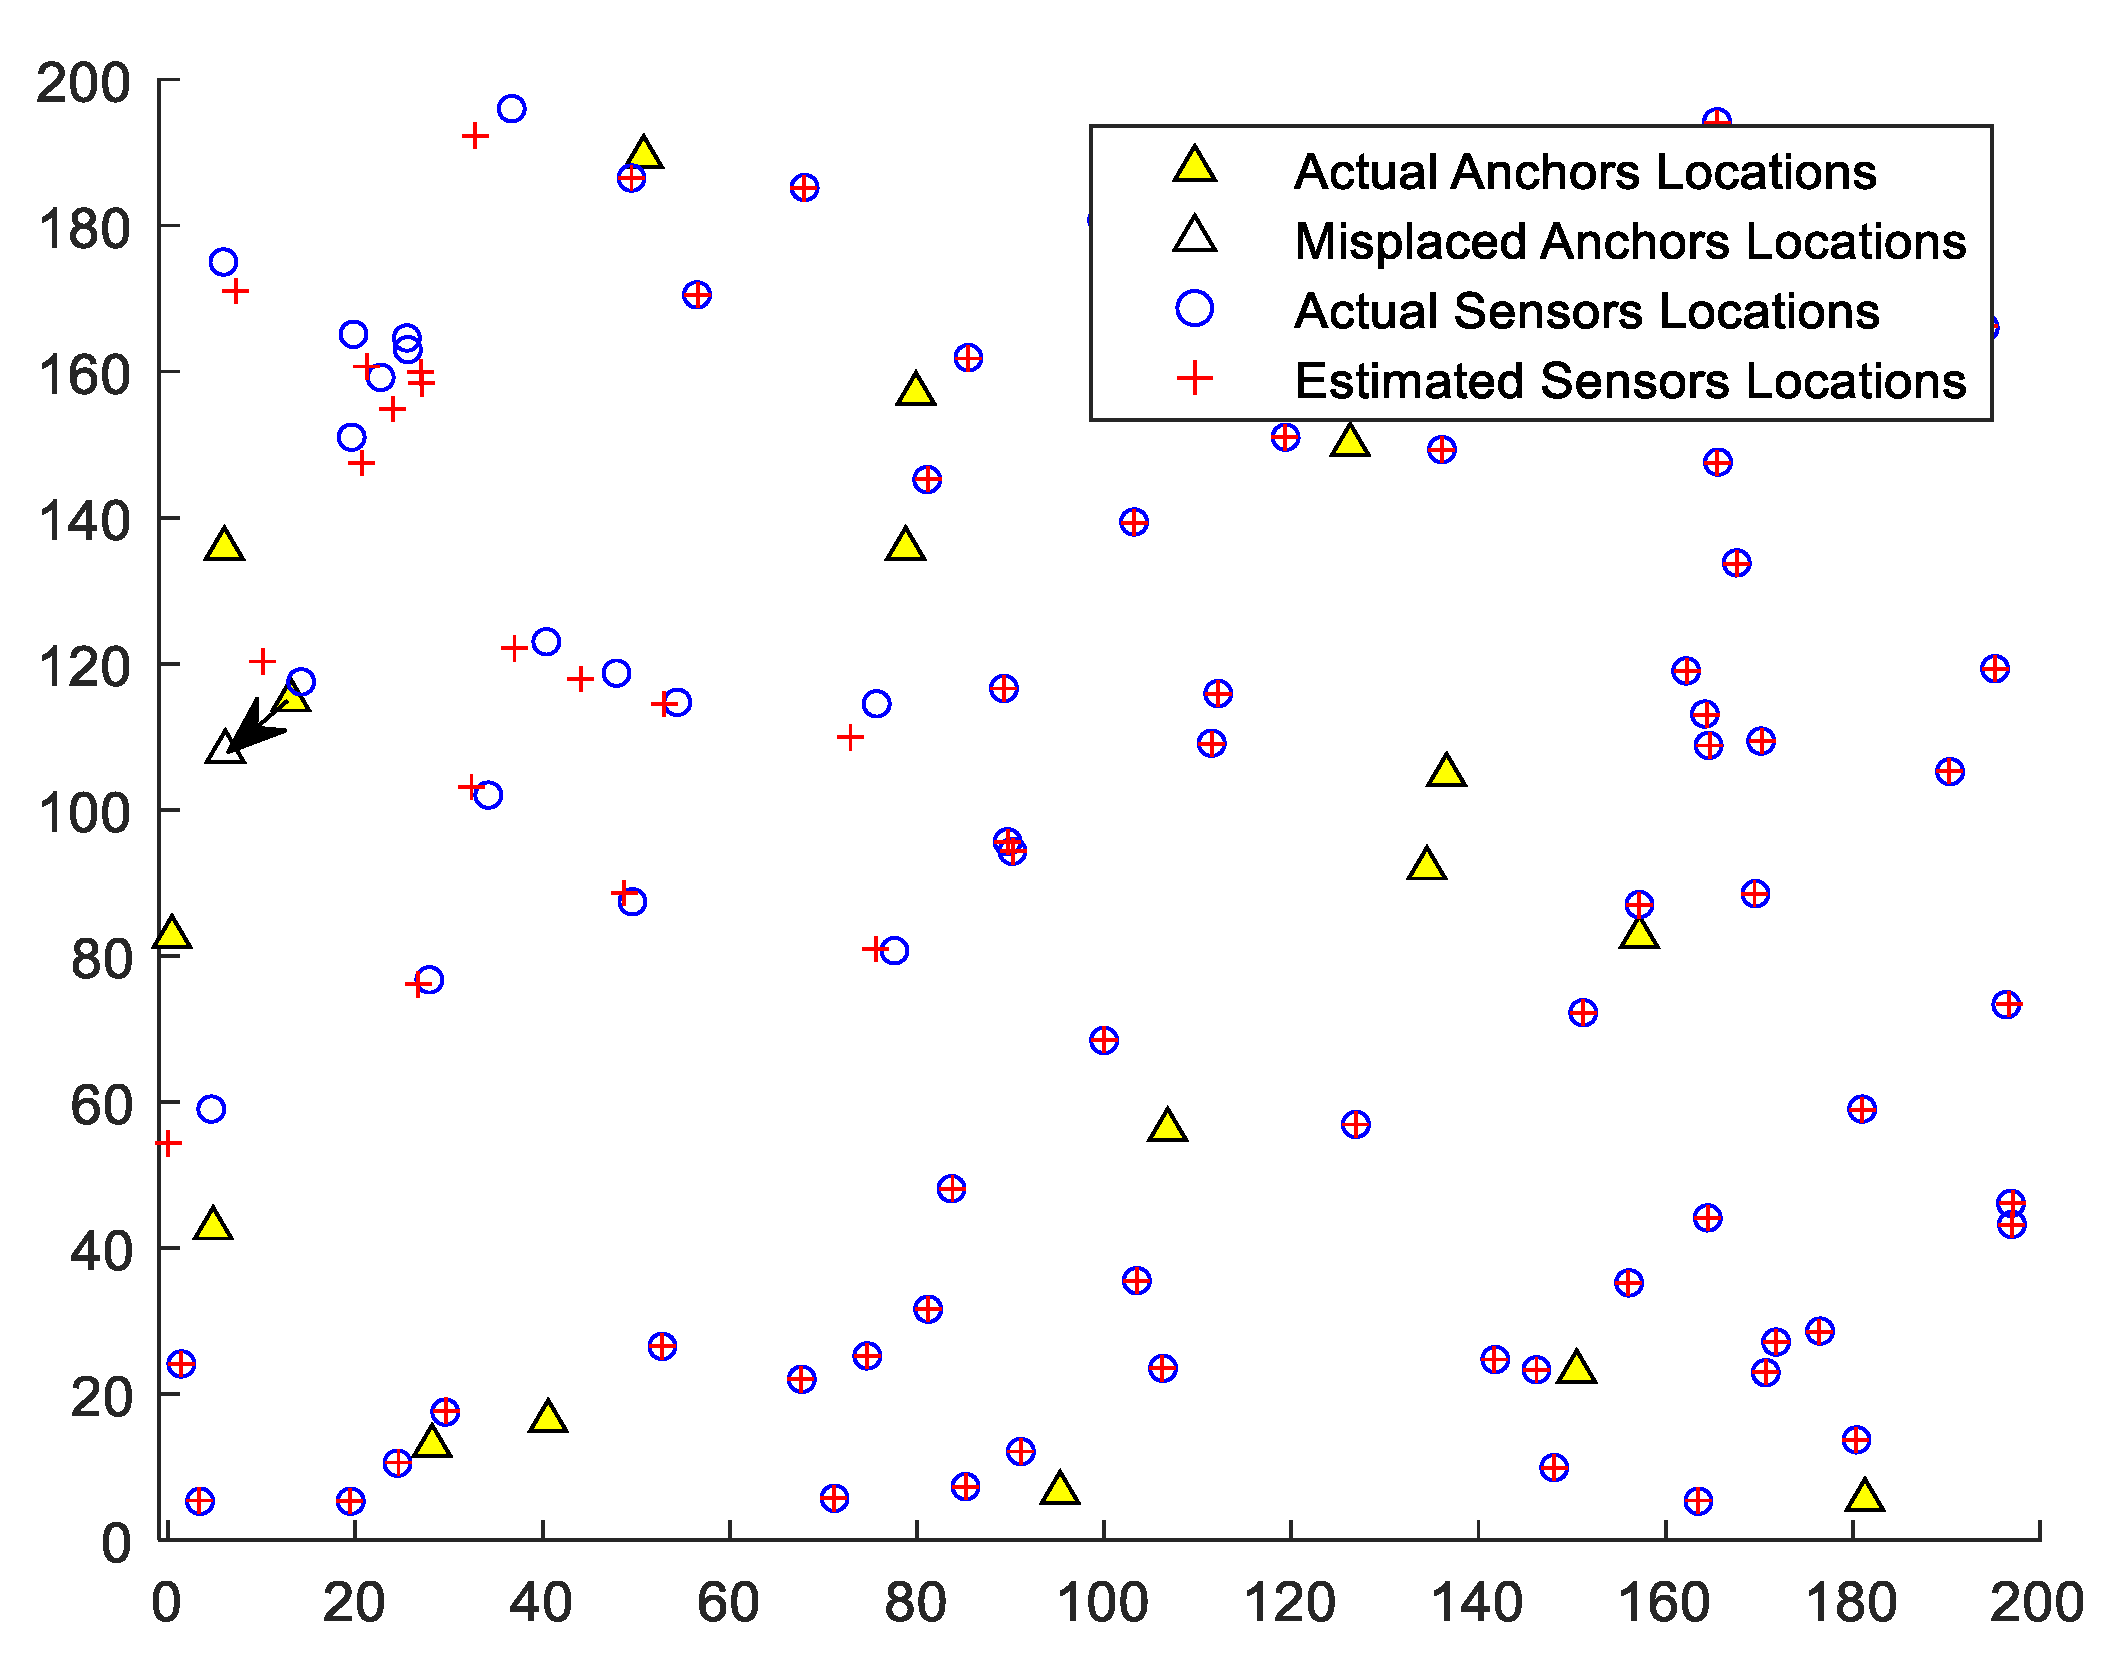
Figure 2 shows the impact of a misplaced anchor on localizing sensor nodes in a
target field that contains 80 sensor nodes and 20 anchor nodes. The actual location of this anchor is (13.1,115), and its perceived/declared location is (6.1,108). The figure shows the affected sensors and their inaccurate locations.
G. Motivation
Cooperative sensing provides advantages to WSNs such as increasing sensing reliability and improving sensing coverage [
12]. However, existing research on sensing coverage usually assumes a correct anchor node position. That is, literature research overlooked the anchor misplacement problem that impacts both localization and sensing coverage.
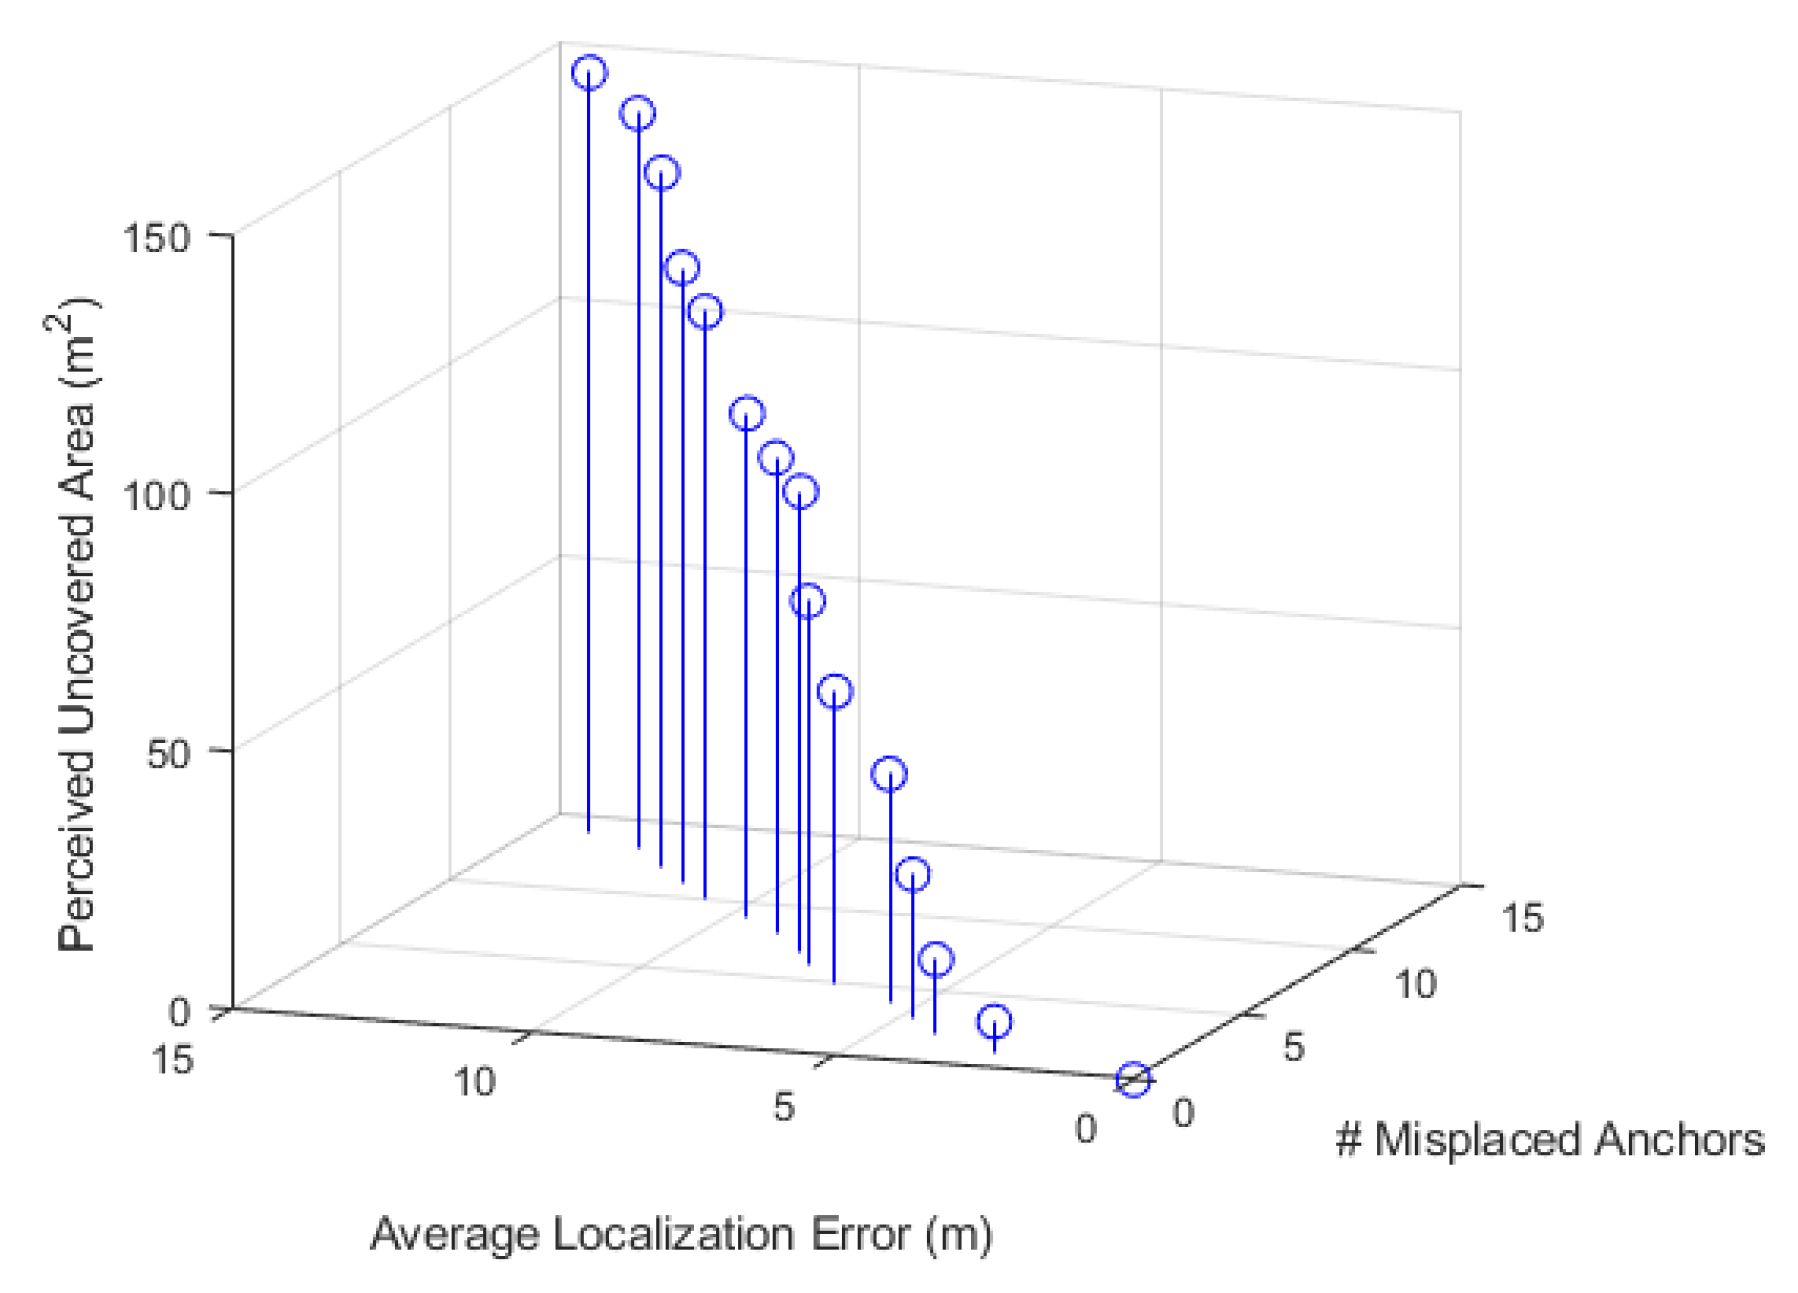
Figure 3 shows the importance of mitigating the impact of the anchor misplacement problem on localization accuracy and, consequently, on the sensing coverage: the more misplaced anchor nodes, the more degradation in the reliability of IoT system services.
Furthermore, related research assumes sensors are homogeneous and belong to only one sensing service provider. Relevant research addresses deterministic sensor placement and deployment planning to achieve higher coverage and extend the network lifetime [
13,
14]. Whereas in this work, sensors can be heterogeneous, randomly deployed, and belong to different sensing service providers.
In the IoT security domain, the problem of anchor misplacement is more hazardous. For instance, a hacker could target anchor nodes and manipulate their locations which generates inaccuracy in the collected data and deems it unreliable. This problem becomes life-threatening when a software/hardware error or a malicious attack targets autonomous vehicular sensor nodes such as LiDAR (Light Detection and Ranging). The LiDAR technology is supposed to provide accurate geospatial data promptly to support decision-making. Thus, malicious altering of LiDAR data, such as positioning coordinates or injecting errors into distances to the surrounding vehicles or objects leads to serious safety issues.
The above discussion raises the following primary research questions: Q1: How does anchor misplacement affect the tradeoff between detection latency and service reliability? For a fixed number of misplaced anchors carrying out sensor localization, detecting misplaced anchors becomes more effective when more non-misplaced anchor nodes participate in validating the localization results of the misplaced ones. However, too many validators increase communication overhead, consequently increasing the latency to complete the detection phase. Q2: How does anchor misplacement affect the coverage of sensory data aggregation? Q3: Can we identify new types of coverage holes and calculate their area?
In this study, we aim to answer the above research questions by designing a distributed, fast, and reliable scheme to detect misplaced anchors in WSNs. We aim to minimize anchor validators so that reliability is high with low latency. Furthermore, we analyze the impact of anchor misplacement on sensory coverage is instrumental in cooperative WSNs.
H. Contributions
The contributions of our work can be summarized as follows:
We propose an effective framework to detect anchor misplacement. This requires minimizing the participating anchor validators so that the reliability of the service provided is high and the latency to converge is minimal.
We demonstrate and analyze the existence of the anchor misplacement problem and its impact on IoT reliability. We show that localizing sensors using misplaced anchors results in inaccurate positioning, affecting the integrity of sensory data.
We provide an insightful and detailed analytical study of the impact of anchor misplacement on sensor localization and sensing coverage.
We propose schemes to identify coverage holes caused by anchor misplacement, calculate their area size, and find upper and lower bounds for these uncovered areas. We utilize Delaunay Triangulation (DT) to partition the target sensing region into equilateral triangles. Since intra-triangle coverage holes are not uniform, our goal is to locally detect each hole and specify its area's upper and lower bounds. Our procedure to assess Intra-triangle Coverage (ITC) is distributed and requires only each triangle's vertices to be involved in the calculation. Thus, the ITC procedure is scalable and efficient in terms of power consumption.
We demonstrate the validity and effectiveness of our proposed approach under various settings. In addition, we show that our approach offers higher localization accuracy and smaller perceived uncovered areas.
To the best of our knowledge, this is the only research investigating IoT sensing coverage under anchor misplacement by locally identifying new coverage holes and quantifying their area.
The organization of the rest of this paper is as follows. Section II overviews preliminary definitions and models of sensing coverage using WSNs and different types of sensor deployment in WSNs. Section III presents the problem formulation and assumptions of our research. Preliminarily results using Voronoi Diagram (VD) and DT toward efficient coverage will be addressed in Section IV. Section V is devoted to studying ITC in detail. Section VI presents the dynamics of anchor misplacement on sensing coverage and provides an algorithm to calculate the lower and upper bounds of sensing coverage holes. A resiliency framework to detect and mitigate the impact of misplaced anchors will be provided in Section VII. Section VIII presents experimental results to validate our proposed framework and show its effectiveness. Section IX concludes the paper and discusses future research directions.
2. Preliminaries and System Model
Sensing coverage measures to what extent the sensing reports reflect the actual physical surroundings in the target sensing field. Thus, without proper coverage, sensing services may be deemed unreliable or even obsolete.
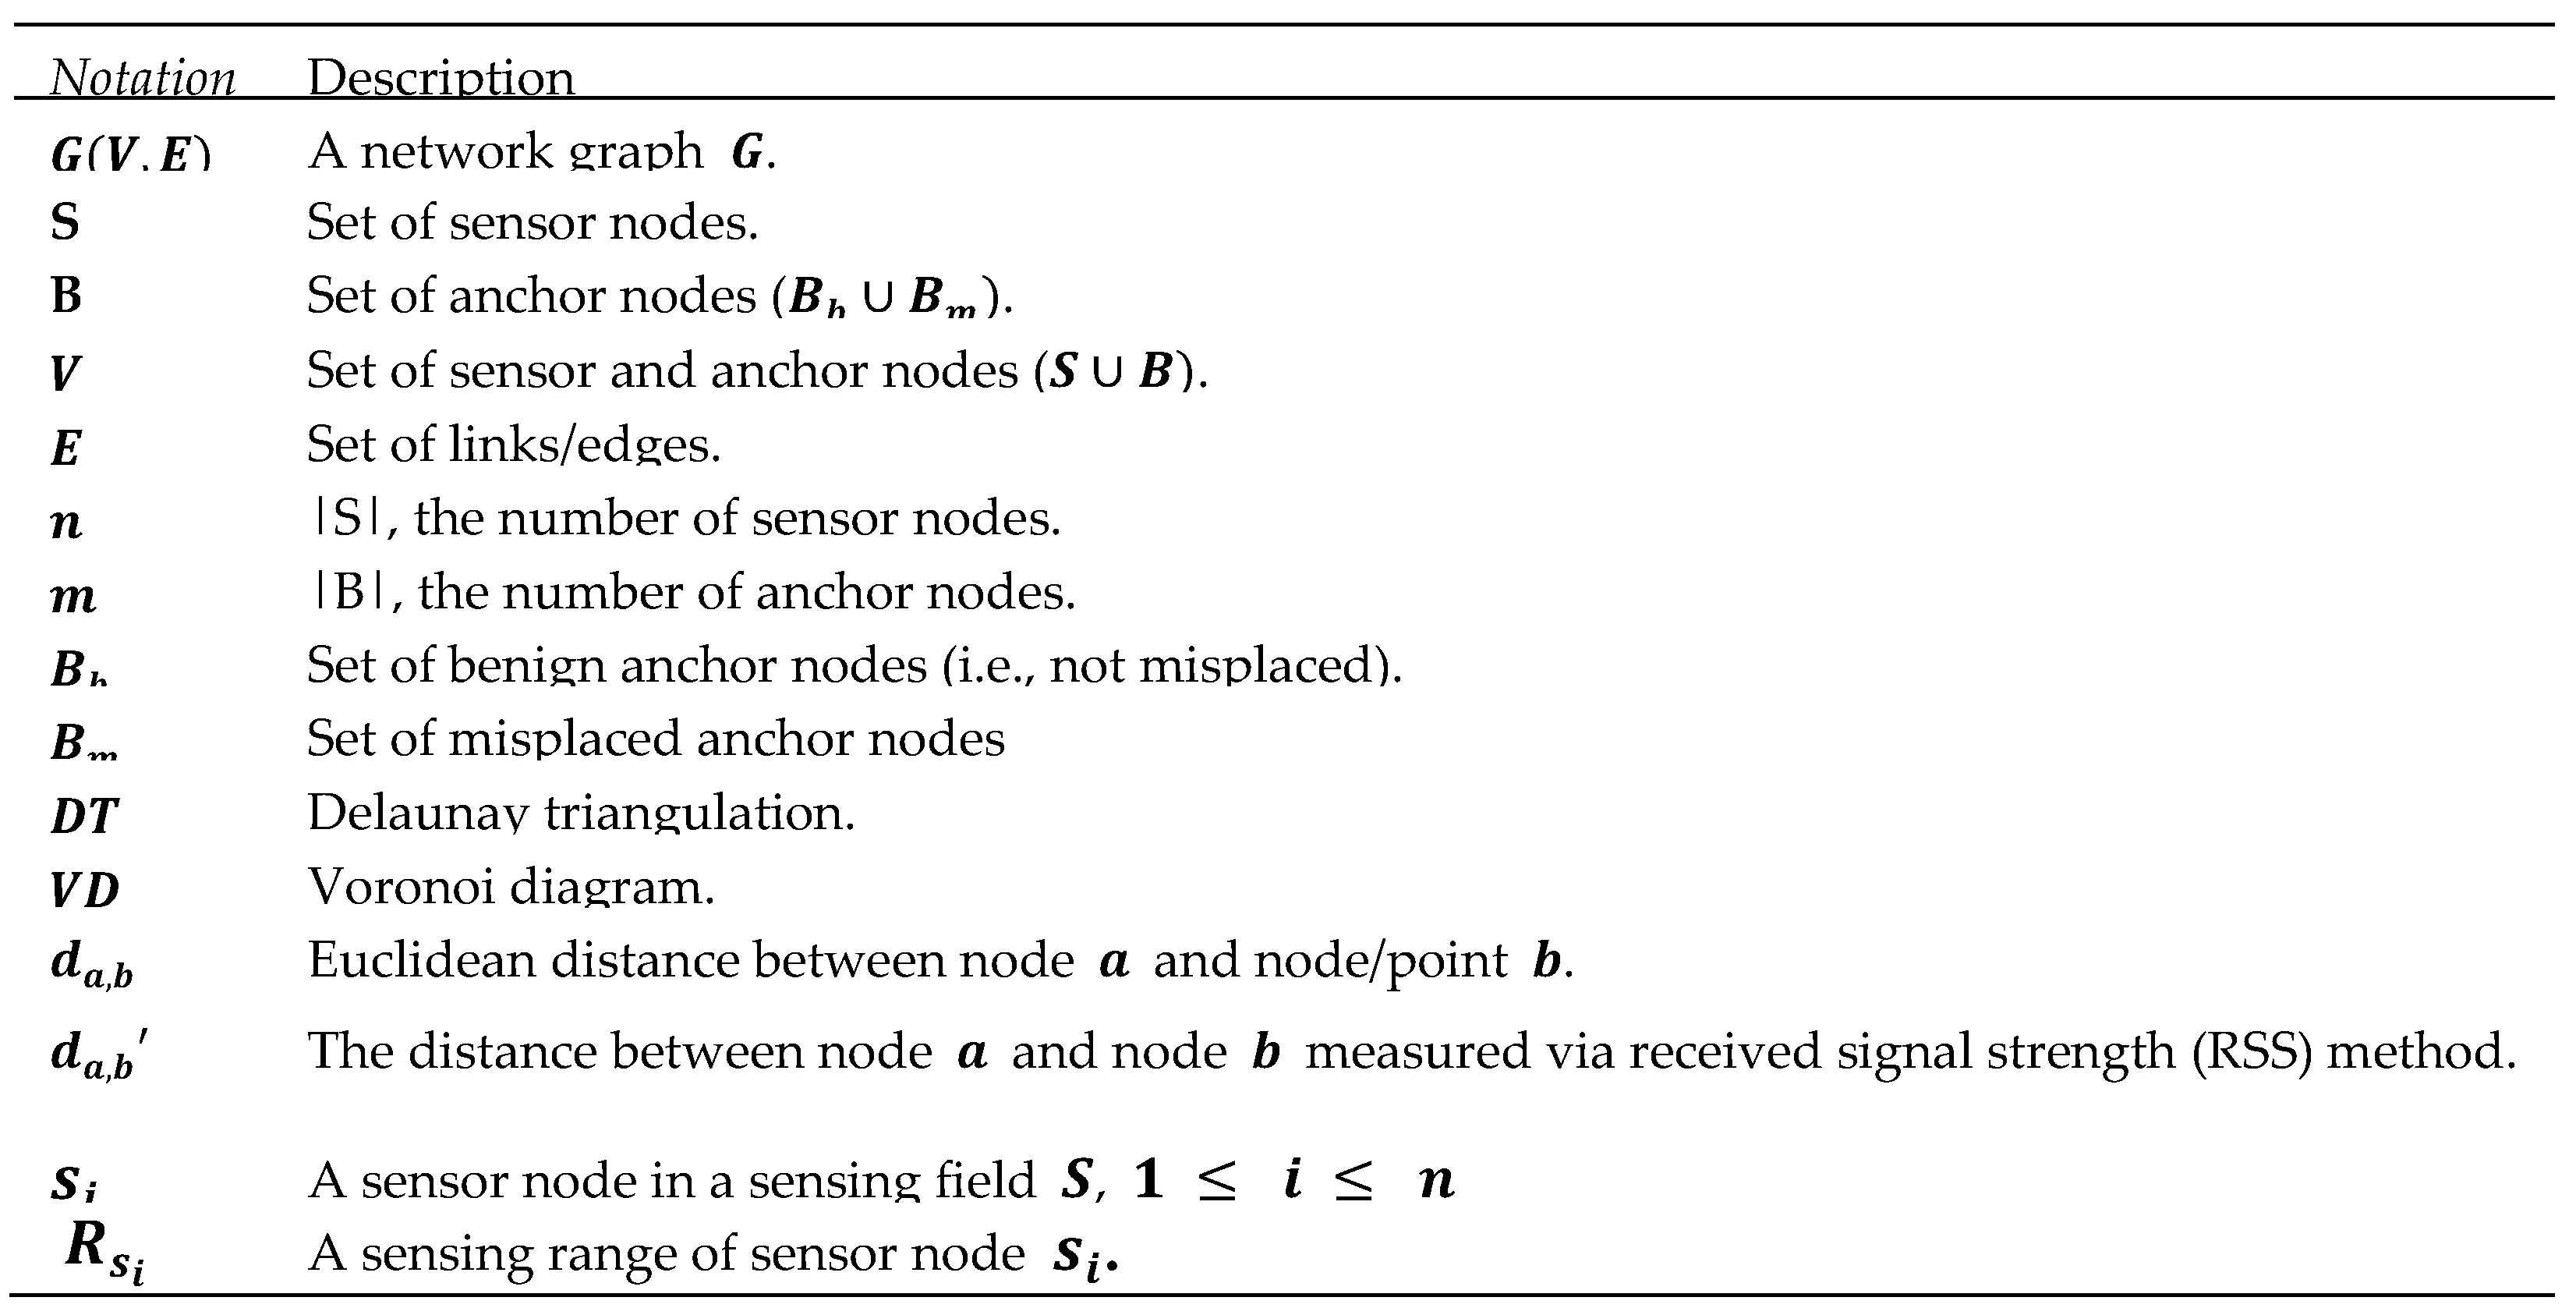
Table I.
Notations and Acronyms.
Table I.
Notations and Acronyms.
B. Types of Sensing Coverage Holes Under Anchor Misplacement
Figure 4 shows the full and partial coverage.
Anchor misplacement poses new types of coverage holes as follows.
- 1)
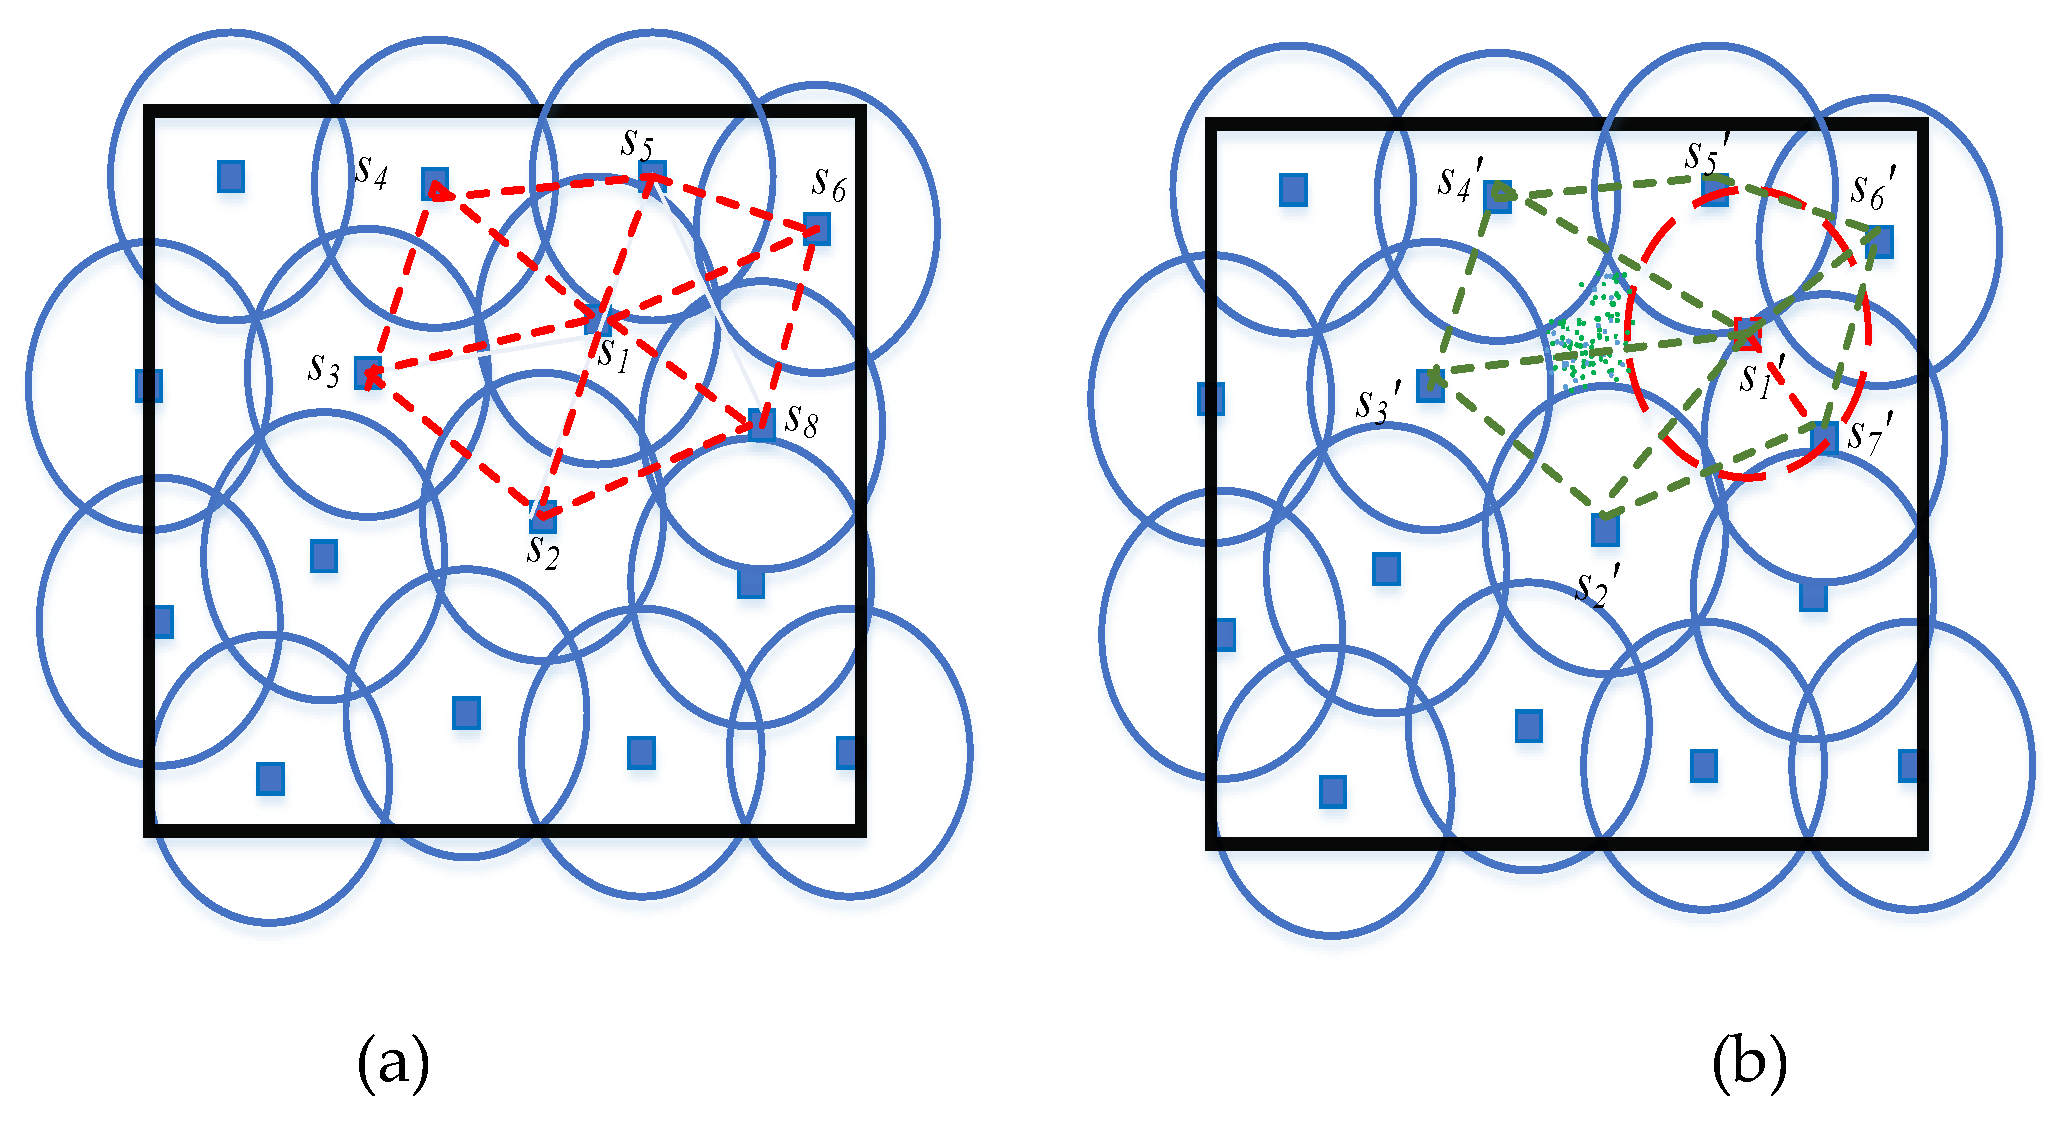
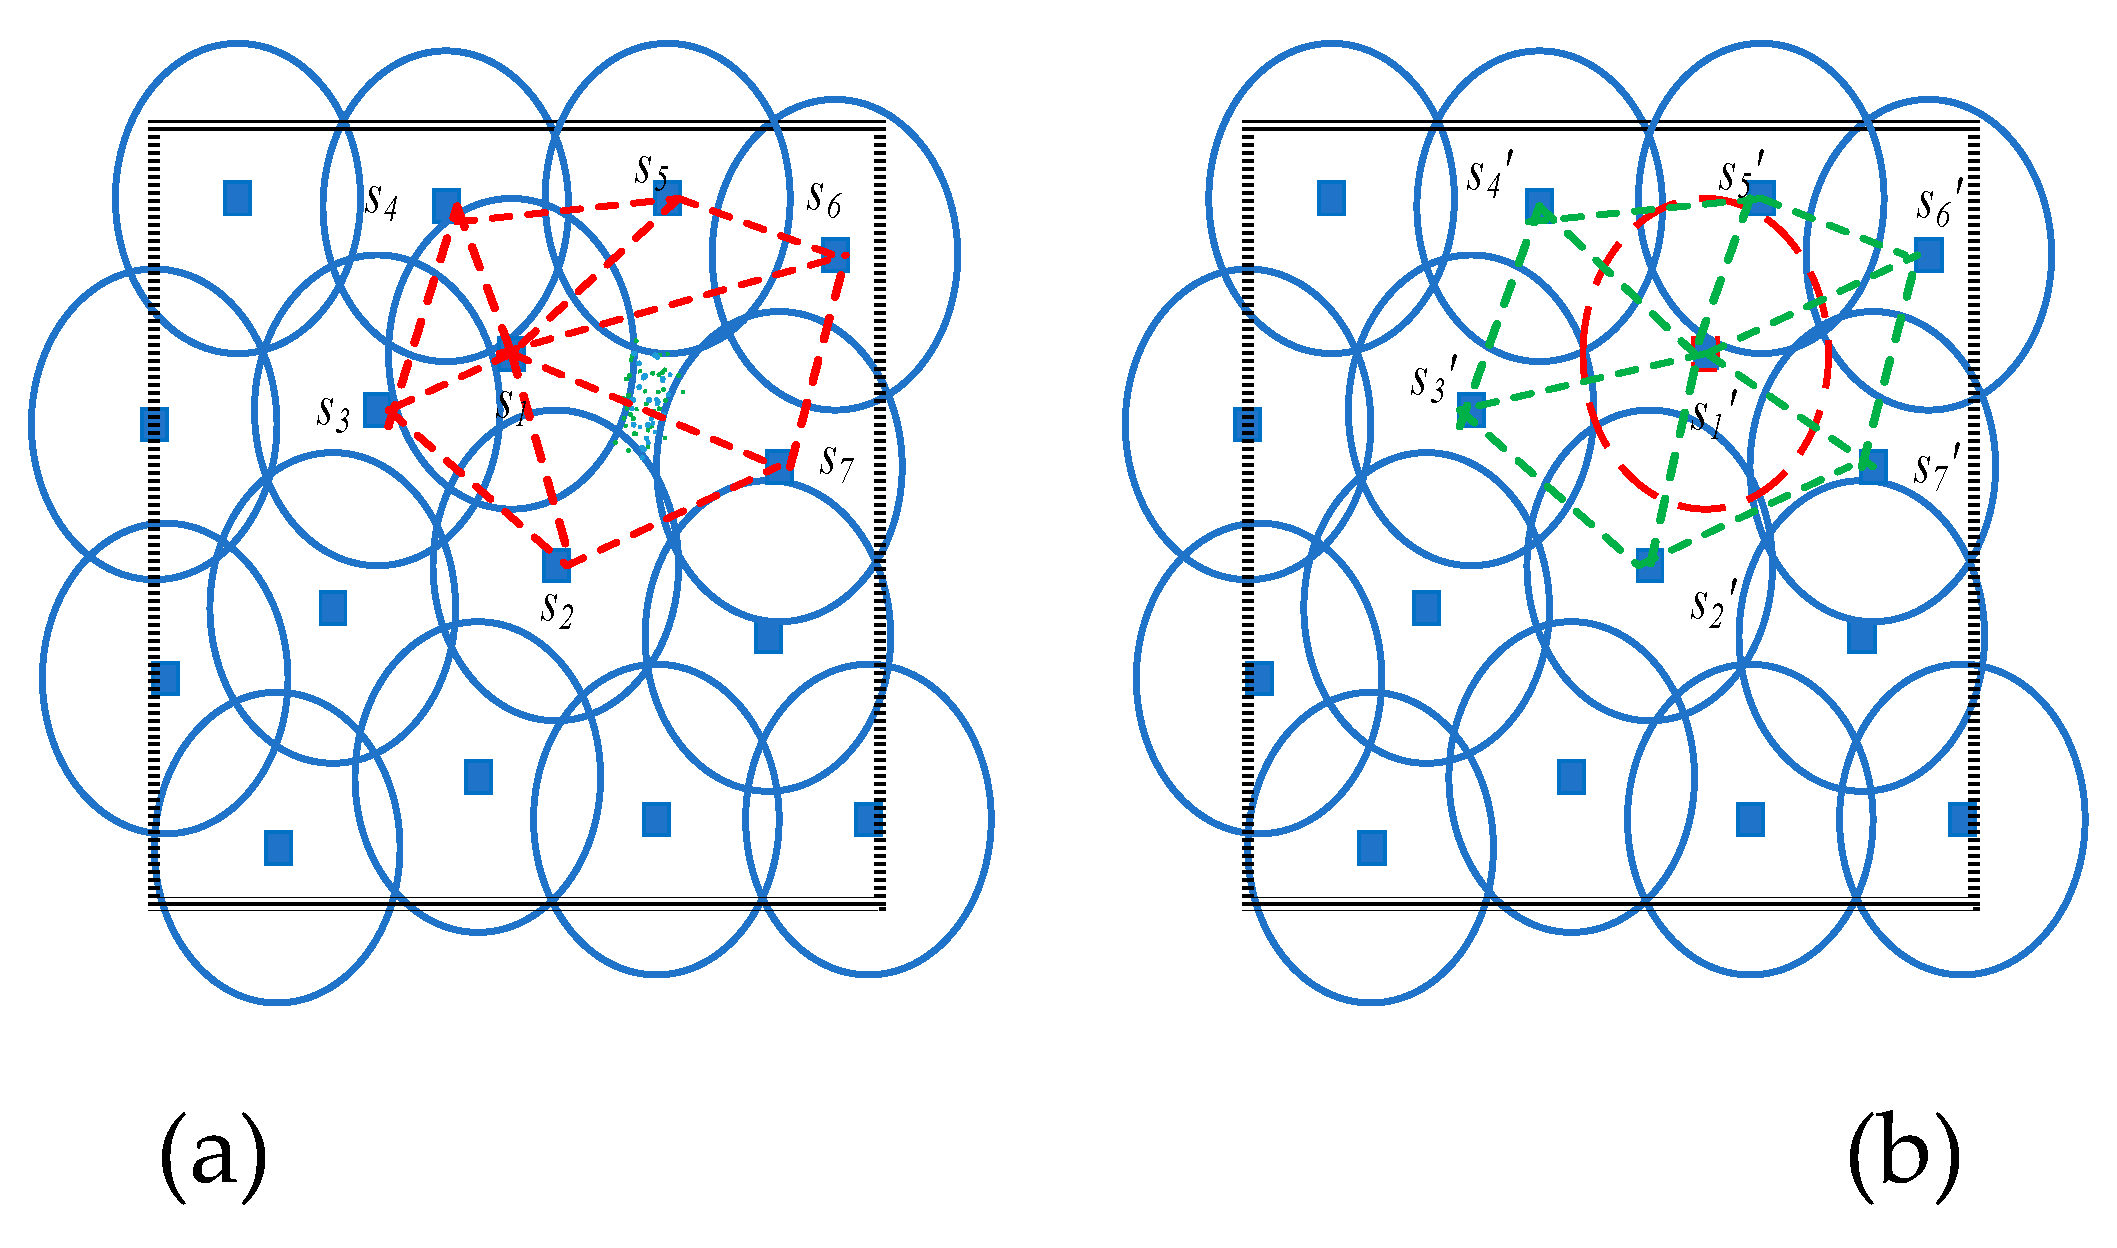
The perceived coverage hole. Fig. 5 (a) shows an ideal case of a sensor
that has been accurately localized with no impact of anchor misplacement. On the other hand,
Figure 5 (b) shows the case where
localized using a misplaced anchor. This creates a false perceived coverage hole that exists in two triangles
and
.
- 2)
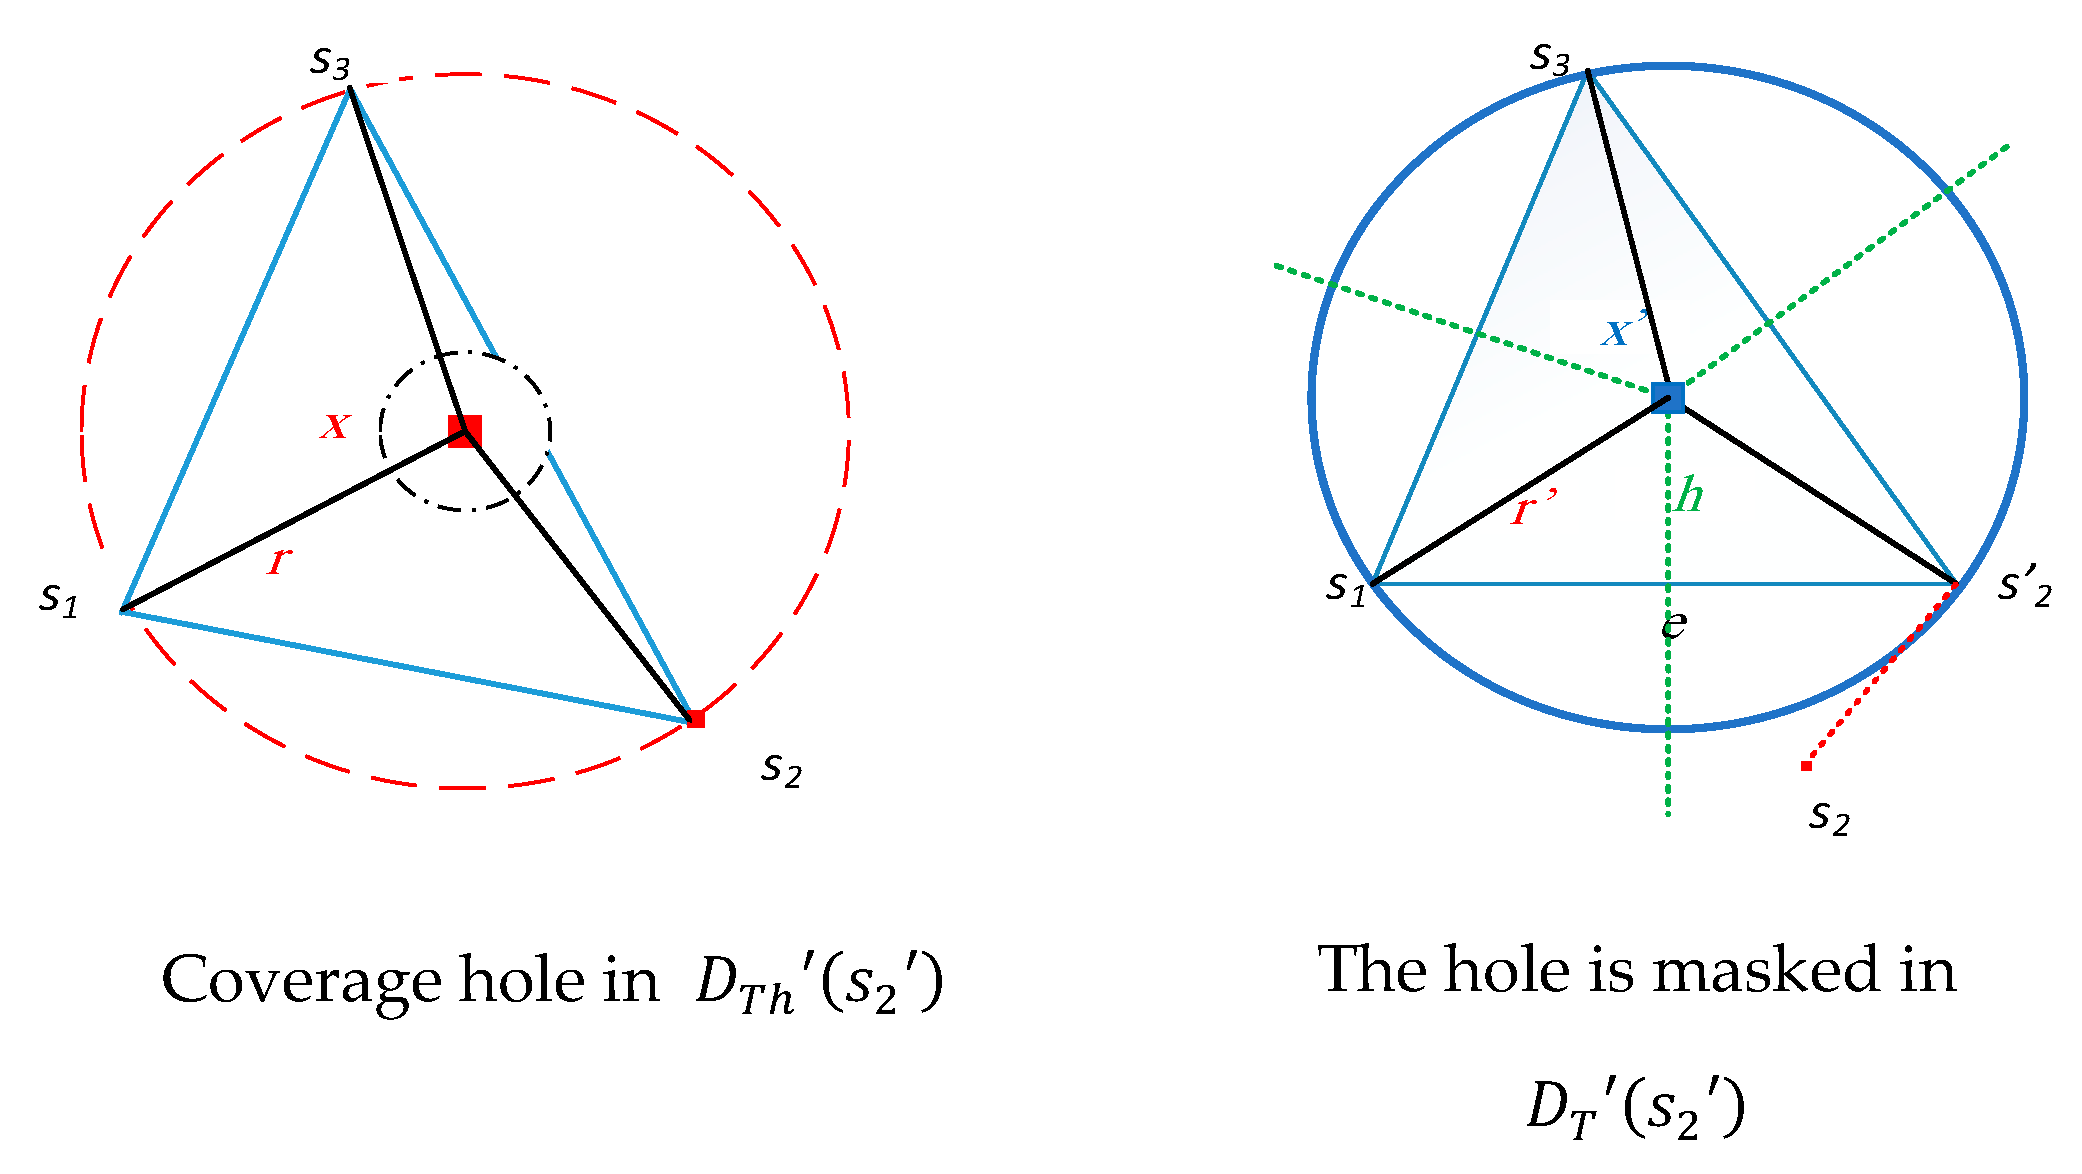
The hidden unreported actual coverage hole.
Figure 6 (a) shows the existence of actual coverage holes in triangles
and
. On the other hand,
Figure 6 (b) shows that anchor misplacement hides these holes by inaccurate localization of sensor
.
C. Network and Sensing Models
We adopt cooperative sensing where sensor nodes belong to different providers. A set N of nodes includes sensor nodes, while a set M includes anchor nodes. Anchor nodes are placed in places of interest (i.e., known positions) so that they can be used to localize sensors' positions. WSN usually follows a multi-hop communication to route sensed data from source sensors to a sink node. In cooperative sensing, a source node could route its collected data to one or more sinks (i.e., data processing centers).
The rate at which the sensor generates sensed data packets will highly depend on the capability of . However, in WSNs this rate is set low to save the sensors' battery power and avoid congestion in the network.
Many sensing models can be constructed according to the application requirements and the surrounding environment. However, most of these models agree that sensing fades as distance increases. The following formula reflects this observation [
15].
where
SN denotes the sensibility between the sensor node
and point
p, and both
and
K are positive constants related to the sensor's technology.
There are two types of sensing models: binary disc and probabilistic.
1). Binary Disc Model
A sensor node is assumed to do 360° monitoring in the binary disc model. Therefore, a point in the sensing field is covered if it is within the circular sensing range of at least one sensing node. Otherwise, it is not covered, as given in the following equation.
Thus, the binary disc model abstracts the sensing coverage of
by a disc of radius
as shown in
Figure 7.
2). Probabilistic Sensing Model
This model depends on the uncertainty of sensor detection. It utilizes the detection probability when a point
is at a distance larger than the value of uncertainty, but within the range [
16].
where
is the uncertainty value in the sensor's detection,
, and both
and
are parameters that measure the probability of detection when
p is at a distance greater than
but still within a range of
. Different values of these parameters reflect the characteristics of different types of sensors and, consequently, different detection probability scales.
In this research, we adopt the binary disk sensing model for the sake of simplicity.
Figure 7 shows the disk model representation of the overlapped region in
Figure 1.
D. Channel Model
Both anchor and sensor nodes are equipped with wireless transceivers. The transmission power of a node
is denoted by
, and communicates with other nodes over wireless channels, following the standard path-loss model. The path loss between nodes
and
of Euclidean distance
is given in the db scale by the following formula.
where
is the path loss at the reference distance
, and
is the path loss exponent.
To better estimate the distance between the IoT nodes
, we follow the formulation adopted in [
17] for the variance:
where SNR is the signal-to-noise ratio.
E. Communication Model
Two sensor nodes are adjacent/neighbors if they can communicate directly (i.e., have 1-hop wireless-link communication). We define to denote the set of sensor nodes in the neighborhood of , that is, . Each sensor node that receives this information is able to estimate its distance from the emitting sensor using a signal strength indicator (SSI). The graph induced by all sensor nodes and wireless links is called a routing graph. Multiple routing paths could connect the source sensor node to a sink in a routing graph. A routing path is a sequence of wireless links that starts with a source sensor towards the sink with no node repetition.
During the validation of anchor misplacement, a node can be either a sender or a receiver of a message. The message is disseminated either in 1-hop or multi-hop manners. As discussed in subsection I.D, a node needs more power to communicate with other nodes in a single-hop way. Let be the transmission power required by the node to communicate with any node in the target field using a single-hop protocol. Similarly, let be the transmission power required by the node to multi-hop to the base station through its neighboring nodes. Clearly, . A node usually uses a single-hop communication to broadcast messages to all other nodes.
3. Problem description
Anchor misplacement degrades IoT-based system reliability and leads to special types of coverage holes due to inaccurate localization of the affected sensor nodes. Let be a misplaced anchor node and let be the set of misplaced anchor nodes. Similar to the neighborhood of sensor nodes presented in Section II.C, the neighborhood, , of the anchor node, is the set of all anchor nodes that are connected with via 1-hop connection.
This paper addresses the impact of anchor misplacement on sensing coverage. Given a random deployment of sensor nodes and a localization error posed by some misplaced anchors on some sensor nodes, we investigate the new types of coverage holes, detect them, and find the size ratio of each type of coverage hole to the total area. Furthermore, we are interested in providing upper and lower bounds on coverage holes in a distributed manner.
Our analysis will utilize powerful structures in computational geometry, such as Voronoi Diagram (VD) and Delaunay Triangulation (DT). Our approach to detecting and bound coverage holes depends on the locality of each convex polygon of the computational structure that represents the sensing field.
A. Assumptions
For this research, we make the following assumptions:
First, IoT sensors can send/receive packets to/from their neighbors. This assumption is important to exchange the sensors' information locally to build our computational structure in a distributed way.
The locations of sensors are calculated priory. This assumption helps to construct the VD and DT.
No three neighboring sensors are collinear. This will enable the construction of the Delaunay Triangulation.
The sensing target field is bounded, which is the case for most IoT applications.
4. Computational geometry tools for analyzing Sensing Coverage: auxiliary results
This section provides auxiliary lemmas and corollaries to use later to detect coverage holes and their ratios. These auxiliary results rely on well-known computational geometry structures: Voronoi diagram (VD) and Delaunay Triangulation (DT). Next, we investigate the existence of full sensing coverage of a target field S.
Let p be a point in S. We call a dominant sensor of point p if has the shortest distance to p among all other sensors in S. That is
. Let
. Assume
has the maximum distance to a point
among all other sensor nodes; if
then
S is fully covered. However, calculating
over an infinite number of points
in
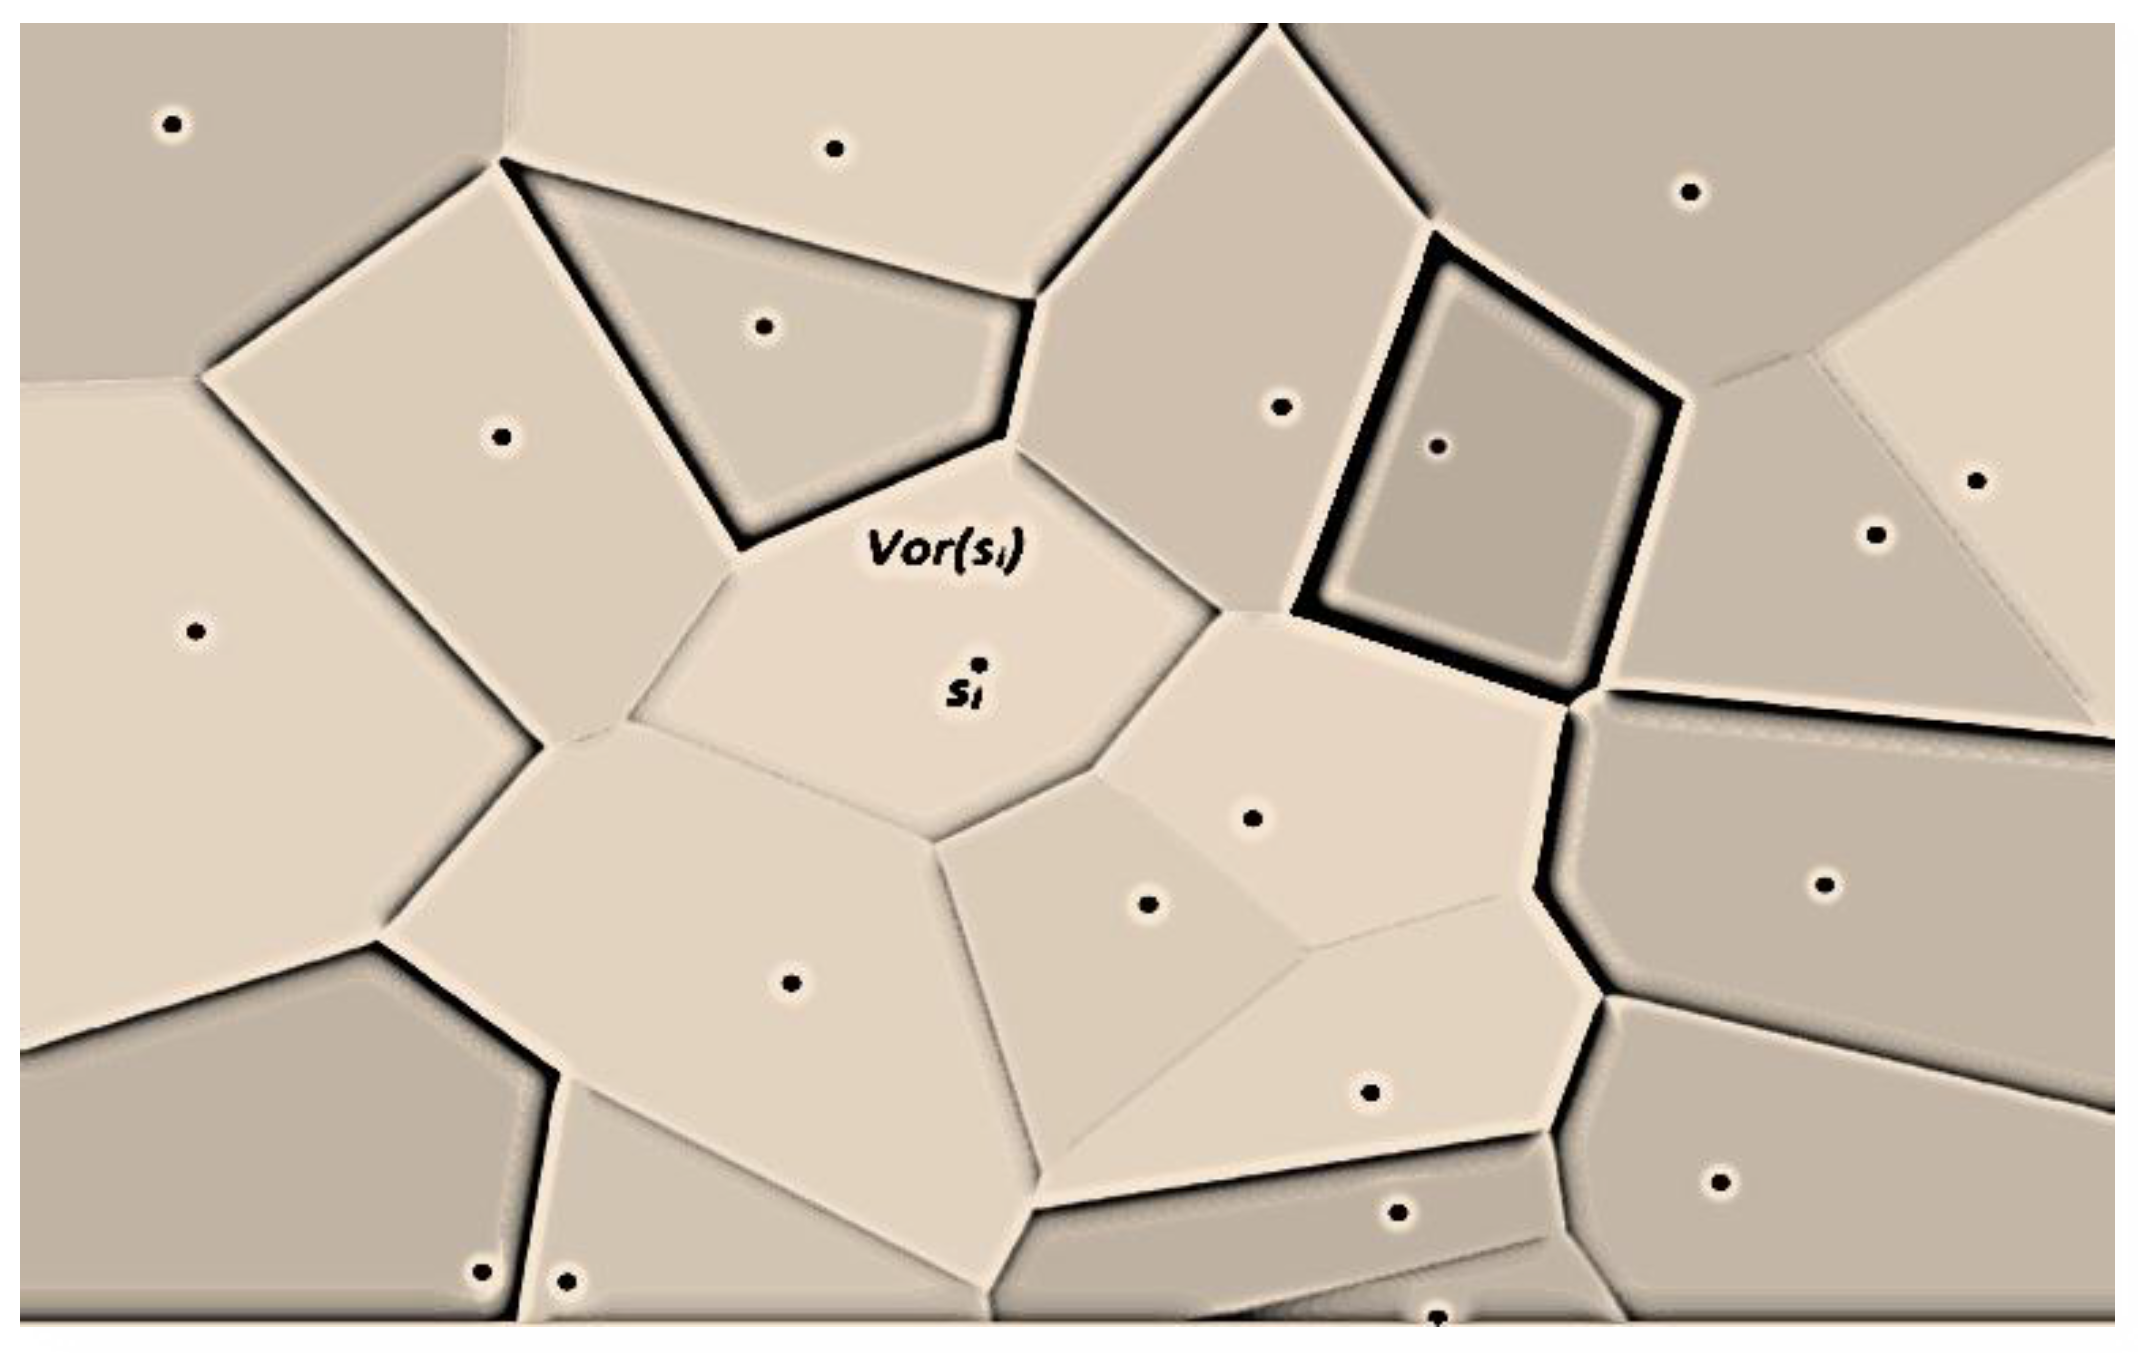
S is not feasible. To overcome this problem, we utilize VD to cluster the sensing field
S into adjacent convex polygons, called cells and denoted by Vor(
s1), Vor(
s2), ….., Vor(
sn). Each cell Vor(
si) is associated with only one sensor
,
as shown in
Figure 8.
The perpendicular bisector of the line segment connecting sensors
and
splits the plane into two half-planes. Let
denote the half-plane that contains
, while
denote the half-plane that contains
. Note that a point
if and only if
. Thus Vor(
) is the intersection of all half-planes generated by the perpendicular bisectors of the line segments of
and each sensor in its neiborhood, i.e.,
. Each bisector line segment is called an edge, and the endpoints of this edge are called vertices. For any point
in
,
the closest sensor to
p. Note that if
p is on a common edge of two neighboring polygons, then it is equidistant from the two sensors associated with these polygons [
1].
The following lemma provides the necessary and sufficient conditions to have full coverage in VD.
Lemma 1 [
1]
: Sensing field
S is fully covered if and only if all vertices in its corresponding Voronoi diagram have a distance less or equal to
to at least one of their associated sensors,
.
The coverage problem of sensing field
S is now converted, by Lemma 1, from checking a non-finite set of points in
S into testing a finite set
1 of points representing the cell's VD vertices. This lowers the computational cost, adding to the feasibility of the solution. If
is maintained, the full coverage of
S is guaranteed. Thus, VD is a powerful tool to show the existence of coverage holes in WSNs. However, VD is unable to quantify the area size of coverage holes. This is due to the fact that Voronoi polygons have different convex shapes with various numbers of edges and have a non-unit-circular model. Therefore, VD does not provide much information about the location and the size of each coverage hole in the field.
Consequently, there is a need for a more efficient structure to control and track the boundary of each coverage hole. To achieve this, we need to transform each VD cell into basic shapes that allow us to track closely and locally coverage holes. That is why we triangulate each Voronoi cell, where the vertices of the generated triangles are the sensors. Two sensors
and
form a triangle edge if Vor(
) and Vor(
) have a Voronoi edge
e in common. This implies that a triangle edge,
, that connects
and
is perpendicular to
e and is bisected by
e. This triangulation is called Delaunay Triangulation (DT) which provides angle-optimal planar triangles such that the circle that circumscribes any triangle, with non-collinear sensors, is devoid of any other sensors. Note that the strong property of convexity in VD is still held in DT as any triangle is a basic convex polygon.
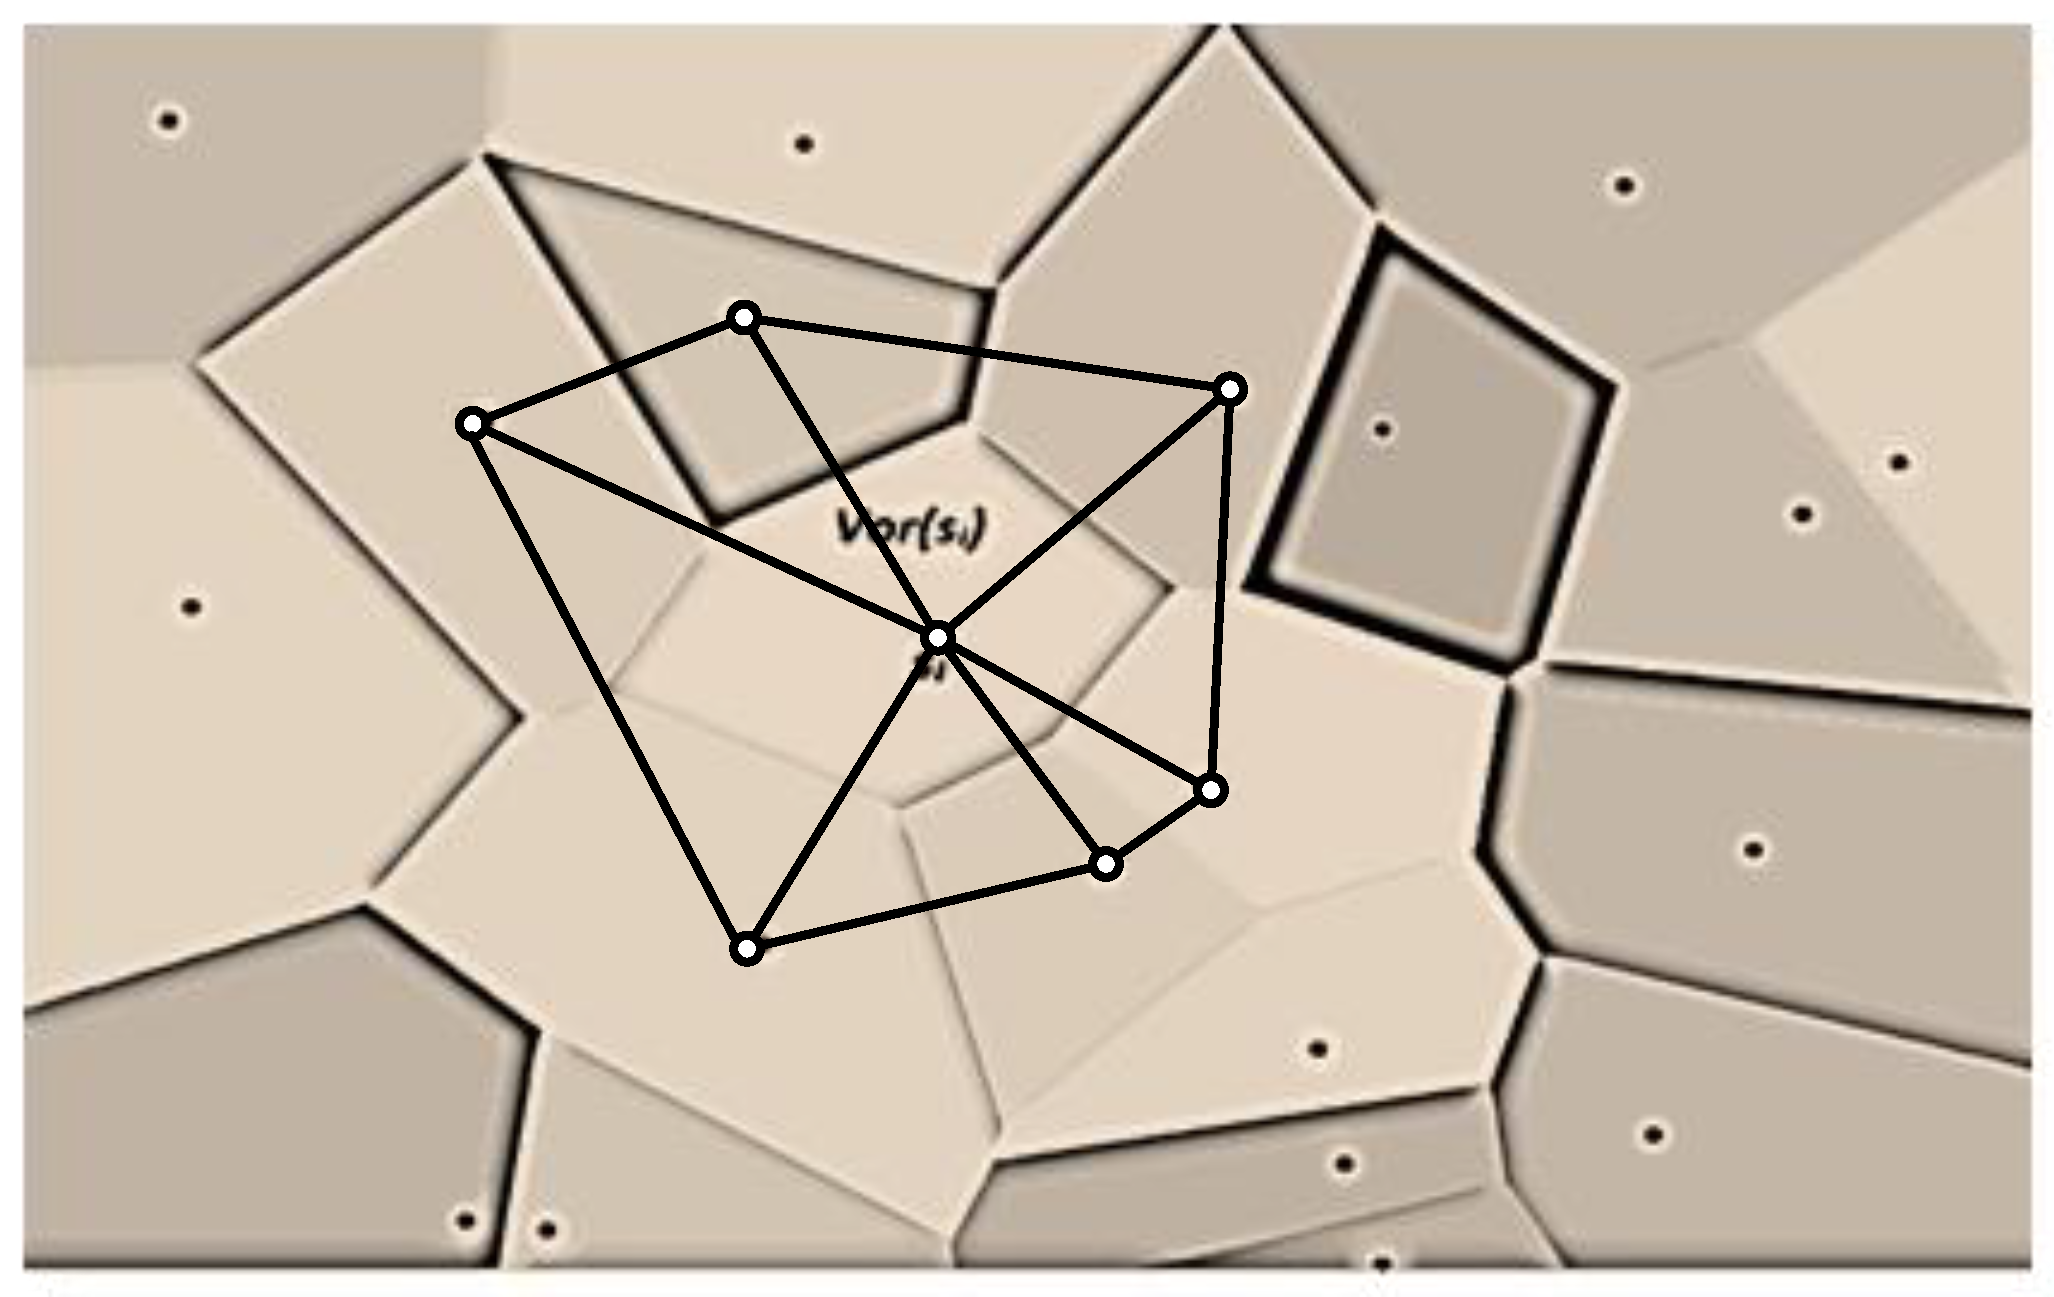
Figure 9 illustrates some triangulations of Voronoi cells. Next, we provide a corollary that links the coverage problem to the edges of DT.
Corollary 1 [
1]
: If a sensing field is fully covered, then the length of every edge,
, of triangles is at most
.
In Delaunay triangulation of sensing field , let and be two triangle vertices that have sensing ranges and , respectively, then the following lemma holds.
Lemma 2: Let ∆ be a Delaunay (acute) triangle with vertices
,
, and
, and let
be a radius of the circle that circumscribes ∆. ∆ is fully covered if and only if the following formula holds.
Proof. Assume ∆ is fully covered. Let
c be the center of the circle of radius
that circumscribes ∆.
c is the furthest point in ∆ to the vertices
,
, and
. The distance from any of the three vertices to
c is equal to
, the circumscribed circle. Each of the sensor vertices will contribute to covering the intra-triangle of ∆. This contribution depends on the sensing range of each sensor vertex.
Figure 10 illustrates the concept of sensing and intra-triangle coverage. Since ∆ is covered, then every point within ∆ including
c is covered as well. Since ∆ is fully covered, the sum of contributions of the three sensors must cover the entire intra-triangle of ∆. This is formulated as follows:
Where
denotes the contribution of sensor
in covering the area of triangle
. This contribution represents a sector area with a radius
.
For acute triangulation,
.
, where
is
side length. Consequently (7) can be written as follows:
This completes the proof of the “if” part.
To prove the (only if) part, assume the formula (6) is held. Let us prove the full coverage of ∆ by contradiction. Assume that ∆ is not fully covered. Consequently, there exists a point
in ∆ that is not covered by any sensor, i.e.,
,
, where
. This means
∎
In the case of homogeneous sensors, we derive the following corollary about a lower bound for sensing coverage.
Corollary 2: A field of cooperative sensing that uses homogeneous sensors with a sensing range
is fully covered if the following formula holds.
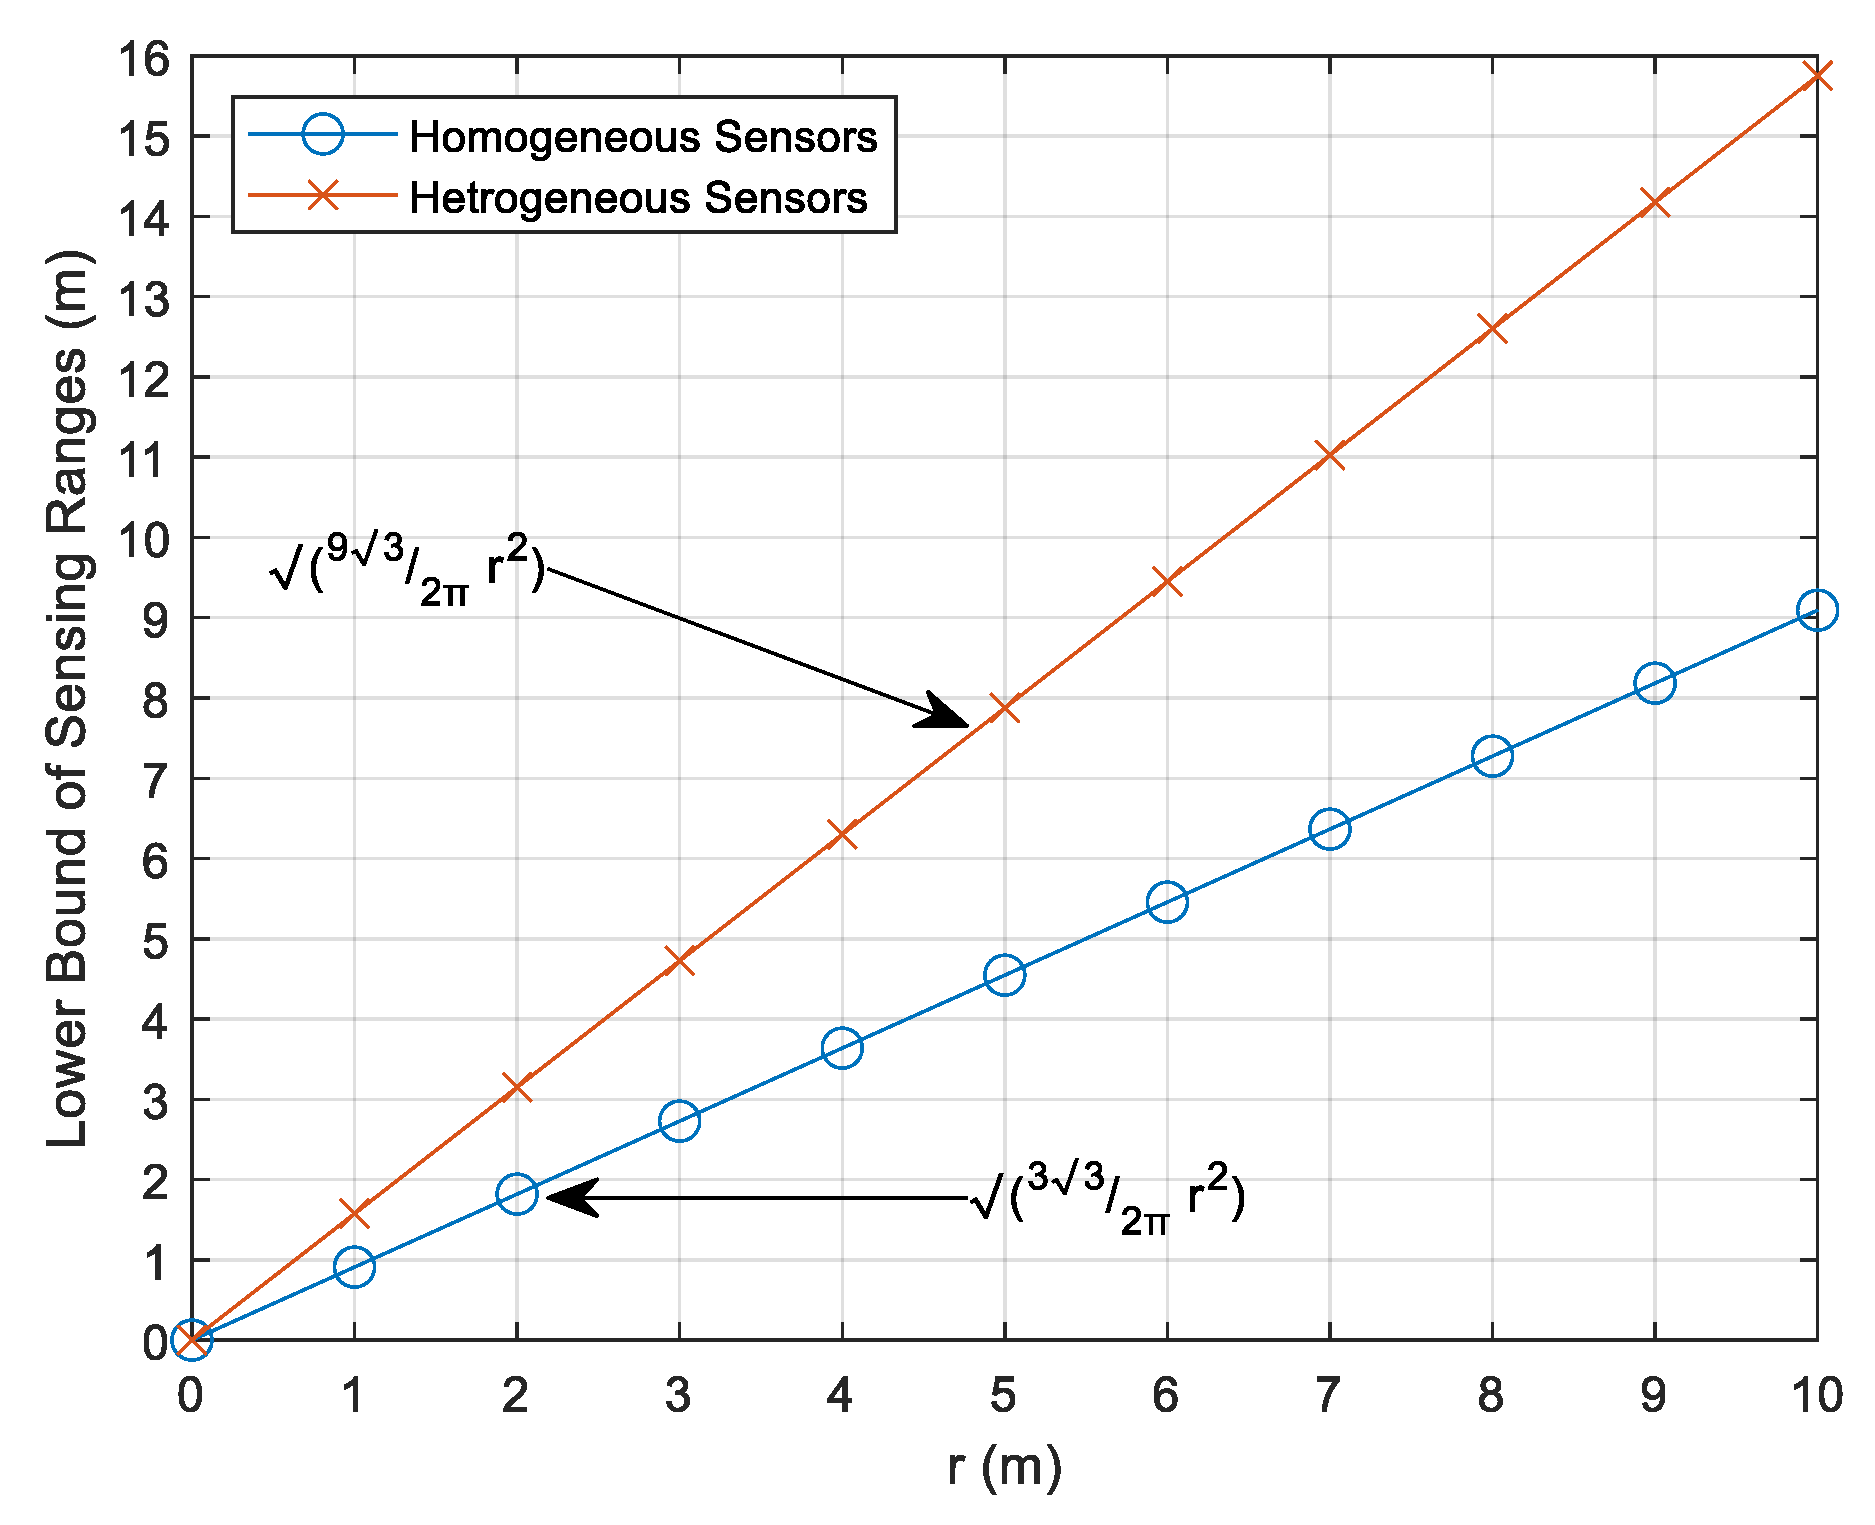
Figure 11 shows homogeneous and heterogeneous sensors' lower bound sensing ranges to achieve full sensing coverage in a triangle ∆. For example, it is enough for homogeneous sensors to have a sensing range of at least
to guarantee a full sensing coverage, as shown in the circle-marked blue curve. On the other hand, the square root of the left-hand side of the formula (10) should be lower bound by the red curve in order to achieve full sensing coverage.
In the next section, we investigate how to detect and define the bounds of each uncovered area in DT.
5. Intra-triangle coverage: beyond ideality
The coverage problem is reduced by DT to studying the coverage of each individual triangle in the whole triangulation. According to Lemma 2, if the condition of Lemma 2 is not fulfilled, then there is an uncovered area in the circumcircle of ∆. According to the largest angle in ∆, we differentiate three scenarios of the circumcenter: the circumcenter is inside ∆ if , outside ∆ if , or on the longest side opposite to . Although DT provides the best possible optimal-angle planar triangles (angles around ), in random deployment, it is possible to find the largest angles greater than . The following question then arises: What is the minimum density of sensors such that DT is well-behaved?
Let
be the minimum sensing range among all IoT sensors in the target field
. In optimal cases, all angles of ∆ are equal to
(i.e., equilateral triangle) and the length of the triangle's side is
[
18]. Thus the area of the triangle in this case is
Furthermore, the number of triangles in any triangulation is
2N-2-, where
N is the number of sensors and
is the number of which are on the convex hull boundary of field
S [
19]. Assume the sensing field
S has a size
L x L; the area size that should be covered by each triangle is
. Therefore,
We assume that the minimum density is achieved. As illustrated in the proof of lemma 2, the coverage contribution of a sensor
is the size of the angular sector centered at
with radius
. Calculating the contribution of
in ∆ requires the angle at
as shown in (8). Since the lengths of all edges of ∆ are known, we use the cosine formula to extract the angle at each sensor. That is
where
a, b and
c are the lengths of ∆'s sides, and
is the angle opposite to the side of length
c. Therefore,
is plugged into (8) to get
, where
is the angle at
in a triangle ∆. The following formula gives the intra-triangle coverage of ∆, denoted by
. That is
where
,
V(∆) is the set of the three vertices of ∆, and
is the common area size contributed by both angular sectors centered, respectively, at vertices
and
, and
is the area covered by all three vertices.
Next, we employ our analysis of intra-triangle coverage to detect coverage holes in a sensing target field.
6. A Deeper Look at the Effect of Anchor Misplacement on Sensing Coverage
We recall that anchor misplacement creates two new types of coverage holes: false perceived and hidden unreported actual coverage holes. We utilize our analysis in the previous section to address these new coverage holes in the vicinity of the sensor nodes that are affected by anchor misplacement (i.e., localized using misplaced anchor nodes). Let , be the set of affected sensor nodes. Further, let denotes the actual sensing coverage area that is covered by sensor node . Next, we introduce several important auxiliary definitions.
Definition 2: The collective
actual sensing coverage (
) of all affected sensor nodes in WSN is defined as a union of their physical sensing coverage in the target field. That is,
Let be the erroneous estimated location of . will report sensed data from an inaccurate location which creates a perceived coverage around. Further, let denotes the perceived sensing coverage area that is covered by the affected sensor node as if is in coordinates.
Definition 3: The collective perceived sensing coverage () of all affected sensor nodes in WSN is defined as follows. .
In practice, to compare
and
and characterize which scenarios lead to which type of coverage holes, we use Delaunay Triangulation to study this problem in the locality of each affected sensor node. We use the implementation of a distributed algorithm in [
20] to construct the DT that represents the target sensing field
S. Lemma 2 provides a good criterion to show the existence of coverage holes. From the analysis in Section V, subtracting
from the full area size of ∆ gives the uncovered area inside ∆ as follows.
where
refers to the area size of ∆ and it is given by the following equation.
, where and a, b and c are the length of the sides of ∆.
Let
be an affected sensor node by anchor misplacement. Its erroneous estimated location is denoted by
with coordinates (
). Let
be its localization error vector. The corrected coordinates of the
's position are
.
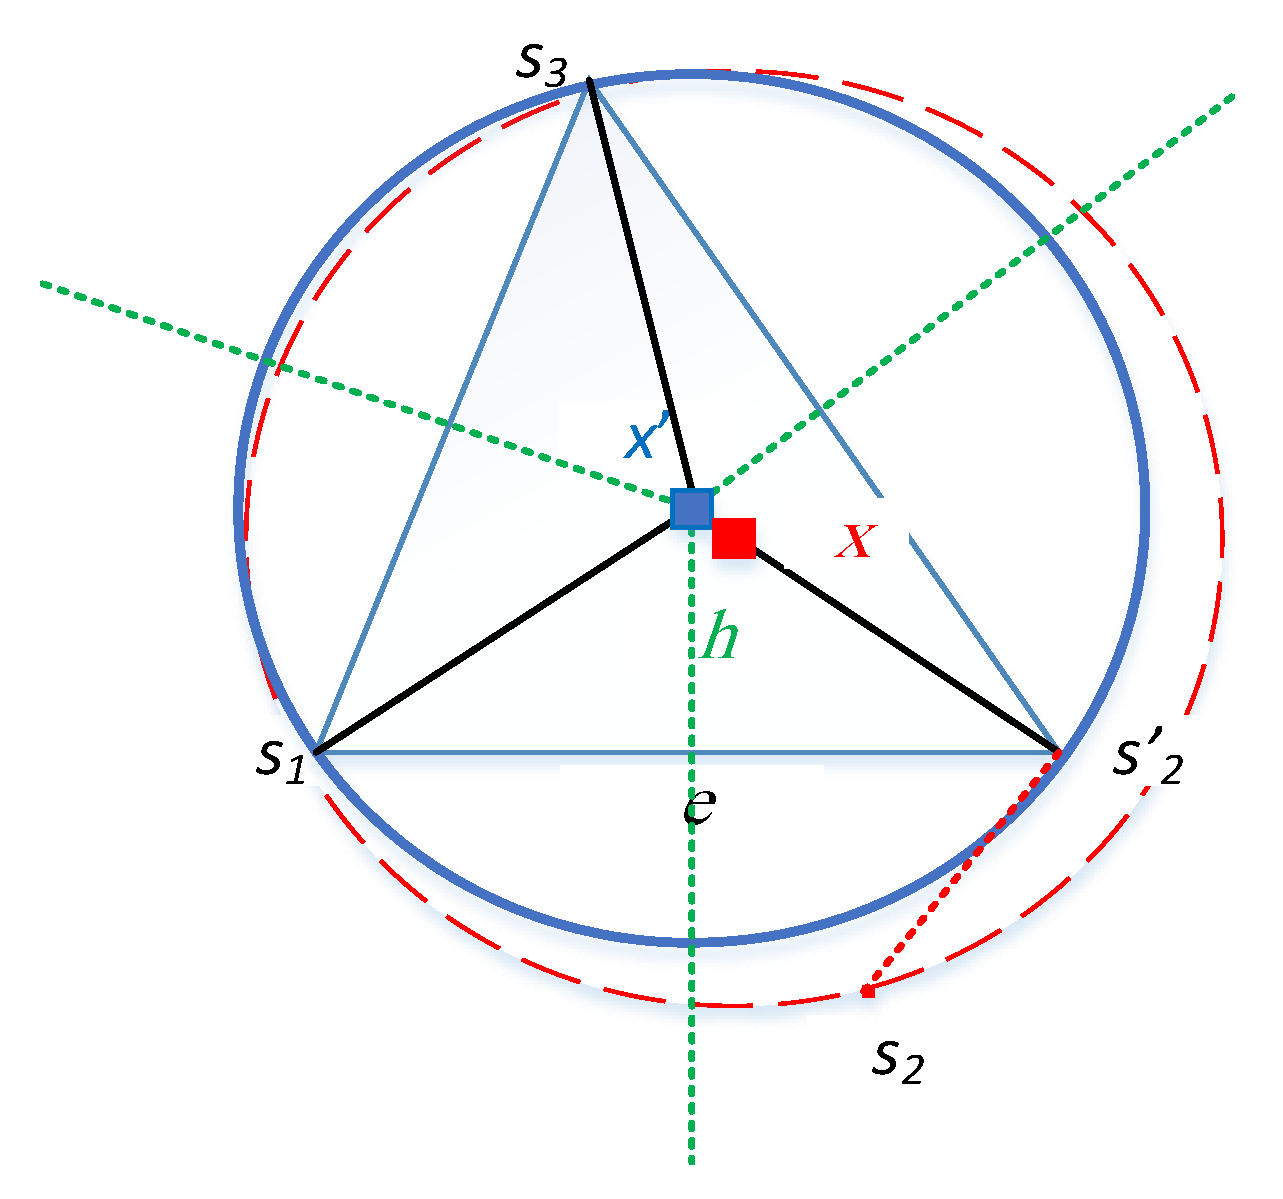
Figure 12 shows the structural change of the Delaunay triangle due to the impact of anchor misplacement on localizing sensor
.
In order to measure the sensing coverage holes posed by anchor misplacement, we need to calculate the sensing coverage in two cases: with and without the existence of anchor misplacement. That is, for each affected sensor node
, we measure the coverage hole by comparing the sensing coverage of
and its neighbors on the one hand, and
and its neighbors on the other hand. This allows us to compare
and
in their vicinities.
Figure 5 and
Figure 6 show the vicinity of affected sensor
(i.e.,
) and the vicinity of
(i.e.,
). The triangulation of these vicinities enables us to study the noncovered areas in each triangle.
Next, we utilize the concept of history in graph theory to demonstrate the above analysis and calculate the sensing coverage for each affected sensor node with and without the presence of anchor misplacement.
A. Anchor Misplacement as a Graph Operator
Let be a Delaunay Triangulation of IoT sensors in the target field with no anchor misplacement. Anchor misplacement triggers a change in which impacts the localization accuracy of sensor nodes. The change in could be either in length metric of edges or in structure as some sensors become connected or disconnected according to their erroneous location. Let denote the new triangulation after anchor misplacement. Having all these effects, anchor misplacement can be considered as a graph operator that maps an input-given graph (i.e., ) into a new graph . If is an affected sensor, then , meaning has been localized correctly (before anchor misplacement), while it has been localized incorrectly after anchor misplacement, we call it in this case. Accordingly, and can be visualized as different sensors from a geolocational perspective.
Let
represents all triangles in
that are induced by
and its neighbors, i.e.,
. Similarly, let
represents all triangles in
that are induced by
and its neighbors, i.e.,
. For example, the triangulation of
includes all triangles in
induced by
and its vicinity, i.e.,
in
Figure 5 and
Figure 6. To this end, we call
the graph history of
since it is the previous graph state before anchor misplacement. We denote it
. That is,
. The concept of graph history is not new in graph theory; it has been used in the literature in various domains such as characterizing the asymptotic behavior of iterated line and path graphs [
21,
22].
Clearly, the subgraphs
and its history,
, may not be the same. Indeed, the erroneous localization of sensors drifts some vertices to be in
but not in
or vice versa. The location of each sensor in the target field is a key point in our study as both subgraphs
and
could be isomorphic
2 but yet different in terms of edge lengths.
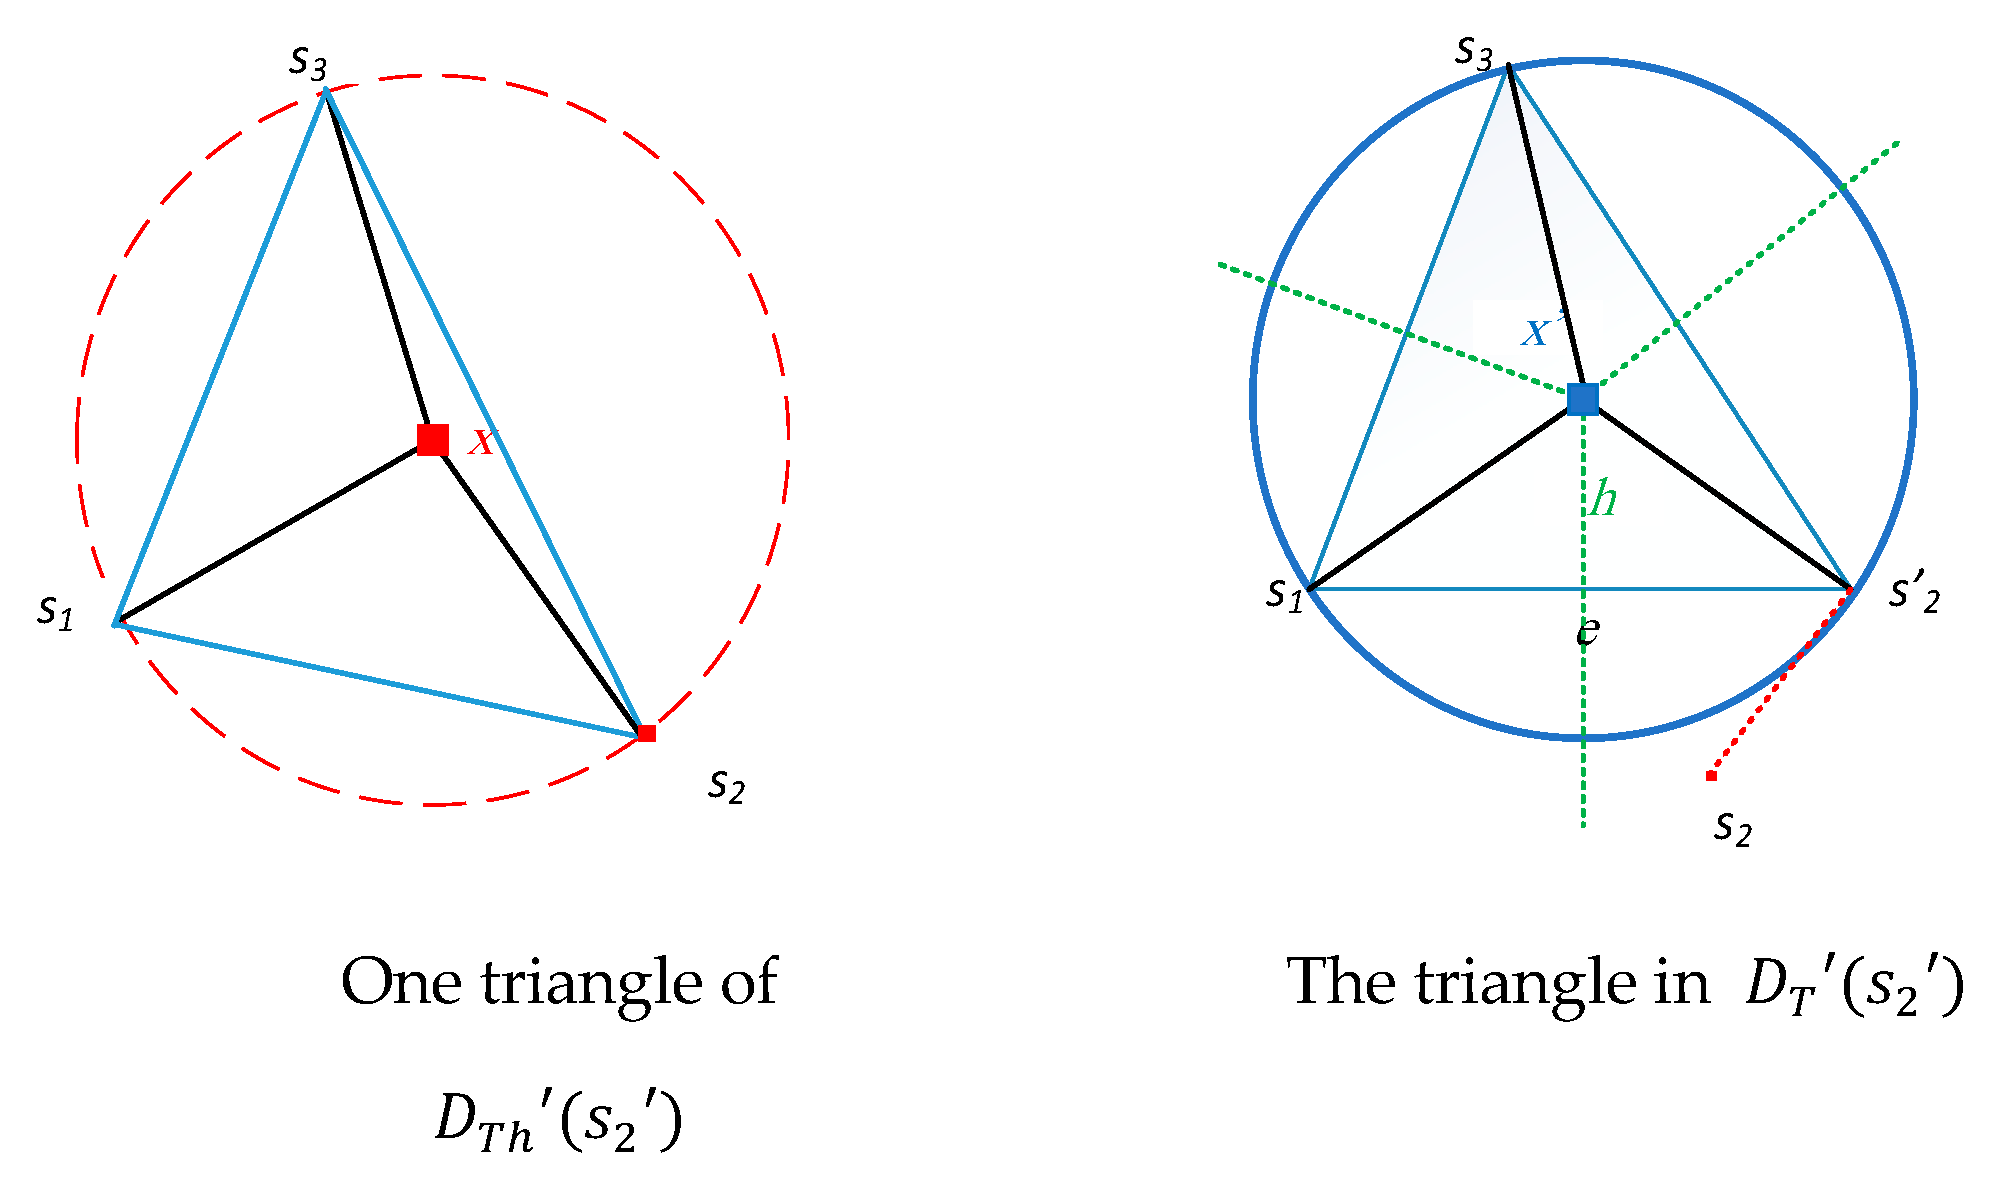
Figure 13 shows one triangle of
and its graph history,
.
We can construct
from
in the following way: Identify the misplaced anchor nodes, then remove the affected sensor nodes
with their linked edges and insert them again in their correct positions. Lastly, construct the triangulation in their locality. The average number of neighbors of
,
, is at most 6 and, therefore, the average number of triangles in both subgraphs
and
will not exceed 6 [
19]. This shows the low computational cost of our approach.
B. Identifying Coverage Holes under Anchor Misplacement
In this subsection, we detect/delineate the false perceived and hidden unreported actual coverage holes. To achieve this, we are interested in the common triangles of both and . The empty intersection indicates that is a totally new structure and none of belongs to . This happens when anchor misplacement poses an extremely high inaccurate location for sensor such that the estimated location is out of the vicinity of . We recognize the following categories of a possible common triangle ∆ between and .
Full local coverage of ∆ is maintained in both and .
Full local coverage of ∆ exists in , but not in . This is the case of false perceived coverage hole.
There is no full coverage in both and .
The full local coverage of ∆ exists in
, but not in
. This is the case of hidden actual unreported coverage holes as shown in
Figure 14.
Categories 1 and 3 deal with extreme cases where the triangle ∆ is either covered in both and its history or not.
We are interested in detecting, identifying, and finding the size of the coverage holes that belong to categories 2) and 4). Our analysis in Section IV allows us to detect the coverage whole. The approach we followed in Section V, i.e., intra-triangle coverage, provides an effective tool to calculate the size of the coverage hole. Identifying the type of coverage hole can be achieved using the concept of history illustrated in this subsection. Next, we find the coverage ratio of the perceived sensing,
to the actual sensing coverage,
. The coverage ratio in the categories 1-4 is denoted CRC1-CRC4, respectively.
Where refers to the area of triangle in graph . refers to the size of the uncovered area in as per (15). Note that if the ratio is not equal to 1 in both categories 1 and 3, then there is inaccurate sensing reporting of ∆ sensor nodes. In this case, the actual coverage in the history is either underestimated or overestimated.
The same approach is still valid if more than one sensor is affected in a triangle . Assume and are two affected sensors and neighbors in . There will be some redundant calculations because and will have a triangle in common. Consequently, the will be calculated twice as both and are affected. Therefore, the value of the whole should be adjusted accordingly in both and .
The coverage ratio in (16) is straightforward. We apply it to the intra-triangle to identify the different types of coverage holes posed by anchor misplacement and calculate the percentage of each one. We later utilize our resilience framework to identify the misplaced anchors and find the set of affected sensor nodes.
C. Calculating Lower and Upper Bounds of Coverage Holes
The intra-triangle coverage holes (or uncovered areas) have different shapes; however, we model the upper and lower bounds of each uncovered area in a triangle ∆ as circles. The lower bound circle is a circle centered in the centroid of the polygon that strictly contains the uncovered area in ∆; it is the largest circle that can be inscribed inside the uncovered area. On the other hand, the upper bound circle is the minimum circle that circumscribes the uncovered area of ∆. To compute lower and upper bounds for the uncovered area in ∆, we apply the following procedure: first, we find a set
of intersection points, namely the intersection points between angular sectors and the edges of ∆, and the intersection points of the angular sectors themselves. Let
and
be two vertices in ∆. If
we exclude the intersection points between the circles centered in
and
and the edge
. Let
be the new set of intersection points. The points of
form a polygon
. Our goal is to find the minimum/maximum circle that circumscribes/inscribed-in
. To achieve this, we need to determine the centroid
c of this polygon. The coordinates of the centroid are given by the following formula [
23]:
where A is the area and is given by
, and
and
are two consecutive points on
's hull. Let
. The circle centered in c with radius
represents a lower bound of the uncovered area in ∆. Likewise, let
. Then
represents the size of the minimum circle that circumscribes
and, hence, considers as an upper bound of the uncovered area in ∆. Therefore, we have the following bounding formula:
where both bounding circles are centered at the centroid of a polygon that contains the uncovered area. It should be noted here that the use of centroid c instead of the circumcenter of ∆ is more effective for the following reasons: 1) the circumcenter of ∆ does not always belong to the uncovered area due to the variation of IoT sensor ranges. 2) The circumcenter could be outside ∆ which makes the calculation of intra-triangle coverage irrelevant. 3) The bounds using the centroid c are tighter as it represents the uncovered area more fairly. Next, we present the algorithm that takes a triangle as an input and provides a uniform upper and lower bound for the uncovered areas.
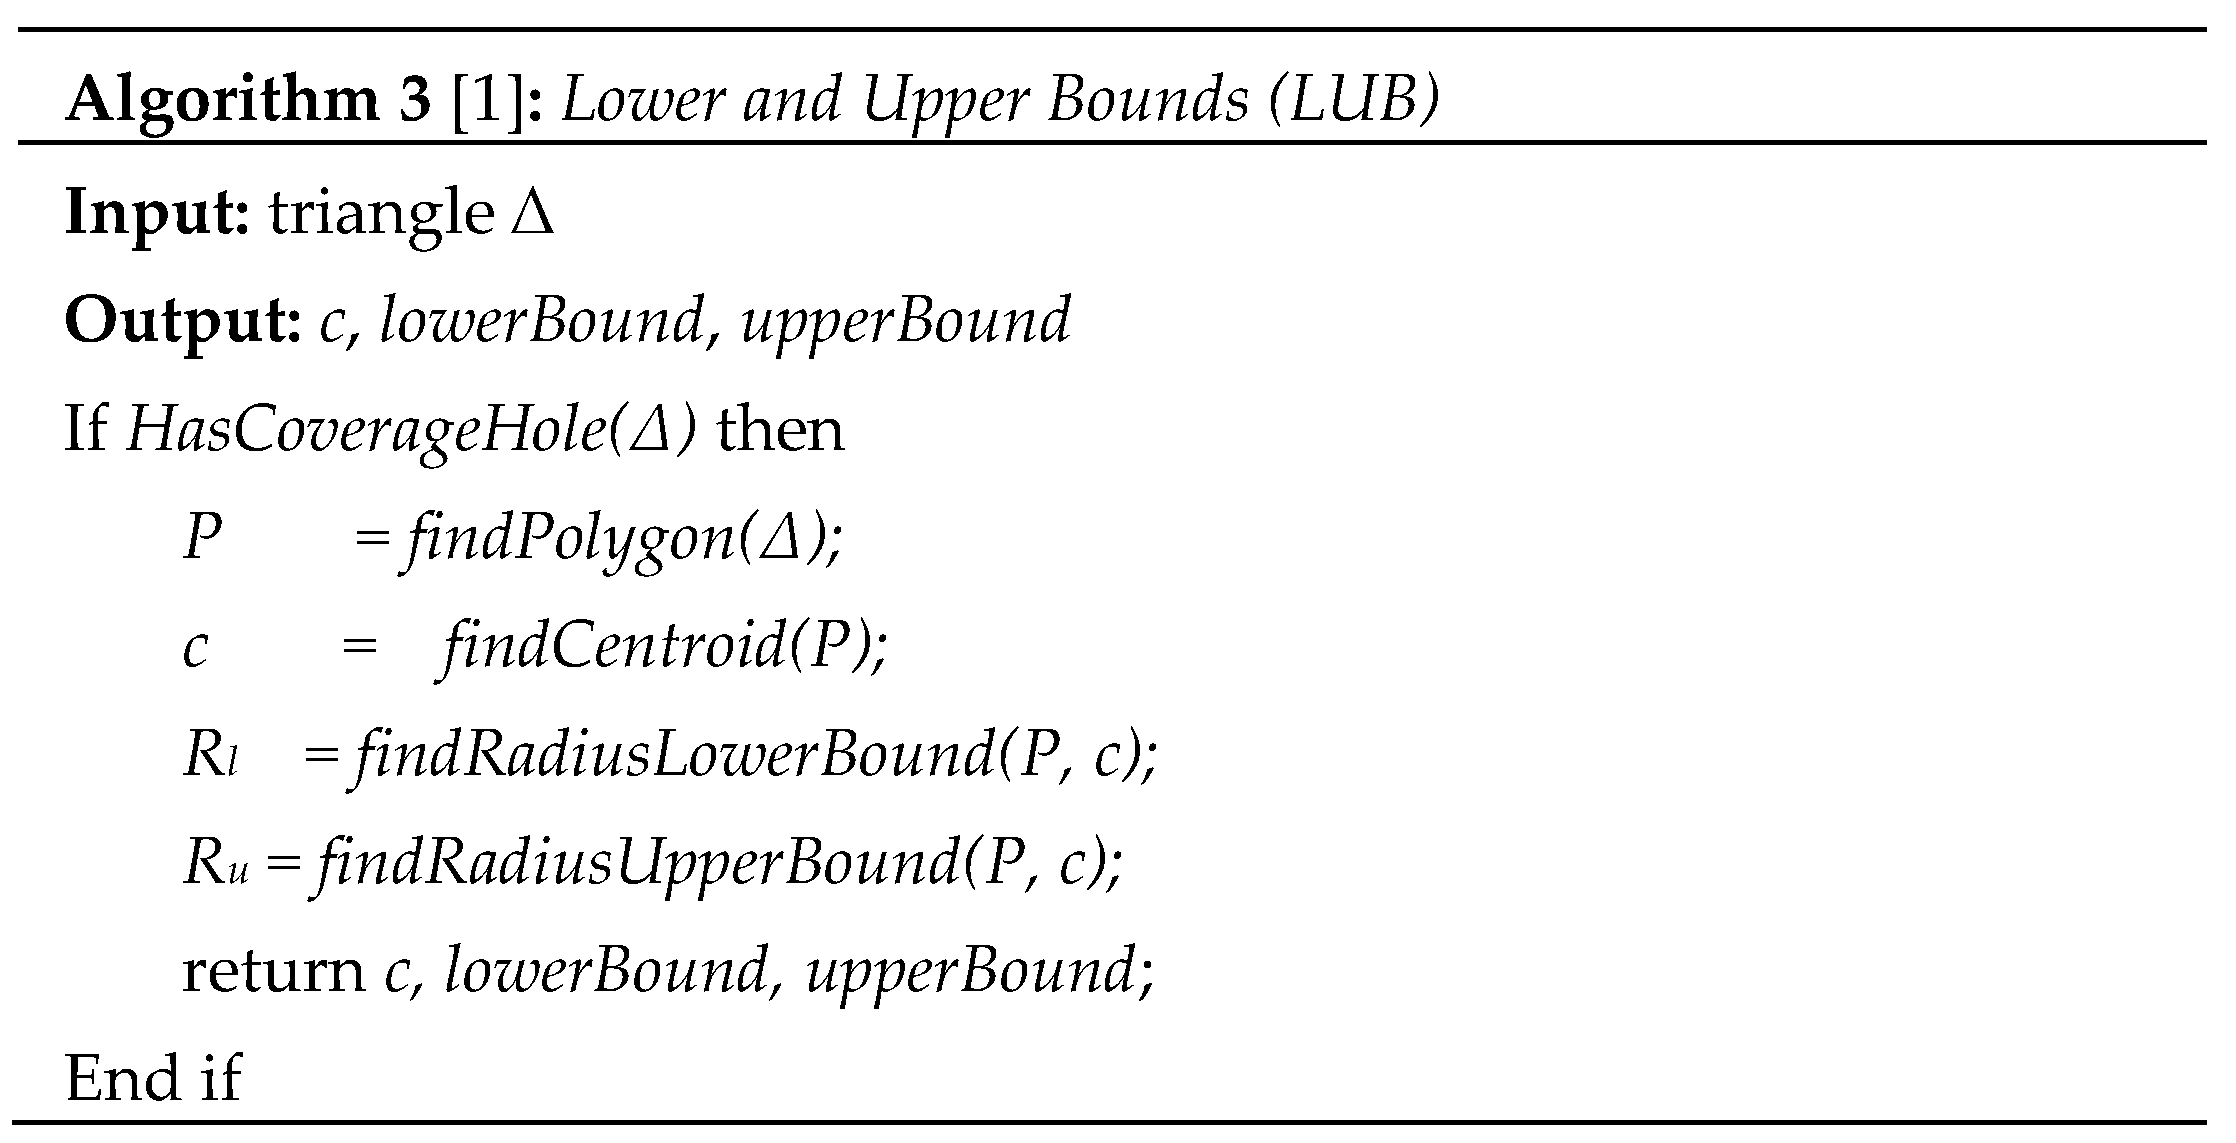
The steps of our above analysis to compute lower and upper bounds are summarized in the following algorithm.
LUB algorithm assumes that all sensors have been localized, and their locations are known. While DT is being constructed, each sensor recognizes its neighbors in each triangle ∆ in DT. LUB algorithm first checks the existence of a coverage hole by calling HasCoverageHole(∆) function which simply checks ∆ against the coverage criteria in Lemma 2. If a coverage hole is discovered, the function findPolygon(∆) is invoked to find the polygon that strictly circumscribed the uncovered region as discussed in this section. findCentroid() will apply the equations (17) and (18) to find the centroid of . The remaining is to call findRaduisLowerBound(, c) to calculate the shortest distance between 's vertices and c which is the radius of the lower bound. Similarly, findRaduisUpperBound(, c) returns the longest distance between 's vertices and c.
7. Resiliency approach for misplaced anchors
In this article, we propose a distributed scheme that takes input from affected sensors during the validation processes, and outputs the set of misplaced anchors.
A. The Proposed Scheme
The proposed scheme aims to determine the localization's validity and, consequently, the sensing coverage's validity by identifying the misplaced anchors through their affected sensors.
The scheme consists of two phases: Phase 1 (identify affected sensors) in this phase, each node measures its distance to all other nodes in two ways: a) Euclidean distance and b) using the received signal strength (RSS). Let and be the distance between nodes and using Euclidean distance and RSS, respectively.
We define
to be the distortion vector between
, and
for node
and all other nodes
as follows.
Where . Clearly, the number of vectors is a multiple of the number of sensor nodes. Calculating all of them to get the average of the two-way distances, i.e., and and the same for and adds up to the overhead computation and consequently increases the latency of detecting misplaced anchors. To this end, we explore two cases: 1) calculate only one vector, from one sensor to all other sensors. For more efficiency, we opt to choose a sensor node close to the center of the target field. 2) calculate several vectors and get the average of two-way distances. Regardless of the cases used, phase 1 will output one vector. We sort this vector in descending order from high to low distortions. In either case, we use the K-means algorithm with K=2 clusters to classify the elements of the vector into two classes: relatively accurate and erroneous sensors localized by misplaced anchors.
Phase 2 (identifying misplaced anchors) this phase aims to use the result of the K-means in the previous phase to identify the set of misplaced anchors. Out of the two generated classes, the one with a high mean localization error value indicates the affected sensors. Consequently, the misplaced anchors are among those which have localized the affected sensors. To find the misplaced anchors set, let
be a set of anchors that participated in localizing sensor node
using the trilateration method. Further, let
be a set of relatively accurate locations of sensor nodes. We define benign anchors,
, as a union set of anchor nodes that participated in localizing all relatively accurate sensors as follows.
Consequently, the misplaced anchors, , belong to the complement set as follows. . Note that need not be mutually exclusive. Indeed, misplaced anchors may participate in localizing some sensors, yet, K-means considers them to have relatively accurate locations. Next, we enhance the detection scheme to address this point.
B. Enhanced Detection Scheme
The previously proposed scheme could result in high false alarms of misplaced anchors. To mitigate this, we propose the following refinement procedure. First, we sort the class/group of relatively accurate sensors in
descending order of localization error. Second, we test the sensors of the sorted group one by one. Let
be the sensor with the highest localization error among other sensors in the sorted class. Further, let
,
, and
are the anchors that participated in localizing
. We test these three anchors against the following criteria: if any of these anchors is closer to the centroid of the affected group rather than the centroid of the relatively accurate sensors group, and its distortion from a benign anchor is greater than a threshold, then this anchor is switched to be
. A threshold depends on historical data which considers SNR. To test an anchor,
, we adopt a similar approach to our previous discussion of distortion between the Euclidean and RSS-based distances as follows.
where
is a benign anchor. We repeat the second step as long as there is at least one anchor participating in localizing sensor
that satisfies the given criteria. To ensure the effectiveness of this procedure, we chose
out of benign anchors that contributed to localizing sensors of the highest accuracy.
8. Numerical Results and Discussion
A. Simulation Results
In this section, we validate our resiliency approach and show its effectiveness. We conduct our experiments using a homogeneous and a heterogeneous network and apply the proposed framework to determine their network reliability. All the simulation results are obtained by repeating the experiments for a certain number of times and averaging the corresponding results. This number is related to the result convergence and variance. For example, if the results converge and come to a stable state with minimum variance after x number of runs, then we adopt x (or higher than x) as a reasonable number of runs.
B. Validation
We first show the validation of our approach in identifying the affected sensors and then misplaced anchors.
We intend to classify the two groups of sensors using K-means clustering. We use the experimental setting depicted in
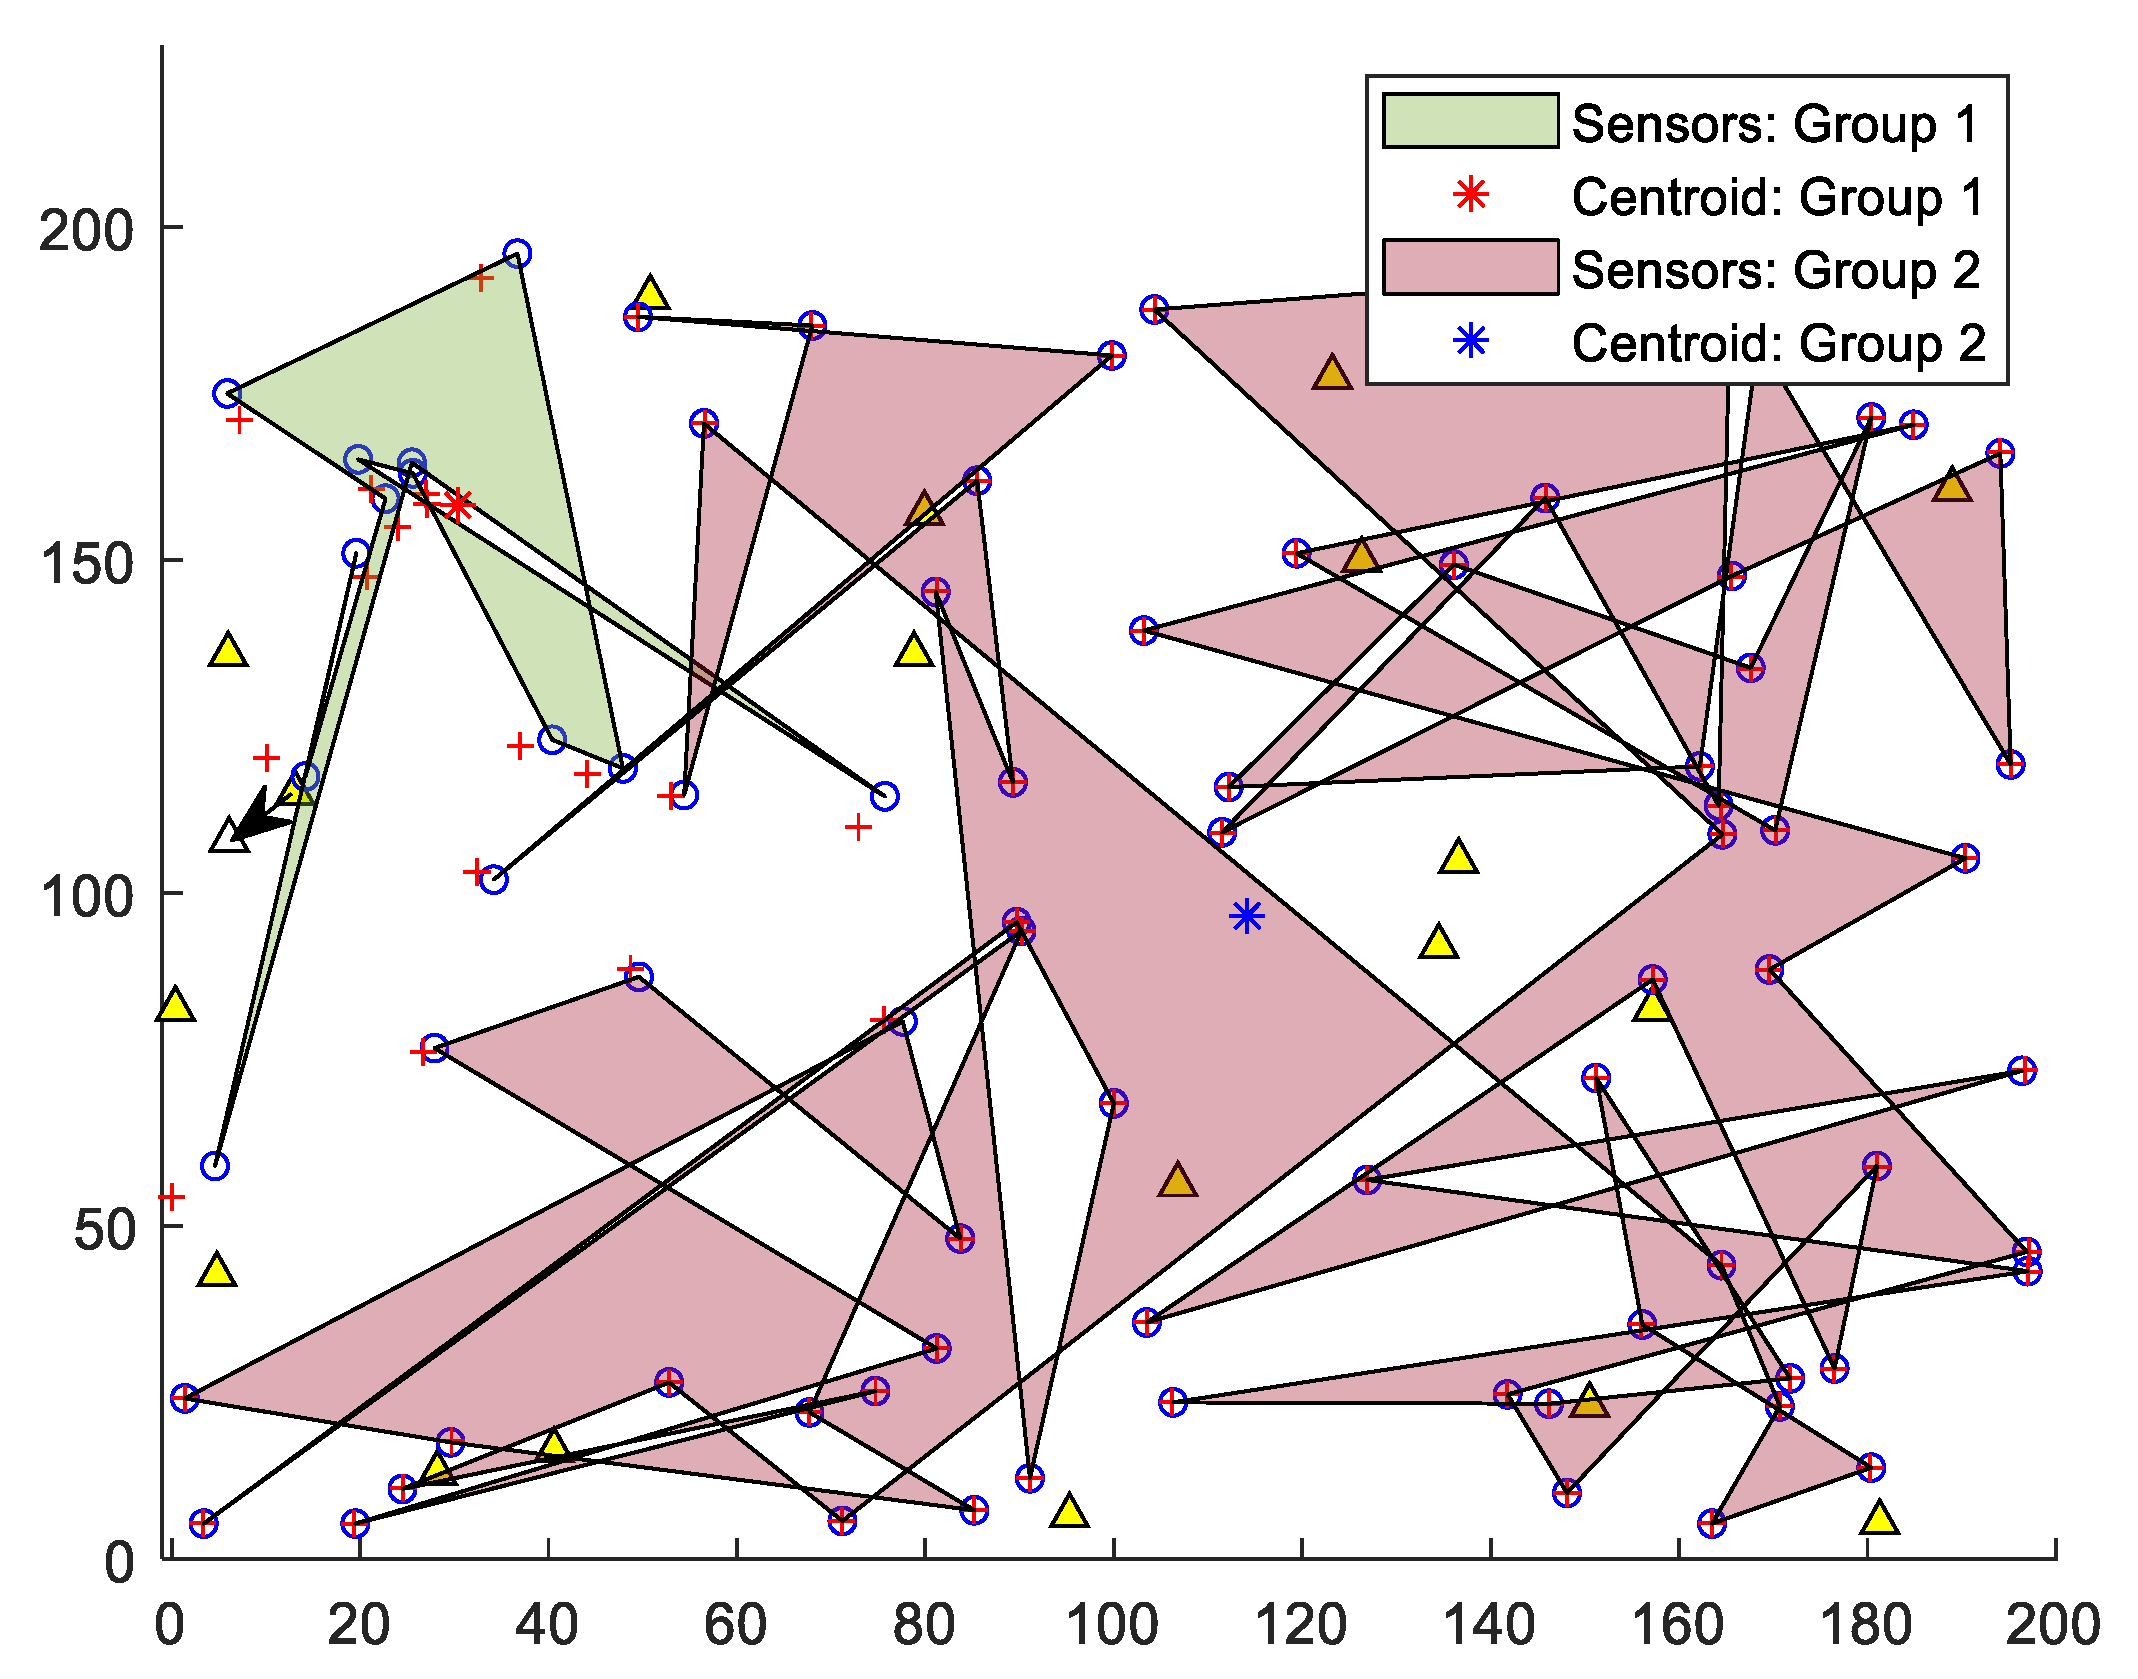
Figure 2. Running phase 1 of our approach results in
Figure 15, showing the groups of affected and relatively non-affected sensors with their centroids. The majority of affected sensors are correctly included in group 1.
We continue to validate our approach by running the enhanced version of phase 2. We calculated localization errors of the two anchor classes for different trials (1, 2, 7, 11, 16, 20, 27, 40). We found that the result converges after 16 trials. Measuring the variance of localization errors suggests that 20 iterations are enough to provide convergent and stable results. Thus, each experiment is repeated 20 times for any given network topology. We take a random sample of 15 observations of averaged localization error values generated by the two anchor groups per iteration. To analyze the statistical significance of the difference between the localization errors generated by the two anchor classes, we adopt the following hypotheses:
Null hypothesis : , which means the true difference of means for the corresponding anchor groups is equal to zero.
Alternative hypothesis : .
We use a 95% confidence interval which is equivalent to a significance level of α=0.05. We reject the null hypothesis if the p-value ≤ α. Rejecting the null hypothesis means that the difference between the localization error caused by these two anchor classes is statistically significant, which means that the test favors the alternative hypothesis. In this case, the zero value is not contained in the confidence interval.
The p-value of 1.9551e-04 suggests rejection of the null hypothesis, meaning the means of the two groups are significantly different. The lower and upper limits of the confidence intervals of the difference of means, [-4.505, -3.4446], confirmed this result.
The results show our approach's validation in identifying misplaced anchors with 95% confidence.
C. Verify the Effectiveness
In this section, we show the robustness of our framework against unreliable nodes. We verify the effectiveness of our framework by mitigating the impact of misplaced anchors on IoT nodes and lift their burden by excluding them as much as possible from the localization process.
We use NS-3 to simulate different scenarios of the conducted experiments where random non-uniform IoT sensors are deployed in the target field. These experiments intend to show the effectiveness of our framework. We also use the implementation of a distributed algorithm in [
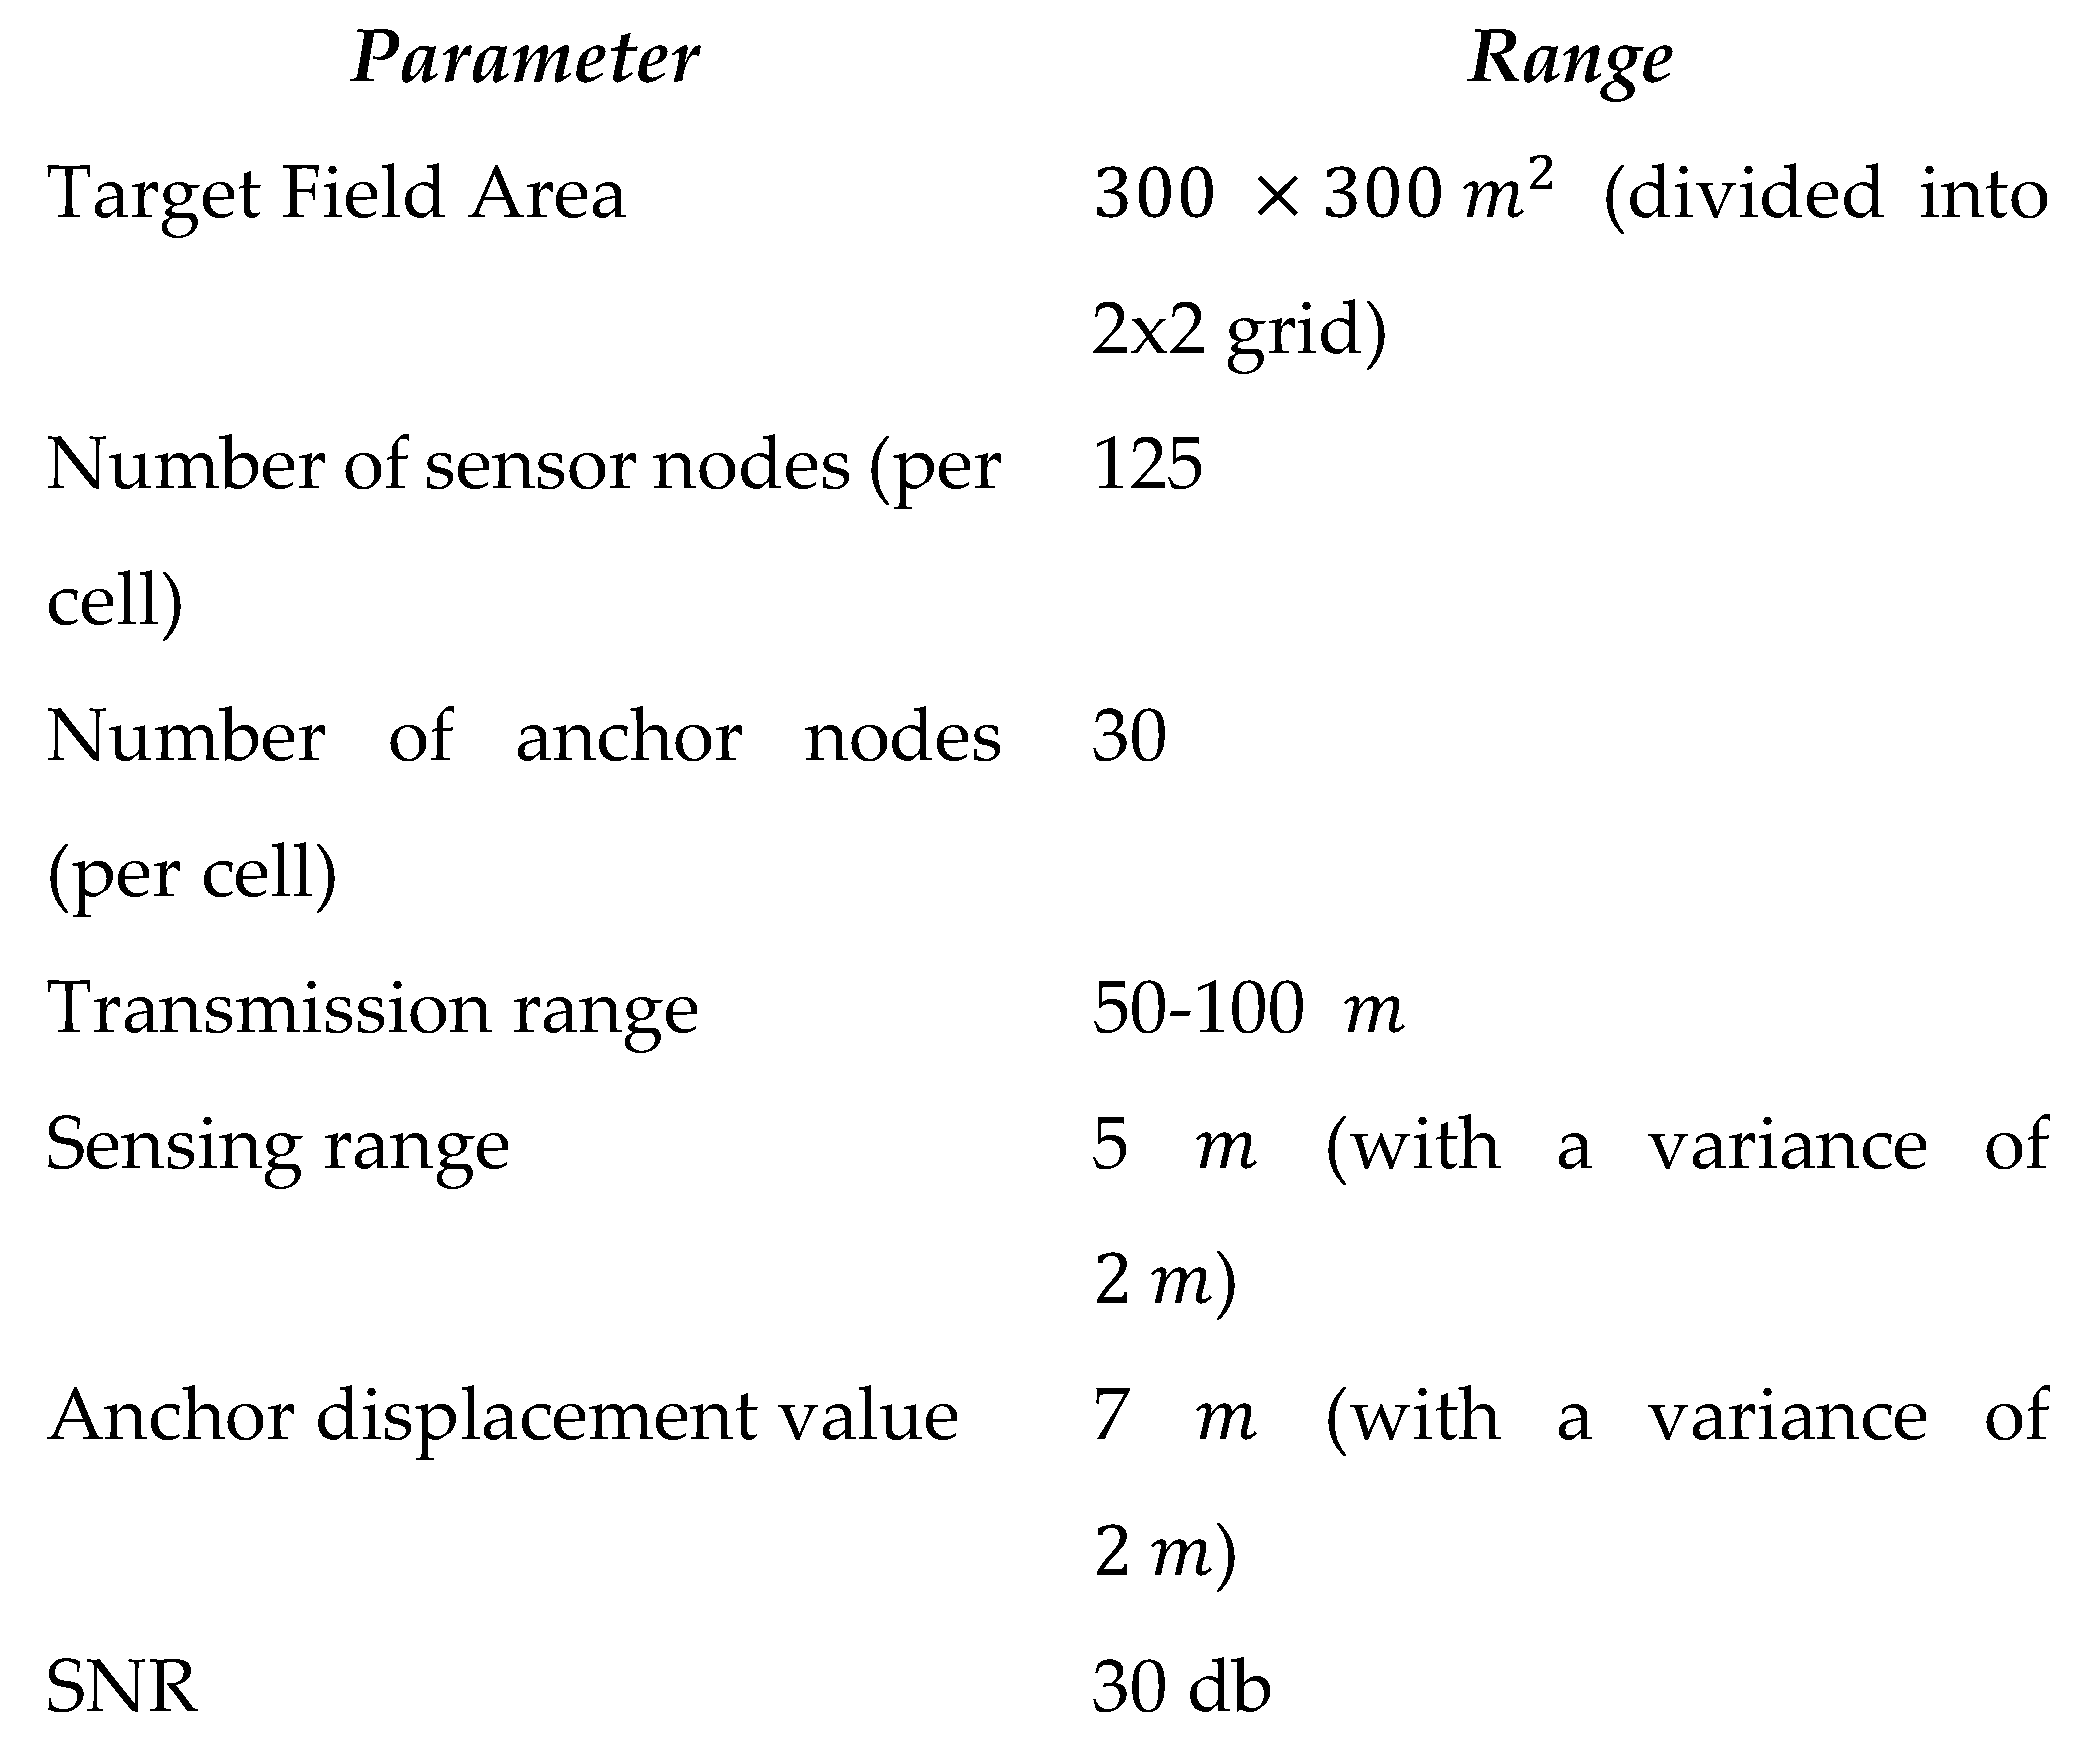
20] to construct the DT that represents the target sensing field. The simulation settings are summarized in Table I.
Table I.
Simulation Settings.
Table I.
Simulation Settings.
1). The Effectiveness of Localization and Perceived Coverage
This experiment aims to show the impact on RMSD and perceived coverage holes as the proposed framework detects and excludes more misplaced anchors.
We use the Root Mean Square Distance (RMSD) to measure the localization error in the network.
where
and
respectively are the actual and estimated positions of sensor node
and
is the total number of sensor nodes. RMSD is widely used in the literature for the comparison of the estimation error in different localization algorithms.
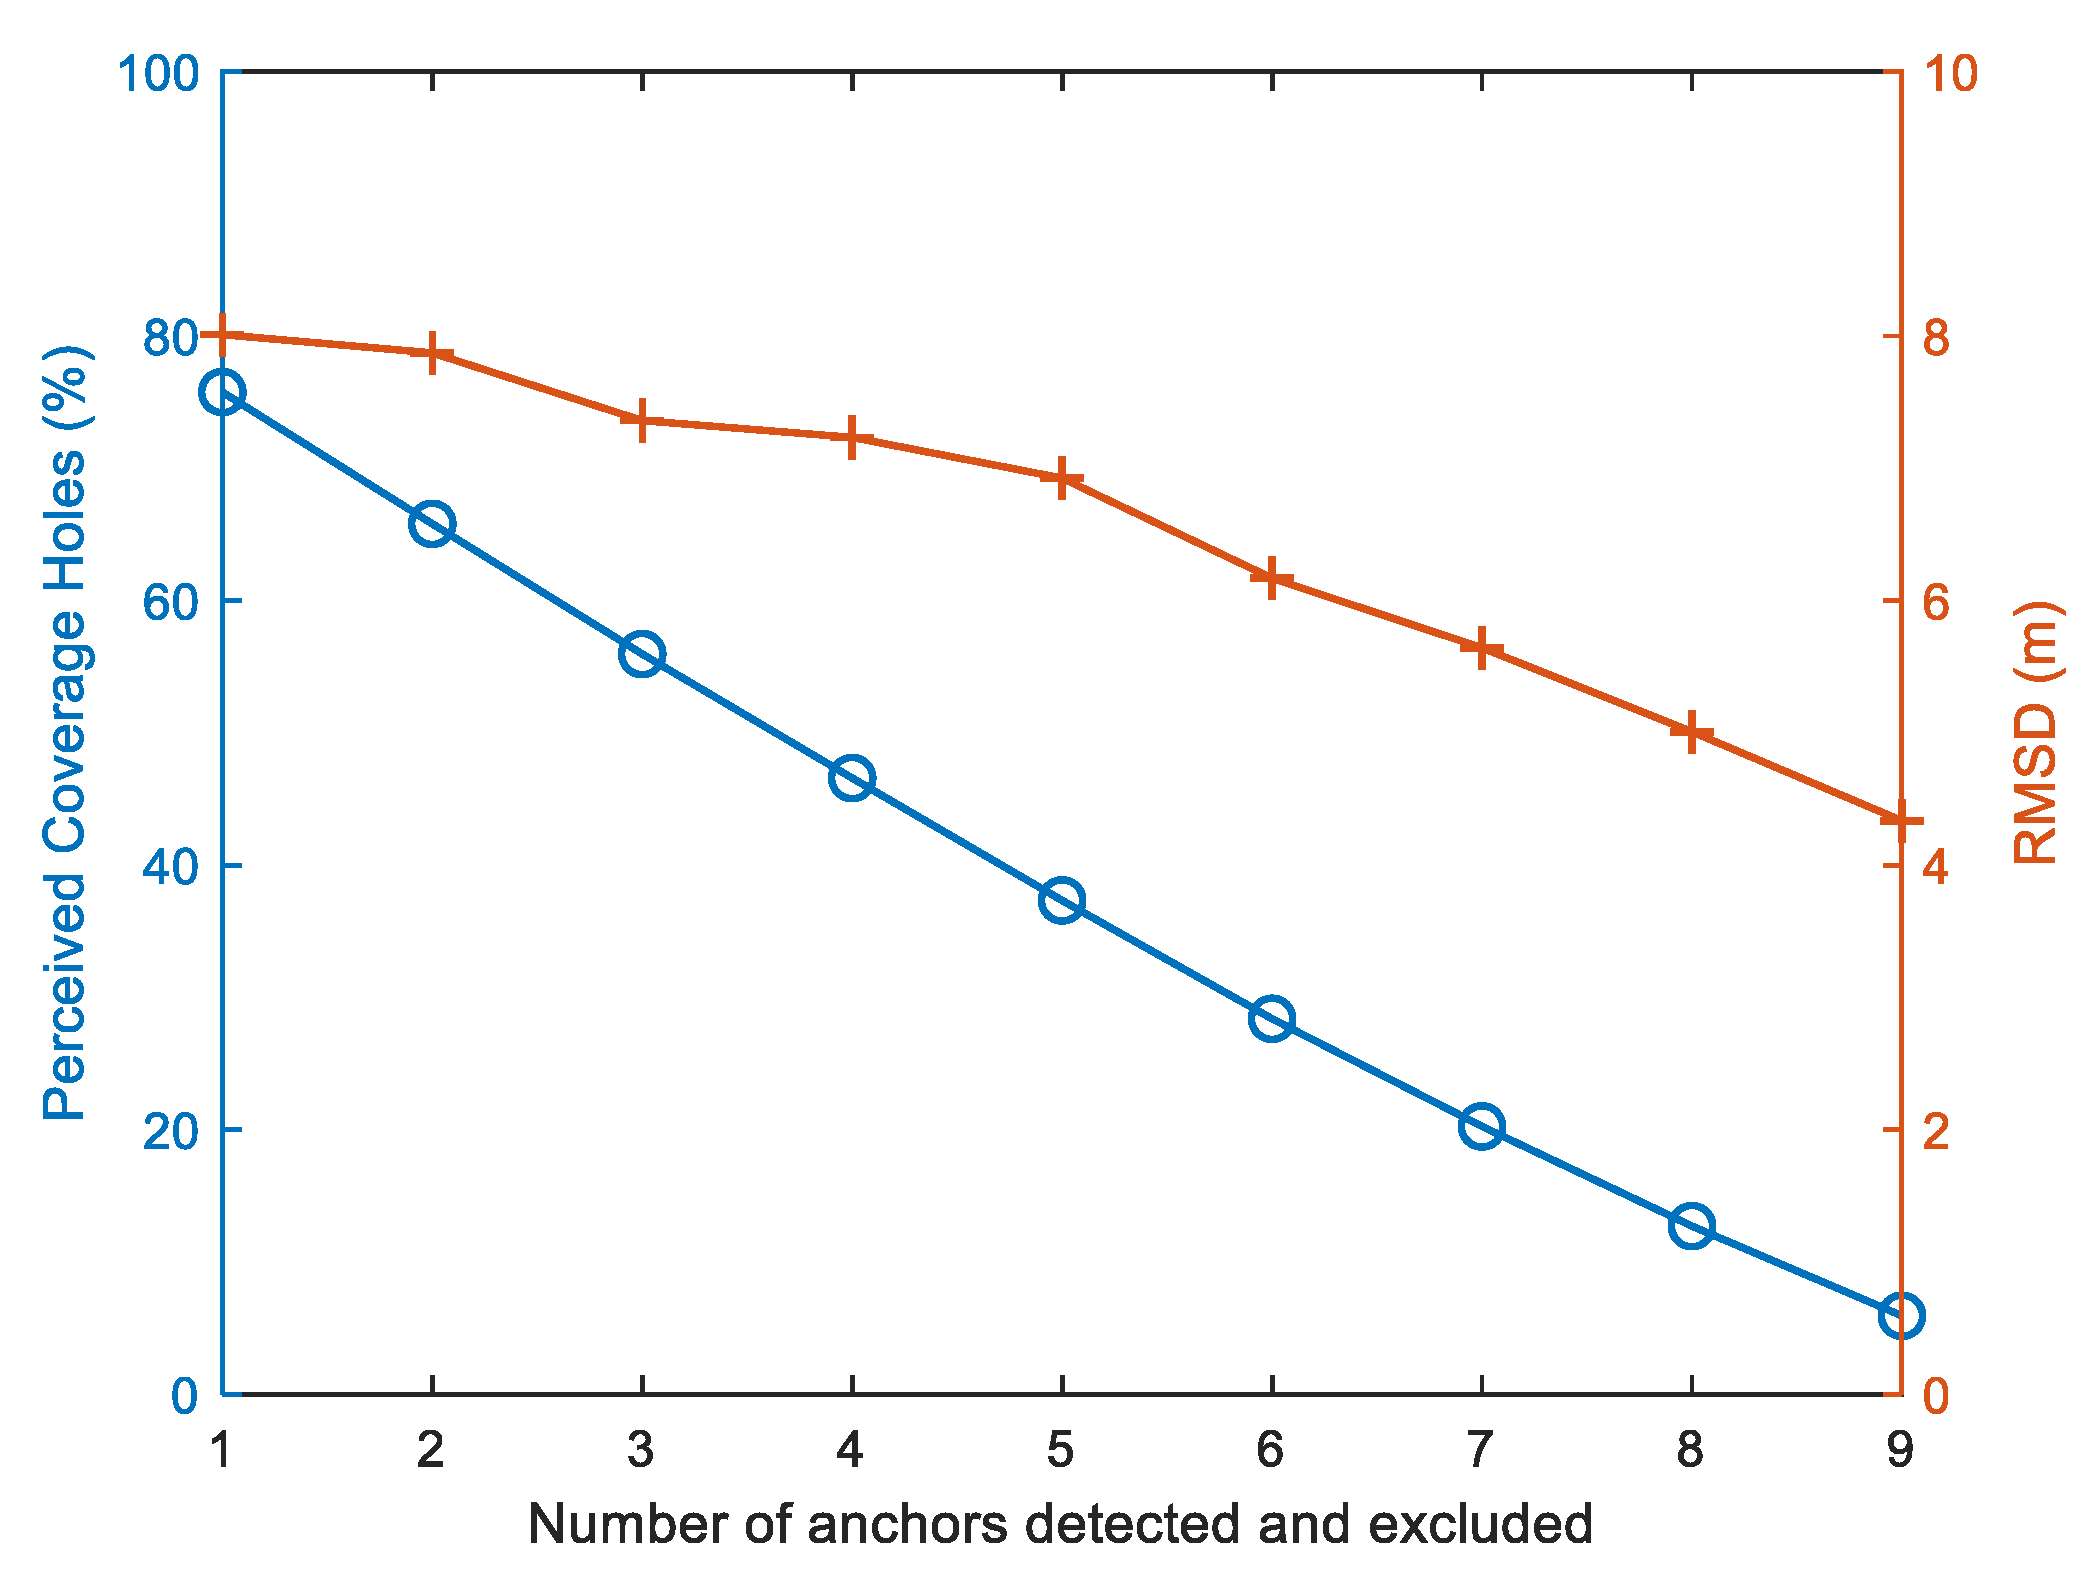
Figure 16 shows the effectiveness of our proposed framework in decreasing both localization RMSD and the percentage of perceived coverage holes as the number of anchor nodes detected and excluded by our framework increases. The perceived lack of coverage has a sharper steep than the RMSD due to the fact that it is directly associated with the number of misplaced anchors in the network, while RMSD is more related to the quality of sensor localization, which is related to multiple factors such as the existence of enough number of reliable anchor nodes per sensor and the impact of SNR to the quality of distance measurements.
2). The Effectiveness of Perceived Coverage Holes for Different Sensing Range Values
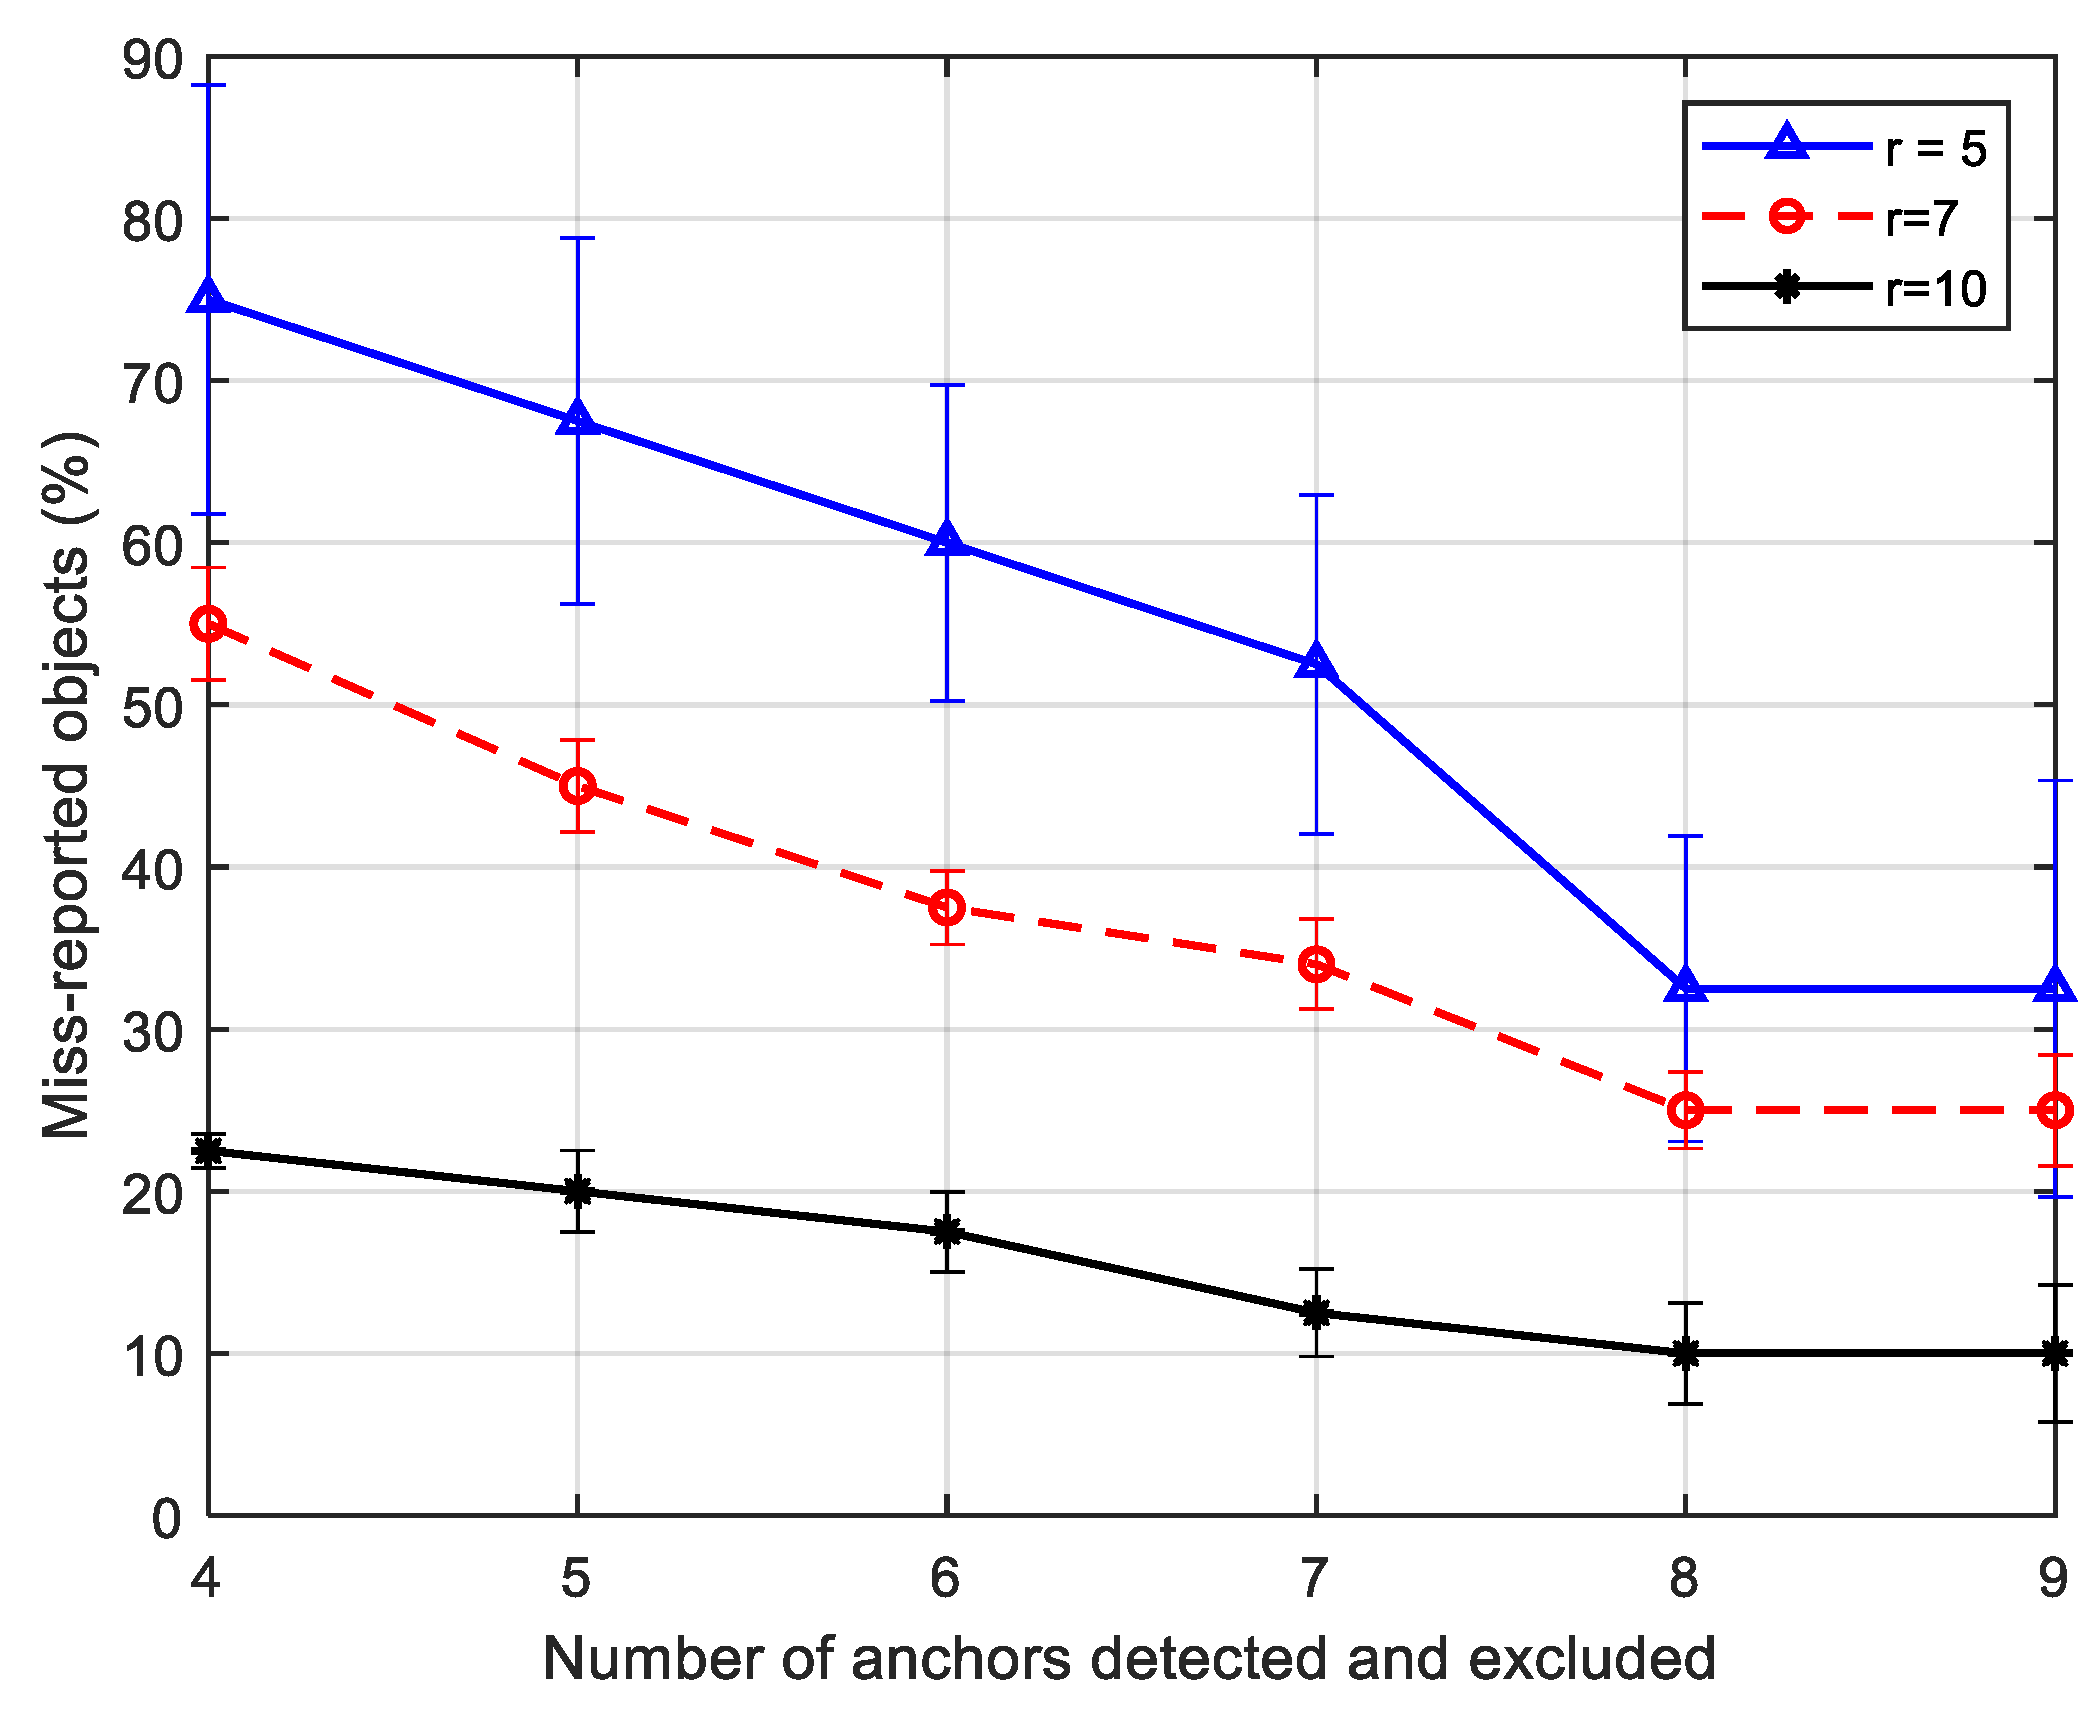
To show the effectiveness of our approach for a heterogeneous network with different sensing range values, we simulate the following scenarios: given 40 objects in terrain, such as gas pipes. The sensor nodes have been deployed to fully monitor gas leakage for all pipes. We assume anchor-based localization is used to localize sensors. If anchor misplacement is incurred, we are interested in showing the impact of our proposed scheme on the percentage of miss-reported objects. To what extent does our framework help to overcome the false perceived coverage as more misplaced anchors are detected and excluded from the network services? The results are shown in
Figure 17.
The 95% confidence interval shows that the percentage of miss-report objects of the three curves becomes statistically insignificant as more misplaced anchor nodes are detected and excluded. This is because regardless of the sensing range, the more misplaced anchors eliminated, the better the sensing reports' validity and, consequently, the fewer miss-reported objects. Our results suggest that using fewer sensing nodes with broader sensing ranges provides faster healing from anchors misplacement. In other words, the proposed framework significantly reduces miss-reported objects as the sensing range increases.
3). The Effectiveness of Perceived Coverage Holes for Different SNR Values
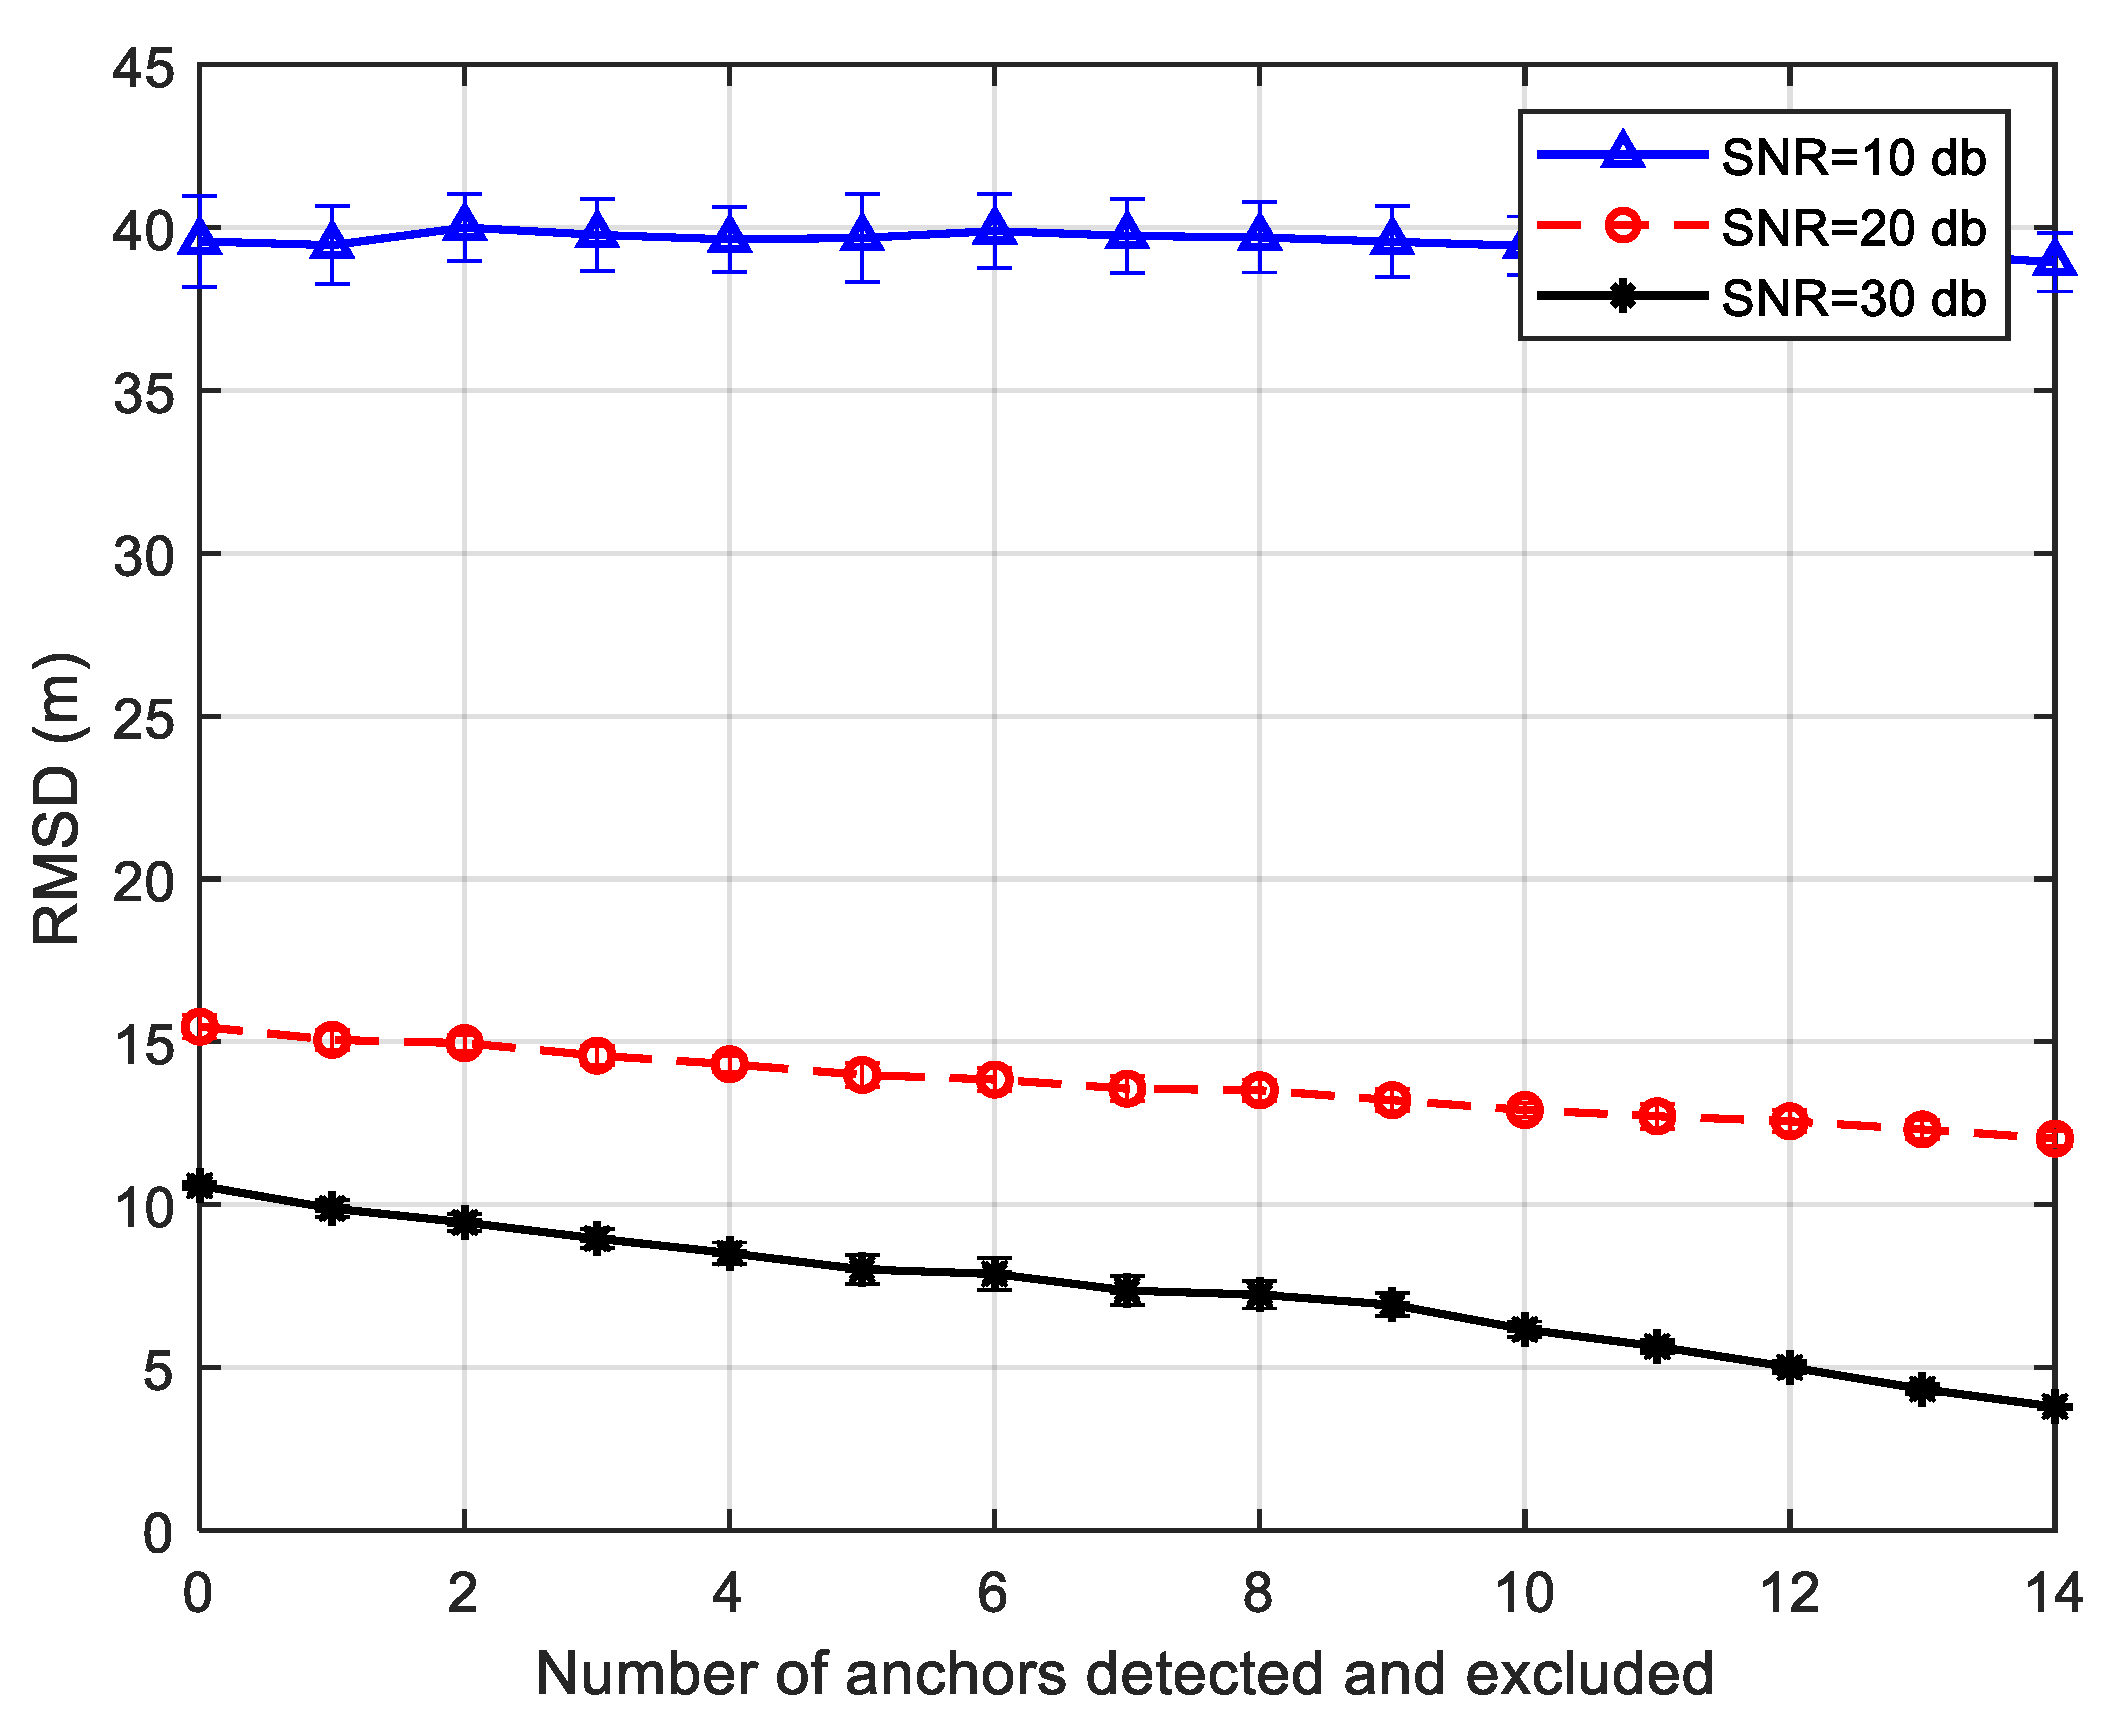
In these experiments, we demonstrate the performance effectiveness of our proposed framework for SNR values 10, 20, and 30 db. The idea is to assess the impact of anchor misplacement and measurement error on localization accuracy.
Figure 18 shows that our framework is more effective for higher SNR. This can be interpreted as follows: as SNR values decrease, measurement error magnitude increases because the signal becomes weaker, reducing the reliability of the localization service. For SNR= 10 db, RMSD stays almost constant to the point that excluding more misplaced anchors nodes does not reduce the RMSD. Moreover, the 95% confidence interval shows the statistical significance of RMSD values for the various SNRs curves. This shows the severity of lower SNR values on sensing reliability.
9. Conclusion
In this paper, we propose a resilience framework to detect anchor misplacement, identify coverage holes, and quantify their area. Toward this, we conduct an in-depth computational geometry-based analysis of the target sensing field under the presence of error components, especially anchor misplacement. We utilized Voronoi Diagrams (VD) and Delaunay Triangulation (DT) to cluster the sensing field to efficiently assess the lack of coverage. Using VD and DT, we addressed the coverage hole problem using a limited number of points in the target sensing field, lowering the computational cost and increasing the feasibility of our schemes in the IoT environment. We assessed the intra-triangle coverage to show the existence of new types of coverage holes: actual unreported and perceived coverage holes.
Our experiments showed the validation and effectiveness of the proposed resilience framework in improving localization accuracy and sensing coverage, reinforcing the overall IoT-based system reliability. Our findings provide solid input for cooperative and overlapped IoT systems to optimize resource sharing by either tolerating coverage loss or deploying extra sensors to cover the coverage gap.
Future work includes designing a framework that extends the life expectancy of IoT networks by employing cooperative sensing and utilizing the intra-triangle analytics of this study. For example, overlapped sensors of multiple network operators can plan an intelligent sleep mode scheduling according to the role of each sensor. Mobile sensors can also be used to back up low-energy sensors and cover actual unreported sensing holes.
References
- Y. Al Mtawa, H. S. Hassanein, and N. Nasser, “Identifying Bounds on Sensing Coverage Holes in IoT Deployments,” in EEE Global Communications Conference (GLOBECOM), pp. 1–6, Dec. 2015.
- Mondal, A.; Mishra, D.; Prasad, G.; Hossain, A. Joint Optimization Framework for Minimization of Device Energy Consumption in Transmission Rate Constrained UAV-Assisted IoT Network. IEEE Internet Things J. 2021, 9, 9591–9607. [Google Scholar] [CrossRef]
- Raza, S.M.; Jeong, J.; Kim, M.; Kang, B.; Choo, H. Empirical Performance and Energy Consumption Evaluation of Container Solutions on Resource Constrained IoT Gateways. Sensors 2021, 21, 1378. [Google Scholar] [CrossRef] [PubMed]
- Martínez Rosabal, O. L. A. López, D. E. Pérez, M. Shehab, H. Hilleshein, and H. Alves, “Minimization of the Worst Case Average Energy Consumption in UAV-Assisted IoT Networks,” IEEE Internet Things J., vol. 9, no. 17, pp. 15827–15838, Sep. 2022.
- K. Xu, G. Takahara, and H. Hassanein, “On the robustness of grid-based deployment in wireless sensor networks,” IWCMC 2006 - Proc. 2006 Int. Wirel. Commun. Mob. Comput. Conf., vol. 2006, pp. 1183–1188, 2006. [CrossRef]
- Bottino, A.; Laurentini, A. A nearly optimal algorithm for covering the interior of an Art Gallery. Pattern Recognit. 2011, 44, 1048–1056. [Google Scholar] [CrossRef]
- R. Kumar, T. Amgoth, and D. K. Sah, “Deployment of Sensor Nodes for Connectivity Restoration and Coverage Maximization in WSNs,” 2021 Int. Conf. Wirel. Commun. Signal Process. Networking, WiSPNET 2021, pp. 209–213, Mar. 2021. [CrossRef]
- D. L. Shanthi, “Maximization of Disjoint K-cover Using Computation Intelligence to Improve WSN Lifetime,” Lect. Notes Networks Syst., vol. 458, pp. 223–238, 2022. [CrossRef]
- Touati, H.; Aboud, A.; Hnich, B. Named Data Networking-based communication model for Internet of Things using energy aware forwarding strategy and smart sleep mode. Concurr. Comput. Pract. Exp. 2021, 34, e6584. [Google Scholar] [CrossRef]
- Wang, S.-C.; Hsiao, H.C.W.; Lin, C.-C.; Chin, H.-H. Multi-Objective Wireless Sensor Network Deployment Problem with Cooperative Distance-Based Sensing Coverage. Mob. Networks Appl. 2021, 27, 3–14. [Google Scholar] [CrossRef]
- Y. Al Mtawa, N. Nasser, and H. S. Hassanein, “Mitigating anchor misplacement errors in wireless sensor networks,” in 11th International Wireless Communications and Mobile Computing Conference (IWCMC), pp. 569–575, Oct. 2015.
- F. B. Sorbelli, S. K. Das, C. M. Pinotti, S. Silvestri, and S. Sil, “Precise Localization in Sparse Sensor Networks using a Drone with Directional Antennas,” Proc. 19th Int. Conf. Distrib. Comput. Netw., 2018. [CrossRef]
- Maheshwari and N. Chand, “A Survey on Wireless Sensor Networks Coverage Problems,” Lect. Notes Networks Syst., vol. 46, pp. 153–164, 2019. [CrossRef]
- M. Farsi, M. A. Elhosseini, M. Badawy, H. Arafat Ali, and H. Zain Eldin, “Deployment techniques in wireless sensor networks, coverage and connectivity: A survey,” IEEE Access, vol. 7, pp. 28940–28954, 2019.
- S. K. Sowe, T. Kimata, M. Dong, and K. Zettsu, “Managing heterogeneous sensor data on a big data platform: IoT services for data-intensive science,” Proc. - IEEE 38th Annu. Int. Comput. Softw. Appl. Conf. Work. COMPSACW 2014, pp. 295–300, Sep. 2014. [CrossRef]
- Shakhov, V.V.; Koo, I. Experiment Design for Parameter Estimation in Probabilistic Sensing Models. IEEE Sensors J. 2017, 17, 8431–8437. [Google Scholar] [CrossRef]
- Y. Al Mtawa, H. S. Hassanein, and N. Nasser, “Measuring the validity of sensing coverage in the presence of anchor misplacement,” in IEEE International Conference on Communications (ICC), pp. 1–6, Jul. 2017. [CrossRef]
- G. Takahara, K. Xu, and H. Hassanein, “Efficient coverage planning for grid-based wireless sensor networks,” IEEE Int. Conf. Commun., pp. 3522–3526, 2007. [CrossRef]
- M. de Berg, O. Cheong, M. van Kreveld, and M. Overmars, “Delaunay Triangulations,” in Computational Geometry, Springer, Berlin, Heidelberg, 2008, pp. 191–218.
- Delaunay Triangulation C++ Library for 2D and 2.5D point clouds. Available online: https://www.geom.at/products/fade2d/ (accessed on 14 August 2022).
- Y. Al-Mtawa and M. Jazzer, “On Independence Problem of P2-Graph,” Int. J. Comput. Sci. Netw. Secur., vol. 9, no. 1, p. 205, 2009.
- Y. Al Mtawa, “Histories of Iterated Path Graphs,” J. Comb. Inf. \& Syst. Sci., vol. 32, pp. 175–188, 2007.
- P. Bourke, “‘Calculating the area and centroid of a polygon’ - Google Scholar,” 1988.
- M. de Berg, O. Cheong, M. van Kreveld, and M. Overmars, “Voronoi Diagrams,” in Computational Geometry, Springer, Berlin, Heidelberg, 2008, pp. 147–171.
| 1 |
The size of this set is at most 2n-5 [ 24]. |
| 2 |
Two graphs are isomorphic if they contain the same objects (i.e., vertices) linked in the same way. |
Figure 1.
Multi-hop cooperative sensing networks.
Figure 1.
Multi-hop cooperative sensing networks.
Figure 2.
The impact of anchor misplacement on localizing sensor nodes.
Figure 2.
The impact of anchor misplacement on localizing sensor nodes.
Figure 3.
Anchor misplacement influence on network reliability.
Figure 3.
Anchor misplacement influence on network reliability.
Figure 4.
Full and partial sensing coverage using heterogeneous sensor nodes.
Figure 4.
Full and partial sensing coverage using heterogeneous sensor nodes.
Figure 5.
A triangulation in the vicinity of sensor node . (a) An ideal case is where there are no coverage holes. (b) A perceived coverage hole due to anchor misplacement.
Figure 5.
A triangulation in the vicinity of sensor node . (a) An ideal case is where there are no coverage holes. (b) A perceived coverage hole due to anchor misplacement.
Figure 6.
An actual unreported coverage hole can be identified by investigating the triangles in the vicinity of the affected sensor . (a) Original deployment with actual coverage hole. (b) An actual coverage hole is masked. Thus unreported.
Figure 6.
An actual unreported coverage hole can be identified by investigating the triangles in the vicinity of the affected sensor . (a) Original deployment with actual coverage hole. (b) An actual coverage hole is masked. Thus unreported.
Figure 7.
Disk model of overlapped IoT sensing providers with coverage holes.
Figure 7.
Disk model of overlapped IoT sensing providers with coverage holes.
Figure 8.
VD partitions sensing field into convex cells.
Figure 8.
VD partitions sensing field into convex cells.
Figure 9.
Sample DT of VD: Triangulations incident to sensor .
Figure 9.
Sample DT of VD: Triangulations incident to sensor .
Figure 10.
An illustration of sensing coverage using the concept of the intra-triangle contribution of a sensor node.
Figure 10.
An illustration of sensing coverage using the concept of the intra-triangle contribution of a sensor node.
Figure 11.
An illustration of sensing ranges lower bounds presented by lemma 2 and corollary 2.
Figure 11.
An illustration of sensing ranges lower bounds presented by lemma 2 and corollary 2.
Figure 12.
An example of structural change on DT due to correcting the location of to .
Figure 12.
An example of structural change on DT due to correcting the location of to .
Figure 13.
A partial snapshot of and its history.
Figure 13.
A partial snapshot of and its history.
Figure 14.
Actual unreported coverage hole with center x.
Figure 14.
Actual unreported coverage hole with center x.
Figure 15.
An illustration of K-means application on sensors, generating two ployhsape regions/groups of sensors: affected and relatively non-affected by anchor misplacement.
Figure 15.
An illustration of K-means application on sensors, generating two ployhsape regions/groups of sensors: affected and relatively non-affected by anchor misplacement.
Figure 16.
The behavior of RMSD and perceived coverage as the number of anchors detected and excluded increase.
Figure 16.
The behavior of RMSD and perceived coverage as the number of anchors detected and excluded increase.
Figure 17.
Number of misplaced anchors vs. percentage of miss-reported objects.
Figure 17.
Number of misplaced anchors vs. percentage of miss-reported objects.
Figure 18.
Number of misplaced anchors detected and excluded vs. localization RMSD.
Figure 18.
Number of misplaced anchors detected and excluded vs. localization RMSD.
|
Disclaimer/Publisher’s Note: The statements, opinions and data contained in all publications are solely those of the individual author(s) and contributor(s) and not of MDPI and/or the editor(s). MDPI and/or the editor(s) disclaim responsibility for any injury to people or property resulting from any ideas, methods, instructions or products referred to in the content. |
© 2023 by the authors. Licensee MDPI, Basel, Switzerland. This article is an open access article distributed under the terms and conditions of the Creative Commons Attribution (CC BY) license (http://creativecommons.org/licenses/by/4.0/).
