1. Introduction
In most projects in tropical areas, many soil slopes are distributed under natural conditions or for engineering reasons. Engineering measures can be used to strengthen soil slope, among which the use of microbial grouting to strengthen soil slope to improve the stability of soil slope has good engineering application value. At the same time, abundant rain and typhoon often lead to the unsaturated state of slope soil, and continuous heavy rain makes rainwater infiltrate into slope soil, resulting in increased saturation of slope soil, reduced matric suction of unsaturated soil, resulting in a substantial reduction of shear strength of slope soil, and a substantial increase in the possibility of landslide disaster. Therefore, it is of great theoretical and engineering value to study the stability of slope reinforced by microbial grouting under the condition of rainfall infiltration.
Microbially induced carbonate precipitation (MICP) technology utilizes the metabolic reactions of the Bacillus bacteria itself as well as nutrients present in the culture environment to promote a series of chemical reactions. This bacterium is abundant in the soil. It is well adapted to the environment and can decompose man-made urea at an extremely fast rate. Nutrients are absorbed through the nitrification and decomposition reaction and converted into products mainly composed of carbonate. Free ions are gathered together to form large complex groups. These complex groups have a strong cementation effect and adsorb the generated calcium carbonate crystals around the sclerotium. At the same time, the CO
32- ions produced continuously by decomposition are transported to the surface of bacteria continuously and combine with Ca
2+ ions adsorbed on the outer surface to precipitate calcium carbonate. Through these calcium carbonate "Bridges", the surrounding loose particles can be condensed into a structurally strong whole, which can fill the pores of the sand body [
1,
2]. The main biochemical equation of calcium carbonate precipitation induced by microorganisms is as follows [
3] :
Based on this reaction mechanism, many scholars at home and abroad have conducted in-depth studies on grouting materials, methods, liquefaction and other aspects [
3]. Shao Guanghui et al. [
4] found that bacterial biomass was the fundamental reason affecting microbial solidification, and the bacterial content would linearly decrease along the direction of the reinforcement channel, and the activity would gradually decline. Li Xian [
5] et al., based on soil permeability characteristics and on the premise of meeting the compatibility of microbial survival, conducted tests on the applicability of MICP sand for several soils, and concluded that the reaction environment of MICP hydrolysis and induced formation of calcium carbonate is liquid, which is more suitable for sand soil. Xu Pengxu [
6] et al. conducted single channel reinforcement with peristaltic pump on sand samples of different particle sizes, and concluded that if the pores of sand samples were too small, the upper part of sand samples would be easily blocked, and the reinforcement effect would be uneven. However, if the particle size was too large, the cementation effect would be not ideal, because the liquid was not easy to remain and the microbial contact surface was small. Whiffin [
7] carried out a long sand column test lasting 5 days, and set the consolidation drainage shear test under 50 kPa confining pressure. After the test was completed, the strength of the sand column reached 200kPa~570kPa. Ma Ruinan [
8] et al. used mixing method to explore the permeability characteristics of calcareous sand and found that MICP technology can reduce the permeability coefficient of calcareous sand by 1 to 2 orders of magnitude, improve the adhesion of calcareous sand, and the sand skeleton is not easy to lose under the action of seepage. Liu et al. [
9] conducted a relevant experimental study on MICP reinforced calcareous sand, which showed that the increase of calcium carbonate content would not cause the change of the peak internal friction Angle of the reinforced soil, on the contrary, the cohesion would be significantly increased.
In view of the mechanical properties of MICP reinforced sand, Feng et al. [
11] studied the influences of different confining pressures and cementation degrees on mechanical properties of quartz sand by using triaxial drainage test. The results show that the strength, dilatancy and initial elastic modulus of MICP reinforced sand are proportional to the degree of cementation, and the degree of cementation is closely related to the bonding force. Yiman Bing et al. [
12,
13] measured the shear strength, compressibility and other properties of the MICP reinforced coastal soft soil, and the results showed that MICP technology could improve the compression characteristics of the soft soil and improve the shear strength of the reshaped soil. Tang Yang proposed the parameter sensitive sequence and combination scheme of MICP reinforced soft soil. Yin Liyang et al. [
14,
15] verified the correlation between soil strength and calcium carbonate generation, and the content of calcium carbonate represented the overall cementation.
At present, there are few studies on the applicability of MICP reinforced slope under the condition of rainfall erosion and infiltration. Rainfall infiltration is the main reason for the increase of water content of slope and the decrease of shear strength of soil, which directly leads to the decline of slope under stability. With the increase of water content, the anti-sliding force of slope also begins to decline. Hu Qizhi et al. [
16] used MIDAS/GTS software to analyze and calculate the stability of slope under fluid-structure coupling under the influence of matress suction, and proved that microbial reinforcement could effectively weaken the influence of rainfall infiltration on slope, reduce the negative pressure area of pore water pressure on slope, and improve the stability of slope under rainfall conditions. Wang Zhaoyang [
17] et al. changed the level of water level in the model, revealing the correlation between the change of groundwater level and the change rule of pore water in soil in the test. The negative pressure of unsaturated soil increases under the action of rainfall and loading, indicating that the change of pore water pressure is related to the water content in soil. Zeng Qiang [
18] compared and analyzed influencing factors such as pore water pressure, volume water content and shear stress of slope under rainfall conditions, and concluded that: Under the condition of constant rainfall duration, with the increase of rainfall intensity, the changes of shear strain and displacement of slope surface also increase, and the shear strain of slope soil gradually moves inward and backward, especially at the foot of slope where stress concentration is obvious. The increase of shear strain will cause the deterioration of slope instability.
At present, scholars at home and abroad have conducted in-depth research on MICP reinforced sand body, but the research on coastal fine sand is insufficient, and the research on solidified Marine fine sand is still few. Among all kinds of research results, most of the reinforcement methods adopted in the study are except single-channel grouting reinforcement, mixing reinforcement and direct irrigation, and there is little research on sprinkler irrigation reinforcement. This method can maximize the contact between bacterial liquid and air, and vaporize bacterial liquid, which can increase the contact area with sand samples, induce the generation of a large number of calcium carbonate crystals, and improve the reinforcement effect. There are few studies on the sandy slope reinforced by MICP under the action of rainfall, so it is necessary to further analyze the related factors affecting the reinforcement effect of the water solubility of calcium carbonate generated after reinforcement when the water content is high, and the particle connectivity under high pore water pressure also needs to be studied.
Based on microbial grouting to strengthen the slope, this study applied the microbial mortar generated by microbial grouting to the slope reinforcement, and obtained better microbial grouting data through the grouting test. The comparison of pore water pressure parameters and flow slip morphology of soil samples after grouting is made. It is comprehensively evaluated that the microbial mortar slope after grouting has better water stability and erosion resistance under the action of heavy rainfall, which improves the safety factor of slope.
2. Test materials and devices
2.1. Test sandn
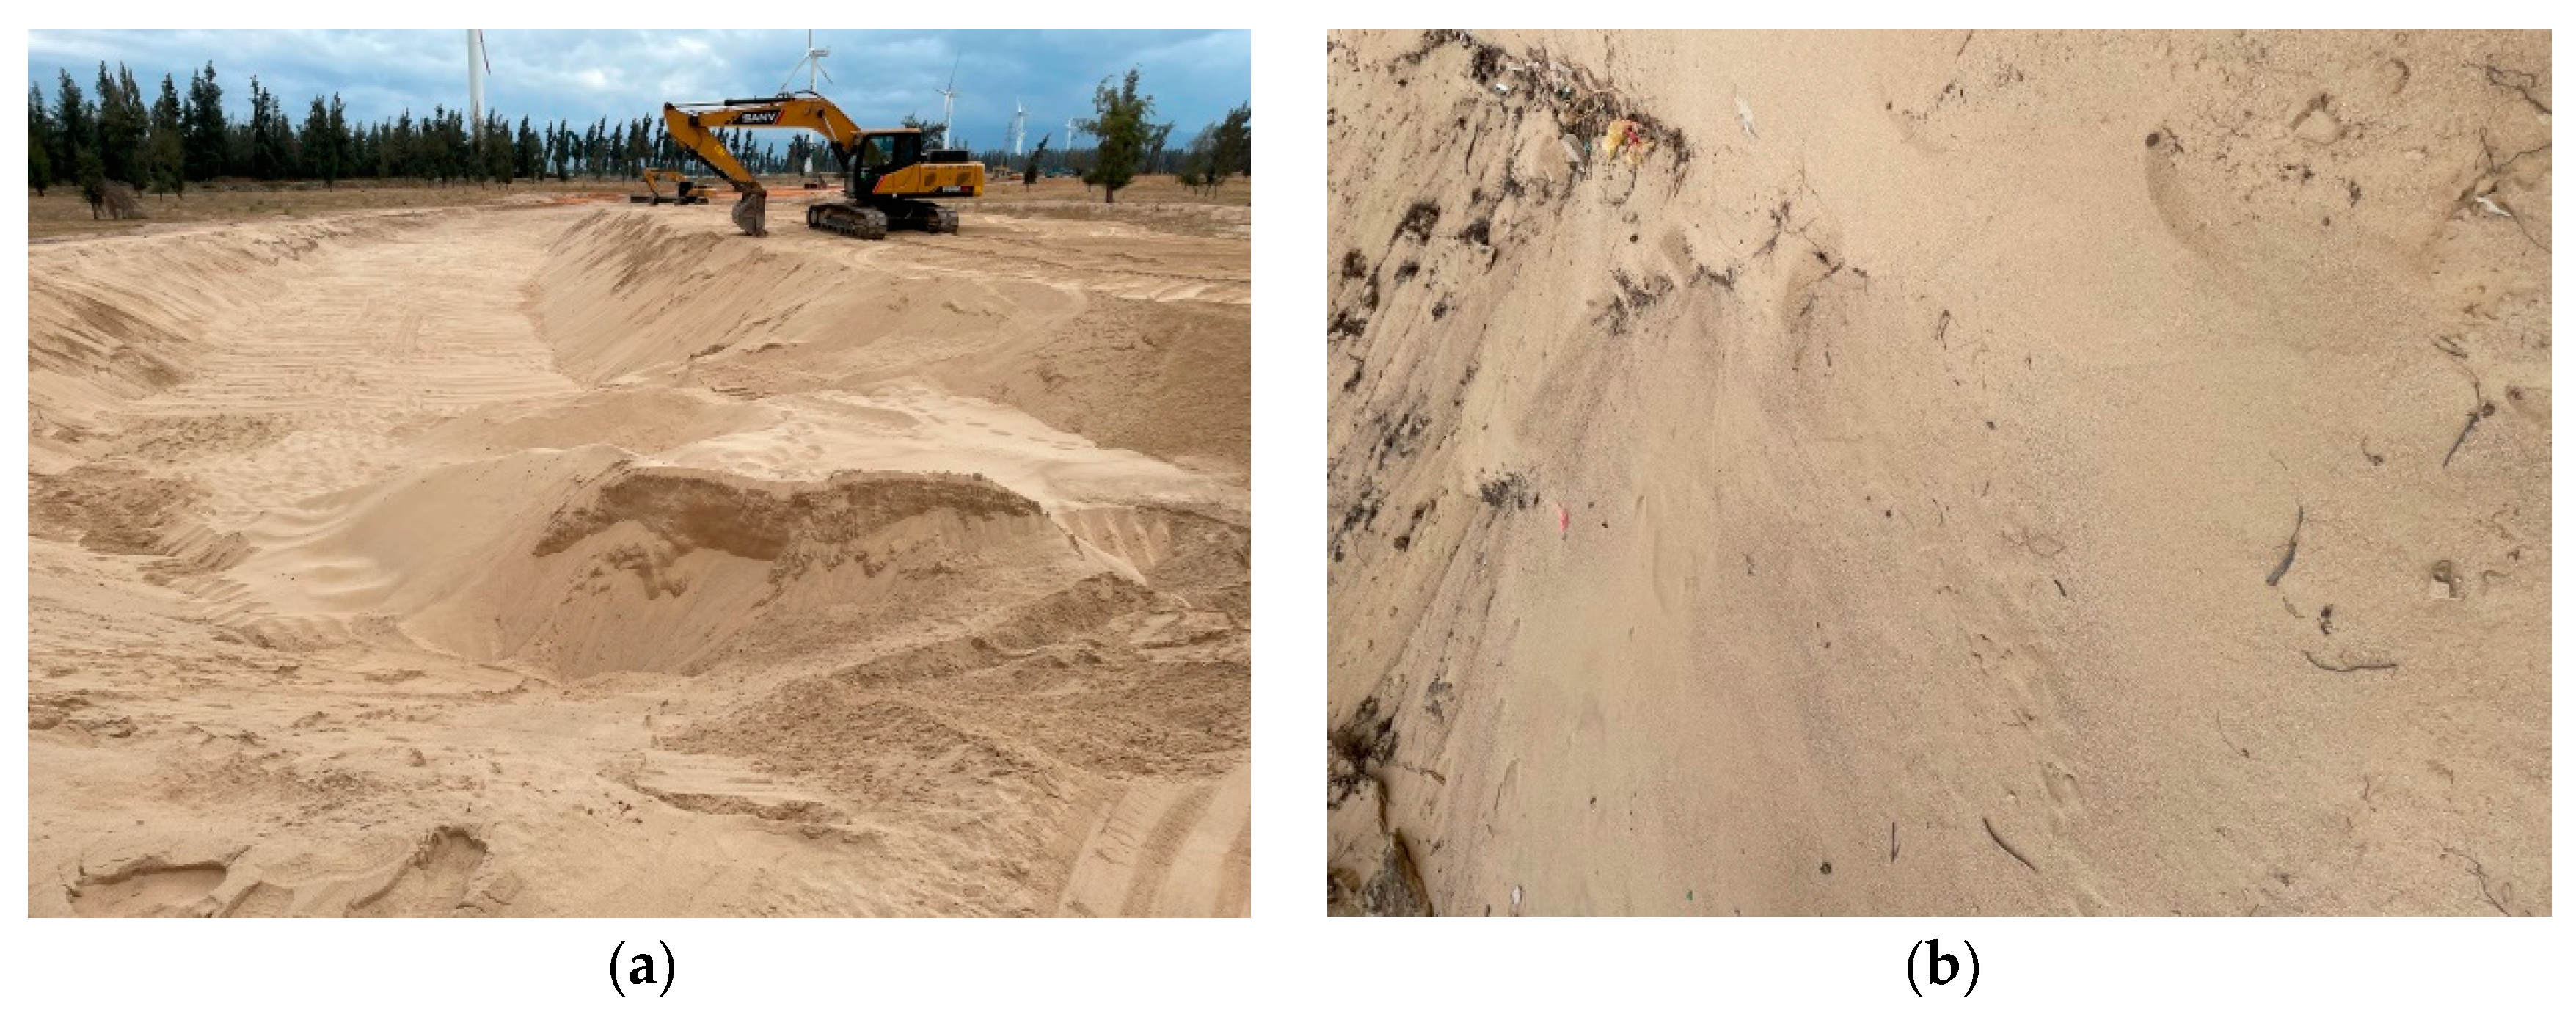
The medium fine sand used in the test was taken from the actual engineering site with good roundness. There were new road cuts outside the door, which belonged to typical beach terrace sand. The engineering environment was shown in the figure.
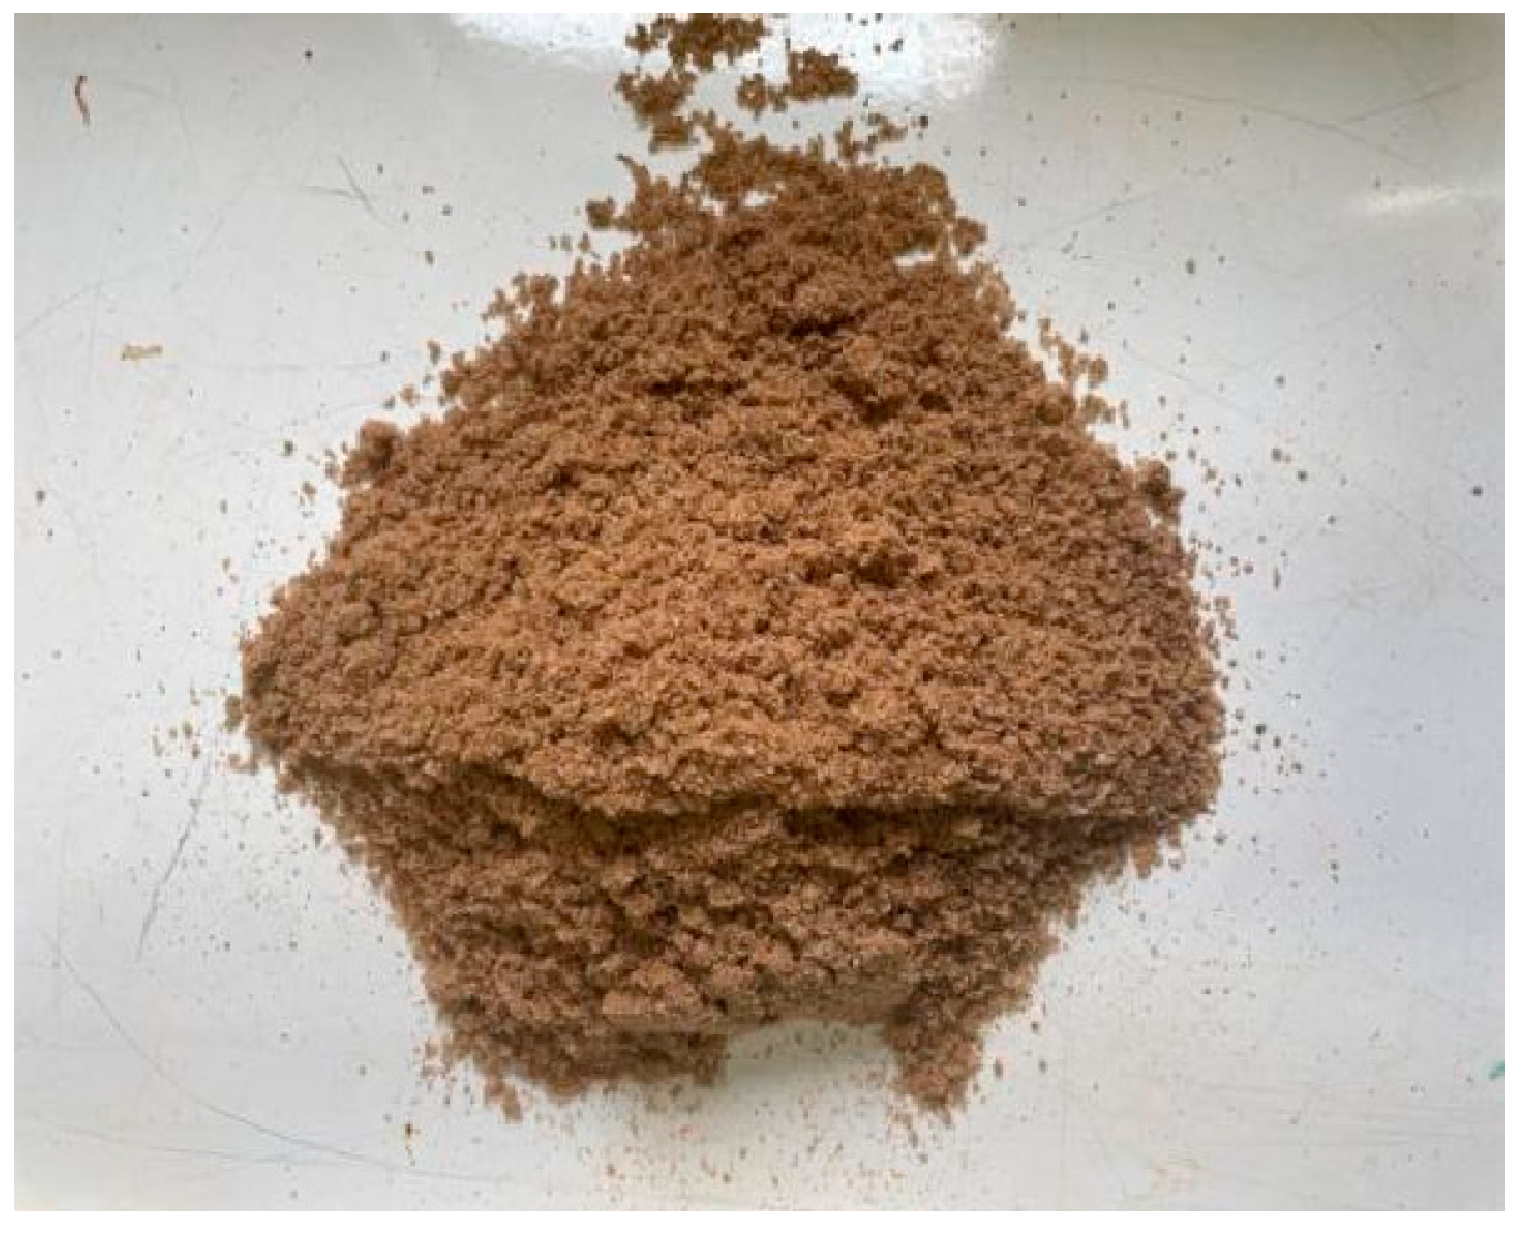
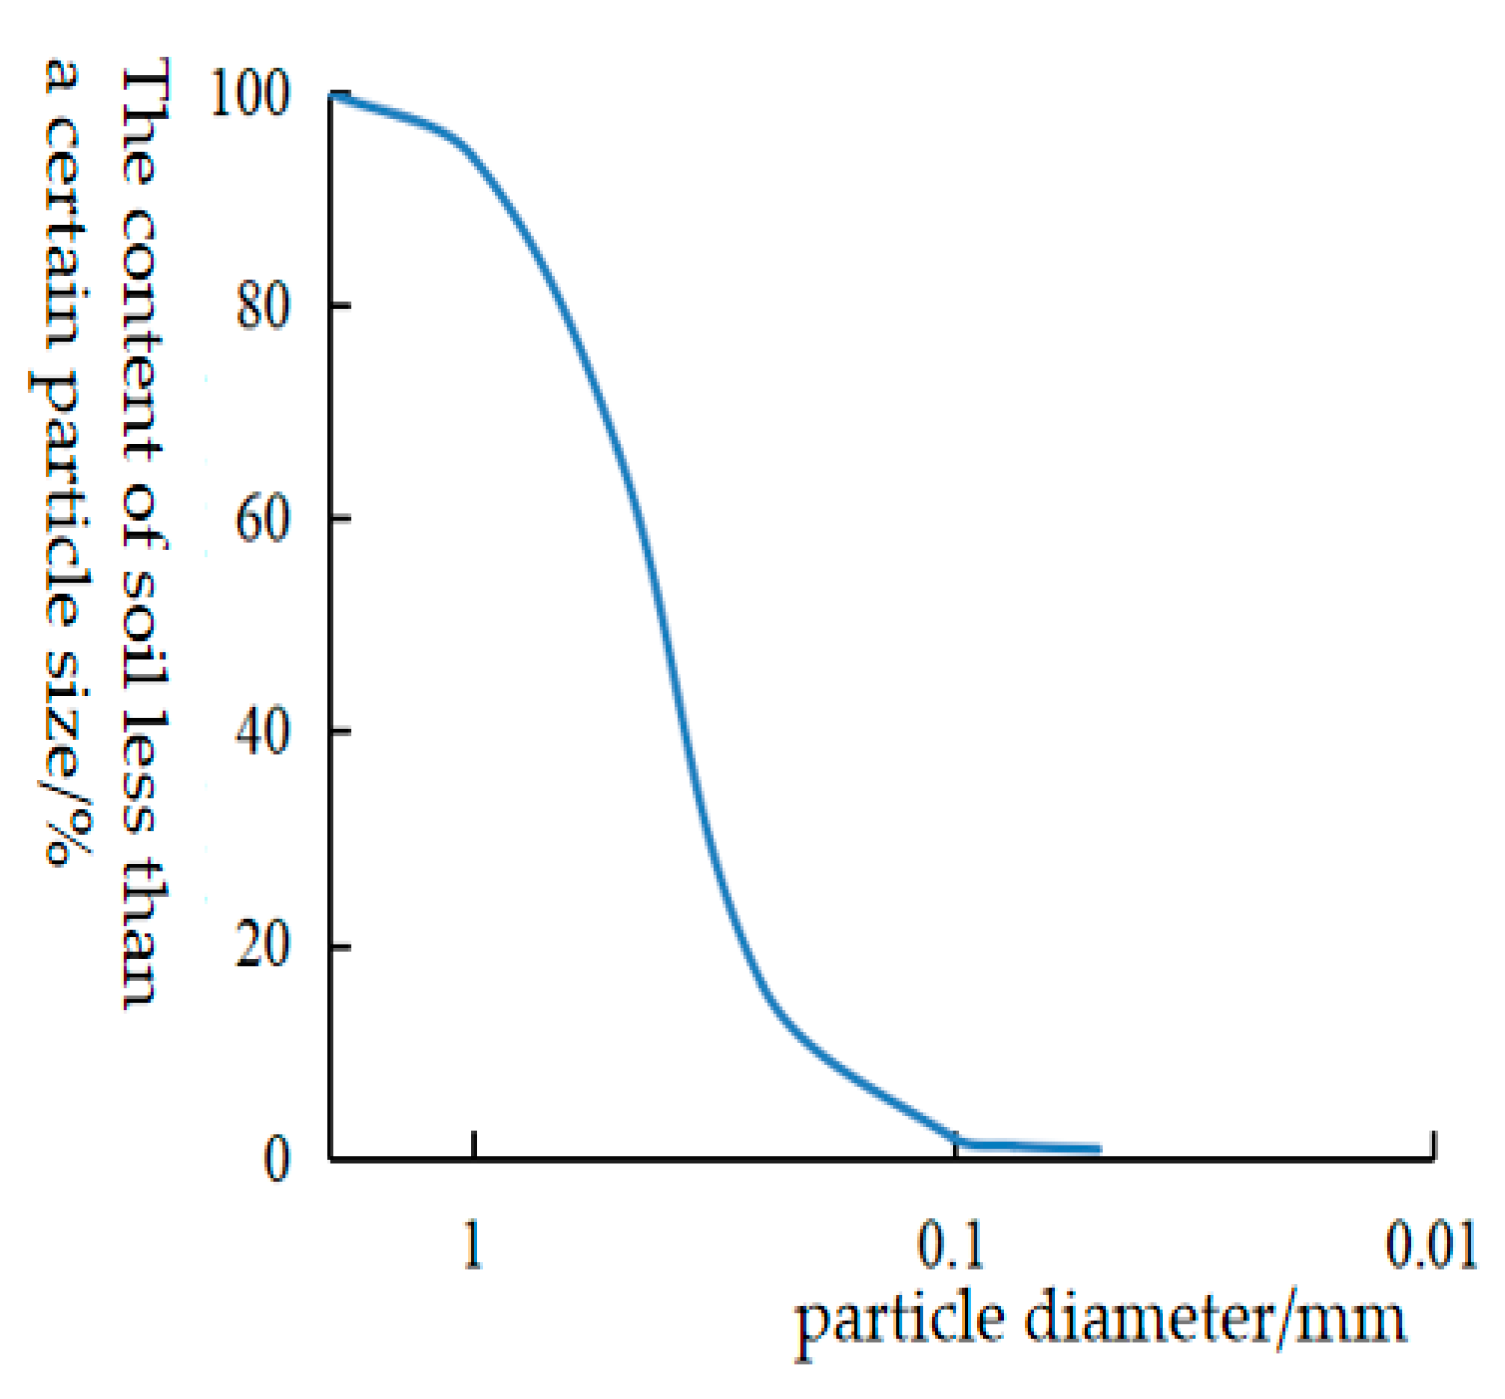
Indoor soil tests were carried out on the sampled soil according to the Geotechnical Test Regulations. The dry density of the sand sample was 1.64g/cm3;, the cohesion of the sand was very small, and the basic physical parameters and particle gradation curves were shown as the figure.
Figure 1.
Engineering field.
Figure 1.
Engineering field.
Figure 2.
In-situ sand sample.
Figure 2.
In-situ sand sample.
Figure 3.
Grain composition.
Figure 3.
Grain composition.
Table 1.
Sand property.
| Dry density(ρ)
|
Specific gravity(Gs) |
Moisture content(%) |
Poriness |
Cohesion(C) |
Internal friction angle(φ) |
| 1.64 |
2.66 |
15 |
0.29 |
0 |
34 |
2.2. Microbial material
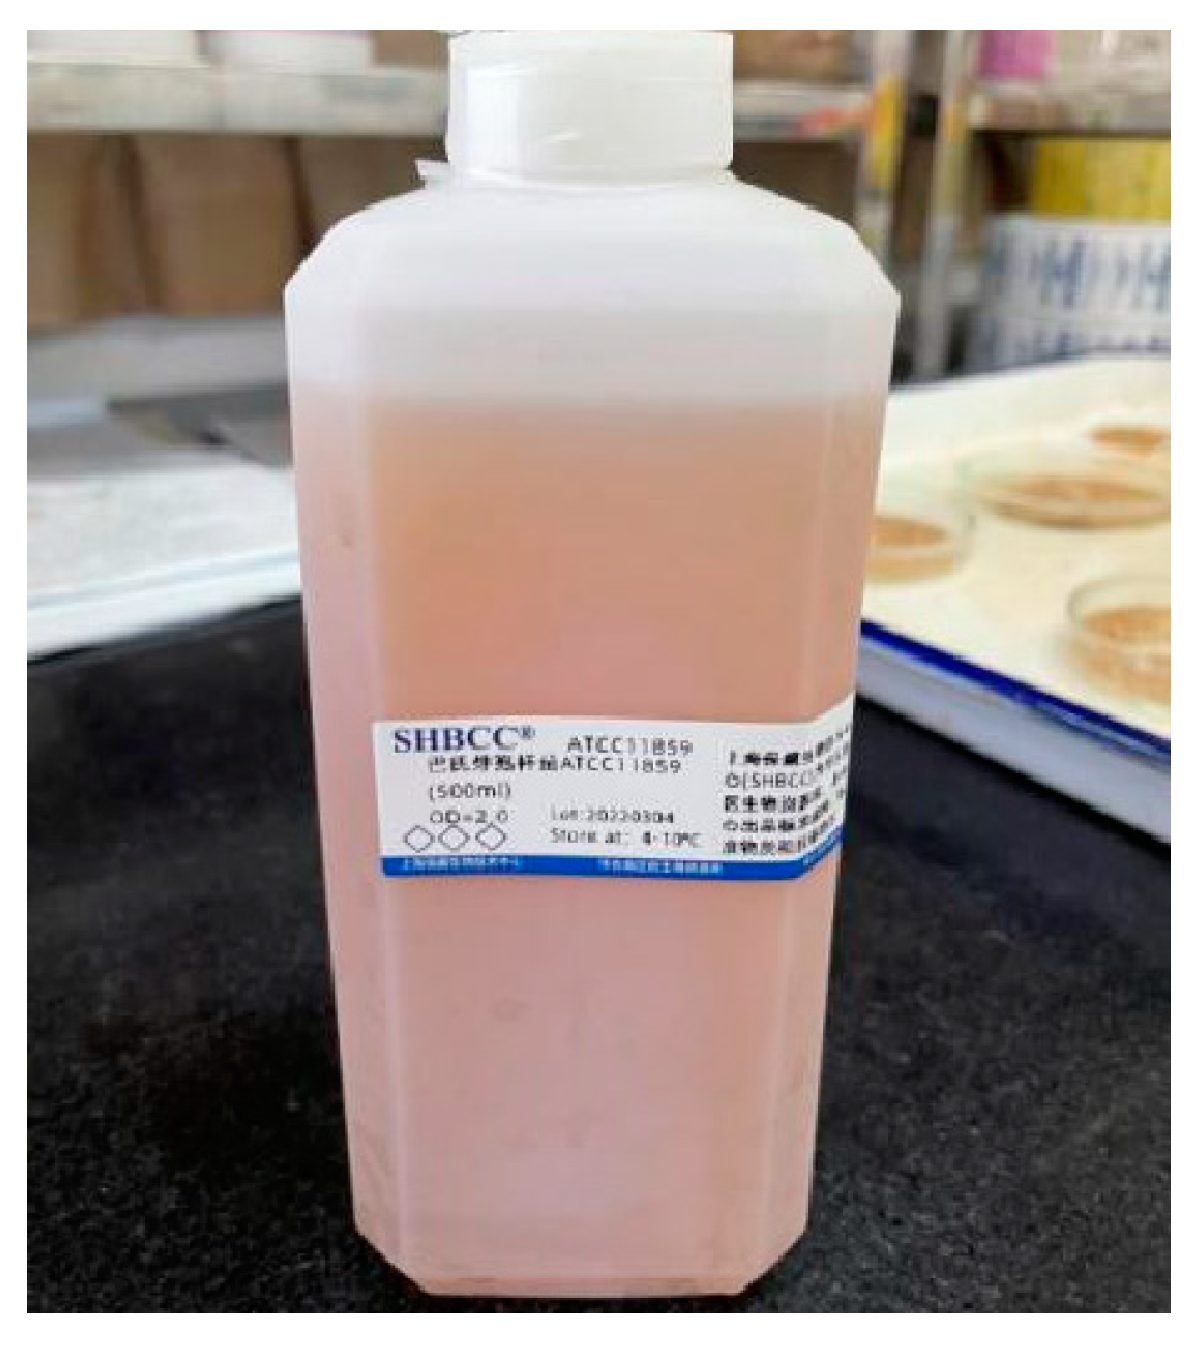
The microbial solidified strain used in the laboratory belongs to Bacillus, purchased from Shanghai Preservation Biotechnology Center and named ATCC11859. It was activated by freeze-dried powder in the biological laboratory into 500mL liquid bacterial solution with OD600=2.0.
Figure 4.
Bacterial stock solution.
Figure 4.
Bacterial stock solution.
Table 2.
Main components and contents of liquid medium.
Table 2.
Main components and contents of liquid medium.
| Composition |
Distilled water |
Bacteriological peptone |
Glucose |
NaCl |
| Content |
1L |
20g/L |
20g/L |
10g/L |
100mL of the prepared liquid medium was sterilized by steam at 120℃, then NaOH solution was added to adjust the pH value of the medium to 9.2, and 20mL1mol/L urea solution was added, and the cooled bacterial solution was dropped into the medium at 8% inoculum volume with a pipette gun. After inoculation, the strains were incubated in a shaking bed at 30℃ with a shaking frequency of 180r/m. After incubation for 27h, the OD600 of bacterial solution was 0.6~0.8 by spectrophotometer and urease activity was 400~600μs/cm by conductivity meter.
2.3. Testing apparatus
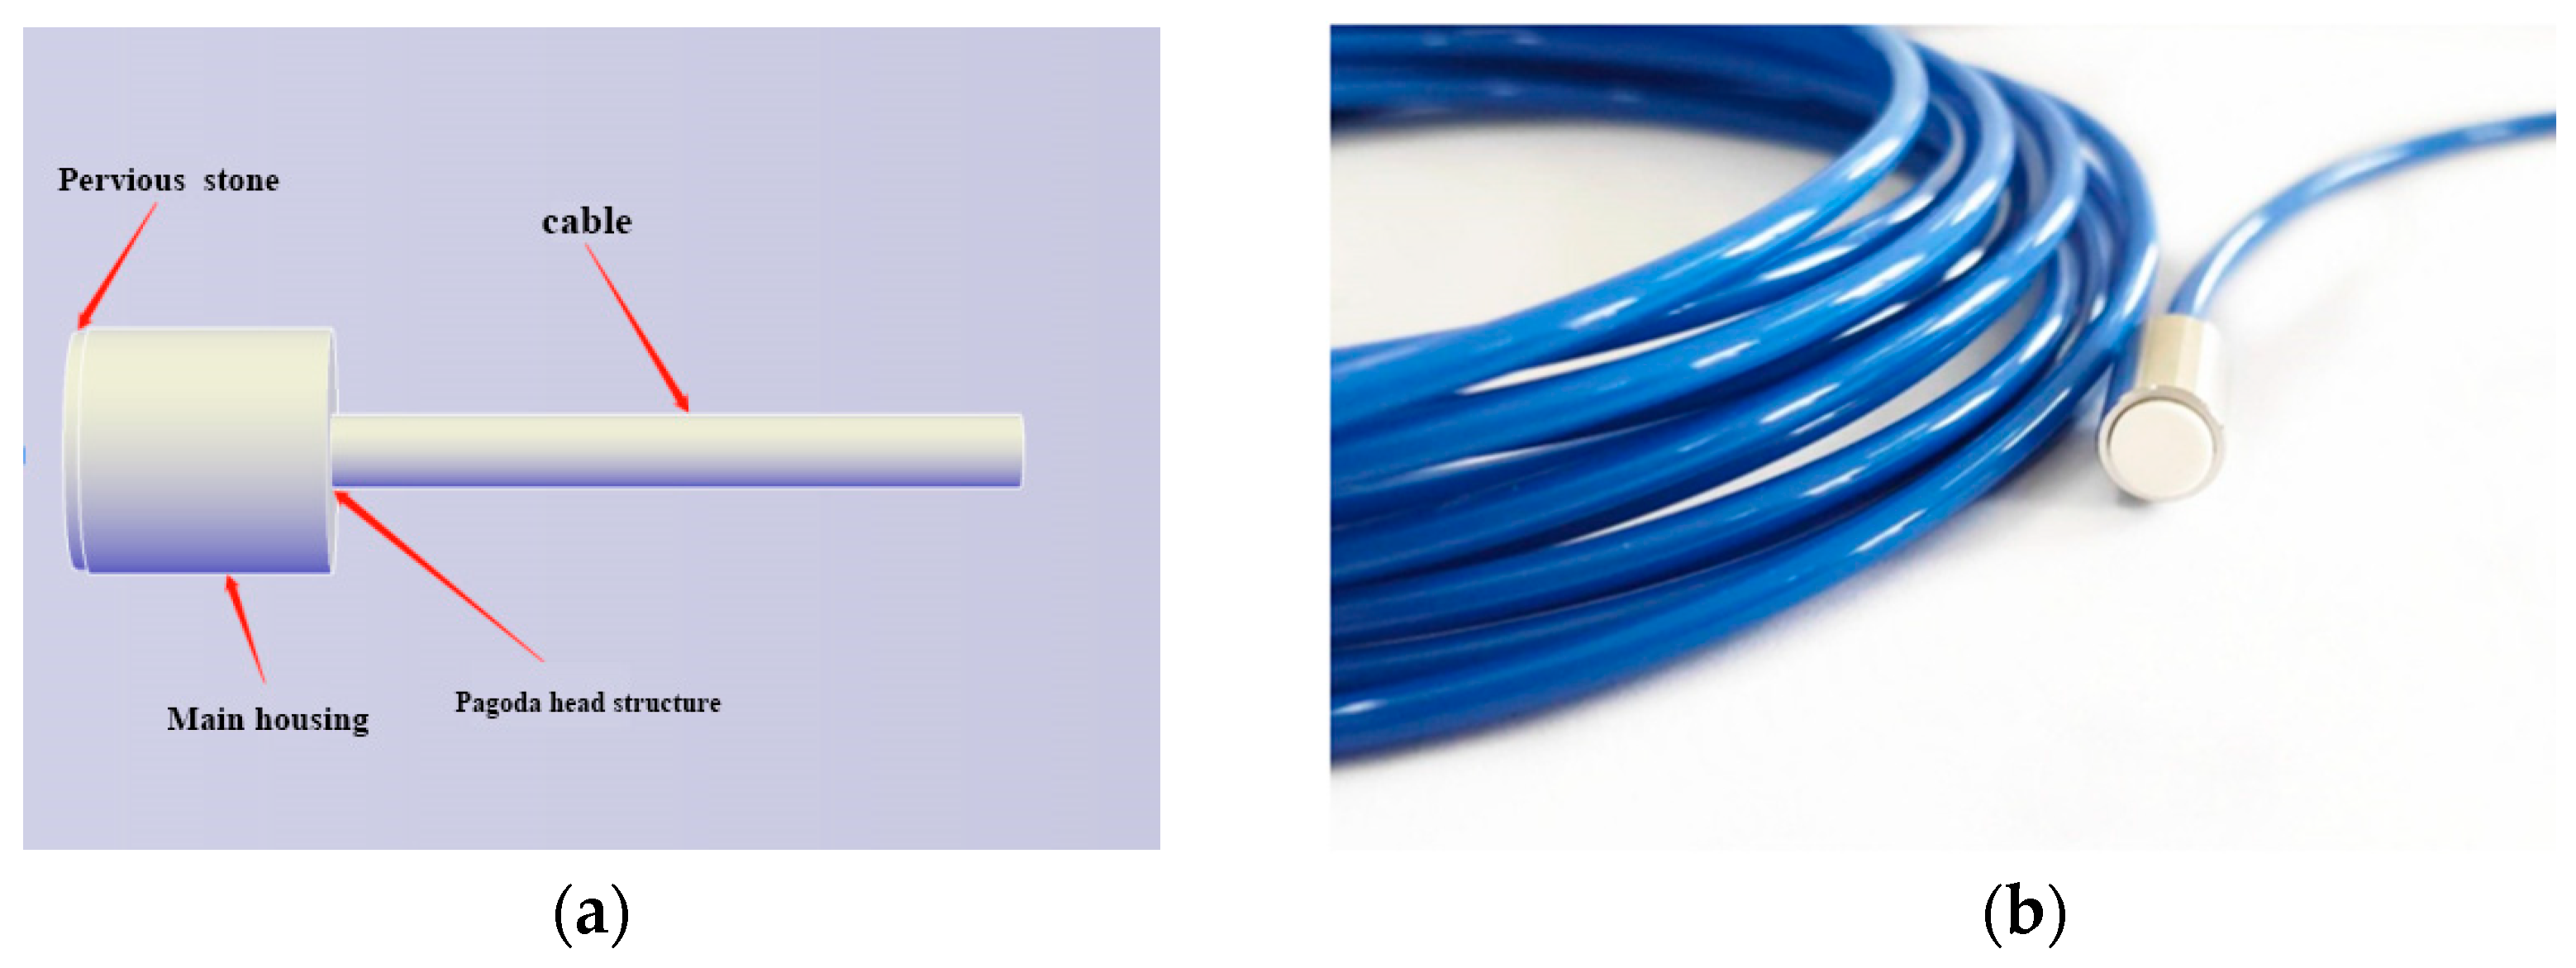
Static stress-strain data acquisition instrument DH3818Y manufactured by Donghua Company was used for the test. The instrument contains 16 channels. The pore water pressure sensor was purchased from Harbin Dayigangzhen Technology Co., LTD., whose full name is SDYH-DSPP-1 integrated miniature osmotic pressure sensor, which can measure negative pressure with a range of -50~50kPa (piezoresissive type). It is developed on the basis of international standard sensors to monitor and measure the dynamic pore pressure changes in the slope rainfall model, as shown in
Figure 5. The measured signal of the sensor represents the change of pore water pressure by the voltage change rate, and the calibration coefficient is shown in
Table 3.
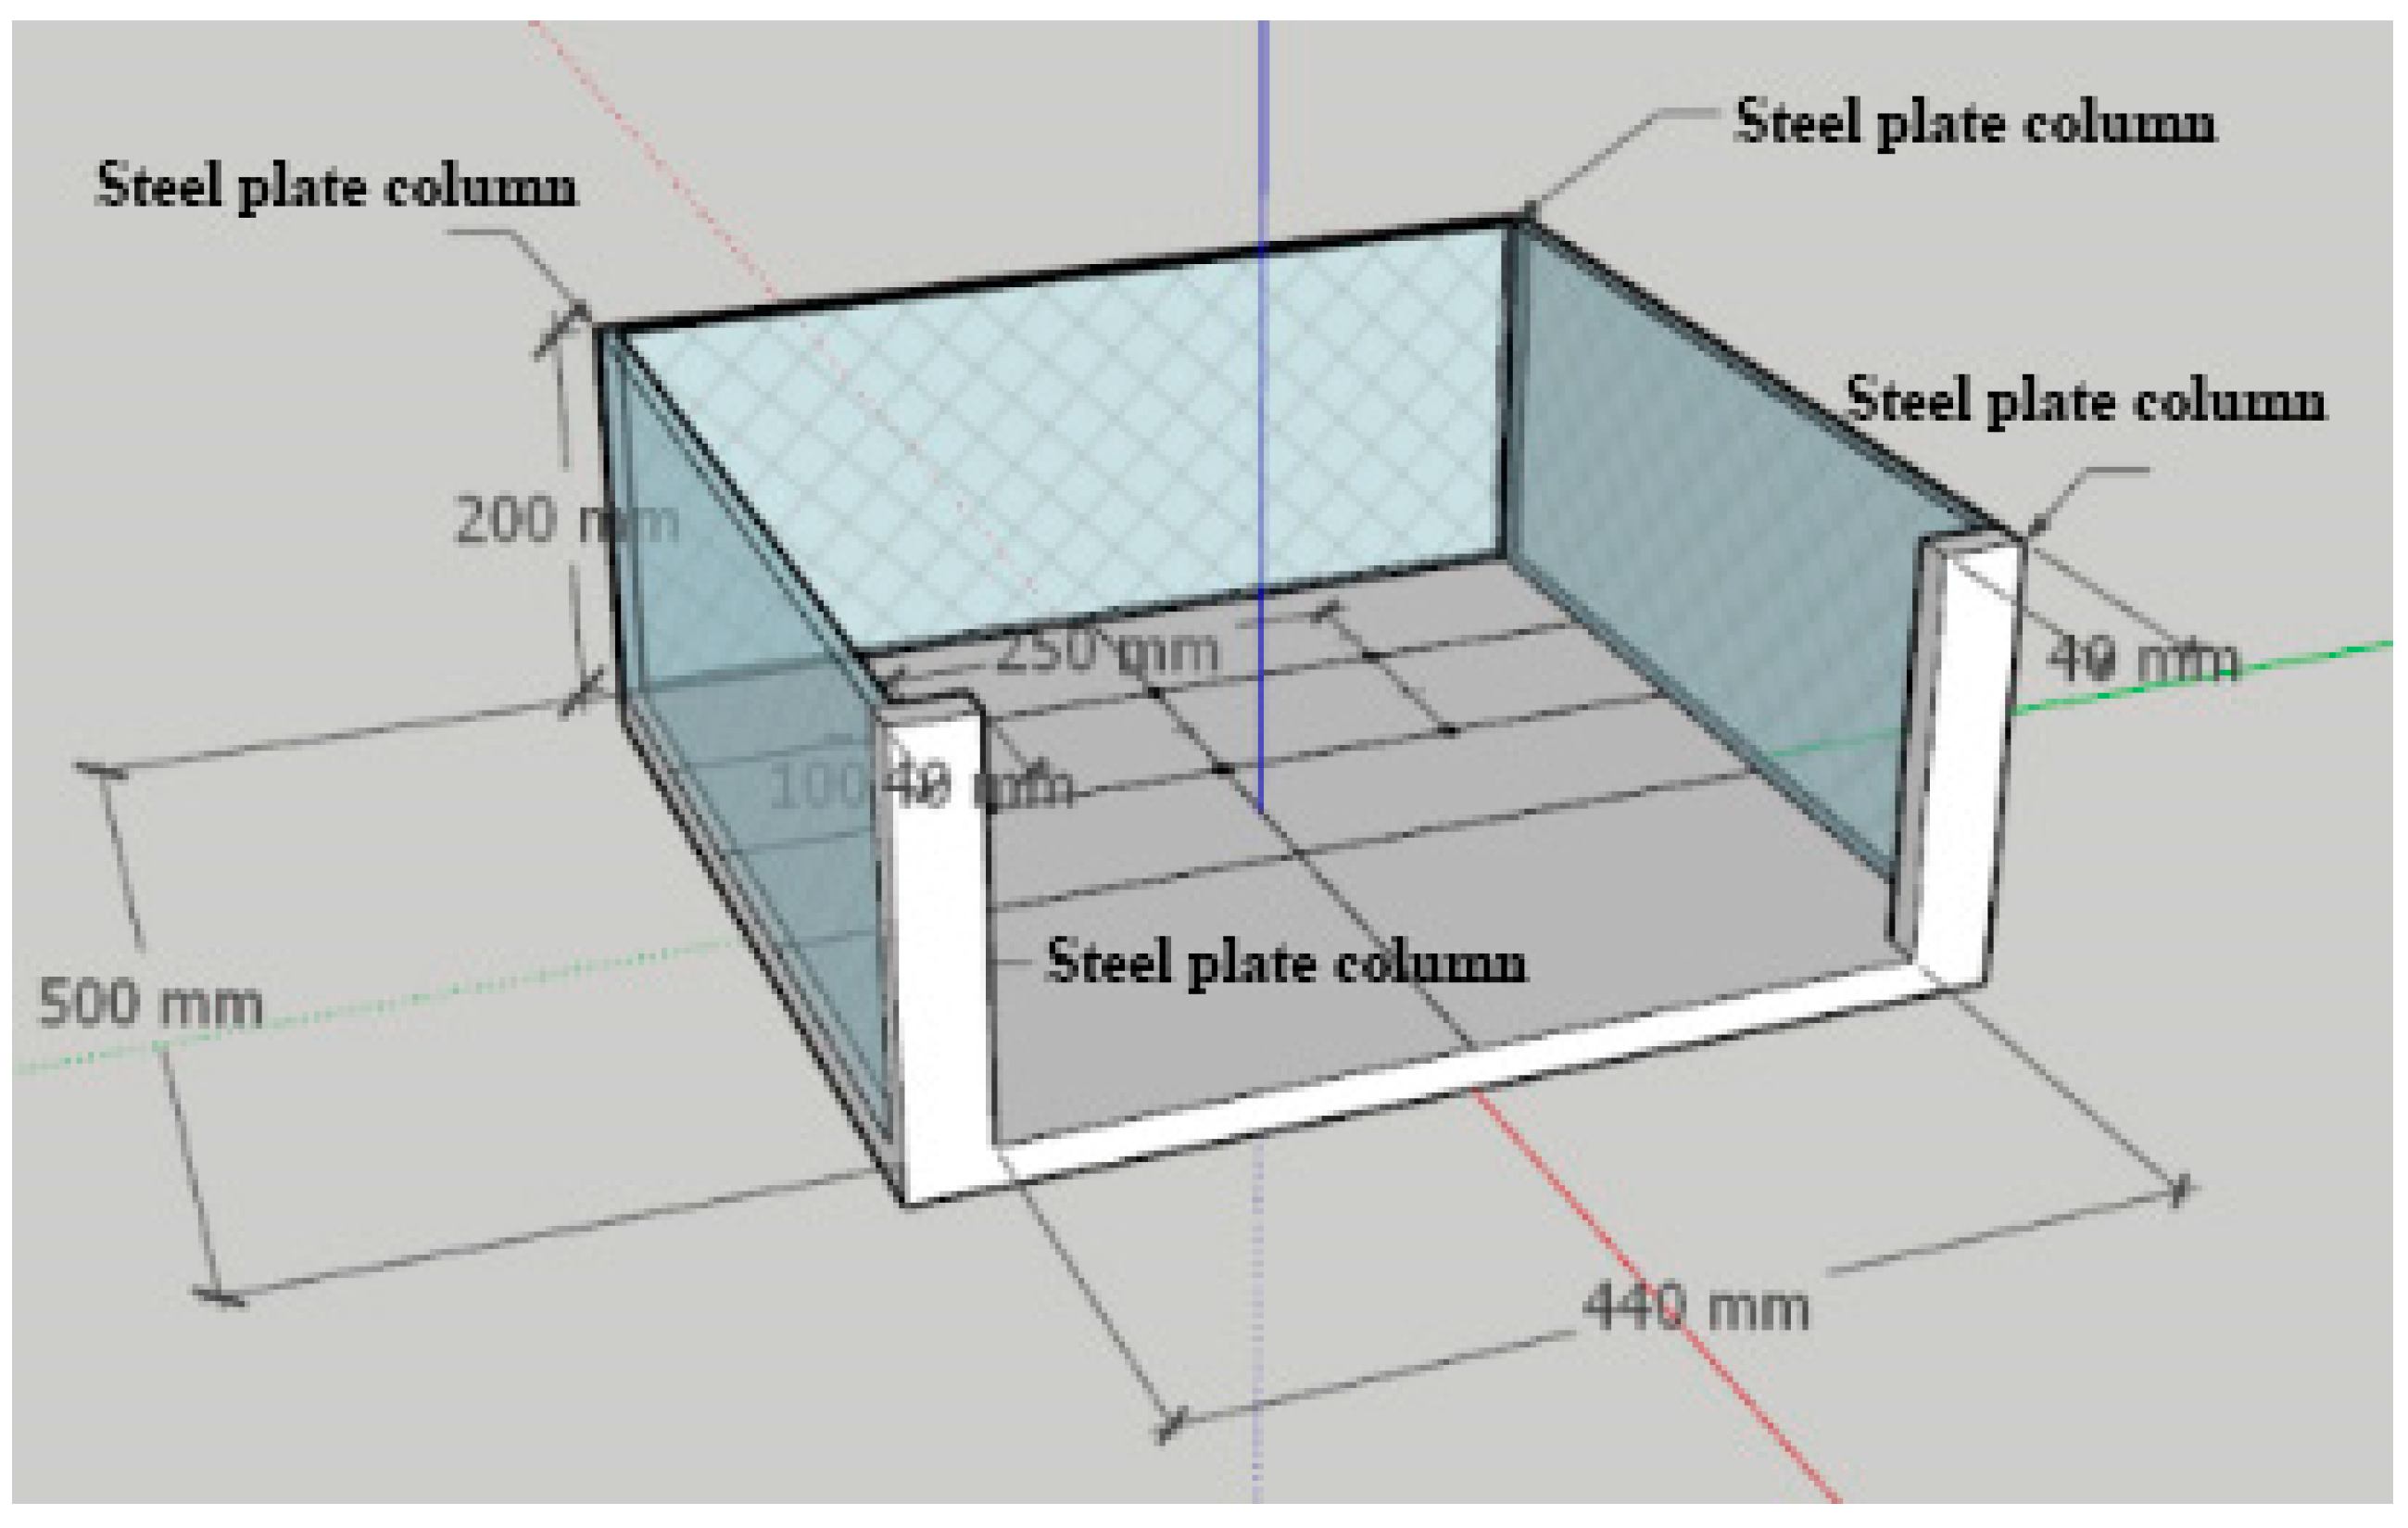
The overall size of the model box is shown in
Figure 6, with length, width and height of 500mm, 500mm and 200mm respectively. Three sides are 10mm thick toughened glass, the bottom is 5mm thick steel plate, and four corners are steel plate columns. Six circular drainage holes with a diameter of 4mm are distributed at the bottom of the model, showing a 3×2 symmetrical distribution. The drainage holes should meet the basic demand of drainage, and the liquid at the bottom should not be redundant precipitated, which will affect the experimental effect.
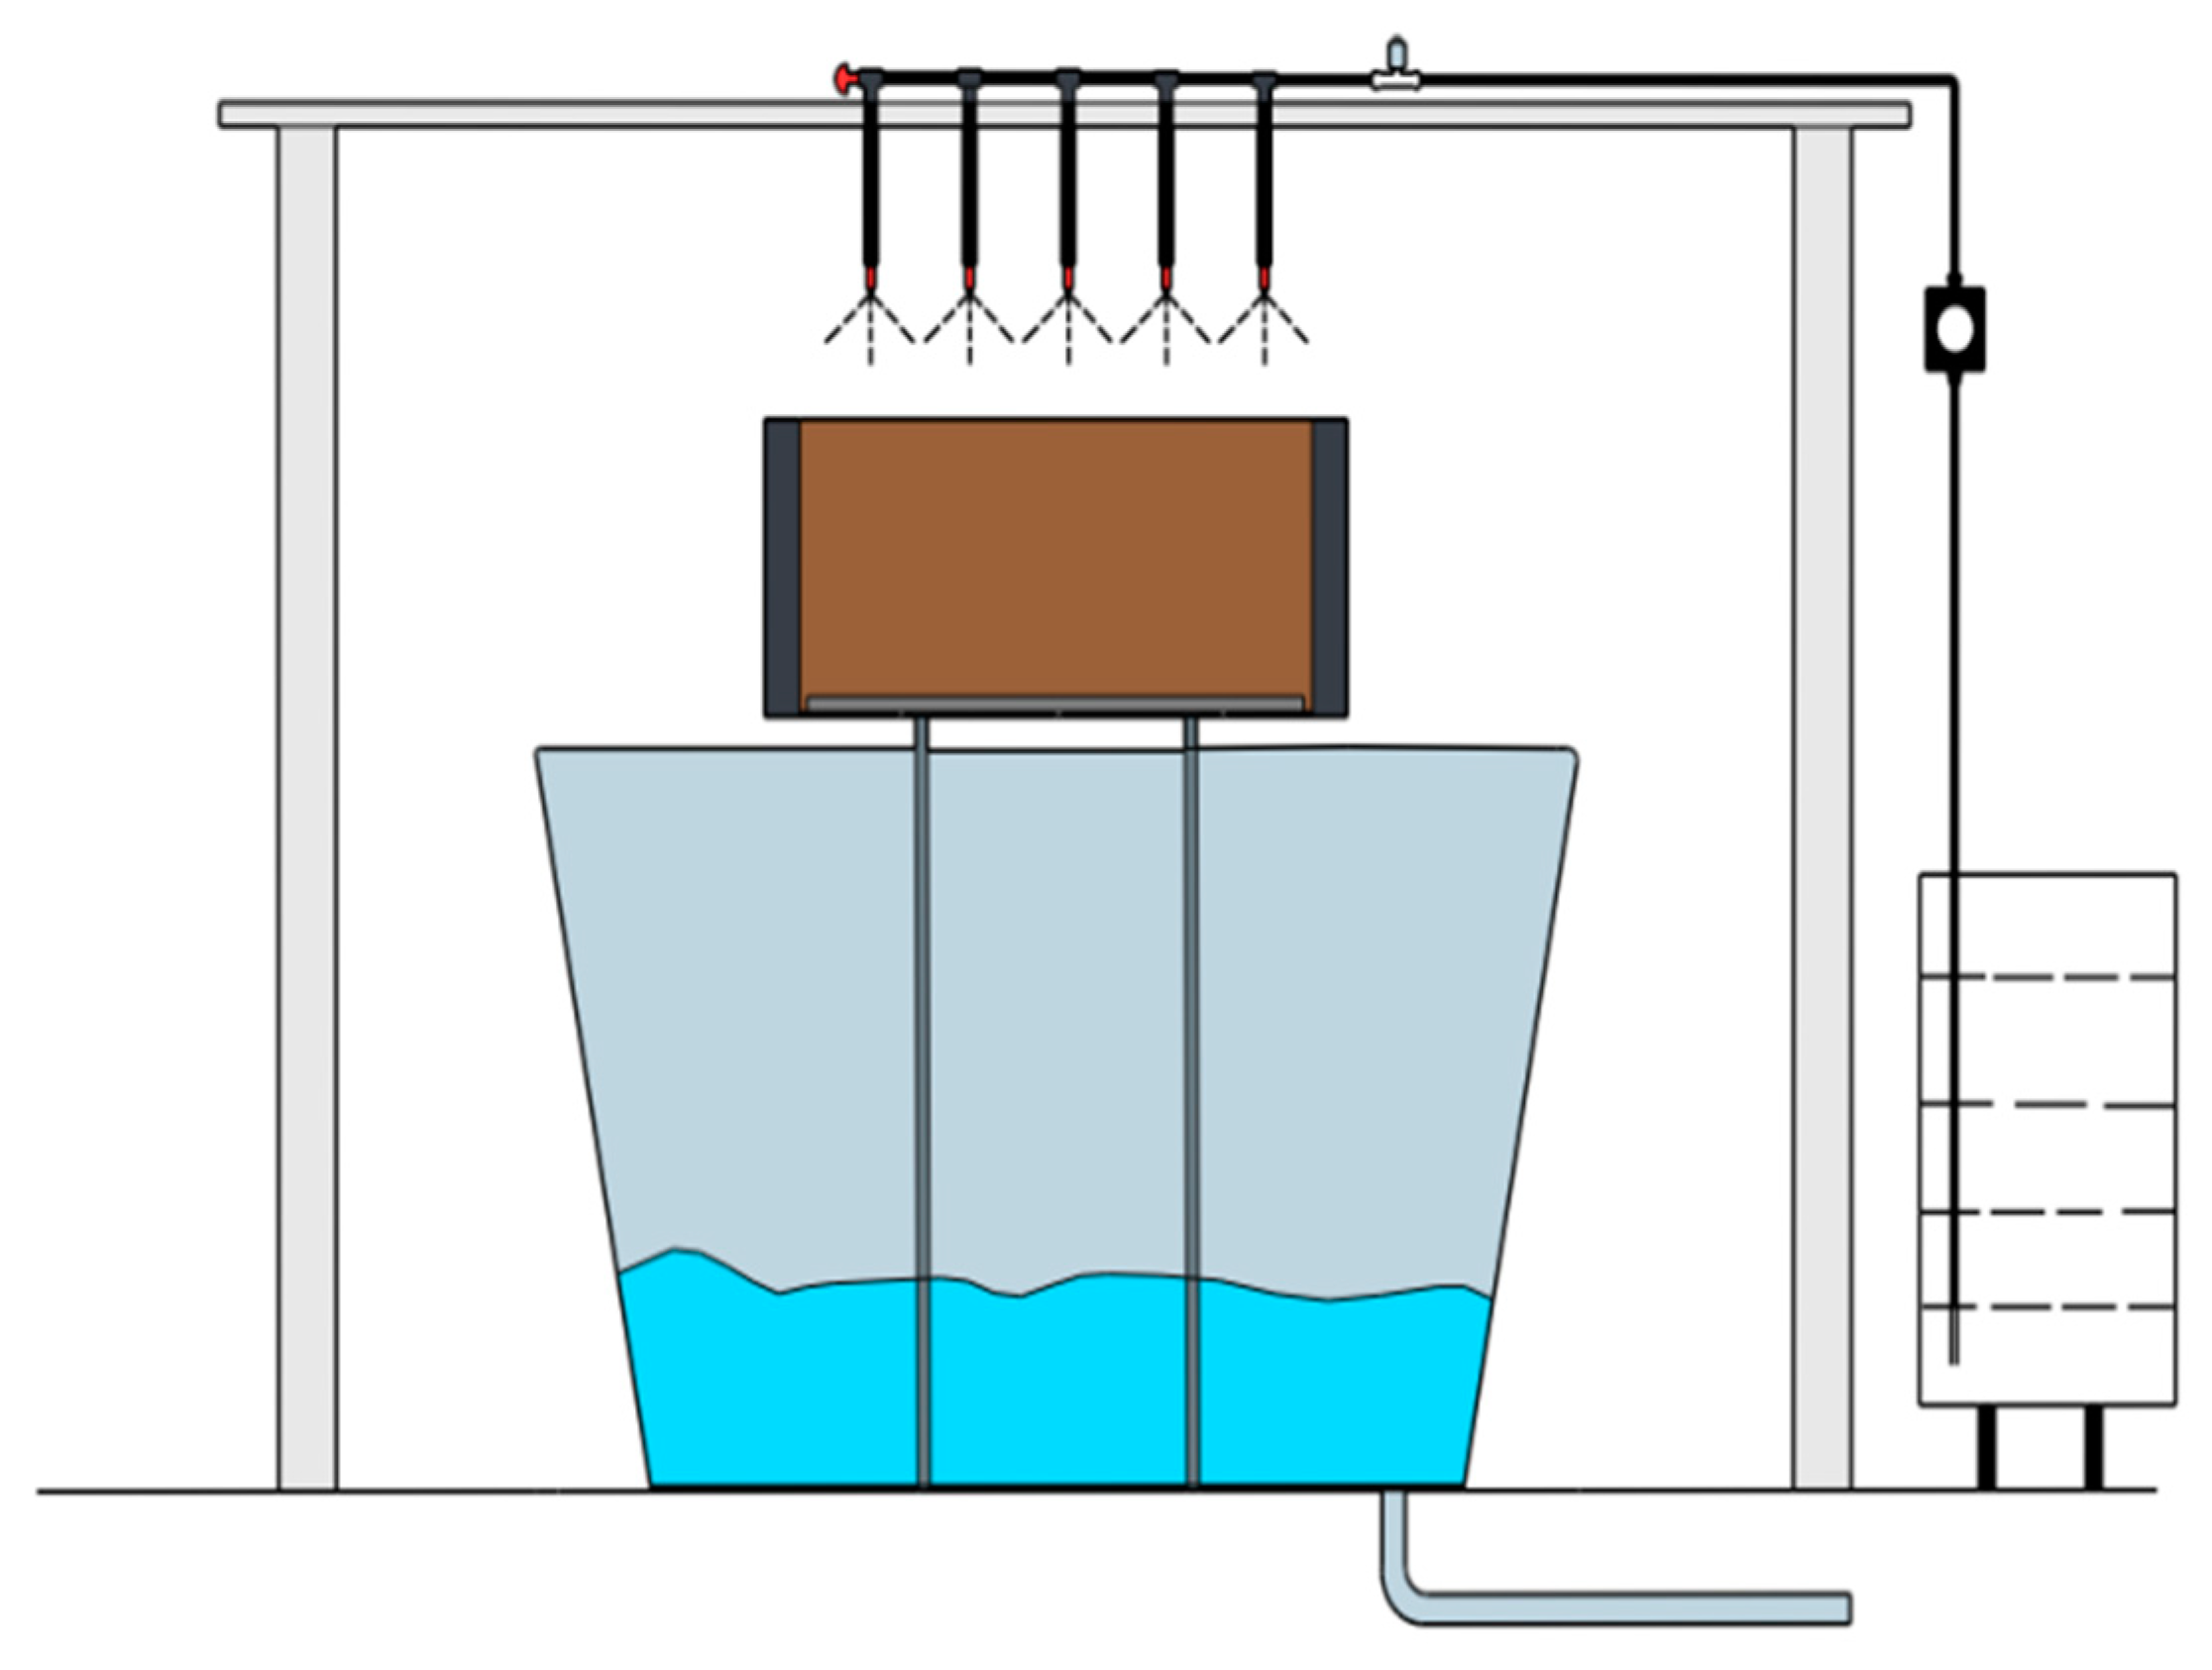
Based on the actual MICP curing condition, a special injection device consisting of a pump, five nozzles, a timer and a number of hoses was designed. The solution was vaporized by surface spray method to increase the reaction surface area of bacterial solution adhesion. The maximum power of the pump is 45W, and the flow parameter is 4L/min. The hose is fixed after winding the axis for 4 turns, and the 5 sprinkler heads are all on the same plane. The device can move left and right along the axis and rotate 360° to meet the spraying surface area required by the experiment. According to a certain number of spraying times and spraying volume, the fixed liquid, bacterial liquid and cementing liquid are sprayed vertically to the slope, and the spraying device is 300mm away from the top of the slope. Different from the single-channel reinforcement method, the reinforcement time can be reduced to less than 1 minute, which greatly improves the reinforcement efficiency.
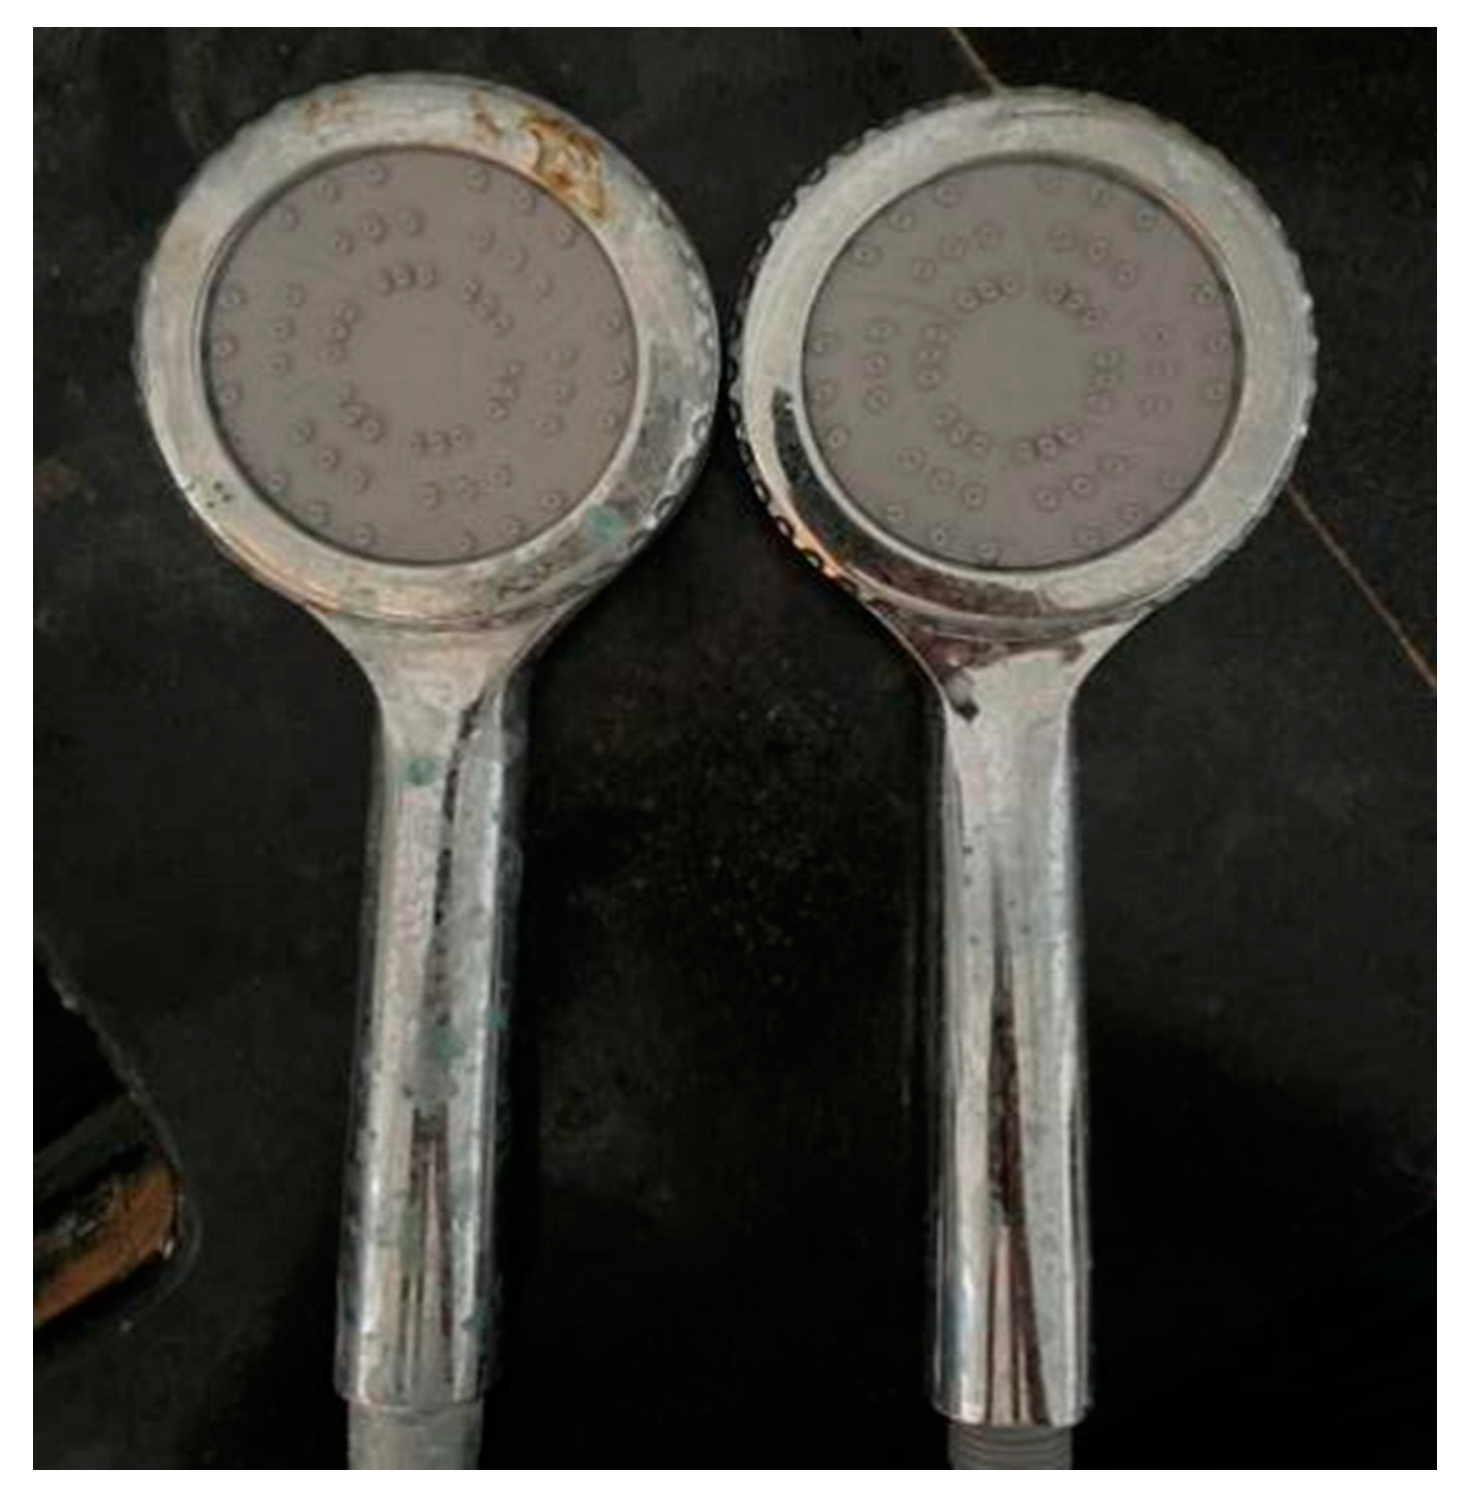
In order to simulate the scour effect, homemade double household shower device, through the adjustable tap control water flow. According to the weighing method to determine the test rainfall, the principle is to use a round mouth fitting with a diameter of 20cm placed under the spraying device, the spraying device is located at a height of 50cm above the fitting, through the simple device to determine the rainfall, every 30g of water means 1mm of rainfall.
Figure 8.
Double mounting device.
Figure 8.
Double mounting device.
2.4. Testing program
According to the size of the model box, a 1:25 scale model slope M-1 with a height of 200mm was prepared, and a 5m high cutting slope of the coastal highway was simulated according to a certain scale. After drying, the moisture content of the field sand sample with layered compaction (four layers) and sprinkling model is controlled at 20%, and the slope slope is 1:1. Basic parameters of the slope model are shown in
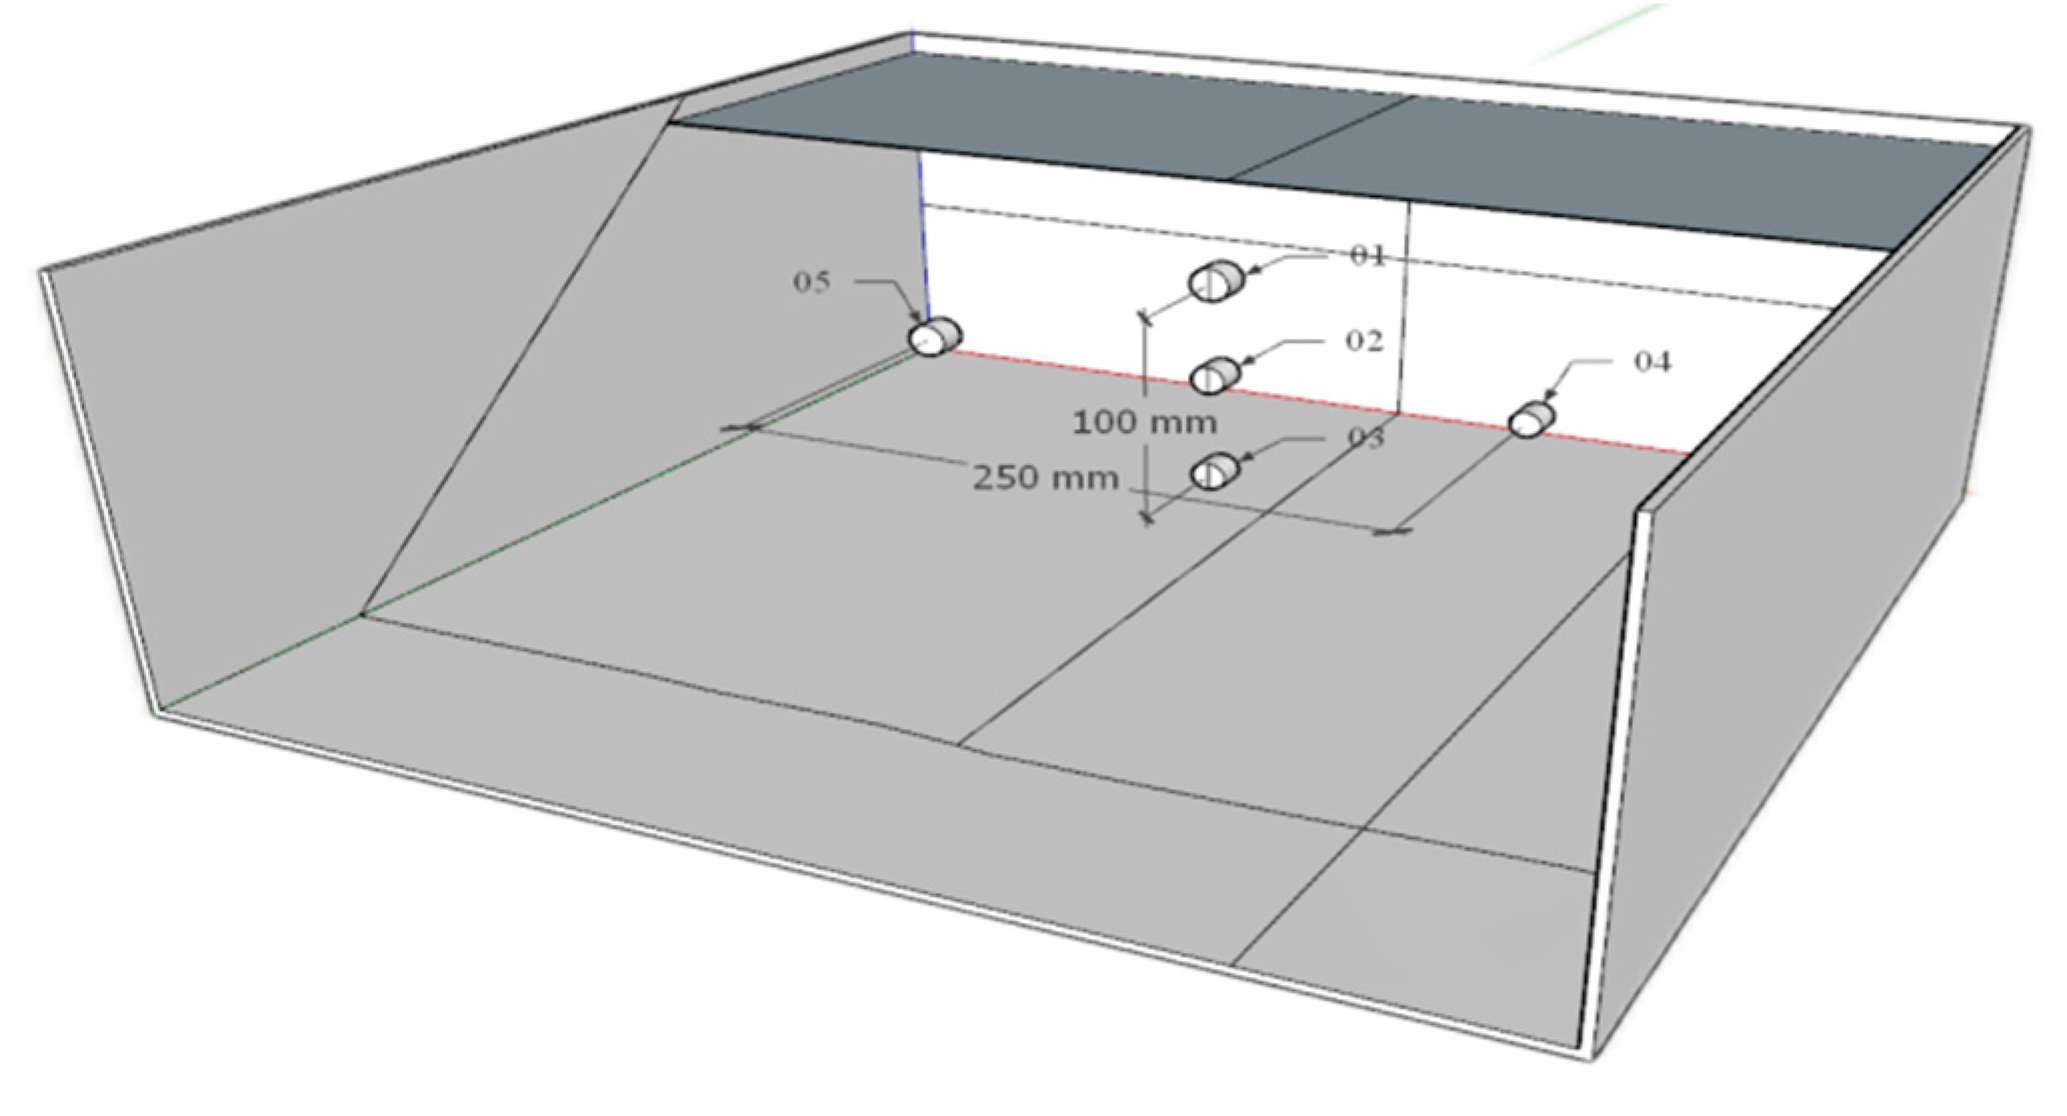
Table 4. During the test, the pore pressure change rule during the perfusion process and scouring action was measured by the embedded pore pressure sensor. The buried position of the sensor is shown in
Figure 9. 1, 2 and 3 are arranged vertically along the depth direction, separated by 50mm, and 2, 4 and 5 are located at the same horizontal line 100mm below the top surface of the slope.
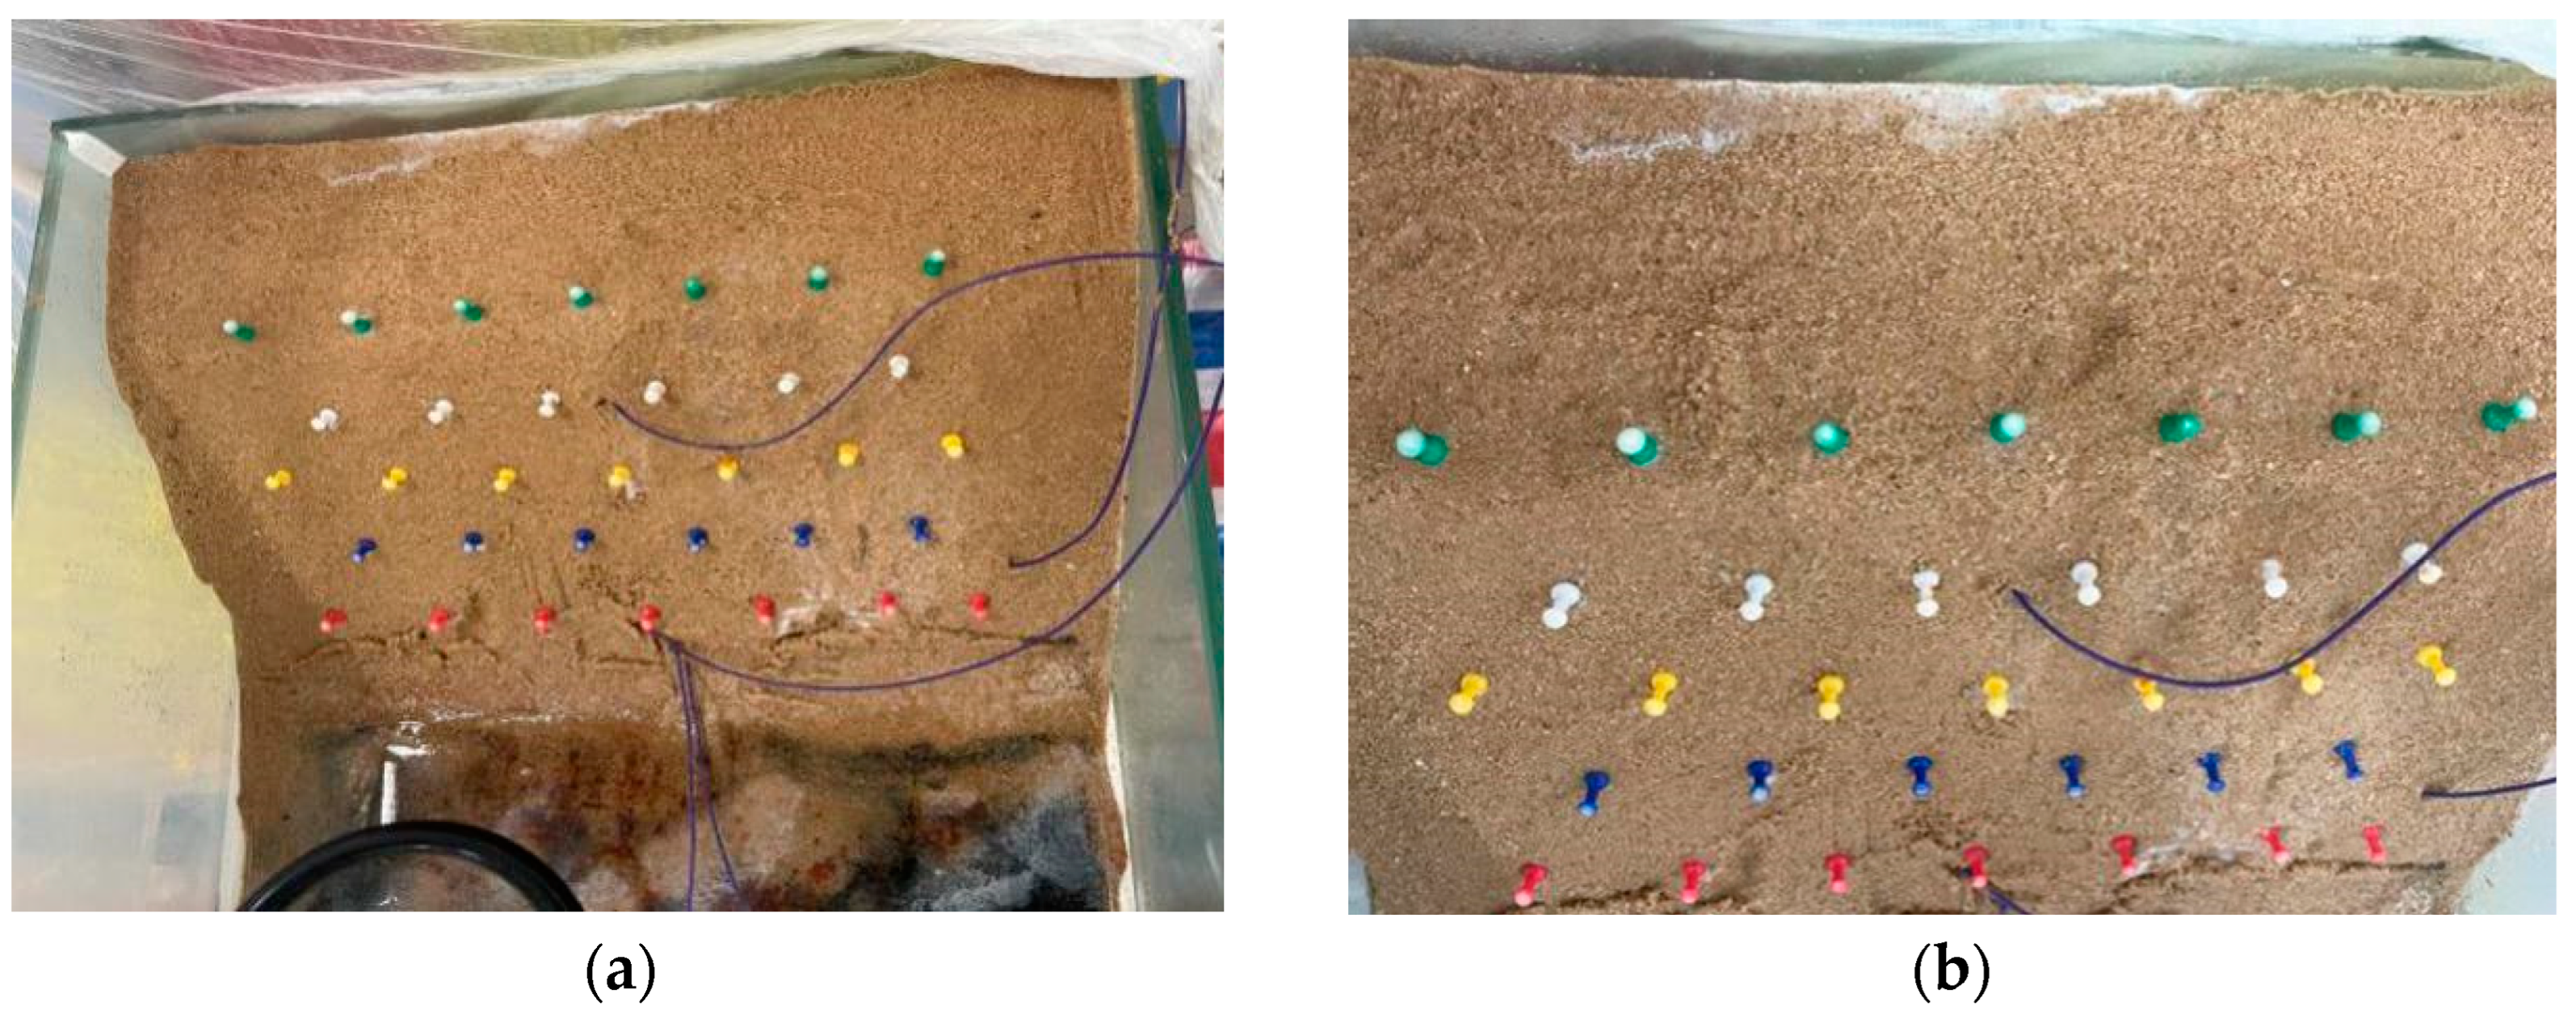
In order to facilitate the observation of displacement and deformation of the model under the action of scouring, displacement monitoring pushpins were arranged on the surface, with spacing of 5cm along the transverse direction and 5cm along the slope direction. A row of displacement monitoring pushpins was arranged at the top of the slope, which was located at the leading edge of the slope. Four rows were arranged on the slope to construct the thumbtack surface monitoring point system. The depth of the thumbtack into the soil was 5mm, and the model sand sample was not disturbed as far as possible, as shown in
Figure 10.
Cementing solution was selected with a mix ratio of 1:0.5 (CaCl2: urea). CaCl2 fixative solution with the same volume and concentration of 1M was first injected before bacterial solution was injected. The injection process of primary fixed solution + primary bacterial solution + primary cementing solution was defined as a set of rounds, and the three different solutions were injected into the sprinkler irrigation device in the order of fixed solution - bacterial solution - cementing solution, and the volume was shown in
Table 5. The M-1 model was strengthened by sprinkler irrigation in three rounds. The overall model is shown in
Figure 11.
3. Experimental analysis
3.1. Pore water pressure
The more loose particles in the model, the stronger the bacterial adsorption capacity. The sand sample with small particle size will affect the change of pore structure of the sand model, and the permeability coefficient is small. In the process of continuous reinforcement, the permeability coefficient k is weakened because the pores of the upper sand sample are gradually reduced [
19]. When bacillus liquid and fixed liquid flow in the sand sample model, pore water pressure in the pores will change with the seepage effect. In addition to surface runoff, part of the flow direction of water in the sand sample also shows infiltration effect [
20,
21]. After multiple rounds of reinforcement, the pores on the top surface, inclined surface and inside the sand sample model are filled and connected due to the formation of calcium carbonate particles. Pore water pressure sensor can be used to explore the changes of pore pressure during reinforcement and pore characteristics after multiple rounds of reinforcement. He Xiaoying, Li Dong et al. [
22] equipped debris flow two-phase bodies in the laboratory to observe the change rule of pore water in debris flow sediment reinforced by MICP, and found that calcium carbonate generated by MICP solidification was not easy to dissipate pore water pressure. The drainage consolidation test showed that when the sediment porosity was small, it was difficult to drain and consolidate. Li Xian proposed a theoretical formula for grouting capacity of sand with different permeability coefficients of MICP, which provides a reference for whether the soil is suitable for reinforcement by MICP method [
23].
The pore water pressure test was divided into two stages. In the first stage, the M-1 model was injected with several different volumes of fixed liquid and bacterial liquid, and the change rule of the internal pore water pressure was measured by the embedded pore water pressure sensor inside the slope. The second stage is to simulate a certain rainfall intensity under the action of a self-made rainfall device, and explore the change process of pore water pressure from initial moisture content to saturation of the entire sandy slope until its internal water pressure law becomes unstable [
24].
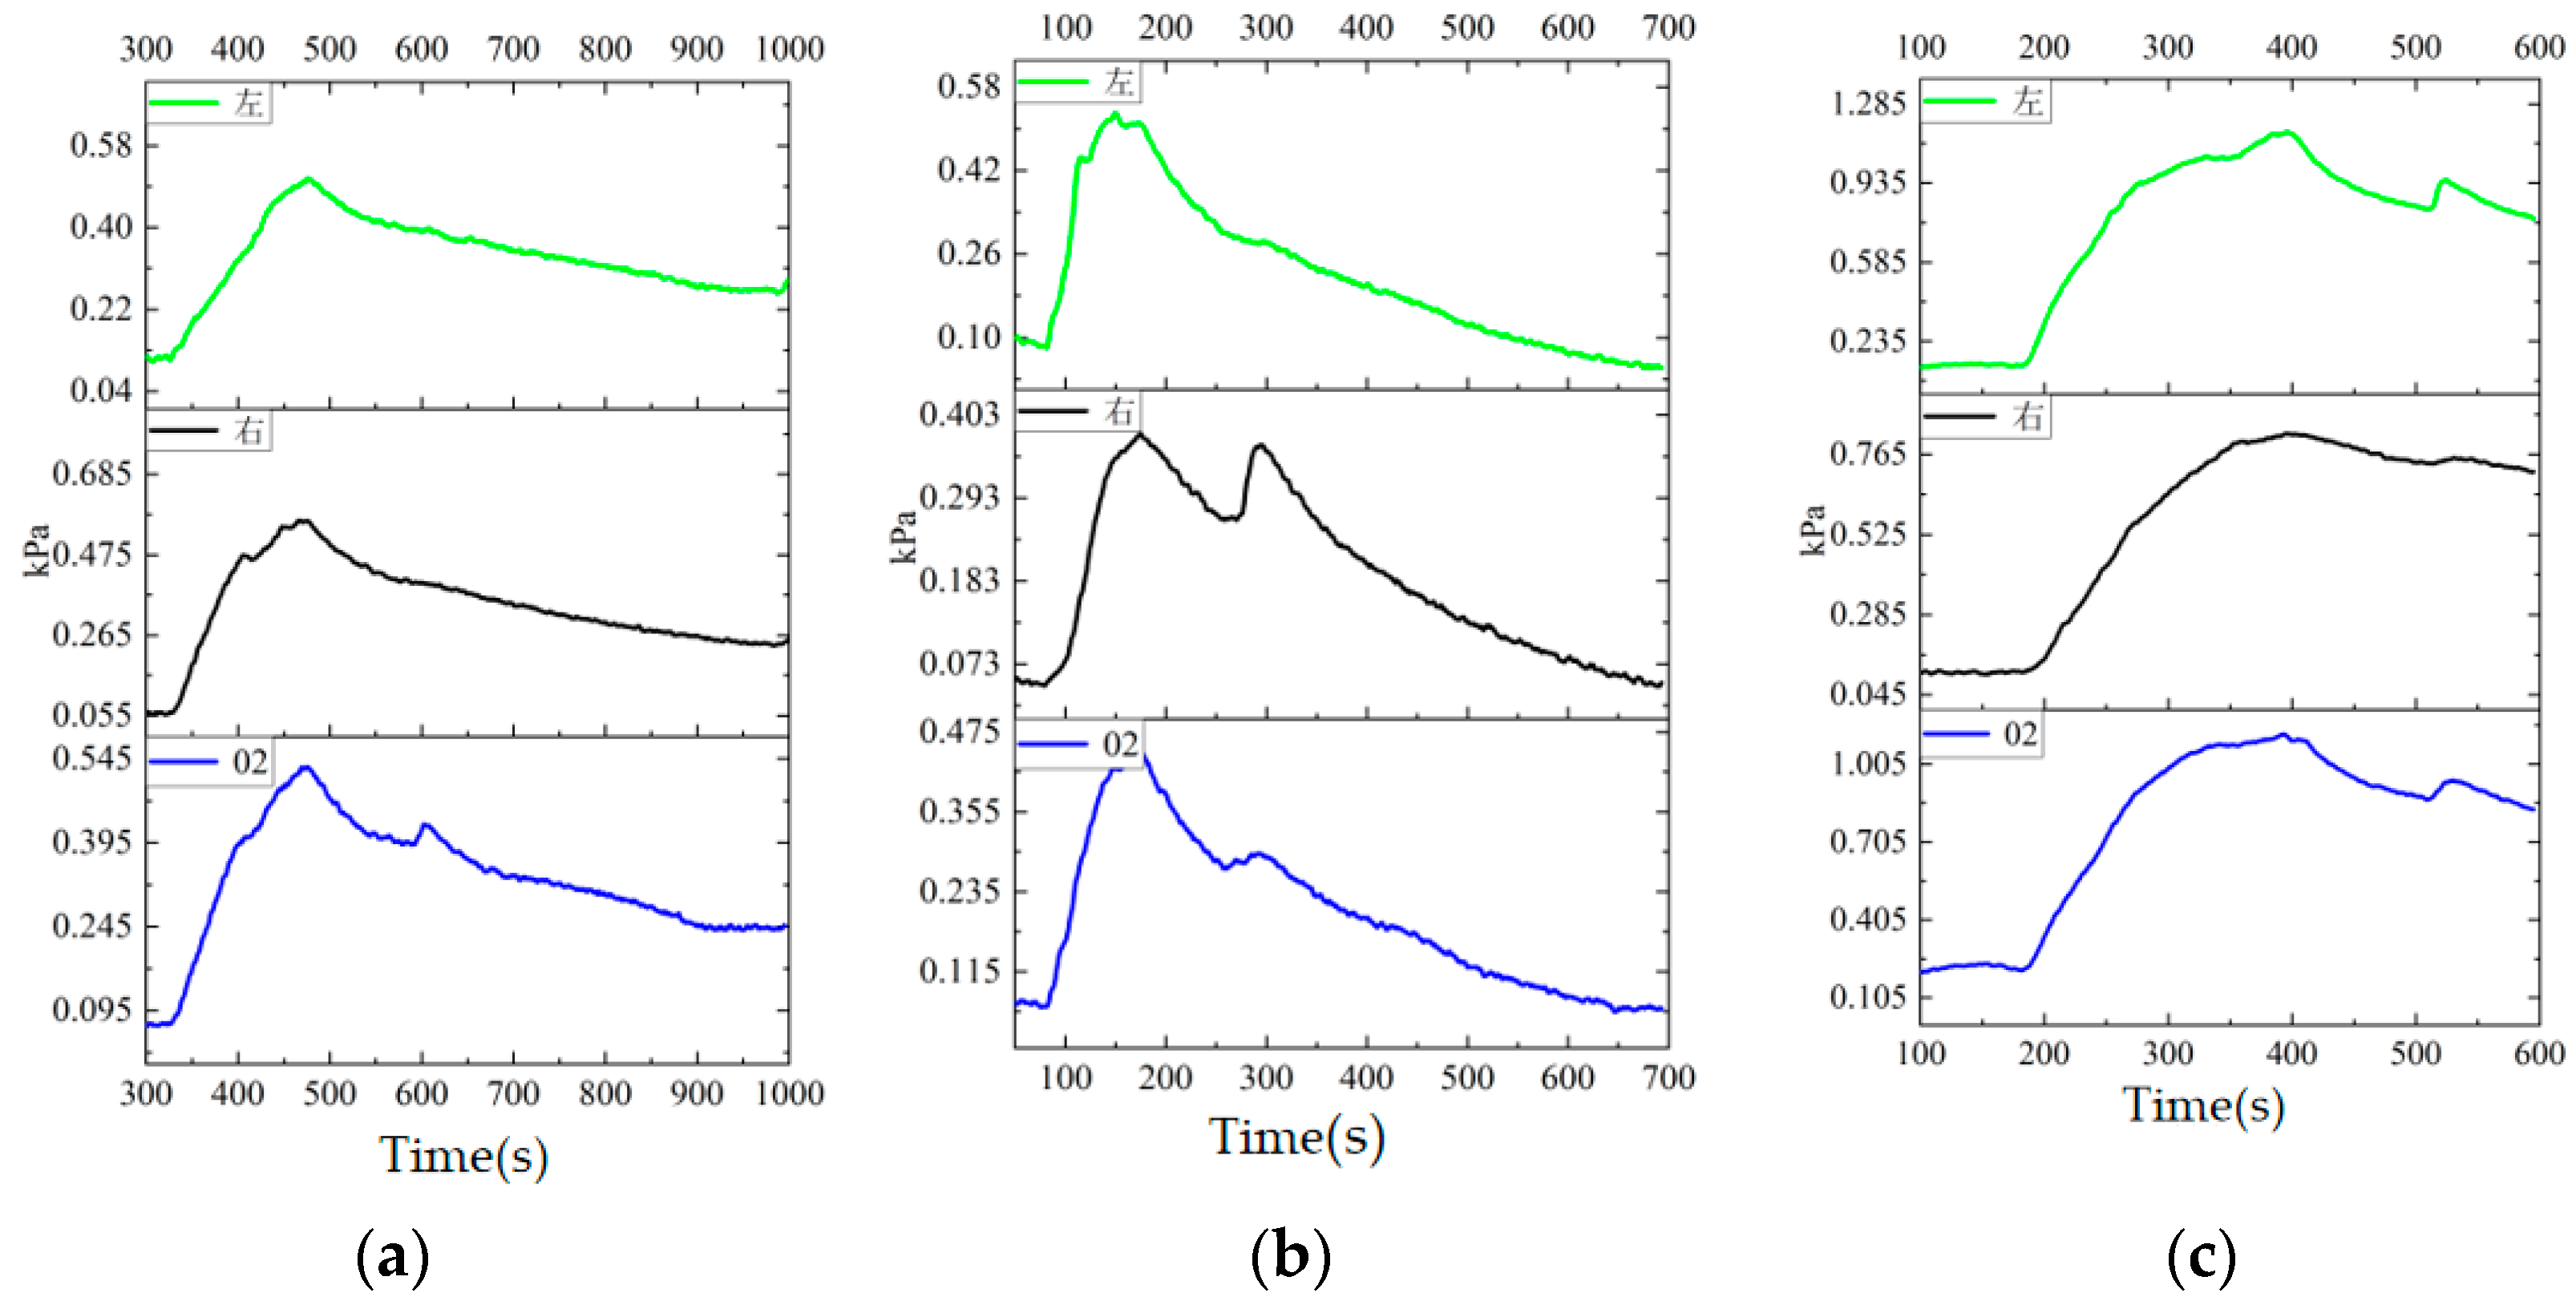
As can be seen from the 02 sensor in the middle and the sensors on both sides of the same horizontal plane in Figure (a), the solution infiltration channel was concentrated in the middle of the M-1 model during the first reinforcement, and the signals in the middle channel were very obvious, while the signals at both ends of 02 were not clear, and the pore pressure variation law was basically similar. The signal (b) indicates that during the second reinforcement, the seepage channel is concentrated on the right side of the model, and the secondary wave crest on the left side is not obvious. The variation of time-pore pressure in the horizontal direction of the third round of reinforcement (c) indicates that the seepage channel is located on the left of the center of the model. The test results show that after three rounds of perfusion reinforcement, the changes of pore pressure in the horizontal plane 10cm away from the top surface have a clear sensitivity to seepage layer. At this depth, the calcium carbonate products are less and the filling effect is ordinary, while the curing effect at this depth is not obvious.
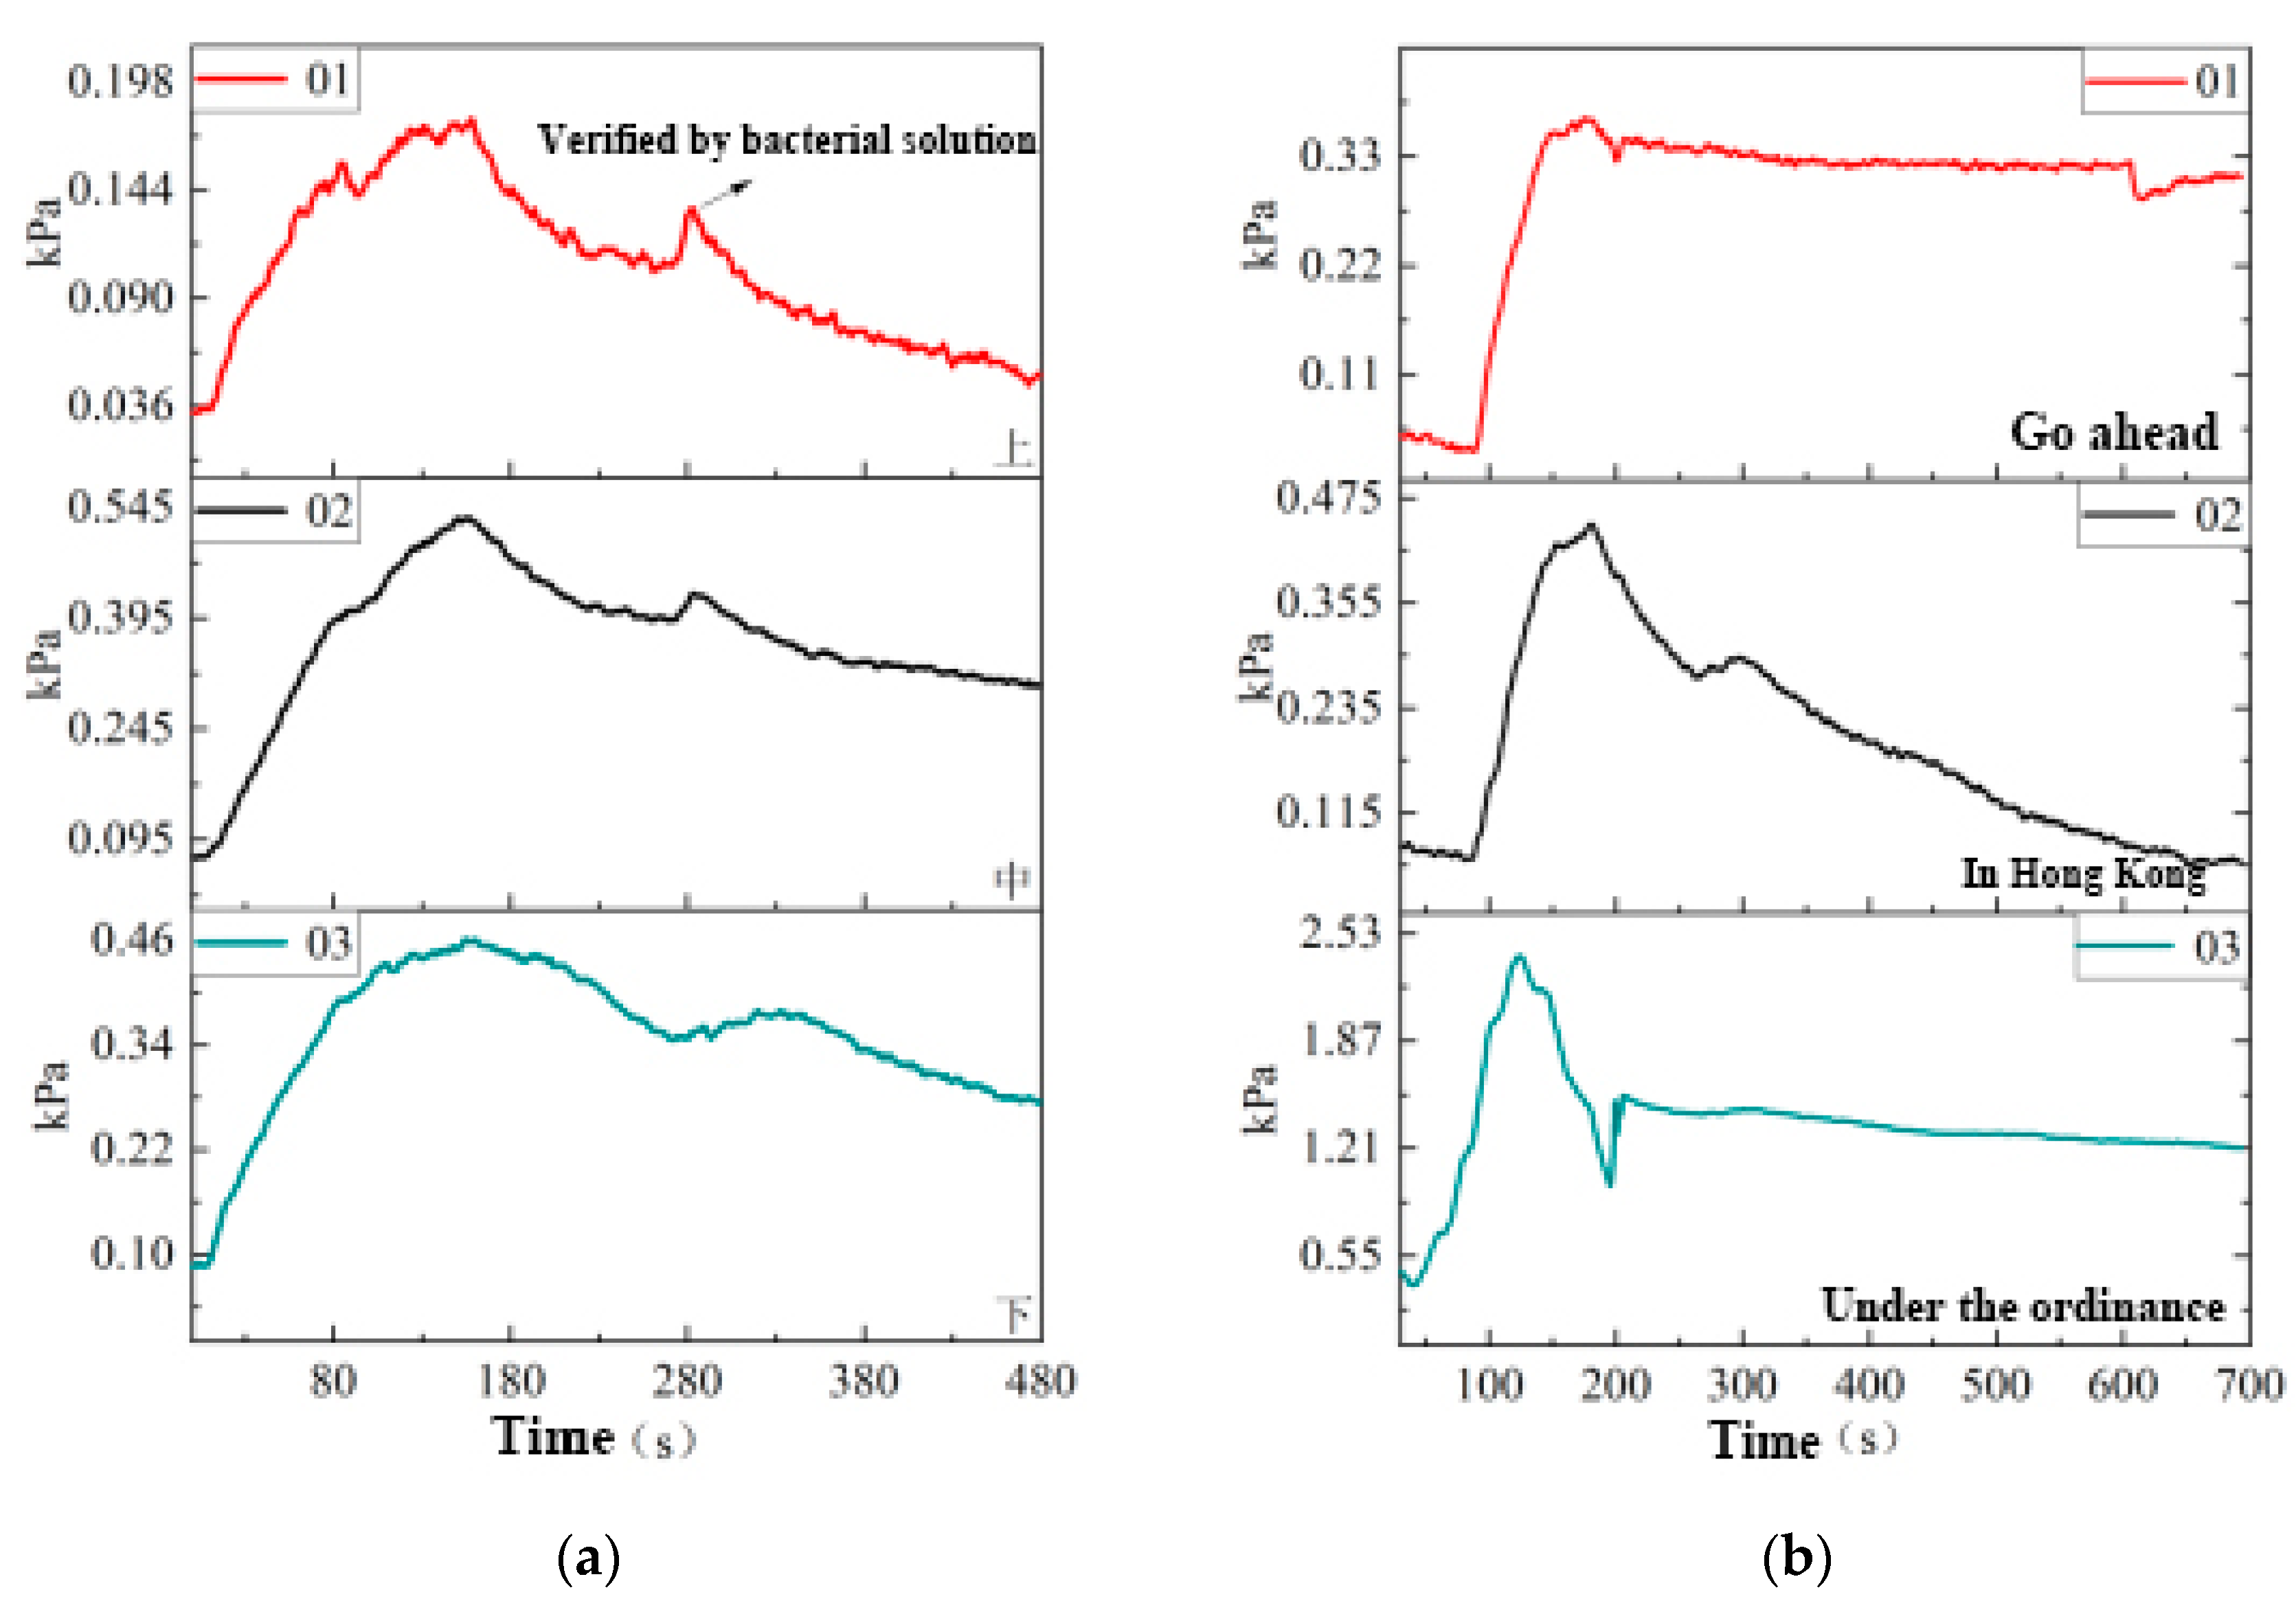
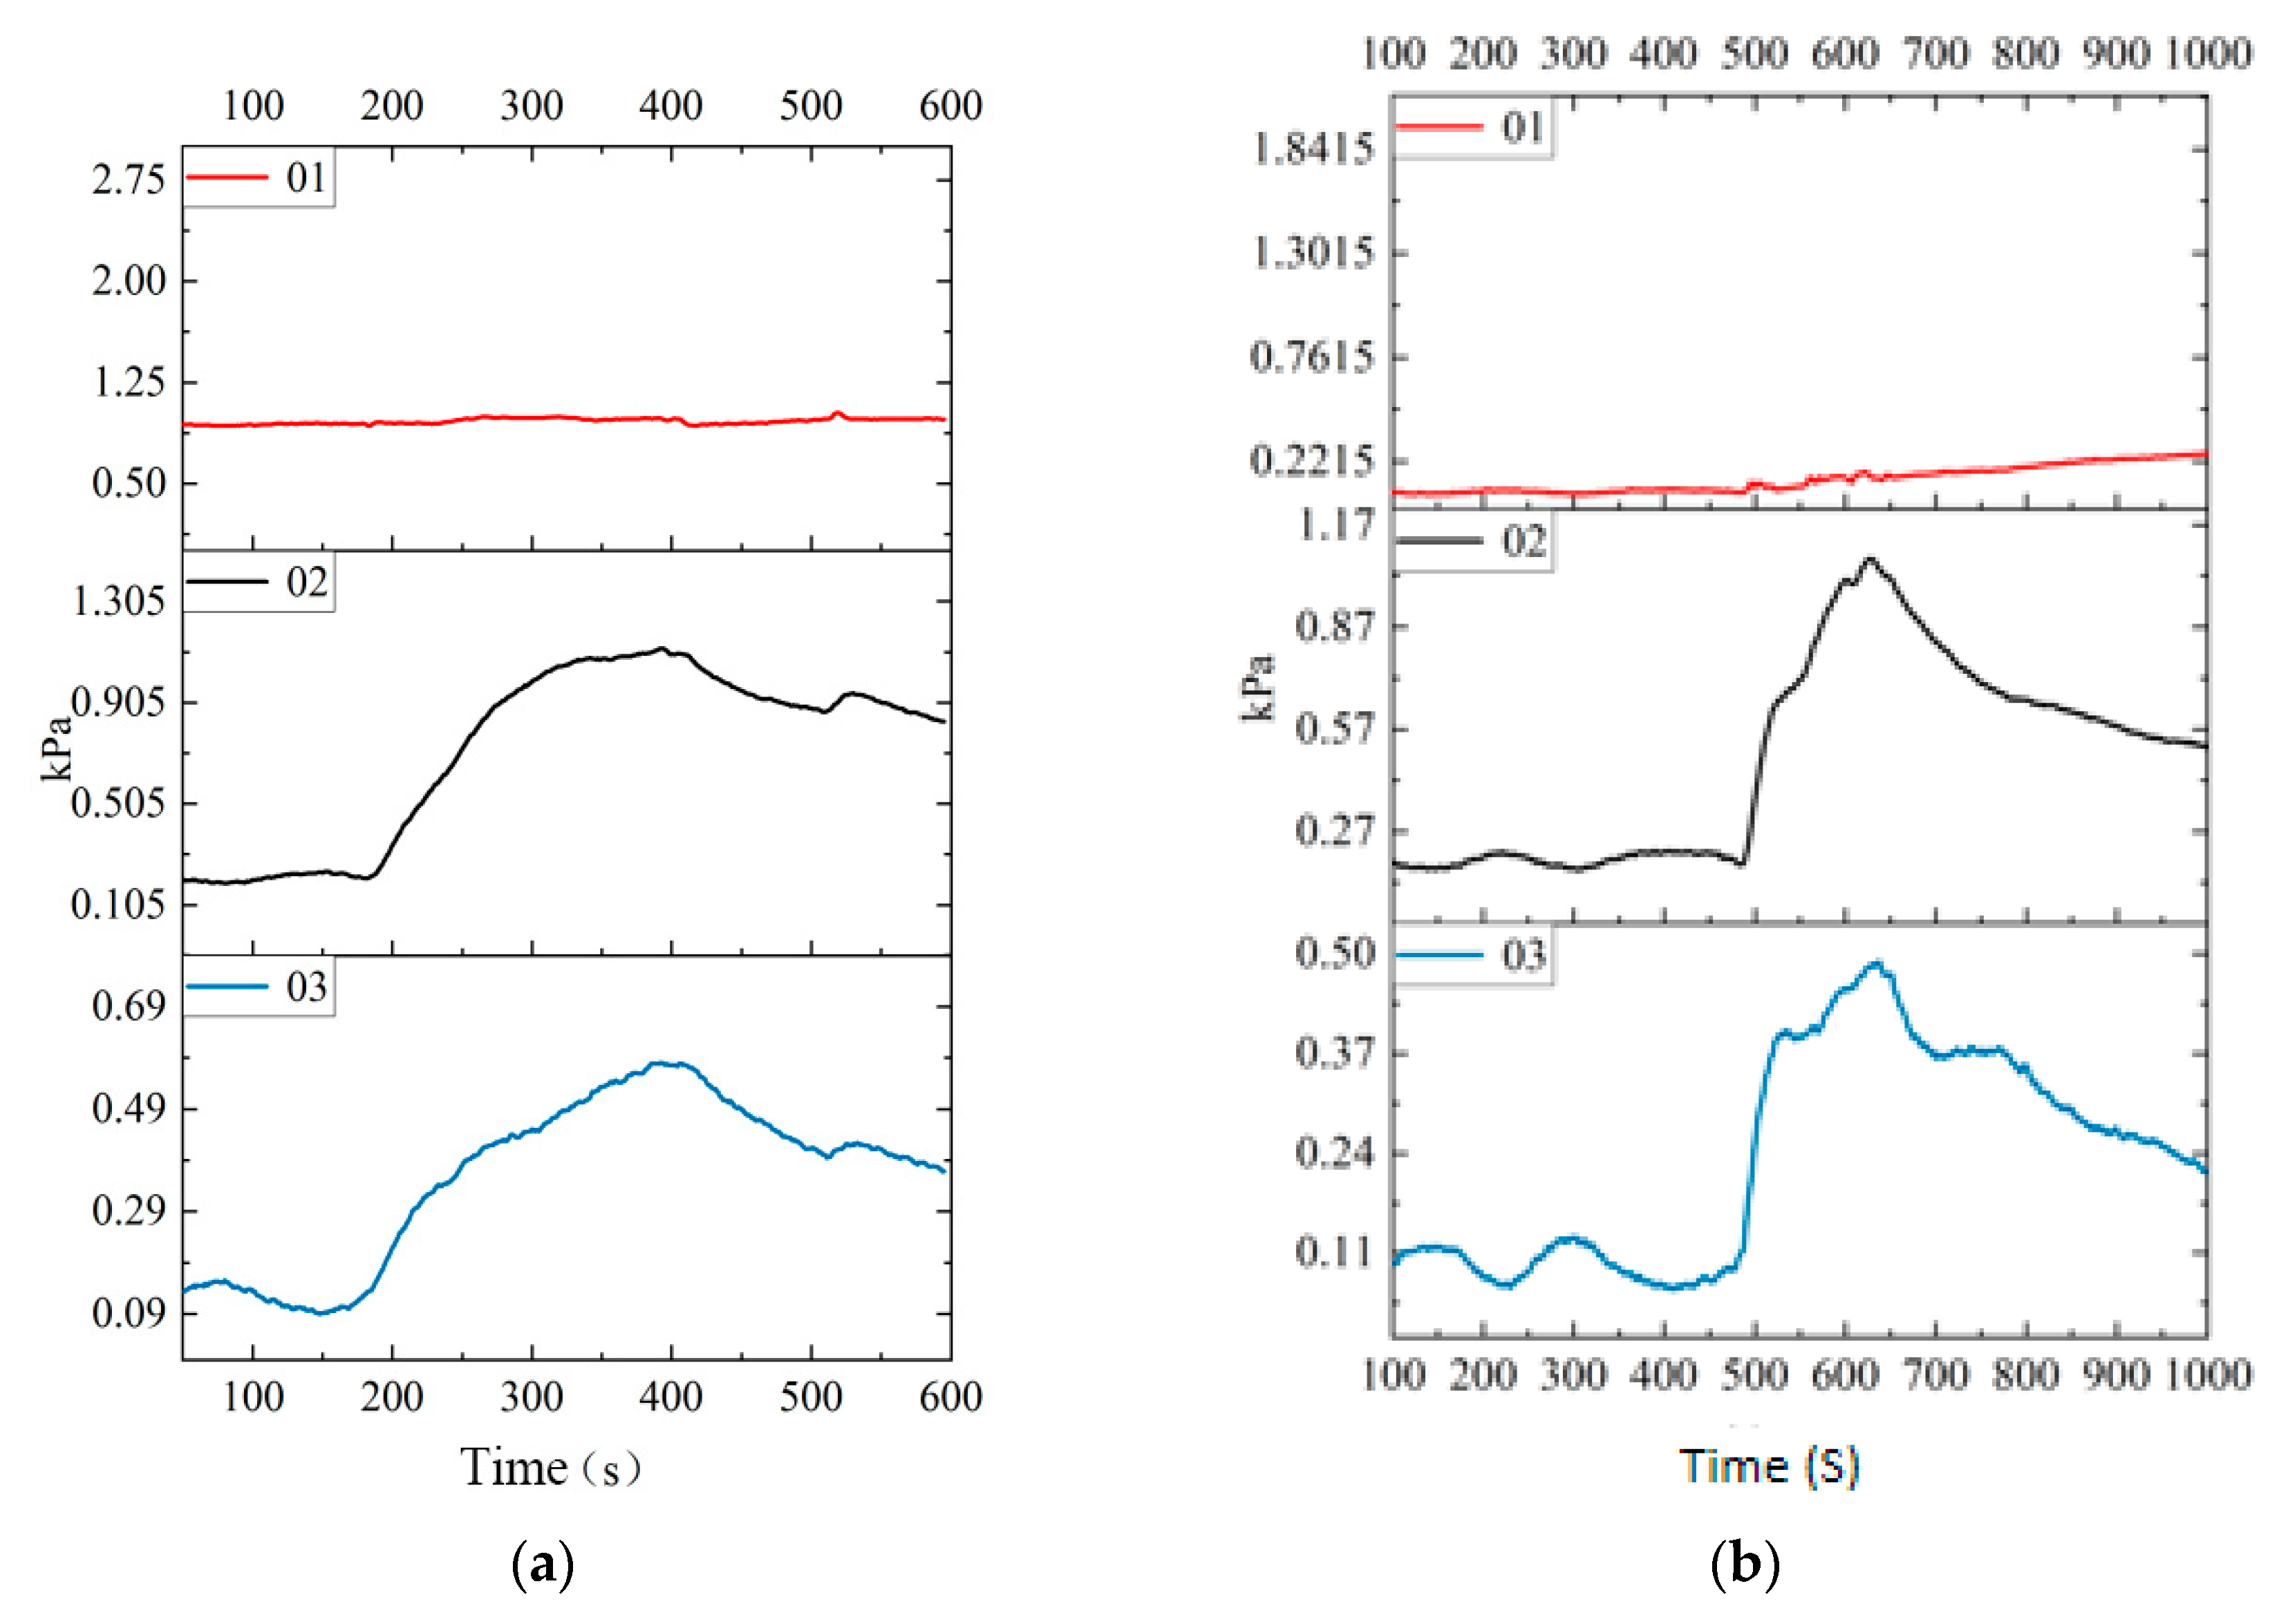
It can be seen from
Figure 13 that pore pressure changes from top to bottom during the cementing process. Sensors 02 and 03 have a certain time lag compared with 01, and the size effect is more obvious. First, in order to verify whether the interaction between the bacterial solution and the cementing solution would cause changes in pore pressure for the first time, 400mL bacterial solution was injected at 280s for 20s. The test results show that the rise rate of shallow sensor 01 is the fastest after the mixing of cementing liquid and bacterial liquid, which indicates that the reaction of calcium carbonate surface is obvious. However, after the rise of pore pressure at the bottom, the secondary wave crest changes little, and the pore pressure dissipates for a long time. As a result, the pore pressure change rate of 01 at the secondary wave peak is not as high as that of 02 and 03 at the bottom. The results showed that the reactants were gradually reduced, and the formation of calcium carbonate was more obvious in the shallow reaction, and the products also hindered the infiltration of the solution. However, in Figure (b), after 01 began to rise for a period of time, the pore pressure remained unchanged at 0.33kPa for about 500s. The test results show that in the shallow depth range, due to the shallow reaction of calcium carbonate, after filling the sand pores, the pores slowly decrease until completely filled. In terms of pore pressure law, the change rate of pore pressure weakens and remains unchanged within a certain period of time, approximately forming a kind of "calcium carbonate film", so that the pore pressure remains unchanged. While 02 and 03 below can still perceive the change of pore pressure after solution infiltration. Pore pressure rises quickly within a certain period of time, and the process of pore pressure dissipation also indicates that pore water pressure in the model is gradually decreasing, which is reflected in the effect of infiltration. The accumulation of calcium carbonate in the surface pore of the model greatly affects the change of surface pore pressure.
Figure 14 (a) and (b) respectively show the time-pore pressure variation of bacterial and cementing fluids in the third round of reinforcement. The pore pressure changes in this cycle continue to confirm the plugging effect of calcium carbonate "film" formed in the middle pores of the upper part of the model. The pervious stone of sensor 1 is blocked by the products near the measuring point of sensor 1, and the stabilization of calcium carbonate around the sensor results in a very small pore pressure change rate, showing a straight line on the image. The deep sensor is characterized by the shallow to deep dynamic equilibrium process, which further indicates that the deep solidification is not significant and the lower pore cementation effect is poor. Pore water during grouting is represented as a dynamic infiltration process, on which the pore pressure changes of 01 in the three groups are mapped. As shown in
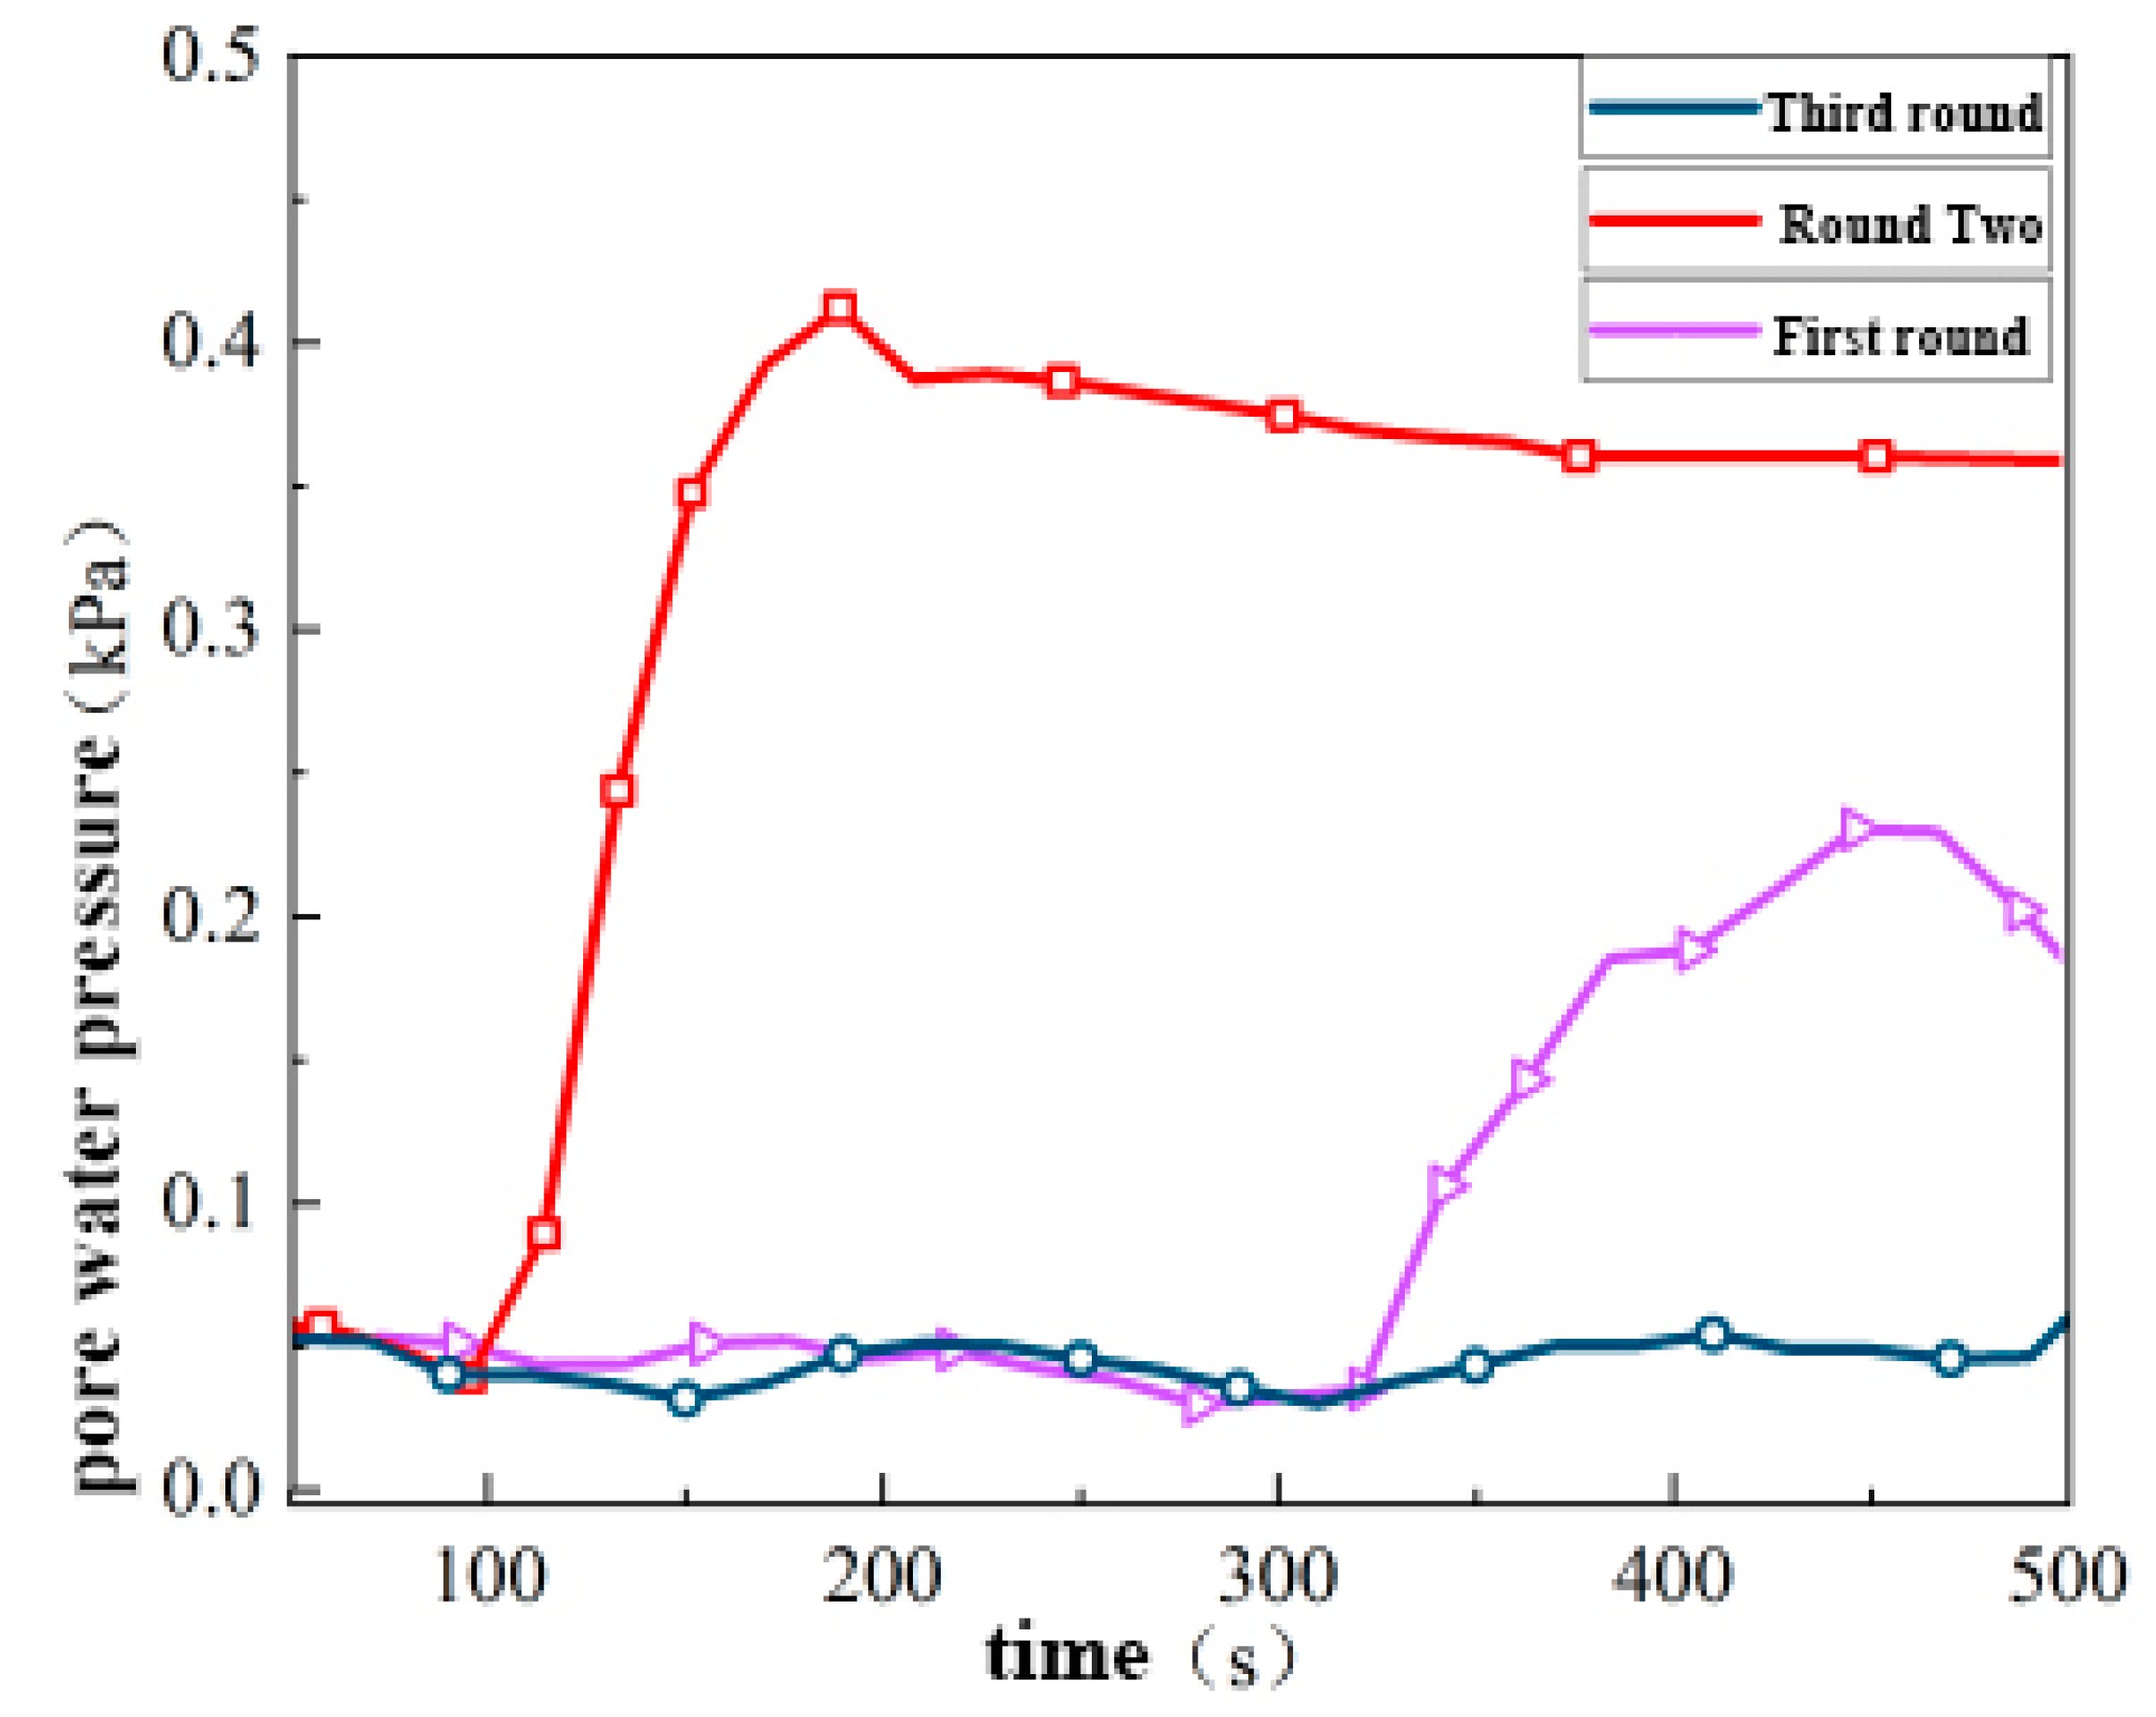
Figure 15, after three times of irrigation with bacterial and cementing fluid, the pore water pressure at 01 gradually decreases. Compared with the second irrigation, the decrease of the first irrigation is the most obvious. This is because a large amount of calcium carbonate generated in the first two irrigation has filled most of the voids, which leads to a small change in the graph between the third irrigation and the second irrigation. Because a large amount of calcium carbonate had been generated in the previous two irrigation, which affected the downward infiltration of bacterial and cementing fluid in the third irrigation, again confirming the conclusion that the deep curing effect was not obvious.
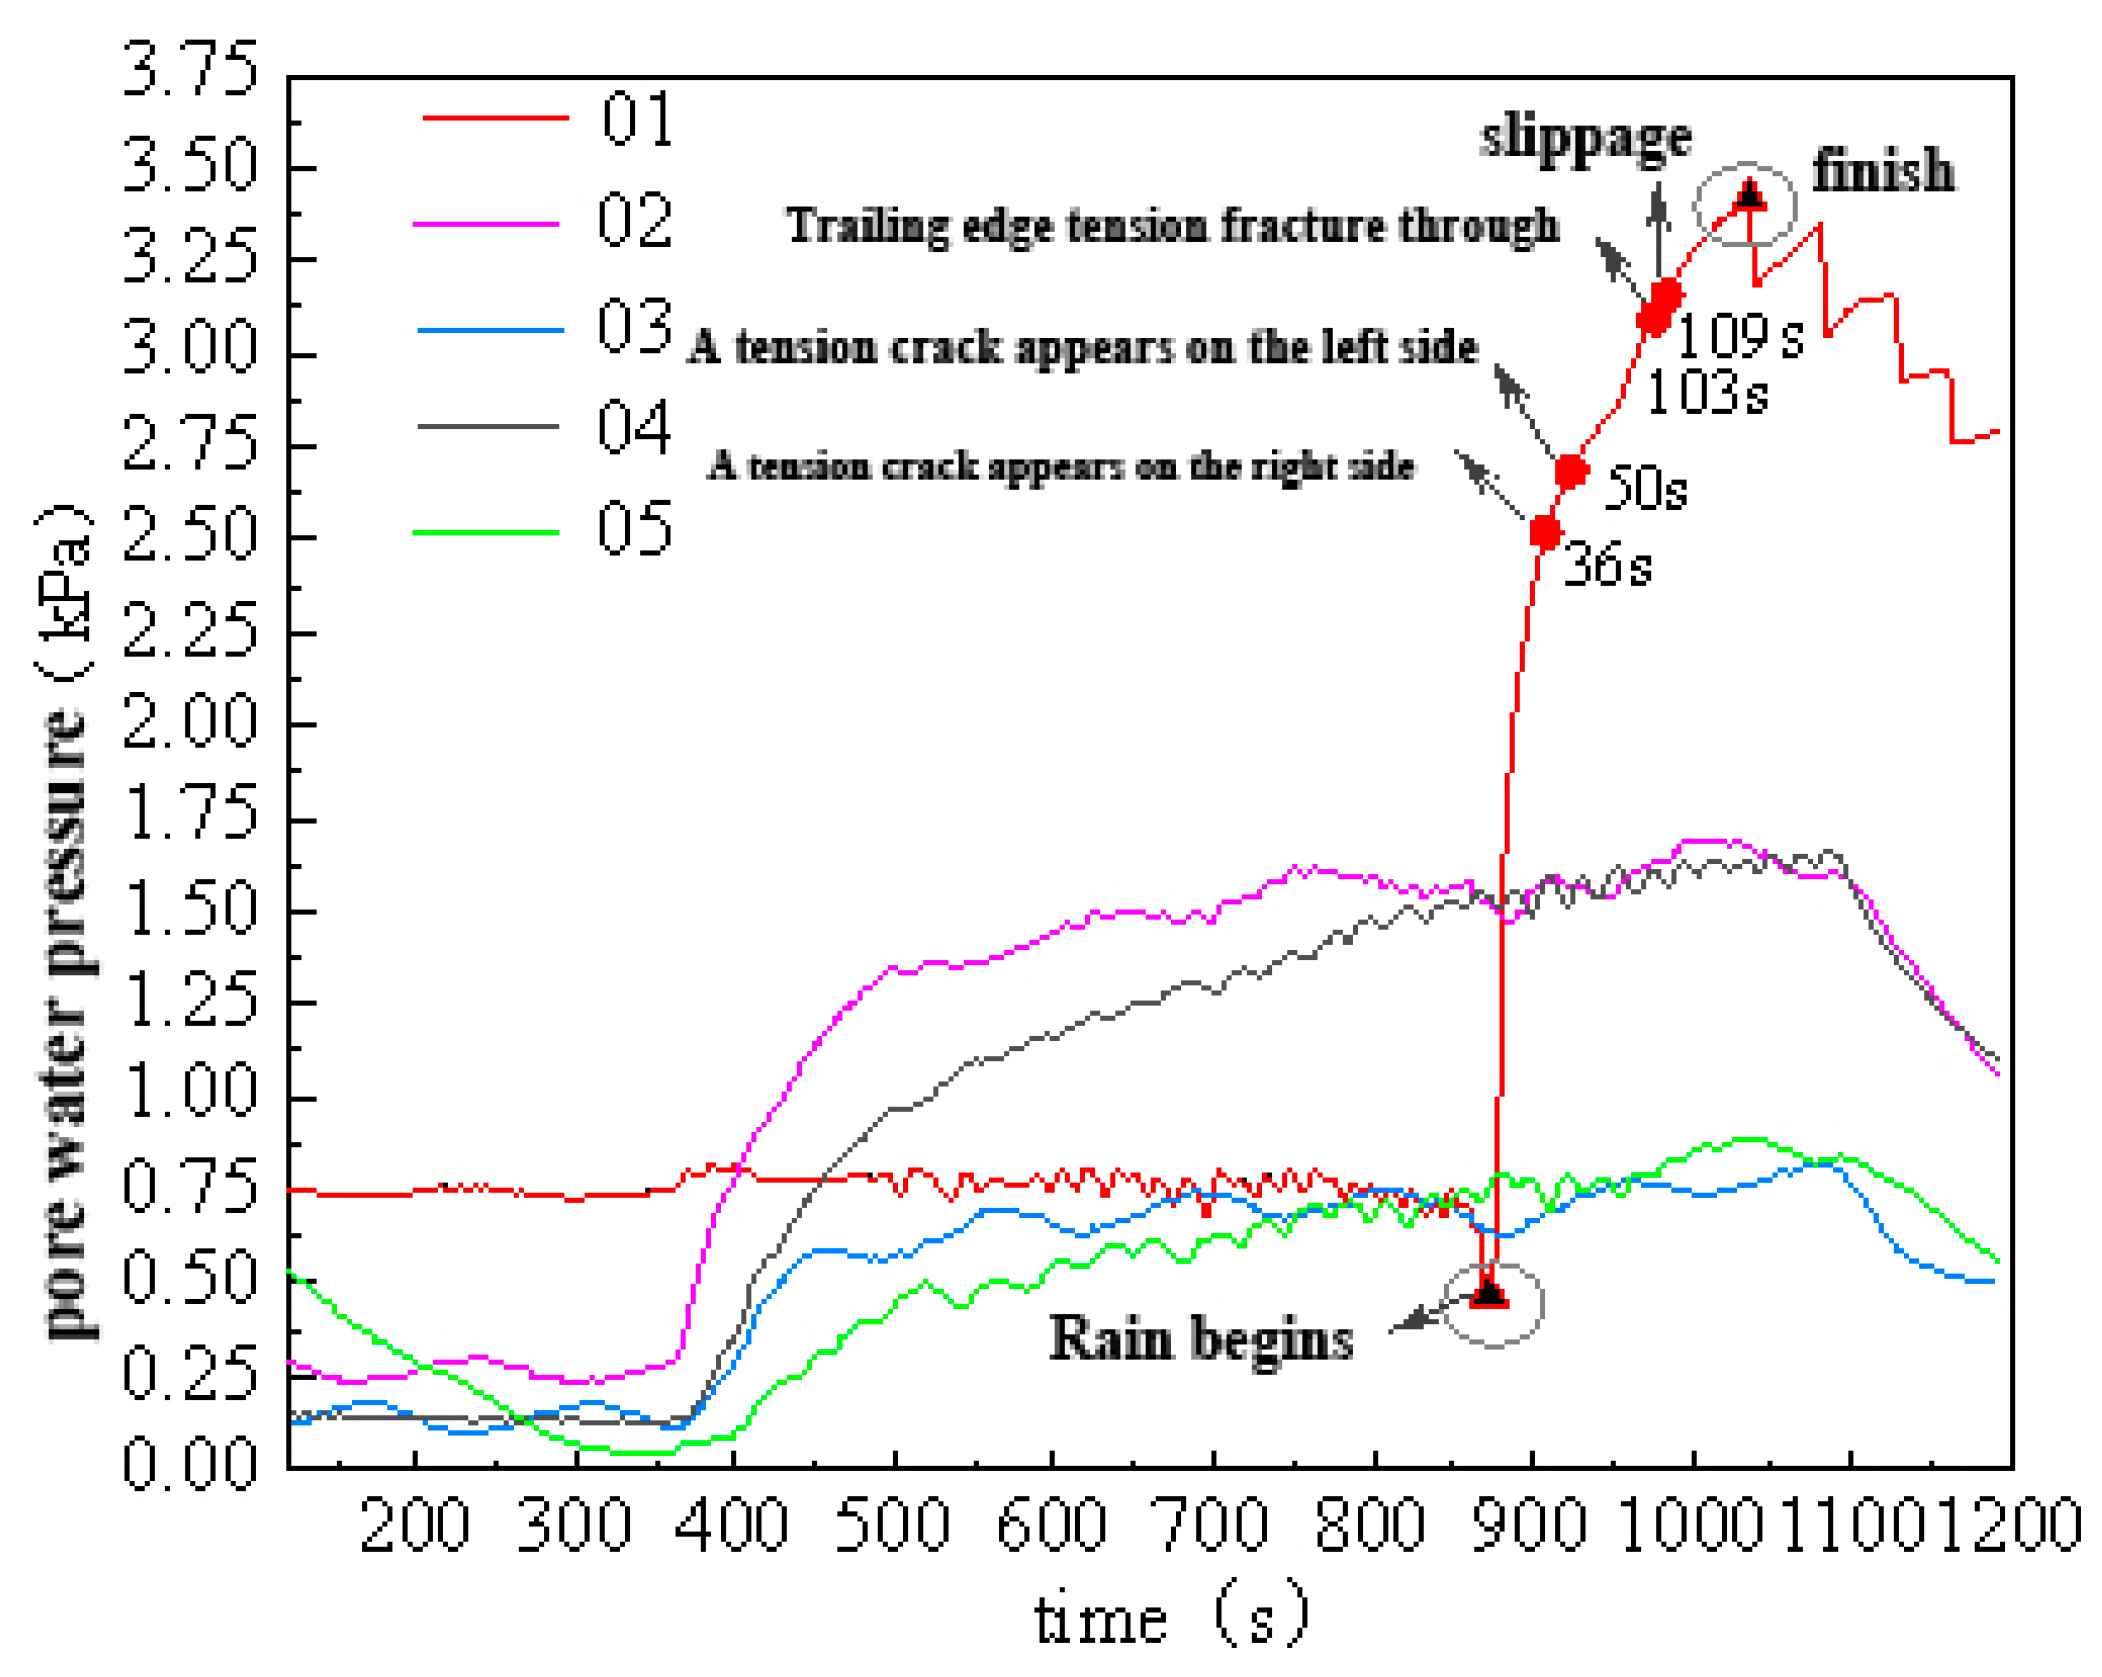
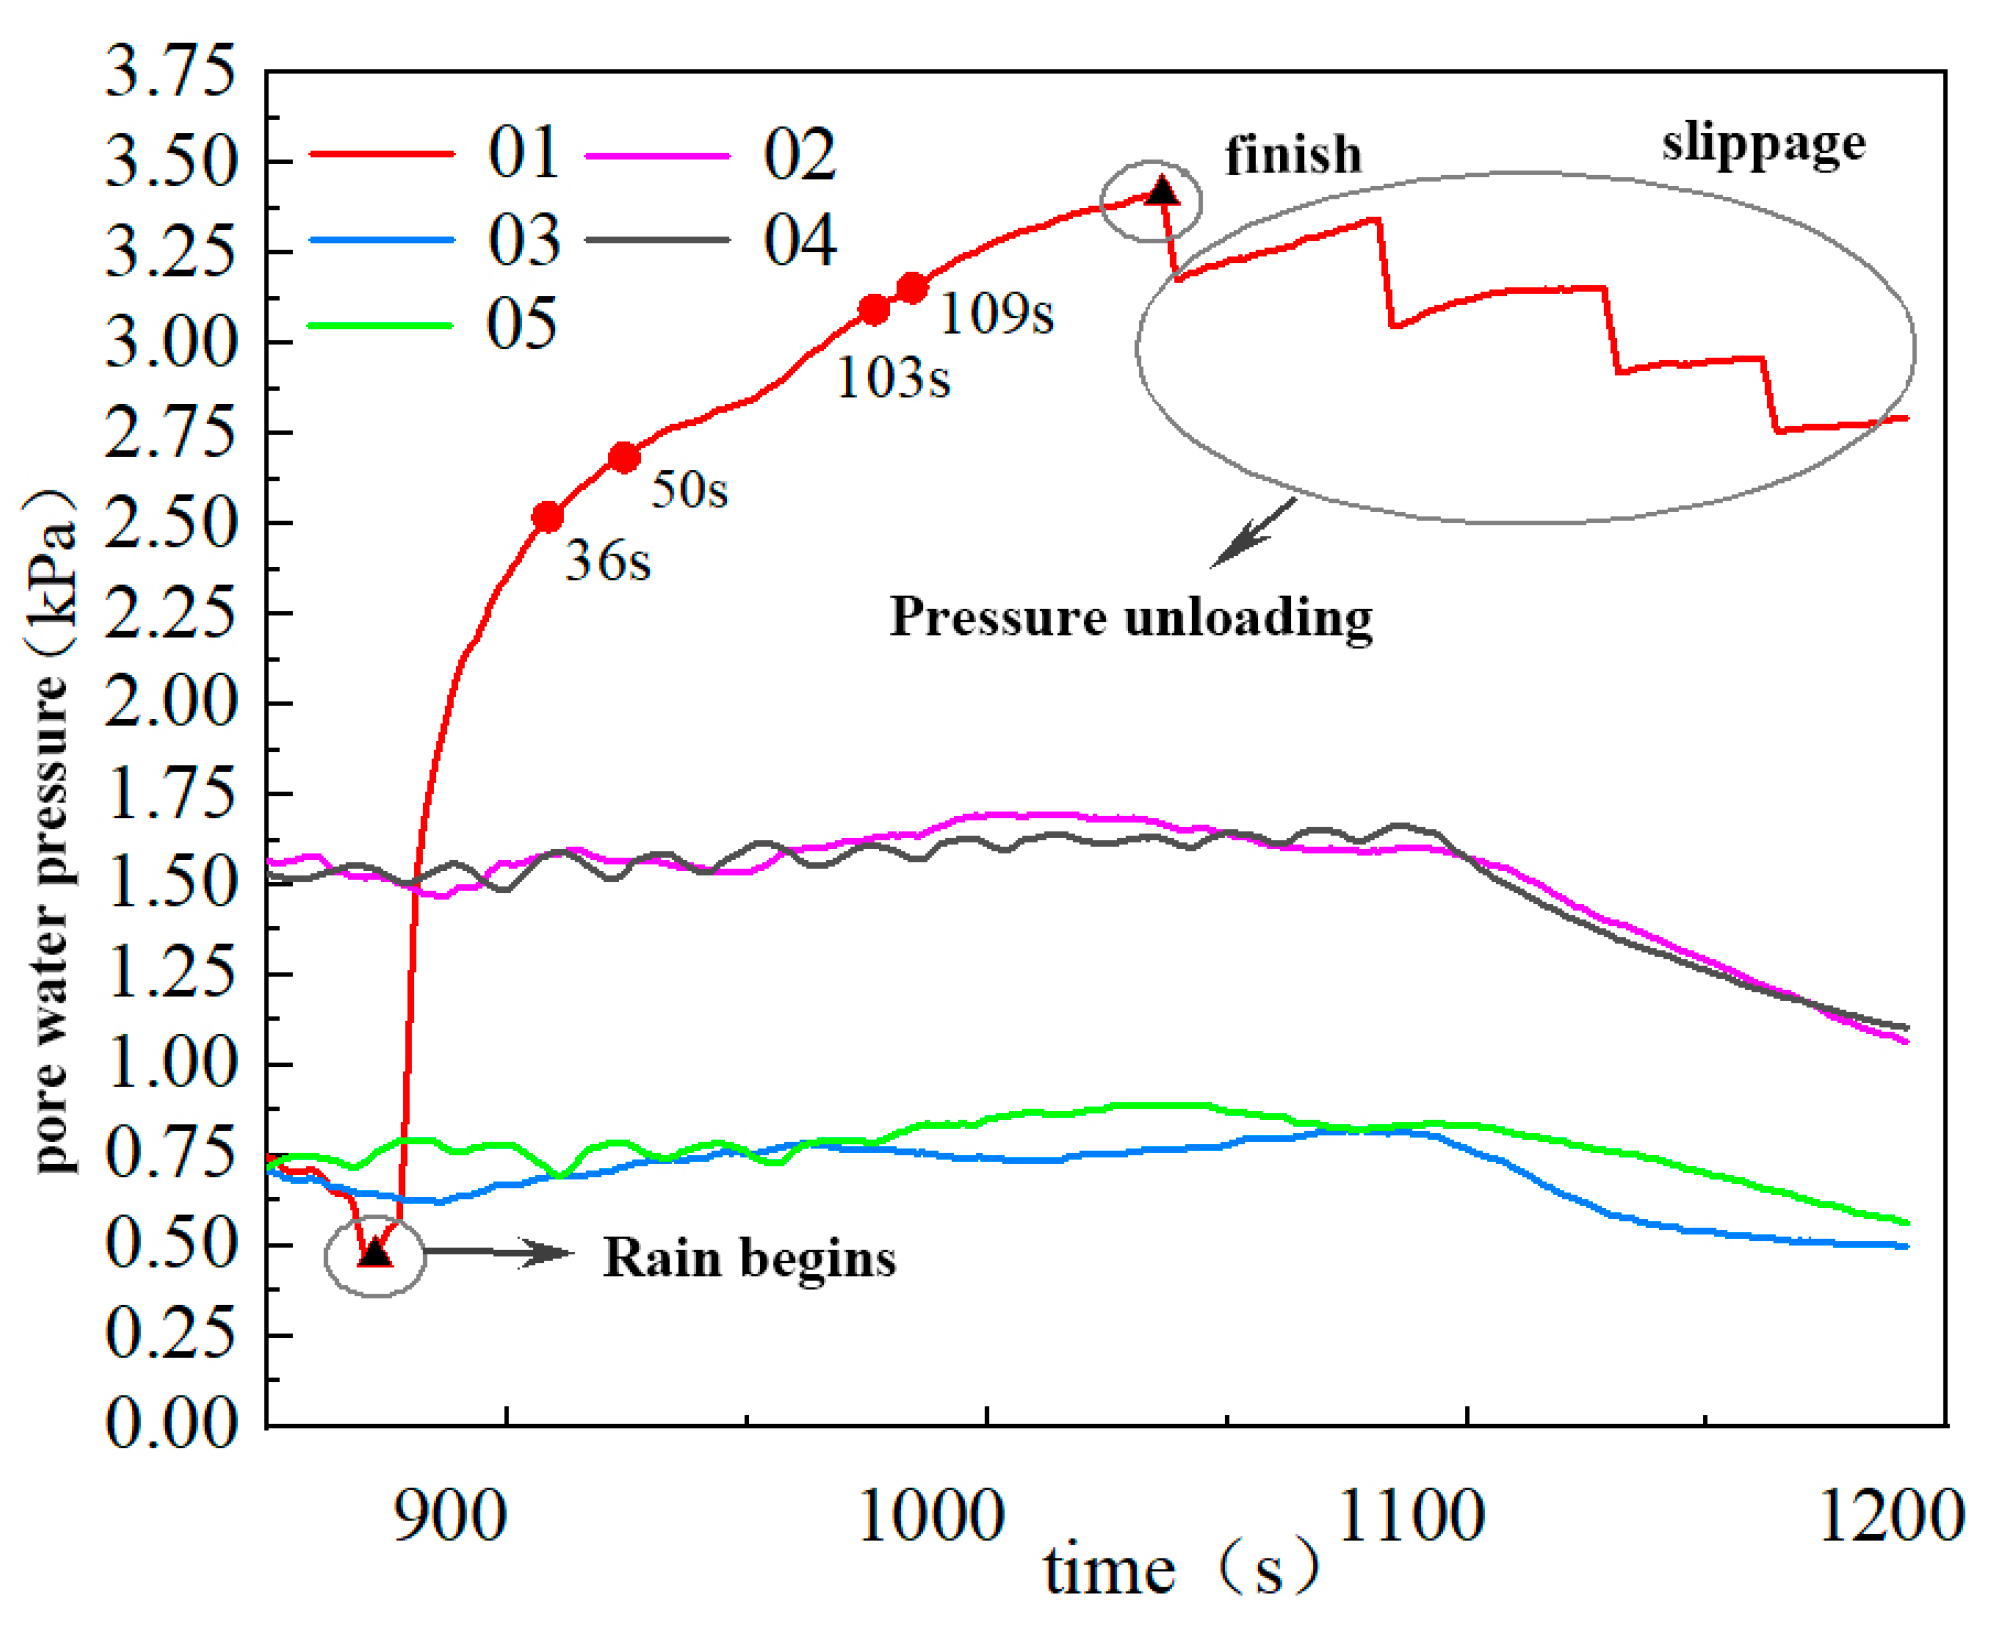
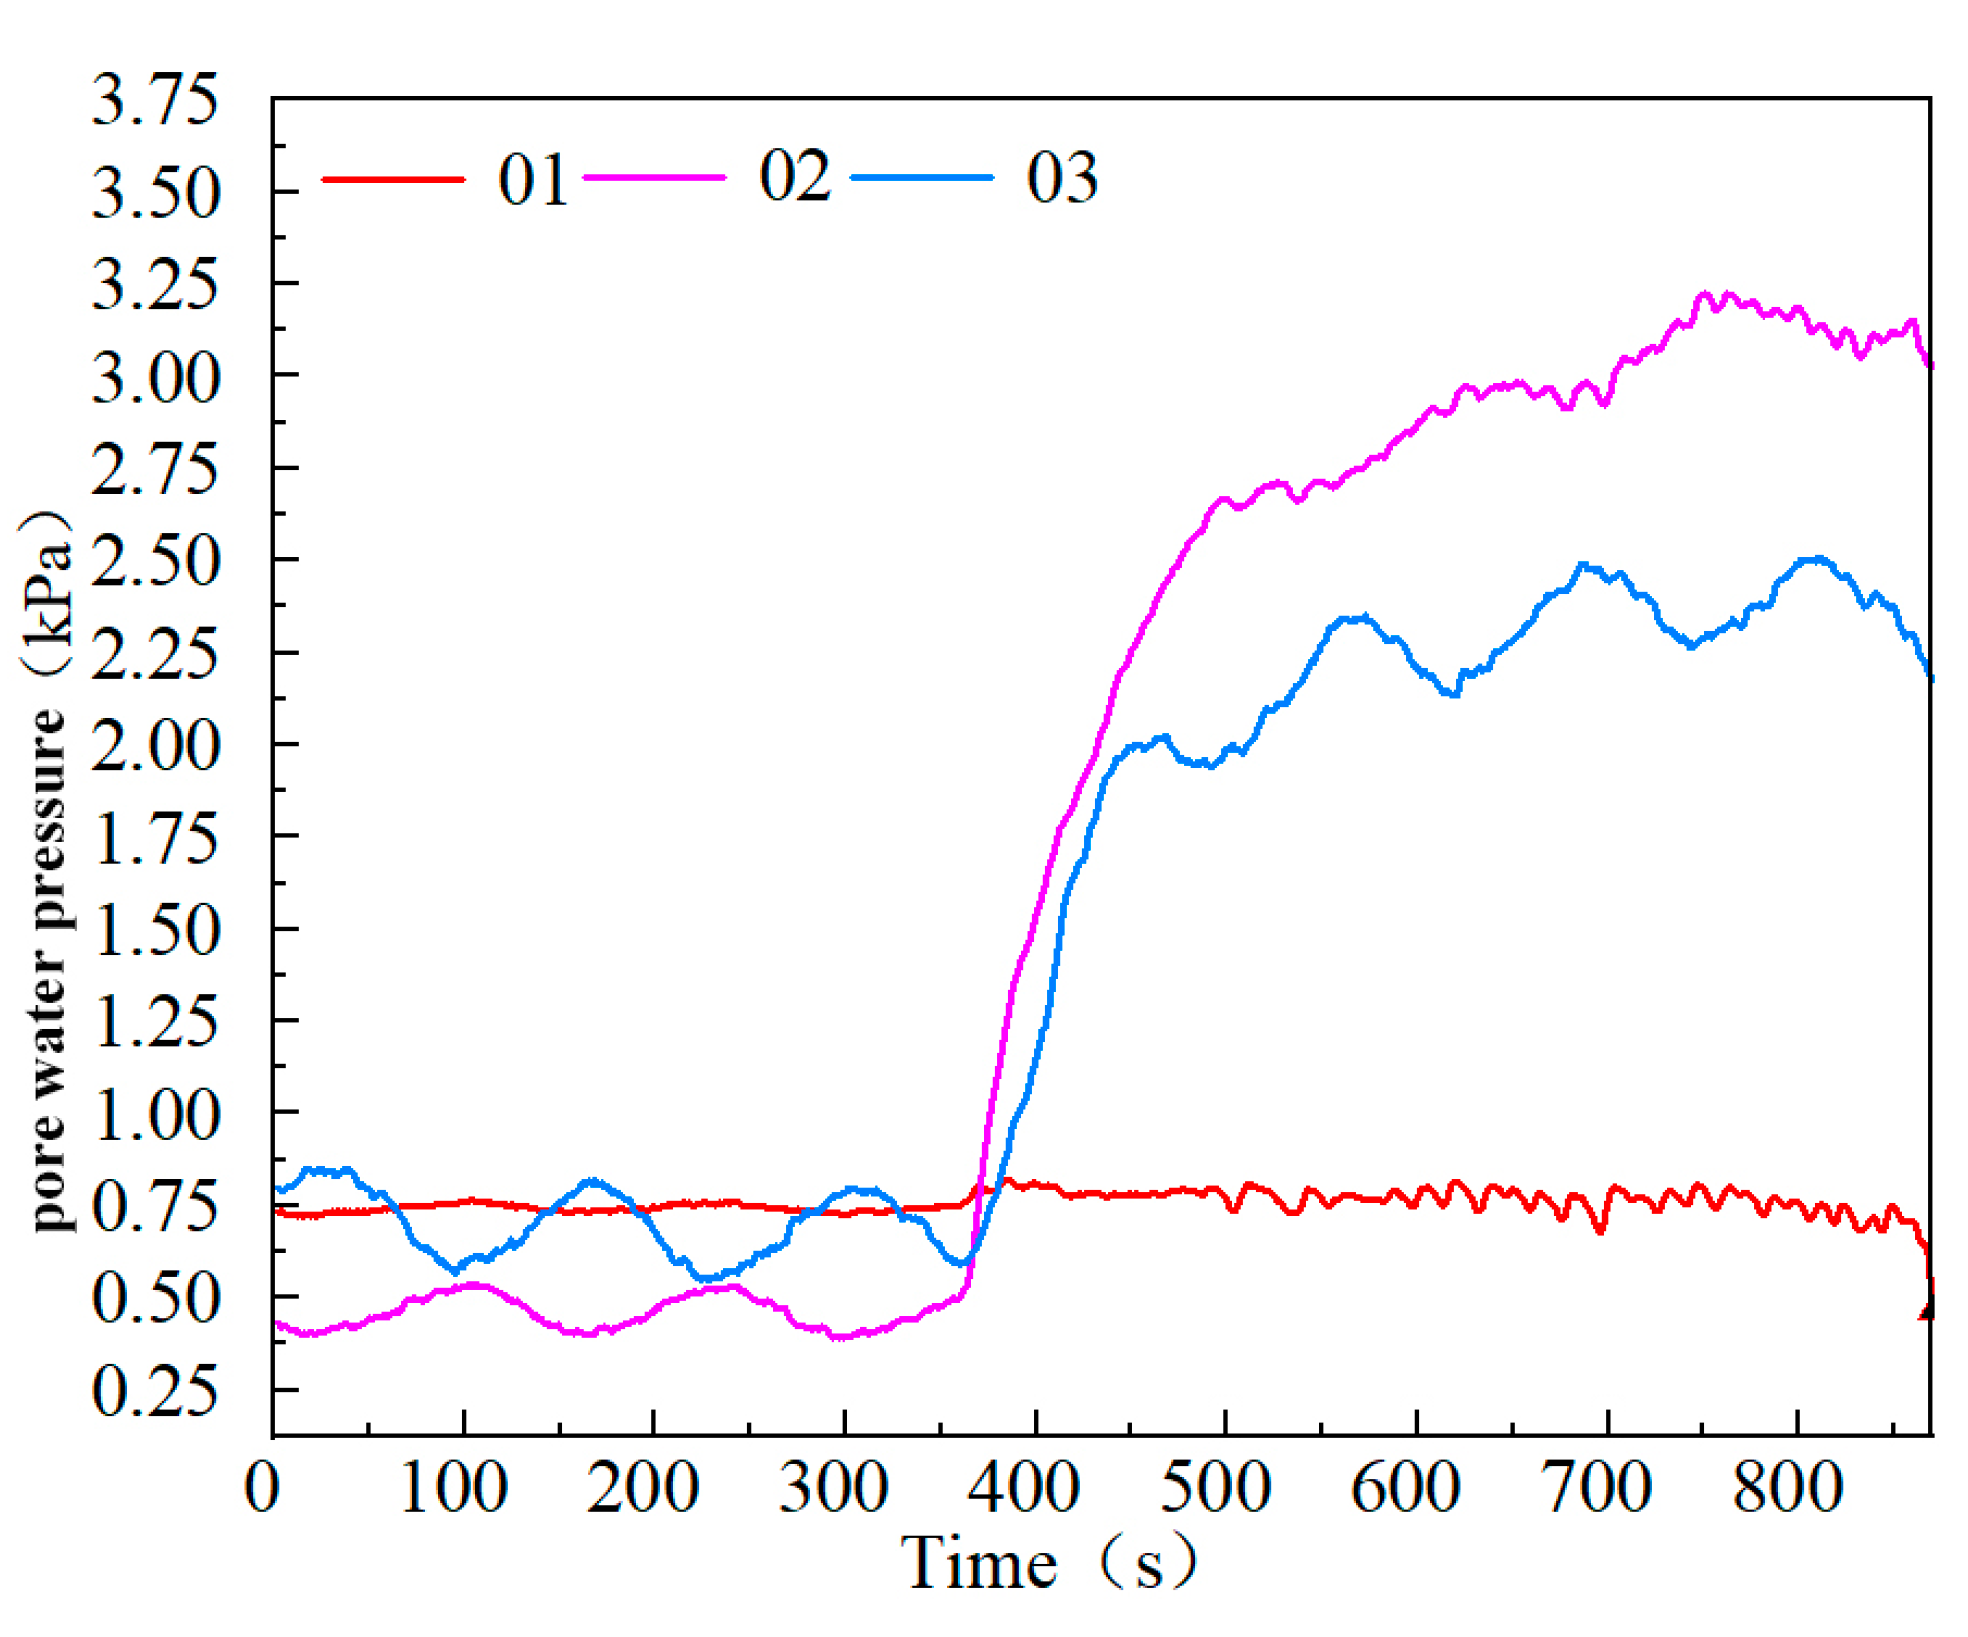
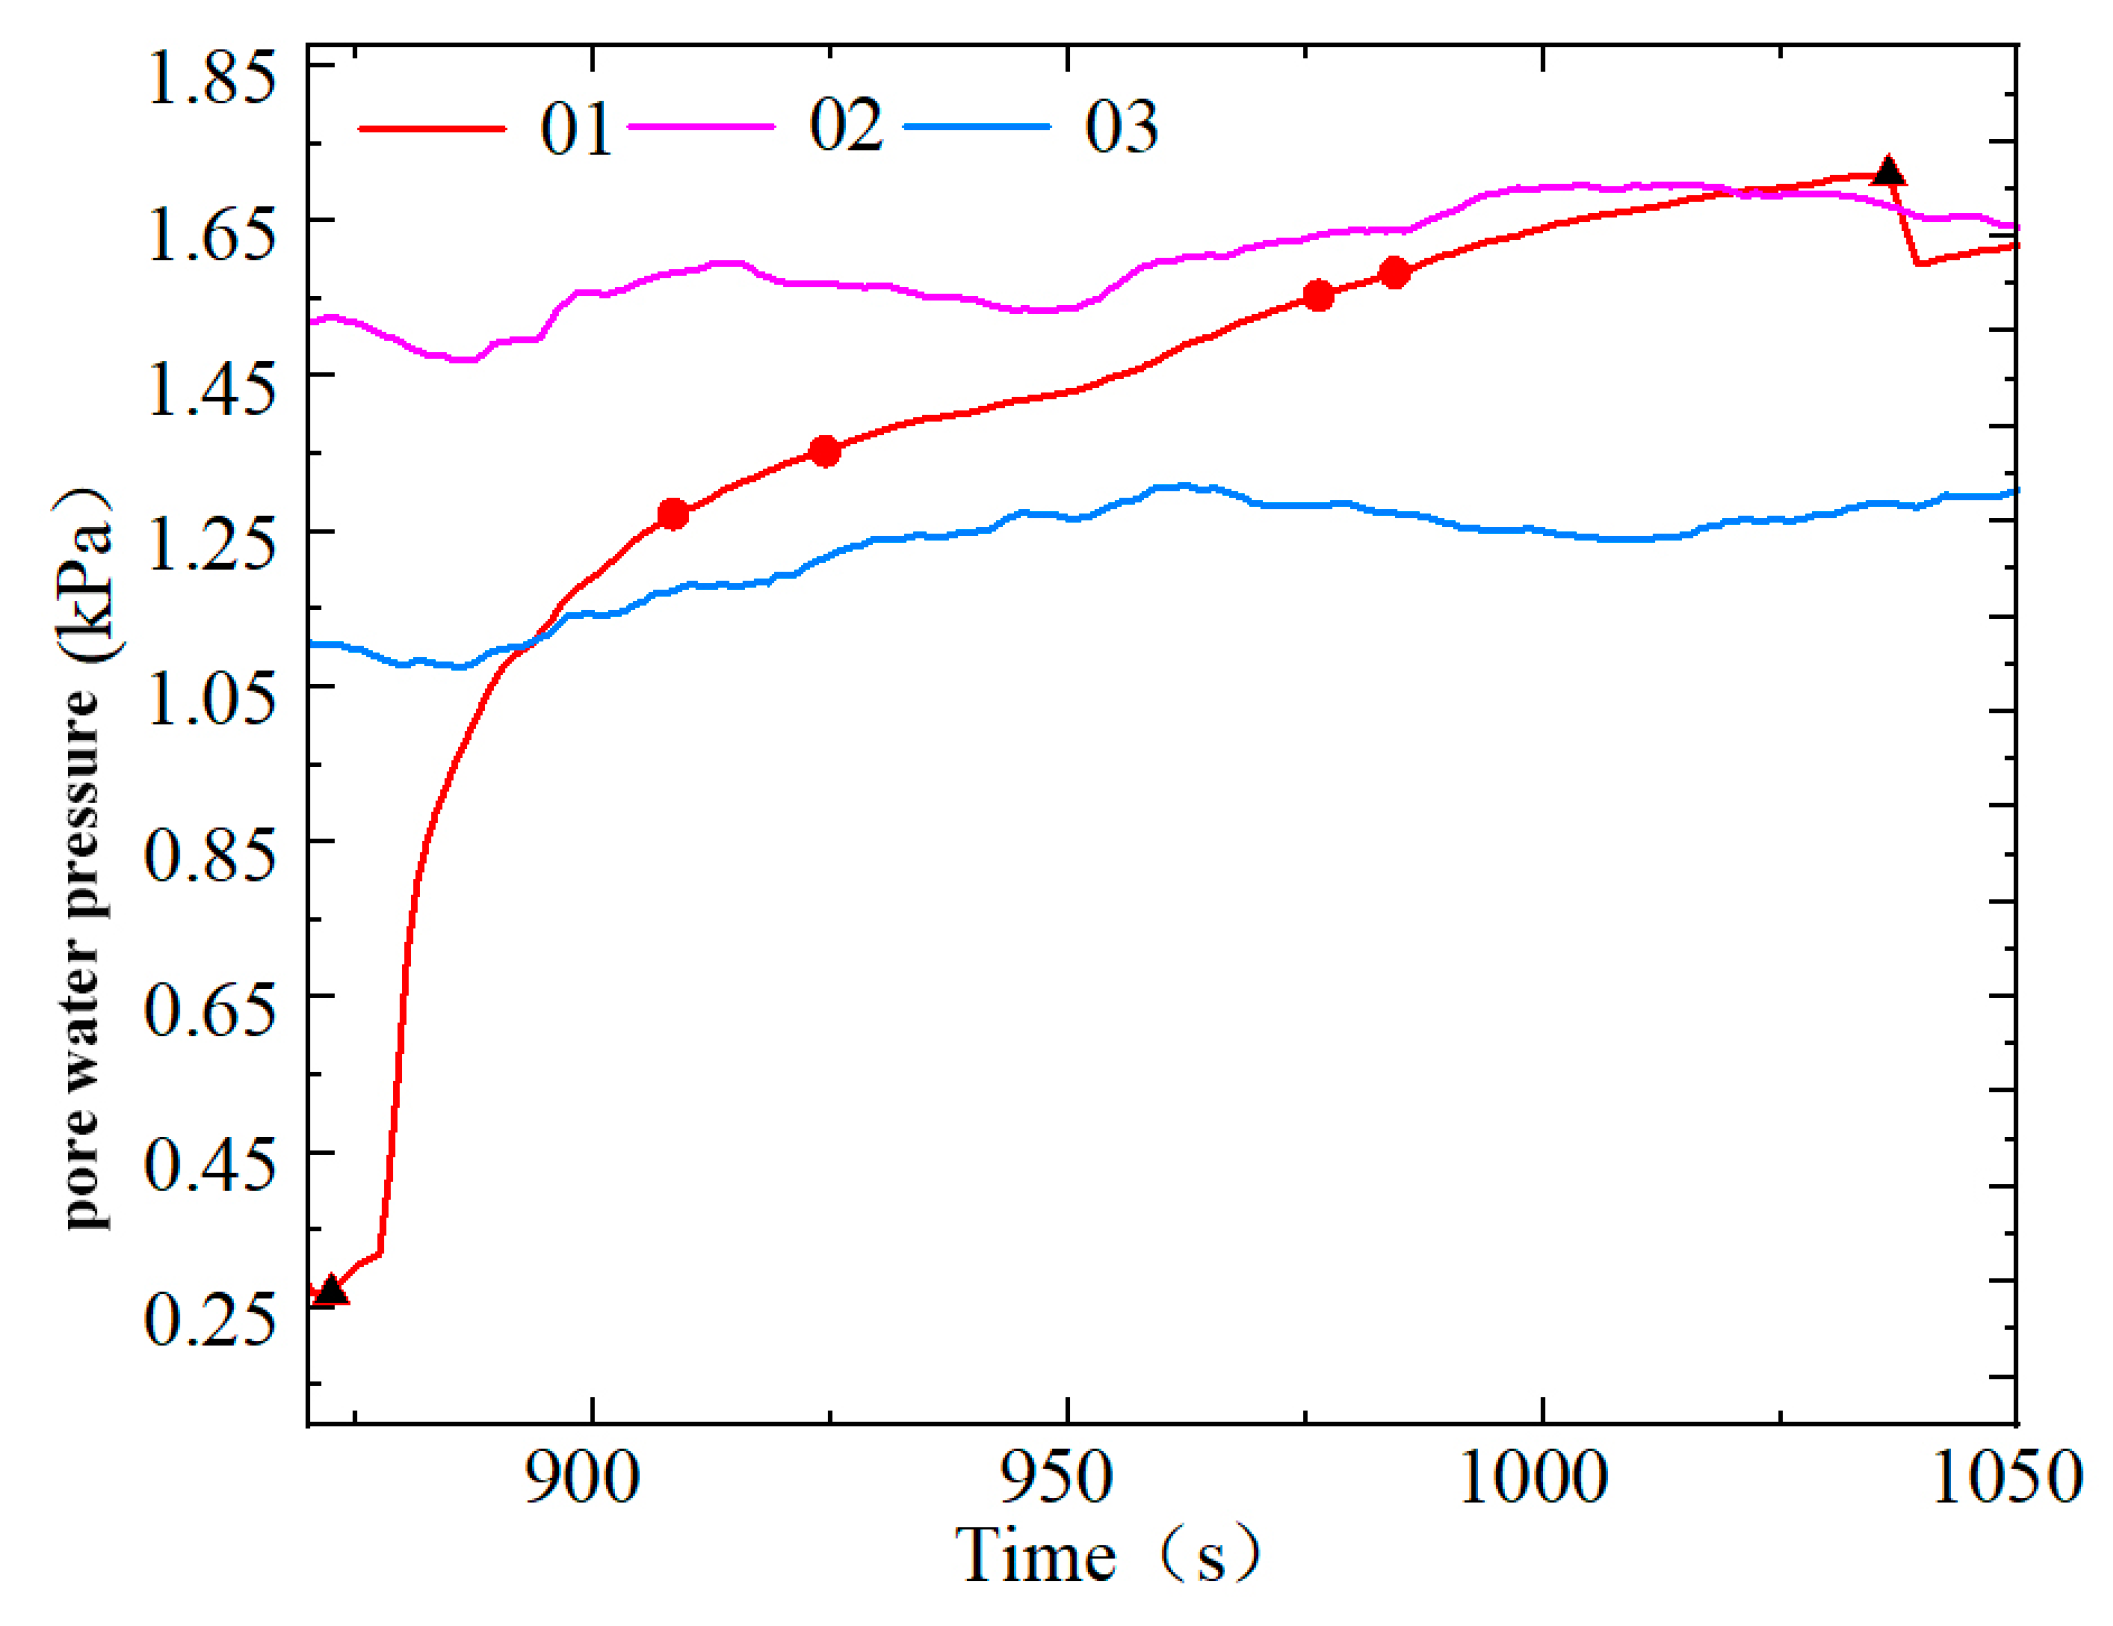
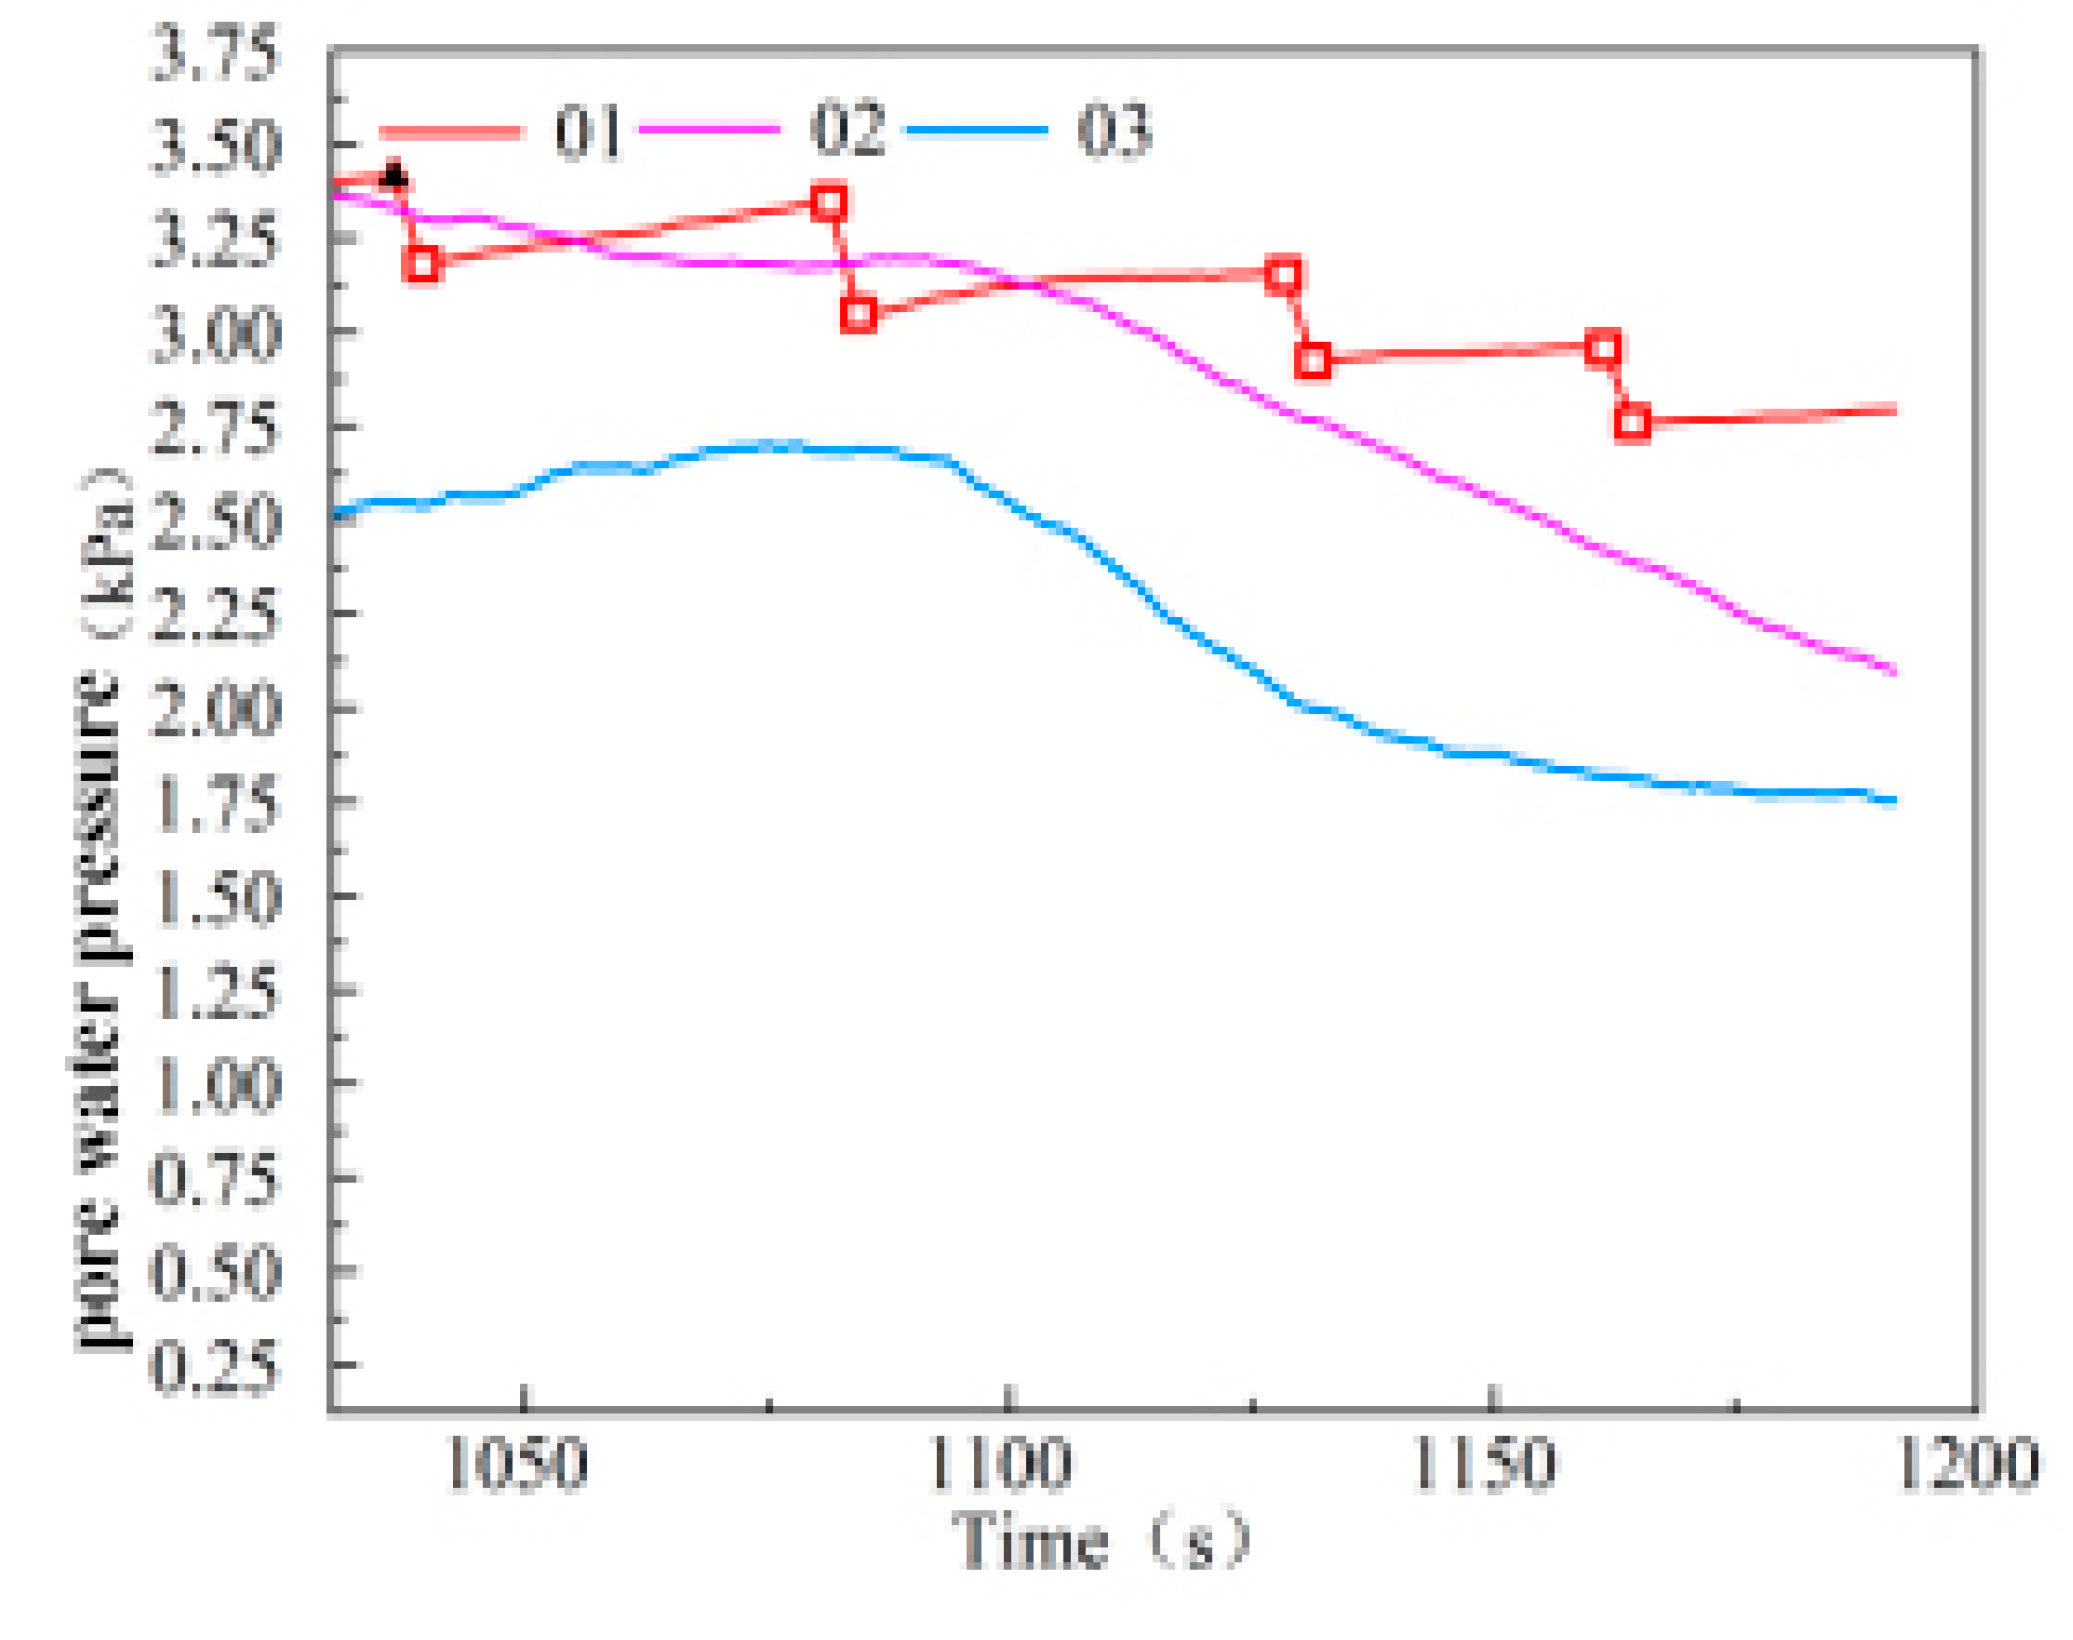
By idealizing the slope model, the failure of the model can be divided into three stages in the short-duration and high-intensity rainfall condition. The overall time-pore pressure variation diagram of 01-05 sensor and the time-pore pressure variation diagram of different time periods are drawn respectively, as shown in the figure below.
According to the analysis of
Figure 16,
Figure 17,
Figure 18,
Figure 19 and
Figure 20, the first stage is the infiltration stage. From the pore pressure changes in this stage, it can be seen that the pore pressure change rate of 01 is close to zero due to the existence of calcium carbonate "diaphragm" in the pores of sand body characterized by sensor 1. Solution percolation exists in the M-1 model. When pore pressure drops in No. 02 of the upper part, solution percolates down, while pore pressure rises in No. 03, which is a top-down seepage change feature. The second stage is the rainfall stage. From 872s, due to the surface solidification, the cementation of the slope surface and the top area is obvious. The rainfall is mostly transformed into runoff flowing down the slope surface, and the slope surface presents a transient saturation state. However, the cementation of calcium carbonate on the surface limited the infiltration of a large amount of water, and the pore pressure of 02 and 03 did not change significantly. Due to the increase of water content, the decrease of basement suction leads to the decline of slope stability. When the slope begins to slip 109s, the basement suction in the soil is zero, and the slope model begins to slide and fail. After 160s, the rainfall ends. The third stage is the sliding unloading stage, starting from 1033s. After the rainfall, the overlying pressure continues to unload, the slope is damaged in stages, and the pore pressure decreases in a stepped way. The pore pressure deformation law of the slope without MICP reinforcement should be a broken line of slow decline after failure. However, after MICP reinforcement, the creep of S-3 slope is very slow after the rainfall is stopped. Due to the cementation in the sand body, the pore pressure in the slope is discharged in a stepped manner, and the basement suction is a process of repeated rise and then decline. After MICP reinforcement, the slope can maintain a certain stability after failure and prolong the creep time.
3.1. Fluid-slip pattern
After three rounds of reinforcement on the slope of M-1 model, short-duration high-intensity scour action was simulated for the model, and the flow rate of the scour device was measured. According to the regulations of the national meteorological department, the rainfall of 23mm reached the heavy rain level within 12 hours (15mm-29.9mm), and the rainfall intensity was 23mm/min. Exceeding the local average daily rainfall standard in Dongfang City. The damage morphology of M-1 was observed after being scoured.
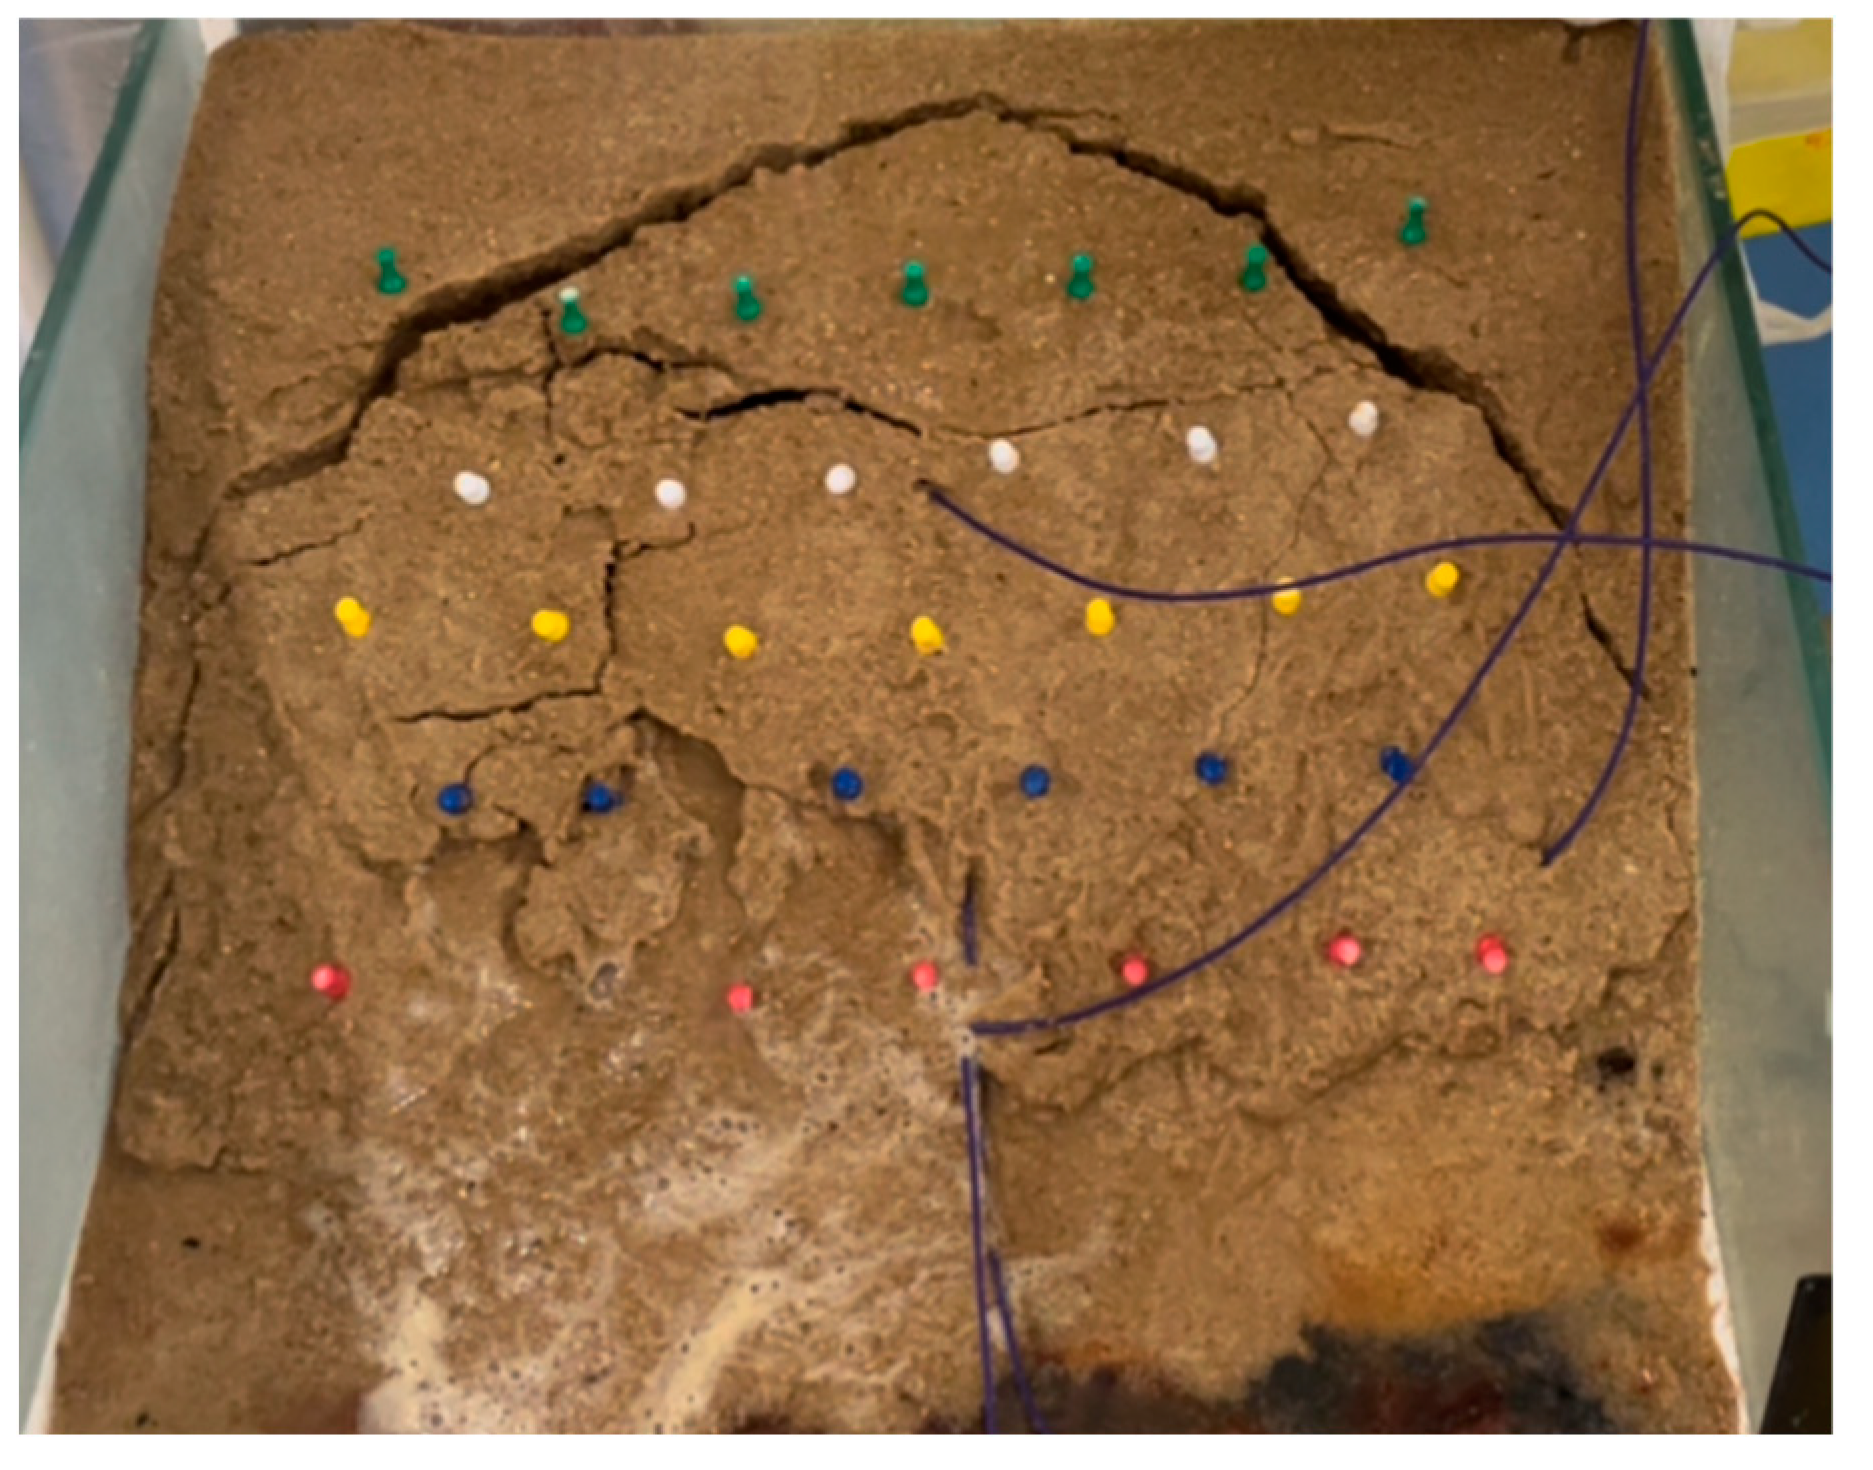
M-1 failed after 150s under the rainfall simulation, and the slope lasted a long time from the beginning of erosion to sliding failure. After the erosion of rainfall intensity, the failure mode showed as the overall sliding failure of the slope. After 36s, the fracture began to develop on the right side of the M-1 slope top, with a diagonal fracture length of 4cm and a width of 2mm. The left oblique crack develops after 50s, with a length of 6cm and a width of 2mm. The sand on the slope surface is not damaged along with the entraining of runoff, and the sand on the slope is not easy to lose. After 103s, the oblique cracks on both sides were connected, and the tension cracks appeared at the rear edge of the slope top. The width of the cracks was 3mm, and they were distributed in a circular arc. The green thumbtack band on the slope top moved down. The left side of the slope surface was missing, the red pushpin belt at the slope Angle began to deform, and the slope foot was unloaded. The moisture content of the lower soil was close to saturation, but the slope body integrity was maintained well. The details are shown in
Figure 21.
At 115s, due to the scour effect, the internal water content of the soil increases, the effective stress decreases, and the anti-sliding force of the soil decreases. The slope surface of the model begins to slide downward as a whole. The development of tension cracks induces rainfall convergence, and the infiltration of rainwater further increases the water content of the model, which accelerates the further sliding of the slope. Although the surface of the model is damaged to some extent, it still maintains good integrity. The failure characteristics of the model are different from those of the model without MICP reinforcement. The sliding surface inside the slope can be seen from the lower M-1 side view, and it can be inferred that the sliding surface is located at 4-5cm.The details are shown in
Figure 22.
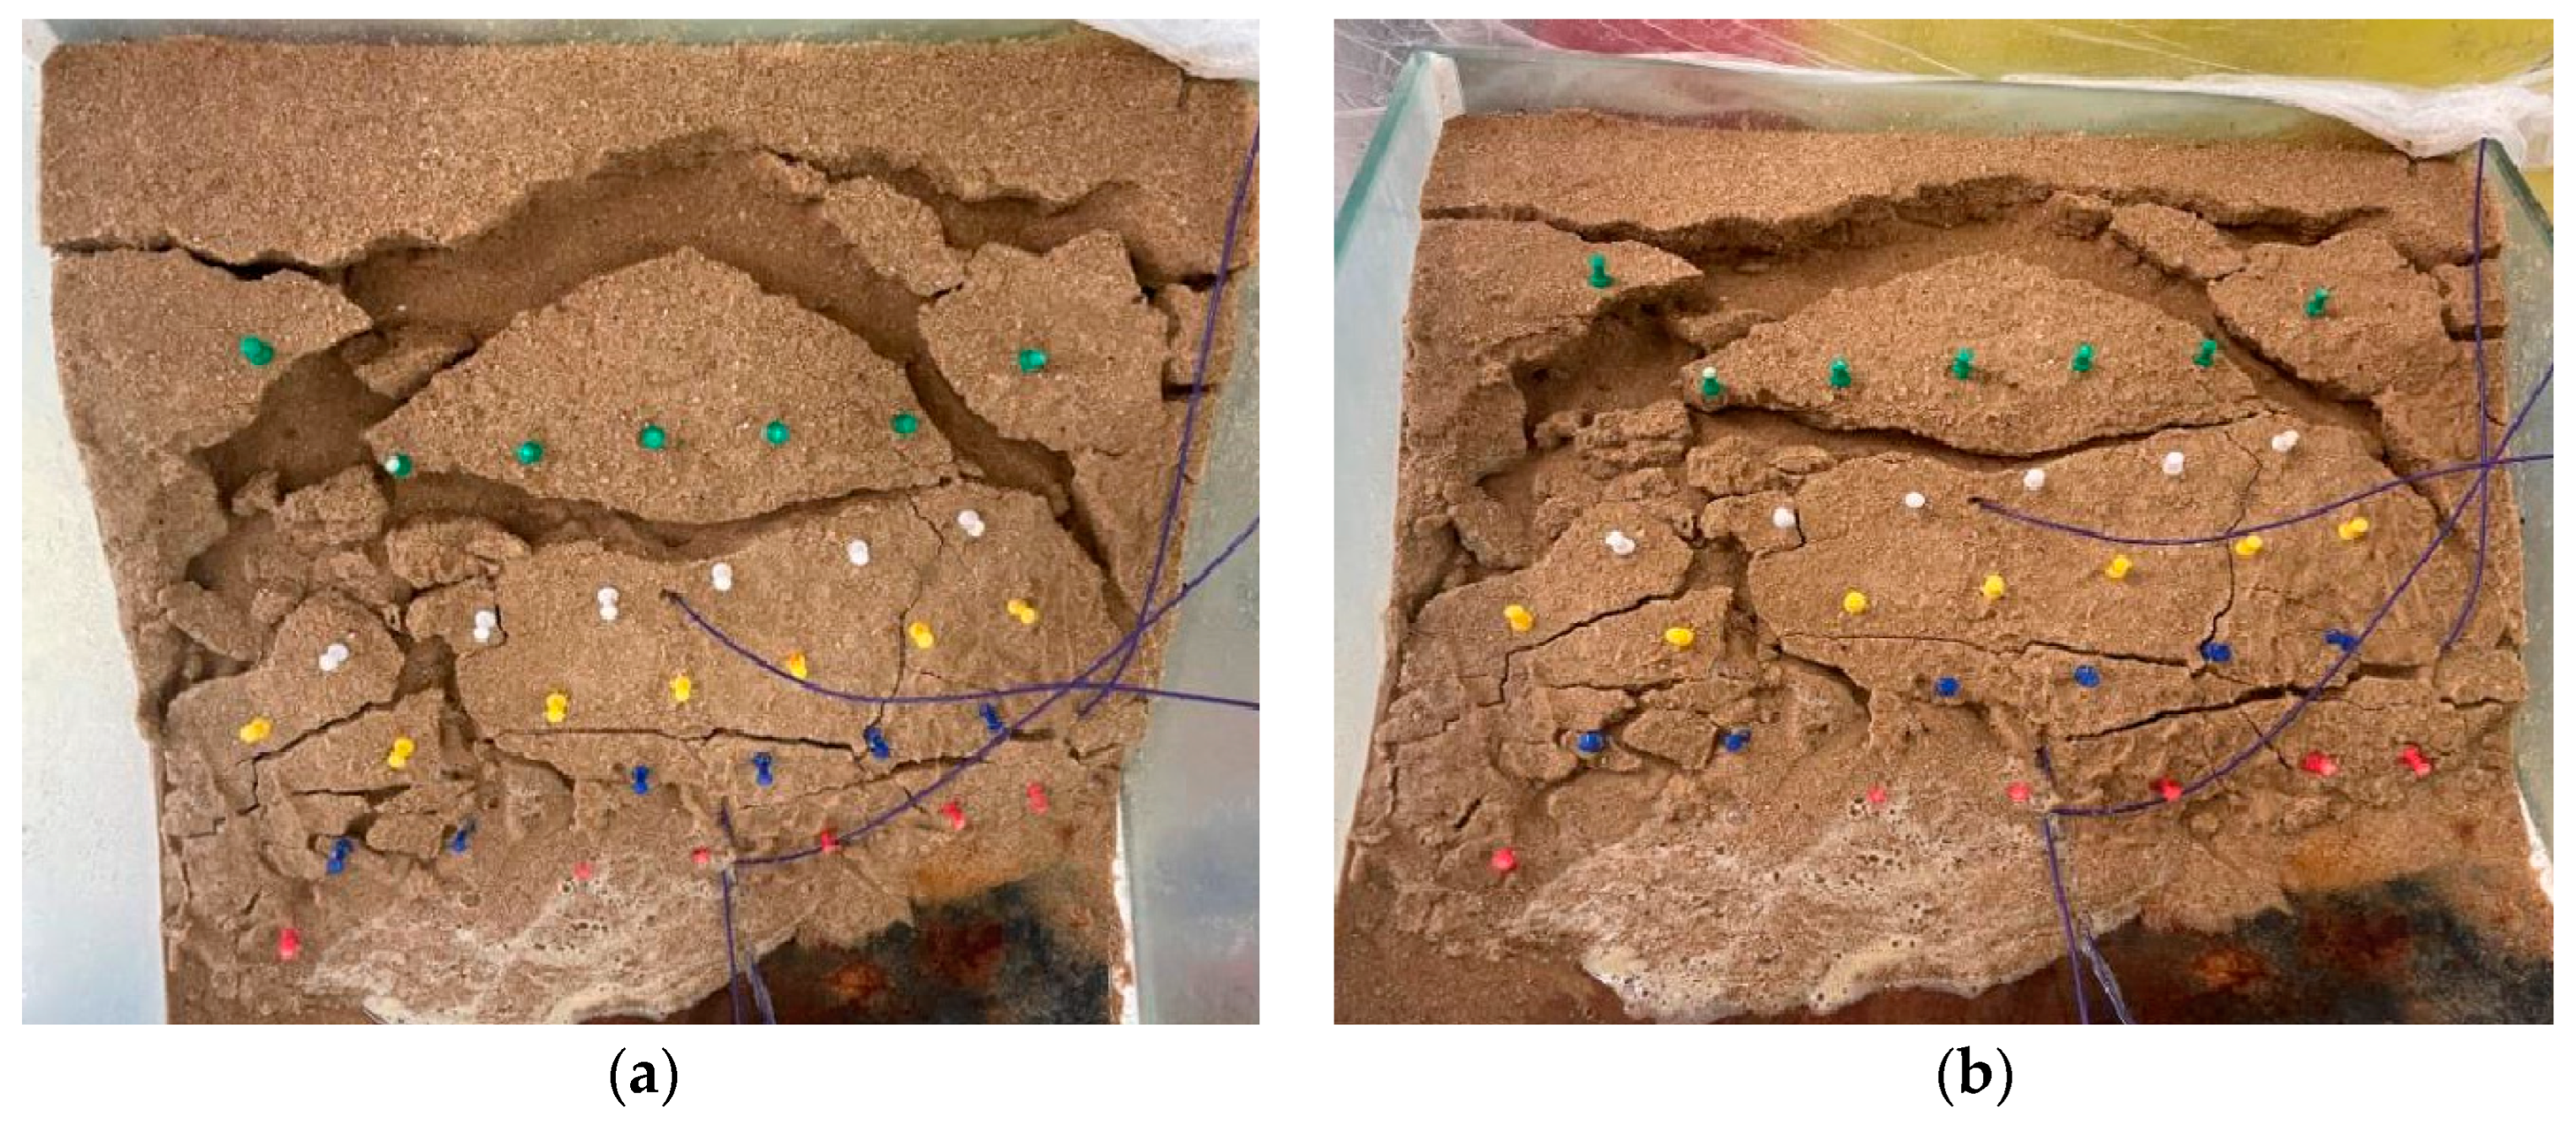
When the simulated rainfall effect was stopped, the slope model morphology was divided from the front and top surfaces due to the development of cracks, the surface sand of the slope block remained intact, and the thickness of the segmented block was about 3-4cm. After 150s of simulated scour, the model was damaged. The failure characteristics of MICP solidified slope model M-1 are manifested as fractional sliding. Due to the loss of sand, the front edge of the model has obvious unloading effect and the largest deformation. After slope Angle slip and accumulation, the upper slope is still sliding and deformation slowly. The damage integrity of the model after MICP action is good in the short-duration and high-intensity simulation of rainfall, and MICP spray irrigation curing technology can effectively resist the surface erosion.The details are shown in
Figure 23.
4. Conclusions
(1) In the M-1 model, after two times of reinforcement, calcium carbonate "film" was formed in the shallow pores of the slope, which reduced the pore pressure change rate during the infiltration of solution. The model first reacts to produce calcium carbonate in the shallow layer, the shallow layer solidifies well, and the space between sand particles decreases gradually. The lower part of the model shows the process of solution infiltration, and the secondary wave crest rises slowly, indicating that the product prevents solution infiltration. The pore pressure of the sensor with the same horizontal depth has the same change law. The depth below 10cm of the top surface has less products, the pore pressure change rate is large, and the curing effect is general.
(2) The S-3 slope strengthened by three sets of turns failed after 150s. The surface blocks of the slope were divided due to the development of cracks. The thickness of the divided blocks was about 3-4cm. After 109s of rainfall, the moisture content of soil increased, the effective stress and anti-sliding force of soil decreased, and the slope surface of the model slipped downward as a whole. The development of tension cracks induces rainfall convergence and accelerates slope slip. Although the surface of the model has some damage, it still maintains good integrity. The failure characteristics of the slope are as follows: fractional sliding. Due to the loss of sand, the unloading effect of the model front is obvious and the deformation is the largest. At the beginning of the slip, the suction of the base is zero, and the failure form shows the overall slip and the creep unloading in the later stage.
(3) After MICP reinforcement, creep of M-1 slope model is very slow. Due to cementation in sand body, pore pressure in slope is discharged in a stepped manner, and basement suction is a process of rising and then falling repeatedly. MICP slope can maintain a certain integrity after failure, prolong the creep time, improve the water stability and anti-erosion of MICP slope under the action of heavy rainfall, and improve the safety factor of slope.
Author Contributions
Conceptualization, J.N. and Y.P.; methodology, M.J.; software, Z.K.; validation, J.C.; formal analysis, M.J.; investigation, W.H.; resources, Z.K.; data curation, J.C.; writing—original draft preparation, Y.L.; writing—review and editing, Y.P.; visualization, M.J.; supervision, Y.L.; project administration, J.N.; funding acquisition, Y.L. All authors have read and agreed to the published version of the manuscript.
Funding
This research was funded by the Research and application of intelligent construction technology and intelligent management of ky Marine Building (ZDKJ2021024), the Study on microbiological reinforcement technology of silty sand Subgrade in coastal area(521RC1040) and Study on high performance supporting structure of coastal tunnel with high water pressure(522CXTD510).
Institutional Review Board Statement
Not applicable.
Informed Consent Statement
Not applicable.
Data Availability Statement
Not applicable.
Conflicts of Interest
The authors declare no conflict of interest.
References
- Jia, H.; Jian, C.; Hanlong, L.; Yufeng, G.; Bing, L. Research progress of microbial geotechnical technology [J]. Chinese Journal of Geotechnical Engineering, 2016, 38, 643–653. [Google Scholar]
- Dejong, J.T.; Fritzges, M.B.; Nüsslein, K. Microbially induced cementation to control sand response to undrained shear[J]. Journal of Geotechnical and Geoenvironmental Engineering, 2006, 132(11): 1381- 1392.
- Al Qabany, A.; Soga, K. Effect of chemical treatment used in MICP on engineering properties of cemented soils. Géotechnique, 2013, 63(4): 331-339. [CrossRef]
- Shao, G.; Chen, H.; Hou, M.; Huang, R.; Liu, P. Variation characteristics of mineralization reaction of silty soil solidified by microbial grouting [J/OL]. Chinese Journal of Geotechnical Engineering :1-7[2022-06-22].
- Li, X.; Wang, S.; He, B.; Shen, T. Soil and Rock Mechanics,2019,40(08):2956-2964+2974.
- Xu, P.; Wen, Z.; Yang, S.; Liu, Z.; Leng, M.; Peng, J. Experimental study of MICP-solidified sand under different particle sizes [J]. Geological Journal of China Universities,2021,27(06):738-745.
- Whiffin, V.S. Microbial CaCO3 precipitation for the production of biocement[D].Perth Australia: Murdoch University, 2004.
- Ma, R.; Guo, H.; Cheng, X.; Liu, J. Experimental study on permeability characteristics of reinforced calcareous sand by microbial mixing [J]. Rock and Soil Mechanics,2018,39(S2):217-223.
- LIU L, LIU H, STUEDLEIN A W, et al. Strength, stiffness,and microstructure characteristics of biocemented calcareous sand[J]. Can Geotech J, 2019, 56(10): 1502–1513.
- Fang Xiangwei, Li Jingxin, Li Jie, Shen Chunni. Triaxial compression test and damage constitutive model of microbial solidified coral sand [J]. Rock and Soil Mechanics,2018,39(S1):1-8 (in China).
- FENG K, MONTOYA B M. Influence of confinement and cementation level on the behavior of microbial-induced calcite precipitated sands under monotonic drained loading[J].Journal of Geotechnical and Geoenvironmental Engineering,2016, 142(1): 04015057.
- Yi Manbing, Wang Yanning, Liu Dong,Ankit Garg, Lin Peng. Experimental study on coastal soft soil reinforcement based on microbial induced calcium carbonate precipitation technology [J]. Journal of Shantou University (Natural Science Edition),20,35(03):47-54.
- Tang Yang. Study on solidification characteristics and fracture mechanism of microbial cemented sand body [D]. Tianjin University,2018.
- Yin Liyang, Tang Chaosheng, Xie John, Lv Chao, Jiang Ningjun, Shi Bin. Effects of microbial mineralization on properties of rock and soil materials [J]. Rock and Soil Mechanics,2019,40(07):2525-2546 (in Chinese).
- Hu Mingjian, Wang Nyum, Zhang Pingcang. Experimental study on slope stability and induced landslide under Rainfall condition: A case study of landslide piled breccia soil slope in Jiangjiagou Basin [J]. Chinese Journal of Geotechnical Engineering,2001(04):454-457.
- Hu Qizhi, Liu Tongde, Ding Zhigang, et al. Effect of rainfall infiltration on stability of slope reinforced by microbial grouting [J]. Southern Agricultural Machinery,2021,52(08):5-8+14.
- Wang Zhaoyang, Wang Jungang, Xu Renyu, Yao Xin, Li Yifan. Pore pressure characteristics of sand caused by water level rise and fall [J]. Journal of Shandong University of Technology (Natural Science Edition),2022,36(02):77-80.
- Zeng Qiang, Influence of unsaturated seepage characteristics on slope stability [J]. Water Resources Science and Cold Area Engineering,2022,5(01):10-14.
- Yuan Xiaolu, Zhou Shihua. Research on Application of MICP in Building Materials [J]. Yangtze River,2012,43(03):76-79.
- Xu Pengxu, Wen Zhili, Yang Simeng, et al. Experimental study of MICP-solidified sand under different particle sizes [J]. Geological Journal of China Universities,2021,27(06):738-745.
- Zhou Yi-zheng, Guan Dawei, Cheng Liang. Application of microbial induced carbonate in soil reinforcement [J]. Geological Journal of China Universities, 201,27(06):697-706.
- He Xiaoying, Li Dong, Ren Yongbiao, et al. Study on the effect of MICP on the consolidation characteristics of viscous debris flow sediments [J]. Yangtze River,2021,52(06):148-153.
- Li Xian, Wang Shixiang, He Binghui, et al. Soil and Rock Mechanics,2019,40(08):2956-2964+2974.
- Tang Zhaoguang, Wang Yongzhi, Duan Xuefeng, et al. Development and performance evaluation of micro-porous water pressure sensor with high frequency response [J]. Chinese Journal of Rock and Soil Engineering,2021,43(07):1210-1219+1375-1376.
Figure 5.
Stress-strain data acquisition instrument is a figure: (a) Sensor constructionl; (b) Picture of real products.
Figure 5.
Stress-strain data acquisition instrument is a figure: (a) Sensor constructionl; (b) Picture of real products.
Figure 6.
Model box size schematic.
Figure 6.
Model box size schematic.
Figure 9.
Internal sensor buried location diagram.
Figure 9.
Internal sensor buried location diagram.
Figure 10.
Experimental model display.
Figure 10.
Experimental model display.
Figure 11.
Overall model design.
Figure 11.
Overall model design.
Figure 12.
Horizontal direction of the first, second, third wheel reinforcement pore pressure changes.
Figure 12.
Horizontal direction of the first, second, third wheel reinforcement pore pressure changes.
Figure 13.
Pore pressure changes in the first and second rounds of cementing fluid.
Figure 13.
Pore pressure changes in the first and second rounds of cementing fluid.
Figure 14.
Pore pressure changes in the third round of reinforcement when bacteria liquid and cementing liquid pass through.
Figure 14.
Pore pressure changes in the third round of reinforcement when bacteria liquid and cementing liquid pass through.
Figure 15.
Changes of 01 time - pore pressure in three rounds.
Figure 15.
Changes of 01 time - pore pressure in three rounds.
Figure 16.
Variation of 01-05 pore pressure during rainfall.
Figure 16.
Variation of 01-05 pore pressure during rainfall.
Figure 17.
01-05 Sensor rainfall duration-pore pressure change from 850-1200s.
Figure 17.
01-05 Sensor rainfall duration-pore pressure change from 850-1200s.
Figure 18.
01-03Pore pressure changes when the sensor is 0-800s.
Figure 18.
01-03Pore pressure changes when the sensor is 0-800s.
Figure 19.
01-03 Sensor pore pressure change from 800 to 1050s.
Figure 19.
01-03 Sensor pore pressure change from 800 to 1050s.
Figure 20.
01-03Pore pressure change of the sensor at 1050-1200s.
Figure 20.
01-03Pore pressure change of the sensor at 1050-1200s.
Figure 21.
Integral slip.
Figure 21.
Integral slip.
Figure 22.
M-1 Model slippage side view.
Figure 22.
M-1 Model slippage side view.
Figure 23.
Front and top slope.
Figure 23.
Front and top slope.
Table 3.
Sensor calibration coefficient.
Table 3.
Sensor calibration coefficient.
| Sensor |
Calibration coefficient |
| 1 |
3298.62kPa/V |
| 2 |
3316.59kPa/V |
| 3 |
3501.72kPa/V |
| 4 |
3207.78kPa/V |
| 5 |
3279.31kPa/V |
Table 4.
M-1 Basic parameters of slope model.
Table 4.
M-1 Basic parameters of slope model.
| Slope base length |
Crest length |
Slope height |
Slope gradient |
Moisture content |
Reduced scale |
| 300mm |
100mm |
200mm |
1:1 |
20% |
1:25 |
Table 5.
Solution irrigation scheme.
Table 5.
Solution irrigation scheme.
| Stationary liquid |
Bacteria solution |
Consolidating fluid |
Time interval between the three solutions |
| 1000mL |
1000mL |
2000mL |
10min |
|
Disclaimer/Publisher’s Note: The statements, opinions and data contained in all publications are solely those of the individual author(s) and contributor(s) and not of MDPI and/or the editor(s). MDPI and/or the editor(s) disclaim responsibility for any injury to people or property resulting from any ideas, methods, instructions or products referred to in the content. |
© 2023 by the authors. Licensee MDPI, Basel, Switzerland. This article is an open access article distributed under the terms and conditions of the Creative Commons Attribution (CC BY) license (http://creativecommons.org/licenses/by/4.0/).
