
Submitted:
15 June 2023
Posted:
15 June 2023
You are already at the latest version
Abstract
Few assessments and indicators on cultural sustainability have been applied to national and local development policies in Indonesia. Said policies have had the notion of space solely defined through its physical aspect. This study aims to establish the cultural aspect of space as a workable indicator for sustainability in development planning. The study grounds itself in the coastal area of Kalibaru Subdistrict, North Jakarta, a region characterized by dense and culturally diverse residential areas located in between heavy industrial development. Primary data are gathered from 10 informants of varying occupations with residence in the area for more than 20 years. In-depth interviews and Spatial Cognitive Mapping were conducted to articulate the cultural spaces of their everyday activities. Prevalent themes of spatial practice were identified and described in 3 categories of 1. core cultural spaces, 2. tactical cultural spaces, and 3. spaces of cultural conflict. The participatory procedures to identify cultural spaces as described in the study were concluded to be operable within existing indicator or index frameworks for sustainability policy. The availability of cultural spaces and its enumeration may be incorporated into national surveys for effective data collection and use.
Keywords:
cultural space
; cultural sustainability
; culture indicators
; sustainability indicators: cultural policy
; development policy
; sustainable development.
1. Introduction
In Indonesia, the history of “sustainable development” goes back to the first national development policies initiated in 1966-1968, referring then to the singular pillar of economic development. Implementation of the environmental pillar of sustainable development came with the 1978 establishment of the Ministry of Environment. Presently, sustainable development as defined and mainstreamed globally through the Sustainable Development Goals (SDGs) is mandated to the Ministry of National Development Planning/National Development Planning Agency (Bappenas) and at the provincial level to the Regional Development Planning Agency (Bappeda). Through the Presidential Regulation No. 59 of 2017 concerning the Implementation of the Sustainable Development Goals, these agencies integrate the coordination, planning, supervision, evaluation, and reporting of the implementation of the SDGs and its indicators into the formulation of the 20-year Long Term Development Plan (RPJP) and the 5-year Medium Term Development Plan (RPJM).
A significant body of literature has argued that international indicators are considered unable to capture the urgency and aspiration for sustainability that are typical at the local scale. Globalization tends to homogenize human tastes and preferences, limiting the space for articulating ethical capital [1]. Most indicators are limited in their approach which tends to be quantitative and unable to cover the complexity of the concept of sustainability. Other indicators do not necessarily directly involve a quantitative process because not all existing factors can be weighed or calculated [2]. Several categories of indicators cannot be weighed based on economic benefits, such as loss of intrinsic value or cultural, recreational, and aesthetic factors [3]. Urgent challenges for sustainability indicators, include 1. More diverse case studies, 2. Specific cultural contexts, 3. Better implementation mechanisms, 4. Integration of sustainability aspects that are not yet common, and 5. Finding better criteria or preparation methods [4]. Information presented by indicators must be scale-specific (macro-meso-micro), wherefor macro scale indicators are widely available but tend to be biased towards general data, hence the urgency to develop indicators on a micro scale [5].
It is noteworthy that the environmental policies made in developing countries since the mid-1970s were mostly top-down initiatives by governments, not out of necessity but as a response imitating Western developments [6]. Government at the local level is the main driver of policies towards sustainable development, and an active local government is needed that can lead the way in collaboration with civil society [7]. National spatial planning during the Indonesian New Order era was based on Spatial Planning Law No. 24 of 1992 and has since been replaced by Spatial Planning Law no. 26 of 2007 which is more participatory and accountable according to the concept of decentralization and delegation of power to local governments [8]. There are now numerous community groups actively demanding involvement in local planning. Planning systems that provide direct connections between government agencies and local community groups are great opportunities for new relationships consistent with decentralization [9]. In development planning, there are two ways to develop sustainability indicators, namely 1. Decision makers and experts determine indicators based on various existing guidelines (top-down, expert-led), and 2. Involve community participation in determining their own sustainability indicators (bottom-up, citizen led) [10-12]. A top-down approach is needed to ensure indicators can be applied and compared objectively and measurably on a macro scale. However, the top-down approach tends to be unable to consider important indicators that are unique to an area and community, such as those of cultural sustainability.
Current discourse on sustainable development has placed considerable importance on the analysis of cultural sustainability indicators. Cultural sustainability has been solidified as the fourth pillar of sustainable development along with the pillars of environmental sustainability, social sustainability, and economic sustainability. The 2005 UNESCO Convention on the Protection and Promotion of the Diversity of Cultural Expressions has emphasized the central role of culture as a transversal issue and fundamental pillar in sustainable development. Initiatives to discuss culture in development studies have been presented in reports such as the WCCD in 1995, the European Council in 1997, UNESCO in 2001, and the UCLG Agenda 21 for Culture in 2009 [13]. Cultural sustainability is still not discussed as much as economic, environmental, and social aspects in sustainability assessments [14]. In the context of national and regional policies, culture is usually discussed within the scope of social sustainability or not at all [13]. There have been no assessment criteria, indicators, nor sufficiently developed academic studies on cultural sustainability to be applied to sectoral and regional policies [15]. Cultural sustainability assessment is relevant so that decision makers do not conflict with existing local and cultural values at targeted development sites [16]. Measuring and comparing cultural elements with their various characteristics remains a complex challenge [17].
The definition of culture in this study refers to the 2001 UNESCO Universal Declaration of Cultural Diversity as a collection of spiritual, material, intellectual, and emotional characteristics that are typical of a society or social group, which includes, in addition to art and literature, lifestyle, ways of living together, value systems, traditions, and beliefs. This study further defines the scope of culture as its practice in everyday space, referring to Lefebvre [18] and de Certeau [19] on spatial production as the interaction of environment and culture. There are three implications in the production of space, namely 1. The spatial practice of the occupants in their daily routines, in spaces that have been provided for work, personal life, and recreation, 2. The representation of space as conceptualized by planners, scientists, and engineers, and 3. The representational spaces that are internalized through symbols by the occupants, with narratives that are often referred to as culture [18]. Occupants utilize defensive tactics in spaces that are produced and regulated by the strategies of governing bodies [19]. These tactics are spatial practices to redefine representational spaces that deviate from the order made by planners. Occupants of space move themselves in a tour that can never be fully defined by the network of map boundaries in spatial development planned by government and company strategies [19].
There is a gap between the above ontology of culture and current national policy processes in understanding the impact of culture on sustainable development. According to the 2022 UNESCO Global Report, only 13% of the Voluntary National Review (VNR) of SDGs from Member States have recognized the role of culture in sustainable development. In 2019, UNESCO launched the Culture Development Indicators 2030 as a digital platform to record each Member State initiative in developing indicators for cultural sustainability. In Indonesia, cultural affairs are mandated to the Directorate-General of Culture under the Ministry of Education, Culture, Research, and Technology. Implementation of cultural sustainability is monitored nationally through the Cultural Development Index (Indeks Pembangunan Kebudayaan, IPK) initiated by the Directorate-General and Bappenas. The index is to be used as a basis for cultural policy formulation and to serve as a reference in cross-sectoral coordination. The index consists of seven dimensions (cultural economy, education, socio-cultural resilience, cultural heritage, cultural expression, literacy, and gender) with indicator data compiled at a provincial level. This study aims to establish cultural space as a possible eighth dimension of the IPK to further align cultural sustainability with the development and spatial planning sectors. A participatory mapping in the coastal area of Kalibaru Subdistrict, North Jakarta, is demonstrated as an operable method to include cultural spaces in frameworks for sustainability policy.
2. Materials and Methods
2.1. Study Area
The Jakarta Bay coast is one of the most environmentally degraded areas in the province. In 2017, the entire bay sea has moderate-to-heavy polluted water quality [20]. As the place where all rivers end their course from the mainland of Jakarta, this coastal ecoregion remains vulnerable at present to further water pollution. Coastal areas are also significantly affected by climate change, including the frequent occurrence of hydrometeorological disasters such as floods and landslides. Fire disasters also occur often in the densely populated residential areas in Jakarta, generally caused by electric short circuit. The risk of flooding can be exacerbated by the phenomenon of land subsidence caused by several factors, such as excessive groundwater extraction, high building loads, or naturally occurring tectonic forces.
Cultural conflicts arising from the development of the Jakarta Bay coast are rarely subjects for evaluation. Nevertheless, the Jakarta Regional Development Plan of 2023-2026 envisions an inclusive city where all citizens have the same right to live and participate directly in urban development, or the right to the city, as termed by Lefebvre. Apart from the struggle for rights and power, the lack of space is included in the phenomenon of socio-economic conflicts that always occur in city centres [18]. In Indonesia, the regional autonomy brought forth by the Reformation should have strengthened participation in local spatial planning. Instead, regional autonomy is seen more as an opportunity to attract investment to the respective regional governments [21]. The role of government from a spatial and cultural development perspective is described in the “centre-periphery” concept where the “centre” (government) forms and controls space with the idea of reconstruction directed to another entity, namely the "periphery", to be absorbed as part of the centre [22]. The concept of “centre-periphery” space may be contrasted with the concept of space in a maritime environment, which is based on a “network” ideology that tends to move outward rather than inward [22]. The maritime coastal life is characterized by fragmentation and plurality of powers, with a high intensity of outward relations, thus weakening the existence of a single centre.
In the case of Jakarta, since the Dutch colonial era there has been a process of transformation from a coastal environment with a “network” development concept towards the “centre-periphery” concept. At the time, the large number of Asian settlements clustered around the city wharves encouraged the expansion of Batavia to the south [23]. From the beginning to the middle of the 18th century, the Dutch began to leave Batavia, which was considered unhealthy, and resettled to the south around Weltevreden and Koningsplein (now Merdeka Square). Since the early 1970s, there has been an increasing number of new housing developments in the suburban ring for the middle and upper class by large private companies [23]. There are also numerous export-oriented industrial estates developed by public and private investors, reflecting the shift of manufacturing in the city towards the suburbs. Jakarta is a National Strategic Area from an economic point of view consisting of the Core Urban Area and the Surrounding Urban Area which form the Metropolitan Area. Jakarta remains a development priority as an economic centre on a global scale, where the “centre-periphery” characteristics can also be seen in its urban spatial plan, equipped with a network of radial-shaped arterial roads.
Even with the ongoing “centre-periphery” development, Jakarta remains a coastal city. With an altitude between -2m to 50m above sea level, and an average of only 5m above sea level, Jakarta is crucially formed by water [24]. Even though Jakarta is a coastal city, the vast waters seem to be a place far away from the daily lives of urban residents [25]. Jakarta has abandoned its coastal identity and the “network” spatial concept since the mid-19th century when the Dutch colonial government moved its administrative centre. Even though the idea of a modern coastal city is starting to produce cultural capital, these values are not inherent but rather something that must be newly built into the coast [25]. The common justification for new development on the coastal area is often based on the inequality between regions, where the poverty rate in the Thousand Islands (Jakarta province) have reached 14.87% and in North Jakarta reaching 6.78% in 2020, far below the provincial poverty rate of 4.69%. Dramatic spatial transformations are also shaped by political-economic alliances between developers and local governments, such as in coastal reclamation planning, as well as external influences from international issues and global markets [26-27]. The transformation of urban areas also occurred within the framework of incidental domestic and international events endorsed by political will, such as the river normalization program and the opening of the MRT and LRT lines to coincide with the 2018 SEA Games [24].
Referring to Lefebvre, the overall transformation of physical space in Jakarta through planning and development will suppress the spatial practices of its inhabitants and transform the structures of its society. The first variable in the transformation of society in Jakarta is the influx of migrants from all over Java and other islands in Indonesia [23]. The 1961 census, the first since 1930, showed that only 51% of Jakarta's population had been born there. Nearby villagers and suburban squatters are slowly displaced by the process of selling agricultural land at low prices for resale as building lots or houses to middle-class buyers who want to get away from the crowds and high prices in the city centre [23]. From 1961 to 1971, Jakarta's urban population almost doubled. Significant societal transformation again occurred after the Reformation in the early 2000s, where the state allowed temporary informal settlements to grow on Jakarta's abandoned or empty land (under toll roads, along riverbanks, and railroads) to prevent homelessness, unemployment, and socio-political unrest [24]. After the Reformation, there has also been an increase in citizen participation in spatial planning and budgeting through various forms of organic collaboration between the community and its local government [24]. Apart from being driven by in-migration from rural Indonesia to the city, societal transformation also happened by the deconcentrating of residents moving out of the city centre [28]. While the discourse on sustainability and increasing efforts to protect the environment continues to increase, urban economic development is also encouraging environmental degradation and pollution. In this situation, the elite community has the position and power to benefit from both (economic growth and environmental protection), while the poor will experience economic stagnation and be trapped in a living environment far from the priorities of sustainable urban development [28].
The study area encompasses the Jakarta Bay Strategic Area as defined in the Jakarta Capital Province Medium Term Development Plan, along with the areas planned for the development of reclamation islands. The operational boundaries of the study were further narrowed with reference to the Environmental Sensitivity Index in the Jakarta Bay Area which measures the potential loss of economic, social, physical, and biological value of existing land, identifying areas with high levels of sensitivity (vulnerability). Kalibaru Subdistrict is described in this category as a dense residential area bordering the sea and flanked by industrial area and port, with significant number of capture fisheries and green mussel cultivation.
2.2. Research Approach
This study was carried out with a qualitative approach to maintain the perspectives of stakeholders and avoid generalizations or single conclusions. The development of sustainability indicators shall prioritize to reflect the diversity of society as best as possible to attain a comprehensive perspective on local peculiarities and integrate as much as possible from conflicting opinions [29]. By articulating various interpretations of how people act and think, stakeholders can see the meanings of everyday environmental practices that are often taken for granted [30].
Primary qualitative data are gathered from informants in the form of oral history and spatial cognitive maps from purposive interviews through cluster sampling. The study engaged 10 informants as community representatives from the Kalibaru Subdistrict for in-depth interviews (Table 1). According to Lefebvre [18], social spaces are divided according to social relations such as between sexes, age groups, family organizations, and relationships at work. The inclusion criteria for the cluster sample are 1. Representatives from prevalent community organizations, 2. Representatives from prevalent fields of work, 3. Representatives from cohort ages of 15-64 or productive age, 4. Representatives of male and female sexes, and 5. Representatives with length of residence of more than 20 years. Secondary qualitative data were also used to support the study, namely data related to spatial structures, demography, and population mobility (planning history, historical maps, land use, population size, density, and distribution).
Spatial Cognitive Mapping method is used in the interview process. The informant's spatial practice is told through daily experiences with the informant making hand sketches on the map of the area in question. Cognitive Mapping is one of the most frequently used methods of structuring qualitative problems [14]. Spatial Cognitive Mapping has been used as a research tool since the 1960s from the realm of behavioural geography [31]. The method aligns with the view of de Certeau [19] in which spatial practices can be told through everyday experiences that respond to maps resulting from the production of knowledge and space. The advantage of cultural Cognitive Mapping is that it can voice the opinions of marginalized groups that are usually not heard by dominant decision makers [32]. Informants are generally interviewed with open-ended questions to accurately describe their life experiences on the topic being explored [33].
3. Results
3.1. Geographic Boundaries
The field study was carried out in the Kalibaru Subdistrict, located in the Cilincing District, North Jakarta City, Jakarta Capital Province. The Subdistrict consists of 14 RWs (hamlets) and 172 RTs (neighbourhoods) with a total area of 2,467 km2. Kalibaru Subdistrict borders the Jakarta Bay to the north, Cilincing Subdistrict to the east, and Koja Subdistrict to the west and south, as shown in Figure 1. Data on the neighbourhoods, number of households, total population, and area of each hamlet are described in Table 2.
The study classifies the Kalibaru Subdistrict into 3 RW clusters based on the categorization commonly mentioned by informants in the interview process, namely the Industrial Zone, West Kalibaru, and East Kalibaru, as shown in Figure 2. The number of RWs and descriptions of each cluster are described in Table 3.
3.2. Demographic Character
The population in Kalibaru Subdistrict is 88,622 people with a total of 28,632 families. Its settlement conditions are classified as heterogeneous in terms of age, sexes, and levels of education.
Figure 3 shows the population by age and sex. Of the three age cohort categories (0-14, 15-64, 65+), the 15-64 age category or the productive age group in Kalibaru Subdistrict is the highest.

Table 3.
Number of residents in Kalibaru Subdistrict by level of education.
| Level of education | Sex | Number of residents | |
|---|---|---|---|
| Male | Female | ||
| Not/Not yet schooled |
2,960 | 2,724 | 5,684 |
| Not finished elementary school |
4,282 | 3,824 | 8,106 |
| Graduated from elementary school/equivalent | 7,706 | 10,067 | 17,773 |
| Middle school/Equivalent |
9,848 | 9,832 | 19,680 |
| High School/Equivalent |
12,257 | 9,395 | 21,652 |
| Diploma I/II |
38 | 62 | 100 |
| Academy/Diploma III |
234 | 314 | 548 |
| Diploma IV/ Undergraduate Degree | 593 | 461 | 1,054 |
| Graduate Degree |
17 | 12 | 29 |
| Postgraduate Degree |
2 | 2 | 4 |
In Table 3, there are a total of 74,630 residents of Kalibaru Subdistrict categorized by their level of education. High school/Equivalent level is the category with the largest population, followed by the Middle school/Equivalent level and the Graduated from elementary school/equivalent level. Educational facilities available in Kalibaru Subdistrict include 21 elementary schools including Madrasah Ibtidaiyah (Islamic), 8 middle schools including Madrasah Tsanawiyah (Islamic), and 2 vocational high schools.
3.3. Development Conditions
The strategic coastal character of the Kalibaru Subdistrict is the basis for the direction of regional development to date. There are two development processes in the area with significant environmental impact, namely 1. the construction of the PTPIN/NCICD Phase A embankment by the Ministry of Public Works and Housing for tidal flood mitigation and 2. the development of the Kalibaru container terminal by the state-owned PT Pelabuhan Indonesia (Pelindo). The construction of the PTPIN/NCICD embankment will enter Phase B based on the Decree of the Minister of Public Works and Public Housing No. 112/KPTS/M/2022 concerning the Integrated Flood Control Concept and Predesign of Sea Wall Phase B of the National Capital Integrated Coastal Development (NCICD) on the Jakarta Bay Coast. Meanwhile, the development of the Kalibaru container terminal is also planned for NPCT2 and NPCT3 which will be located north of NPCT1 based on Presidential Regulation Number 36 of 2012 concerning Assignment to PT Pelabuhan Indonesia II (Persero) to Build and Operate the Kalibaru Terminal at Tanjung Priok Port. The Kalibaru container terminal will later be connected to the Cibitung-Cilincing Toll Road (JTCC) through the construction of the New Priok East Access (NPEA) or "sea highway" which will stretch across the entire northern coastal waters of Kalibaru Subdistrict (Figure 4). In addition to this policy, the Jakarta Capital Province Governor Instruction Number 55 of 2020 concerning the Acceleration of Improvement of the Flood Control System in the Climate Change Era has mobilized the procurement of 495 stationary water pump units and 327 mobile pump units spread across Jakarta to deal with recurring floods.
The impact of development on the coast is primarily felt by fishing community groups with their sea-oriented economic activities. The character of the coast also determines the type of space for economic activity in Kalibaru Subdistrict, including 1. bonded zones affiliated with national and foreign companies and 2. fisheries business areas by fishermen groups centred in fishing auctions (TPI) and fishery product processing spaces in the vicinity.
Land use in Kalibaru Subdistrict is dominated by residential use and trade/services/business use. Table 4 shows the largest types of land use, namely for 1. Very small house with an area of 38.86 ha, 2. Small house with an area of 14.89 ha, and 3. Open warehouse with an area of 12.11 ha. This is in accordance with the categorization by the Ministry of Environment and Forestry on Kalibaru Subdistrict as a dense residential area bordering the sea and flanked by industrial areas and ports, with intensive capture fisheries and green mussel cultivation activities.
3.4. Core Cultural Spaces
Informants were asked to tell stories and describe/mark the space for their daily activities and the impact of the development they experienced on the map through the cognitive mapping method. The mapping results were translated and reprocessed into 3 categories, namely 1. Core cultural spaces, 2. Tactical culture spaces, and 3. Spaces of cultural conflict.
The first category regarding core cultural spaces refers to the typological concept of spatial structure that has a core/centre. The maritime or coastal environment is based on a network ideology with a plurality of powers or multi-centres [22]. Thus, the cultural spaces in Kalibaru Subdistrict can be said to have several core spaces (Table 5). Figure 5 shows a spatial visualization of the core cultural spaces in the Kalibaru Subdistrict. Figure 6, Figure 7, Figure 8 and Figure 9 documents the current state of the spaces.
3.5. Tactical Cultural Spaces
The second category, namely tactical cultural space, refers to the concept according to de Certeau [19] namely tactics as spatial practice that deviates from the order of the planners. Spaces in this category can be temporary or informal, without clear boundaries or delineations in practice (Table 6). Figure 10 shows a spatial visualization of the tactical cultural spaces in Kalibaru Subdistrict. Figure 11 and Figure 12 documents the current state of the spaces.
3.6. Cultural Spaces of Conflict
The third category is the cultural spaces of conflict, where there are not only specific issues from residents with other residents or developers, but also prevalent environmental problems with impact vis-à-vis the everyday activities of its residents (Table 7). Figure 13 shows a spatial visualization of the cultural conflict spaces in the Kalibaru subdistrict. Figure 14, Figure 15, Figure 16 and Figure 17 documents the current state of the spaces.
3.7. Specific Cultural Topics
An overview of community transformation is carried out through a descriptive analysis of primary data that represents people's perceptions of changes in cultural values in the locations where they live. The informant's data was translated and reprocessed in Table 8 which explains the various specific cultural topics found in the Kalibaru Subdistrict.
4. Discussion
The descriptive analysis process carried out are in accordance with the aspirations of developing bottom-up indicators as conceptual criteria for cultural sustainability. The interviews were conducted as a storytelling process, in which the informants could reveal how they experienced the impact of change. The process of telling stories is considered to be able to encourage informants to be more open in expressing what is valuable in their socio-cultural context. According to de Certeau [19], stories have now sunk into secluded places and have been replaced by rumours disseminated by authorities and through the media. Each story is a story about the spatial practices of the occupants and users of space. In this study, the participation of various community groups helped to strengthen local identity and provide a means for all residents to identify with their community and its sustainability efforts. Decision makers need such a conceptual model of sustainability indicators to be implemented in development planning, while community participation can produce concrete ideas for follow up as a solution to environmental problems.
Articulating stories of cultural spaces of conflict in Kalibaru Subdistrict shall be done through perspectives given by Jane Jacobs [34]. The problem of gang brawls has been prevalent in interviews conducted, both in older areas like the traditional markets as well as newly built areas like the retention pond. All these places offer an “easy opportunity to crime” as described by Jacobs [34], in having 1. Not enough eyes upon the streets, 2. Children playing on the streets seen as a problem, and 3. A vacuum in open spaces that invite blight. Nevertheless, the Subdistrict Office and organisations that it associates with such as the Karang Taruna youth and PKK women’s organization have been taking central roles in fostering the community wellbeing and mediate support from external entities (private foundations, CSR, political parties, educational institutions) to tackle economic, social, and environmental problems in the area. Community organizations were able to elaborate the three kinds of problems well, being consciously aware that these are the categorizations usually held in exchanges with benefactors. However, problems framed in a cultural aspect were very rarely disclosed. The below discussion shall look at Jacobs’ three main reasons for blight in the public space of Kalibaru Subdistrict through the local, everyday cultural lens.
A city street that makes a safety asset out of the presence of strangers must have eyes upon the street and users on it to induce the people to watch the sidewalks in sufficient numbers [34]. Some areas filled with activity during the daytime, such as the market area around the Subdistrict Office, may become empty during the night. Other newer built places like the retention pond and areas piled by waste are empty throughout the day and are without lighting during the night. The informants of the study are already aware of the value of community surveillance and enthusiastically aspire to light these vulnerable places and fill them with activity (street bazaars, vendors, and ad hoc recreations). Proposals like these teem with informality which the Subdistrict Office usually avoid, unless packaged in a culturally relevant theme and occasion such as Ramadan or Independence Day. As such, culture here is used to justify, often successfully, the informality of tactics used by residents to deal with the problem of surveillance in vulnerable areas.
Among the superstitions of planning is a fantasy about children condemned to play on the city streets [34]. Like in many densely built areas, children in the neighbourhoods (RWs) of Kalibaru Subdistrict play on the streets while the adults wish they do not. The lack of dedicated spaces for children is a frequent complaint, and one that provides the basis for the new development of spaces like Plaza Kalibaru and Wisata Kalibaru that can function as playgrounds. Indeed, we may find these places full of children especially in the afternoons after school. The model for these aspirations may also come from the public football field in RW 15, which have been functioning as a playground since 2007. According to Jacobs [], by moving the play-ground from the streets to a dedicated space, the children have moved from a place with many eyes over them to one with few. In the case of Wisata Kalibaru, the coastal space directly faces the sea with little shade. Although designed as a recreational space, the adjacent spaces (sand depot to the west and ship splitting to the east) do not support this and hence there are few eyes in surveillance. On the other hand, Plaza Kalibaru has been more successful in this aspect. Due to its location where buildings enclose and face it [34], the nearby residents have their eyes on it throughout the day and street vendors are incentivized to park and sell their wares nearby. These minor-demand goods [34] in turn also incentivize people to visit the area. Meanwhile, not all children have moved their play from the streets to the new recreation areas. However, once the streets are empty, other opportunities are ready to fill the space, whether it be dried fish vendors looking to dry their goods, goat herders looking to park their animals, or simply residents looking for a nearby place to throw away their household rubbish.
It is important to acknowledge the central role of community organizations in the identified core and tactical cultural spaces in Kalibaru, and following that, the role of the Subdistrict Office in fostering those bonds. Jacobs [34] attributes the success of neighbourhoods mainly to localized self-government and the district as the mediator between neighbourhood communities and the city. Districts must help bring the resources of a city down to where they are needed by street neighbourhoods, and they must help translate the experiences of real life, in street neighbourhoods, into policies and purposes of their city as a whole [34]. In this sense, Kalibaru has been somewhat successful, as current development planners there have been able to continue to engage the communities in negotiation and dialogue. Nevertheless, the bigger national agenda at hand namely expansion of the terminal containers at NPCT2 and NPCT3, as well as the “sea highway” in the next five years, ultimately will have unprecedented impact on the community, especially fishermen. Edward Soja [35] explained the impact as stemming from the regional planning trend of serving the systemic network of the global economy through a regional division of labour. By expanding the container terminals and reducing the area for fishery and mussel farming in Kalibaru, major changes in the labour market and employment of its residents are anticipated, as seen in the Karang Taruna youth who have abandoned their prospects as new generations of fishermen and now accepted the lure of becoming temporary workers at the container shipping ports.
The cognitive mapping method for identifying cultural space in an area affected by development has been carried out in a participatory manner at Kalibaru Subdistrict. This process uncovered a wealth of cultural information that had not yet been recorded in data for development planning nor in national cultural sustainability indexes like the IPK. In the seven dimensions of IPK, there is no dimension yet that pays attention to the problems intervening in daily cultural spaces besides specific cultural heritage sites of outstanding value. Including the aspect of cultural space in the IPK can further synergize with the development and spatial planning sectors, especially regarding the preparation of local and national Long-Term and Medium-Term Development Plans which shall refer to the IPK to monitor cultural sustainability.
In spatial plans such as the above, there is a tendency to achieve legibility, which oftens erases many aspects of the view from below of the everyday [36]. Mumford [37] describes that reality implies a certain looseness and vagueness, a certain failure of definition. The dimensions of cultural space in the IPK shall provide, albeit limited, definition of this reality. The process of identifying the core and tactical cultural spaces, along with the cultural spaces of conflict, are attempts to describe the real and imagined thirdspaces of Edward Soja [36], that he relates to the lived representational spaces of Lefebvre. Furthermore, the study attempts to resurface what the legibility of spatial planning has hidden, namely the differences in uneven development and categorize them as such to achieve a certain sense of legibility that is acceptable to the policy process.
The IPK is updated yearly, with a fitting justification complementary to the nature of spatial plans which are developed in for longer terms. Soja [36] described that human institutions and relationships change in relatively brief years while geographic realities alter only over centuries; as such, it is important to keep political and cultural patterns in a state of effective readjustment, within the more fixed lines laid down by the region’s geography. Yearly evaluation of regional cultural spaces in the IPK shall be able to critically describe the previously unknown impact of spatial planning and its implementation. Through it, the plan can undergo readaptation as it encounters the traditions, the conventions, the resistances, and sometimes the unexpected opportunities of actual life [36].
Current implementation of the IPK is one of the highlights and is an example of good practice in the formulation of participatory cross-sectoral cultural policy. However, there are still many recommendations for developing the IPK so that it may be able to reflect the actual situation and condition of cultures nationally. For example, the cultural economic dimension in the IPK has only one indicator, namely "the percentage of the population who have been involved as performers/supporters of performing arts who make the involvement a source of income". This indicator has not considered actors of arts and culture other than the performing arts sector. In fact, cultural knowledge can play an important role in daily economic activities such as in the activities of fishermen in Kalibaru Subdistrict. The results of the research describing people's perceptions in descriptive maps and tables can serve as examples of practice to raise everyday cultural issues into the realm of policy. Through the evaluation of development itself, empty spaces can be found in policies that can be filled by the contribution of the community, striving for completeness of indicators to accurately reflect sustainability conditions. For this reason, the development of cultural sustainability indicators is an ongoing process in a system of linkages between indicators, policies, and society.
As a suggestion for further field studies, it is necessary to take samples on a larger scale to enrich the existing cultural data at the research location. It can also broaden the criteria for informants and pay attention to other factors such as the balance of gender representations, occupations, and income. In doing so, the demographic mapping of the location becomes more complete. Further research can also take a broader scope of policies, including those managed by institutions other than cultural managers. For example, in relation to cross-cultural coordination with the national Ministry of Public Works and Public Housing and the Coordinating Ministry for Maritime Affairs and Investment, as two agencies that have a major role in development in coastal areas and cultural heritage.
Author Contributions
Conceptualization, M.H.H., H.S.H., and K.R.K.; methodology, M.H.H.; software, M.H.H.; validation, M.H.H., H.S.H., and K.R.K.; formal analysis, M.H.H.; investigation, M.H.H.; resources, M.H.H.; data curation, M.H.H.; writing—original draft preparation, M.H.H.; writing—review and editing, H.S.H., and K.R.K.; visualization, M.H.H.; supervision, H.S.H., and K.R.K.; project administration, M.H.H.; funding acquisition, M.H.H. All authors have read and agreed to the published version of the manuscript.
Funding
This research was funded by Research and Development Division of Universitas Indonesia, grant number NKB-1360/UN2.RST/HKP.05.00/2022.
Institutional Review Board Statement
Not applicable.
Informed Consent Statement
Informed consent was obtained from all subjects involved in the study.
Data Availability Statement
The data will be available upon a reasonable request.
Acknowledgments
The authors sincerely thank the Department of Environmental Science, Universitas Indonesia.
Conflicts of Interest
The authors declare no conflict of interest.
References
- Gupta, A. K.; Sinha, R.; Koradia, D.; Patel, R.; Parmar, M.; Rohit, P.; Patel, H.; Patel, K.; Chand, V. S.; James, T. J.; Chandan, A.; Patel, M.; Prakash, T. N.; Vivekanandan, P. Mobilizing grassroots’ technological innovations and traditional knowledge, values and institutions: Articulating social and ethical capital. Futures 2003, 35, 975–987. [Google Scholar] [CrossRef]
- Blewitt, J. Understanding sustainable development; Routledge, 2018.
- Rogers, P.; Jalal, K.; Boyd, J. An introduction to sustainable development. In Earthscan; 2008.
- Ramos, T. B. Sustainability assessment: Exploring the frontiers and paradigms of indicator approaches. Sustainability (Switzerland) 2019, 11. [Google Scholar] [CrossRef]
- Dizdaroglu, D. The role of indicator-based sustainability assessment in policy and the decision-making process: A review and outlook. Sustainability (Switzerland) 2017, 9, 1–28. [Google Scholar] [CrossRef]
- Boyle, J. Cultural influences on implementing environmental impact assessment: Insights from Thailand, Indonesia, and Malaysia. Environmental Impact Assessment Review 1998, 18, 95–116. [Google Scholar] [CrossRef]
- Evans, B.; Joas, M.; Sundback, S.; Theobald, K. Governing local sustainability. Journal of Environmental Planning and Management 2006, 49, 849–867. [Google Scholar] [CrossRef]
- Rukmana, D. The Change and Transformation of Indonesian Spatial Planning after Suharto’s New Order Regime: The Case of the Jakarta Metropolitan Area. International Planning Studies 2015, 20, 350–370. [Google Scholar] [CrossRef]
- Silver, C. Spatial Planning for Sustainable Development: An Action Planning Approach for Jakarta. Jurnal Perencanaan Wilayah Dan Kota 2014, 25, 115–125. [Google Scholar] [CrossRef]
- McAlpine, P.; Birnie, A. Is there a correct way of establishing sustainability indicators? The case of sustainability indicator development on the Island of Guernsey. Local Environment 2005, 10, 243–257. [Google Scholar] [CrossRef]
- Fraser, E. D. G.; Dougill, A. J.; Mabee, W. E.; Reed, M.; McAlpine, P. Bottom up and top down: Analysis of participatory processes for sustainability indicator identification as a pathway to community empowerment and sustainable environmental management. Journal of Environmental Management 2006, 78, 114–127. [Google Scholar] [CrossRef]
- Turcu, C. Re-thinking Sustainability Indicators: Local Perspectives of Urban Sustainability. Journal of Environmental Planning and Management 2013, 56, 695–719. [Google Scholar] [CrossRef]
- Soini, K.; Birkeland, I. Exploring the scientific discourse on cultural sustainability. Geoforum 2014, 51, 213–223. [Google Scholar] [CrossRef]
- Myllyviita, T.; Lähtinen, K.; Hujala, T.; Leskinen, L. A.; Sikanen, L.; Leskinen, P. Identifying and rating cultural sustainability indicators: A case study of wood-based bioenergy systems in eastern Finland. Environment, Development and Sustainability 2013, 16, 287–304. [Google Scholar] [CrossRef]
- Axelsson, R.; Angelstam, P.; Degerman, E.; Teitelbaum, S.; Andersson, K.; Elbakidze, M.; Drotz, M. K. Social and cultural sustainability: Criteria, indicators, verifier variables for measurement and maps for visualization to support planning. Ambio 2013, 42, 215–228. [Google Scholar] [CrossRef]
- Lahtinen, K.; Myllyviita, T. Cultural sustainability in reference to the global reporting initiative (GRI) guidelines. Journal of Cultural Heritage Management and Sustainable Development 2015, 5, 290–318. [Google Scholar] [CrossRef]
- James, P. Assessing cultural sustainability; United Cities and Local Governments, 2014.
- Lefebvre, H. The Production of Space; Blackwell, 1974.
- de Certeau, M. The Practice of Everyday Life; University of California Press, 1984.
- 20. Bappeda DKI Jakarta. Rencana Pembangunan Daerah 2023-2026; 2022.
- Sudaryono. Paradigma Lokalisme Dalam Perencanaan Spasial. Journal of Regional and City Planning 2006, 17, 28–38. [Google Scholar]
- Setiadi, H.; Yunus, H. S.; Purwanto, B. The metaphor of “center” in planning: Learning from the geopolitical order of swidden traditions in the land of sunda. Journal of Regional and City Planning 2017, 28, 111–128. [Google Scholar] [CrossRef]
- Cybriwsky, R.; Ford, L. R. City profile Jakarta. Cities 2001, 18, 199–210. [Google Scholar] [CrossRef]
- Martinez, R.; Masron, I. N. Jakarta: A city of cities. Cities, 2020; 106(June). [Google Scholar]
- Kusno, A. Runaway city: Jakarta Bay, the pioneer and the last frontier. Inter-Asia Cultural Studies 2011, 12, 513–531. [Google Scholar] [CrossRef]
- Herlambang, S.; Leitner, H.; Tjung, L. J.; Sheppard, E.; Anguelov, D. Jakarta’s great land transformation: Hybrid neoliberalisation and informality. Urban Studies 2019, 56, 627–648. [Google Scholar] [CrossRef]
- Hudalah, D.; Firman, T. Beyond property: Industrial estates and post-suburban transformation in Jakarta Metropolitan Region. Cities 2012, 29, 40–48. [Google Scholar] [CrossRef]
- Leichenko, R. M.; Solecki, W. D. Consumption, inequity, and environmental justice: The making of new metropolitan landscapes in developing countries. Society and Natural Resources 2008, 21, 611–624. [Google Scholar] [CrossRef]
- Valentin, A.; Spangenberg, J. H. A guide to community sustainability indicators. Environmental Impact Assessment Review 2000, 20, 381–392. [Google Scholar] [CrossRef]
- Drenthen, M. Environmental Hermeneutics and the Meaning of Nature 2017, May 2018, 1–15.
- Brennan-Horley, C.; Luckman, S.; Gibson, C.; Willoughby-Smith, J. Gis, ethnography, and cultural research: Putting maps back into ethnographic mapping. Information Society 2010, 26, 92–103. [Google Scholar] [CrossRef]
- Taylor, K. Cultural Mapping: Intangible Values and Engaging with Communities with Some Reference to Asia. The Historic Environment: Policy & Practice, 2013; 4, 50–61. [Google Scholar]
- Galehbakhtiari, S.; Hasangholi Pouryasouri, T. A hermeneutic phenomenological study of online community participation: Applications of fuzzy cognitive maps. Computers in Human Behavior 2015, 48, 637–643. [Google Scholar] [CrossRef]
- Jacobs, J. The Death and Life of Great American Cities; Vintage, 1992.
- Soja, E. Thirdspace: Journeys to Los Angeles and Other Real-and-Imagined Places; Blackwell, 1996.
- Soja, E. Postmodern Geographies: The Reassertion of Space in Critical Social Theory; Verso, 1989.
- Mumford, L. The Culture of Cities; Harvest Books, 1970.
Figure 1.
Geographical boundaries of the research area.
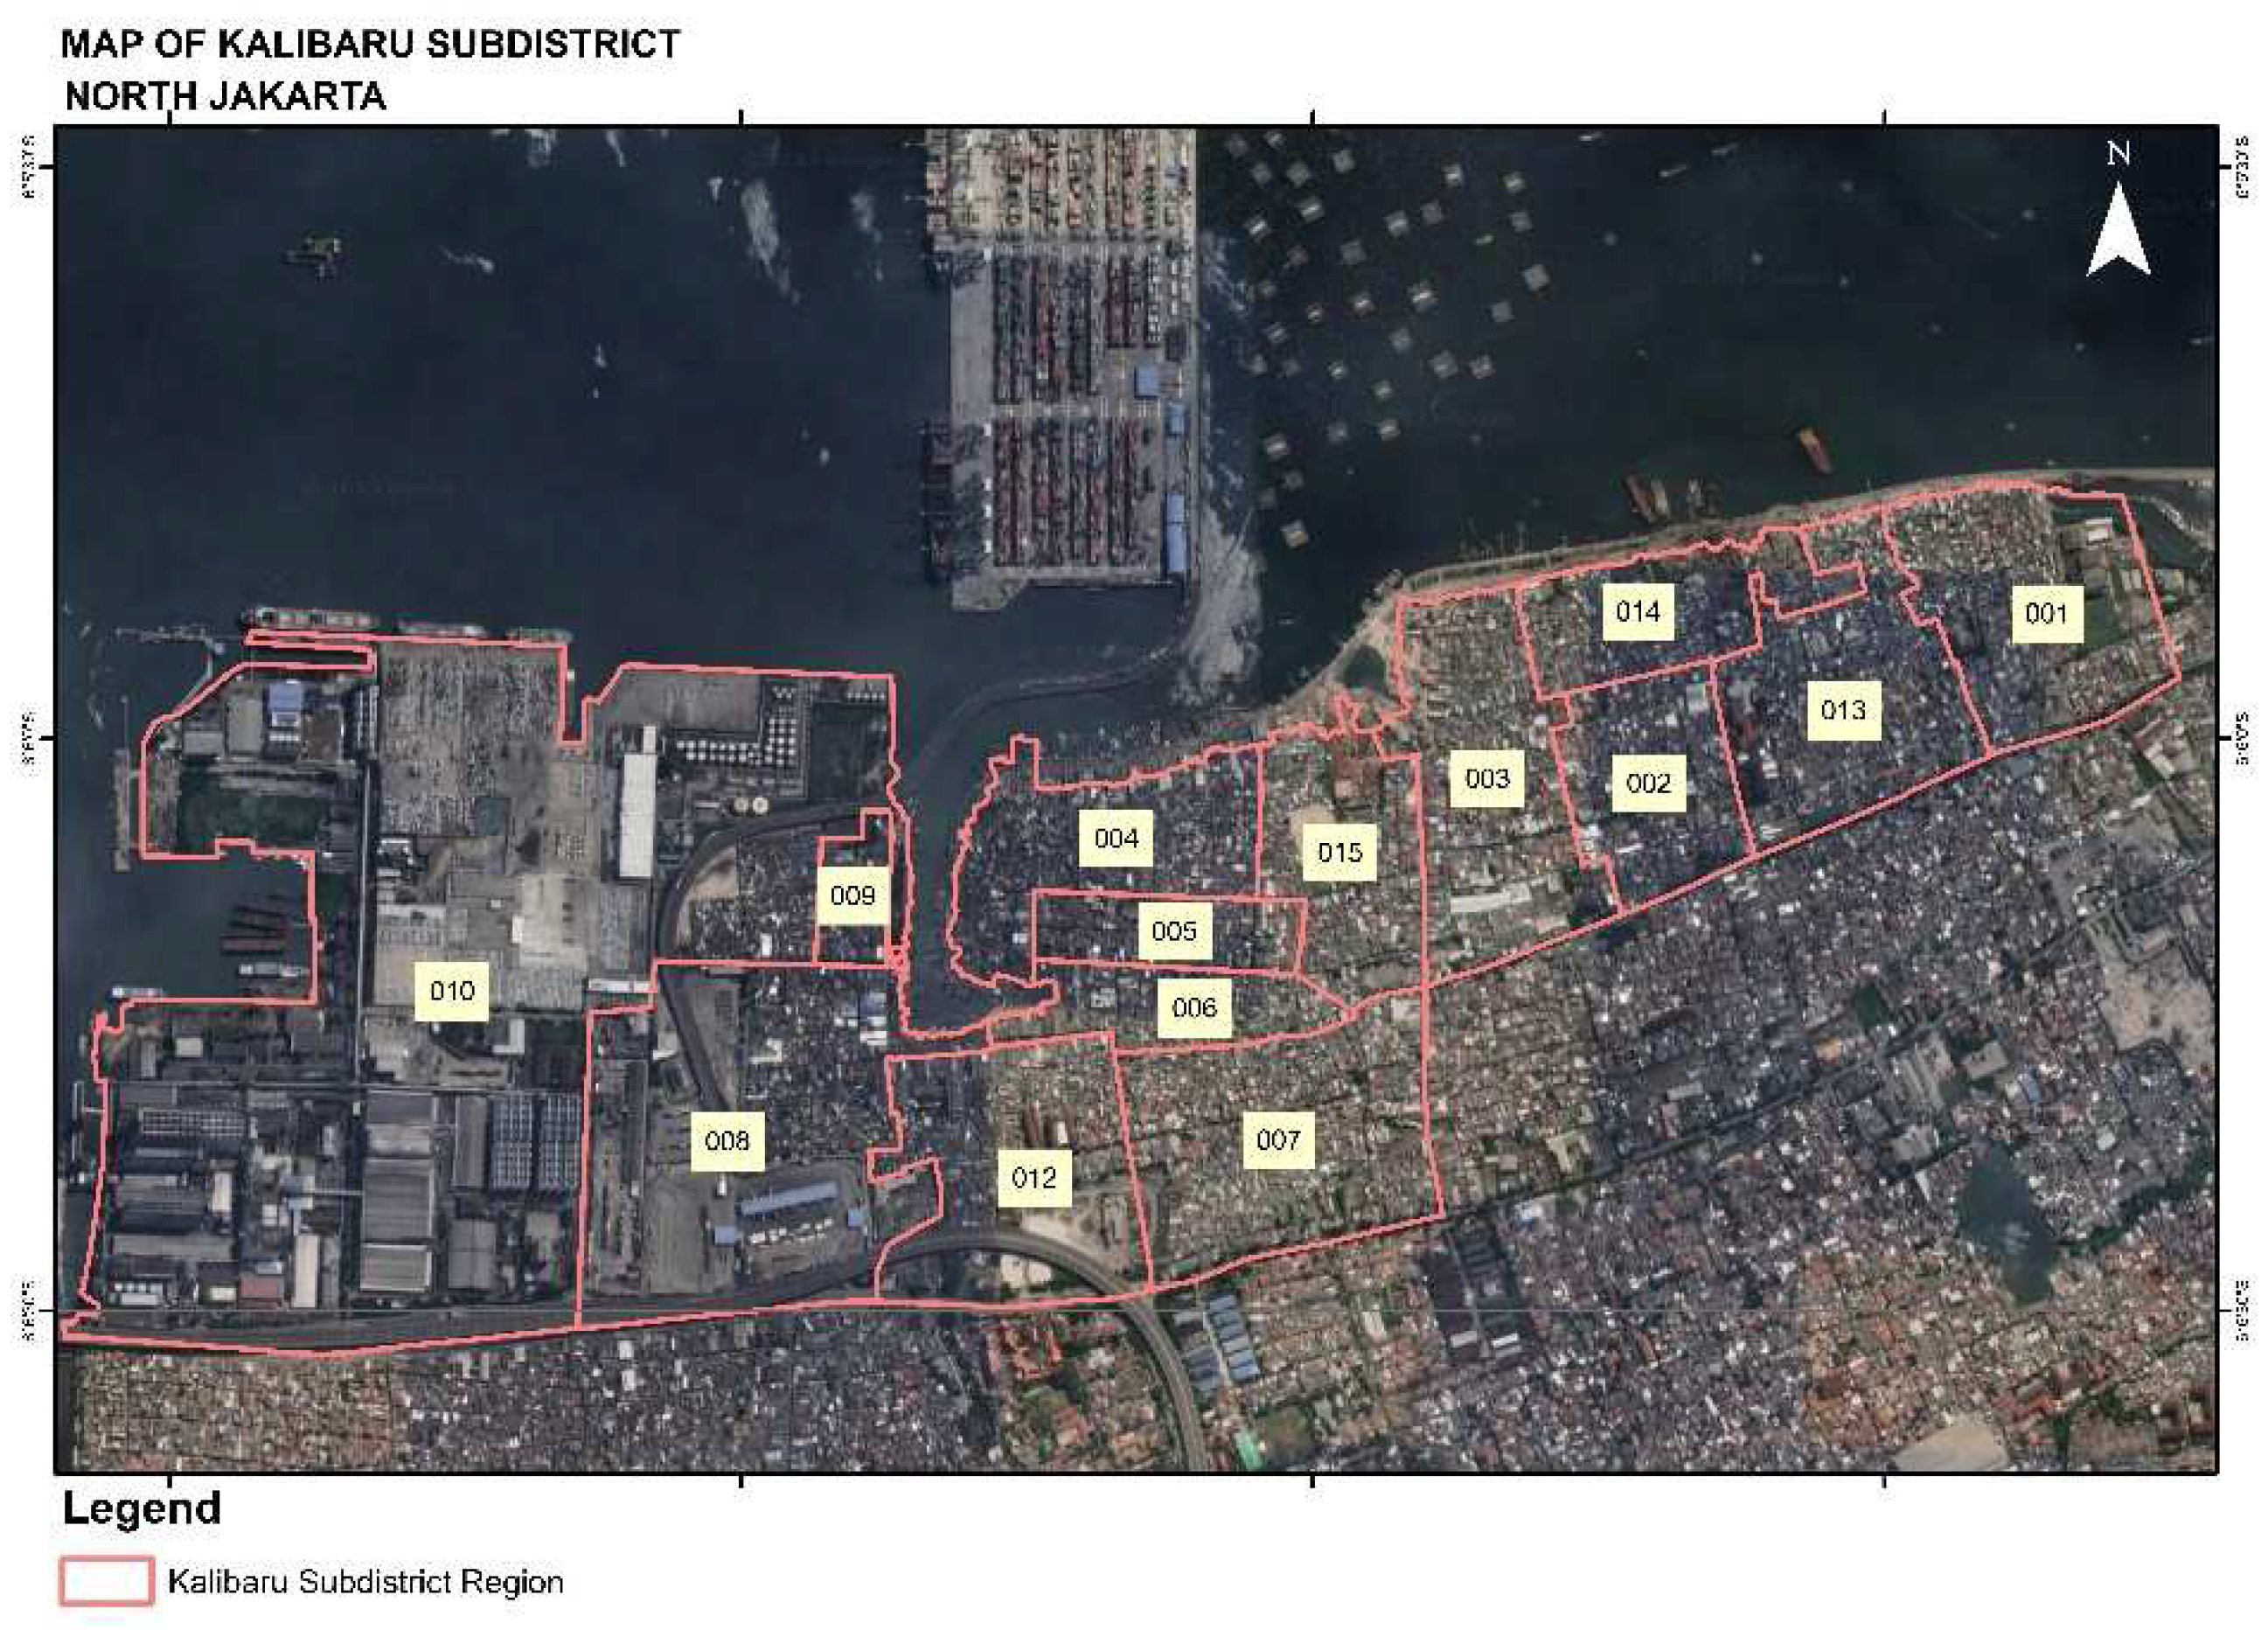
Figure 2.
Area clusters in the Kalibaru subdistrict.
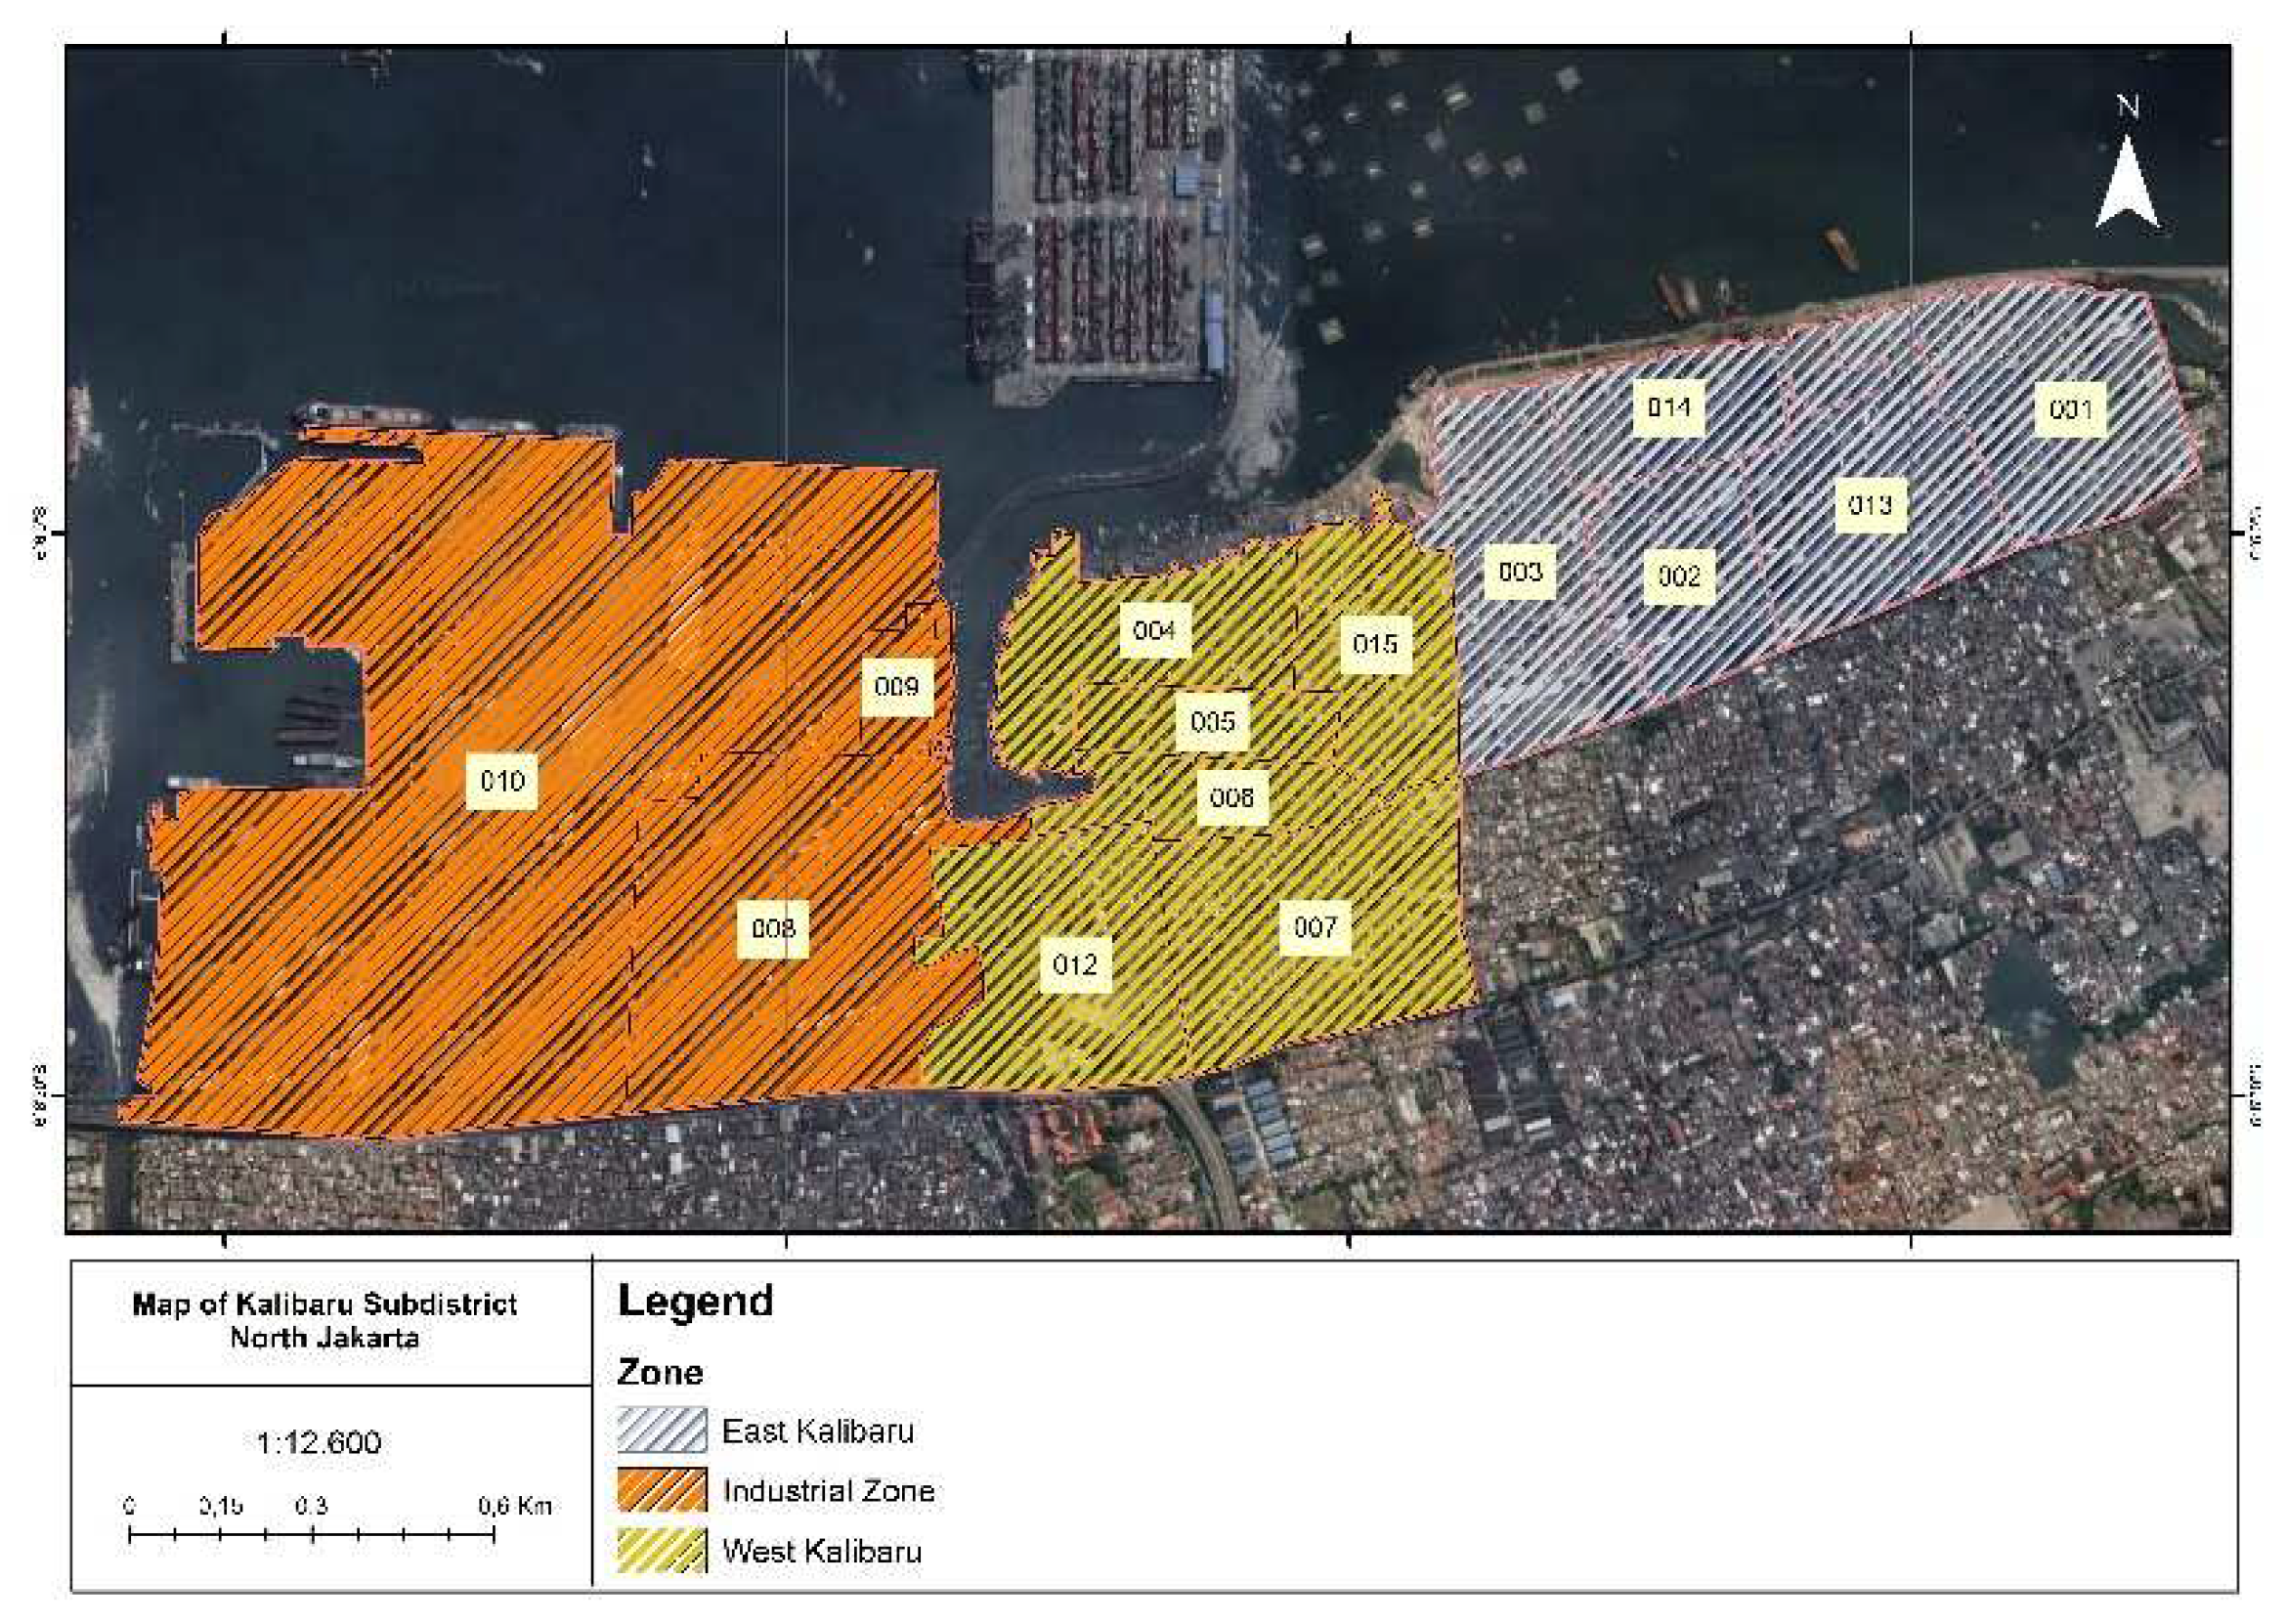
Figure 3.
Kalibaru Subdistrict population based on age and sex.
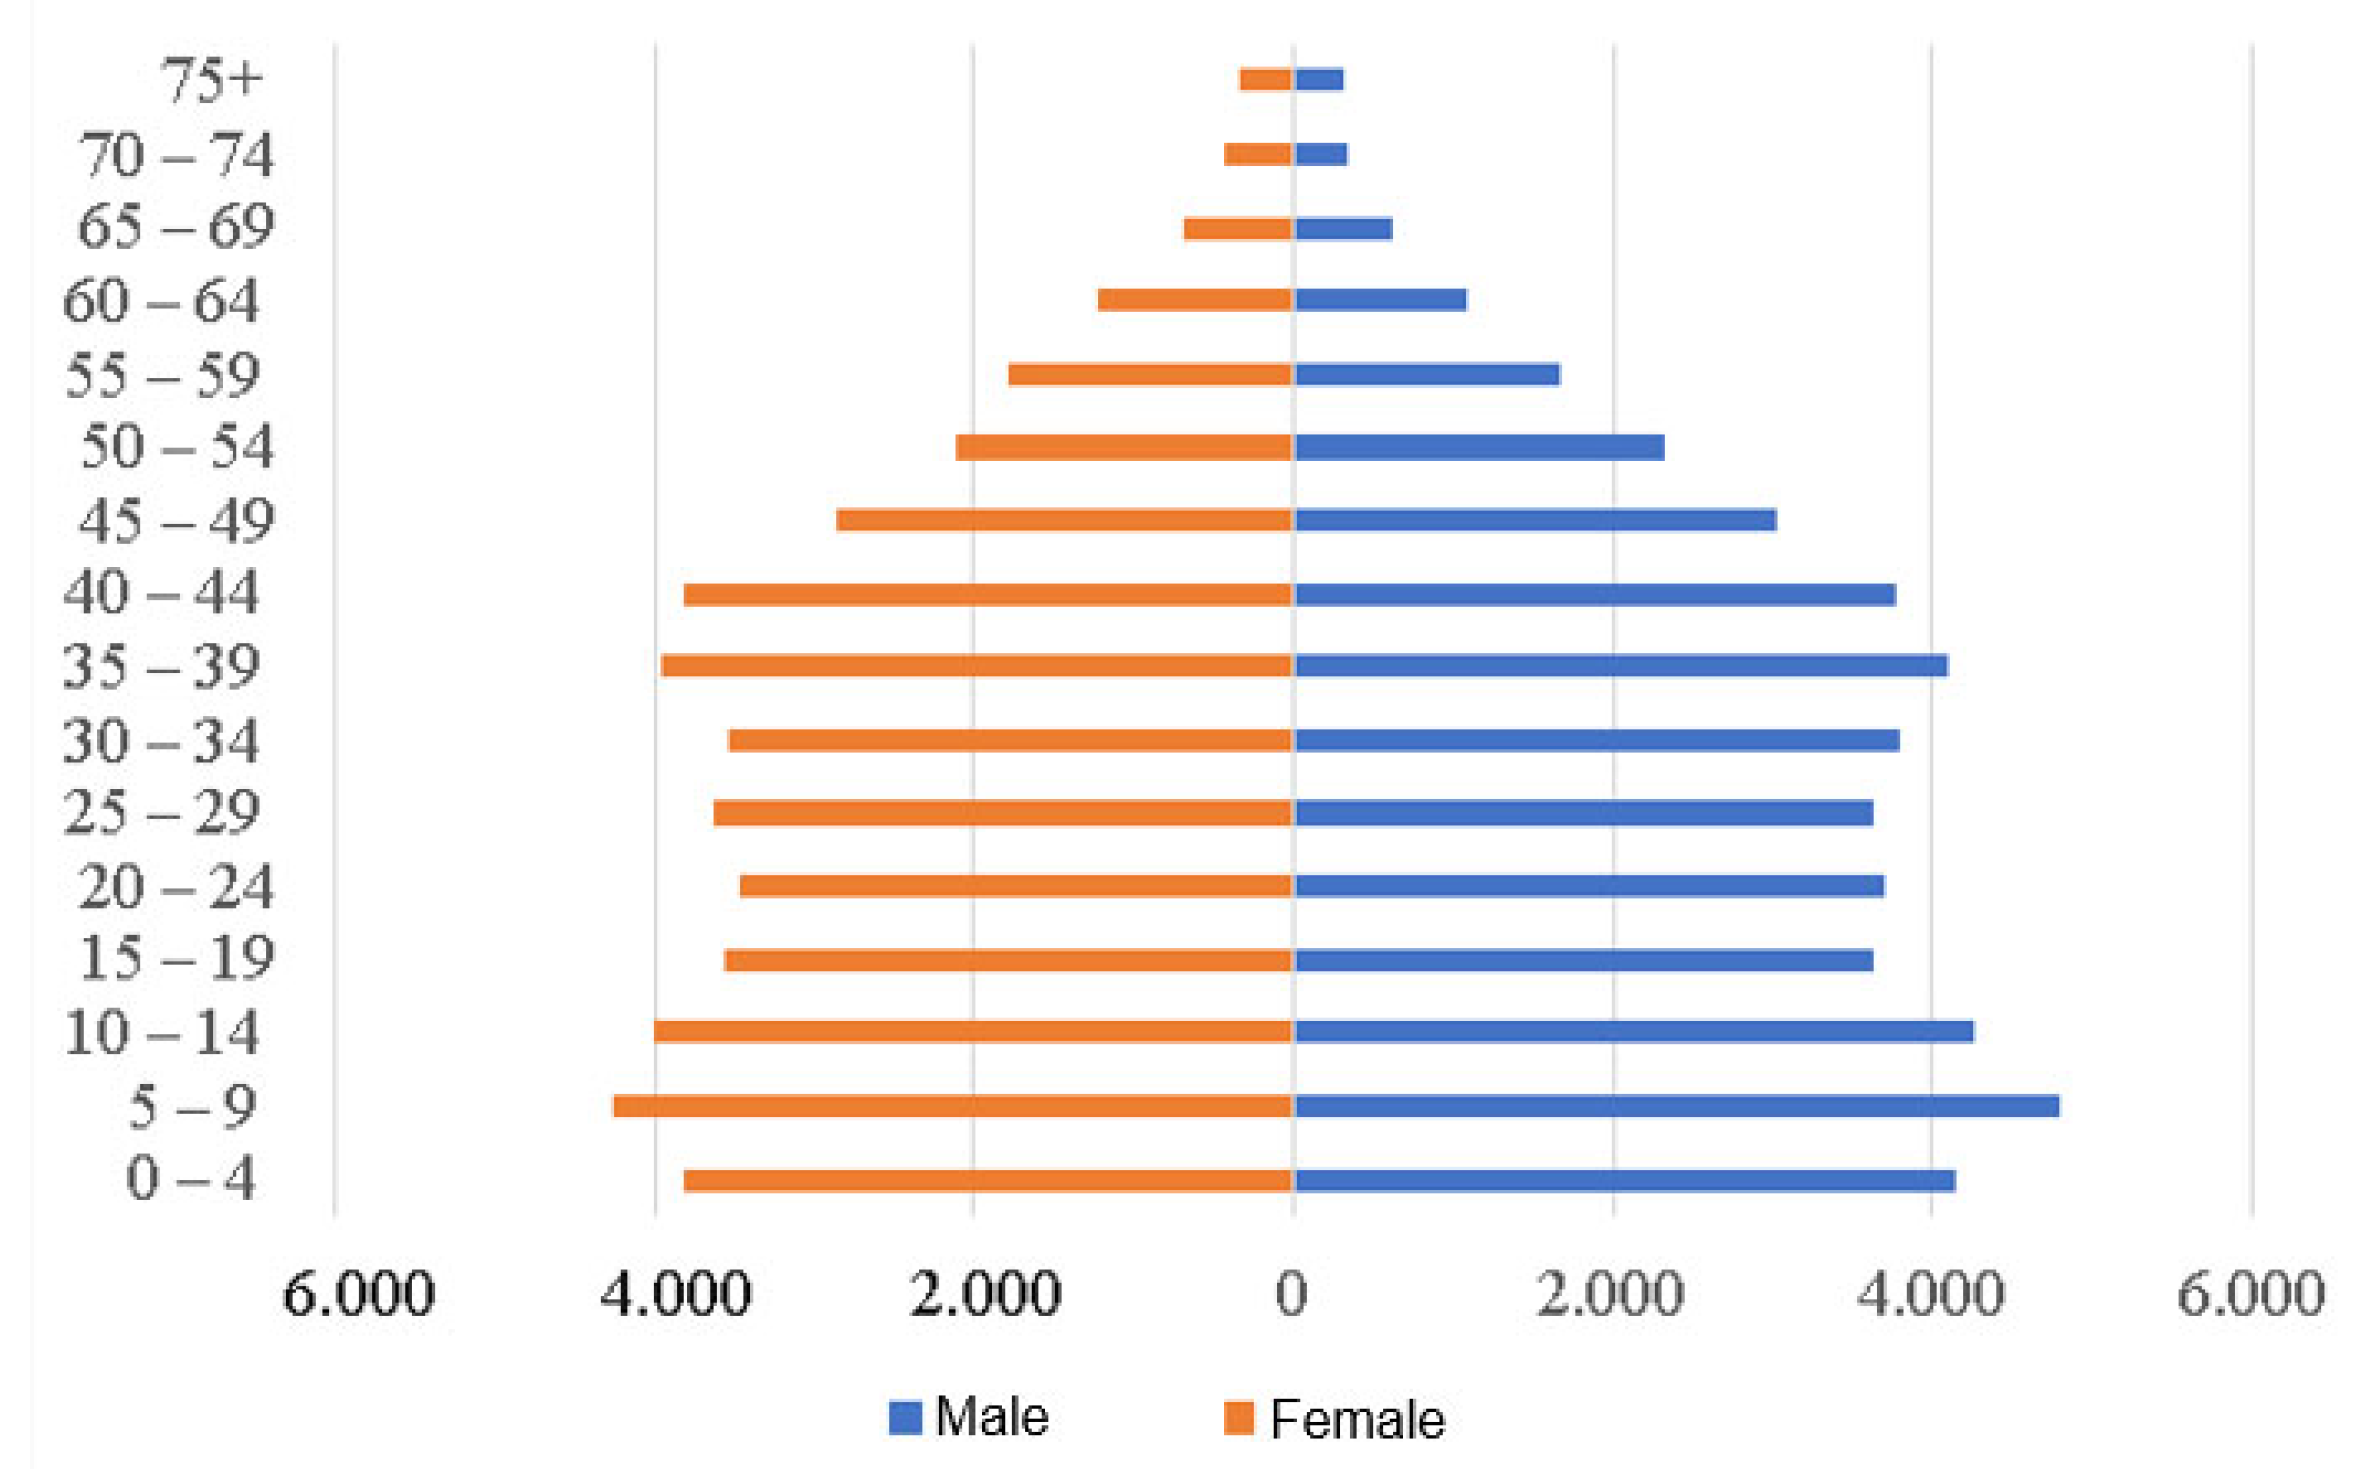
Figure 4.
NPCT and NPEA development plans (Source: International Association Ports and Harbour (IAPH) World Ports Conference, 2017).
Figure 4.
NPCT and NPEA development plans (Source: International Association Ports and Harbour (IAPH) World Ports Conference, 2017).
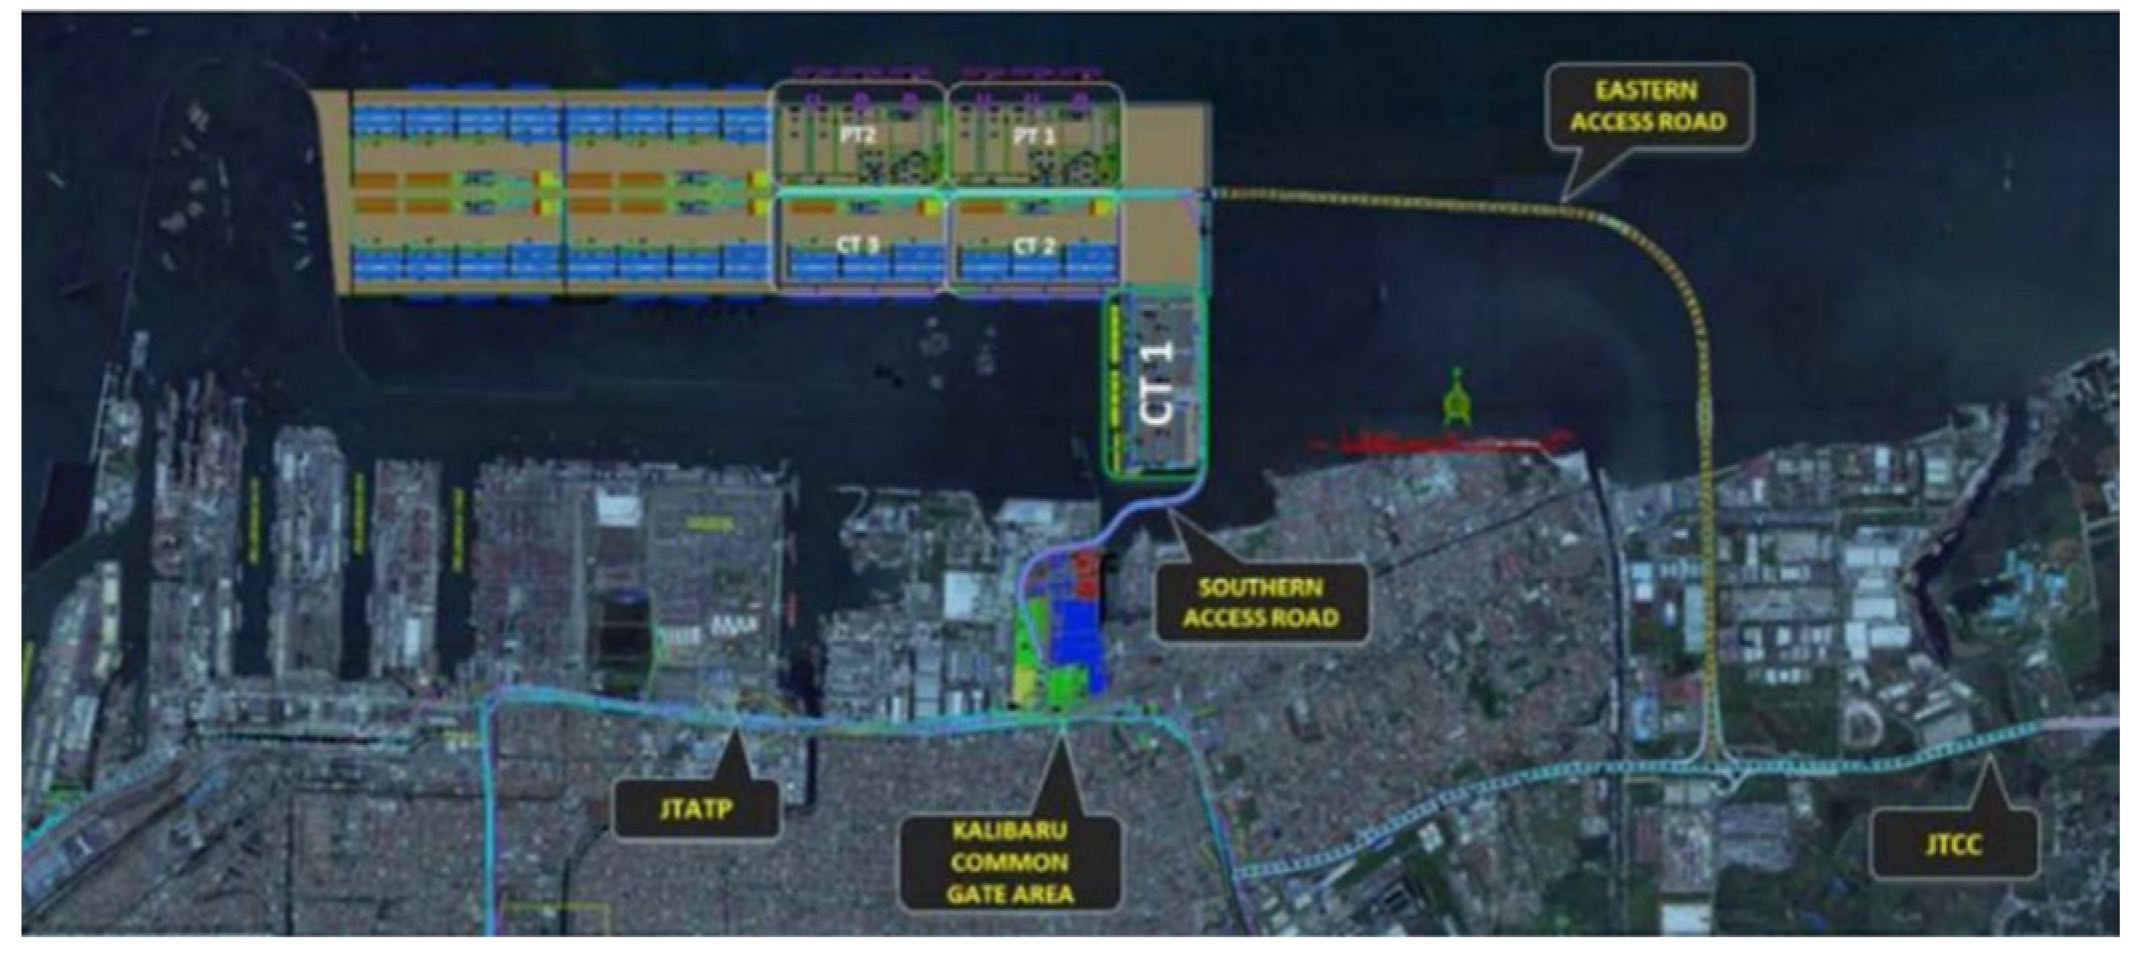
Figure 5.
Map of core cultural spaces in Kalibaru Subdistrict.
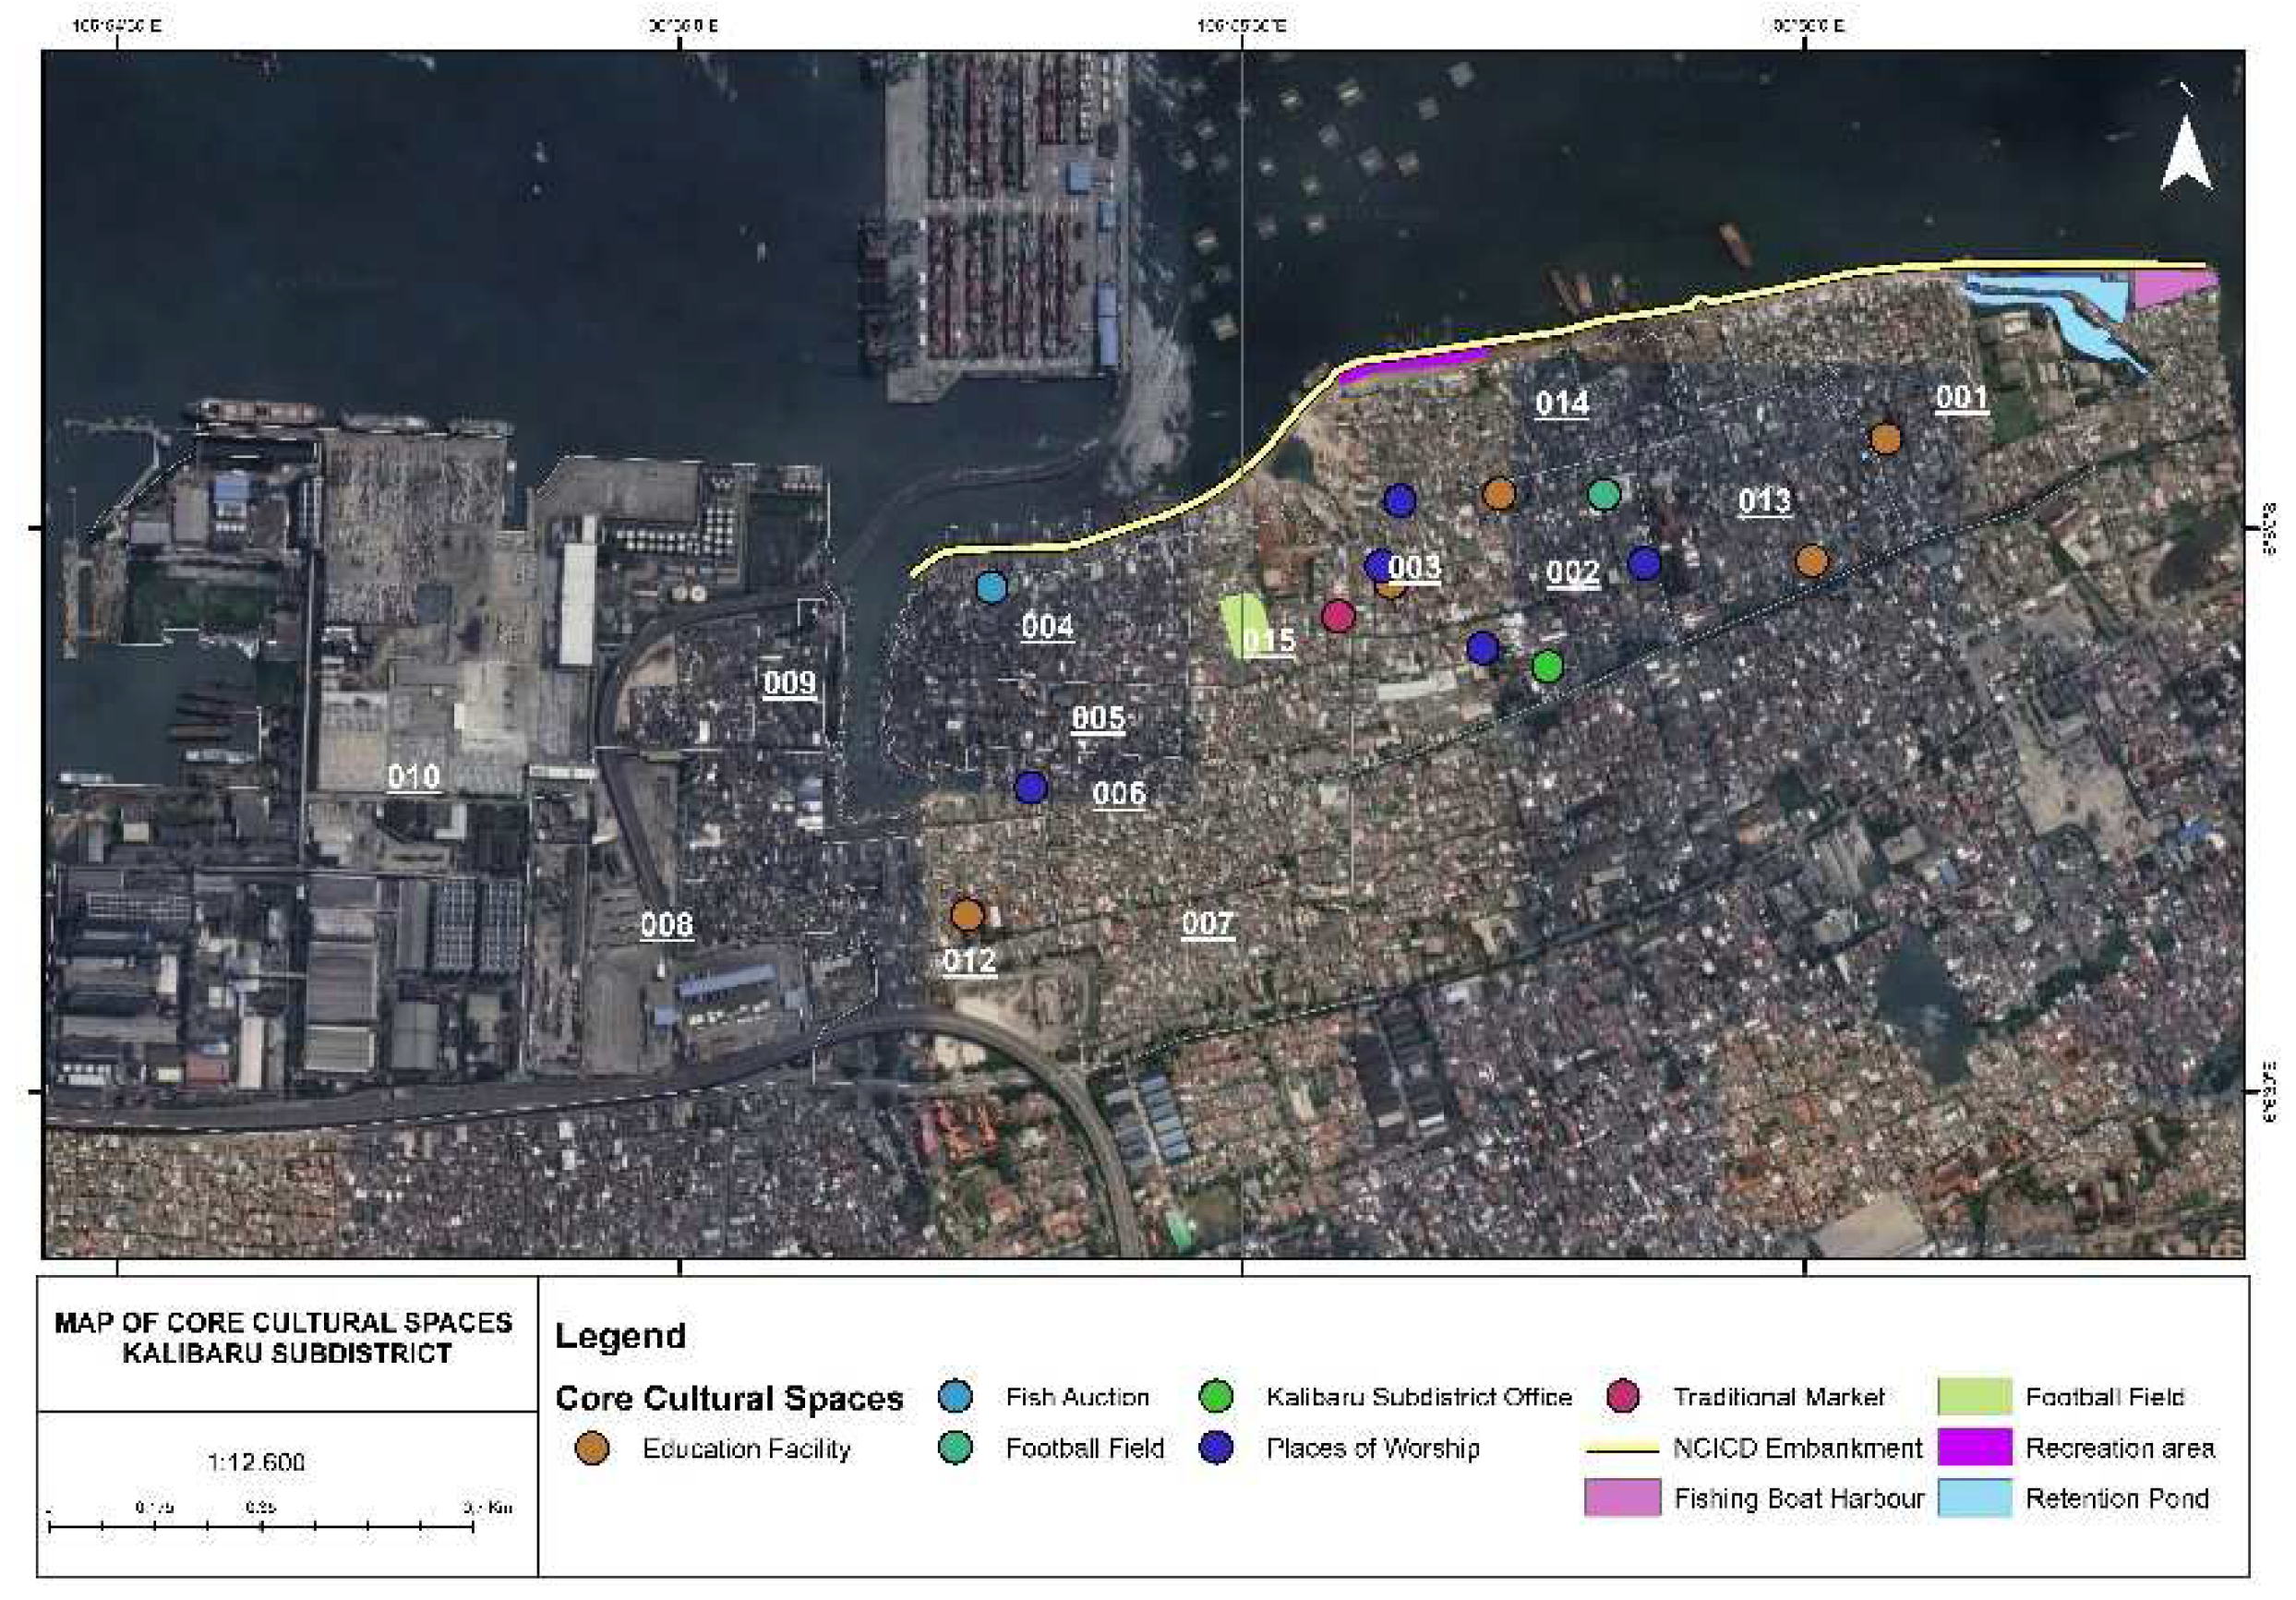
Figure 6.
Bamboo construction along the NCICD embankment Phase A: (a) RW 01, (b) RW 13, and (c) RW 04.
Figure 6.
Bamboo construction along the NCICD embankment Phase A: (a) RW 01, (b) RW 13, and (c) RW 04.
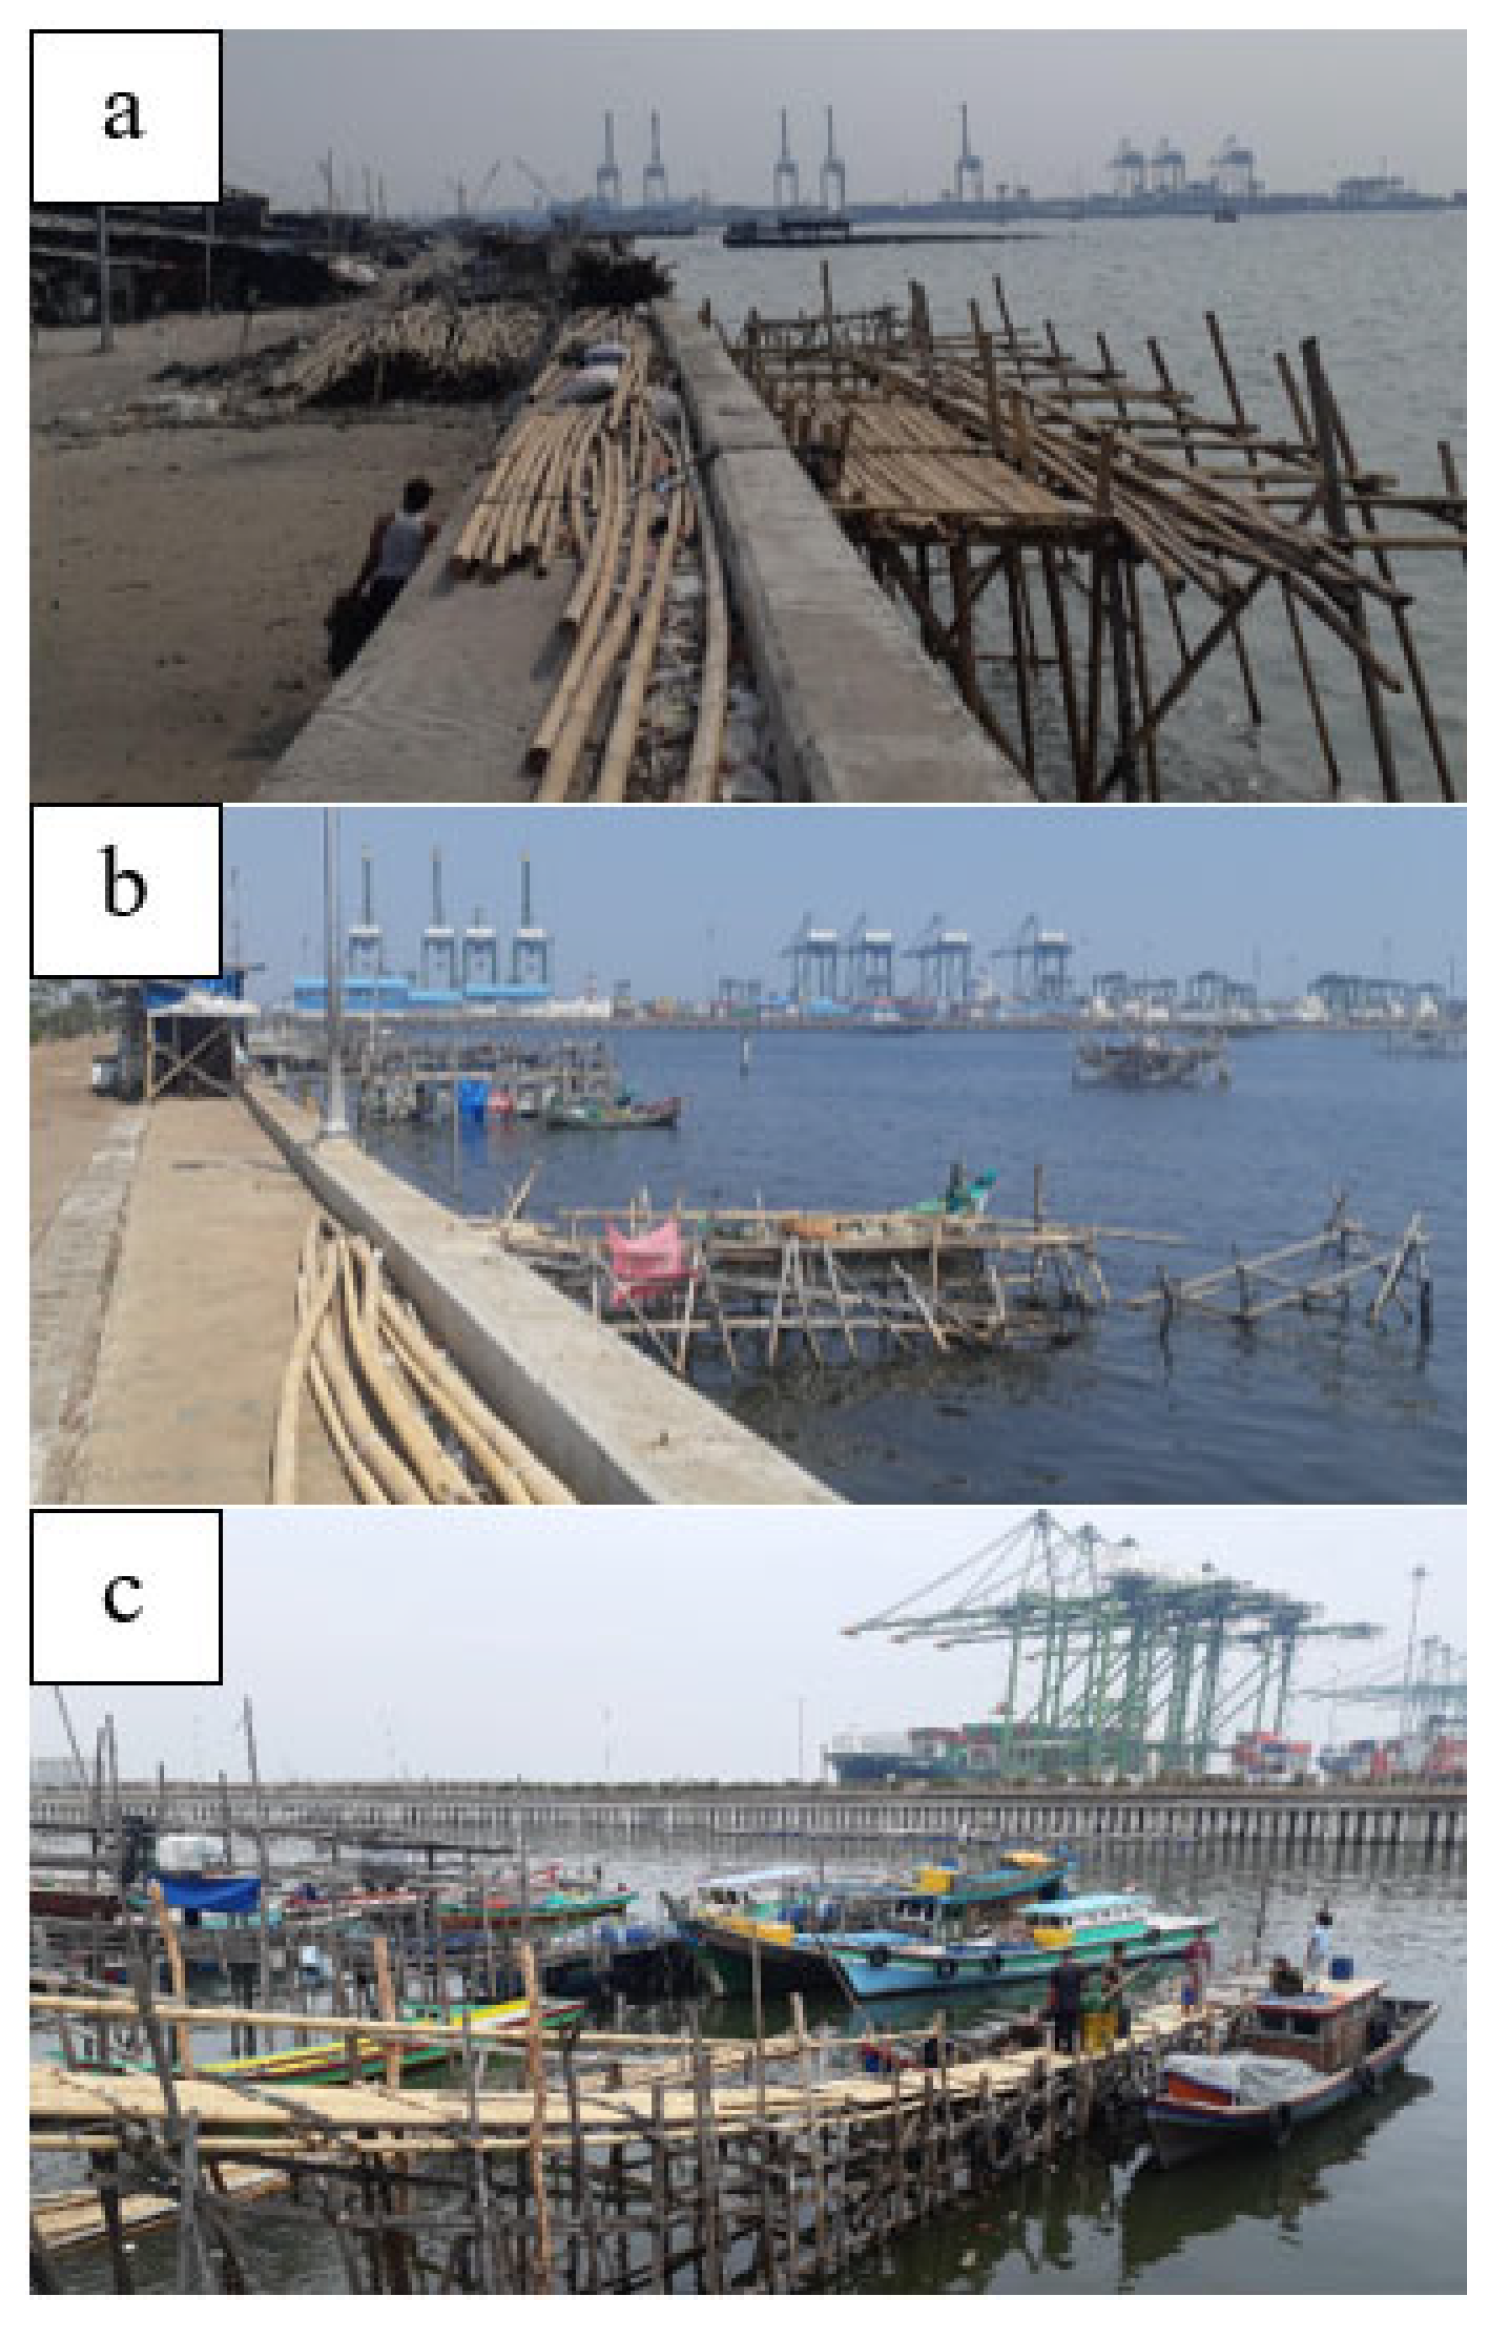
Figure 7.
Plaza Kalibaru: (a) sports park, (b) PUPR logo and National Capital Integrated Coastal Development (PTPIN), and (c) boat harbour north of the park.
Figure 7.
Plaza Kalibaru: (a) sports park, (b) PUPR logo and National Capital Integrated Coastal Development (PTPIN), and (c) boat harbour north of the park.
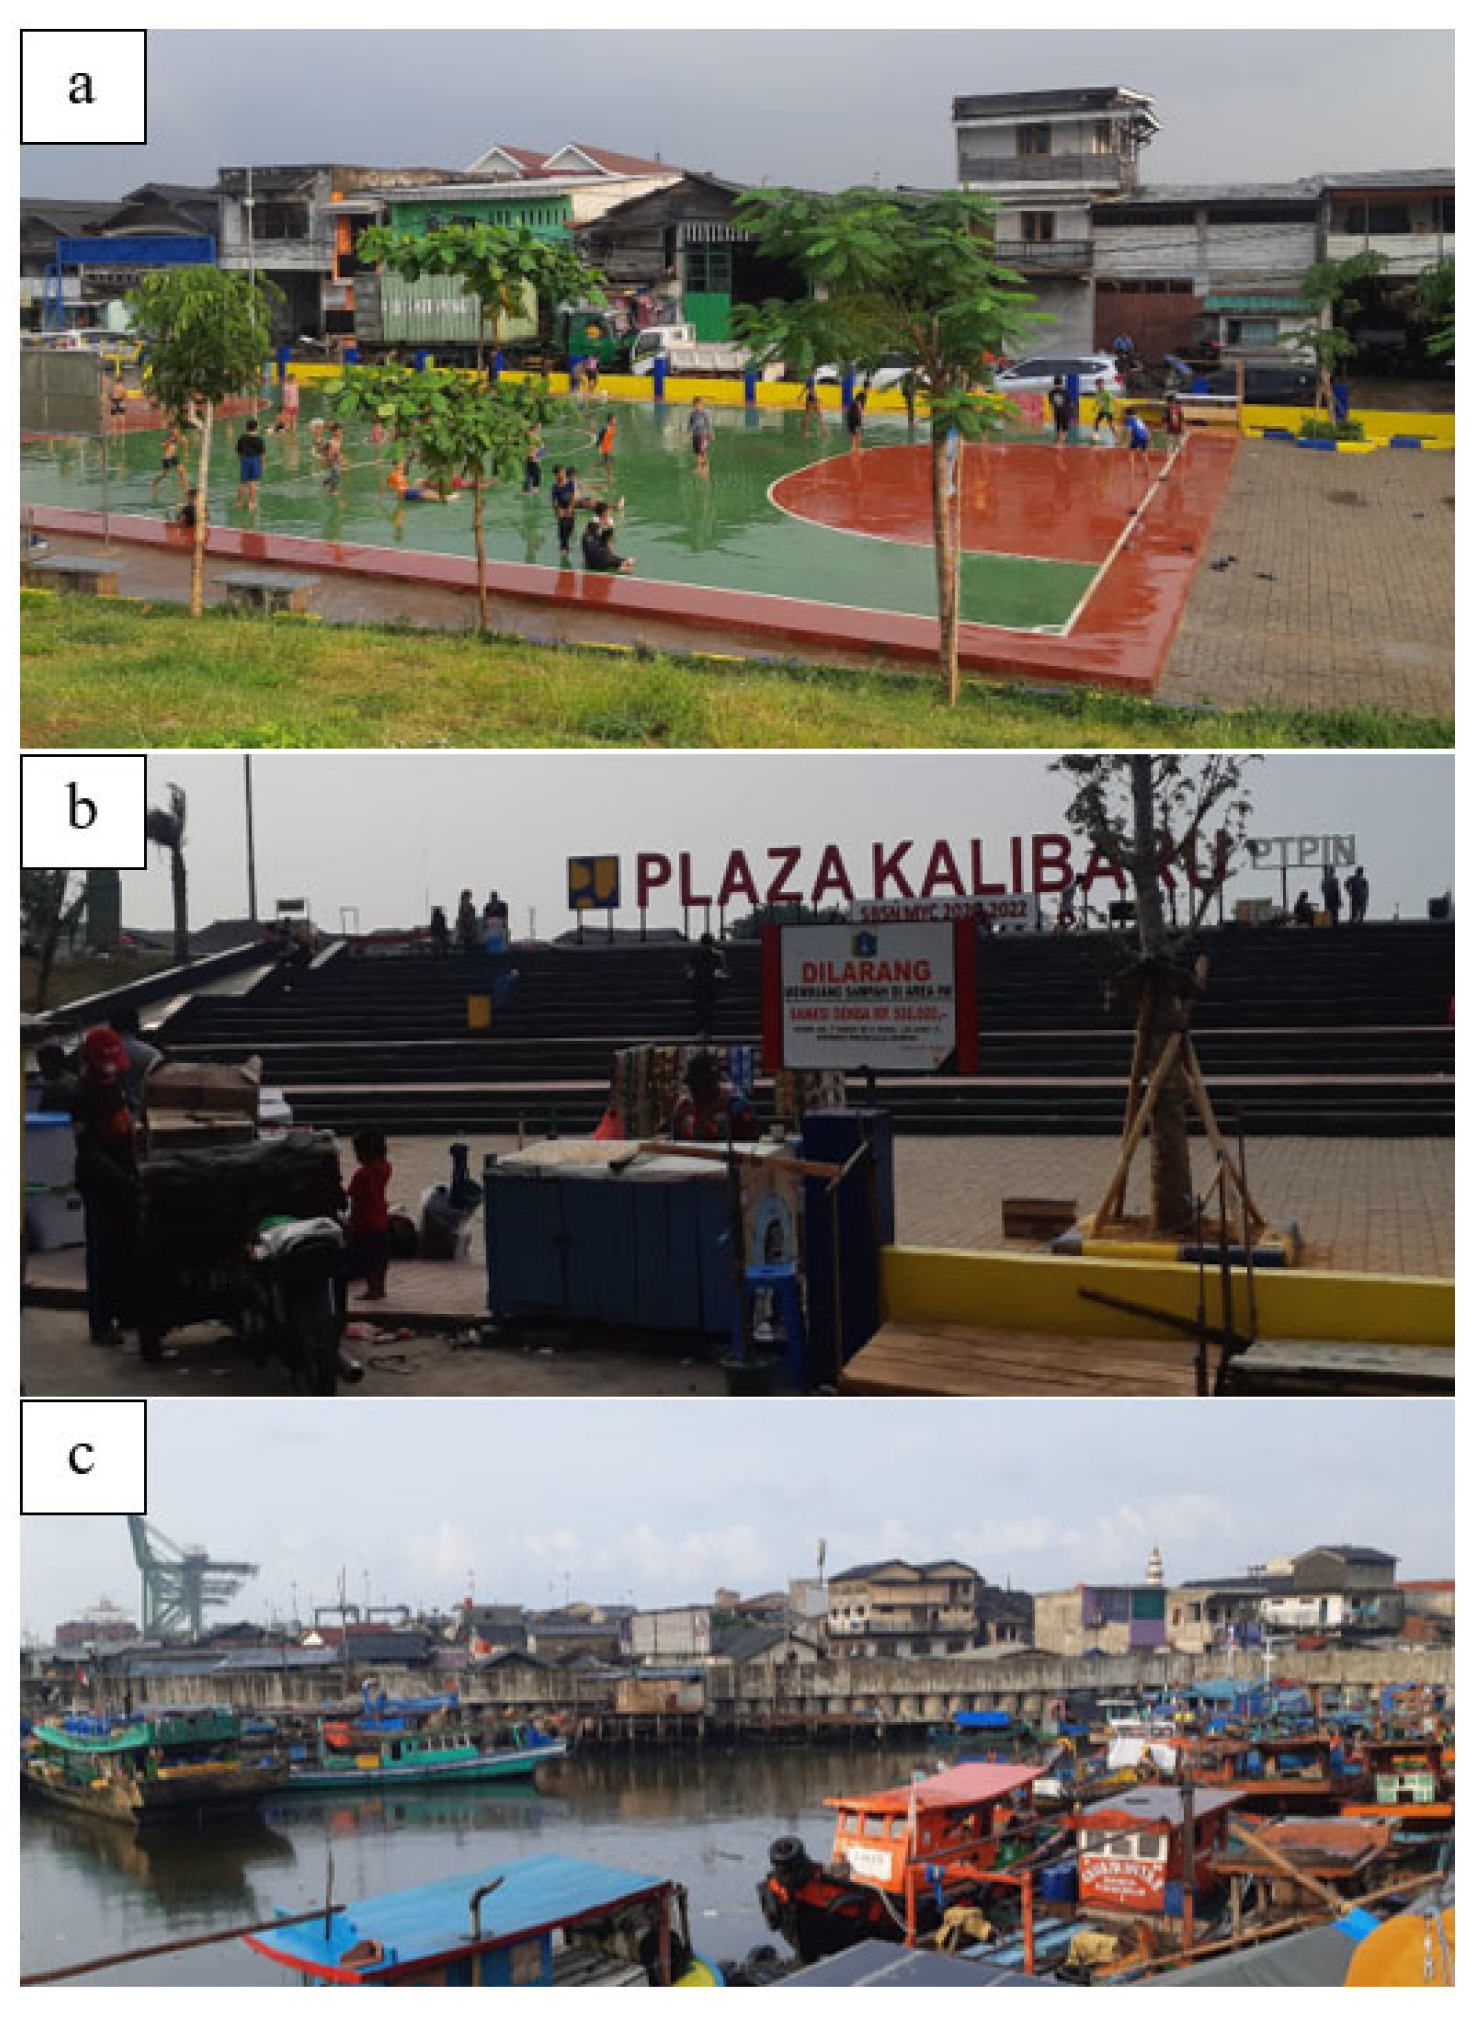
Figure 8.
Football field in RW 15.
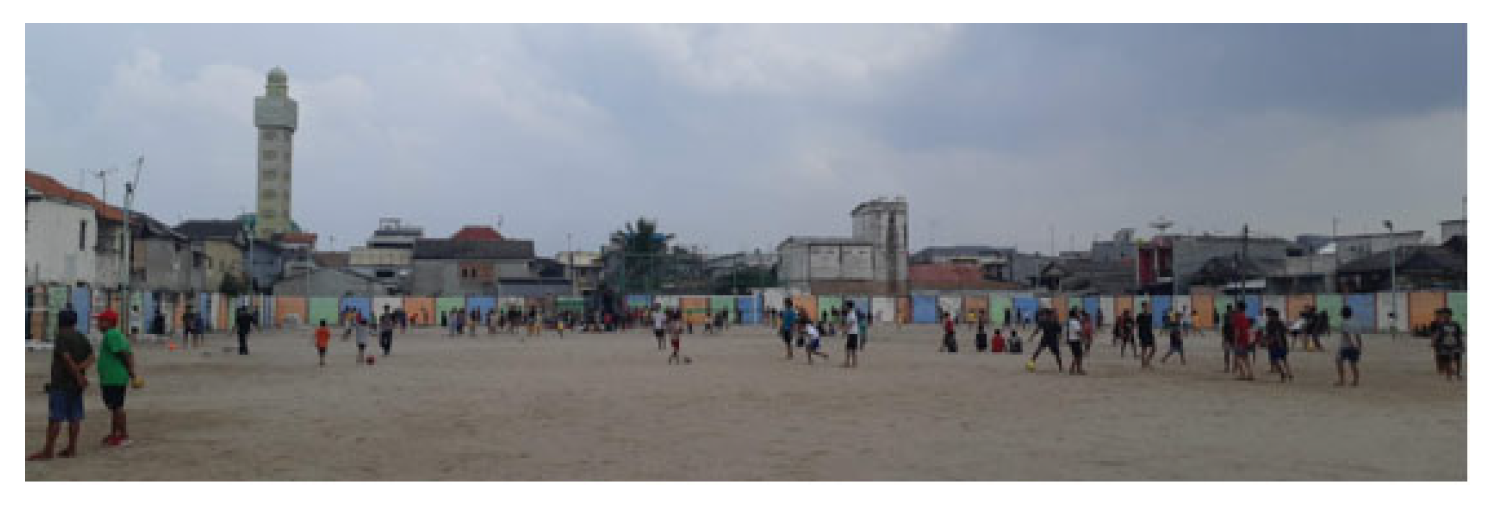
Figure 9.
Main traditional markets at Kalibaru Subdistrict: (a) Jalan Baru Market RW 02, (b) Jalan Baru Market RW 03, and (c) Mencos Market.
Figure 9.
Main traditional markets at Kalibaru Subdistrict: (a) Jalan Baru Market RW 02, (b) Jalan Baru Market RW 03, and (c) Mencos Market.
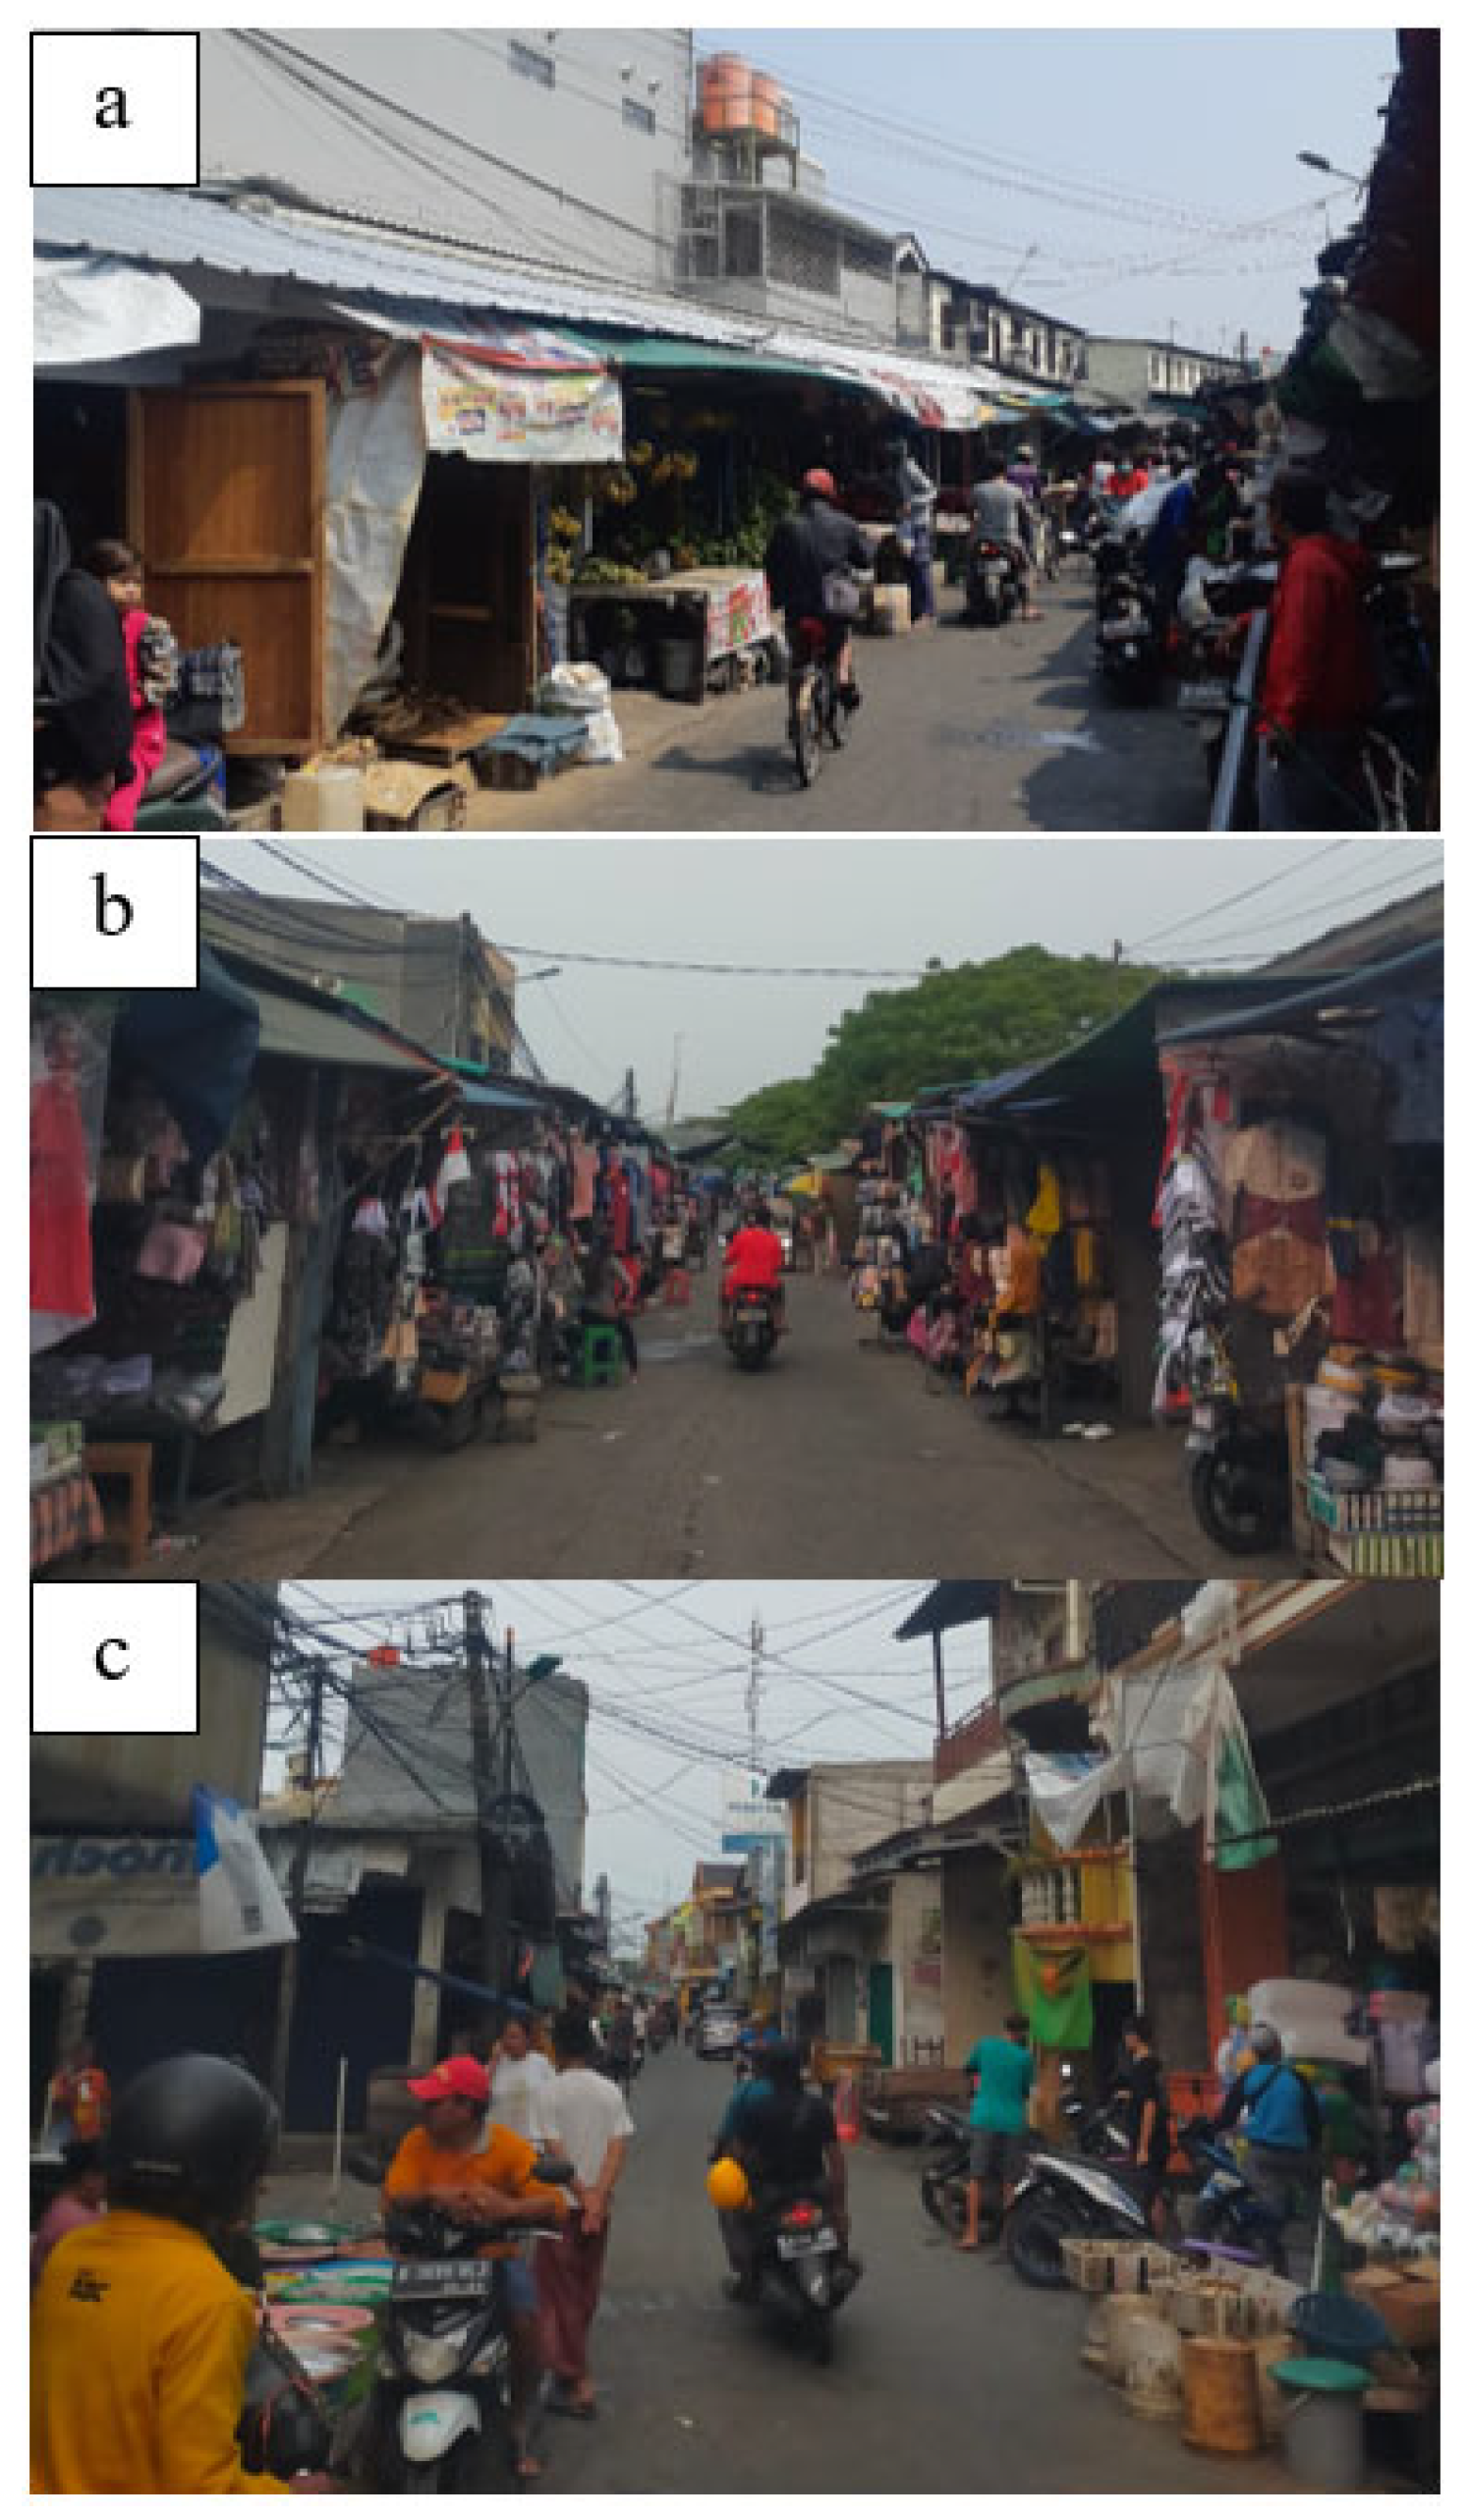
Figure 10.
Map of tactical culture spaces in Kalibaru Subdistrict.
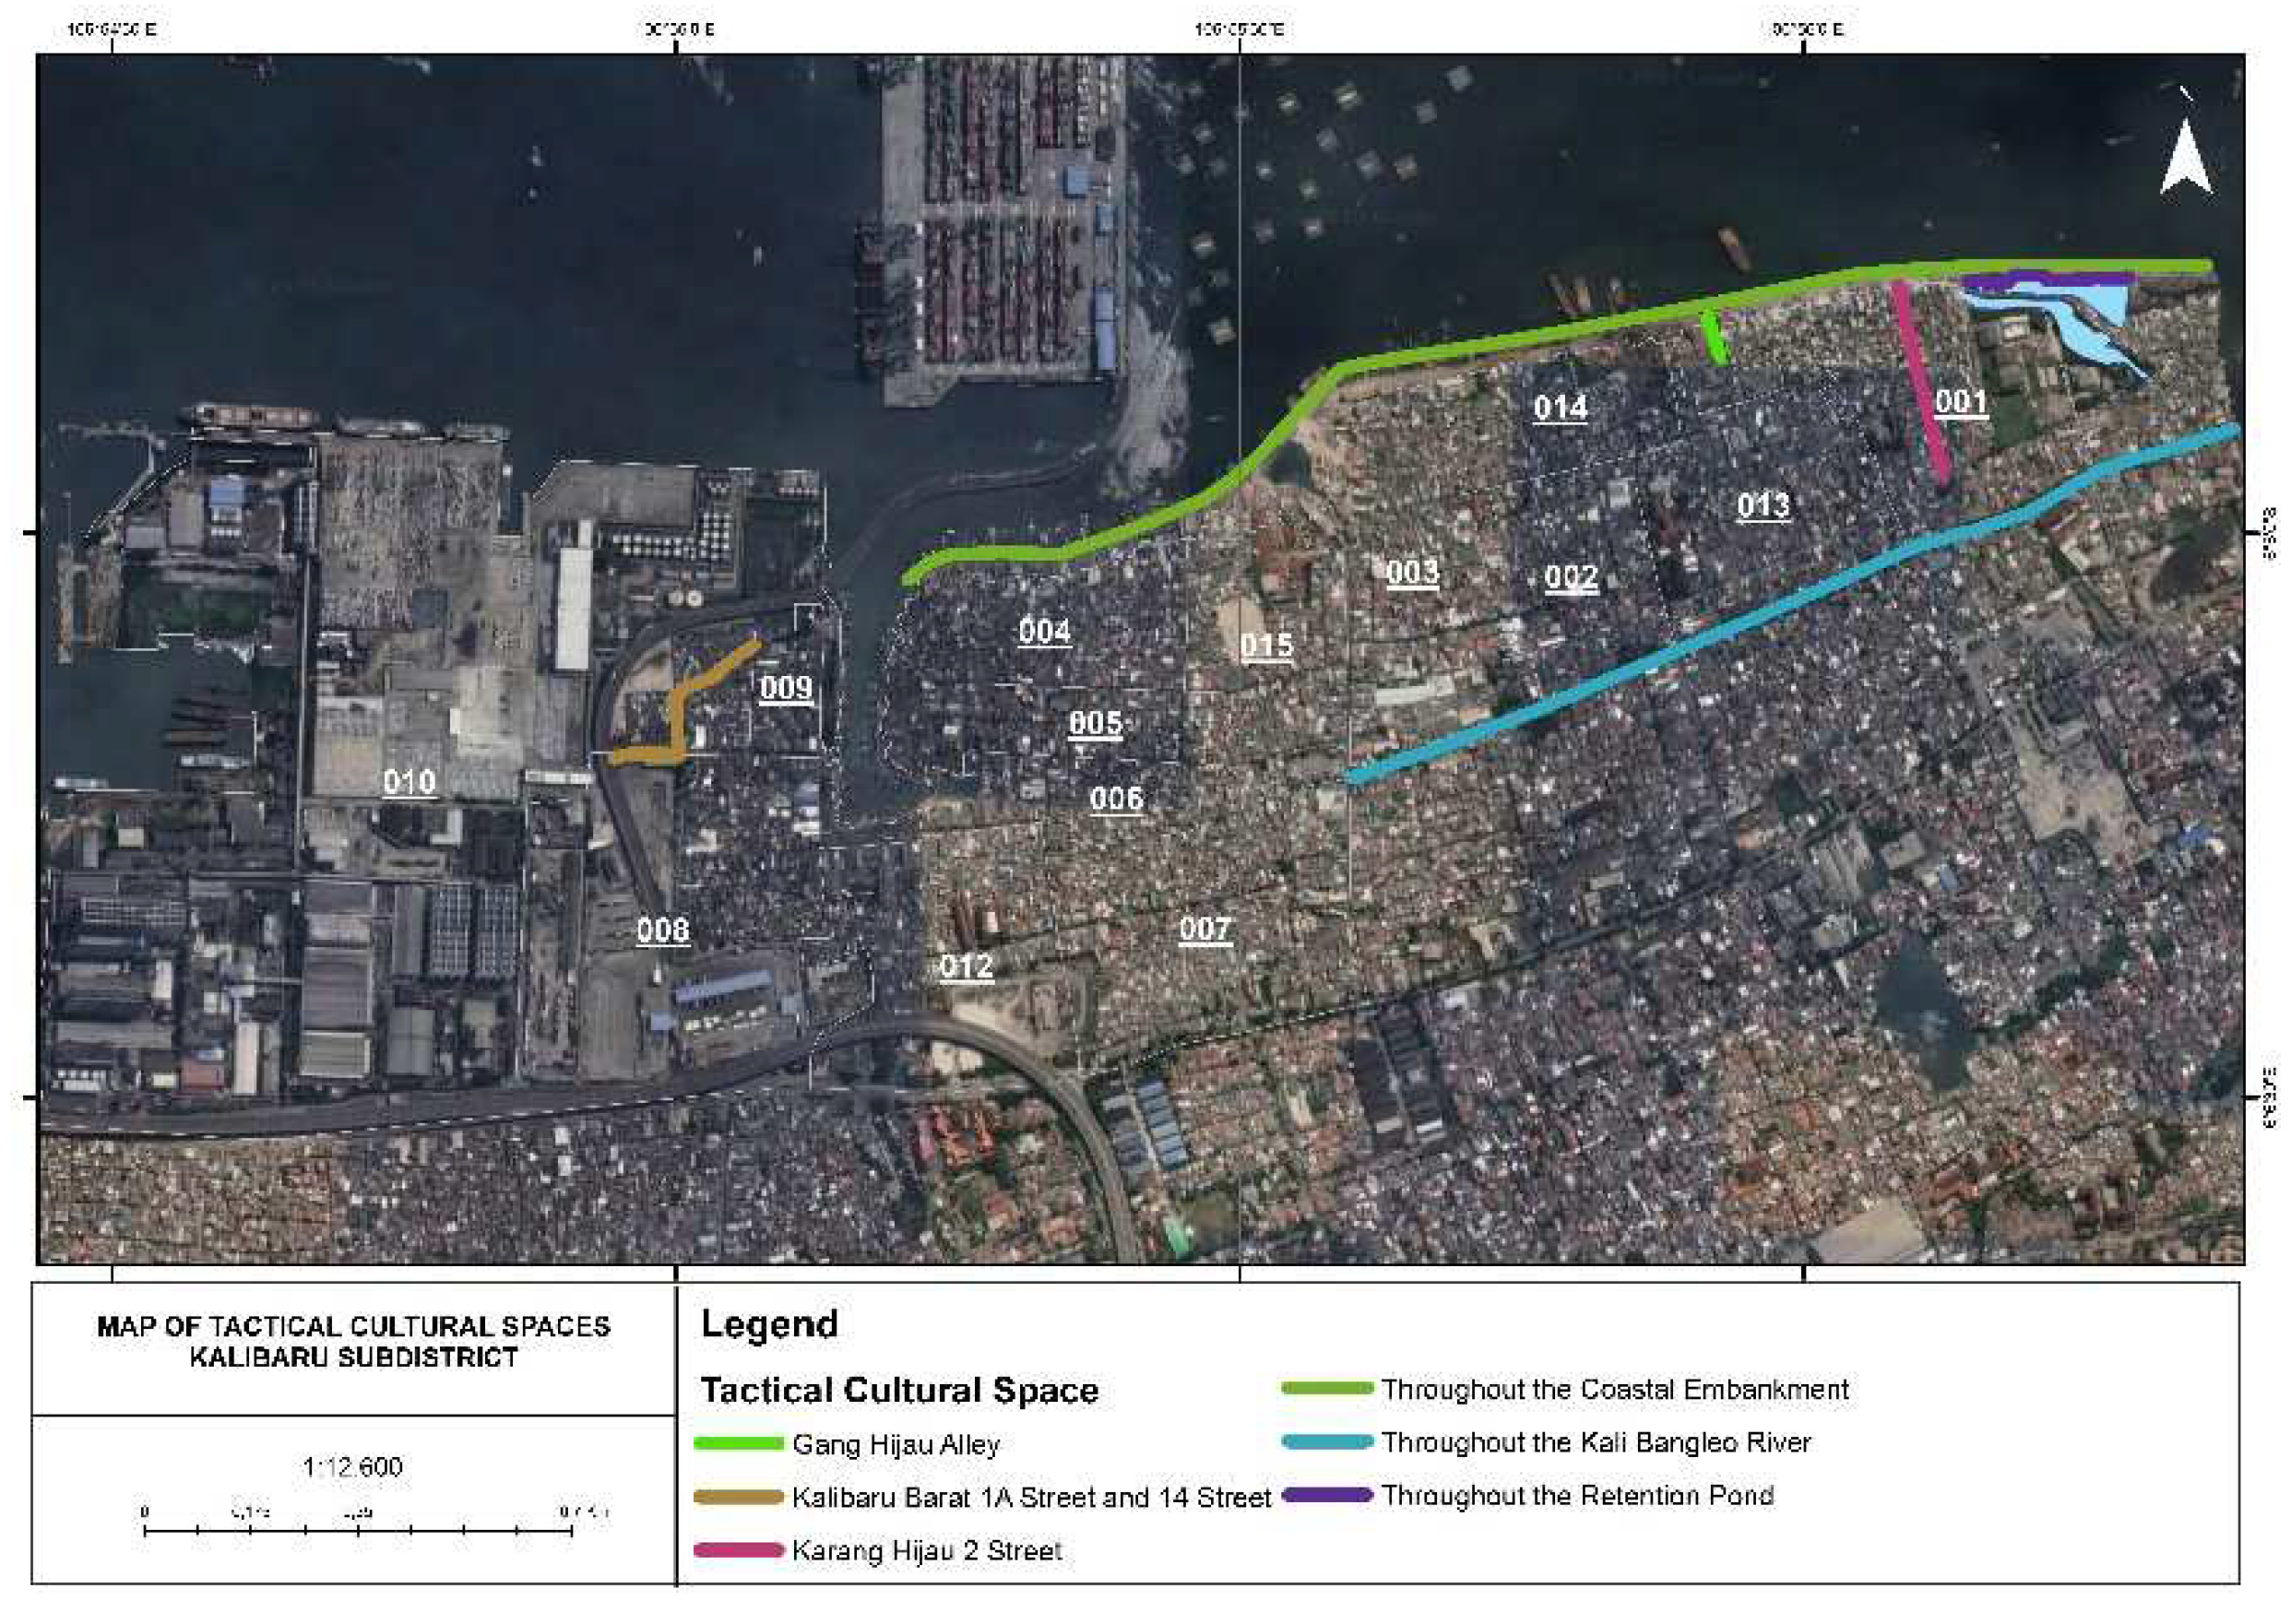
Figure 11.
Retention ponds (a) RW 03/RW 15 and (b) RW 04/RW 06.
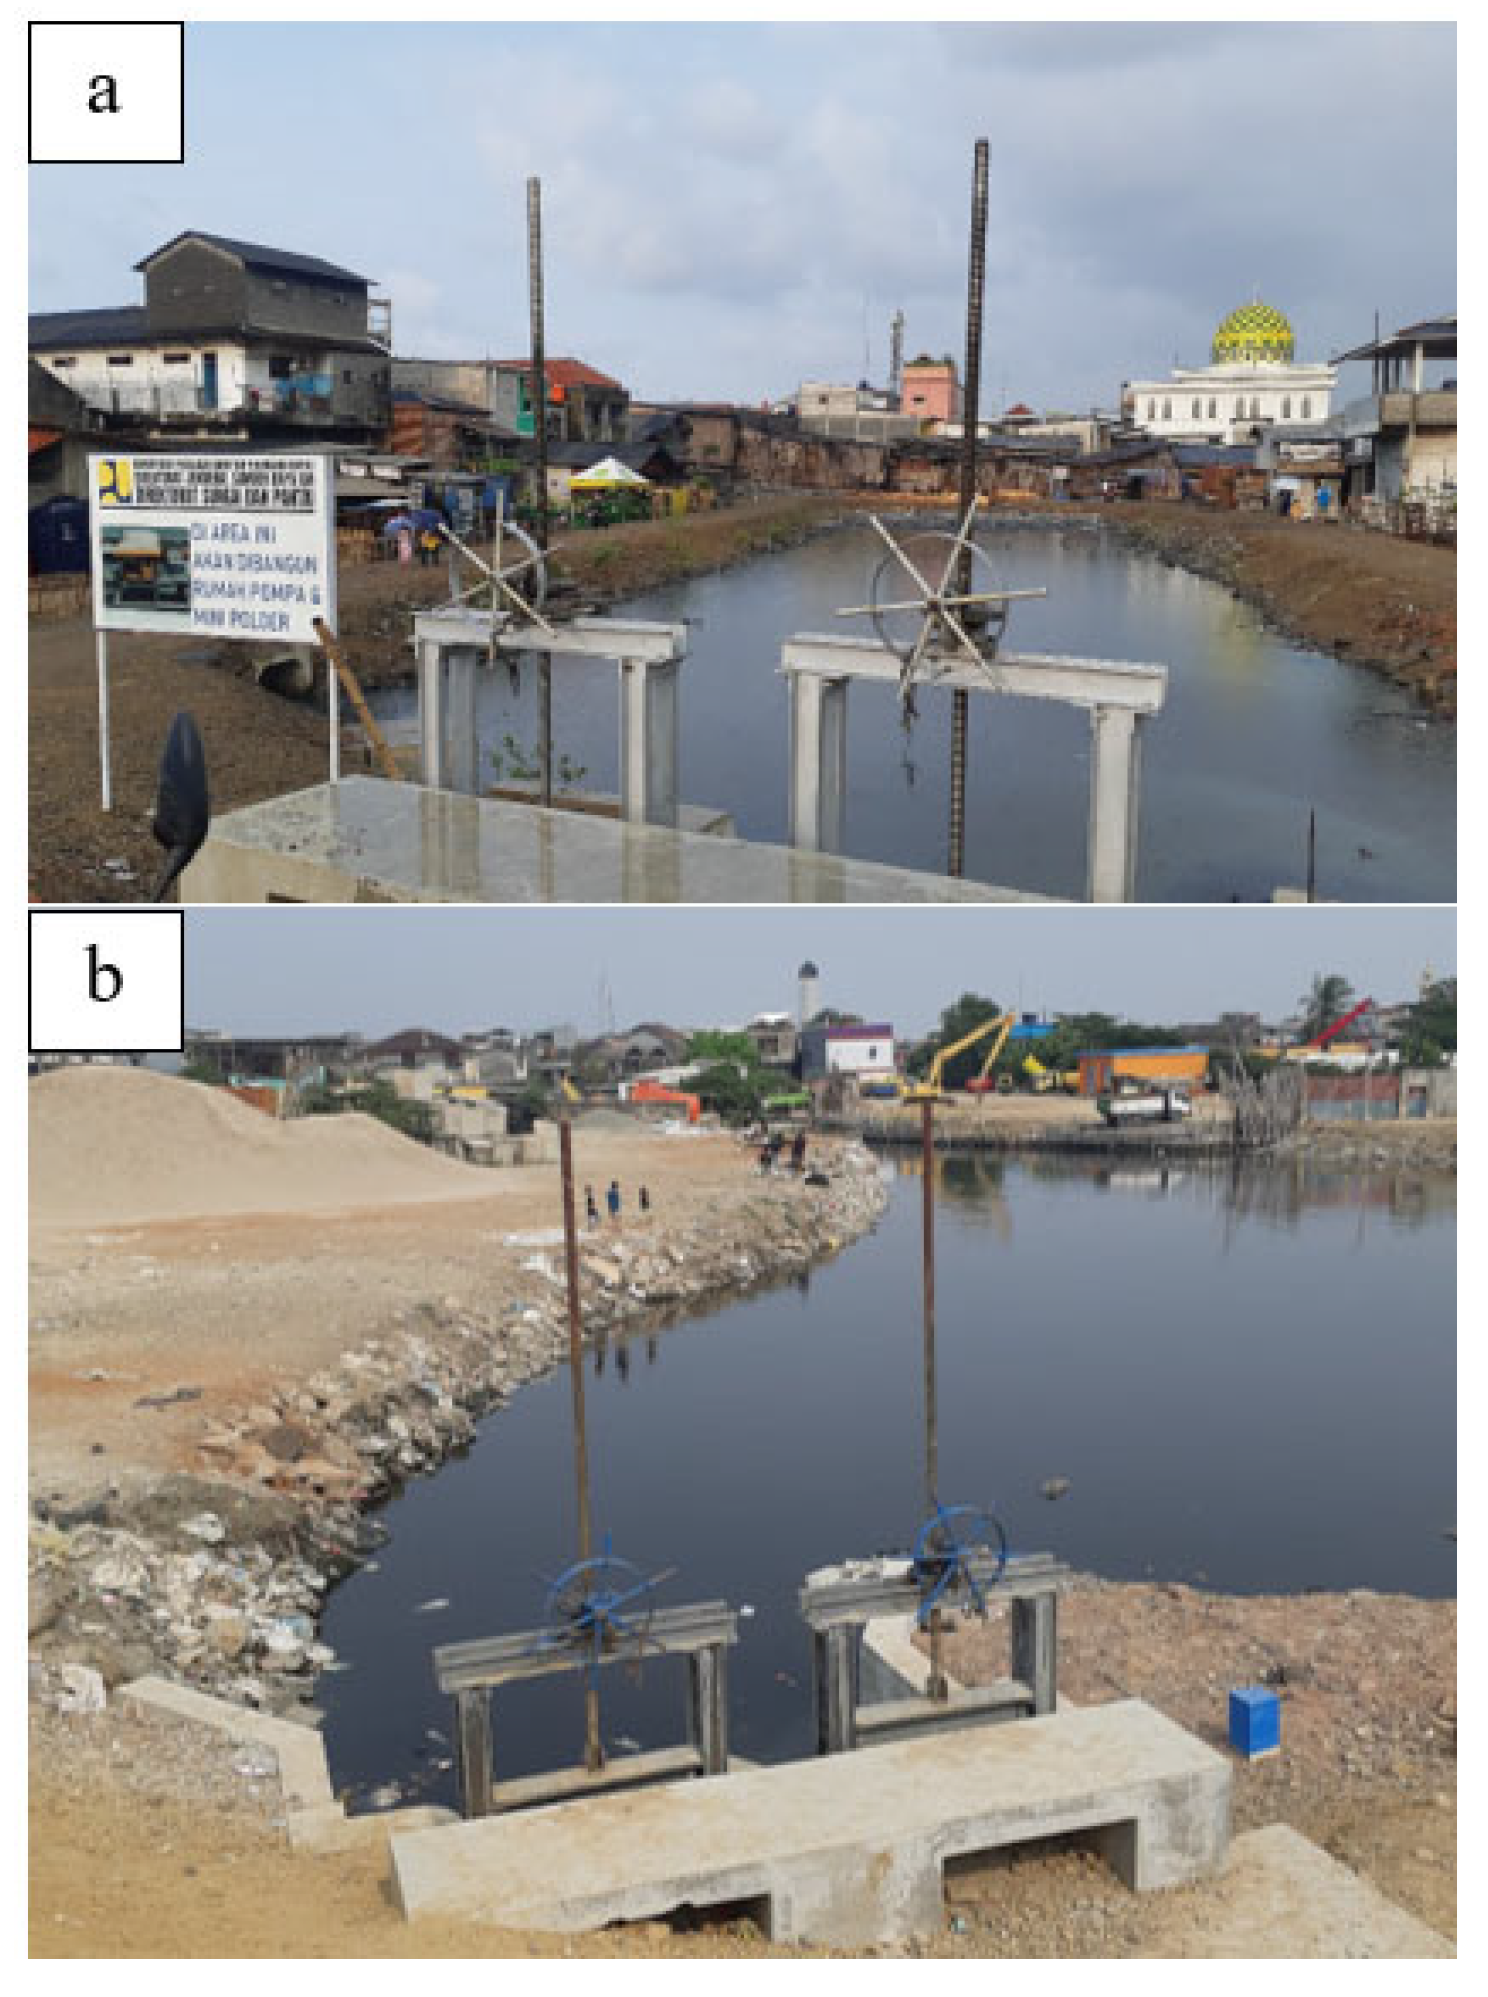
Figure 12.
Along Jalan Karang Hijau 2 street: (a) south gate and (b) north gate.
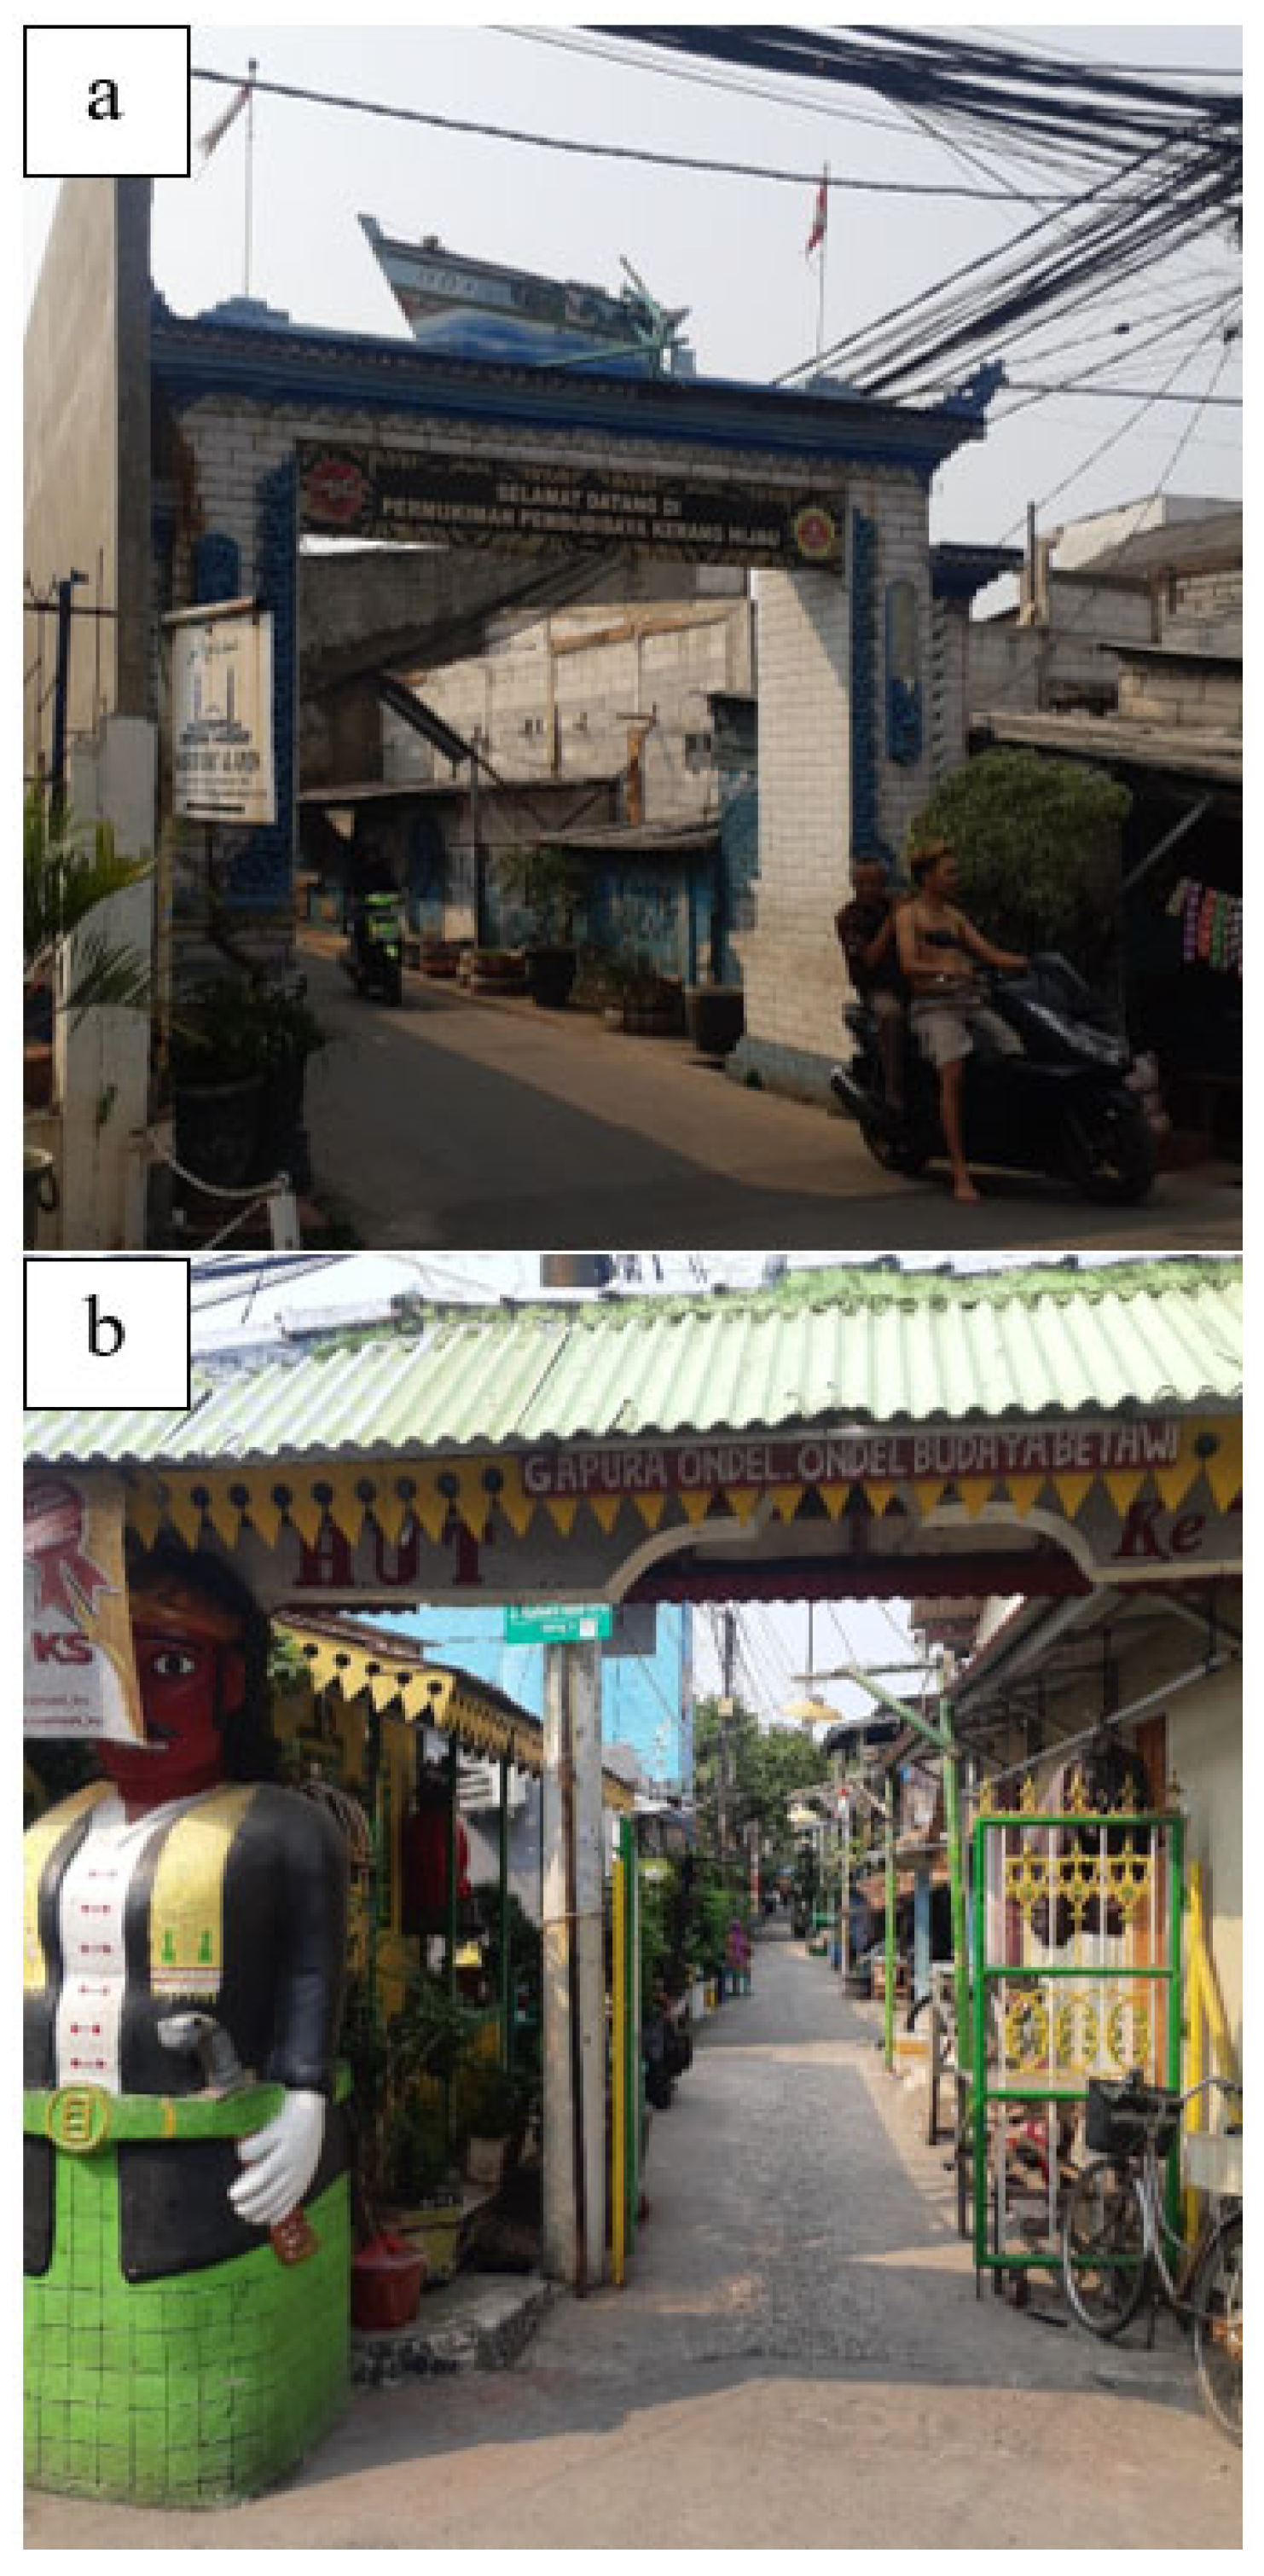
Figure 13.
Map of cultural spaces of conflict in Kalibaru Subdistrict.
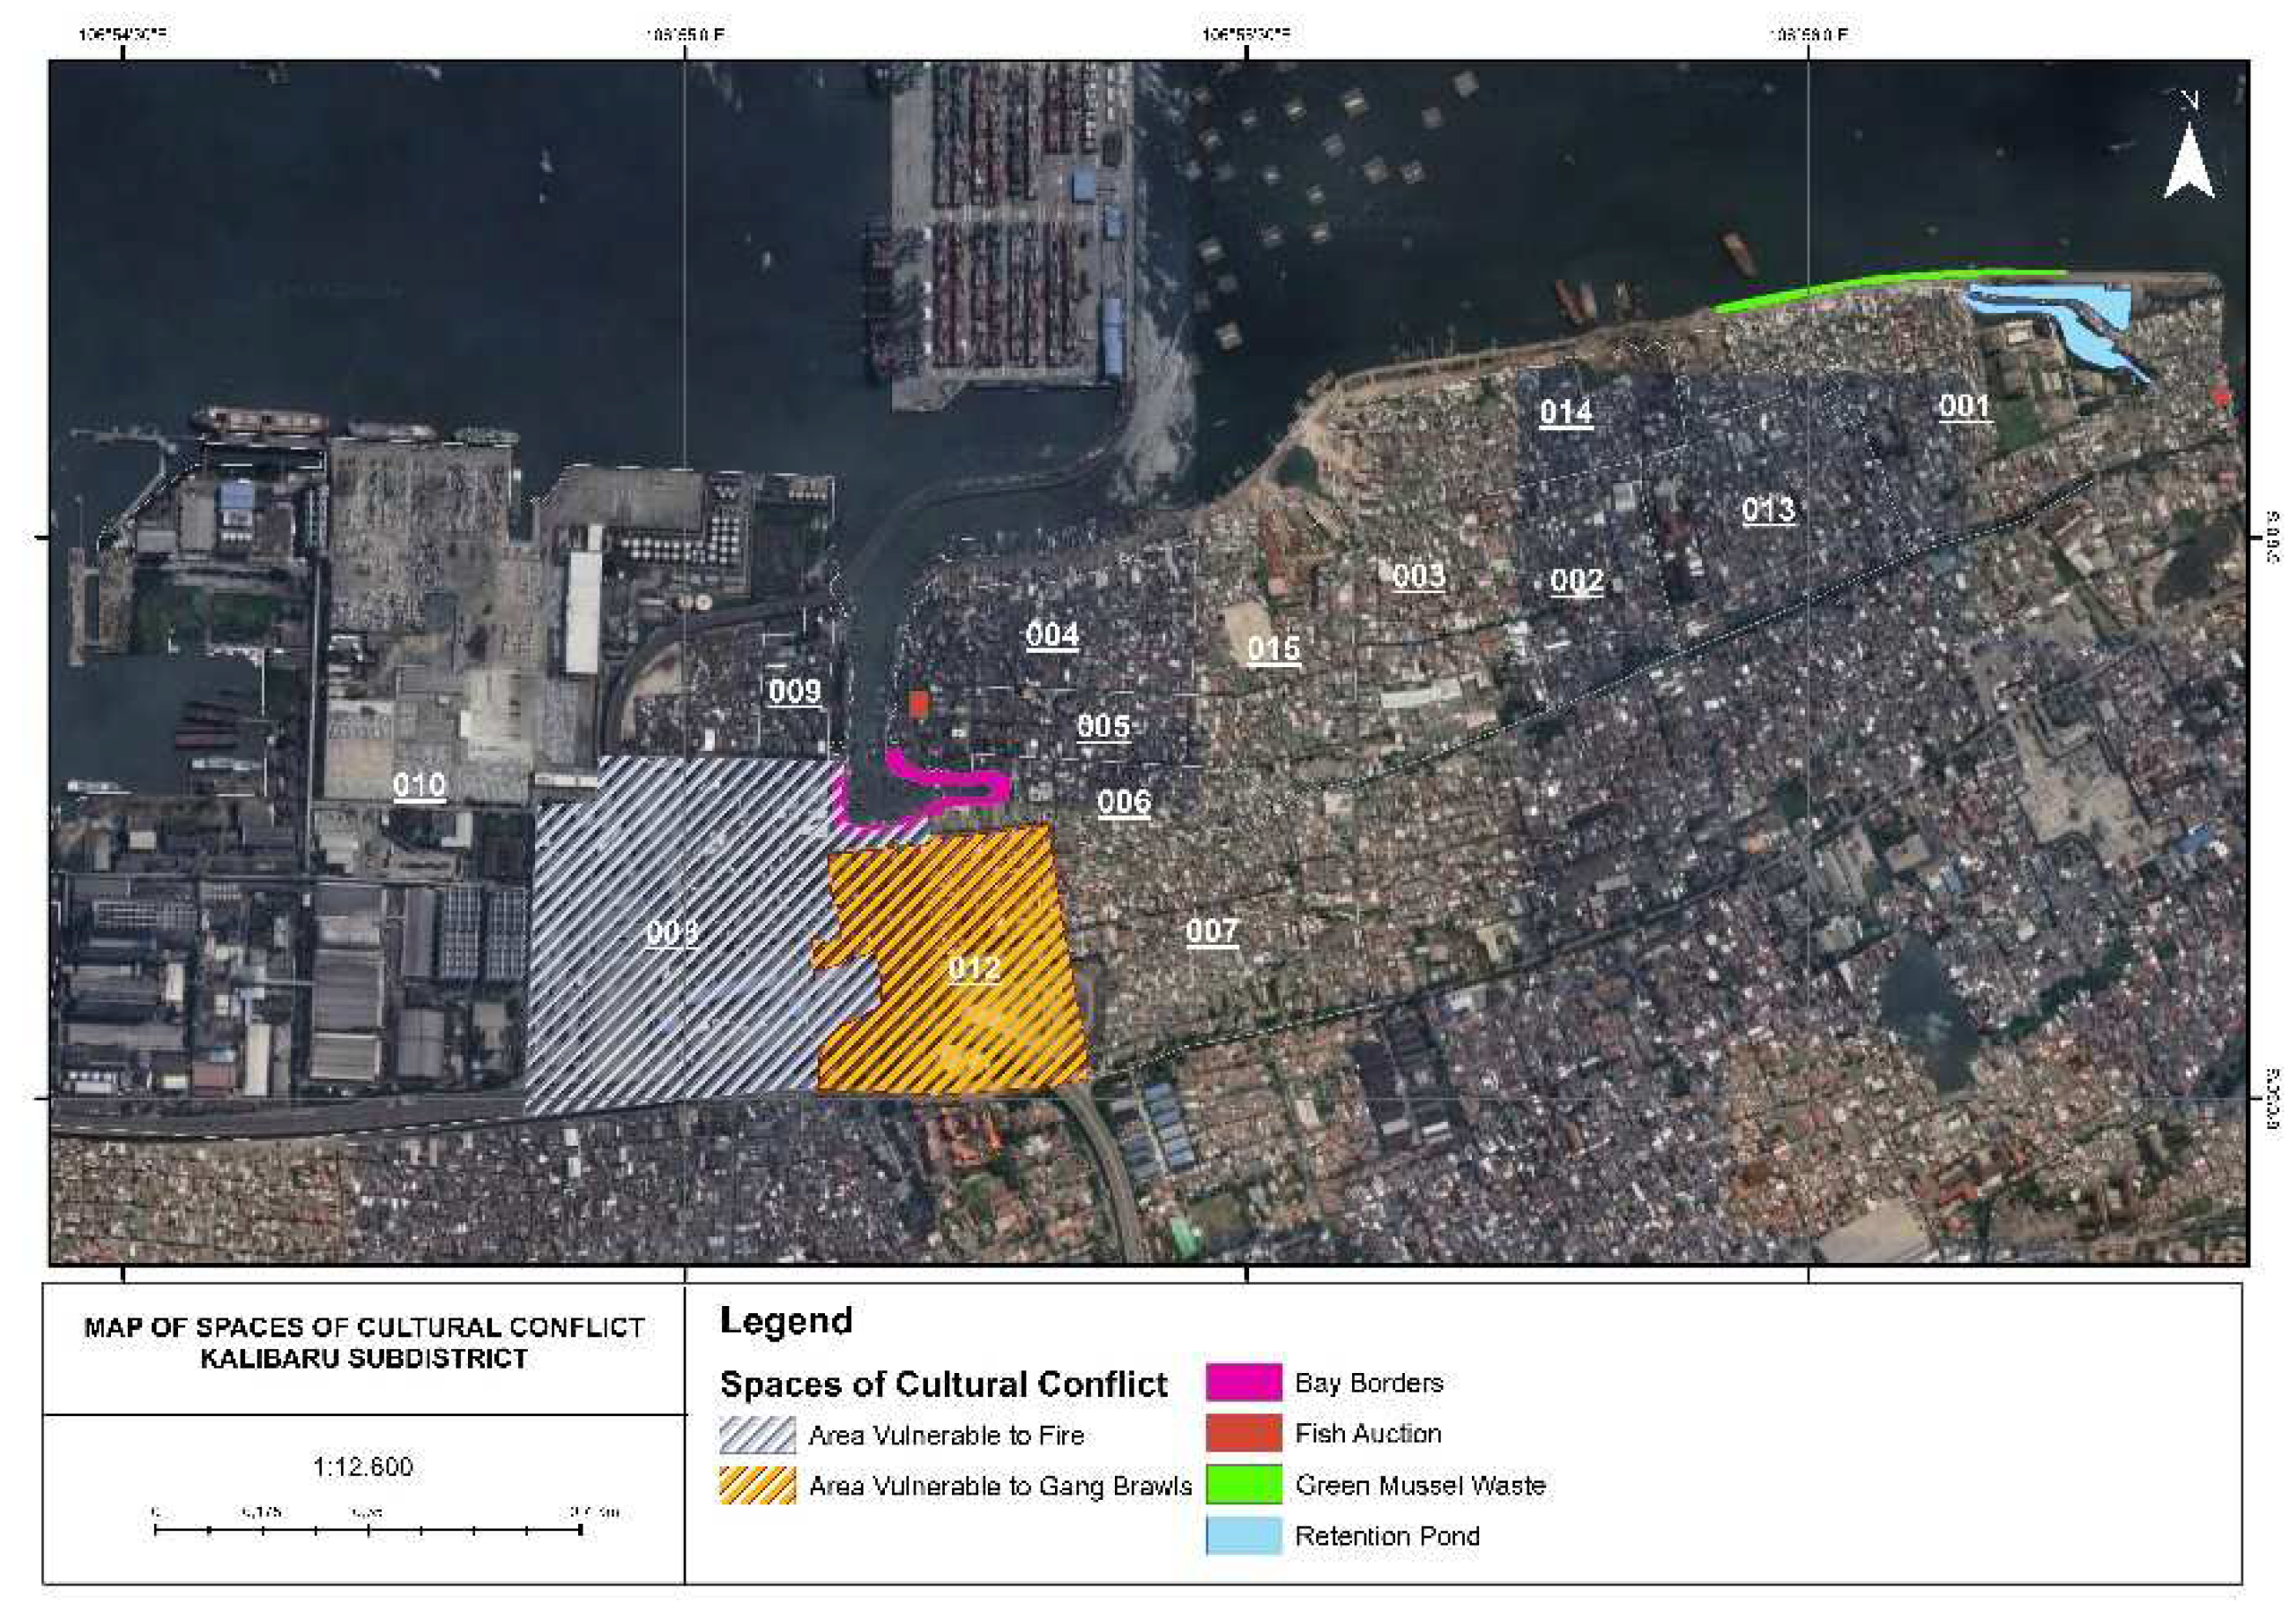
Figure 14.
Around the bay at (a) when it is dry and (b) when it is inundated.
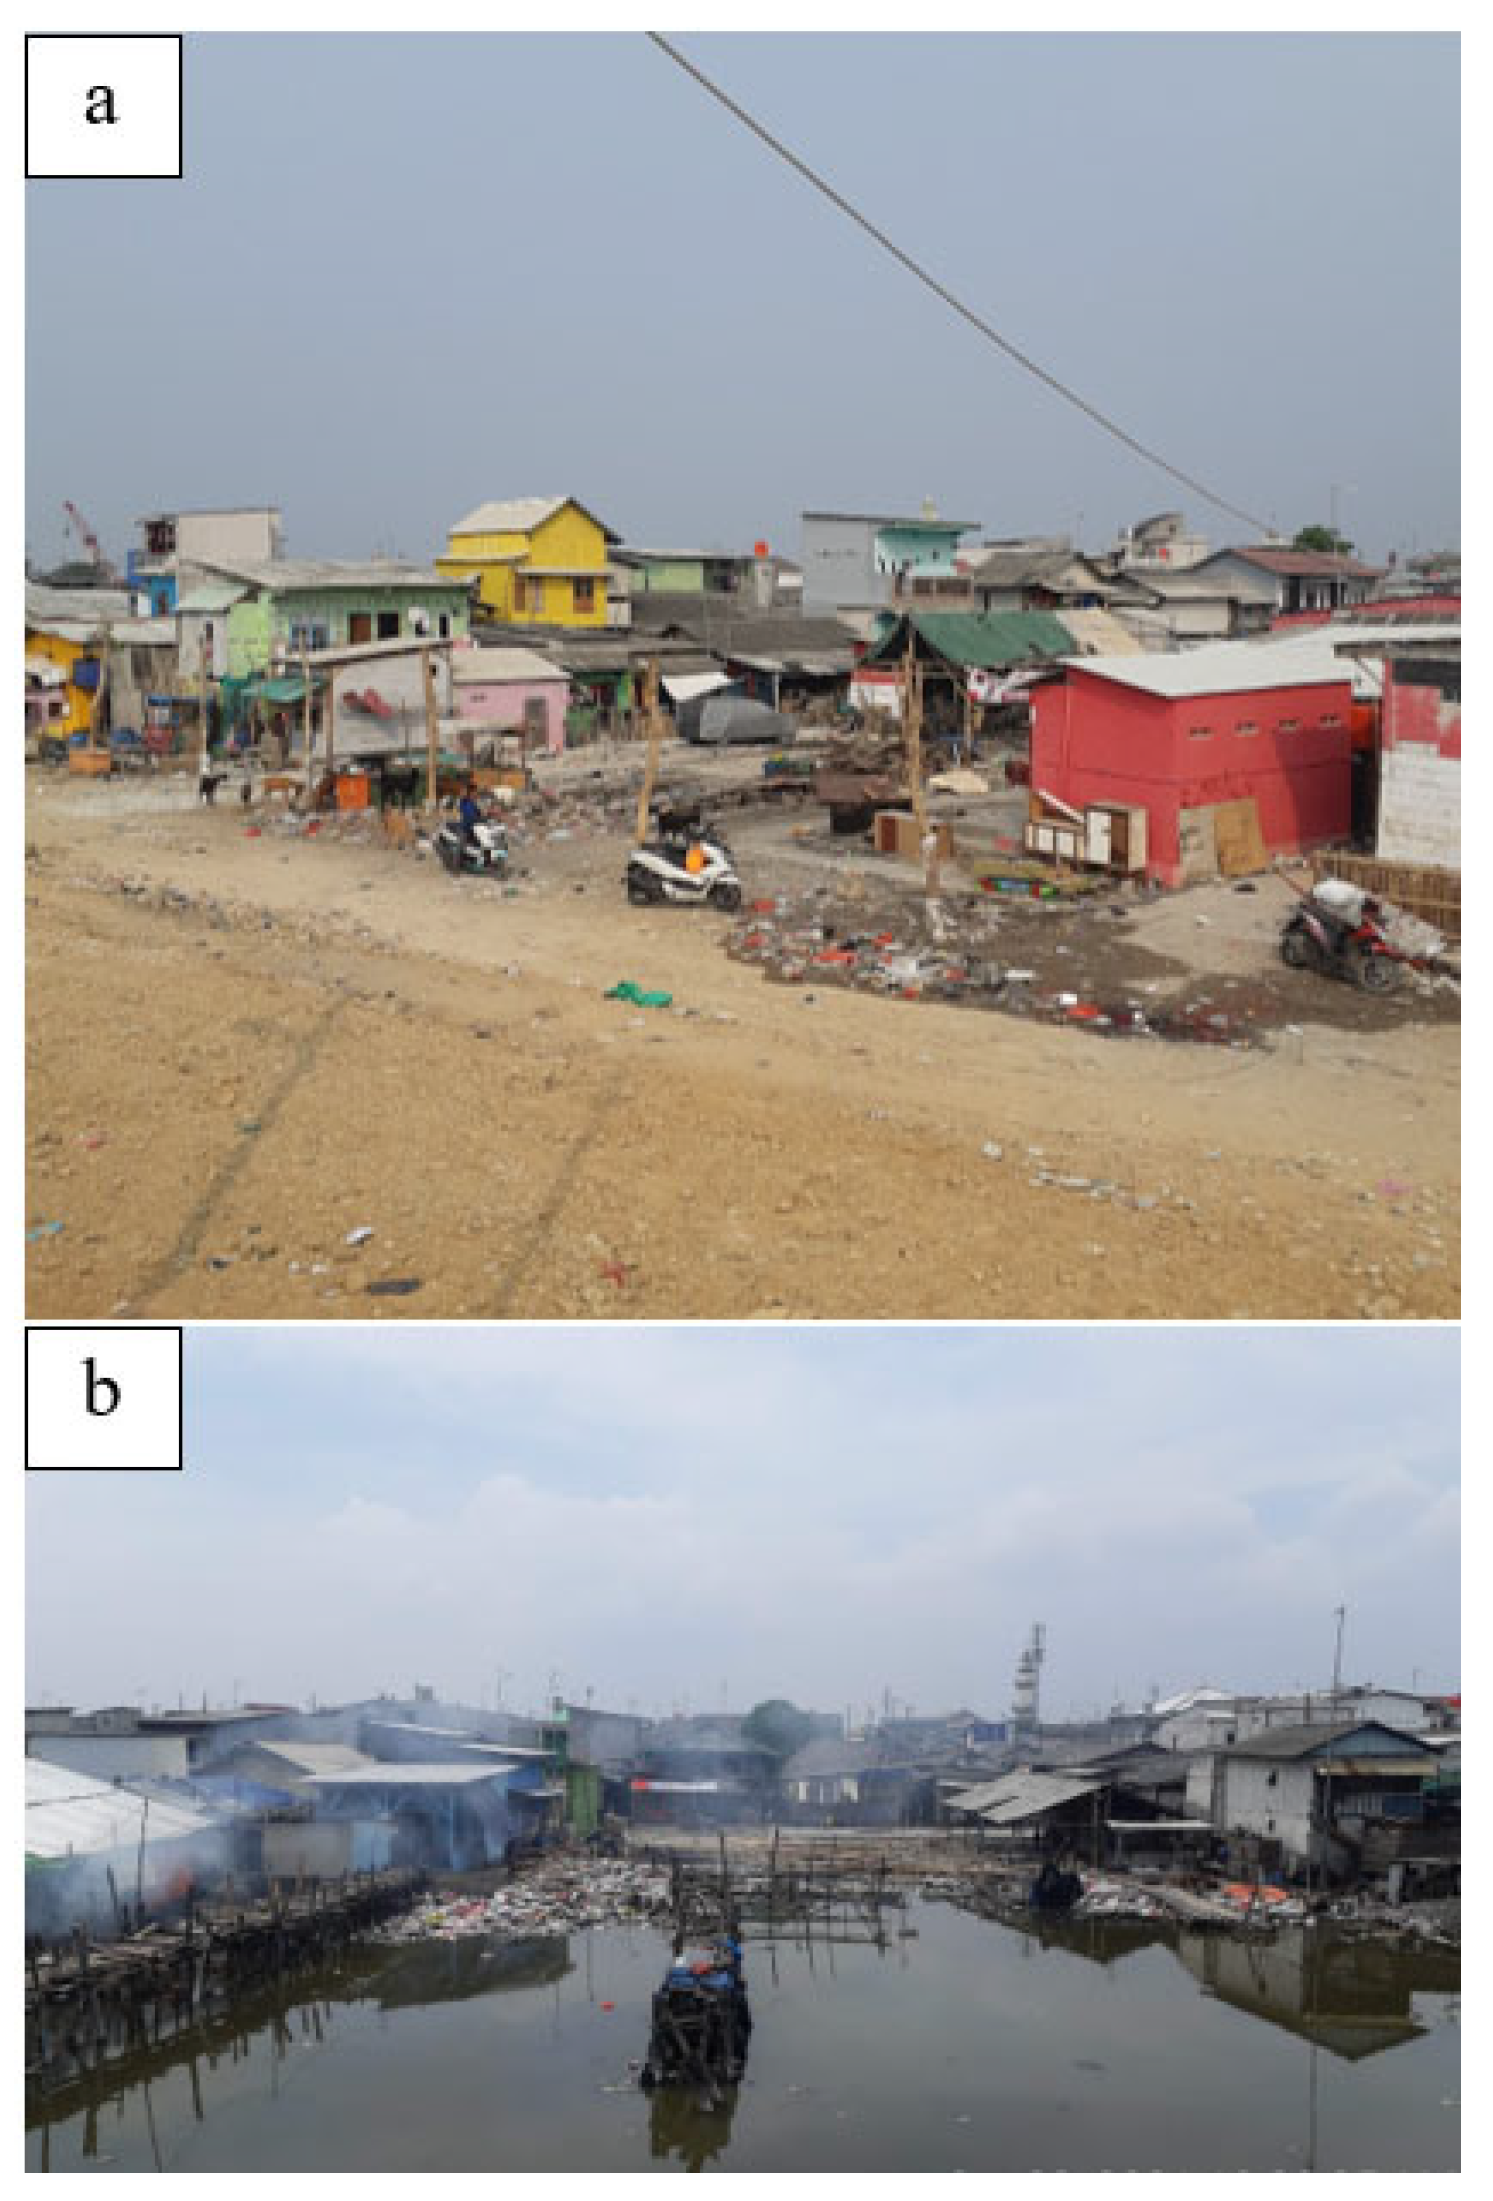
Figure 15.
Stockpiling of (a) bamboo and rope, (b) sand depot, and (c) mussel shell waste along the embankment.
Figure 15.
Stockpiling of (a) bamboo and rope, (b) sand depot, and (c) mussel shell waste along the embankment.
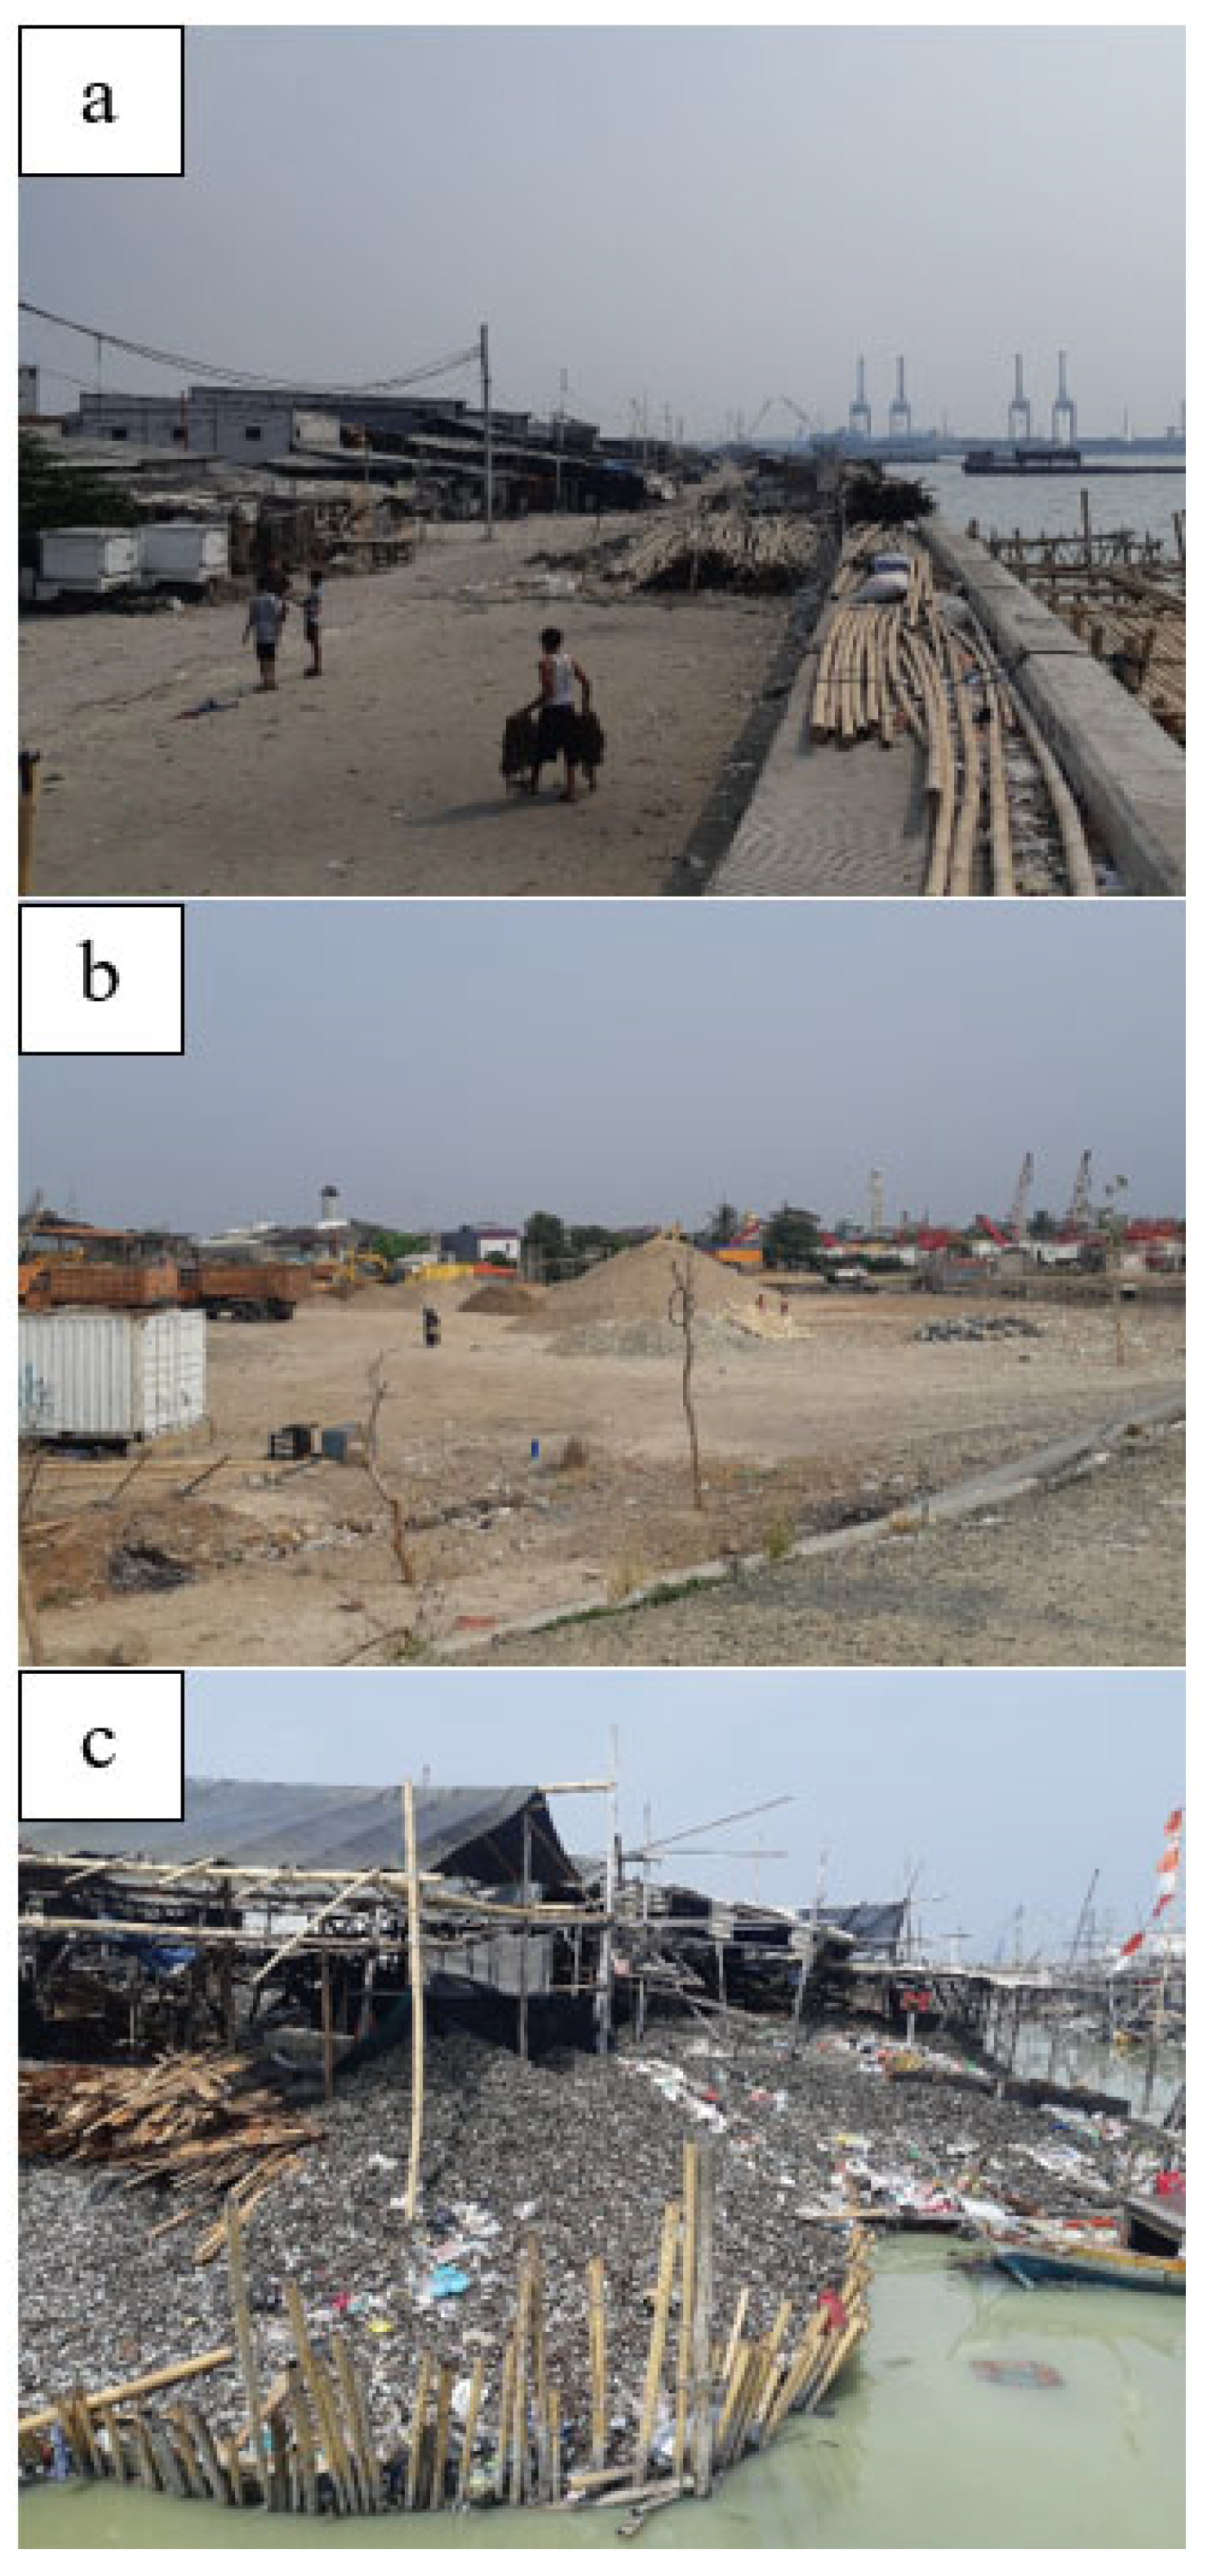
Figure 16.
Rubbish piles in (a) RW 15, (b) RW 04, (c) RW 06, and (d) RW 08.
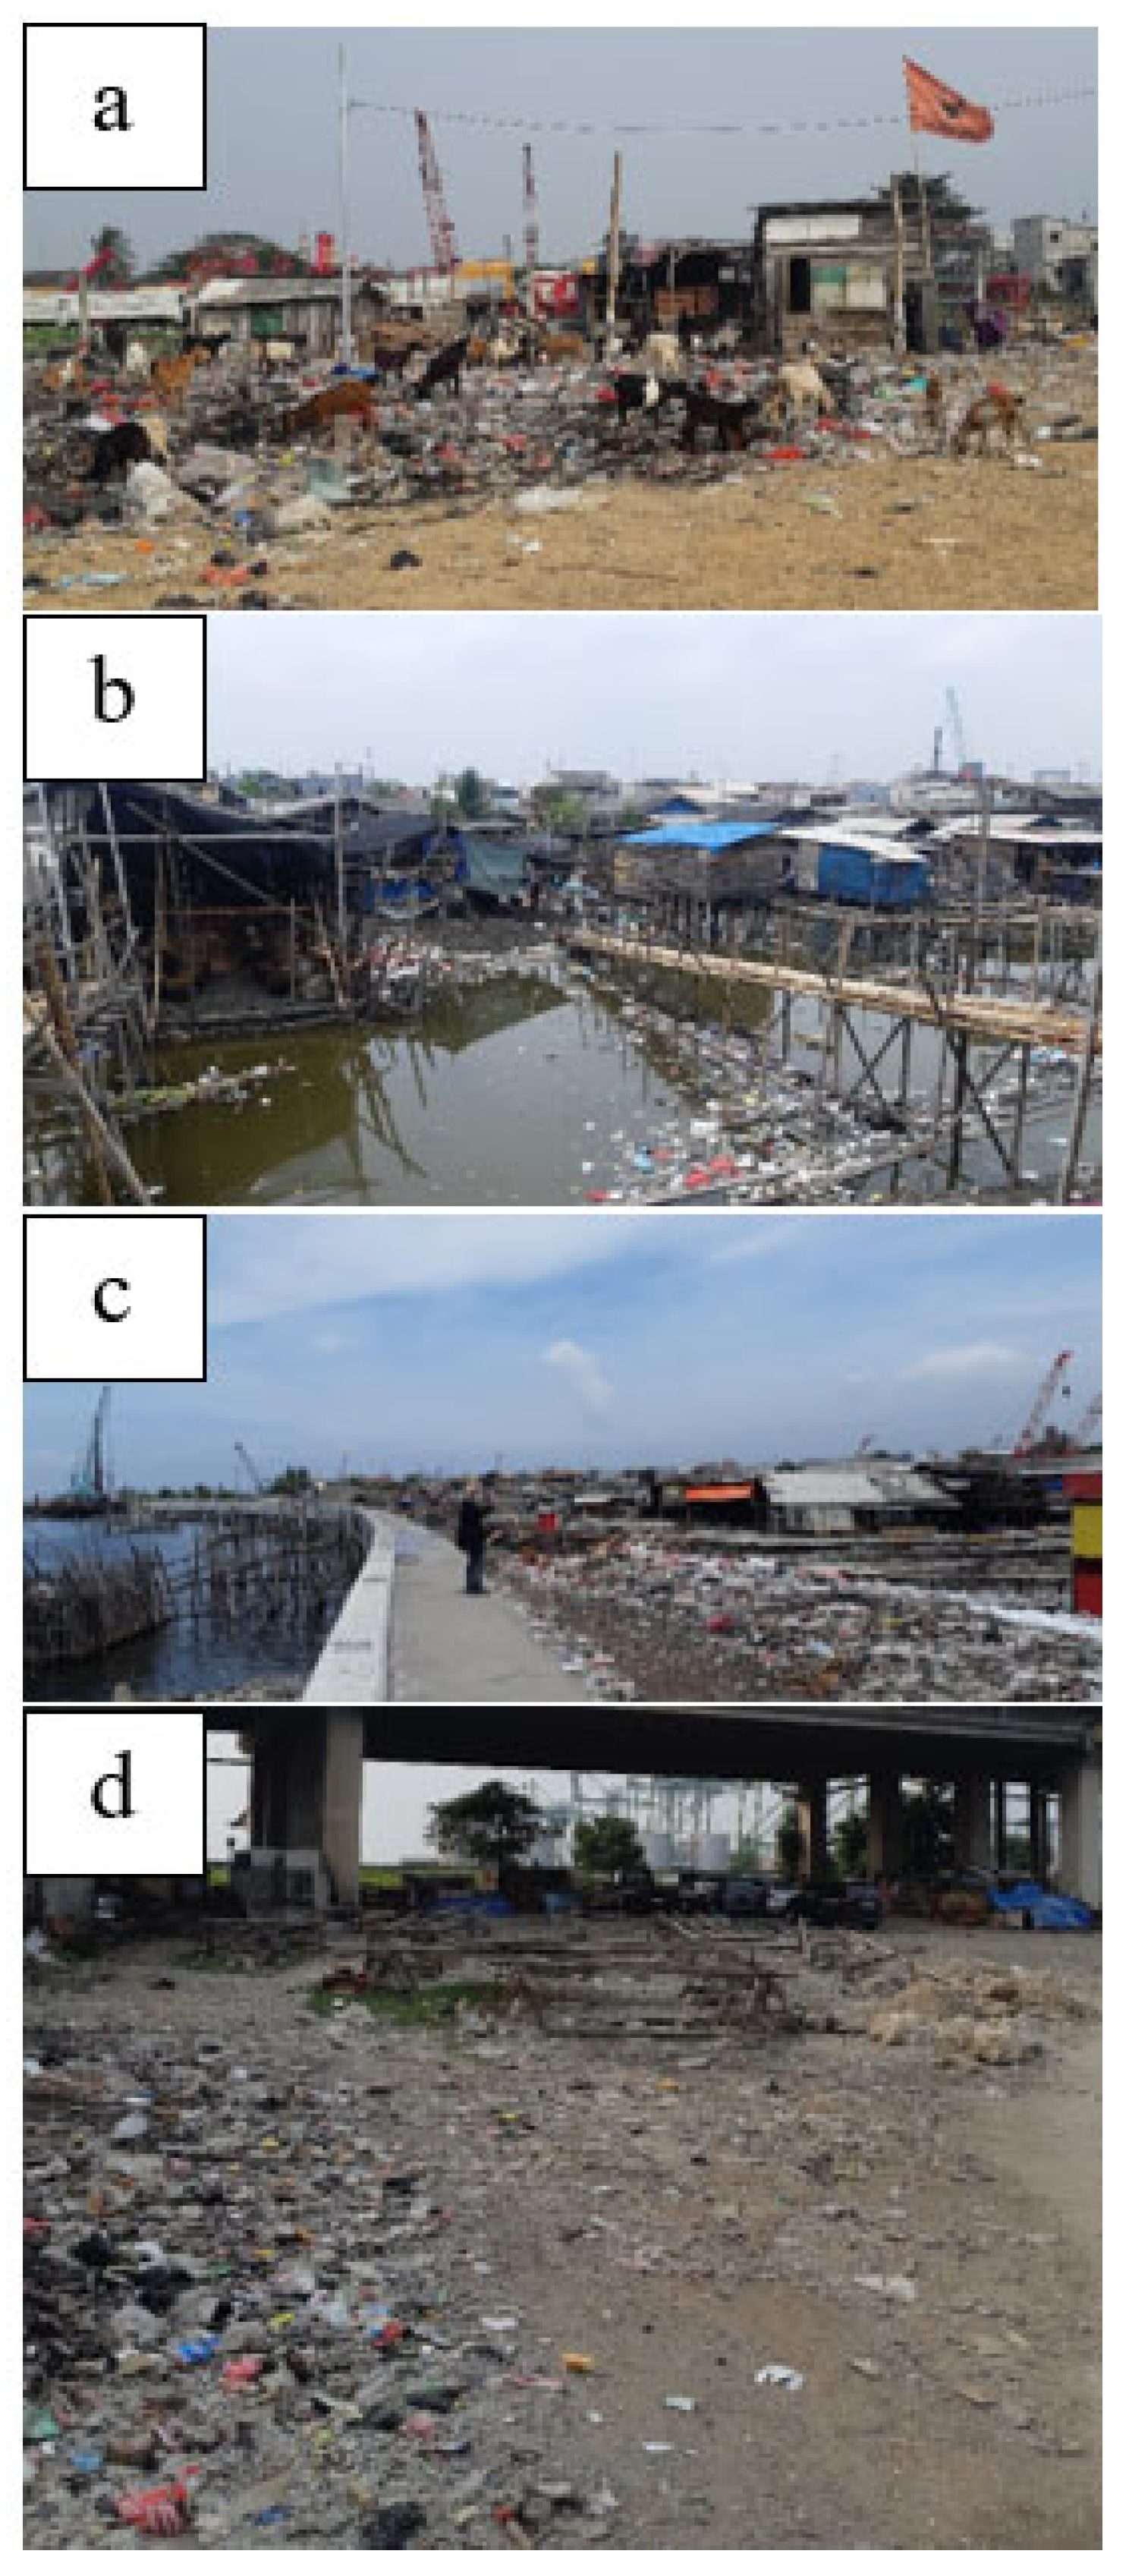
Figure 17.
Mixing economic activity spaces such as (a) ship splitting, (b) drying salted fish and (c) fish processing in informal spaces.
Figure 17.
Mixing economic activity spaces such as (a) ship splitting, (b) drying salted fish and (c) fish processing in informal spaces.
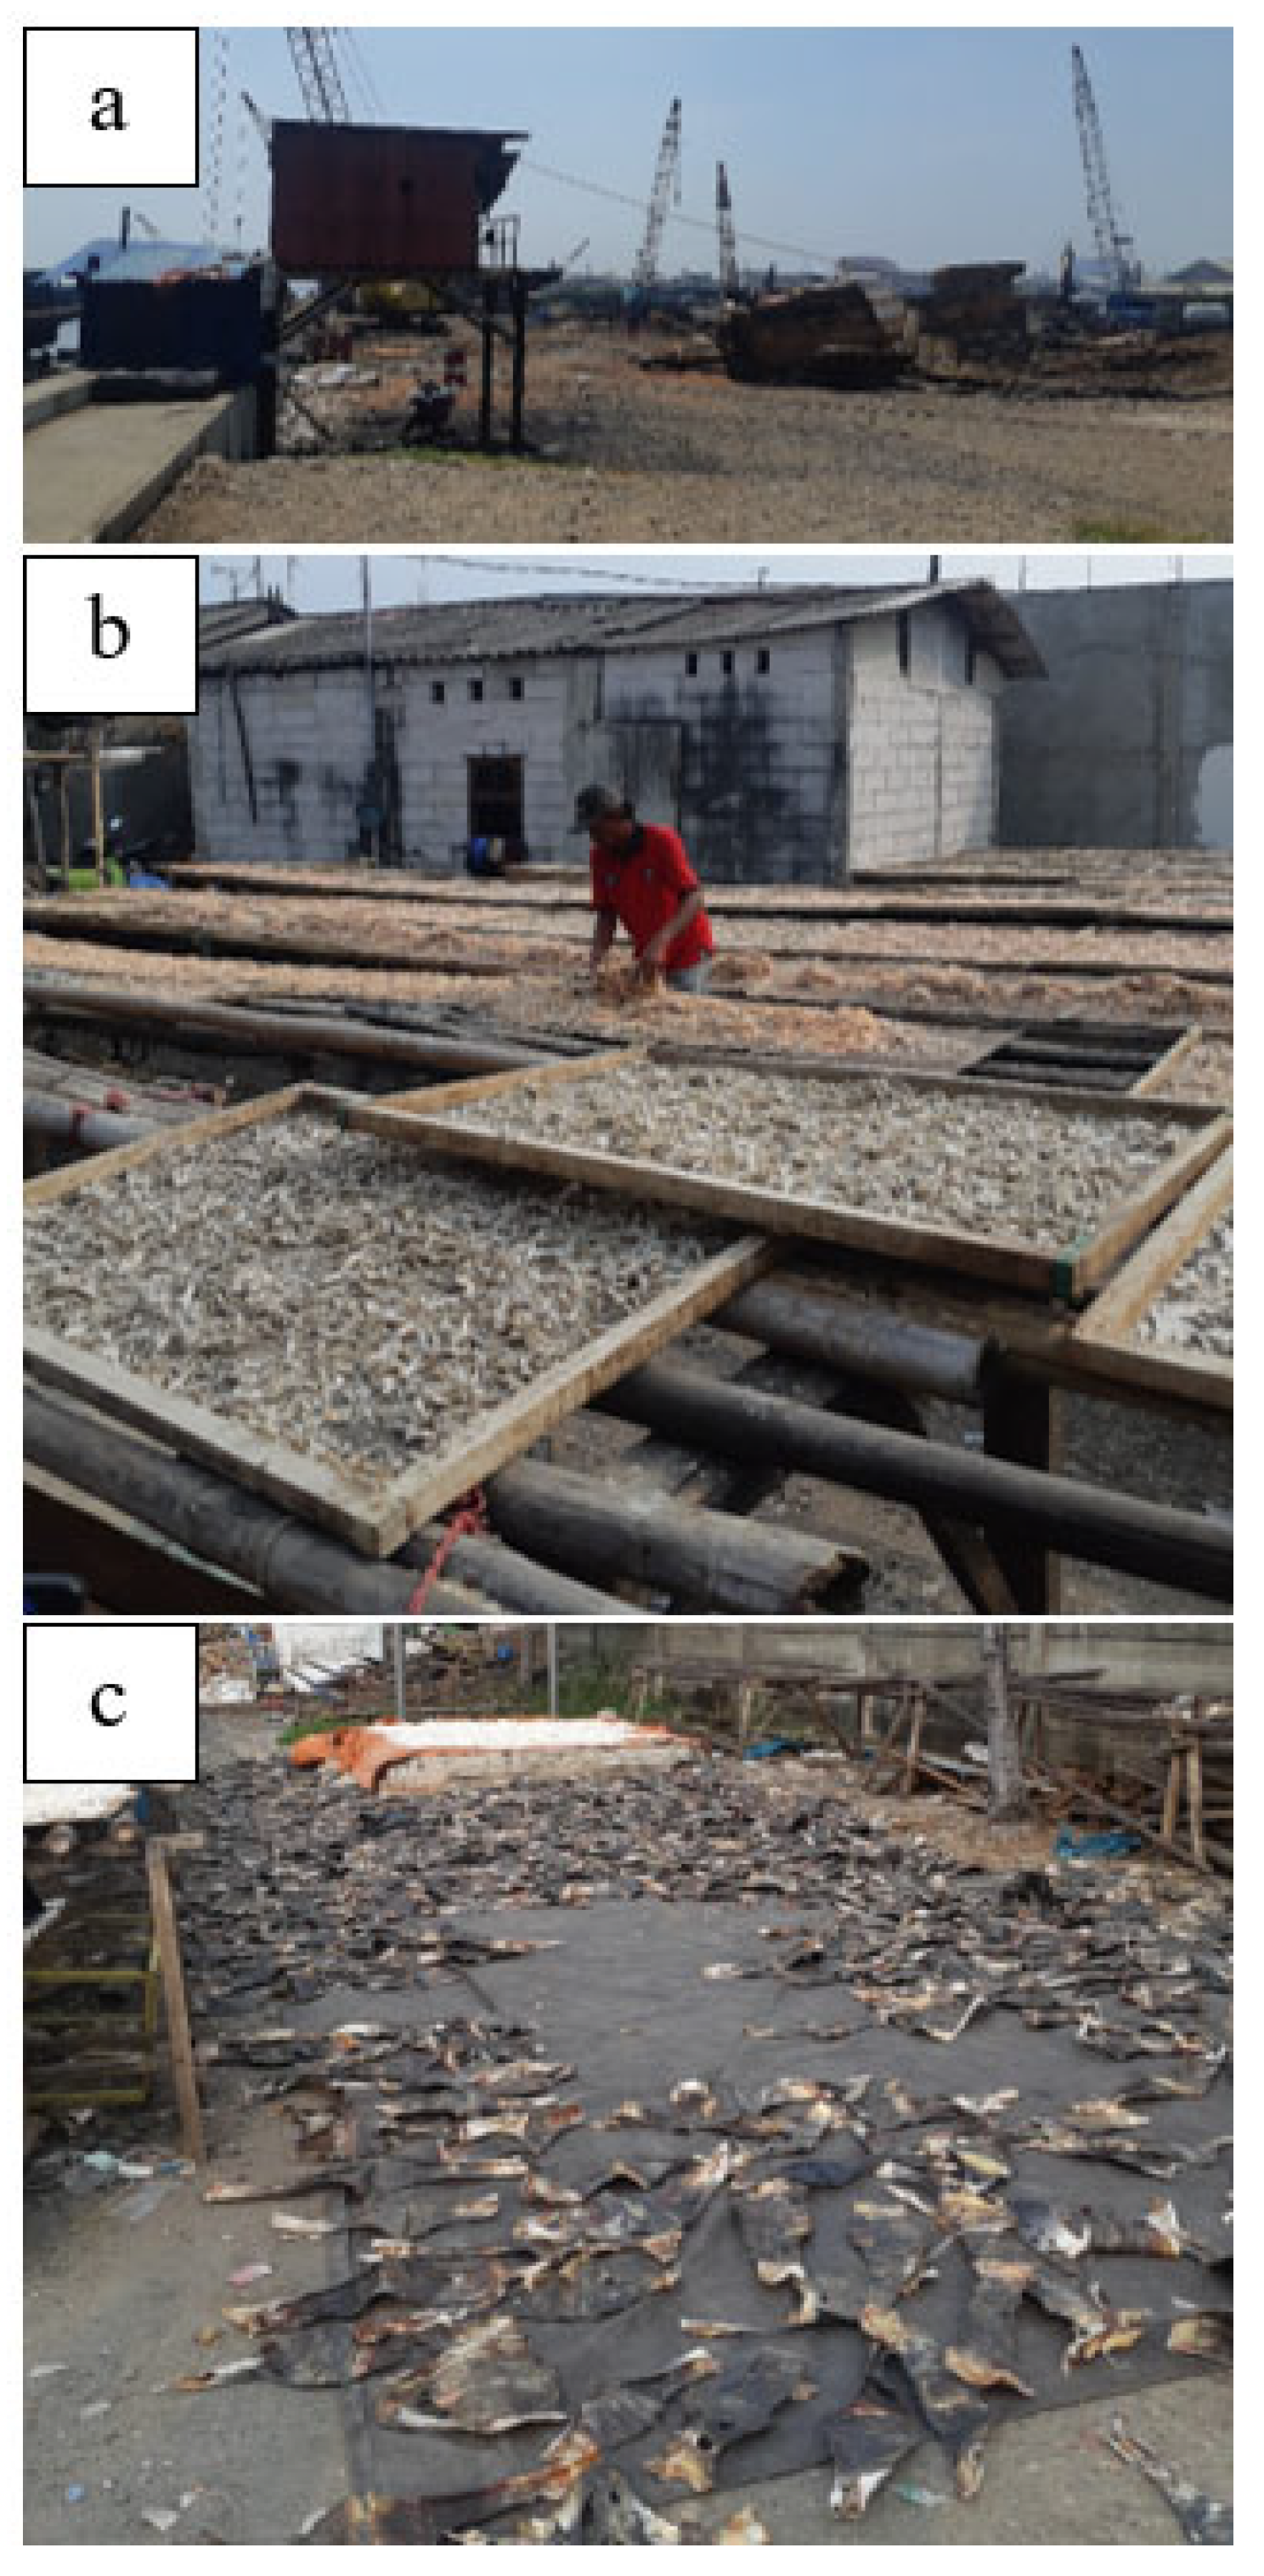
Table 1.
Identifiers for informants in the study.
| Letter | Male/ Female |
Age | Years of residence |
Identified ethnicity |
Field of work/ organization |
|---|---|---|---|---|---|
| A | M | 37 | 32 | Betawi |
Public facilities care/ Karang Taruna youth |
| B | M | 47 | 33 | Betawi- Indramayu |
Fisherman/ Kalibaru fishermen co-op |
| C | F | 42 | 42 | Sulawesi |
Housewife/ PKK women’s organization |
| D | M | 37 | 22 | Betawi- Indramayu |
Public facilities care/ Local mosque assembly |
| E | M | 36 | 36 | Betawi- Indramayu |
Fisherman/ Private social foundation |
| F | F | 51 | 26 | Makassar- Sulawesi |
Housewife/ PKK women’s organization |
| G | M | 37 | 37 | Bone- Sulawesi |
Karang Taruna youth |
| H | F | 49 | 39 | Bugis- Sulawesi |
Elementary schoolteacher/ PKK women’s organization |
| I | M | 36 | 36 | Indramayu |
Public facilities care/ Local mosque assembly |
| J | M | 28 | 28 | Betawi- Indramayu |
Shipping port worker/ Karang Taruna youth |
Table 2.
Kalibaru Subdistrict area data.
| RW | Number of RT |
Number of families |
Total population |
Area (Ha) |
|---|---|---|---|---|
| 01 | 15 | 2.766 | 8.784 | 14 |
| 02 | 13 | 1.382 | 4.311 | 8,9 |
| 03 | 17 | 2.813 | 8.660 | 14,8 |
| 04 | 14 | 2.171 | 7.076 | 11,3 |
| 05 | 13 | 1.536 | 4.765 | 4,9 |
| 06 | 12 | 1.838 | 5.695 | 6 |
| 07 | 15 | 4.109 | 12.595 | 17,3 |
| 08 | 11 | 2.092 | 6.025 | 28,4 |
| 09 | 6 | 524 | 1.604 | 2,5 |
| 10 | 9 | 1.116 | 3.441 | 97,7 |
| 12 | 14 | 2.660 | 7.729 | 15,6 |
| 13 | 13 | 2.466 | 7.863 | 14,1 |
| 14 | 8 | 1.520 | 4.841 | 8,4 |
| 15 | 12 | 1.639 | 5.233 | 9,9 |
| Total | 88.622 | 253,9 | ||
Table 3.
Description of area cluster.
| Cluster | RW | Description |
|---|---|---|
| Industrial Zone | 08 | The Industrial Zone is marked by the presence of companies, mostly import-export, with offices or warehouses and business activities on site, including PT AIRIN, PT Bogasari, PT Indofood Sukses Makmur, PT Indonesia Vehicle Terminal, PT Pelabuhan Indonesia (Pelindo), and PT Pelayaran Bahtera Adhiguna. Pelindo, in particular, is the state-owned company managing the shipping container terminal in this area, namely New Priok Container Terminal One (NPCT1). Residential areas in this area are bordered by company fences and walls on the west, north, and south, and are bounded by Jakarta Bay on the east. The community organization with a significant presence in this area is the Kalibaru Port Temporary Workers Cooperative (TKBM), with most members also joining the Karang Taruna youth organization of Kalibaru Subdistrict. |
| 09 | ||
| 10 | ||
| West Kalibaru | 04 | West Kalibaru area is marked by Jalan Raya Cilincing road in the south, Jakarta Bay and the Jakarta Outer Ring Road tollroad in the west, Jakarta Bay in the north, and Jalan Cilincing Baru road in the east. Jalan Cilincing Baru road is the main marker between the West Kalibaru and East Kalibaru areas. Other markers are the fish auction (TPI) at West Kalibaru in RW 04 and TPI at East Kalibaru in RW 01. The community organization with a significant presence in the region is the West Kalibaru Fishermen Association. |
| 05 | ||
| 06 | ||
| 07 | ||
| 12 | ||
| 15 | ||
| East Kalibaru | 01 | East Kalibaru area is marked by Jalan Raya Cilincing road in the south, Jalan Cilincing Baru road in the west, Jakarta Bay in the north, and Jalan Cilincing Krematorium road in the east. This area includes most of the embankment construction on the border of Jakarta Bay and Kalibaru Subdistrict. The community organization with a significant presence in the region is the East Kalibaru Fishermen Association. This area is adjacent to the Cilincing Subdistrict which has its own fish auction (TPI) and fishermen association at the mouth of Kali Rawa Malang river. |
| 02 | ||
| 03 | ||
| 13 | ||
| 14 |
Table 4.
Land use in Kalibaru Subdistrict.
| Land use | Area (ha) |
|---|---|
| Shipyard | 0,74 |
| Open warehouse | 12,11 |
| Closed warehouse | 1,83 |
| Other green space | 0,52 |
| Industry | 2,60 |
| Small industry | 1,29 |
| Playgroup/Kindergarten | 0,01 |
| Clinic | 0,02 |
| Pool | 0,31 |
| Empty land | 3,21 |
| Sports field | 0,89 |
| Financial institution | 0,05 |
| Mosque | 0,55 |
| Minimarket | 0,07 |
| Musala/Prayer room | 0,07 |
| Motor vehicle parking | 0,83 |
| Truck and container parking | 5,45 |
| Central market | 0,41 |
| Traditional market | 1,61 |
| Motor vehicle washing | 0,09 |
| Basic education | 1,16 |
| Upper secondary education | 0,67 |
| Junior secondary education | 0,01 |
| Regional government office | 0,36 |
| National government office | 0,11 |
| Shop | 4,55 |
| Pesantren/Islamic boarding school | 0,06 |
| Pura/Temple | 1,07 |
| Public health centre | 0,12 |
| Small house | 14,89 |
| Boarding house | 0,38 |
| Very small house | 38,36 |
| Medium house | 0,01 |
| Environmental playground | 0,01 |
| Fish auction | 0,04 |
Table 5.
Description of core cultural spaces in Kalibaru Subdistrict.
| Space | Description |
|---|---|
| Phase A NCICD embankment in Kalibaru Subdistrict along the coast of RW 01, RW 03, RW 04, RW 06, RW 13, RW 14, and RW 15 | The construction of embankments in the last 5 years has had a significant impact on people's daily lives. Fishing boat harbours that were previously located along the coast are now concentrated in RW 01 and RW 04. The fishing community makes bamboo structures as boat moorings, ladders, and bridges between the sea, embankments, and land. |
| Fishing boat harbour, retention pond, and pump house in RW 01 | The fishing boat port is planned to be concentrated only in RW 01 along with the next levee and container terminal construction phase. The pump house has been present in the last 2 years and has become a place of interest for the community in an effort to prevent flooding. |
| East Kalibaru Fishermen's Cooperative in RW 01 | The East Kalibaru Fishermen's Cooperative is one of the main stakeholders in resource management at the site including facilitating support for fishermen and waste treatment. |
| Fish Auction (TPI) in RW 01 and RW 04 | The fish auction in RW 04 is planned to be moved and concentrated only in RW 01 along with the relocation of the fishing boat harbours. |
| Kalibaru Subdistrict Office in RW 02 | The Subdistrict Office has spaces that are routinely used by the public for various social, cultural, and religious activities. |
| Plaza Kalibaru in RW 04 and RW 06 | Plaza Kalibaru was built in 2022 as a recreational space with parks, sports fields, and a jogging track along the embankment. It used to be the mooring centre for fishing boats in West Kalibaru and dirtied with piles of waste. Now, residents actively use it for activities such as children's playgrounds, gymnastics, and food stalls hawking. A specific section is planned to be built as a place for entertainment that is child-friendly and can function as an educational facility. The area around the plaza received assistance from the Ministry of Social Affairs in 2022 and facilities have been built to convert salt water into fresh water. |
| Wisata Kalibaru (WiKa) in RW 03 | WiKA was built in 2022 in East Kalibaru as a recreational space with the same facilities as Plaza Kalibaru. In the past it was part of the nearby sand barn and ship splitting area. |
| Football field in RW 15 | Since 2007, the football field in RW 15 has become the main space for community sports activities. The Karang Taruna youth organization regularly holds competitions on site, including an annual futsal tournament. |
| Futsal field in RW 02 | A futsal field nearby the RW office which has become an alternative sports location. |
| The main traditional markets in Kalibaru Subdistrict include the Jalan Baru Market in RW 02 and RW 03, as well as the Mencos Market on the border of RW 05 and RW 06 |
The traditional market is often mentioned by informants as their daily destination and has existed since they were born. |
| Schools, among others: • MI Miftahul Hikmah (Islamic school) in RW 05; • Elementary, Middle, and High School Complex in RW 12; • Public Elementary in RW 02, 03, 07, 13, 14 and 15; • Private Elementary Pantai Indah Kalibaru; • Private Elementary Dewi Sartika; • Muhammadiyah Islamic Boarding School in RW 04; • Learning Center in RW 08. |
Schools are a prevalent daily destination for informants when dropping off and picking up children. Each RW also has a playgroup centre near their respective offices, except for RW 01, 03, 05, 06, 09, and 14. |
| Mosques and prayer rooms, including: • Al Hidayah Mosque in RW 04; • Baitus Syukur Mosque in RW 05; • Baitul Mukminin Mosque in RW 06; • Al Mubasirin Mosque in RW 07; • Darussalam Lama Mosque in RW 10; • Musala/Prayer room in RW 13; • Musala At Taubah in RW 15. |
Mosques and prayer rooms are daily destination for most informants, especially at nighttime, with multiple social and religious activities including Koran recitations, lectures, and mutual cooperation to clean RW public premises. |
| Temporary landfill in RW 08 and Waste Bank in RW 06 | The PKK women's organization is active in separating and recycling waste in RW 06 and RW 08. The landfill in RW 08 was renovated in 2021. Piles of waste can also be found in RW 15 and RW 04. The highest amount of waste comes from RW 07 as the RW with the largest population. Most of the fishery waste, including shells, comes from RW 01 and RW 13, which are intensive fishery activity areas. |
| Temporary port workers (TKBM) cooperative office in RW 08 | Nearly 600 Kalibaru youth are temporary port workers who are required to fill in attendance at the TKBM office before leaving with the group to the container terminal. Access to the terminal is closed for TKBM except by shuttle bus. Most of the TKBM are also members of Karang Taruna youth organization. |
| Under the toll road at RW 09 and RW 12 | The space under the toll road has been initiated by residents to become a public space. There is a ball field, pigeon racing community area, and a fishing area. Music and martial arts events are also often held. |
Table 6.
Description of tactical culture spaces in Kalibaru Subdistrict.
| Space | Description |
|---|---|
| Along the coastal embankment | Even though the fishing harbours has been centralized in RW 01, the fishing community still uses the spaces under the embankment as a place to store boats (for boat repair and preparation activities) so they don't pile up in the harbour area. The fishermen store materials such as bamboo and rope along the embankment. As a result of deliberations with the developers, several points under the embankment have been agreed to be built for ship repair and material storage. |
| Around the RW 01 retention pond | The concentration of various activities has made the area lively. Residents began to aspire to build recreational and even tourism facilities, as well as facilities to ensure safety at the site. There are also hawkers who sell their wares around the location. |
| Around the retention ponds in RW 03/RW 15 and RW 04/RW 06 (WiKa and Plaza Kalibaru area) | With the recent bustle of activity, many residents peddle on the streets around the location. In the month of Ramadan, residents hold a culinary bazaar. Vacant land in the RW 15 and RW 04 areas has begun to be discussed as a park or street market area. |
| Throughout the Bangleo River | Residents use the Bangleo River for daily activities such as recreation, peddling, and fishing. Notably, the river segment in Gang Macan/Macan Alley in RW 12 is one of the points of blockage and accumulation of garbage in the river. |
| Along Jalan Kalibaru Barat 1A street and Jalan Kalibaru Barat 14 street in RW 10 | Along the way, the alley is a place where many children play until nighttime, as well as many street vendors. The lack of public space in RW 09 and RW 10 areas due to its location in between industrial areas has made residents maximize the use of existing space. |
| Along Jalan Karang Hijau 2 street in RW 01 | Several alleyways in the Kalibaru Subdistrict are used to hold “almsgiving for the earth” events which are generally held in conjunction with the Independence Day (17 August) festivities. Residents bring prepared food from their homes, gather in alleys, spread carpets, and pray together. |
| Gang Hijau alley in RW 13 and Gang Semprotan alley in RW 02 | Several alleyways were initiated by the PKK women’s organization as locations for “green alleys” with herbal plants that are jointly managed by residents. |
Table 7.
Description of the cultural spaces of conflict in Kalibaru Subdistrict.
| Space | Description |
|---|---|
| Fish auction in RW 01 and RW 04 | The fish auction in RW 04 will be merged with the fish auction in RW 01 due to development. This has the potential to trigger conflict between the developer and the fishing community in East Kalibaru and West Kalibaru. |
| Retention pond in RW 01 | The retention pool area is dark at night because there is no lighting and is now prone to local gang brawls. |
| Around the border of the bay at RW 06, RW 08, and RW 12 | This area is still prone to inundation and flooding of up to 50 cm during heavy rains. |
| Stockpiling of materials and waste along the embankments of RW 01 and RW 13 | Green mussel waste is mostly found in RW 01 and RW 13, considering the large number of fishermen and their production activities there. Materials like bamboo and rope also cover the road. |
| Overspill of landfill trash around RW 08, RW 07, and RW 15 | Before the construction of Plaza Kalibaru, there were piles of trash around RW 08, RW 06, and RW 04. RW 07 has the highest population density in Kalibaru Subdistrict and the highest amount of waste. Piles of garbage occur in RW 15 due to the absence of landfills and the length of time for transportation (every 2 days). |
| Fire in RW 08 area | RW 08 is vulnerable to fires due to a port and wood storage centre nearby. A big fire happened in 2009 between RW 08 and RW 10 due to negligence of a polymer factory near the site. |
| Gang brawls in the RW 03 and RW 12 areas | RW 03 as one of the RWs with the highest population density, is prone to brawls on Jalan Baru street near the market and the Subdistrict office. RW 12 has the lowest level of participation in Karang Taruna youth organizations. |
| PT Pelindo's land development in the RW 10 area | Most of the residential land in RW 10 belongs to PT Pelindo company and is in preparation for demolition. Companies and developers try to establish good relations with residents through intensive CSR activities in the RW 08, RW 09, and RW 10 areas. |
| Shifts in fishermen's economic activities and environmental pollution along the embankment coast | All fishermen informants worry about their livelihoods and sea conditions with the NPCT2, NPCT3, and NPEA industrial development plans. Prior to 2016, it was known that the number of large vessels passing through fishing routes was still not many. Fishermen realize that most of the pollution in the sea comes from company factories and large ships. |
Table 8.
Description of specific cultural topics.
| Topic | Description |
|---|---|
| Sea ceremonies | The sea ceremony (pesta laut) is a fishermen tradition that is carried out at least once a year. In practice, West Kalibaru fishermen and East Kalibaru fishermen formed a committee for the preparation of the event together with the Cilincing fishermen group. The location of the sea ceremony is centred at the mouth of Kali Rawa Malang river, nearby the Cilincing fish auction. Although the sea ceremony is a tradition characteristic of fishermen, all informants are of the opinion that the aspect of the tradition belongs to the parents (previous fishermen's generation) and the current generation of fishermen just join in for the festivities. There are those who also argue that sea ceremonies should not be held if current conditions for fishermen are difficult (e.g., lack of funds or a pandemic situation). The sea ceremony is open to the public and has become a tourist spot for city dwellers who want to know more about fishing culture. |
| Almsgiving for the earth | Alms for the earth (sedekah bumi) is usually done in conjunction with the celebration of Independence Day on August 17th. Residents usually gather with their neighbours in one RW, cook food, and hold prayers together in the alleyways. |
| Local system of shipping and harbouring | Management of ships, organizing departures to go to sea, and the data collection system is managed by fishermen groups. Ship registration and sailing and anchoring permits are managed by the harbourmaster (syahbandar). The Harbourmaster and Port Authority Office (KSOP) issues a Small Pass card for fishermen as a document in the form of a certificate of ownership and nationality of the ship and can be used as collateral for business credit or insurance. |
| Ethnic-based community associations | Majority of informants are the second generation of parents who migrated to Jakarta from West Java (Indramayu) or South Sulawesi (Bugis-Bone-Makassar). Some of their parents married Betawi people and now identify themselves as Betawi-Indramayu or Betawi-Sulawesi. There are ethnic-based community organizations or harmony such as the Bone Community Family Harmony (KKMB), the South Sulawesi Family Association (PKSS), the Betawi Rempug Forum (FBR), and ethnic-based arisan gathering groups or arts activities such as Betawi lenong and martial arts centres. All informants know the existence of the associations but are not actively involved in it. |
| Religious social activities | Majority of informants are active in social-religious activities at the mosque or prayer room near their residence. The subdistrict has a system for residents working together to manage the cleanliness of mosques. Every Friday, the subdistrict staff organizes cleaning activities at different RW mosques. There are 57 religious assemblies in the subdistrict with regular Koran recitation activities. The majority of large or subdistrict level activities are held at the subdistrict office. |
| Social activities supported by companies/foundations/outside agencies | Community groups often submit proposals for financial support to various large companies with offices in Kalibaru Subdistrict. These companies channel significant CSR due to the environmental impact of their business activities. Several social foundations are also active in assisting the social activities of Kalibaru residents, including the HOPE Indonesia Foundation, the Mitayani Foundation, and the Polar Social House. Other activities are supported by various political parties and government agencies. Educational institutions have also carried out various assistance or community service activities, such as the Jakarta Health Polytechnic, State Islamic University, and the University of Indonesia. |
| System of temporary port workers | Since 2017, the Kalibaru Subdistrict has around 600 youth working as Temporary Port Workers (TKBM) at container terminals. |
| Activities of the PKK women’s organization | As a social organization that aims to empower women, the Family Welfare Empowerment Group (PKK) in Kalibaru Subdistrict is very active in social activities in its area. The PKK is divided into several working groups: 1. Working Group 1 fosters religious activities, mutual cooperation, data collection, and counselling, 2. Working Group 2 fosters economic activities such as the Family Income Increase and Business (UP2K) program, cooperatives, and educational activities such as the establishment of playgroups in every RW, 3. Working Group 3 fosters food security program activities such as selling used cooking oil and channelling the proceeds for alms, 4. Working Group 4 fosters health and environmental sustainability activities such as Hatinya PKK (greening areas with food and medicinal plants) and programs with health centres such as reducing stunting rates. There are 26 Toddler health centres and 14 Elderly and Integrated health centres in the Subdistrict. The various PKK programs above have won awards and appreciation from the North Jakarta City government. |
| Activities of the Karang Taruna youth organization | The Karang Taruna youth organization in Kalibaru Subdistrict is also very active in holding social activities in the area. In the field of sports, Karang Taruna has an annual soccer tournament agenda which has been managed since 2005 and is held on the RW 15 football field. In the creative sector, Karang Taruna also has regular programs such as the Creative Sea Children's Group (KOPLAK) with handicraft exhibitions and magazines from young journalists. This group is also actively developing packaging products for MSMEs such as green mussel crackers. |
Disclaimer/Publisher’s Note: The statements, opinions and data contained in all publications are solely those of the individual author(s) and contributor(s) and not of MDPI and/or the editor(s). MDPI and/or the editor(s) disclaim responsibility for any injury to people or property resulting from any ideas, methods, instructions or products referred to in the content. |
© 2024 by the authors. Licensee MDPI, Basel, Switzerland. This article is an open access article distributed under the terms and conditions of the Creative Commons Attribution (CC BY) license (https://creativecommons.org/licenses/by/4.0/).
Copyright: This open access article is published under a Creative Commons CC BY 4.0 license, which permit the free download, distribution, and reuse, provided that the author and preprint are cited in any reuse.


