Submitted:
02 June 2023
Posted:
14 June 2023
You are already at the latest version
Abstract
A self-protective metal/ liquid microcapsule composite plating coating has been prepared in our previous research. The release speed of liquid core material from microcapsules is crucial for the coating surface properties. The aim of this paper is to study the permeability rule of liquid microcapsules within composite coatings. According to permeability experimental data’s linear characteristics, multiple linear regression is firstly used to set up permeability model of liquid microcapsules. The results show that a reliable mathematical model about membrane porosity, viscosity of core material and membrane thickness is established under ambient temperature and moisture. Meanwhile, the predictive capacity and reliability of this model are analyzed carefully.
Keywords:
Liquid microcapsule
; Multiple linear regression
; Permeability experiments
; Permeability model
; Predictive capacity
1. Introduction
Nowadays, composite materials containing microcapsules have attracted more and more attention due to their magical self-repairing properties [1,2,3,4,5,6]. In our group, the functional Cu-based and Ni-based composite coatings containing liquid microcapsules were prepared by electrolytic co-deposition [7,8,9,10,11]. One of the promising advantages of this composite is that the encapsulated core material can be released gradually and modify the properties of coating surface. The process of core material arriving coating surface is divided into two steps, as seen in Figure 1: (i) the core material of microcapsules diffuse into the matrix through the shell material; (ii) the released core material from microcapsules diffuses to the coating surface. The diffusion speeds of core material in shell and matrix are crucial for the coating surface properties. If the release rule is mastered, the control release of microcapsule will be further implemented. Unfortunately, there is not a method to accurately predict release speed of microcapsule. Herein, the first step was mainly discussed in this research.
As is known, the release rates of microcapsules are closely related to the porosity of shells, viscosity of core material and shell thickness and so on. In our previous research, hydrophobic agent, organosilicon resin and lubricant were usually used as the liquid core materials and polyvinyl alcohol (PVA), gelatin or methyl cellulose (MC) as shell materials of microcapsule [12]. So in this paper, the shell and core materials above are considered as study objects, and a series of permeability experiments were carried out under ambient temperature and moisture. We attempt to seek a statistics rule about permeability rate without considering the change of environmental factors.
Multiple linear regression (MLR) method is an effective tool for quick predictions [13,14]. Here, it is firstly introduced to constitute a suitable permeability model based on the permeability data obtained in experiments. It is possible that the model we obtained is not perfect and needs improvement on a certain aspect because this is a new attempt. However, it provides a new method to analyze experimental data and is favorable to the establishment of mathematical models.
2. Materials and Experiments
2.1. Preparation of Shell Membranes of Microcapsule
2 wt. % methyl cellulose (MC), polyvinyl alcohol (PVA) and gelatin aqueous solutions were prepared respectively, which are purchased from YiLi fine chemicals Co. Ltd of Beijing. After deformed, the calculated solutions were poured on the plastic mold with a certain area and dried at room temperature for 24 hours in vacuum drying oven. Hence, the films with 5 μm, 15 μm and 30 μm thickness were obtained.
2.2. Characterization of Membranes
The surface photographs of shell membranes were characterized by scanning electron microscopy (HITACHI S-530). And the cross-section fractal dimensions of membranes were used to characterize their porosity.
2.3. Permeability of Shell Membranes
The core materials permeability of films was measured by weighing. BH-102 hydrophobic agent and L-MH46 lubricating oil were adopted as the core materials of microcapsules (permeability media) and their measured viscosities were 15 m2/s and 32 m2/s respectively. The orifices (Φ12 mm) of the cylindrical tube were closed by different shell membranes, in which were filled with 3 ml core materials. These tubes were placed downward in air at 25 °C and weighed every 2 hours. The residual core material around orifice was cleaned using hexane solution before weighing. Then the mass loss of the total tube was calculated.
2.4. Analysis Method
The permeability data were analyzed by multiple linear regression method with the software of Statistical Package for the Social Science (SPSS).
3. Experiment Results
3.1. Cross-Section Images and Fractal Dimensions Df of Membranes
The SEM graphs of the cross section of the shell membranes are shown in Figure 2. In membranes SEM observations, the cross sectional samples have different porosity, which is characterized by the cross-section fractal dimensions Df. In the study, the area dimension Df can be determined by the box-counting method [15,16]. This method is based on the membrane image analysis of a sufficiently large section. SEM images of films are JEPG format coded with true color and then are transferred to gray-scale formation (256 grayscale levels) with Adobe Photo 7.0 software. Before analyzing an image, a threshold has to be determined in order to distinguish pores from the background, obtaining a binary image. And then the cross-section fractal dimension Df is obtained by Matlab program according to the box-counting method. Simultaneously, the pore areas of films are also calculated. Table 1 displays the fractal dimensions Df and pore areas of these three membranes.
3.2. Permeability Analysis of Shell Membranes
Figure 3 depicts the permeability properties of three shell membranes under different conditions. As seen, the mass loss all enhances linearly with the increasing time. The slope of fitting line represents the permeation rate of film, which is almost a fixed value. These values of permeation rates are listed in Table 2.
4. Multiple Linear Regression Theory
Multiple linear regression analysis is an effective tool to confirm the relationship of dependent variable and several independent variables. The attained expression is called regression equation or mathematical model, which can predict the value of dependent variable. MLR method requires a certain linear relationship between dependent variable and explanatory variables.
Usually, the MLR model is typically expressed as [17]
where represents the observed value of dependent variable, and denote the explanatory variables and the regression coefficients for the constant and the variables, respectively. is the number of explanatory variables.
5. Discussion
In this section, we try to present the permeability mathematical model according to the experimental data in Table 2. The three measured explanatory variables used in this work include membrane porosity (fractal dimension Df), viscosity of core material (VCM) and membrane thickness (MT). To satisfy the requirement of the MLR method, the variables should be properly transformed when necessary. After transformations, three variables are finally identified to constitute the models: Df, 1/VCM, 1/ (sqrt (MT)).
5.1. Model Selection and Assessment
Three models are obtained after MRL and the statistic results of the models for the experimental data are listed in Table 3. The correlation coefficient R manifests the serial correlations between dependent variable and explanatory variables. As observed, the significant serial correlation is detected for the models based on the whole data set (N =18). Comparing these three models, the correlation coefficient R3 = 0.920 in model C shows the optimal serial correlation. Moreover, Durbin-Watson value (DW = 2.180) is a statistic to test the serial correlation with a first-order autoregression. The DW value is close to 2, which illustrates the linear independence among the explanatory variables. Consequently, Df, 1/VCM and 1/ (sqrt (MT)) in this study are linear independent.
Additional, the anova analysis results of models after MLR are also given in Table 3. It can be seen that the F values are: 38.184 (Sig. (P) = 0.000﹤0.05) for model A, 28.951(P = 0.000﹤0.05) for model B and 25.879 (P = 0.000﹤0.05) for model C. All the three models show the significant linear relationship between dependent variable and independent variables. Based on the discussion above, it can be considered that the model C is more suitable to describe the relationship of dependent variable and independent variables. It is also concluded from standardized coefficients that the influence of 1/ (sqrt (MT)) on the dependent variable is most significant. Hence, the optimal permeability mathematical model is obtained as follows
To validate the rationality of the model we selected, three models are investigated here. The actually measured Y and the predictions made by model A, B and C are shown in Figure 4. There exists a certain difference among the predictions of three models. Especially, the predictions made by model C are better fit the actually measured values. This implies that the model C appears to have predicted the permeation rate Y more accurately than model A and B, and the results are agreement with the model analysis above.
A further model evaluation based on a set of indices is implemented, but only part of the results are presented in Table 4 for brevity. The second block of Table 4 represents the goodness of fit of the three models to their respective observations. and are the average of the observed and predicted values, respectively. SP denotes the standard errors of the predicted values. MAE (mean absolute error) and RMSE (root mean squared error) are respectively defined as [18]
where and () are predictions and observations, respectively. The results indicate that model C fits the existing data better than model A and B with a higher R2 and lower standard error SP, which might be attributed to the slight change of the actual permeation rate data. On the other hand, model C appears to have a more satisfactory predictive capacity indicated by the closeness of to , the lower levels of MAE, RMSE. These results are in accord with that of in Figure 4. Therefore, it is reasonable to deduce that model C (Eq. (2)) is more suitable to predict the permeation rate of shell membranes of microcapsules under ambient temperature and moisture.
5.2. Normal Distribution Verification
In the course of linear regression, we hypothesize the residual follows normal distribution. Figure 5 depicts the normal P-P plot of regression standardized residual. As seen, all the scattered points show linear relationship, which illustrates dependent variable indeed coming from normal population.
5.3. The Permeability Model Checkout
To validate the good predictive capacity of the model C, a new verification test was carried out at ambient temperature and moisture. The MC membrane with 21 μm thickness and organosilicon resin is adopted as the experimental film and permeability media, respectively. The measured viscosity of organosilicon resin under room temperature is about 36 m2/s. The true permeability curve and fitted line of MC membrane-organosilicon resin system are shown in Figure 6. As observed, the permeation quantity enhances linearly with the increasing time. The fitted line depicts the high correlation coefficient of 0.997 and its slope about 0.559 is calculated. This value is the real permeation rate under this system.
Meanwhile, the predictive permeation rate of 0.566 is also calculated by Eq. (2). Comparing the true and predictive values, it can be found that the error is about 2.06 %. This result illuminates the well predictive capability and the reliability of model C.
6. Conclusion
For studying the permeability rule of liquid microcapsules within composite plating coatings, a number of permeability experimental data were obtained. According to these data, a fast and effective method, multiple linear regression is firstly used to constitute permeability model of liquid microcapsules used for electrolytic co-deposition. Consequently, a reliable mathematical model related to the membrane porosity, viscosity of core material and membrane thickness is established under ambient temperature and moisture. Meanwhile, the good predictive capacity of this model is exhibited.
Further study will focus on the permeability process of released core material through the metal coatings. It would be also interesting to see how the algorithms, work with the coating thickness and structure data produced with another complex mathematical model. It will be beneficial to the implementation of controlled release.
References
- Yanling Wang, Zhaozhu Zhang, Fanjie Chu, et al. Designing polydopamine-capped [BMIm]PF6 /NaL microcapsule optimize the wear-resistance of polymer composite liner, Tribology International, 179 (2023).
- Muhammad Nisar, Franciele L.Bernard, Evandro Duarte, et al. New polysulfone microcapsules containing metal oxides and ([BMIM][NTf2]) ionic liquid for CO2 capture, Journal of Environmental Chemical Engineering 9 (2021). [CrossRef]
- Choi, Yun-Wang, Oh, Sung-Rok, Kim, Cheol-Gyu, Lim, Hak-Sang. The Experimental Study on Preparation Characteristics of Self-healing Microcapsules for Mixing Cement Composites Utilizing Liquid Inorganic Materials, Journal of the Korean Recycled Construction Resources Institute 6 (2018) 236-244.
- K. Hong, S. Park, Preparation of poly(-lactide) microcapsules for fragrant fiber and their characteristics, Polymer. 41 (2000) 4567-4572. [CrossRef]
- Yong Wu, Tianli Han, Xiaofei Huang, Xirong Lin, Yunfei Hu, Zhonghua Chen, Jinyun Liu. A Ga-Sn liquid alloy-encapsulated self-healing microcapsule as high-performance Li-ion battery anode, Journal of Electroanalytical Chemistry 922 (2022). [CrossRef]
- Masayuki I, Isao S, Kunihiro W. Surf. Technol., 2003, 3: 230.
- X.Q. Xu, L.Q. Zhu, W.P. Li, H.C. Liu. A variable hydrophobic surface improves corrosion resistance of electroplating copper coating, Applied surface science 257(2011) 5524-5528. [CrossRef]
- X.Q. Xu, Guo Y.H. Guo, W.P. Li, L.Q. Zhu. Electrochemical behavior of different shelled microcapsule composite copper coatings, International Journal of Minerals, Metallurgy and Materials 18(2011) 377-381. [CrossRef]
- X.Q. Xu, H.C. Liu, W.P. Li, L.Q. Zhu, A novel corrosion self-protective copper/liquid microcapsule composite coating, Mater. Lett. 65(2011) 698-701. [CrossRef]
- X.Q. Xu, L.Q. Zhu, W.P. Li, H.C. Liu. Microstructure and deposition mechanism of electrodeposited Cu/liquid microcapsule composite, Transactions of nonferrous metals society of China 21(2011) 2210-2215. [CrossRef]
- T.L. Zheng, L.Q. Zhu, W. Zhang, Corrosion resistance performance of liquid-containing microcapsule composite nickel and copper coating, Acta. Aeronautica et Astronautica Sci. 27 (2006) 147-151. (In Chinese).
- L.Q. Zhu, in: S. K. Ghosh (Ed.), Functional coatings by polymer microencapsulation, WILEY-VCH, Germany, 2006, Ch.9.
- Z.F. Ge, WE. Frick, Some statistical issues related to multiple linear regression modeling of beach bacteria concentrations, Environmental Research 103 (2007) 358-364. [CrossRef]
- J.F. Tomera, C. Harakal, Multiple linear regression analysis of blood pressure, hypertrophy, calcium and cadmium in hypertensive and nonhypertensive states, Food and Chemical Toxicology 35 (1997) 713-718. [CrossRef]
- B. Yu, P. Cheng, A fractal permeability model for bi-dispersed porous media, Int. J. Heat Mass Transfer. 45 (2002) 2983-2993. [CrossRef]
- R. Pitchumani, B. Ramakrishnan, A fractal geometry model for evaluating permeabilities of porous performs used in liquid composite molding, Int. J. Heat Mass Transfer. 42 (1999) 2219-2232.
- N.R. Draper, H. Smith, Applied regression analysis, second ed., Wiley, New York, 1980.
- C.J. Willmott, Some comments on the evaluation of model performance, B. Am. Meteorol. Soc. 63 (1982) 1309-1313.
Figure 1.
The diffusion process of microcapsule in plating coating.
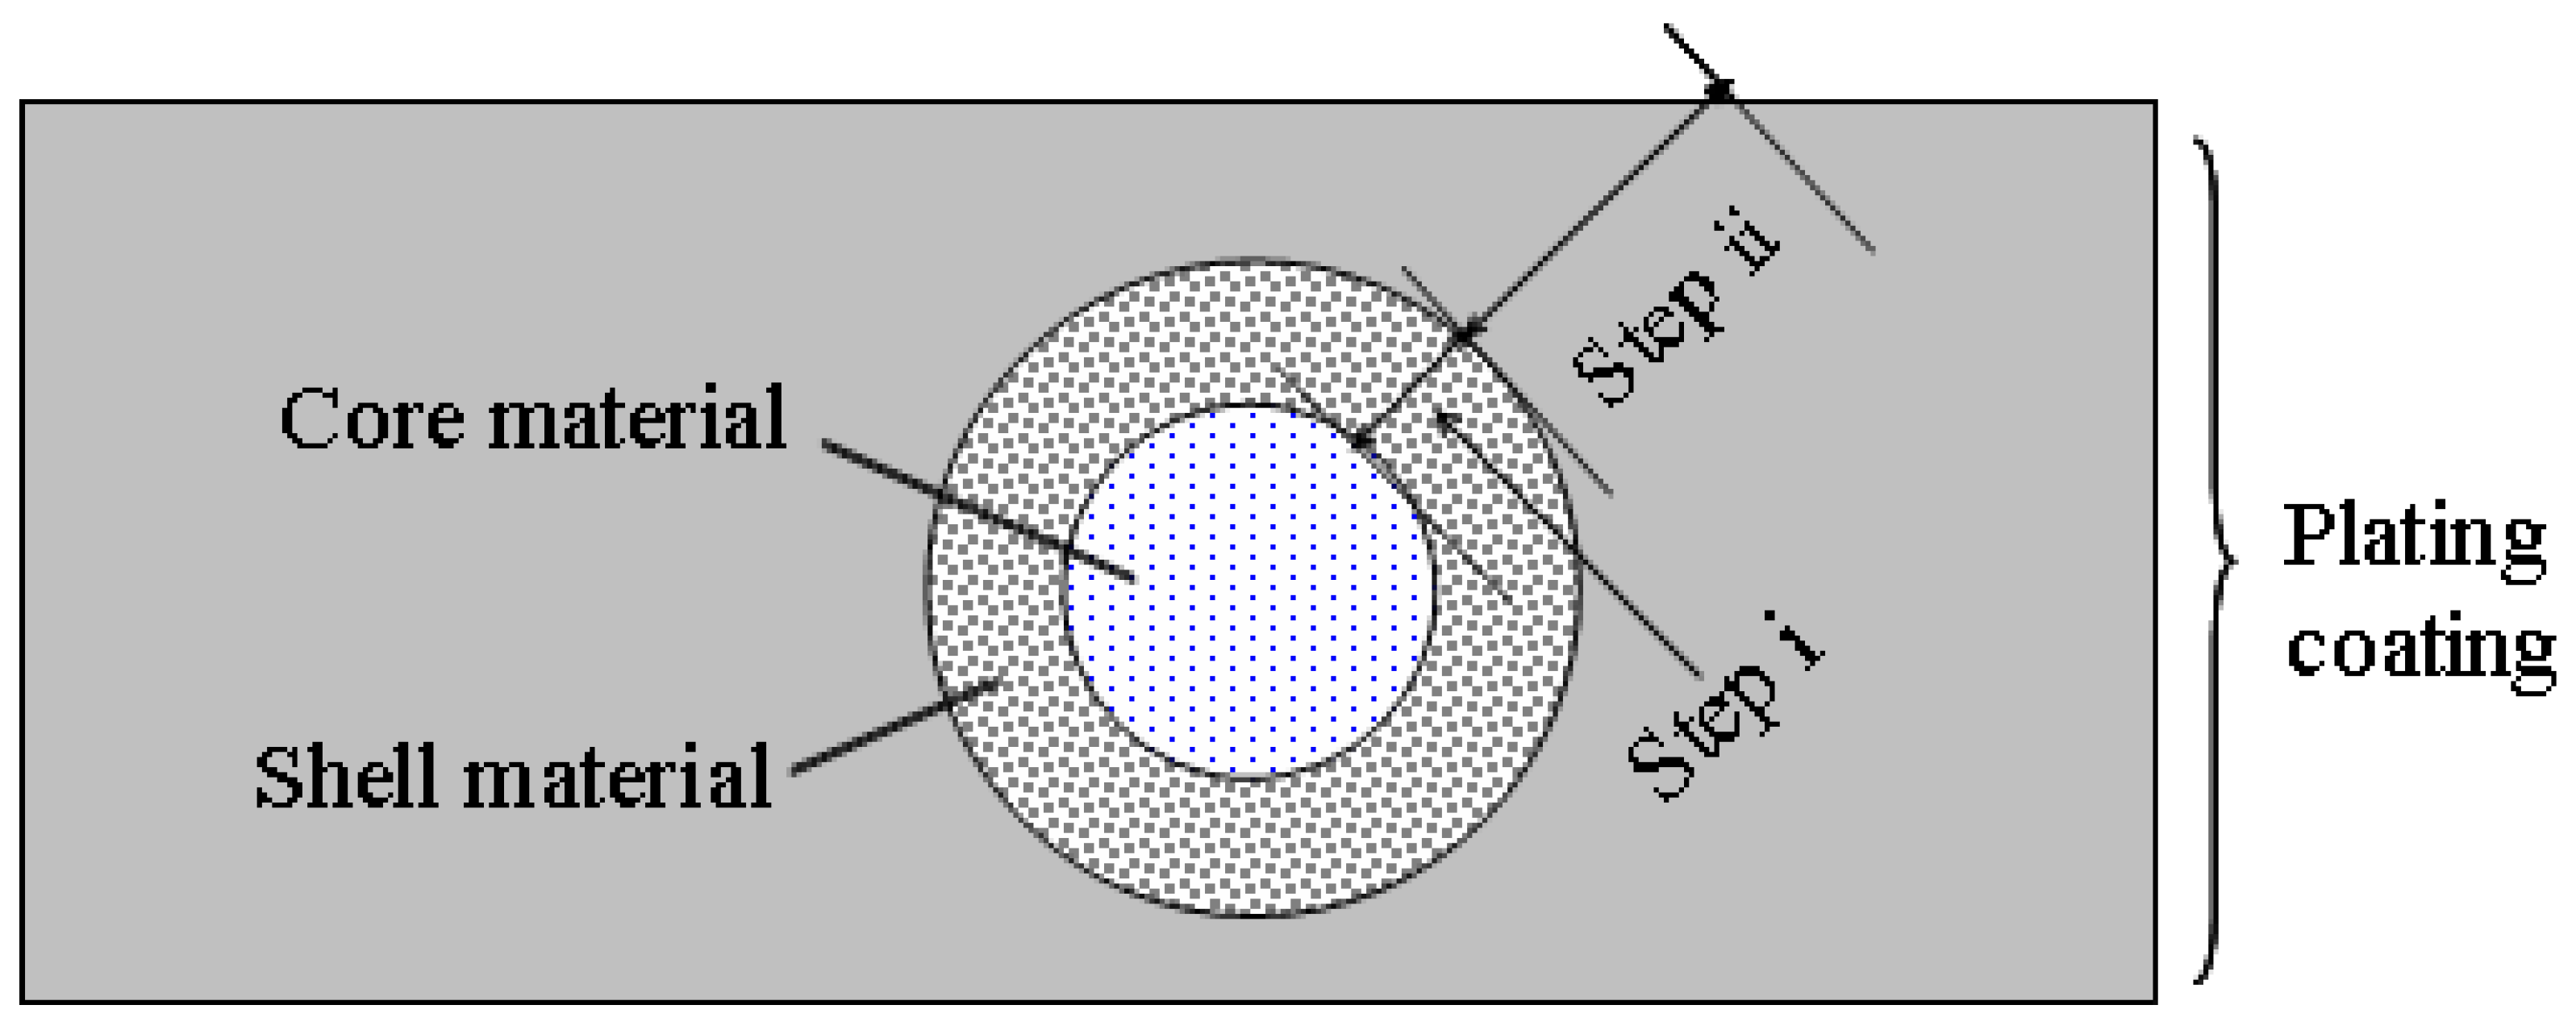
Figure 2.
SEM images of (a) PVA membrane; (b) Gelatin membrane; and (c) MC membrane.
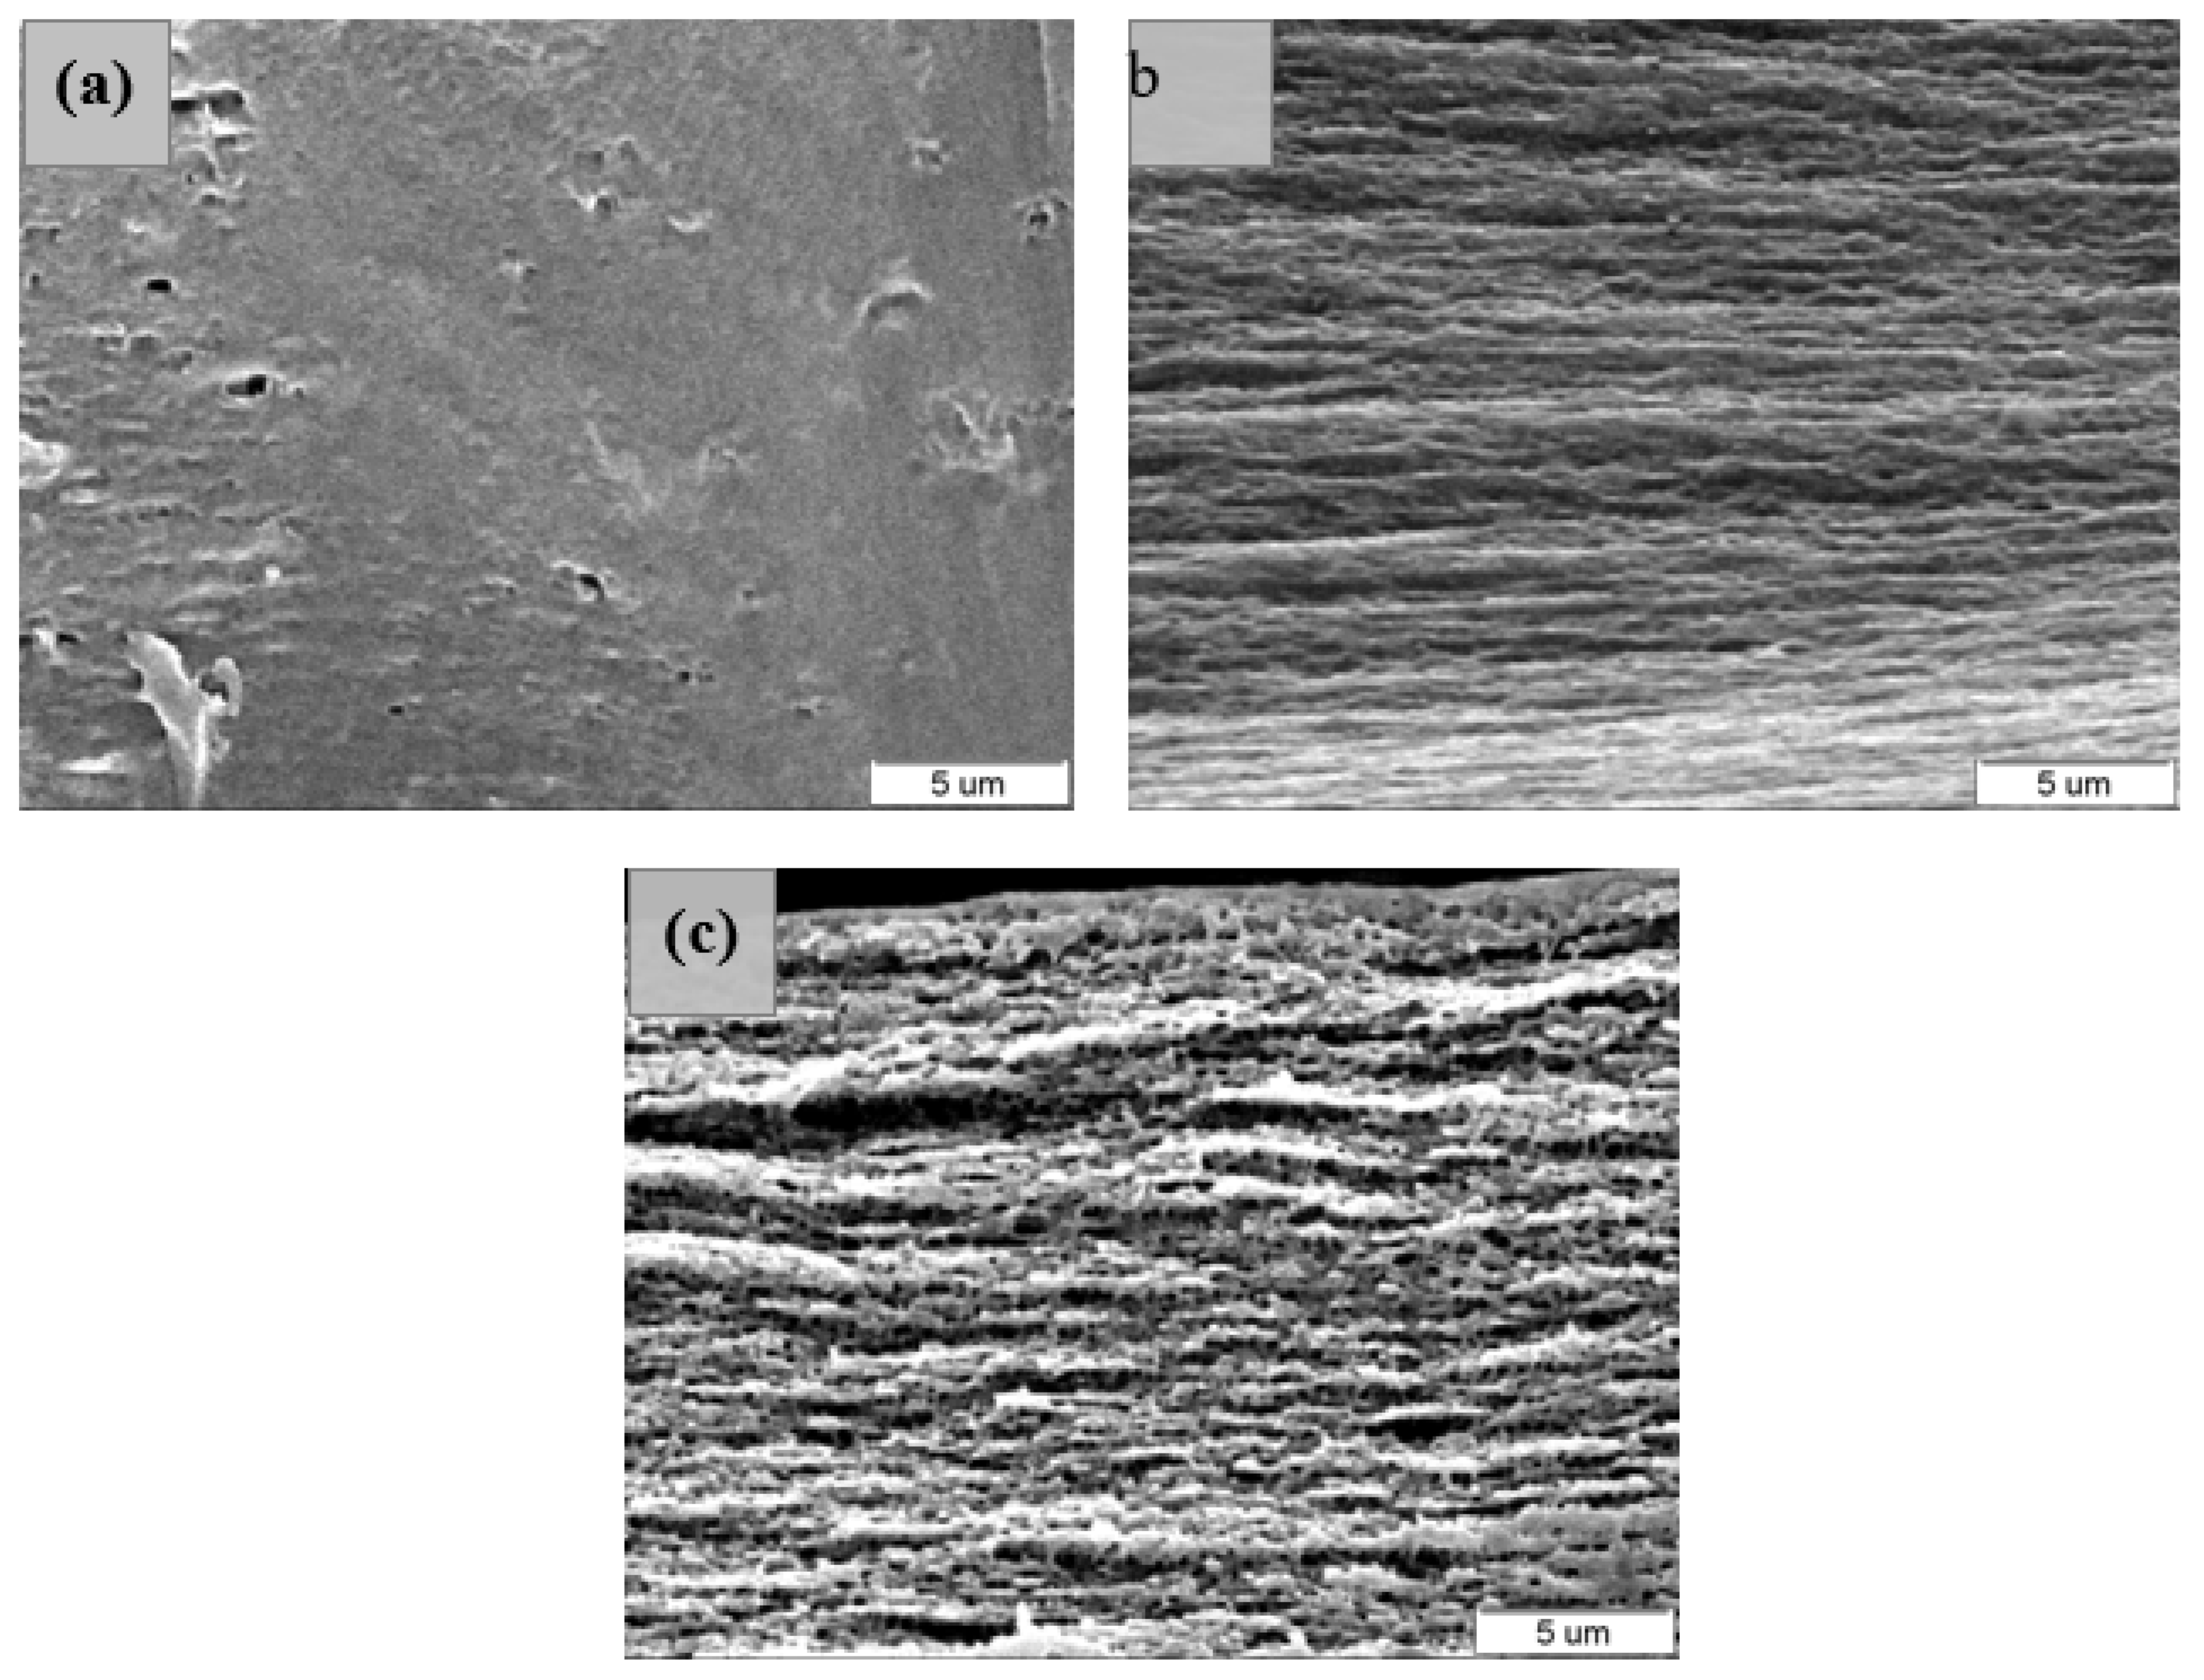
Figure 3.
Permeability curves of different thickness membranes under different systems. (a) MC film- Hydrophobic agent system; (b) MC film - Lubricating oil system; (c) Gelatin film- Hydrophobic agent system; (d) Gelatin film- Lubricating oil system; (e) PVA film- Hydrophobic agent system; (f) PVA film- Lubricating oil system.
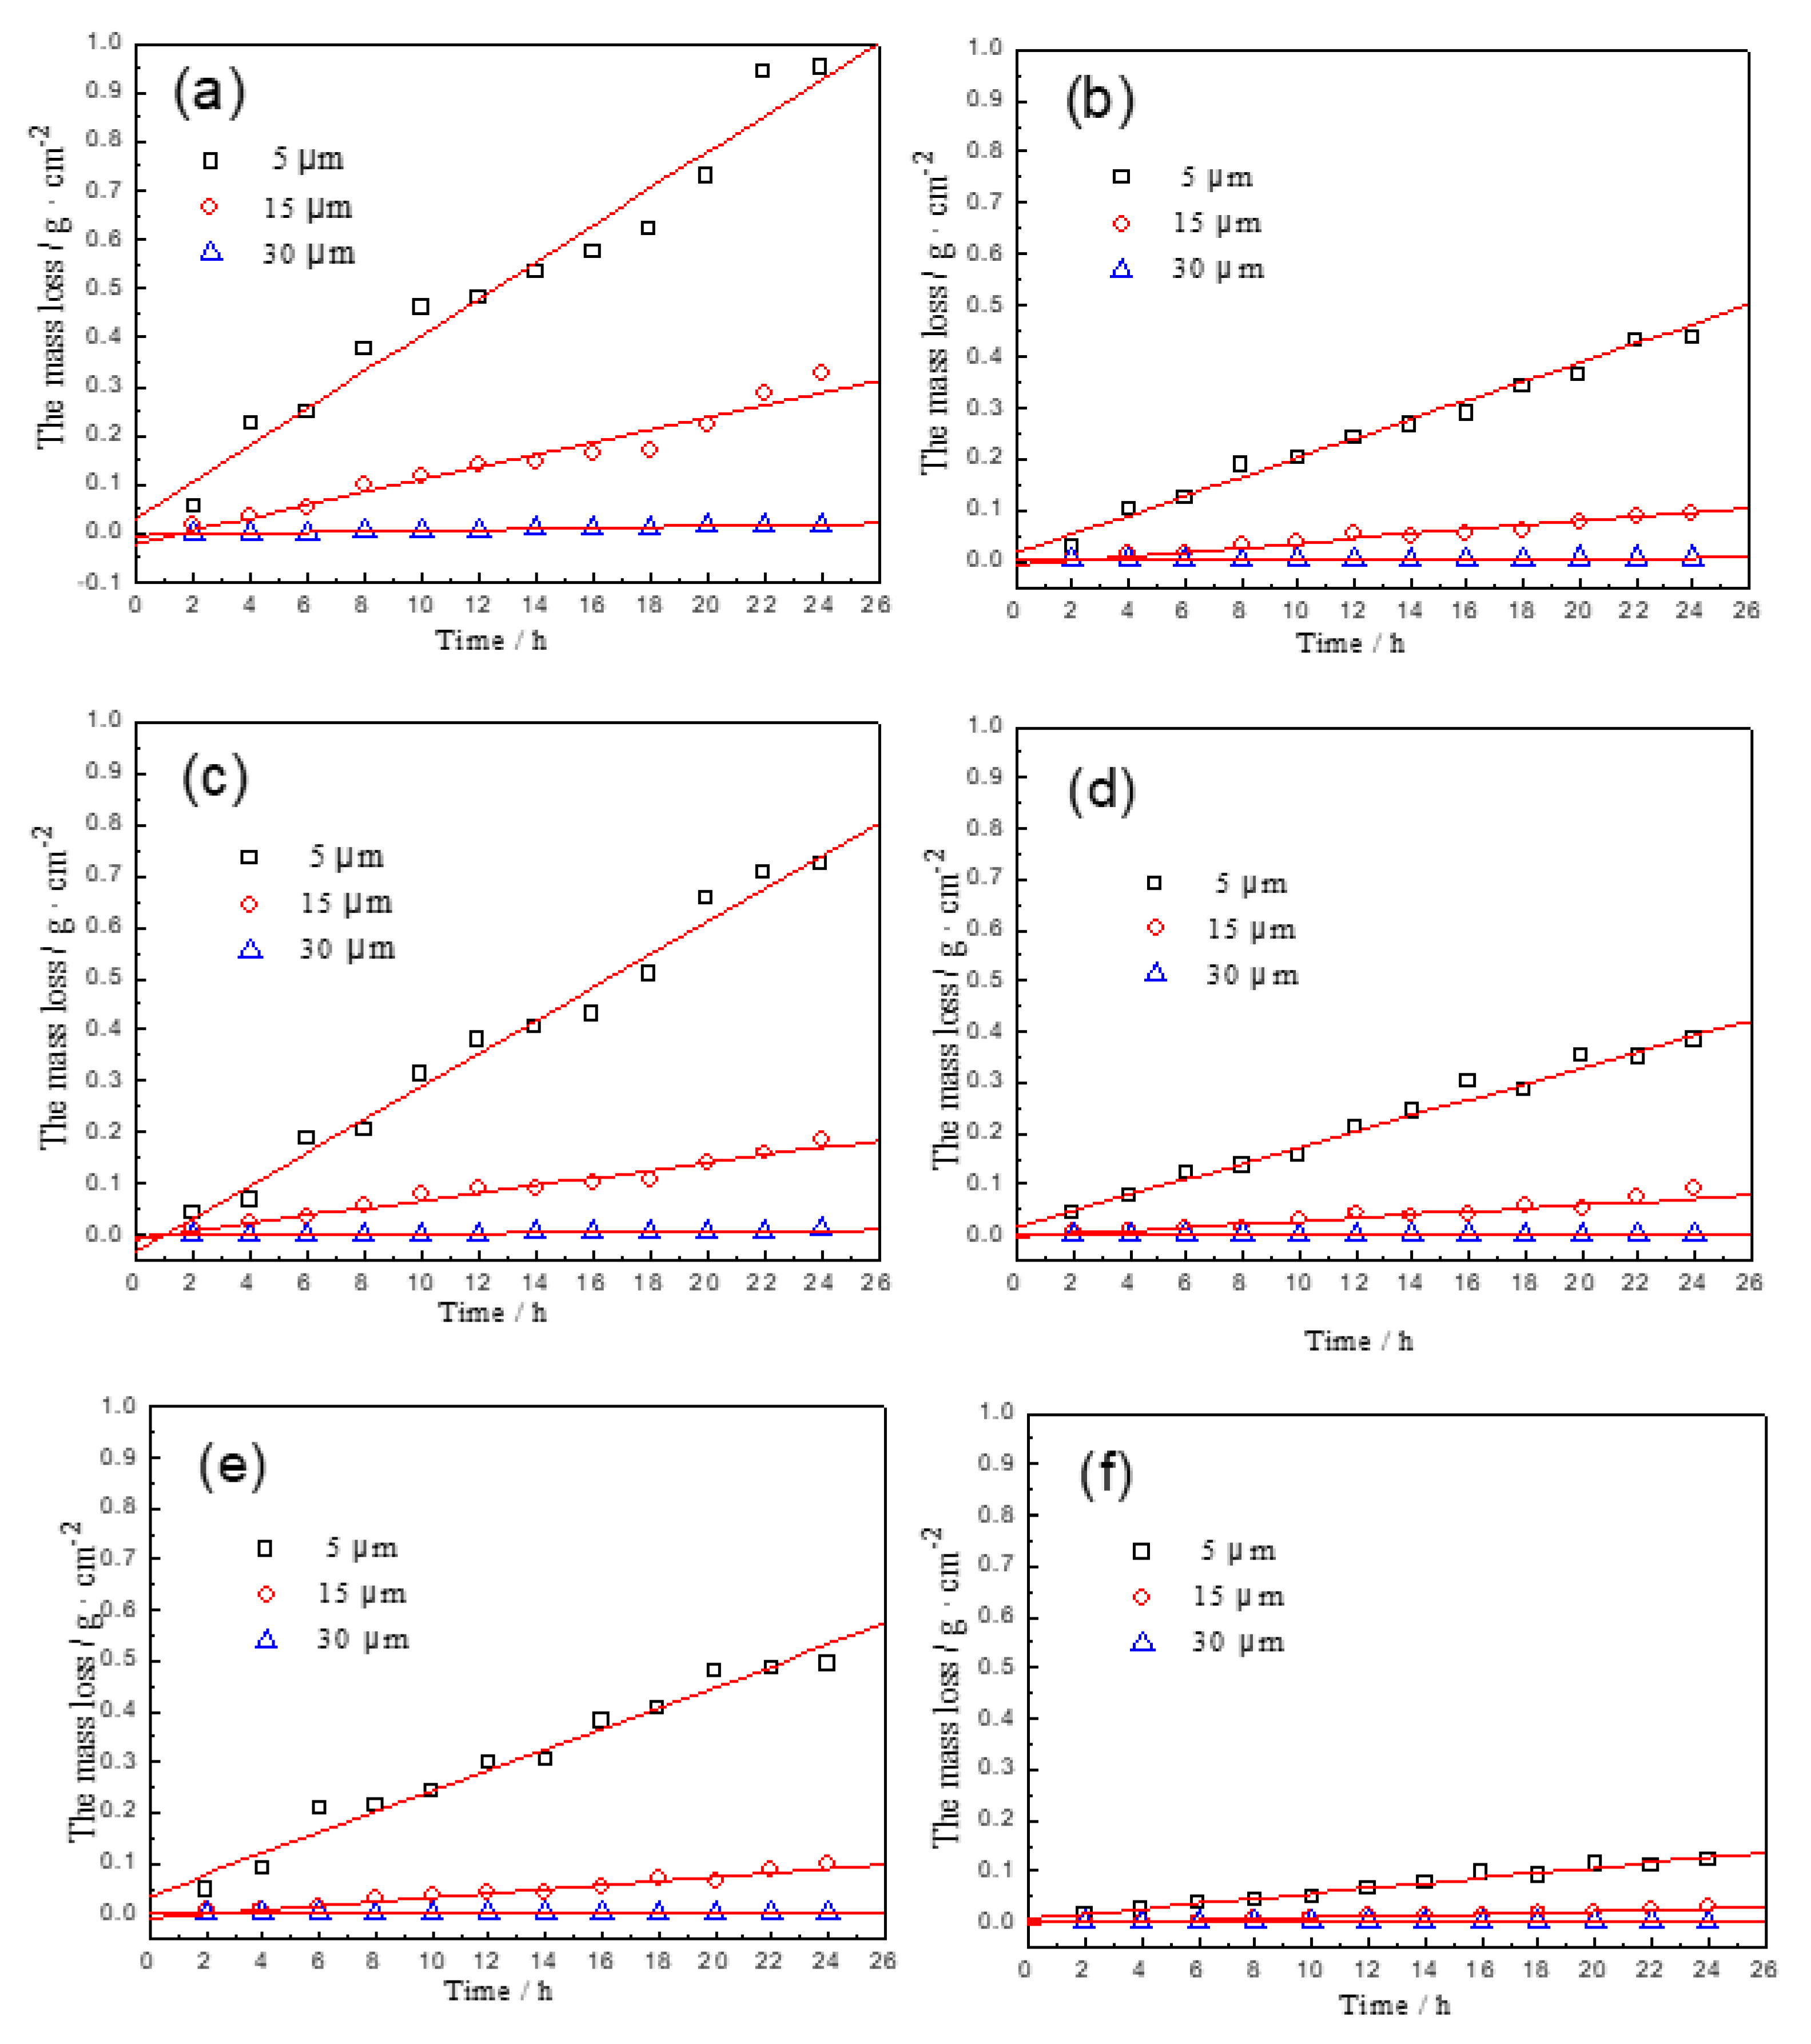
Figure 4.
Comparison of the predictive capacity of model A, model B and model C. bar: measured Y on the whole N = 18; open circle: predictions made by model A; filled circle: predictions made by model B; open triangle: predictions made by model C.
Figure 4.
Comparison of the predictive capacity of model A, model B and model C. bar: measured Y on the whole N = 18; open circle: predictions made by model A; filled circle: predictions made by model B; open triangle: predictions made by model C.
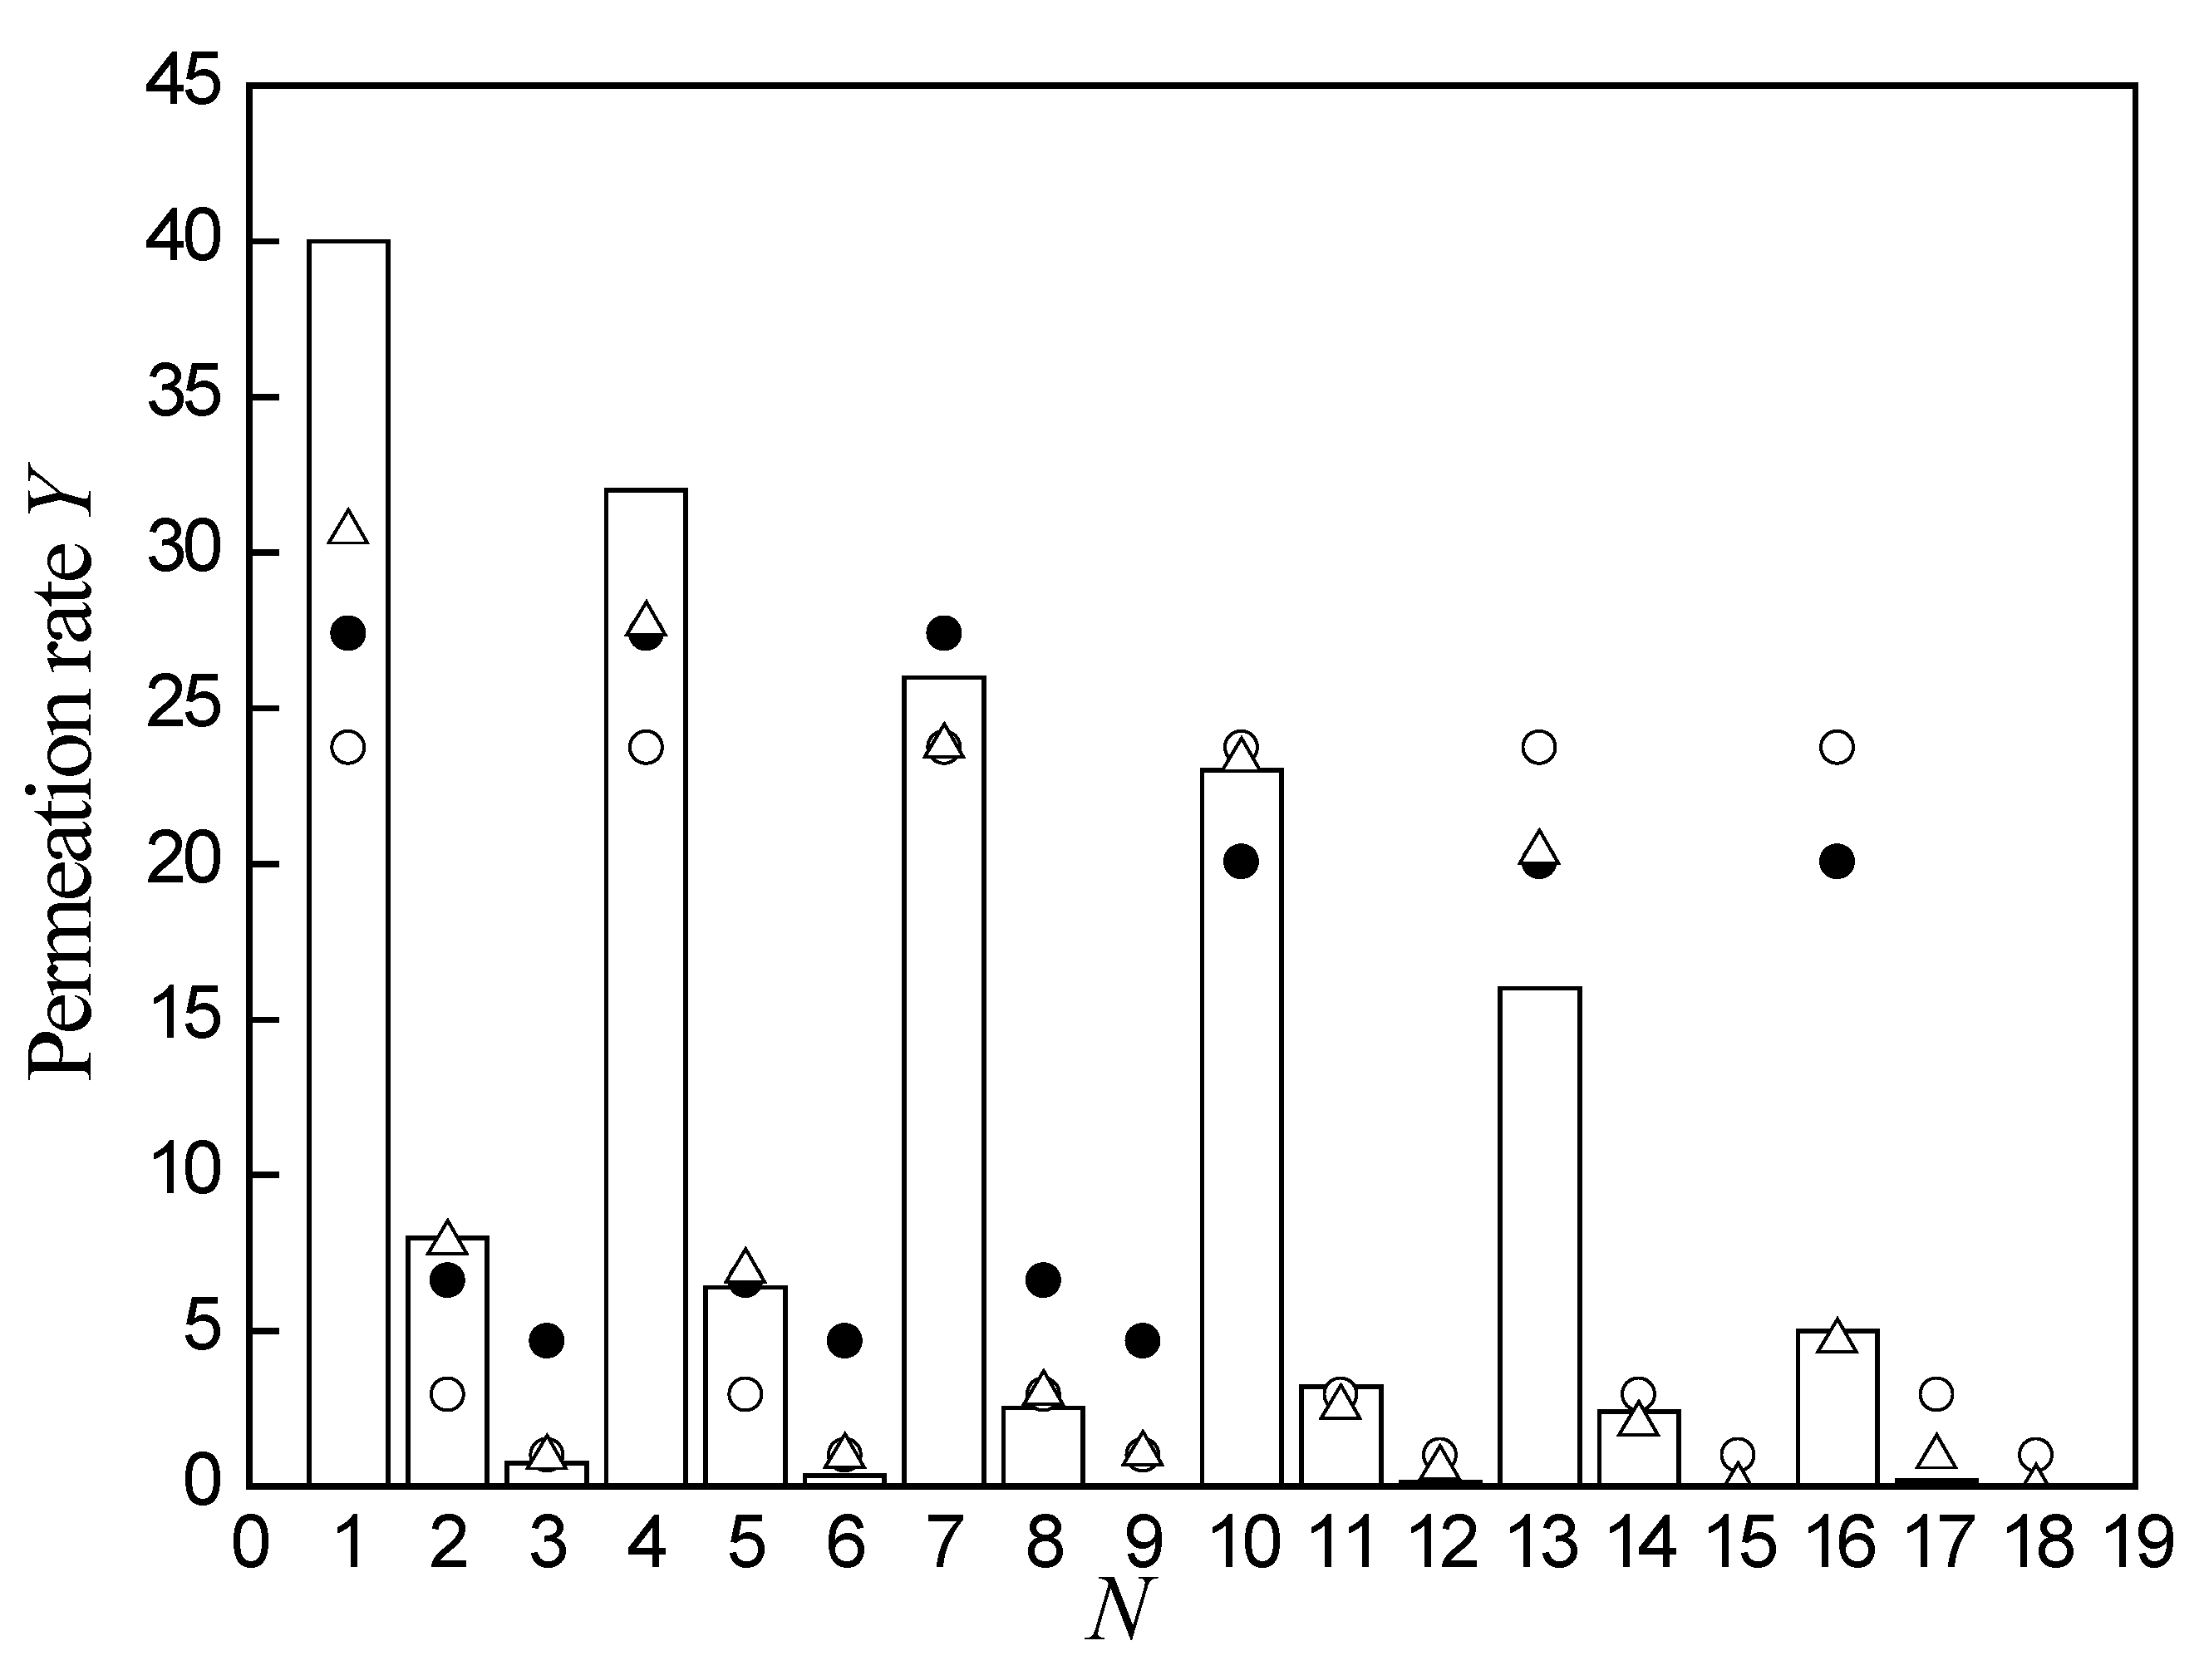
Figure 5.
The normal P-P plot of regression standardized residual.
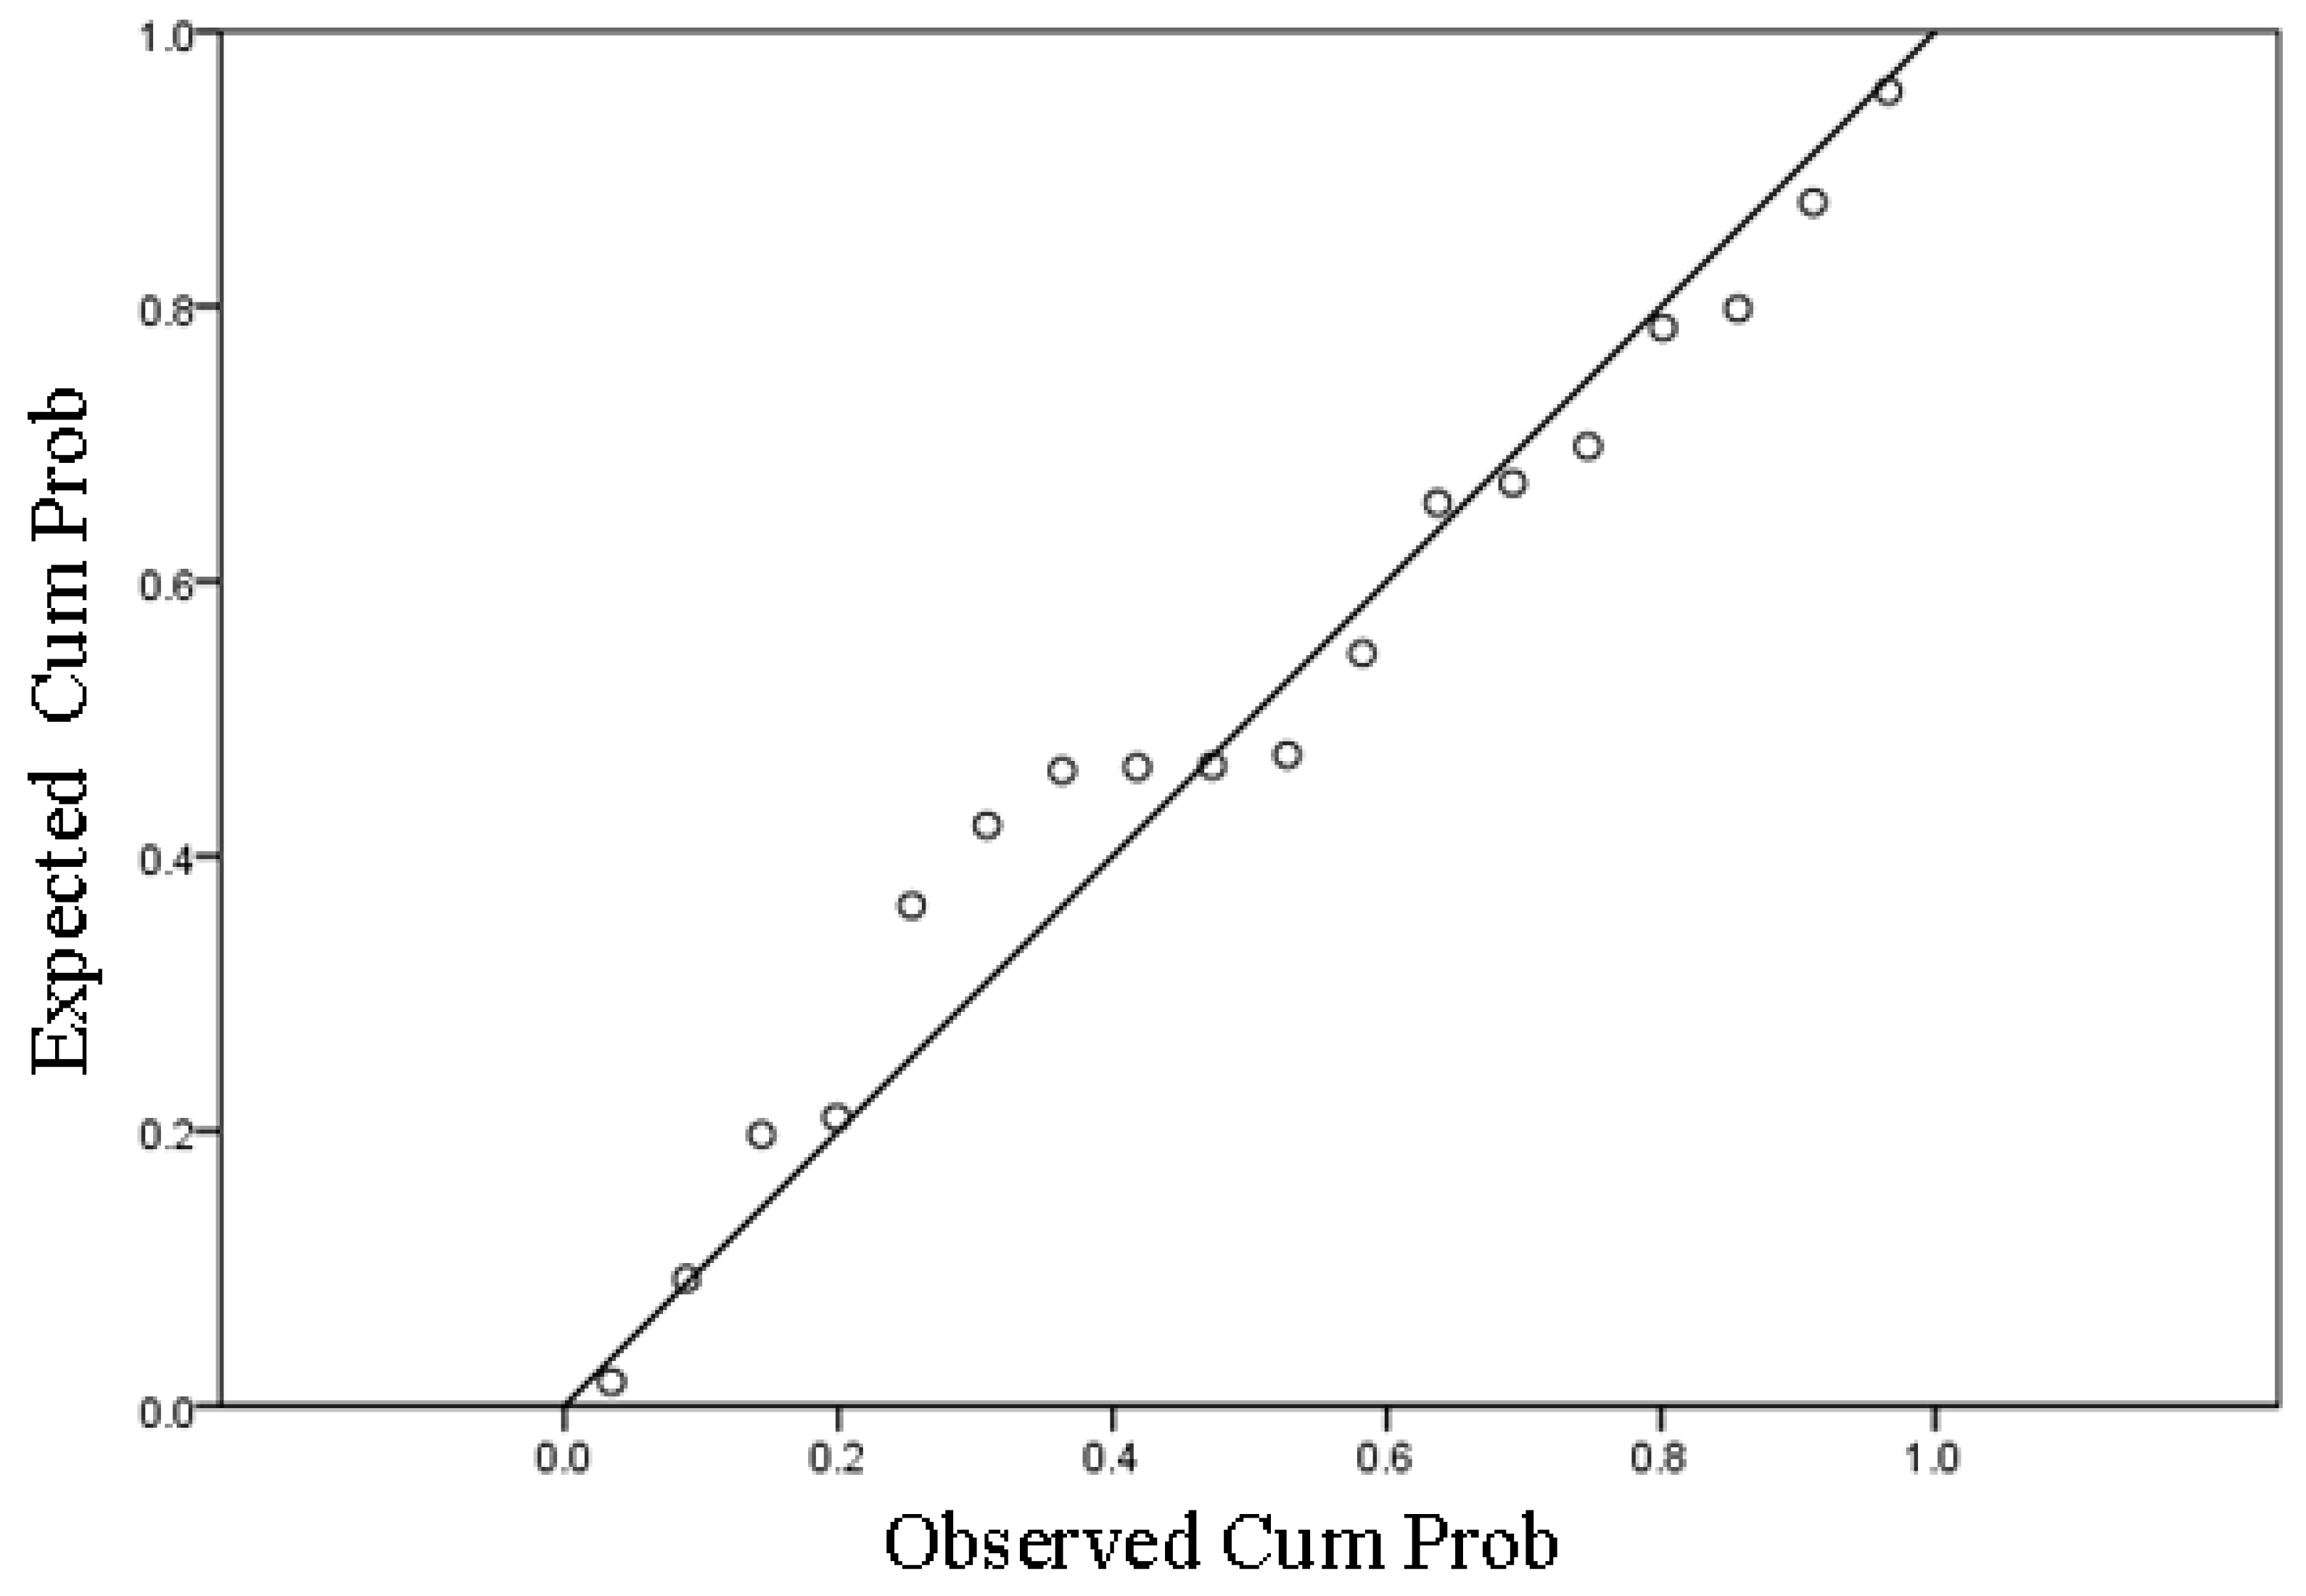
Figure 6.
Permeability curve of MC membranes-organosilicon resin system (MT=21 μm).
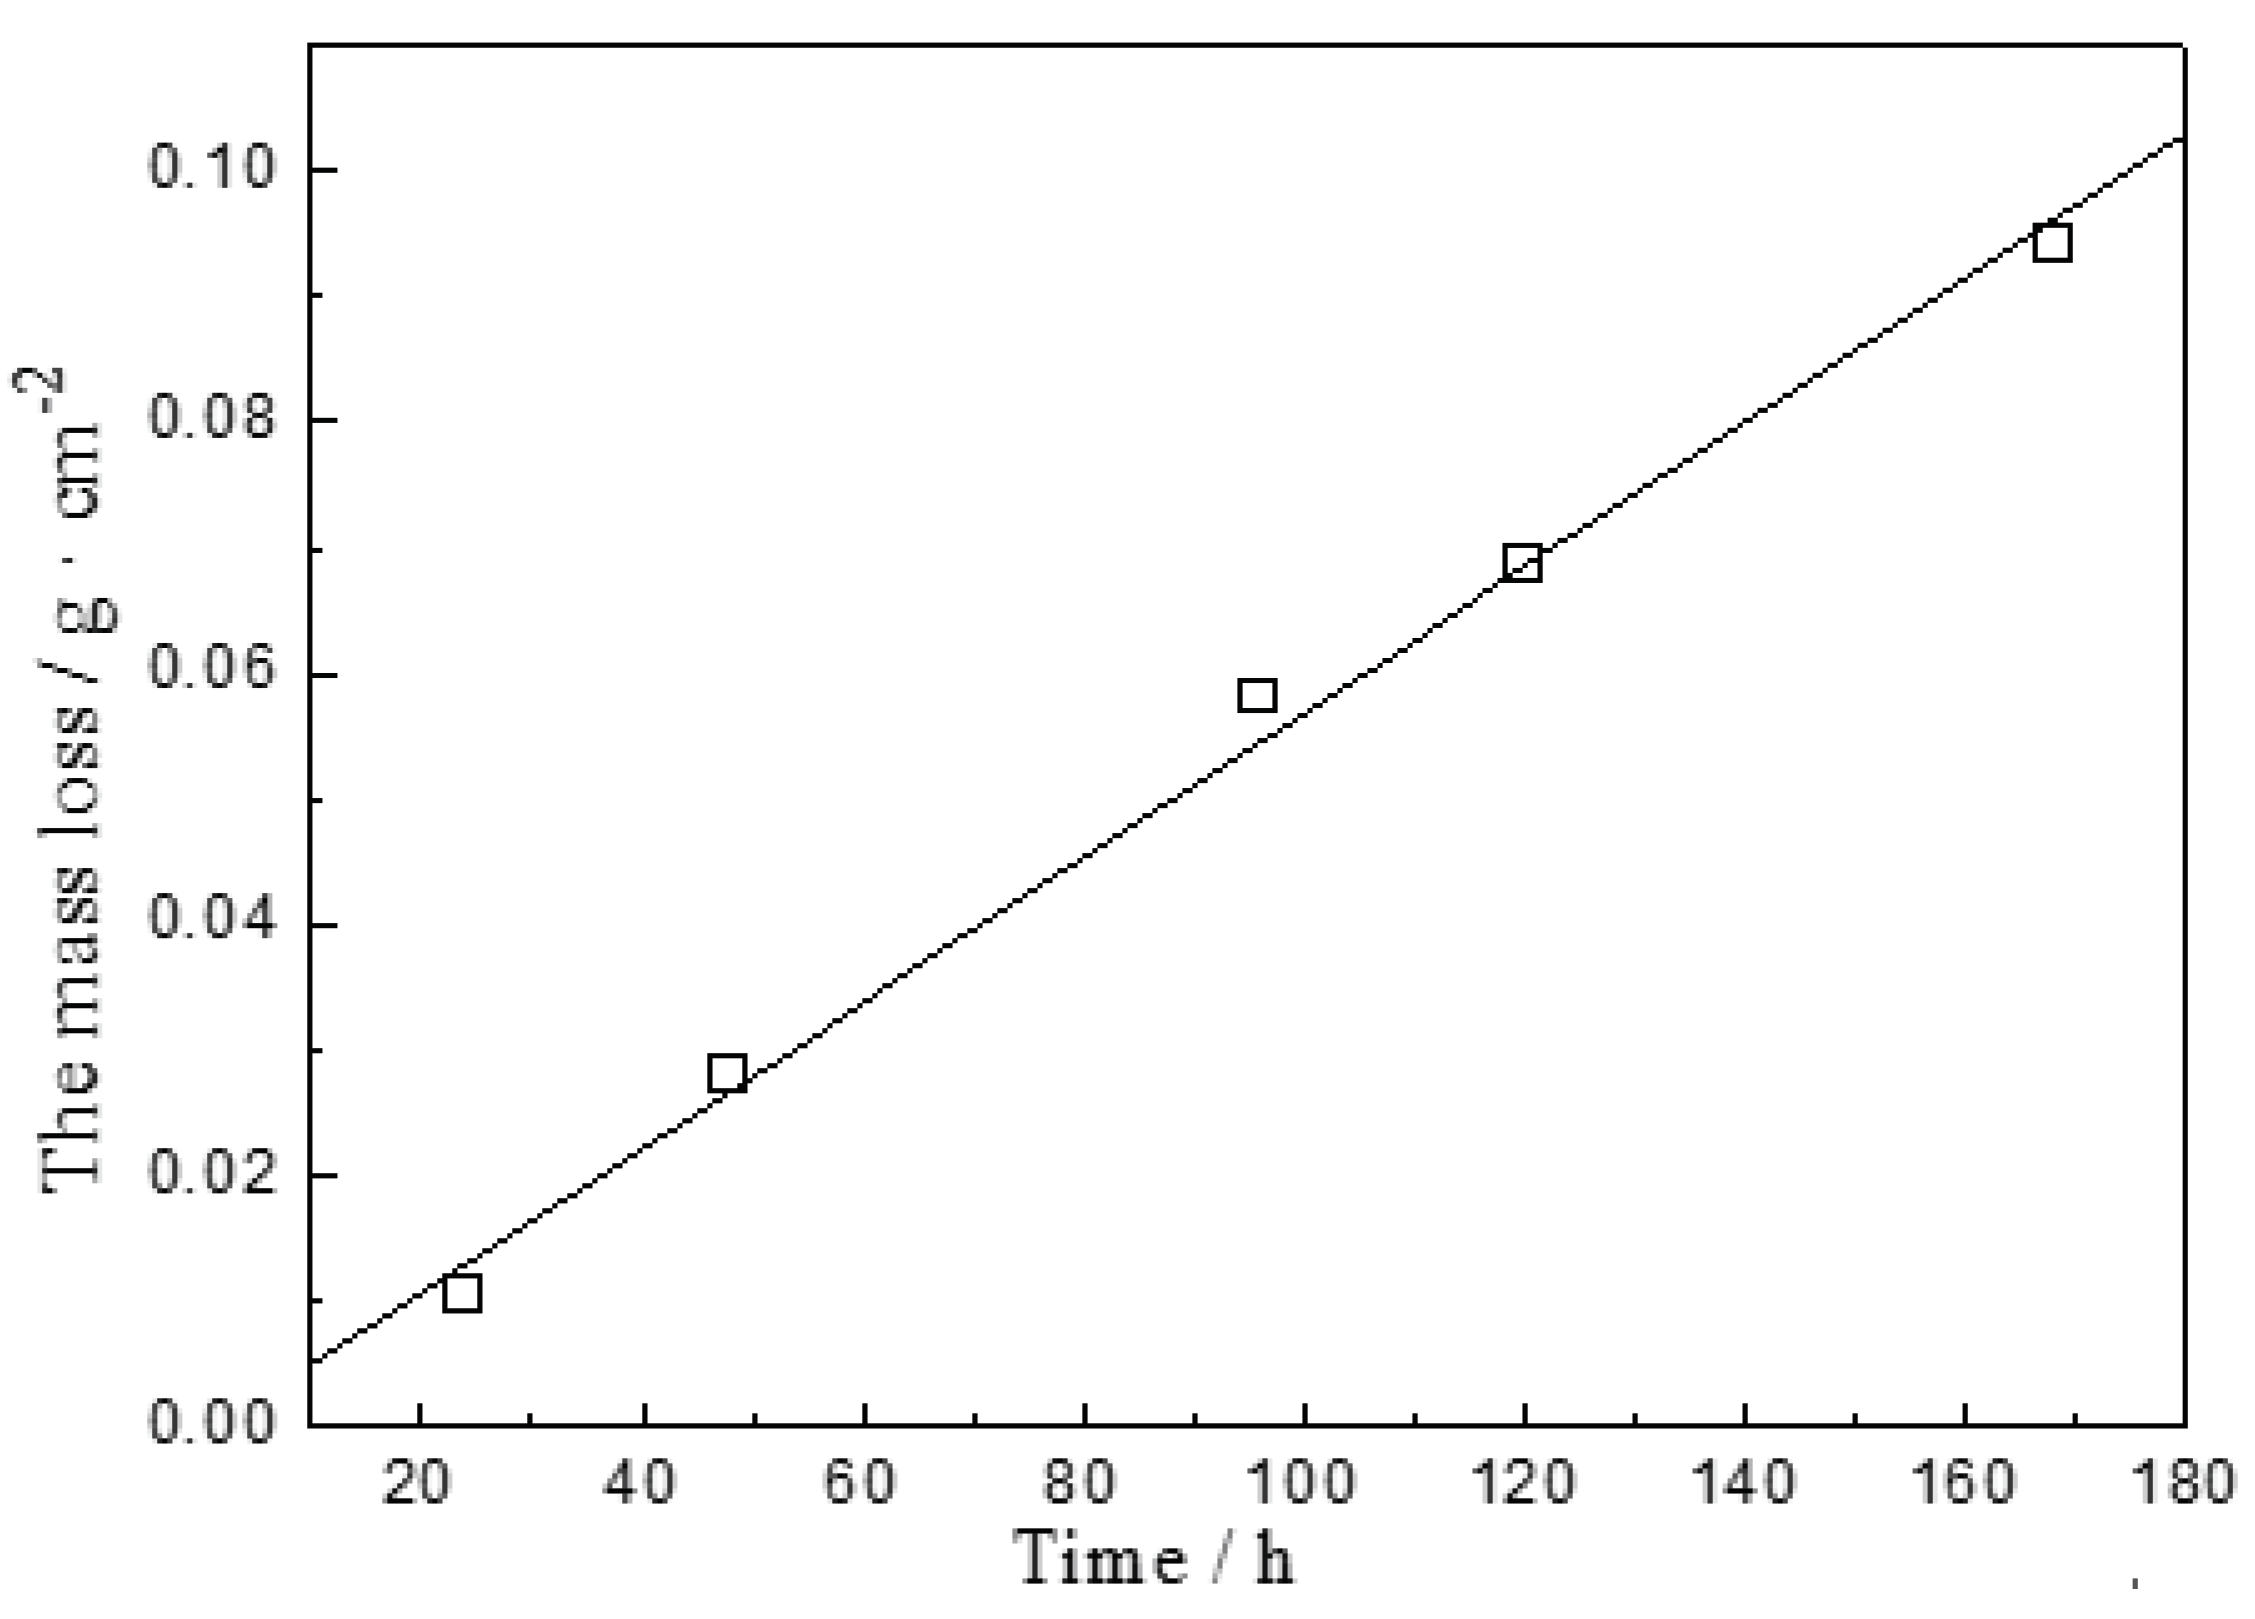

Table 1.
Calculated cross-section fractal dimension Df and pore area of membranes.
| Shell Materials | Pore Area (%) | Cross-Section Fractal Dimension Df |
|---|---|---|
| PVA film | 0.0019 | 2.00 |
| Gelatin film | 5.3120 | 2.29 |
| MC film | 16.7062 | 2.51 |
Table 2.
Permeation rates of different thickness membranes under different conditions.
| Fractal Dimension (Df) |
Viscosity of Core (m2/s) |
Membrane Thickness (μm) |
Permeation Rate (mg/cm2·h) |
|---|---|---|---|
| MC (Df =2.51) |
15 | 5 | 40 |
| 15 | 15 | 8 | |
| 15 | 30 | 0.75 | |
| 32 | 5 | 23 | |
| 32 | 15 | 3.2 | |
| 32 | 30 | 0.14 | |
| Gelatin (Df =2.29) |
15 | 5 | 32 |
| 15 | 15 | 6.4 | |
| 15 | 30 | 0.36 | |
| 32 | 5 | 16 | |
| 32 | 15 | 2.4 | |
| 32 | 30 | 0.06 | |
| PVA (Df =2.00) |
15 | 5 | 26 |
| 15 | 15 | 2.53 | |
| 15 | 30 | 0.0053 | |
| 32 | 5 | 5 | |
| 32 | 15 | 0.2 | |
| 32 | 30 | 0.0014 |
Table 3.
The statistic results of the models for the complete data.
| Model | Variables | R | Unstandardized Coefficients B |
Standardized Coefficients |
F | Sig. | Durbin- Watson |
|---|---|---|---|---|---|---|---|
| A | Constant 1/(sqrt (MT)) |
0.839 | 0.360 584.476 |
0.839 |
38.184 | 0.000 | |
| B | Constant 1/VCM 1/(sqrt (MT)) |
0.891 | -9.784 207.197 584.476 |
0.299 0.839 |
28.951 | 0.000 | |
| C | Constant Df 1/VCM 1/(sqrt (MT)) |
0.920 | -40.414 13.513 207.197 584.476 |
0.230 0.299 0.839 |
25.879 | 0.000 | 2.180 |
Table 4.
Comparison of the predictive capacity of model A, model B and model C (N=18).
| Model | R2 | SP | MAE | RMSE | ||
|---|---|---|---|---|---|---|
| A | 0.705 | 9.22 | 9.25 | 7.0674 | 3.96 | 6.66 |
| B | 0.794 | 9.22 | 9.24 | 6.0929 | 4.19 | 5.56 |
| C | 0.847 | 9.22 | 9.21 | 5.4344 | 1.45 | 2.72 |
Disclaimer/Publisher’s Note: The statements, opinions and data contained in all publications are solely those of the individual author(s) and contributor(s) and not of MDPI and/or the editor(s). MDPI and/or the editor(s) disclaim responsibility for any injury to people or property resulting from any ideas, methods, instructions or products referred to in the content. |
© 2023 by the authors. Licensee MDPI, Basel, Switzerland. This article is an open access article distributed under the terms and conditions of the Creative Commons Attribution (CC BY) license (http://creativecommons.org/licenses/by/4.0/).
Copyright: This open access article is published under a Creative Commons CC BY 4.0 license, which permit the free download, distribution, and reuse, provided that the author and preprint are cited in any reuse.


