
Submitted:
13 June 2023
Posted:
14 June 2023
You are already at the latest version
Abstract
Generating localized haptic feedback on touch displays has been a challenge in recent years. In this study, we introduce a haptic interface using transparent thin-film PVDF actuators to address this issue. The transparency feature allows for mounting the actuators at any location beneath the display, enabling localized haptic feedback as the generated vibration is primarily evident on the mounting area. Two different configurations are designed, simulated and prepared to explore the effectiveness of the proposed approach. The first configuration is used to characterize the haptic interface. Modal and forced-vibration analysis are performed to identify important design characteristics based on human factor considerations. Subsequent 2AFC psychophysics experiments validate the characteristics. In the second configuration, eight actuators are attached to the touch surface in a 2x4 matrix formation and excited at different voltage amplitudes. Human experiments are conducted based on the results from corresponding forced-vibration analysis. The results show that subjects demonstrate an accuracy of 96% in identifying locations with haptic feedback when the actuators are excited with 232 Vpp. Overall, our study demonstrates the effectiveness of the haptic interface equipped with PVDF-type actuators in achieving localized haptic feedback on touch displays.
Keywords:
localized haptic feedback
; PVDF actuators
; touch displays
; modal analysis
; forced-vibration
; psychophysics
; psychometric function.
1. Introduction
Especially with the prevalence of smartphones in the last decade, touch screens are everywhere in our daily life: mobile phones, kiosks, notebooks, tablet PCs, control interfaces of smart home appliances, etc. However, they mostly lack haptic feedback on their surface which as a supportive sensory channel could have a high potential to improve task performance and usability [1,2]. Over the last decades, 2 main methods to obtain haptic feedback on touch screens have stood out among others: 1) electrostatic actuation and 2) electromechanical actuation. In the former method, a conductive transparent layer (i.e. ITO films) embedded in the touch screen is excited with alternating voltage [2,3]. And the latter is performed using different types of electromechanical actuators such as vibration motors, linear actuators, piezoelectric patches, electroactive polymers etc. which are mechanically coupled to the touch screen [4,5]
Electrostatic actuation requires the relative movement of the user’s finger on the display at all times because it is mainly based on the change of the friction force between the display surface and the finger. On the other hand, electrostatic force and hence the friction force can be easily manipulated by varying the excitation voltage with a microcontroller. Moreover, touch interface systems actuated electrostatically do not include mechanically moving parts which would reduce the life span of the appliance.
Typically, researchers employ the well-known surface capacitive touch sensor (Model: 3M SCT3250) to implement the electrostatic actuation method [1,6,7,8,9,10,11]. Here, the amplified excitation voltage is applied to the electrode embedded in the touch display, and the electric charges are distributed evenly on the entire conductive layer. So, during a time period there can be only one haptic effect to be sensed by the contacting finger on a surface capacitive glass (3M SCT3250). Suppose that we refer to a finger of the current/different user by saying “natural stylus”. It is actually an illusion that the user gets different haptic feedback on different locations of the electrostatically actuated display. A second natural stylus would perceive the same haptic feedback even if it had contacted a different location, simultaneously. At this point, one of the biggest drawbacks arises: there is actually no multi-haptic feedback in those studies. Multiple haptic effects felt via several natural styli interacting with the touch display can only be obtained by “separating” conductive surfaces or by specific electronic circuitry mounted to the natural styli. In a novel demo study, the ITO layer of a surface-capacitive touch sensor is partitioned by laser ablation method so that every “ITO-cell” can be excited individually [12]. So, the haptic feedback is literally localized where users perceive different haptic effects via each individual natural stylus. However, any kind of localization of the haptic feedback using specific circuitry is not known to the authors.
Similar haptic localization issue applies also to the second method (electromechanical actuation) since the actuators vibrate the entire surface they are attached to. Moreover, in this method it is necessary to mount the actuators not beneath the display area, but rather under the peripheral edges (i.e. screen bezels or the surface borders excluding the visual area) since they would obviously block the visual information coming from the display. So, focusing of the produced vibration on the desired locations comes into play as the new research problem. Nevertheless, there are some signal-processing solutions to overcome the problem of haptic feedback localization [13,14]. This technique is called time-reversal focusing where the mechanical waves generated by multiple piezoelectric actuators are focused spatially and temporally. However, they are not easy to implement and might require considerable processing power.
In this study, we propose a simple but effective method where transparent piezoelectric polymer (PVDF, polyvinylidene fluoride) films can be utilized to generate localized haptic feedback on touch displays. Furthermore, the optical transparency feature of the film actuators provides design flexibility since they can be mounted in any shape and location to the touch interface.
Electroactive polymers have various application areas as actuators. In a remarkable robotics application, the authors built a soft robot that mimics the movements of an insect [15]. Here, high strain outputs of PVDF polymer actuator make the soft robot pace at a relative speed of 20 body lengths per second, carry lightweight loads, and climb slopes.
Another study is about active vibration control on plate structures where laminated PVDF actuators are utilized [16]. The authors performed active control experiments by applying sinusoidal signals at multiple frequencies and reached a vibration reduction of 20 dB on the steel plate.
Chilibon et. al compared different types of bimorph transducers: PZT and PVDF-based piezoelectric materials in their work [17]. Two PZT patches with 0.3 mm thickness produce more than 2 mm displacement at the cantilever tip. However, the same structure with a 25 μm thick PVDF polymer actuator provides more than 1 mm displacement at the tip of the beam. There is at least 5-fold supremacy when compared to the PZT actuator.
Perez et al. developed a PVDF-based bimorph actuator for laser scanners [18]. This actuator is designed to induce vibrations on a small mirror located at the beam-tip, weighing 160 mg, at a frequency range of up to 3 kHz.
One of the interesting application areas is introduced by Chen et al. where PVDF-based piezopolymer actuators are used to adjust the surface accuracy of large-scale space antennas [19]. The authors investigated also the task performance of several types of PVDF-polymers. Similar electrostrictive materials can also be utilized to control thin shell reflectors in space industry [20].
Furthermore, PVDF-based piezoelectric materials can be used as pressure sensors and nanogenerators since they can respond to changes in physical quantities such as pressure, sound waves, temperature and air flow by converting mechanical energy into electrical energy [21,22]. In a similar manner, Jin and his collaborators embedded PVDF arrays inside a rubber cylinder to measure the internal stresses generated by several external factors [23].
In their study, Hu et. al developed a finger-shaped haptic sensor using a thin PVDF-film which can evaluate fabric surfaces by measuring height and depth variations in surface textures through relative motion [24].
PVDF-based electroactive polymers are also used to generate haptic feedback. Matysek et al. fabricated a 3x3 matrix array of multilayer dielectric elastomer actuators in their study [25]. In another work accomplished by Stubning et al., a design procedure for a transparent EAP-stack actuator with multiple layers was introduced. However, neither of those actuators were implemented on a display interface [26]. Additionally, the multilayer structure of the EAP-stack actuator may result in decreased transparency and therefore lower visual quality of the display.
2. Methods
To test the proposed concept, two transparent touch interfaces are designed and constructed. They consist of transparent plastic plates and multiple transparent PVDF-film actuators attached beneath the touch surface. Two different configurations are examined using analytical and experimental methods: a) First, the modal analysis is performed in order to identify the proper characteristic parameters such as actuation frequency and vibration amplitude considering human-factors principles. b) Afterward, these findings are utilized to evaluate subjects’ performances via experimental studies.
2.1. Hardware
Multiple transparent PVDF-film actuators (20x20x0,05 mm) are attached to the bottom of a transparent PVC (polyvinyl chloride) plastic layer (100x50x0.6 mm) which is constrained via a clamp mechanism along its rectangular perimeter. To ensure fixed boundary conditions, the plastic plate is clamped between two metal frames using several nuts and bolts on the sides. The structure stands on a 10-inch PC monitor which is placed horizontally on a desk. Vibration isolation between the structure and the monitor is provided with a 1 cm thick foam rubber.
Unipolar analog input signals are generated by a 32-bit microcontroller (STM32F407G). An executable program is developed in Unity software to communicate with the microcontroller for conveying indicators of the randomized signals. At the same time, it records the choice responses of the subjects via an interface. A custom-designed amplifier circuit with adjustable gain amplifies the unipolar signals and excites PVDF-film actuators. It hosts also a high-pass filter stage to eliminate DC components originating from the microcontroller. Hence, pure sinusoidal high-voltage signals are obtained on the amplifier output. Finally, the excitation voltage is directed to the relevant actuators by a multi-channel relay module which is controlled by the microcontroller board, as well. To ensure proper connection with transparent actuators, electrically conductive adhesive tapes are utilized. In case of incomplete connectivity silver paste is applied.
PVDF-film actuators are glued (clear epoxy adhesive) to the plate in such a way that the positive electrodes are positioned directly beneath the layer. Hence to prove the safety of the interface, electrical breakdown for the utilized PVC plate must be investigated. The dielectric strength of the PVC material is about 25 kV/mm [27]:
breakdown voltage = dielectric strength * thickness = 25 kV/mm * 0.6 mm = 15 kV
Since operating excitation voltages are below 300 Vpp the setup is safe to conduct human experiments.
For the experiments, two identical touch interfaces with different actuator configurations are prepared. In the first configuration, two actuators are mounted to the right and left sides, respectively (Figure 1a). The second configuration consists of 8 actuators which are mounted in a 2x4 array formation (Figure 1b). Both configurations are arranged symmetrically with respect to the origin of the surface geometry.
2.2. Finite Element Analysis
2.2.1. General Information
The piezoelectric behavior for a general, anisotropic material is defined by two equations [28,29,30]. Equation (1) is for the sensing and (2) is for the actuation mode:
where;
D: The electric displacement vector
T: The stress vector
E: The electric field vector
S: The deformation (strain) vector
s: Elastic compliance matrix
d: Piezoelectric charge constants matrix
ε: Dielectric constants matrix
and subscripts T and E indicate values at constant stress and electric field, respectively.
Generally, the non-zero and unique components of those piezoelectric coefficients, dielectric constants and elastic compliance tensors in piezoelectric materials are determined by different factors such as extrusion process or specific crystal symmetry [31]. For instance, the transparent PVDF material (PolyK Technologies, LLC) used in this study is orthotropic. Orthotropic materials can exhibit different mechanical or electrical properties along 3 axes which are perpendicular to each other (Figure 2).
Basically, governing piezoelectric equations can be rearranged for isotropic materials as follows [21,30,32,33,34]:
where the variable dij means generated strain along j due to the electric field along i.
As anisotropic piezopolymers, PVDF materials generate different strain amplitudes under an electric field in the direction of polarization. Since the poling of PVDF-film sheet is in direction 3, d24 and d15 can be neglected [22,24,34]. So, the matrix of piezoelectric charge coefficients is expressed as:
The required coefficients of the elastic compliance matrix are procured from several experimental studies [27,30,32,35,36]. And the basic properties of the utilized PVDF material are given in Table 1.
The structure is built and simulated in a finite element analysis program. After performing a modal analysis, the first 3 natural frequencies turned out to be ωn1 = 451.2 Hz, ωn2 = 584.2 Hz and ωn3 = 824.4 Hz.
Since each of the natural frequency values corresponds to a definite and distinctive mode shape of the structure (Figure 3) according to basic modal analysis principles, natural frequencies must be avoided in order to generate localized vibrations at desired locations successfully. Thus, the frequency of the excitation voltage must not be selected in the vicinity of natural frequencies. Meanwhile, it should also be situated in the perception interval for human skin which can reach up to 800-1000 Hz [37,38]. Considering those design limitations, 5 frequency values equally spaced (%30) on logarithmic scale are selected: 137, 178, 230, 300 and 390 Hz [39,40].
2.2.2. A/B Configuration
In the first configuration, both actuators are excited with a pure sinusoidal signal of 100 V peak-to-peak amplitude and with 5 different frequencies. Individual excitation of the PVDF-based actuators provides the localization of the vibration where the generated displacement amplitude reaches 0.36 μm, 0.37 μm, 0.39 μm, 0.45 μm and 0.63 μm depending on signal frequencies, respectively (Figure 4). Those displacement amplitudes are higher than the absolute detection threshold for the human fingertip reported in literature [41,42]. Results obtained from the excitation at 137 Hz show the symmetry of the structure (Figure 4a,b). The vibration patterns for the actuator-B at remaining frequencies are not given to save space.
It appears that the vibration pattern of the 390 Hz signal is pervasive to some degree due to its relative proximity to the first natural frequency, but it can still be considered localized.
2.2.3. Array Configuration
In the second configuration, each actuator is activated individually with 230 Hz sinusoidal signal. This value lies in the range of 200-300 Hz where the human fingertip is reported to be perceptually most sensitive to vibratory cues according to several studies [43,44,45,46]. Here, the vibration maps of only 2 conditions (actuators A and B are excited) are depicted (Figure 5). The other 6 vibration maps are not given because they are similar to the ones obtained by the excitation of the first 2 actuators due to the structural symmetry of the touch surface. In other words, the vibration maps formed by individually exciting actuators A, D, E, and H are similar in terms of shape and displacement magnitude. Likewise, the individual activation of the remaining actuators (B, C, F, and G) leads to the formation of similar vibration maps but with increased displacement magnitudes.
Finite element simulation results provide convincing evidence of distinct and prominent vibration patterns on the corresponding actuators, solidly proving the effectiveness of achieving localized haptic feedback (Figure 5).
2.3. Experiments
2.3.1. A/B Configuration
The primary objective of the first experiment is to characterize the haptic interface by assessing and analyzing the key actuation parameters considering human factors: actuation frequency and detection threshold. For this, one of the classical psychophysical methods introduced by Fechner is used to estimate the absolute threshold value for detection: repeated-measures, within-subject method of constant stimuli [47,48]. It is accomplished with the one-interval, two-alternatives, forced-choice (1I-2AFC) paradigm since it can provide more objective psychophysical procedures.
Eight subjects (four female, four male) with a mean age of 28.9 took part in the experiment. All of them were right-handed and used the index finger of their dominant hand in the experiment. They did not report any sensorimotor impairment. Both experiments reported in this study received approval from the Human Research Ethics Committee of Gebze Technical University.
According to the well-known Weber’s rule, the just noticeable change in stimulus intensity is a constant fraction of the stimulus intensity [47,48]. Thus, both voltage and frequency levels used in human experiments are selected to be equally spaced on the logarithmic scale.
After some preliminary observations, 50 V is predicted to be the required voltage amplitude at 230 Hz to produce vibratory feedback at absolute detection threshold. Taking 50 V as the center value, 4 lower and 4 higher amplitudes of excitation voltage are added to the stimulus set which are equally spaced on logarithmic scale: 17 V, 22 V, 29 V, 38 V, 50 V, 65 V, 85 V, 110 V, 143 V.
The simulation outputs of the forced-vibration analysis for the A/B configuration have revealed that the excitation at each selected frequency produces similar vibration patterns, though with different displacement amplitudes (Figure 4). So, the activation voltages are adjusted to eliminate the frequency effect and equalize the displacement amplitudes using proper gain coefficients (Table 2).
For example, the amplitudes of the stimulus set are modified for 137 Hz:
1.08 * [17, 22, 29, 38, 50, 65, 85, 110, 143] = [18, 24, 31, 41, 54, 70, 92, 119, 154]
The touch interface designed has a rectangular shape since lateral motion is the most effective method to explore the surface properties [49]. Before the experiment, subjects were informed about their tasks and instructed to interact with the haptic interface as they would with a typical smart device equipped with a touch display. They were trained for approximately 3 minutes to become familiar with the haptic feedback effects generated by the touch-screen interface. In the training session, they were exposed to each stimulus twice (1 for each alternative side) at 230 Hz. In the experiment session, every subject conducted a set of 180 trials (9 stimuli) for each of 5 signal-frequency levels, a total of 900 trials. Hence, each stimulus appeared 20 times (10 times on A-side and 10 times on B-side). Those appearances were randomized block-wise: each stimulus was given once before any stimulus was given twice. This method helps to reduce the learning and carry-over effect and to increase statistical validity [50]. The subjects’ task was to determine the side with the haptic feedback on it and to select it with a mouse located next to the monitor (Figure 6). When they made the selection, the next trial was originated by the software immediately. The experiment for one subject lasted about 70 minutes.
2.3.2. Array Configuration
In the second experiment, a multiple-choice procedure is designed to prove the ability of the touch-screen interface to provide localized haptic feedback. Here, the subjects try to detect the one with haptic feedback out of 8 locations: A, B, C, D, E, F, G, and H (Figure 7). 230 Hz is set to be the operating frequency for the pure sine signal, because according to the results of the human experiments with the A/B configuration, it is the critical member of the frequency set where the fingertips of the participants are most sensitive to vibratory feedback.
Two amplitudes are selected from the voltage stimuli set: one is the next greater one to the absolute detection threshold (65 V), and the other one is the highest level (143 V). Previous simulation results have shown that the generated displacement magnitude is higher when one of the actuators in the middle (B, C, F, or G) is actuated compared to the case when one of the actuators in the corners (A, D, E, or H) is actuated (Figure 5). To compensate for this difference caused by the location effect, the gain coefficient 2.44/2.15 = 1.13 is used to increase the excitation voltage of the corner actuators.
Additionally, the difference caused by the positioning of the actuators must also be eliminated. According to the finite element analysis results, two different configurations have led to maximum vibration magnitudes of 0.39 μm and 0.24 μm on the corresponding actuators at 100 Vpp and 230 Hz, respectively (Figure 4 and 5). Since there is a directly proportional relation between excitation voltage and displacement amplitude of the generated vibration, the maximum displacement amplitudes produced in A/B configuration at 65 V and 143 V are 0.25 μm and 0.56 μm, respectively. To obtain the same displacement amplitudes in the array configuration, the excitation signals with voltage amplitudes of 106 V and 232 V shall be used (Figure 8).
Six subjects with a mean age of 27.5 participated in the experiment which was conducted over two sessions. Before the experiment, subjects underwent a 4-minute training process. They were asked to explore the touch surface freely and to identify the specific location with the highest perceived haptic effect out of the eight available options with the mouse next to the monitor. In the training session, two different haptic cues (with amplitudes of 106 V and 232 V) appeared on each different location twice. In the experiment session, both signals are conveyed to each location 20 times. So, the experiment consists of totally 320 trials per participant. After each trial, the subject's response triggered the subsequent trial, in which haptic feedback stimuli were randomly delivered to different locations. Again, the stimuli are randomized block-wise. The multiple-choice experiment is completed approximately in 40 minutes.
3. Results
3.1. Results of the First Experiment
Success rates are averaged out among 8 subjects for each stimulus value (9 voltage levels) and data points of psychometric functions for 5 different frequencies are obtained (Figure 9). The dashed curve indicates the ideal psychometric function in 2-AFC condition. Since there are 2 choices it starts from the value of chance performance 0.5 and the threshold is defined as the point at which the participants achieve 75% correct responses. This threshold value is equivalent to a 50% threshold in a psychometric function derived from a yes/no detection experiment [48,50].
As depicted in the graph, the overall performance of the subjects improves as the stimuli amplitudes increase. However, the curve corresponding to 390 Hz exhibits an unexpected anomaly in the highest two stimuli, potentially attributed to the pervasive behavior of the vibration pattern at that specific frequency. Participants appeared to encounter ambiguity during the decision-making process, particularly when the haptic effect was discernible not only on the intended target area but also on the other side (Figure 4f). As anticipated, the participants' performance yielded the most favorable outcomes at 230 Hz and 300 Hz.
Absolute detection threshold results are analyzed using two-factor ANOVA with repeated measures. The null hypothesis of a significant effect was rejected when the resulting p-value was found to be less than the predefined significance level of α = 0.01. It states that varying amplitude and frequency of the excitation signal does not affect the perception performance of the subjects. The results show that the null hypothesis is rejected (p<0.01) for both factors which means that amplitude and frequency have a significant effect on success rates of the participants. Moreover, there is no significant interaction effect between two factors (p>0.01). In other words, the effect of one factor on the success rate does not depend on the levels of other factor which is consistent with the parallel behavior observed in the frequency curves.
Ogive curves (Sigma-shaped or S-shaped curves) are fitted to the data points, with the threshold representing the stimulus level at which detection occurs in 75% of the total trials. If the threshold values fall between two stimuli, a simple linear interpolation process is employed. Required excitation voltages to achieve vibration displacement amplitudes of detection threshold are calculated and given below (Table 3):
3.2. Results of the Second Experiment
Success rates of the participants for each of the 8 locations for 2 different voltage amplitudes are plotted in the bar charts below (Figure 11). Bars start from 50% of success rate since the lowest one among all subjects is 55% (Subject-2 at location B). This proves that even the vibration displacement of 0.25 um is to some extent sufficient to perceive the haptic feedback and the results are consistent with the findings reported in previous studies [41,42,51]. With only a few exceptions, every subject showed improved performance across all 8 locations when actuators are excited with higher voltage (232 V) compared to with low voltage. Furthermore, two participants exhibited the best performance at higher voltage, achieving 100% accuracy among all locations.
When the hit rates were averaged for each participant, it was observed that all of them exhibited a clear improvement in the success rate at higher voltage (Figure 12).
Besides the performance metrics of the individuals, the accuracy of location-based responses is also important. To demonstrate this, confusion matrices are plotted for both low- and high-voltage cases (Figure 13). The average performance of participants at low voltage does not drop below 74%, and it reaches at least 82% when the two lowest performances are excluded. At high voltage, the average performance is significantly improved, reaching a minimum of 90%. In both cases, the lowest performances are observed when the C- and G-actuators are actuated, which could be attributed to structural deficiencies such as poorer coupling of the actuator to the surface or interference caused by neighbor actuators.
On the other hand, average success scores at the corner locations (A, D, E, H) consistently rank among the top 4 or 5 in both cases because these actuators have fewer neighboring actuators that can potentially interfere with their haptic effects compared to the middle locations. Eventually, when the two lowest performances at locations C and G are excluded, the average performance at every location reaches a minimum accuracy of 95%, which can be considered a very good score.
4. Discussion and Conclusion
In this study, a haptic interface equipped with transparent PVDF actuators is introduced. In contrast to the work conducted by Stubning et al. in this study, the actuators are positioned beneath a transparent plastic plate [26]. Moreover, unlike the approach of using a stack of actuators, this study accomplishes the goal of achieving accurate localized haptic feedback using only single actuators. Indeed, stack actuators can have the disadvantage of reducing the transmittivity of light, thus affecting the image quality coming from the display. This drawback underscores the efficiency of the proposed method in delivering precise haptic sensations while simultaneously simplifying the overall design. There are two more studies where researchers deploy transparent actuators to generate vibrotactile feedback. One of them involved the use of EAP (electroactive polymer) arrays and employed beat phenomenon to render haptic effects [52]. The other one introduced transparent graphene-based stack actuators to generate bumps with high amplitudes on tactile displays [53].
The concept of this study is introduced via two different arrangements: A/B- and array configuration. In the first configuration two actuators are mounted on the left and right sides of the rectangle plate. The Finite element analysis method is employed to simulate the structure and obtain information about relevant design parameters such as the frequency and amplitude of excitation signals and the generated amplitudes on the interface. Among the selected frequency set, 230 Hz is the frequency where vibration displacement threshold is at its minimum (34.3 dB re 1 Vpp). As expected, the human fingertip sensitivity represents a U-shaped curve: amplitude thresholds increase when the frequency is lower or higher than 200-300 Hz. Similar findings have been reported in many numerous previous studies as well [2,42,43,44,45,46,51].
The second configuration consists of 8 actuators arranged in a 2x4 matrix formation and is designed to demonstrate the capability of generating localized haptic feedback on desired locations. The actuation frequency of 230 Hz is chosen based on the supportive findings from the first experiment. Two excitation amplitudes, 106 and 232 volts are selected: they generate maximum vibration displacements of 0.25 μm and 0.56 μm on the second setup, respectively. The success rates are averaged among 6 subjects and 8 different locations, resulting in an accuracy of 83% at low voltage and 96% at high voltage. Hence, the results, especially at higher voltage, strongly validate the localization process of the generated haptic feedback on touch displays, enhancing the overall user experience. Considering that the maximum amplitude used in this study is 232 V, it is evident that utilized transparent PVDF-based materials are suitable actuators for achieving localized and rich haptic effects since they are able to handle excitation ranges of up to 5000 V.
Although the application process of the actuators to touch surface poses challenges, this study serves as a good proof of the concept. In the future some microfabrication methods can be employed to produce touch interfaces with higher haptic resolution. It is important to note that a comprehensive vibration analysis will always be necessary in order to effectively implement this in real-life applications.
Author Contributions
Conceptualization, E.E.S.; methodology, E.E.S and B.U.; software, E.E.S. and B.U.; validation, E.E.S.; formal analysis, E.E.S.; data curation, E.E.S.; writing—original draft preparation, E.E.S.; writing—review and editing, E.E.S. and B.A.; visualization, E.E.S.; supervision, B.A.; All authors have read and agreed to the published version of the manuscript.
Funding
This research received no external funding
Conflicts of Interest
The authors declare no conflict of interest.
References
- Prewett, M.S.; Elliott, L.R.; Walvoord, A.G.; Coovert, M.D. A Meta-Analysis of Vibrotactile and Visual Information Displays for Improving Task Performance. IEEE Trans. on Systems, Man, and Cybernetics 2012, 42, 123–132. [Google Scholar] [CrossRef]
- Bau, O.; Poupyrev, I.; Israr, A.; Harrison, C. TeslaTouch: Electrovibration for Touch Surfaces. Proc. of the 23nd Annual ACM Symp. on User Interface Software and Technology 2010, 283–292. [Google Scholar]
- Ishizuka, H.; Hatada, R.; Cortes, C.; Miki, N. Development of a Fully Flexible Sheet-Type Tactile Display Based on Electrovibration Stimulus. Micromachines 2018, 9, 230. [Google Scholar] [CrossRef]
- Basdogan, C.; Giraud, F.; Levesque, V.; Choi, S. A Review of Surface Haptics: Enabling Tactile Effects on Touch Surfaces. IEEE Trans. on Haptics 2020, 13, 450–470. [Google Scholar] [CrossRef]
- Chen, J.; Teo, E.H.T.; Yao, K. Electromechanical Actuators for Haptic Feedback with Fingertip Contact. Actuators 2023, 12, 104. [Google Scholar] [CrossRef]
- Kim, H.; Kang, J.; Kim, K.; Lim, K.; Ryu, J. Method for Providing Electrovibration with Uniform Intensity. IEEE Trans. on Haptics 2015, 8, 492–496. [Google Scholar] [CrossRef]
- Shultz, C.D.; Peshkin, M.A.; Colgate, J.E. Surface Haptics via Electroadhesion: Expanding Electrovibration with Johnsen and Rahbek. In Proceedings of the IEEE World Haptics Conf. Evanston, USA, 22-26 June 2015. [Google Scholar]
- Zophoniasson, H.; Bolzmacher, C.; Anastassova, M.; Hafez, M. Electrovibration: Influence of the Applied Force on Tactile Perception Thresholds. In Proceedings of the Zooming Innovation in Consumer Electronics International Conference Novi Sad, Serbia, 31 May-01 June 2017. [Google Scholar]
- Jiao, J.; Zhang, Y.; Wang, D.; Guo, X.; Sun, X. HapTex: A Database of Fabric Textures for Surface Tactile Display. In Proceedings of the IEEE World Haptics Conference, Tokyo, Japan, 9-12 July 2019. [Google Scholar]
- Isleyen, A.; Vardar, Y.; Basdogan, C. Tactile Roughness Perception of Virtual Gratings by Electrovibration. IEEE Trans. on Haptics 2020, 13, 562–570. [Google Scholar] [CrossRef] [PubMed]
- Osgouei, R.H.; Kim, J.R.; Choi, S. Data-Driven Texture Modeling and Rendering on Electrovibration Display. IEEE Trans. on Haptics 2020, 13, 298–311. [Google Scholar] [CrossRef] [PubMed]
- Emgin, S.; Ege, E.S.; Birer, O.; Basdogan, C. Localized Multi-Finger Electrostatic Haptic Display. In Proceedings of the IEEE World Haptics Conference Hardware Demonstration, Chicago, USA, 22-25 June 2015. [Google Scholar]
- Bai, M.R.; Tsai, Y.K. Impact Localization Combined with Haptic Feedback for Touch Panel Applications Based on the Time-Reversal Approach. The Journal of the Acoustical Society of America 2011, 129, 1297–1305. [Google Scholar] [CrossRef] [PubMed]
- Hudin, C.; Lozada, J.; Hayward, V. Localized Tactile Feedback on a Transparent Surface through Time-Reversal Wave Focusing. IEEE Trans. on Haptics 2015, 8, 188–198. [Google Scholar] [CrossRef] [PubMed]
- Wu, Y.; Yim, J.K.; Liang, J.; Shao, Z.; Qi, M.; Zhong, J.; Luo, Z.; Yan, X.; Zhang, M.; Wang, X.; Fearing, R.S.; Full, R.J.; Lin, L. Insect-Scale Fast Moving and Ultrarobust Soft Robot. Science Robotics 2019, 4, eaax1594. [Google Scholar] [CrossRef]
- Sheng, M.; Han, Y.; Li, Q.; Li, X.; Dang, Z. ; Experimental Investigation of Active Vibration Control on Plate Structures Using Laminated PVDF Actuators. Proceedings of 14th International Bhurban Conference. on Applied Sciences&Technology, Islamabad, Pakistan, 10-14 January 2017. [Google Scholar]
- Cilibon, I.; Dias, C.; Inacio, P.; Marat-Mendes, J. PZT and PVDF Bimorph Actuators. Journal of Optoelectronics and Advanced Materials 2007, 9, 1939–1943. [Google Scholar]
- Perez, R.; Kral, M.; Bleuler, H. Study of polyvinylidene fluoride (PVDF) based bimorph actuators for laser scanning actuation at kHz frequency range. Sensors and Actuators A 2012, 183, 84–94. [Google Scholar] [CrossRef]
- Chen, Q.; Natale, D.; Neese, B.; Ren, K.; Lin, M.; Zhang, Q.M.; Pattom, M.; Wang, K.W.; Fang, H.; Im, E. Piezoelectric polymers actuators for precise shape control of large scale space antennas. Proceedings of SPIE 6524, Electroactive Polymer Actuators and Devices, San Diego, CA, USA, 05 April 2007. [Google Scholar]
- Wang, K.; Godfroid, T.; Robert, D.; Preumont, A. Electrostrictive PVDF-TrFE Thin Film Actuators for the Control of Adaptive Thin Shell Reflectors. Actuators 2020, 9, 53. [Google Scholar] [CrossRef]
- Xie, L.; Wang, G.; Jiang, C.; Yu, F.; Zhao, X. Properties and Applications of Flexible Poly(Vinylidene Fluoride)-Based Piezoelectric Materials. Crystals 2021, 11, 644. [Google Scholar] [CrossRef]
- Kalimuldina, G.; Turdakyn, N.; Abay, I.; Medeubayev, A.; Nurpeissova, A.; Adair, D.; Bakenov, Z. A Review of Piezoelectric PVDF Film by Electrospinning and Its Applications. Sensors 2020, 20, 5214. [Google Scholar] [CrossRef]
- Jin, M.; Matthews, D.; Wang, N.; Pan, J. The Use of a PVDF Array to Measure the Stress Field Inside an Elastic Material. Sensors 2023, 23, 2144. [Google Scholar] [CrossRef]
- Hu, H.; Han, Y.; Song, A. A Finger-Shaped Tactile Sensor for Fabric Surfaces Evaluation by 2-Dimensional Active Sliding Touch. Sensors 2014, 14, 4899–4913. [Google Scholar] [CrossRef] [PubMed]
- Matysek, M.; Lotz, P.; Winterstein, T.; Schlaak, H.F. Dielectric Elastomer Actuators for Tactile Displays. Proceedings of World Haptics 2009 - Third Joint EuroHaptics Conference and Symposium on Haptic Interfaces for Virtual Environment and Teleoperator Systems, Salt Lake City, UT, USA, 18-20 March 2009. [Google Scholar]
- Stubning, T.; Denes, I.; Beruscha, F. Design optimization of EAP-based haptic surfaces. In Proceedings of the IEEE 2nd International Conference on Dielectrics, Budapest, Hungary, 01-05 July 2018. [Google Scholar]
- MatWeb. Available online: https://www.matweb.com/index.aspx (accessed on 01.05.2023).
- Piefort, V. Finite Element Modelling of Piezoelectric Active Structures. PhD Thesis, Universite libre de Bruxelles, Brussels, 27.04.2001. [Google Scholar]
- Jalili, N. Piezoelectric-Based Vibration Control, From Macro to Micro/Nano Scale Systems, 1st ed.; Springer: New York, USA, 2010; pp. 129–158. [Google Scholar]
- Holloway, F.C. Material Characterization of Poly(Vinylidene Fluoride): A Thin Film Piezoelectric Polymer. MSc Thesis, Montana State University – Bozeman, Montana, 17.04.1997. [Google Scholar]
- Dahiya, R.S.; Valle, M. Robotic Tactile Sensing, 1st ed.; Springer: Dordrecht, Holland, 2013; pp. 195–210. [Google Scholar]
- Fukada, E.; Furukawa, T. Piezoelectricity and ferroelectricity in polyvinylidene fluoride. Ultrasonics 1981, 19, 31–39. [Google Scholar] [CrossRef]
- Wang, H.; Zhang, Q.M.; Cross, L.E.; Sykes, A.O. Piezoelectric, dielectric, and elastic properties of poly(vinylidene fluoride/trifluoroethylene). Journal of Applied Physics 1993, 74, 3394–3398. [Google Scholar] [CrossRef]
- Ramanathan, A.K. Polyvinylindene Fluoride (PVDF) Films for Near-static Measurement Applications. PhD Thesis, The Ohio State University, Ohio, USA, 2021. [Google Scholar]
- Zhao, J.M.; Song, X.X.; Liu, B. Standardized Compliance Matrices for General Anisotropic Materials and a Simple Measure of Anisotropy Degree Based on Shear-Extension Coupling Coefficient. Int. Journal of Applied Mechanics 2016, 8, 1650076. [Google Scholar] [CrossRef]
- Vazquez, M.; Petrearce, R.; Duran, J.; Acevedo, P. Simulation of a PVDF transducer array using the finite element method (FEM) to measure temperature gradients in a soft tissue. In Proc. of IEEE 9th IberoAmerican Congress on Sensors, Bogota, Colombia, 15-18 October 2014. 18 October.
- Serhat, G.; Kuchenbecker, K.J. Free and Forced Vibration Modes of the Human Fingertip. Applied Sciences 2021, 11, 5079. [Google Scholar] [CrossRef]
- Jones, L.A. Haptics, 1st ed.; The MIT Press: Cambridge, England, 2018; pp. 1–55. [Google Scholar]
- Choi, S.; Kuchenbecker, K.J. Vibrotactile Display: Perception, Technology, and Applications, Proceedings of the IEEE 2013, 101, 2093–2104.
- Israr, A.; Tan, H.Z.; Reed, C.M. Frequency and amplitude discrimination along the kinesthetic-cutaneous continuum in the presence of masking stimuli. The Journal of the Acoustical Society of America 2006, 120, 2789–2800. [Google Scholar] [CrossRef] [PubMed]
- Gregg, E.C. Absolute Measurement of the Vibratory Threshold. Archives of Neurology and Psychiatry 1951, 66, 403–411. [Google Scholar] [CrossRef] [PubMed]
- Young, G.; Murphy, D.; Weeter, J. Audio-Tactile Glove. In Proc. of the 16th Int. Conf. on Digital Audio Effects, Maynooth, Ireland, 2-5 September 2013. 5 September.
- Israr, A.; Choi, S.; Tan, H.Z. Detection Threshold and Mechanical Impedance of the Hand in a Pen-Hold Posture. In Proc. of the 2006 IEEE/RSJ Int. Conf. on Intelligent Robots and Systems, Beijing, China, 9-15 October 2006. 15 October.
- Verrillo, R.T. Psychophysics of vibrotactile stimulation. The Journal of the Acoustical Society of America 1985, 77, 225–232. [Google Scholar] [CrossRef]
- Jones, L.; Sarter, N. Tactile Displays: Guidance for Their Design and Application. Journal of the Human Factors and Ergonomics Society 2008, 50, 90–111. [Google Scholar] [CrossRef]
- Gescheider, G.A.; Bolanowski, S.J.; Rope, J.V. ; Verrillo. A four-channel analysis of the tactile sensitivity of the fingertip: frequency selectivity, spatial summation, and temporal summation. Somatosensory & Motor Research 2002, 19, 114–124. [Google Scholar]
- Jones, L.A.; Tan, H.Z. Application of Psychophysical Techniques to Haptic Research, IEEE Transactions on Haptics 2013, 6, 268–284.
- Gescheider, A.G. Psychophysics: The Fundamentals., 3rd ed.; Lawrence Erlbaum Associates, Publishers: New Jersey, USA, 1997; pp. 1–100. [Google Scholar]
- Lederman, S.J. Tactile roughness of grooved surfaces: The touching process and effects of macro- and microsurface structure. Perception & Psychophysics 1974, 16, 385–395. [Google Scholar]
- Cunningham, D.W.; Wallraven, C. Experimental Design: From User Studies to Psychophysics, 1st ed.; CRC Press: Florida, USA, 2012; pp. 101–120. [Google Scholar]
- Bolanowski, S.J.; Gescheider, G.A.; Verrillo, R.T.; Checkosky, C.M. Four channels mediate the mechanical aspects of touch. Journal of Acoustical Society of America 1988, 84, 1680–1694. [Google Scholar] [CrossRef]
- Choi, D.S.; Kim, S.Y. ; Transparent Film-Type Vibrotactile Array and Its Haptic Rendering Using Beat Phenomenon, Sensors 2019, 19, 3490.
- Kim, U.; Kang, J.; Lee, C.; Kwon, H.Y.; Hwang, S.; Moon, H.; Koo, J.C.; Nam, J.D.; Hong, B.H.; Choi, J.B.; Choi, H.R. A transparent and stretchable graphene-based actuator for tactile display. Nanotechnology 2013, 24, 145501. [Google Scholar] [CrossRef]
Figure 1.
Scaled versions of actuator-configurations: (a) A/B Configuration; (b) Array Configuration.
Figure 1.
Scaled versions of actuator-configurations: (a) A/B Configuration; (b) Array Configuration.
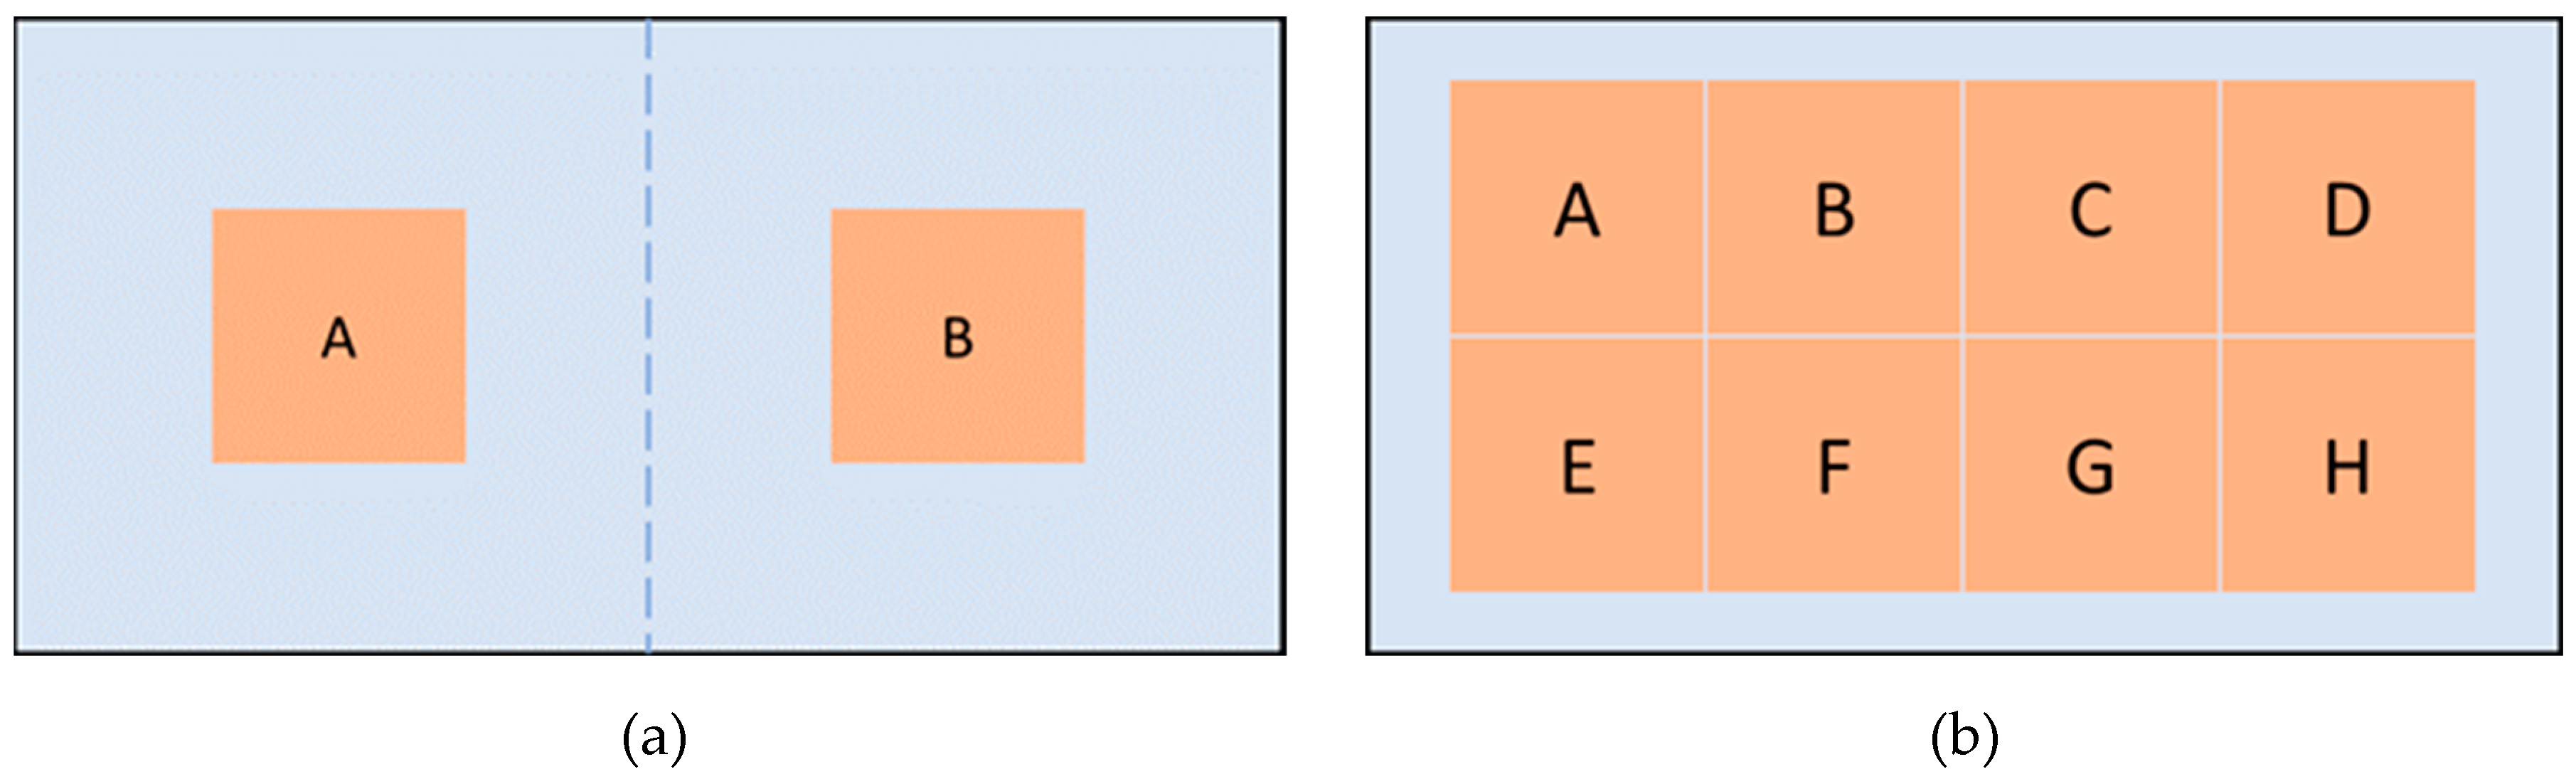
Figure 2.
Tensor directions for defining constitutive relations.
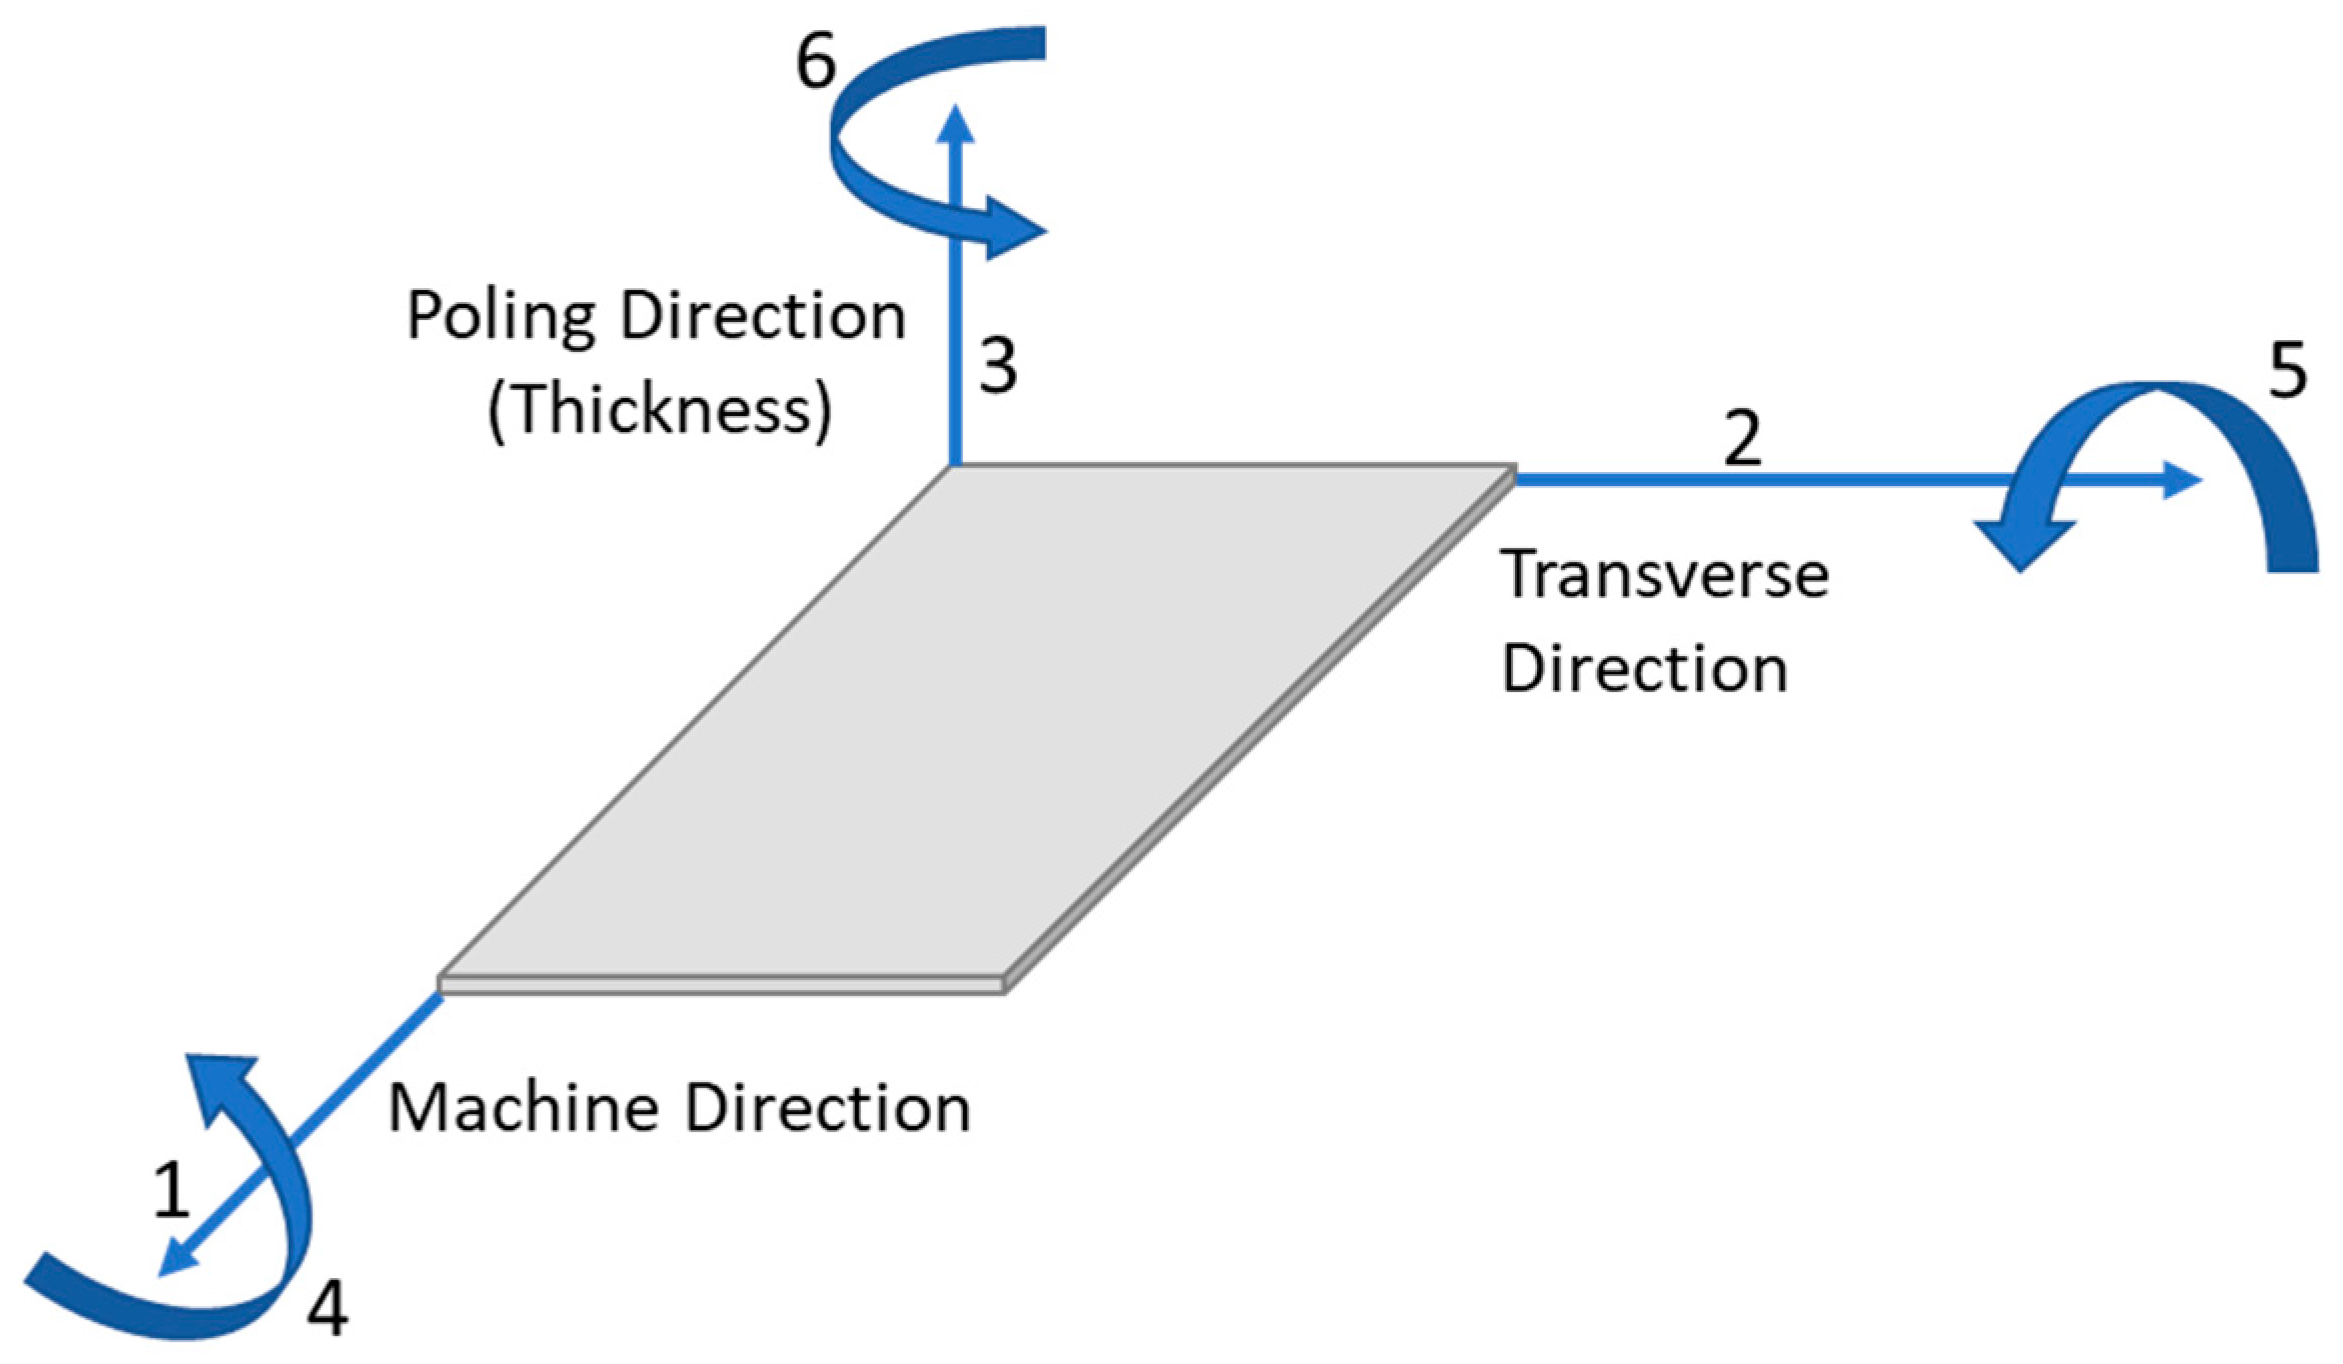
Figure 3.
First 3 mode shape of the structure: (a) Mode shape at ωn1; (b) Mode shape at ωn2; (c) Mode shape at ωn3.
Figure 3.
First 3 mode shape of the structure: (a) Mode shape at ωn1; (b) Mode shape at ωn2; (c) Mode shape at ωn3.
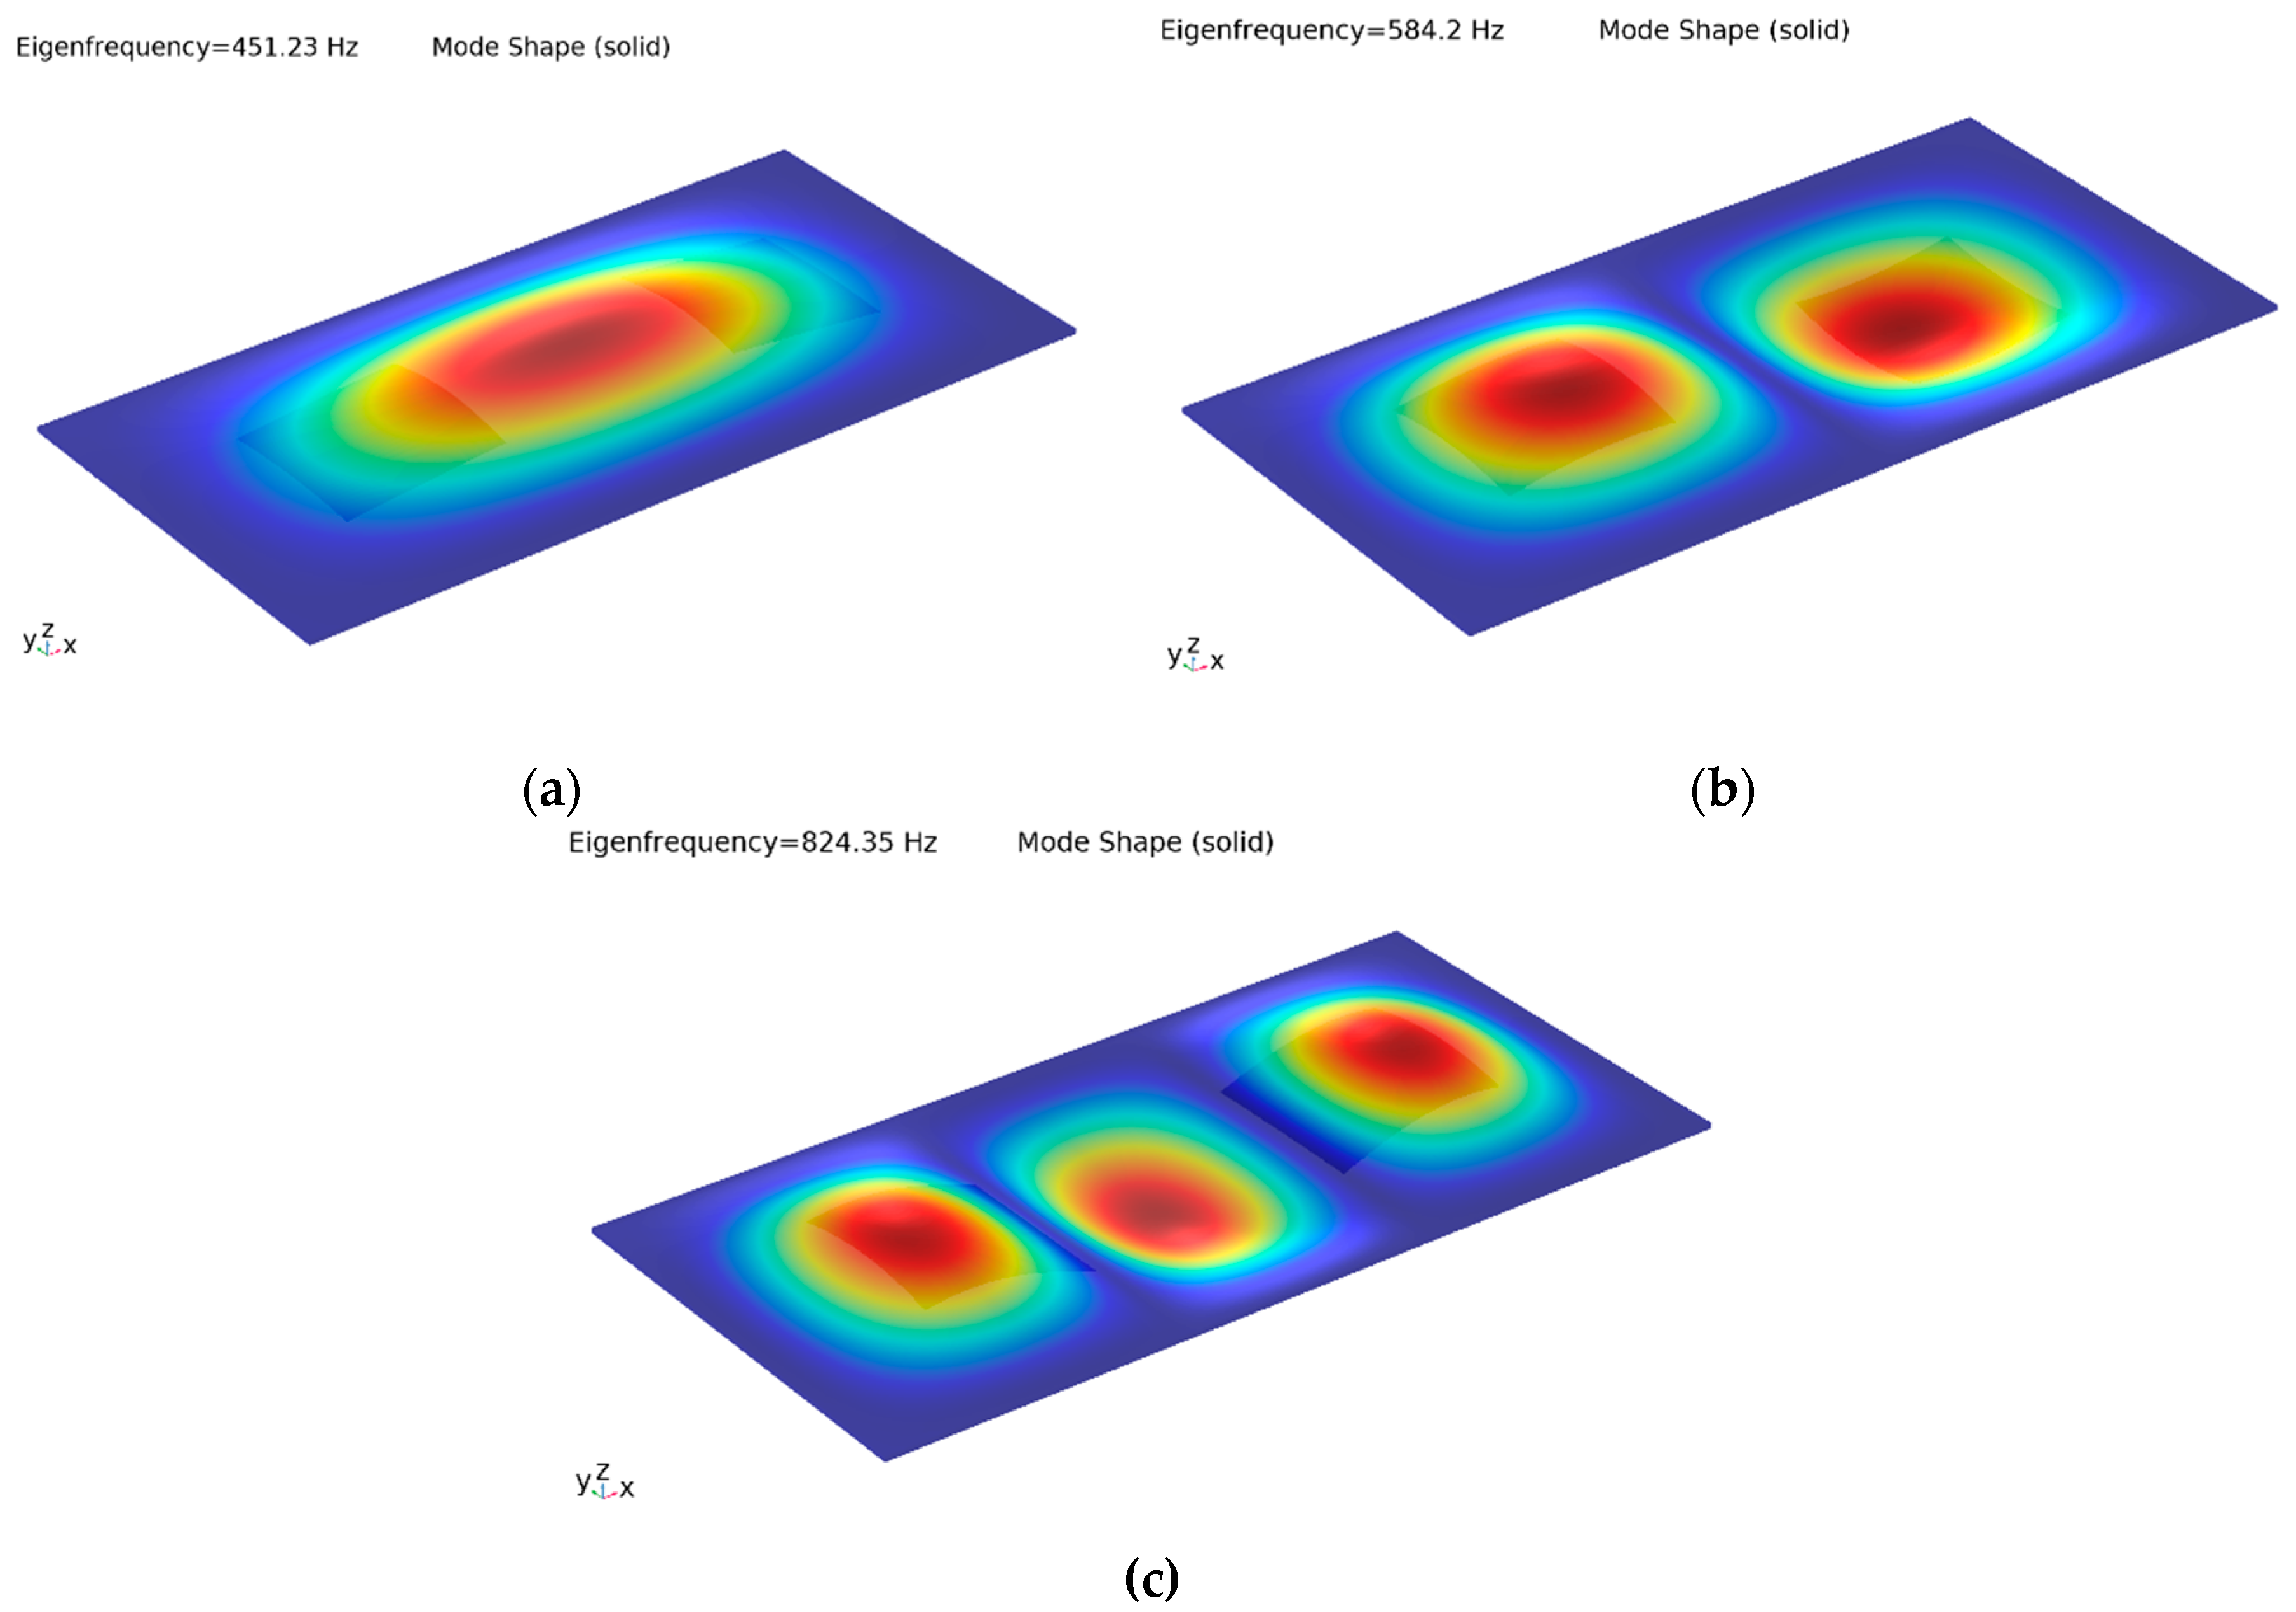
Figure 4.
Forced vibration analysis outputs: (a) Only the left actuator is excited at 137 Hz; (b) Only the right actuator is excited at 137 Hz; (c) Only the left actuator is excited at 178 Hz; (d) Only the left actuator is actuated at 230 Hz; (e) Only the left actuator is excited at 300 Hz; (f) Only the left actuator is excited at 390 Hz.
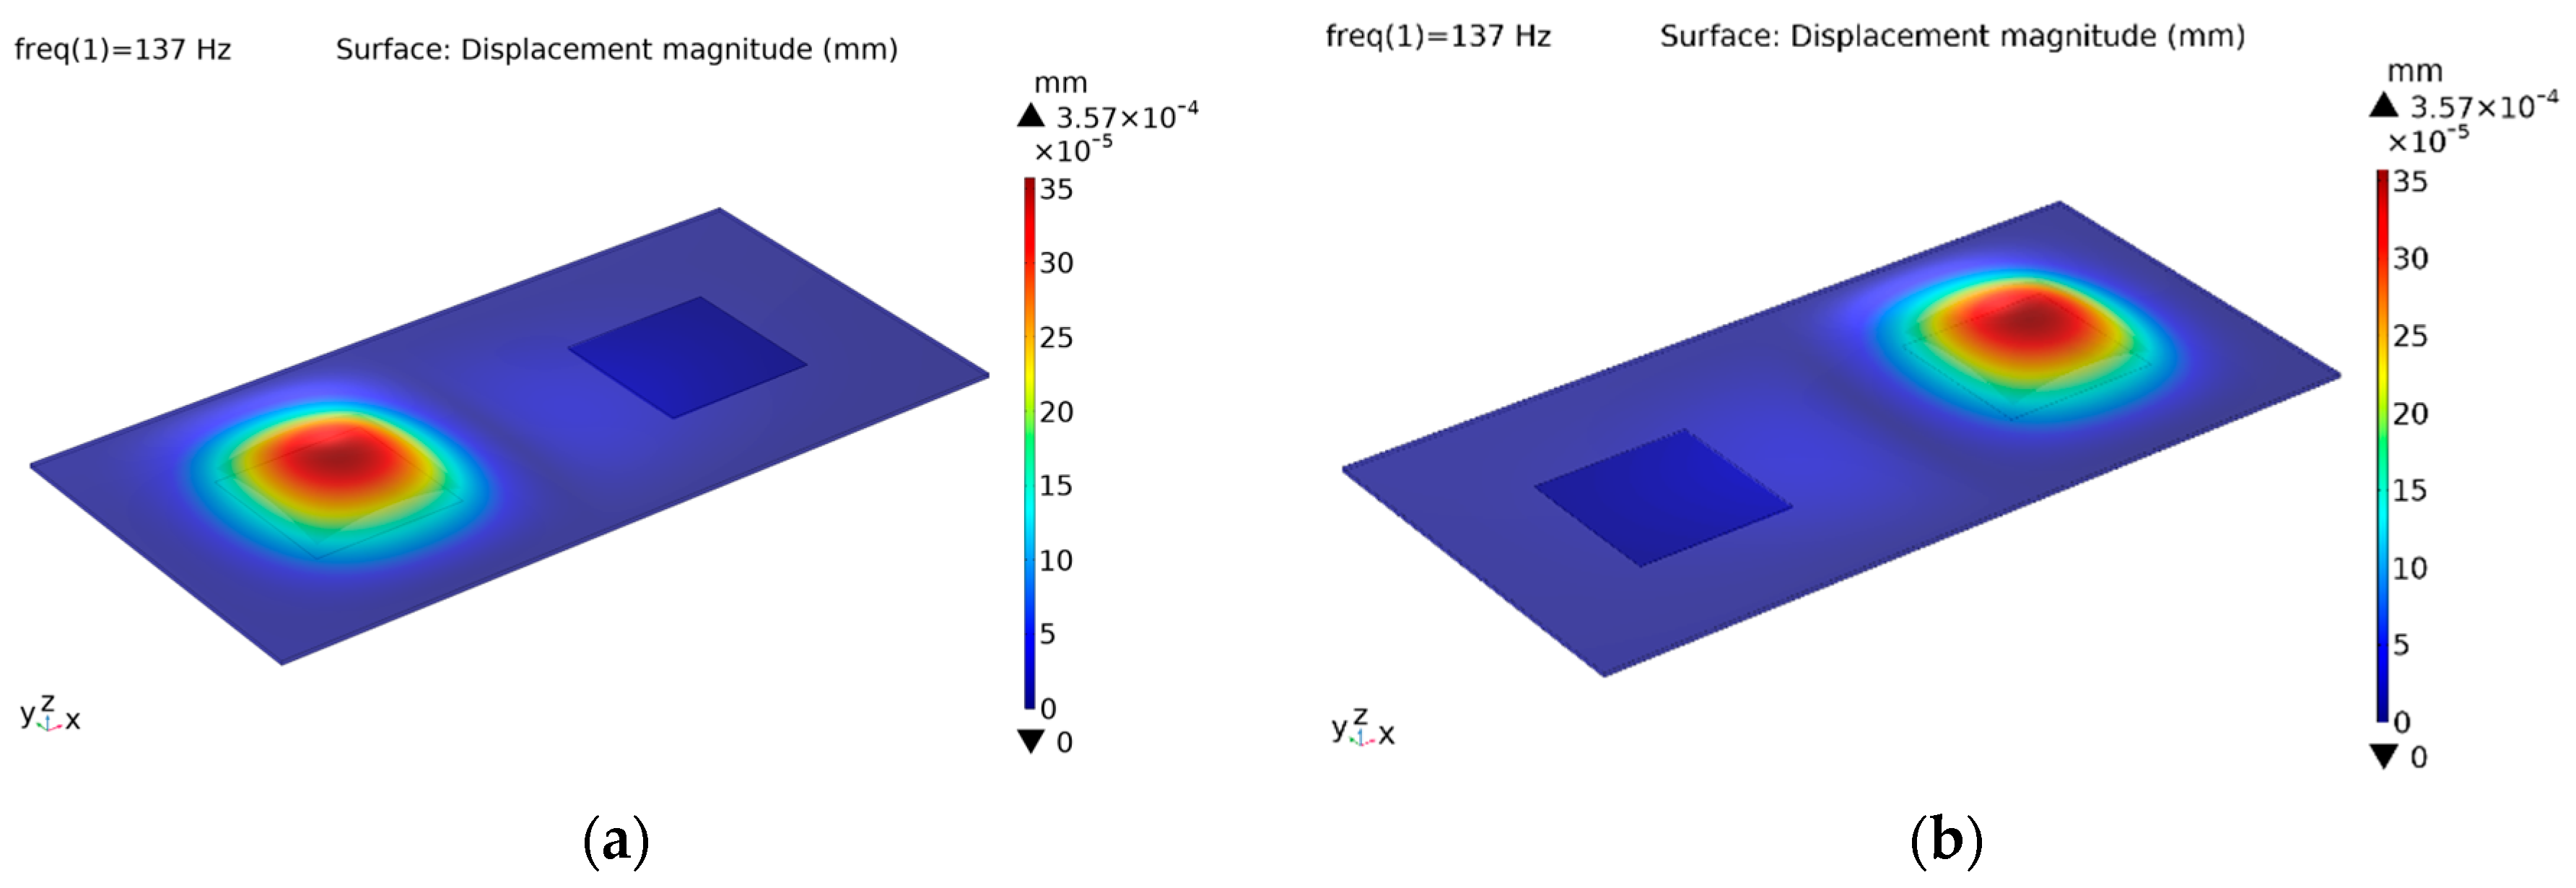
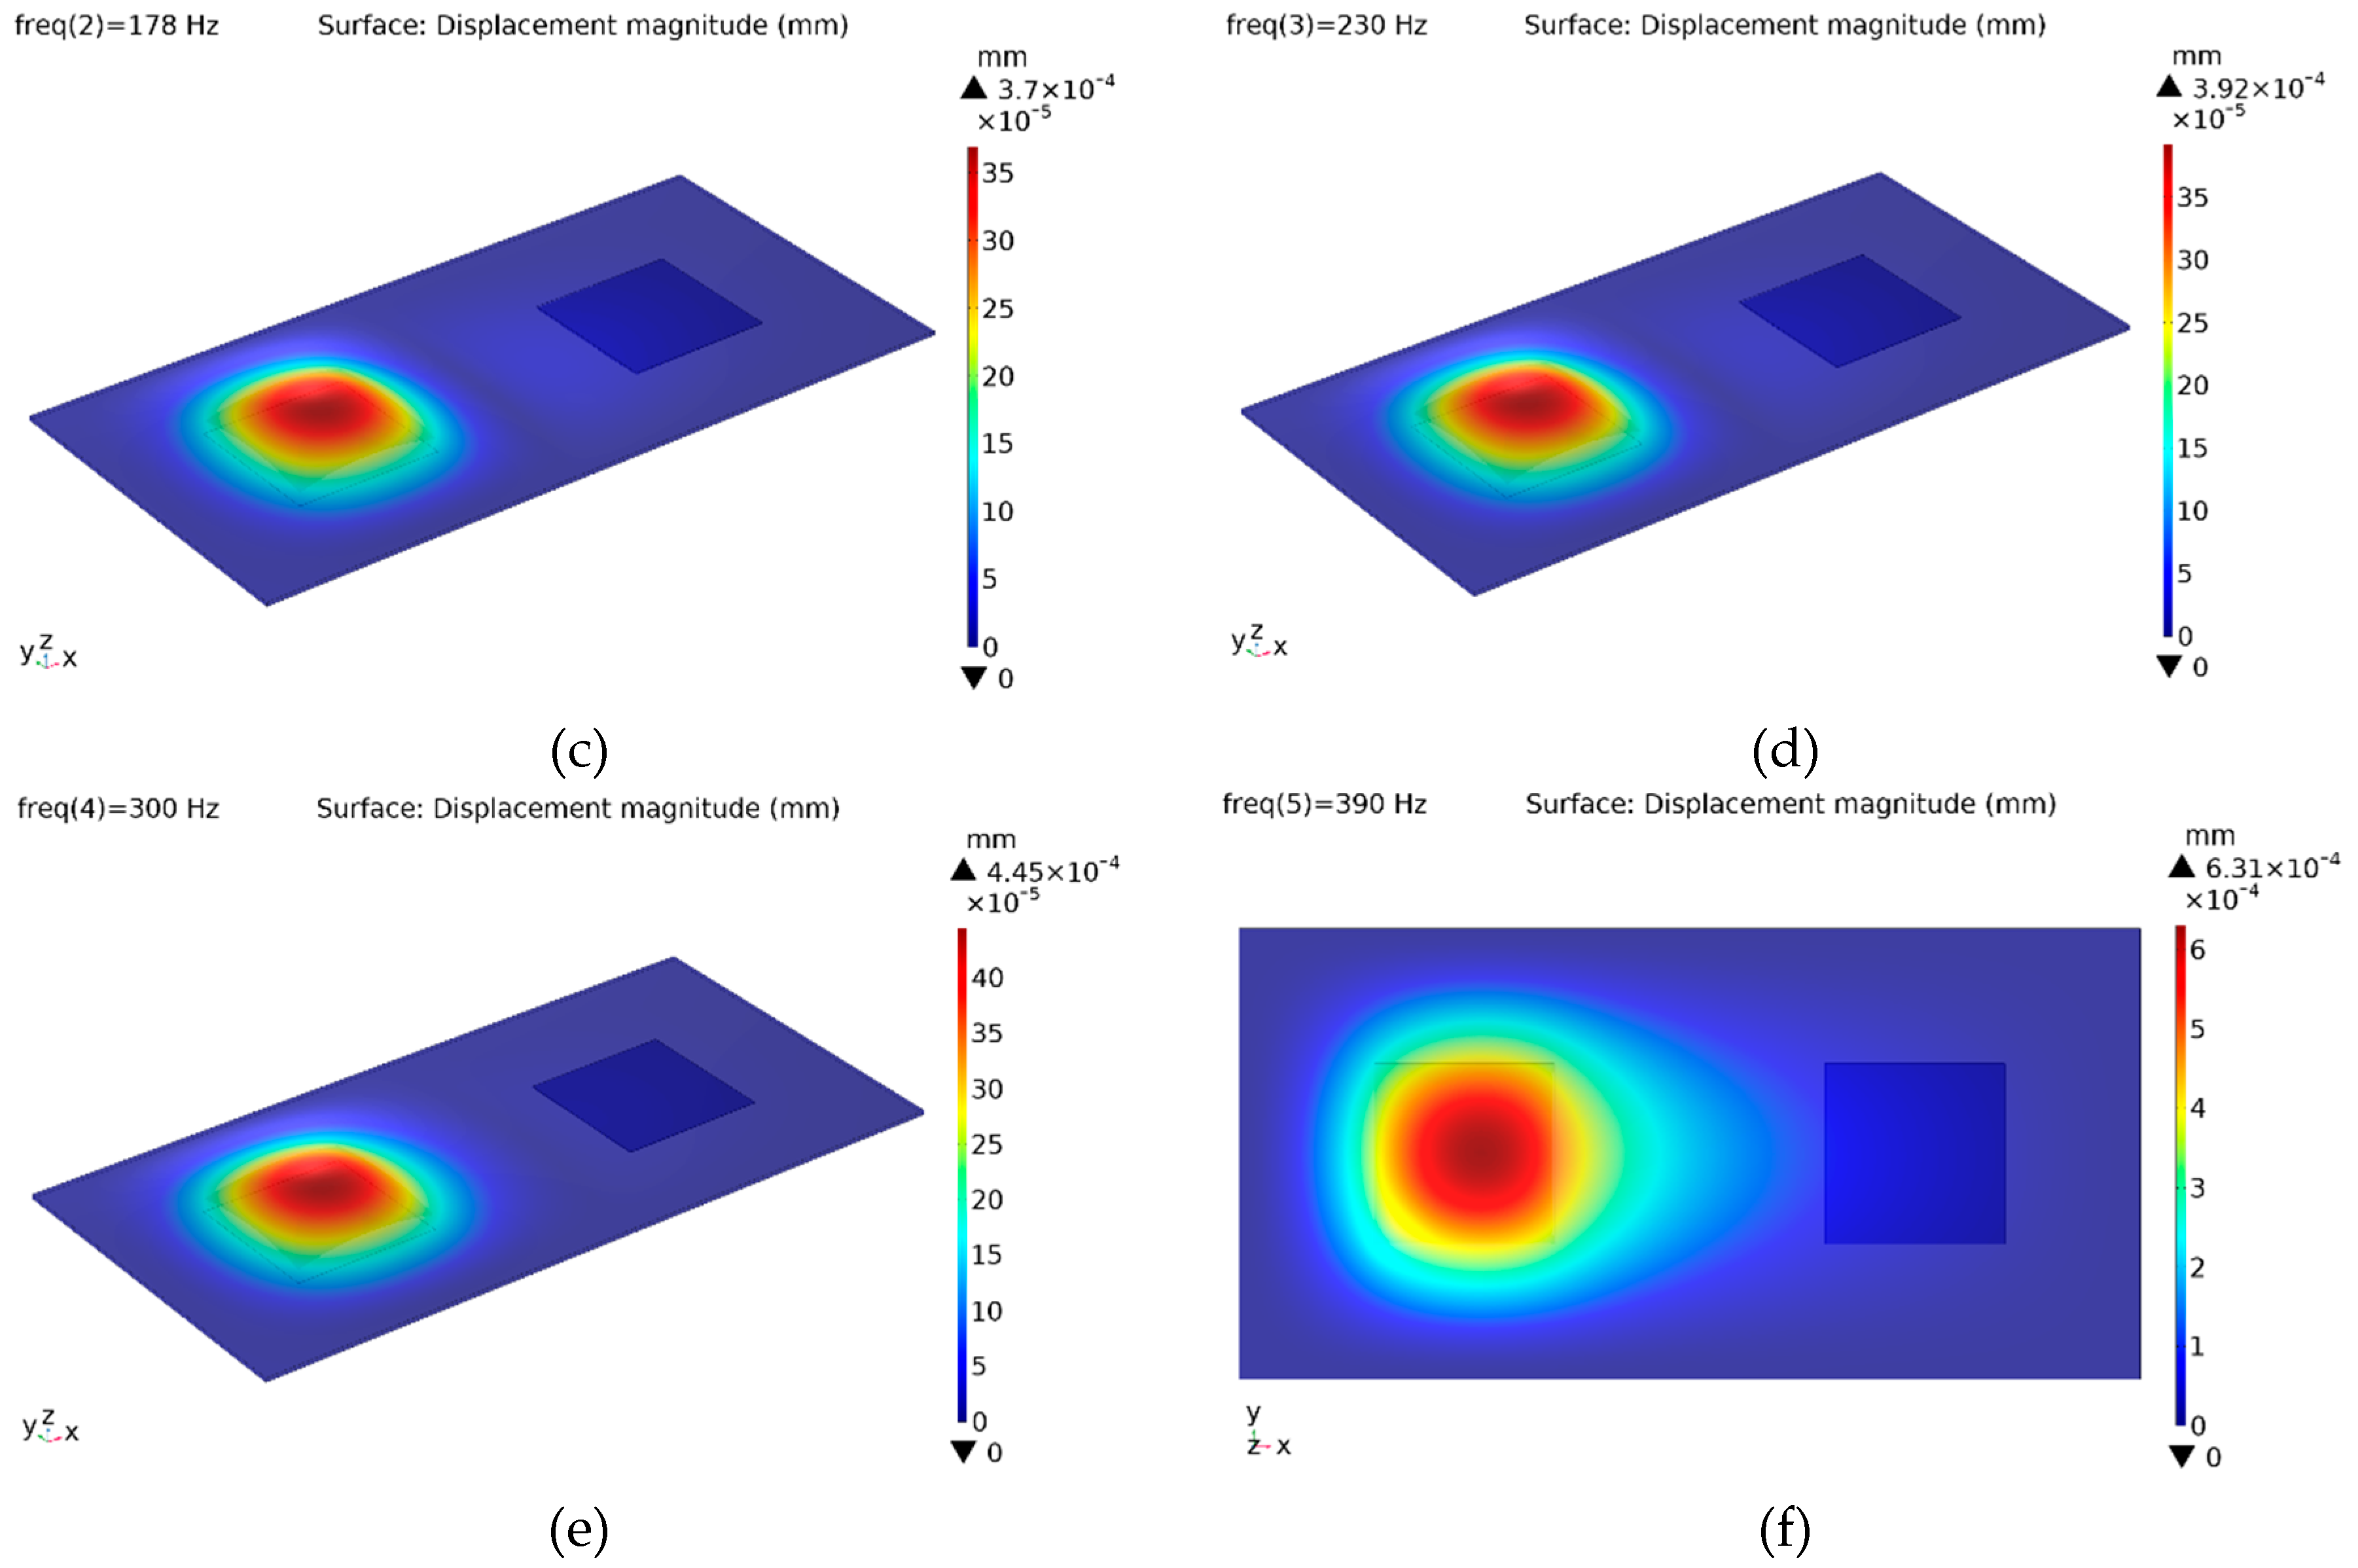
Figure 5.
Forced vibration analysis outputs show localized vibration patterns on corresponding locations: (a) Only actuator A is excited. (b) Only actuator B is excited.
Figure 5.
Forced vibration analysis outputs show localized vibration patterns on corresponding locations: (a) Only actuator A is excited. (b) Only actuator B is excited.
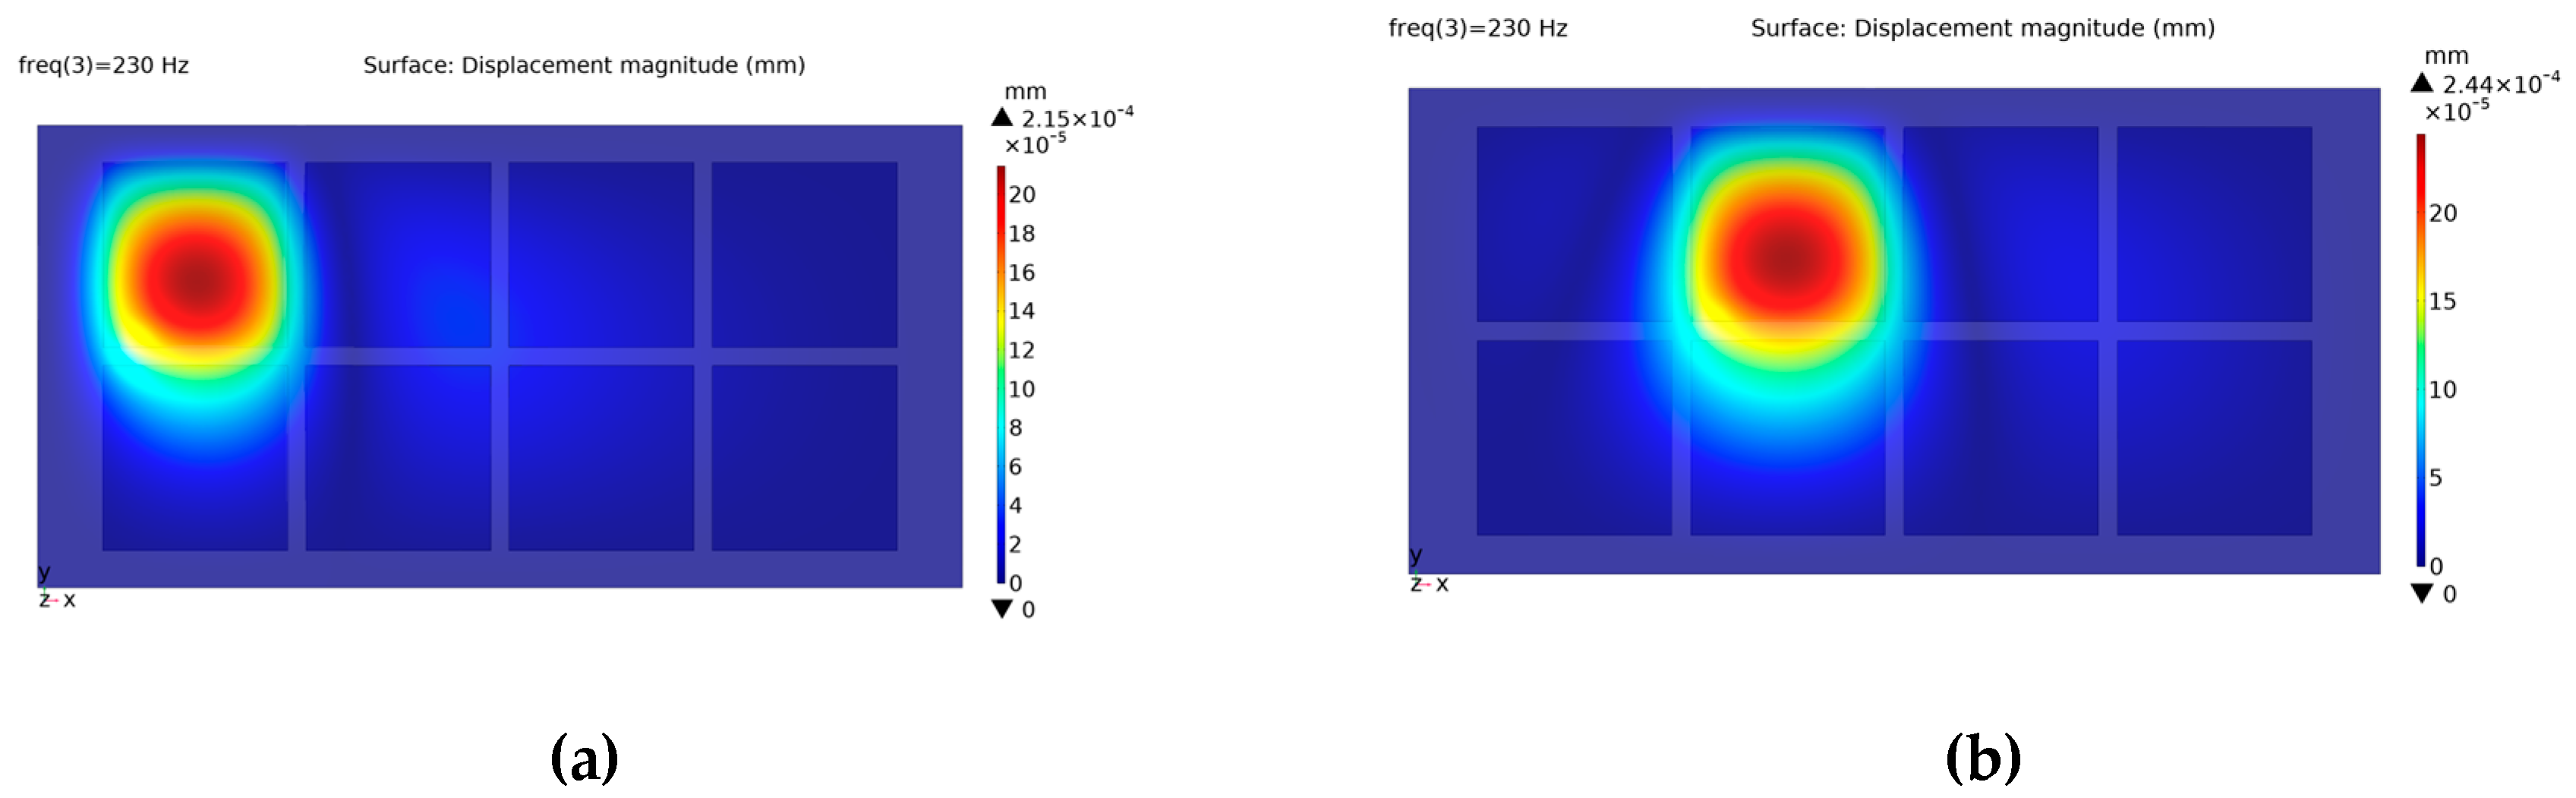
Figure 6.
Haptic touch interface designed for the first experiment.
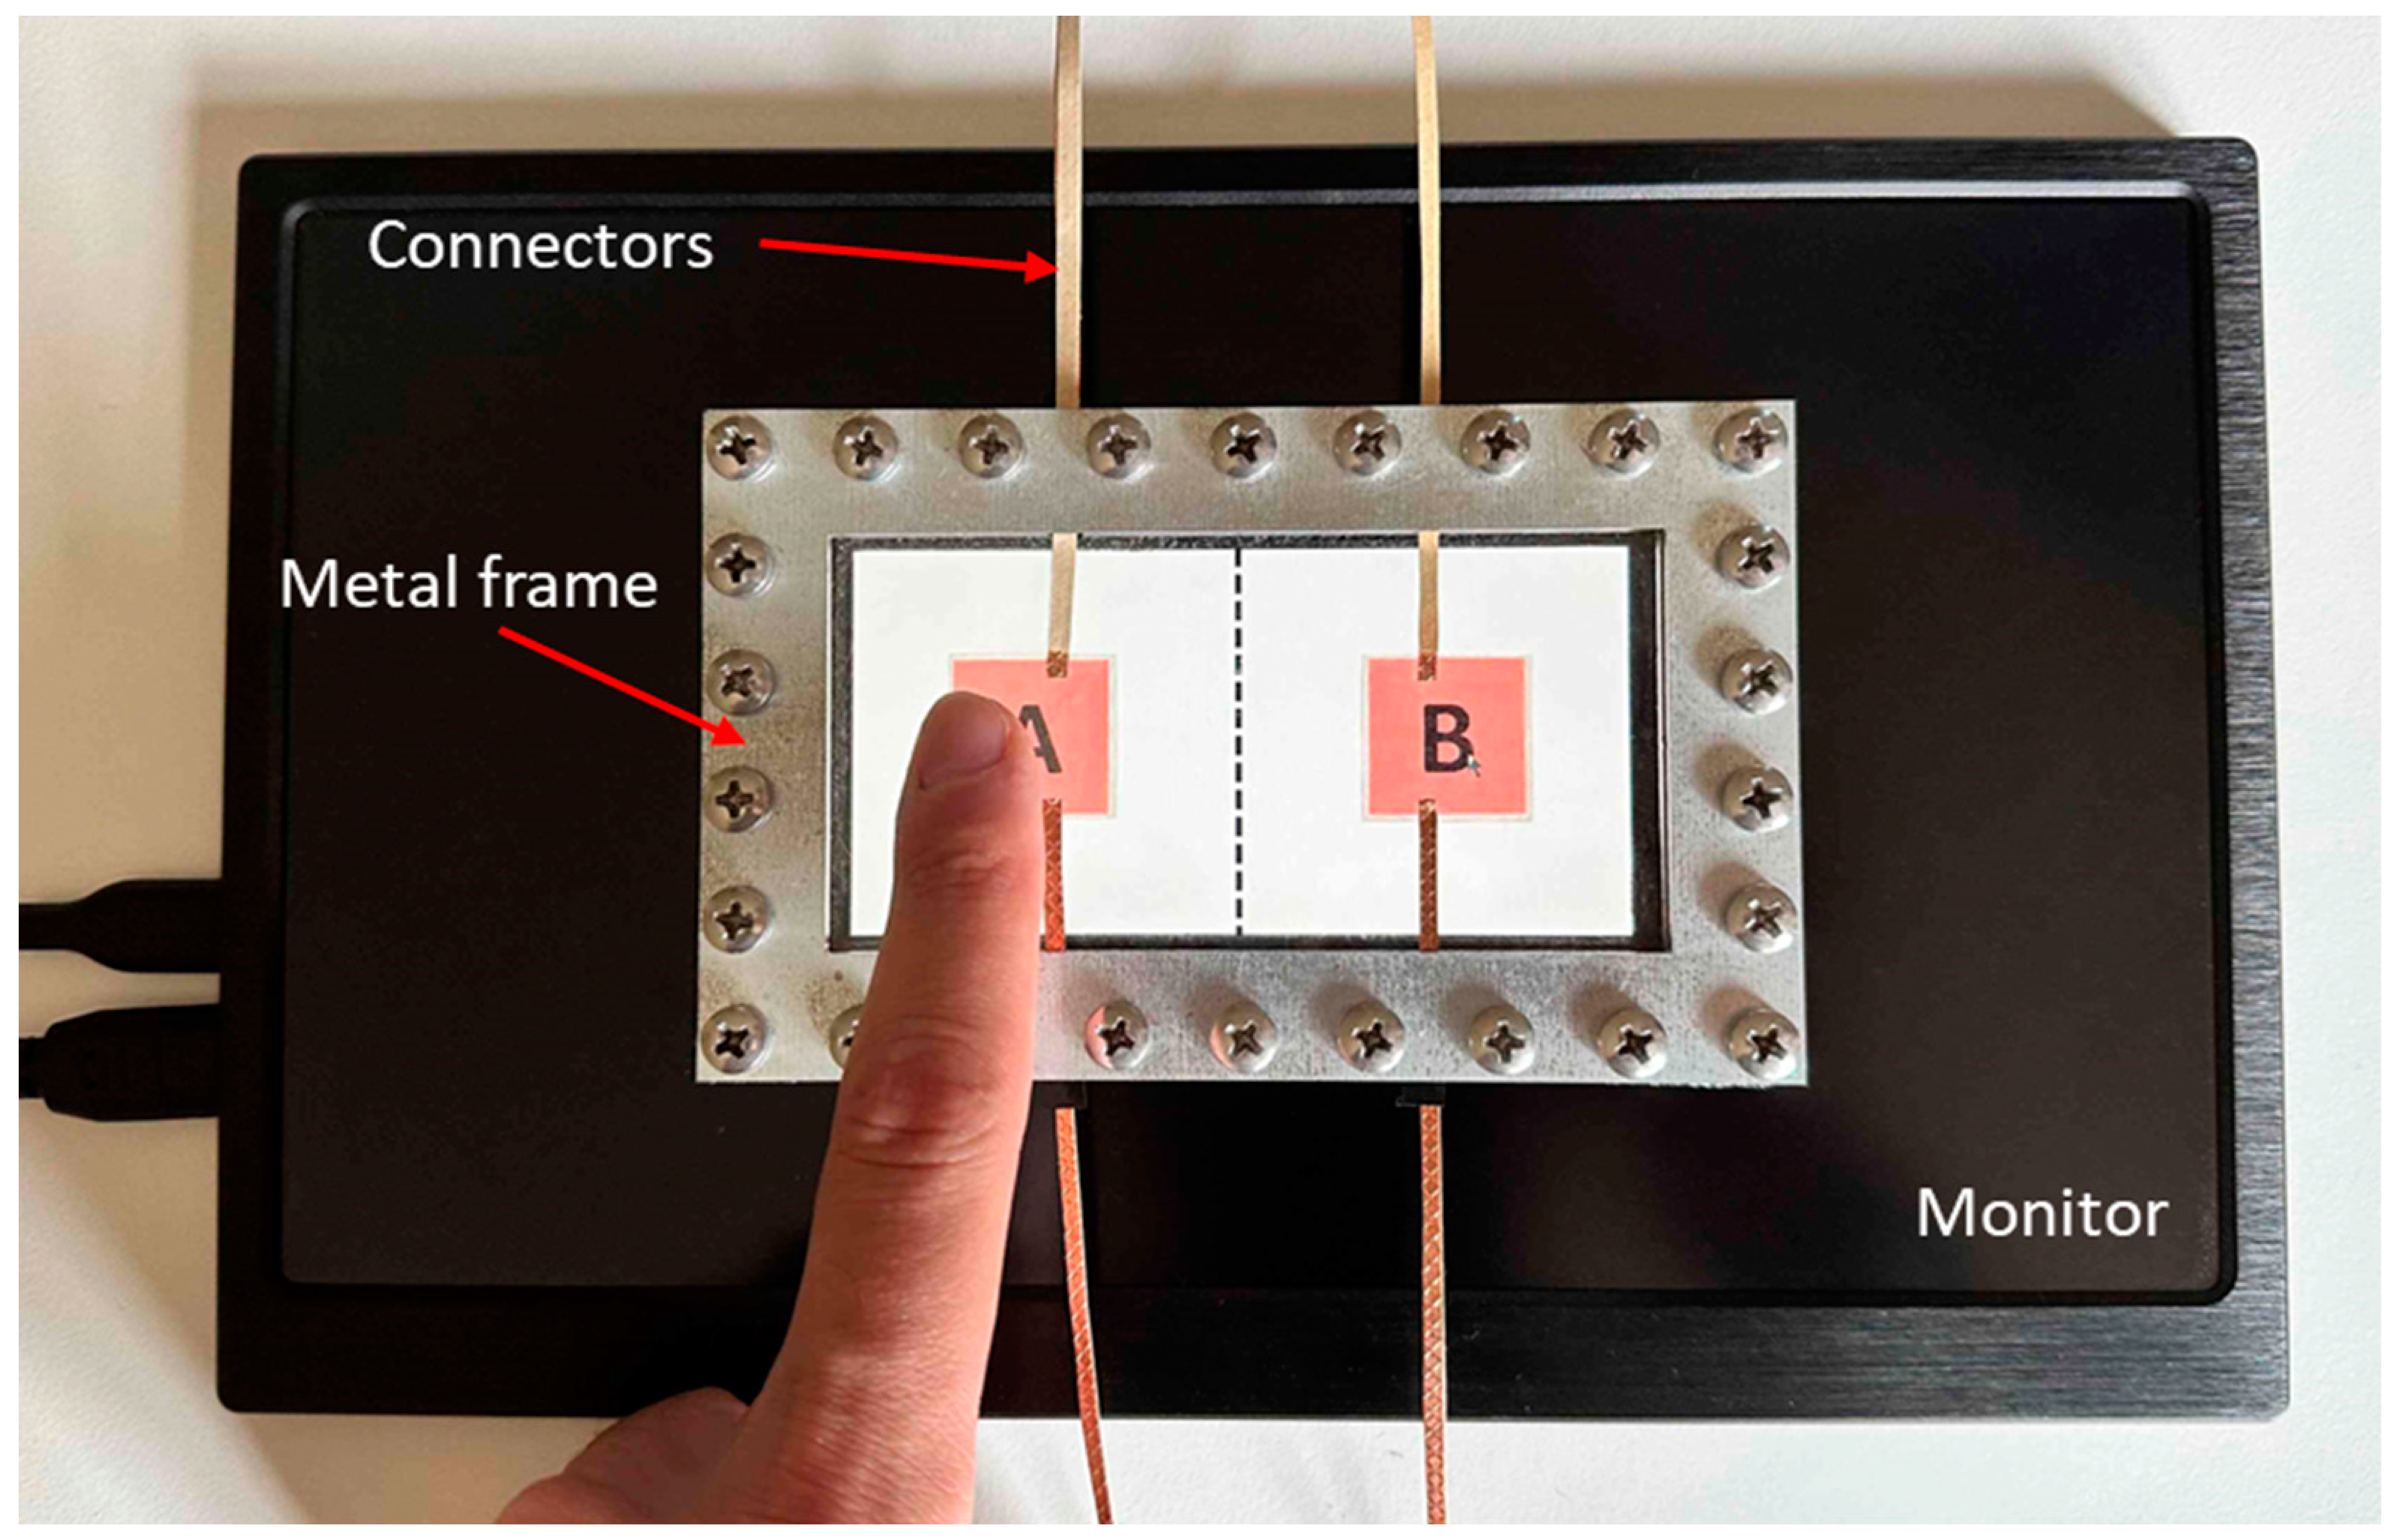
Figure 7.
Haptic touch interface designed for the second experiment.
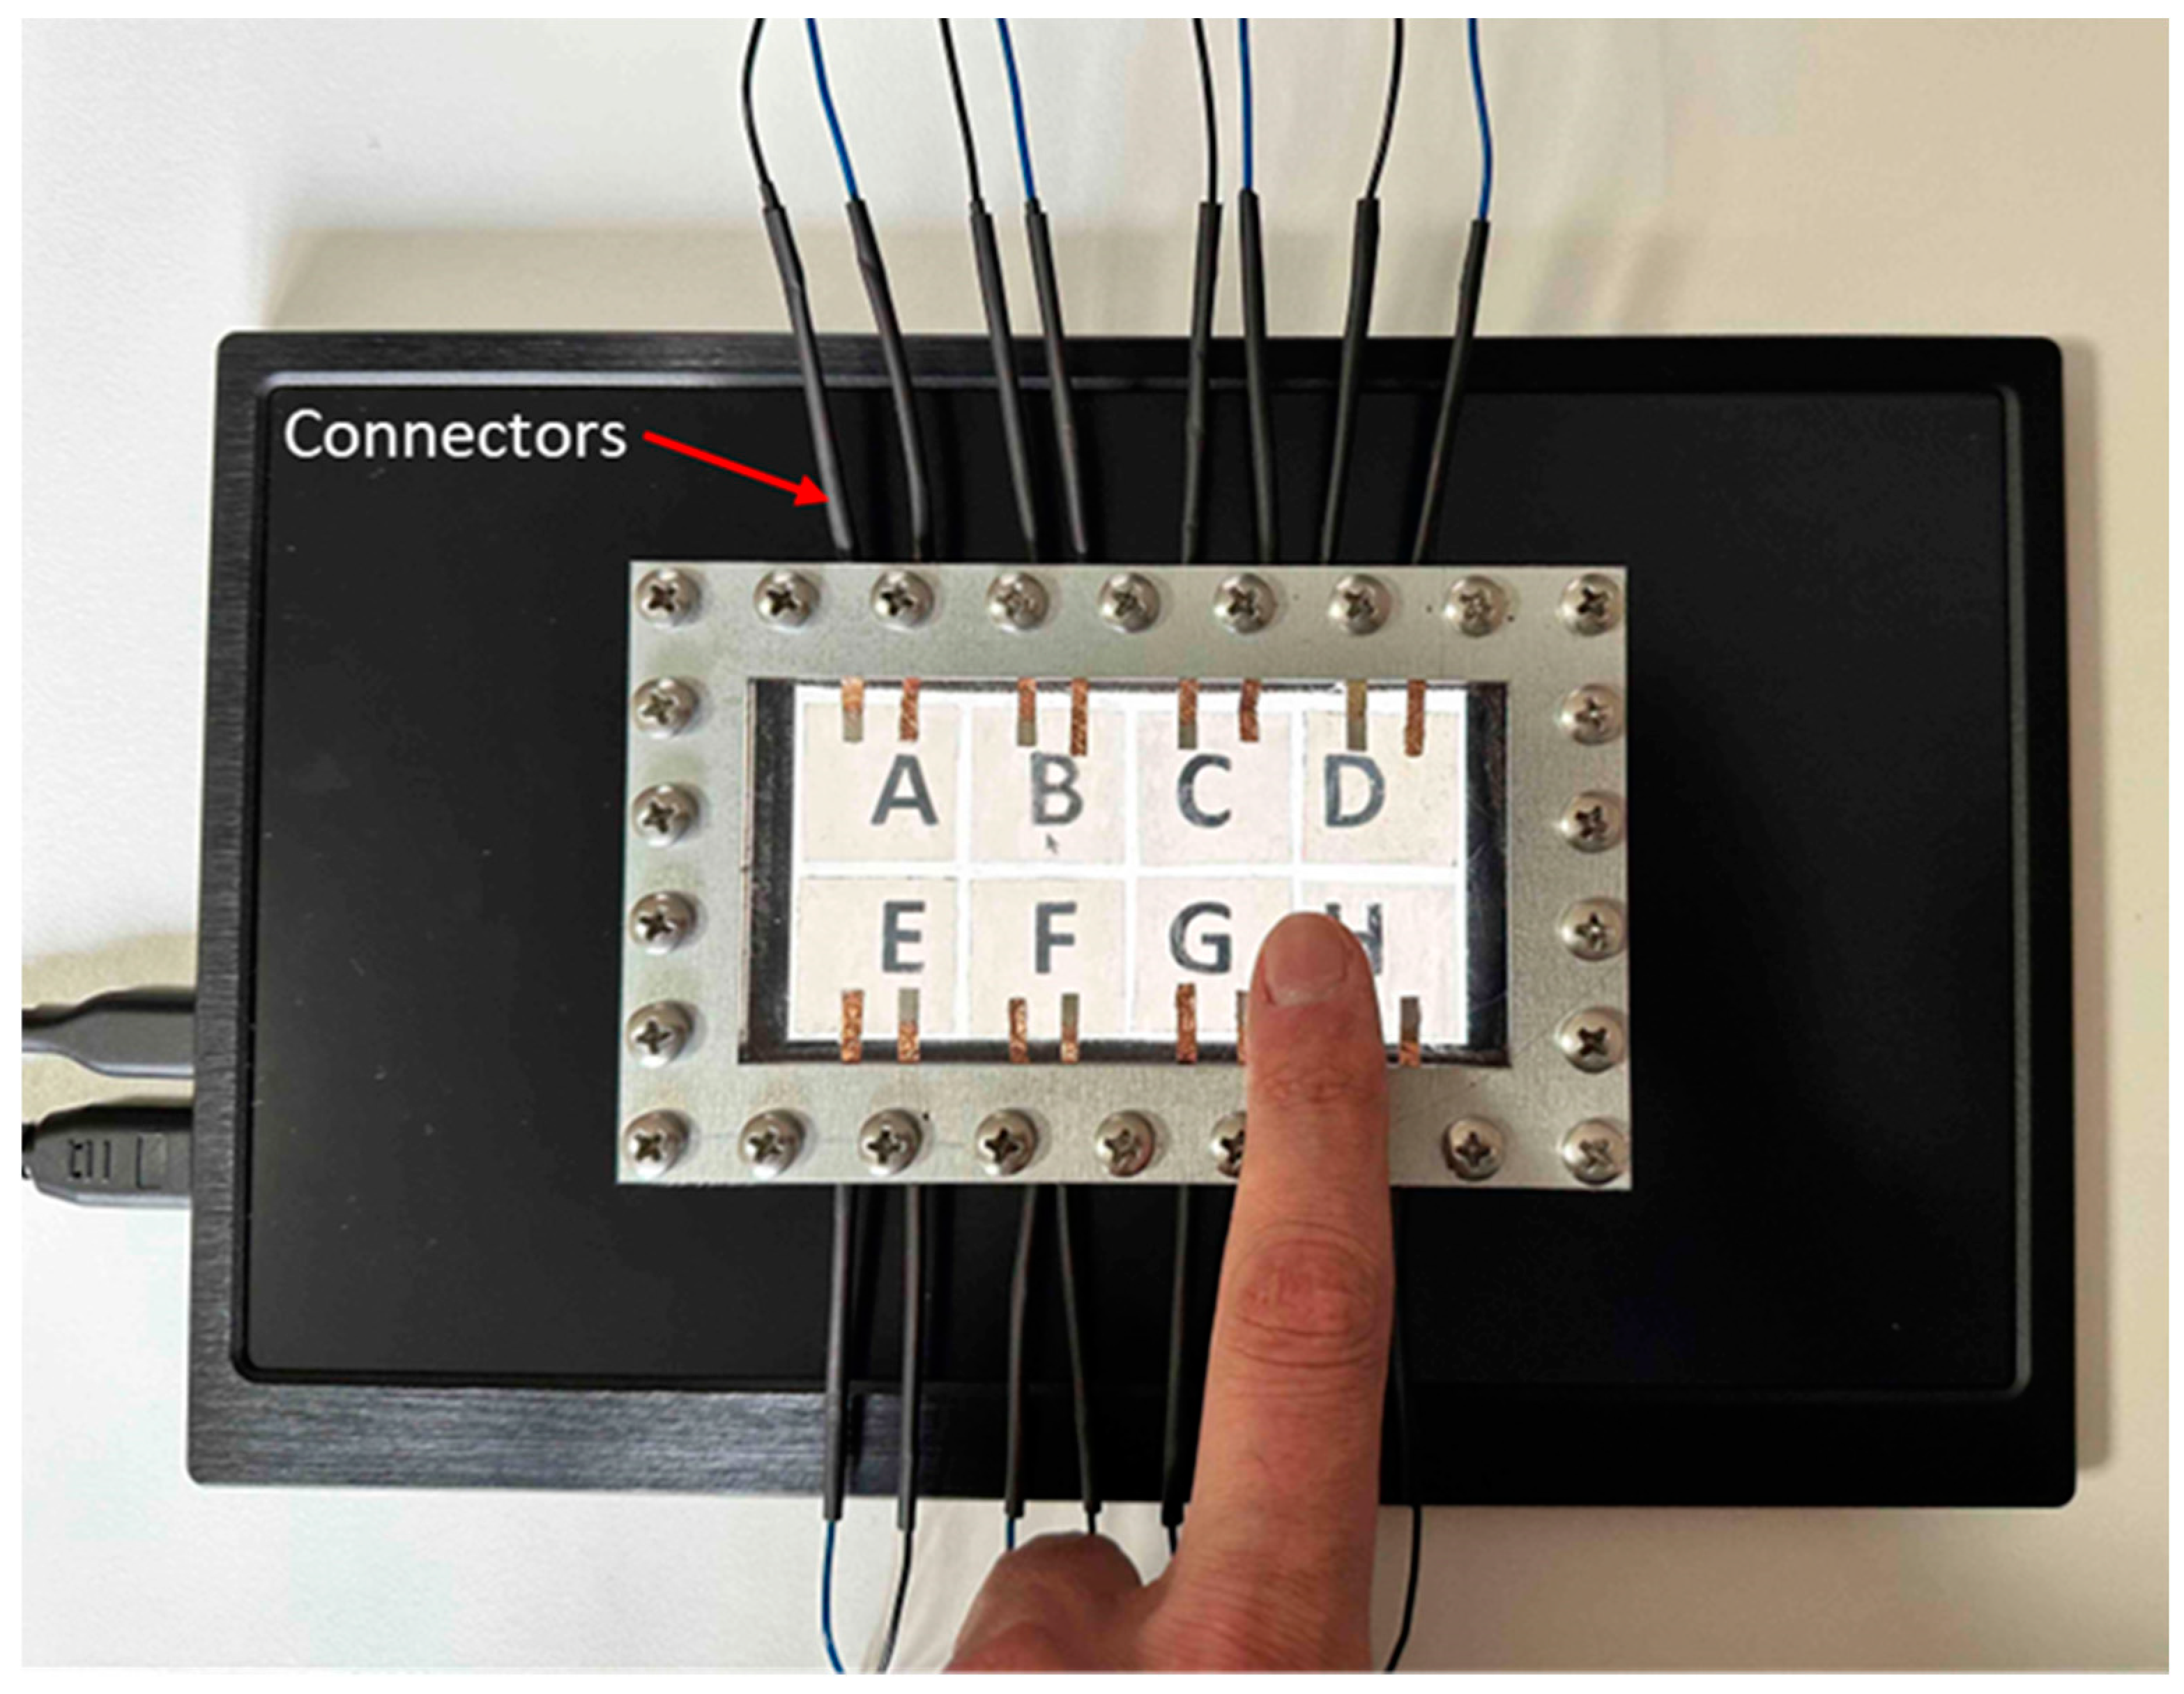
Figure 8.
Generated vibration displacements at 230 Hz with two different configurations.
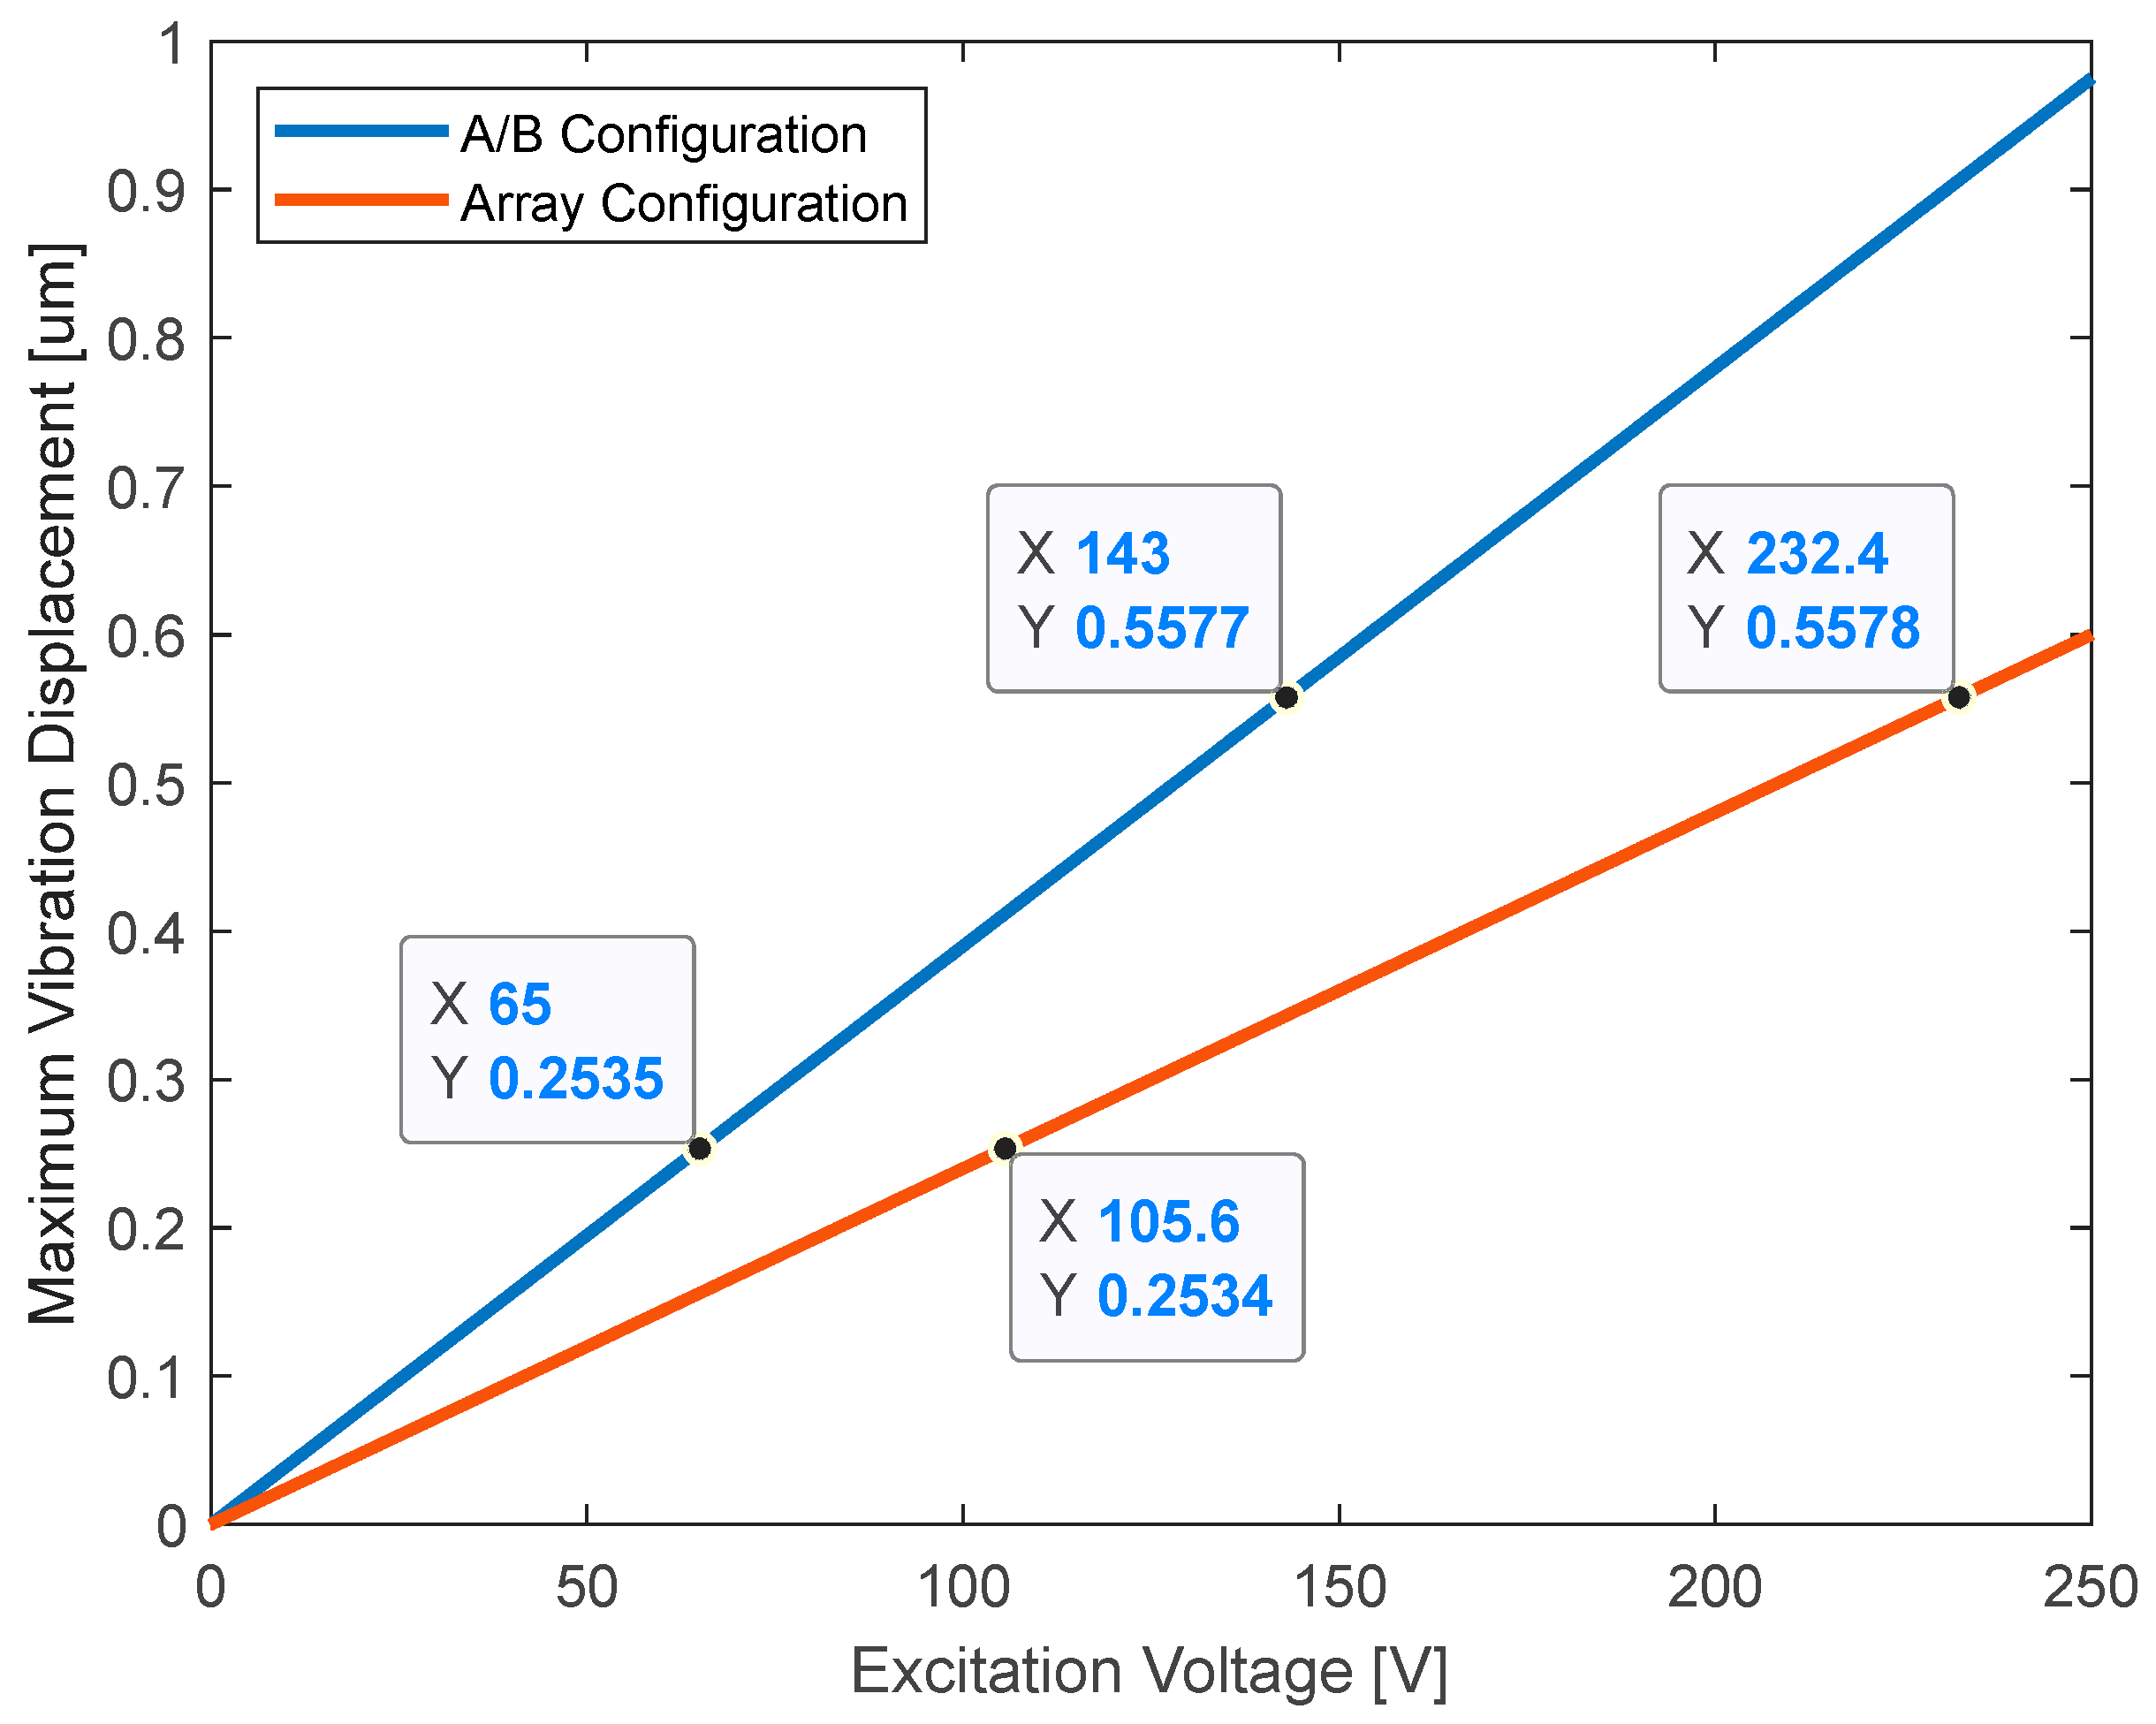
Figure 9.
Psychometric curves obtained in A/B configuration.
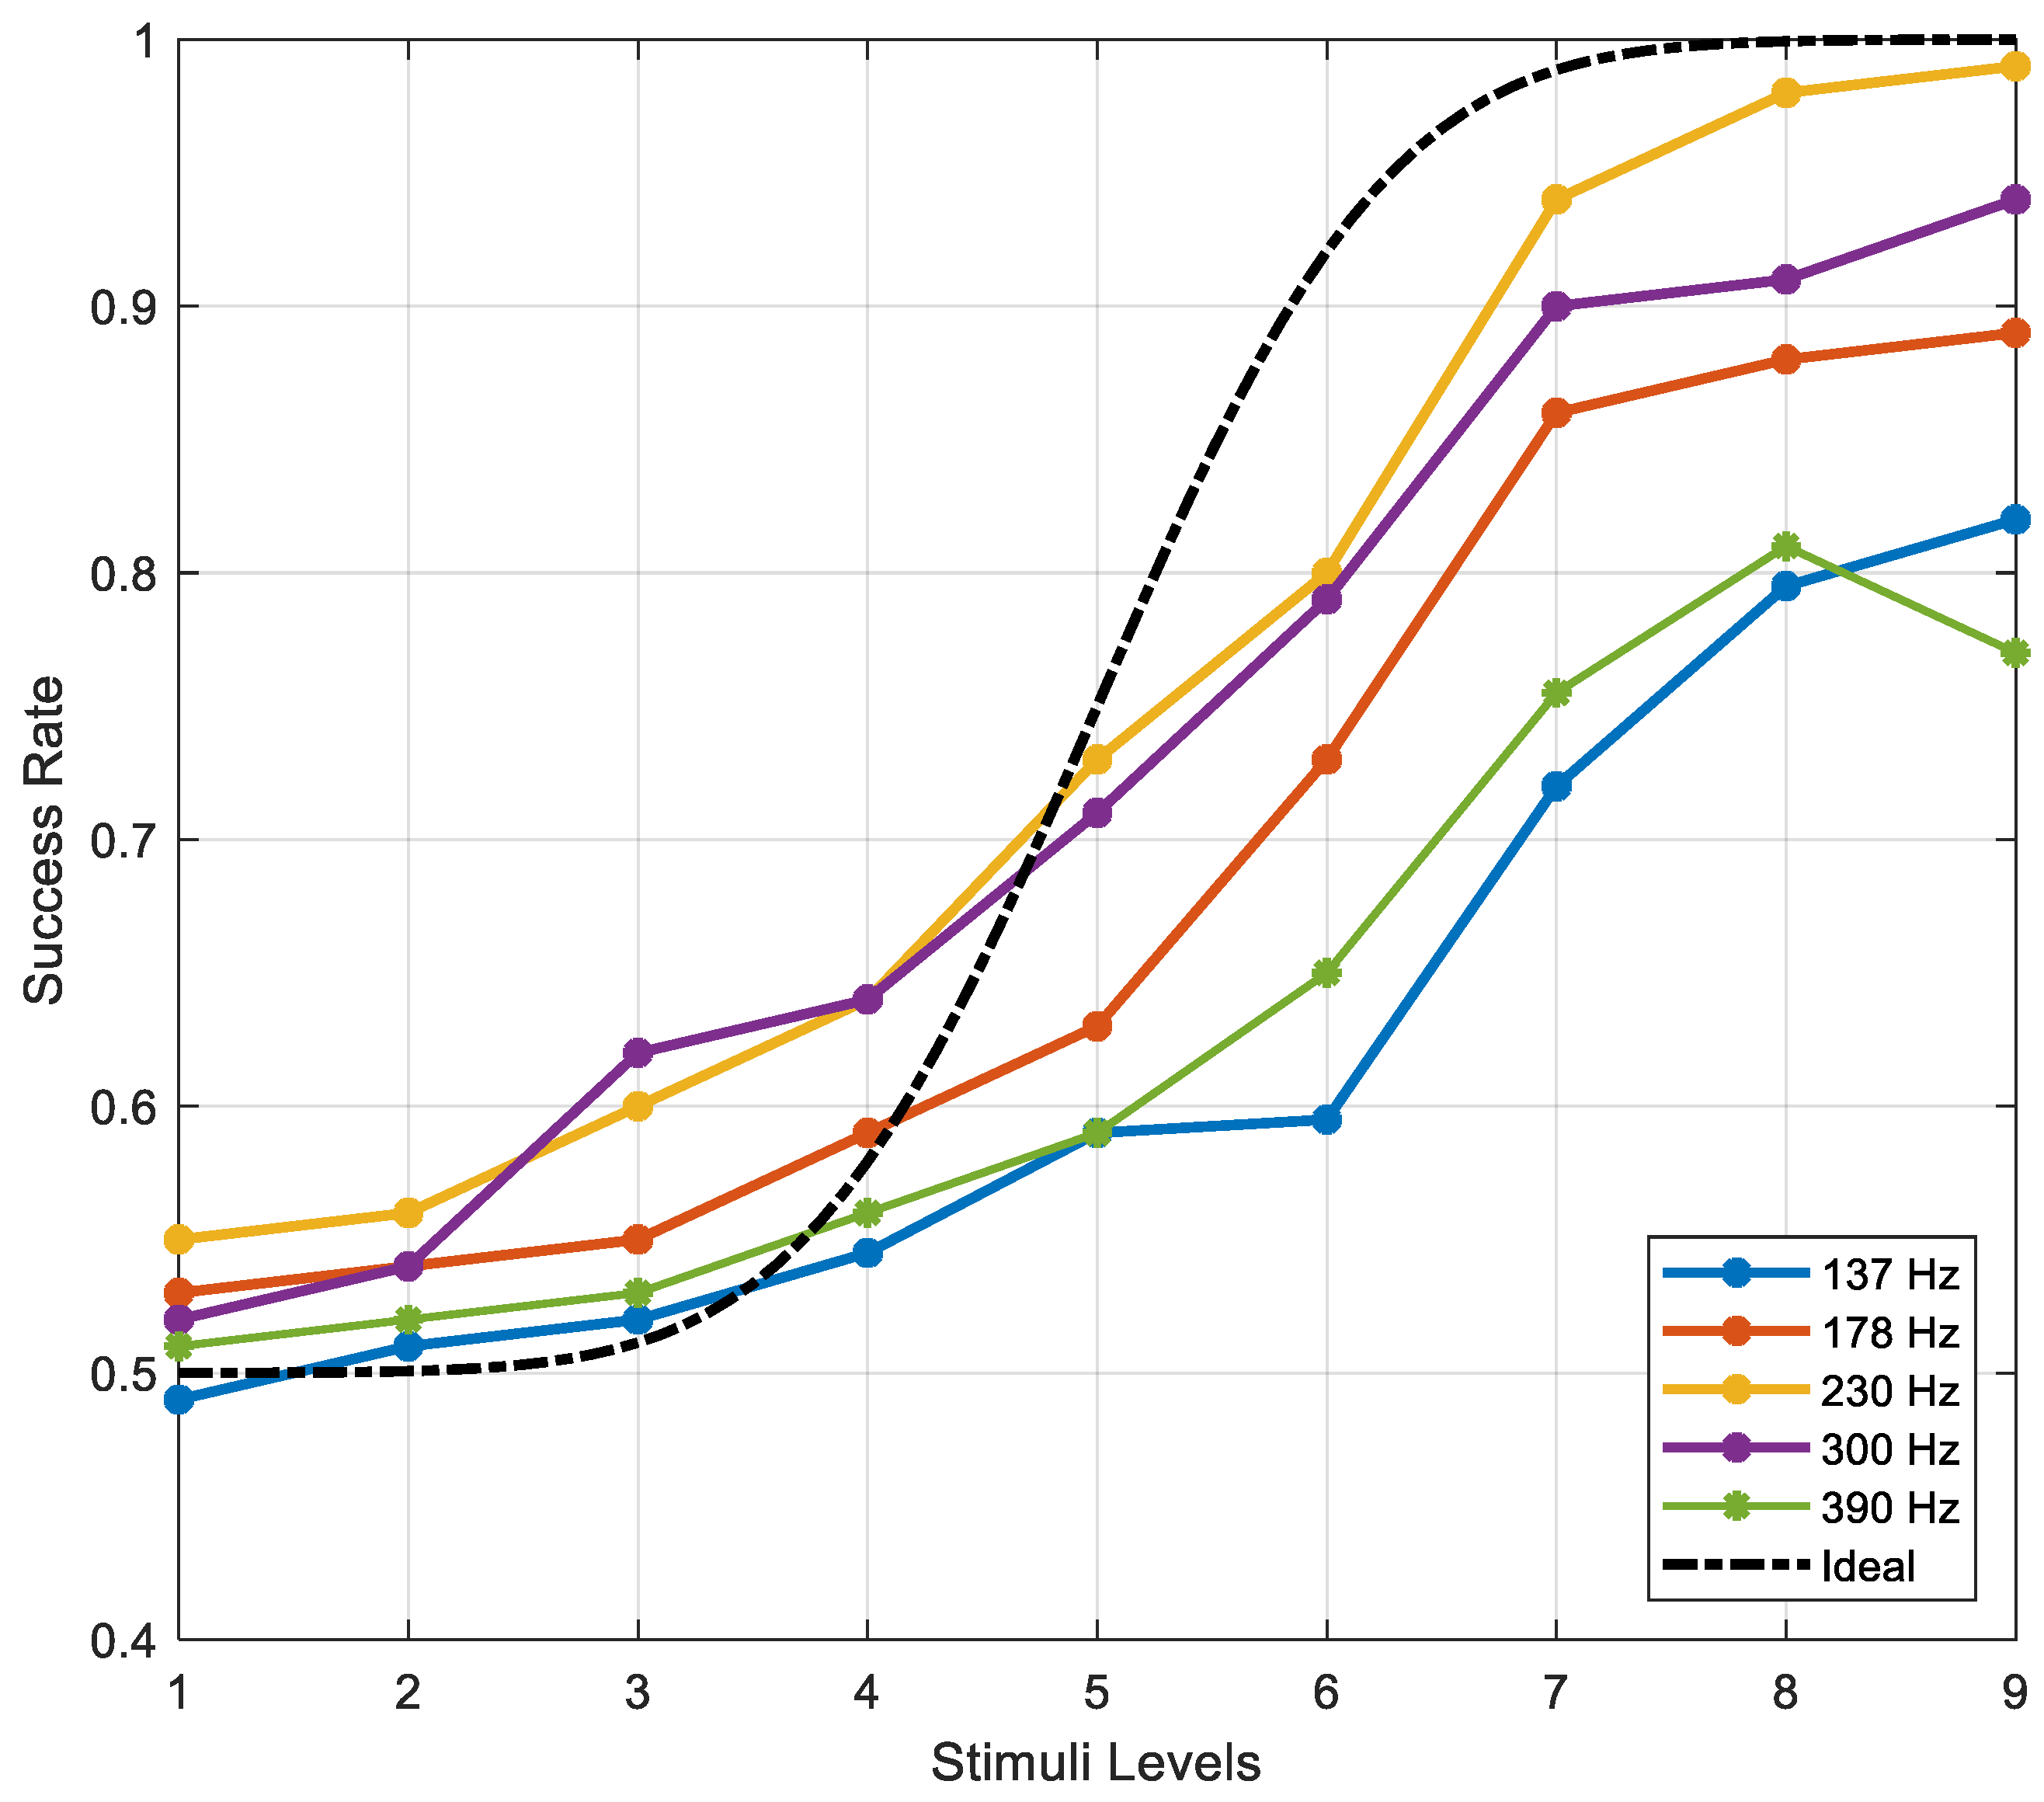
Figure 10.
Variation of mean detection thresholds with different frequencies.
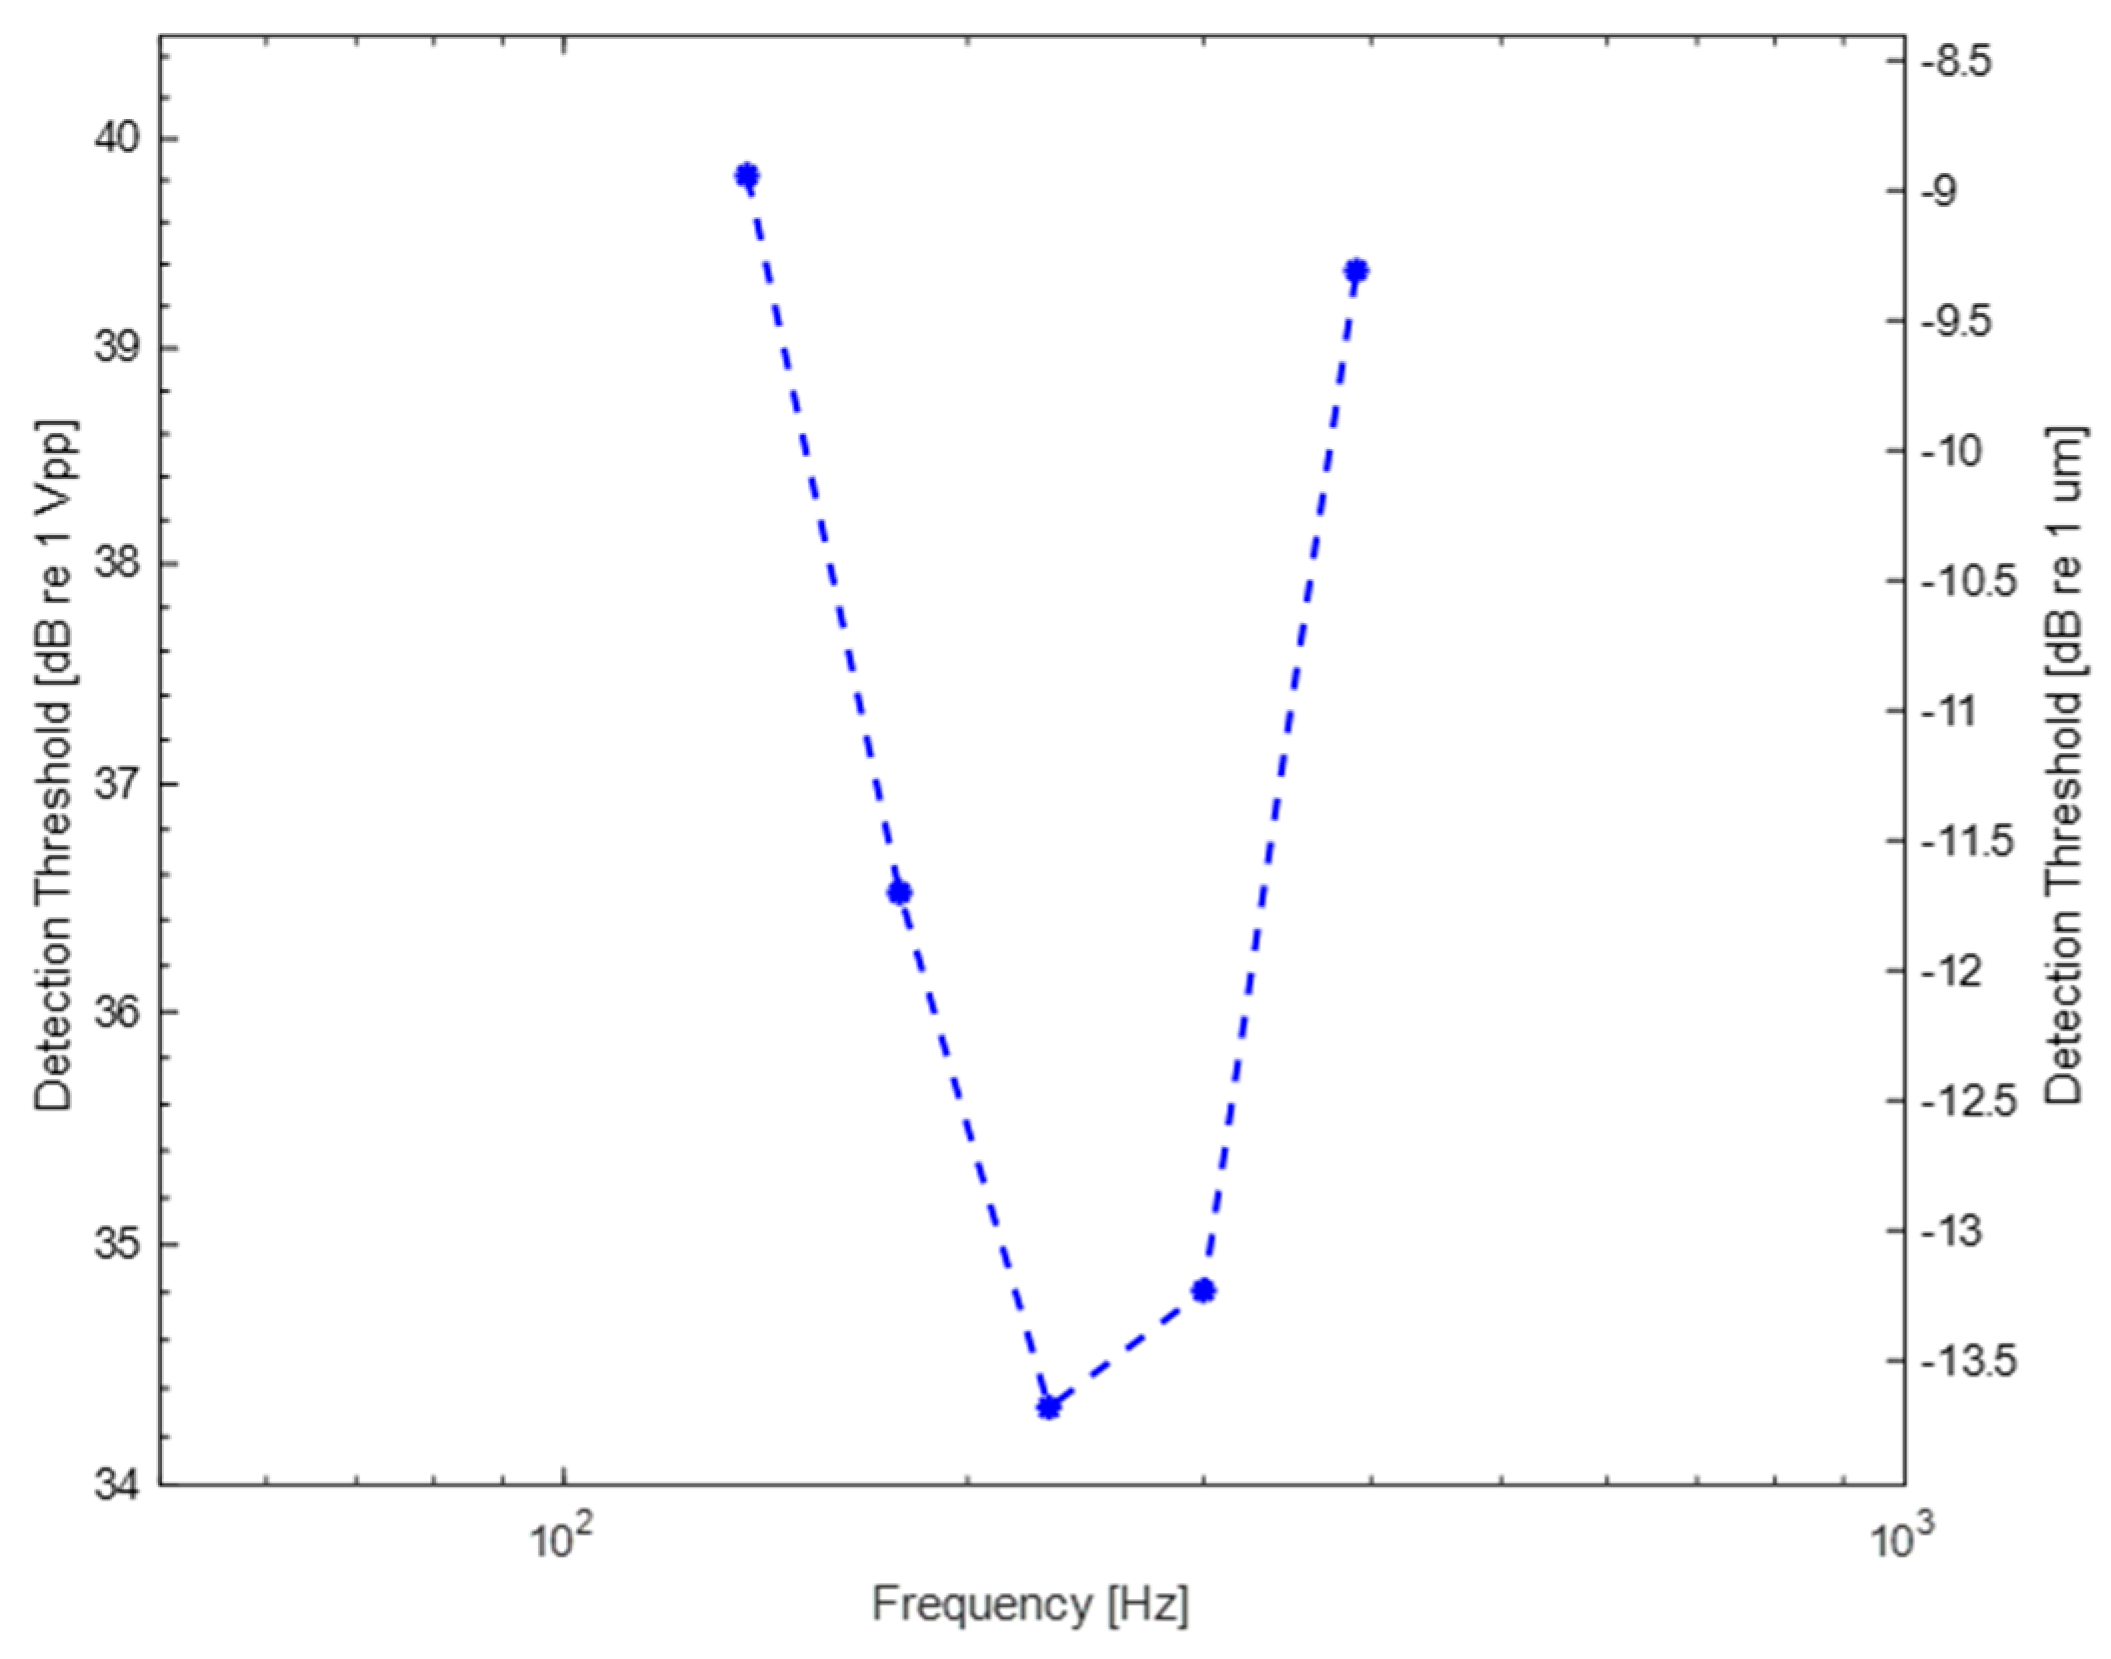
Figure 11.
Success rates of the subjects in array configuration: (a) Subject-1; (b) Subject-2; (c) Subject-3; (d) Subject-4; (e) Subject-5; (f) Subject-6.
Figure 11.
Success rates of the subjects in array configuration: (a) Subject-1; (b) Subject-2; (c) Subject-3; (d) Subject-4; (e) Subject-5; (f) Subject-6.
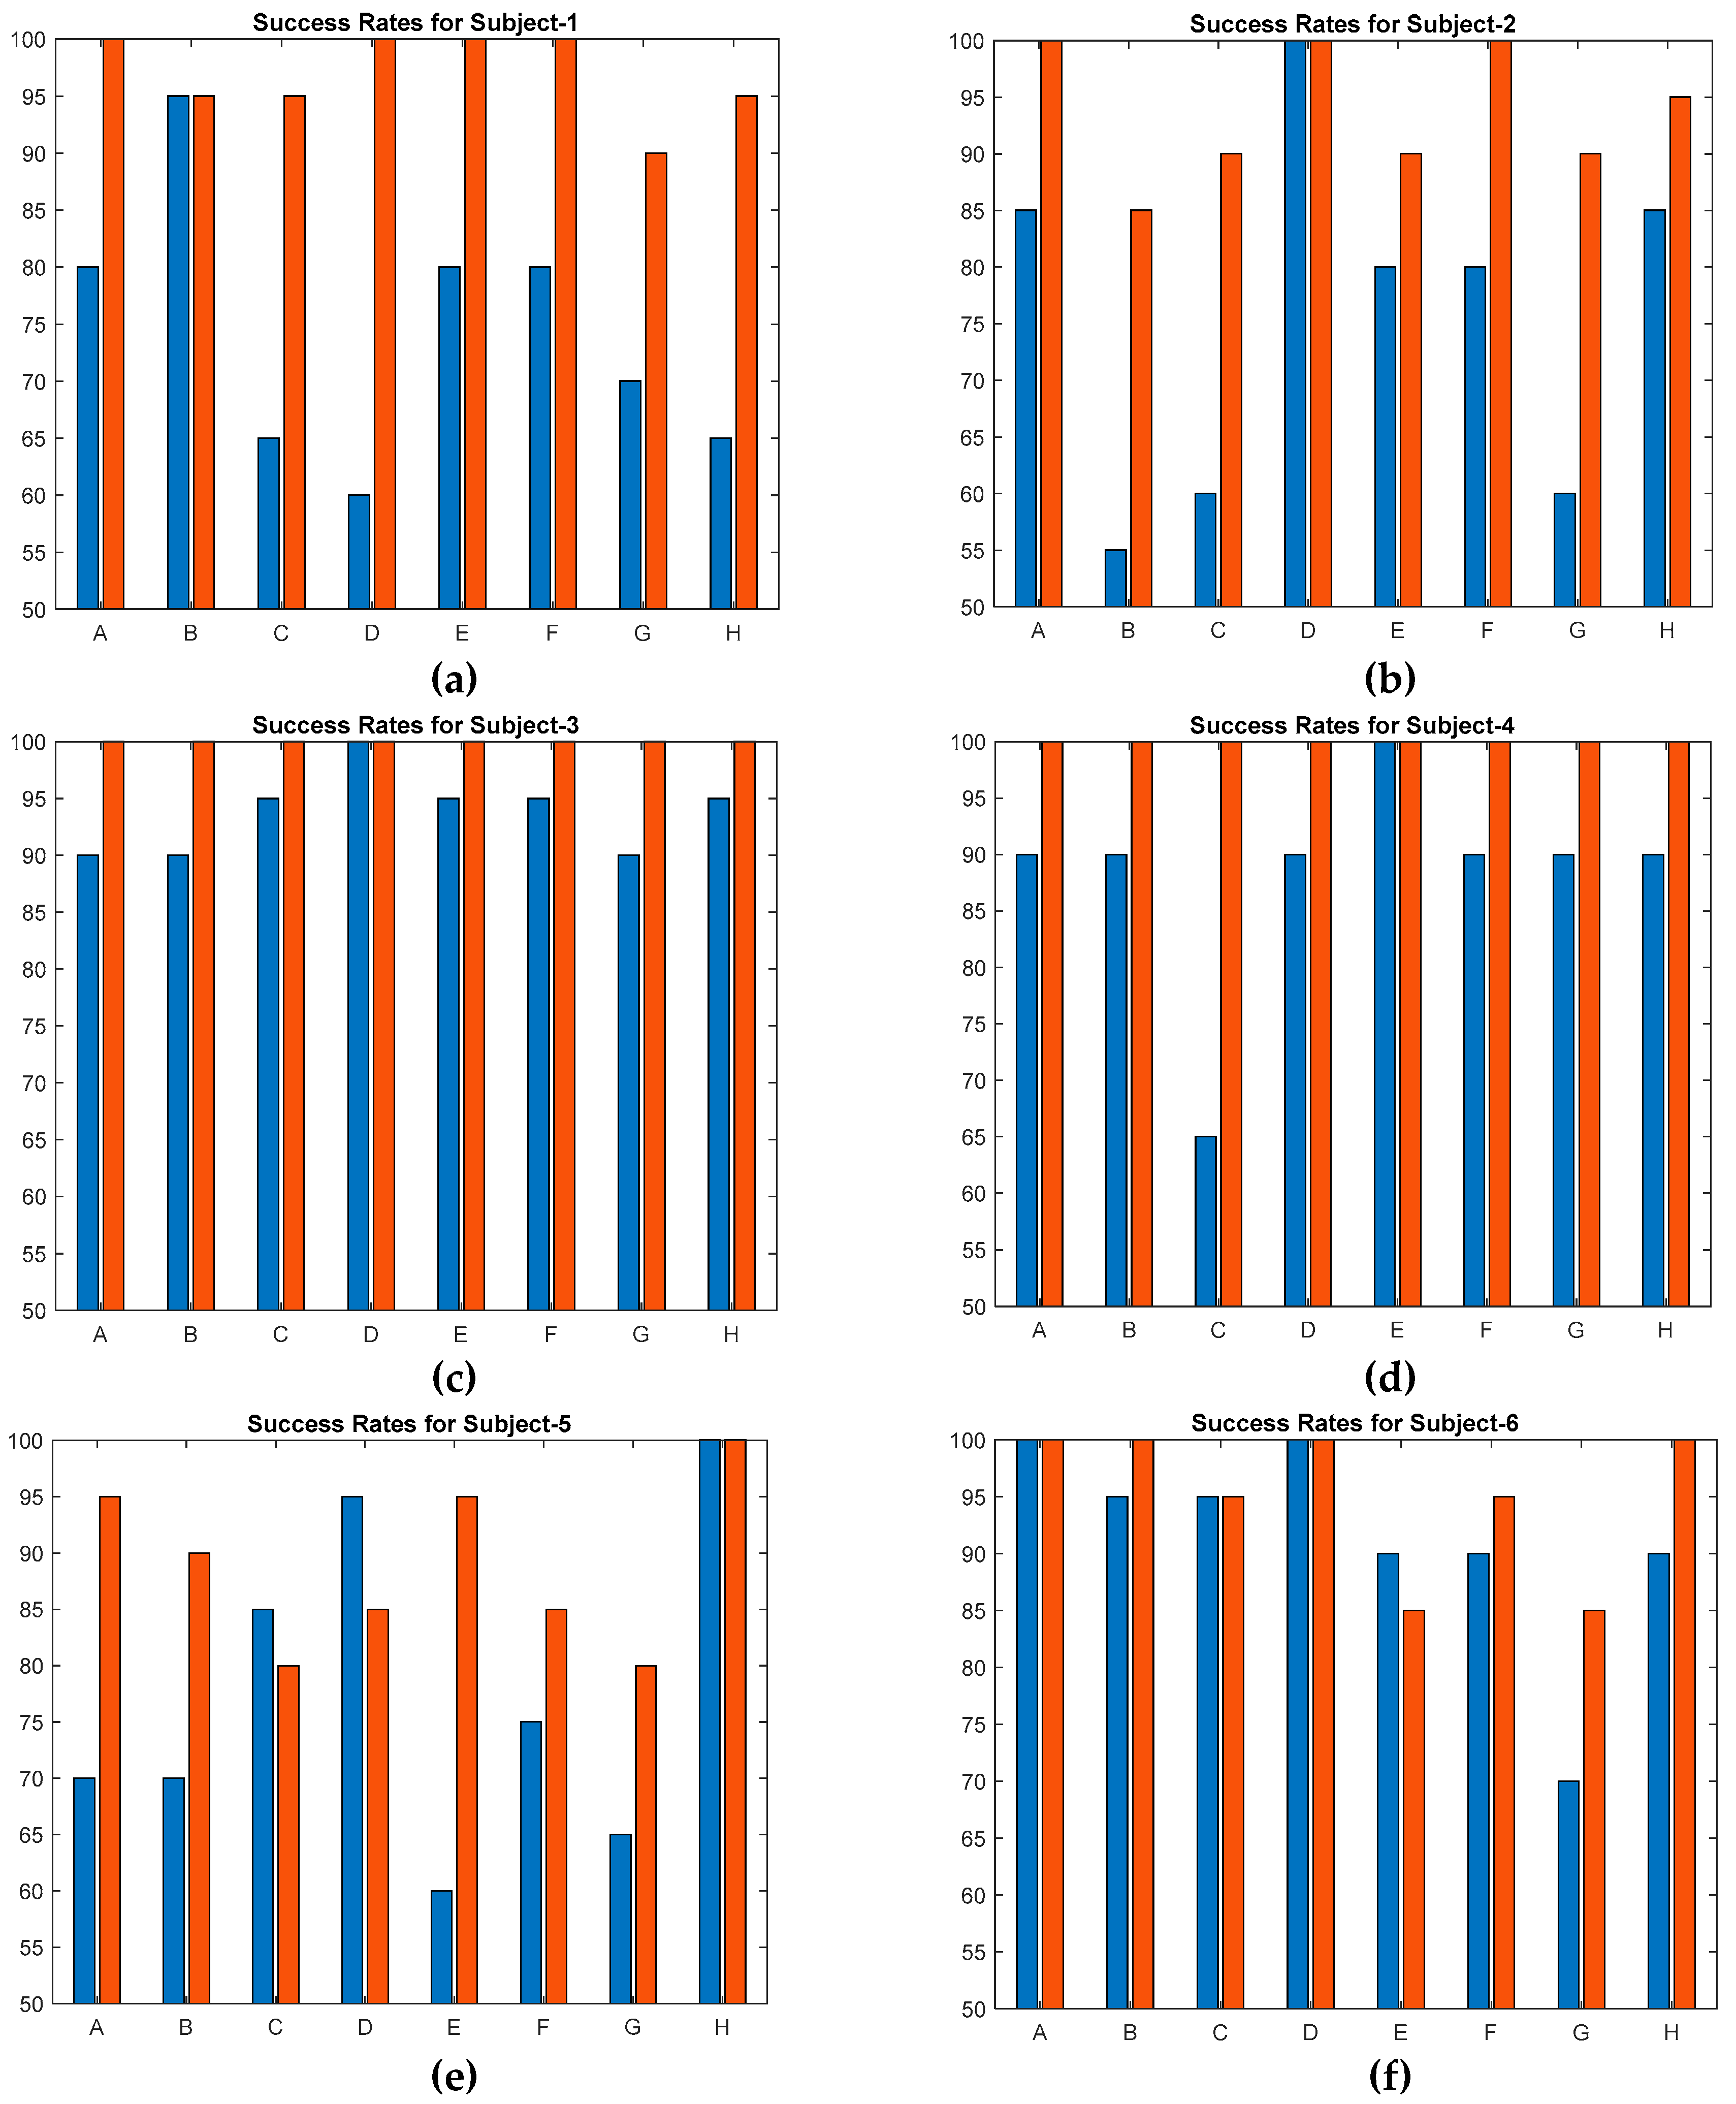
Figure 12.
Average values with standard error bars.

Figure 13.
Confusion matrices for 8 locations: (a) At low voltage; (b) At high voltage.
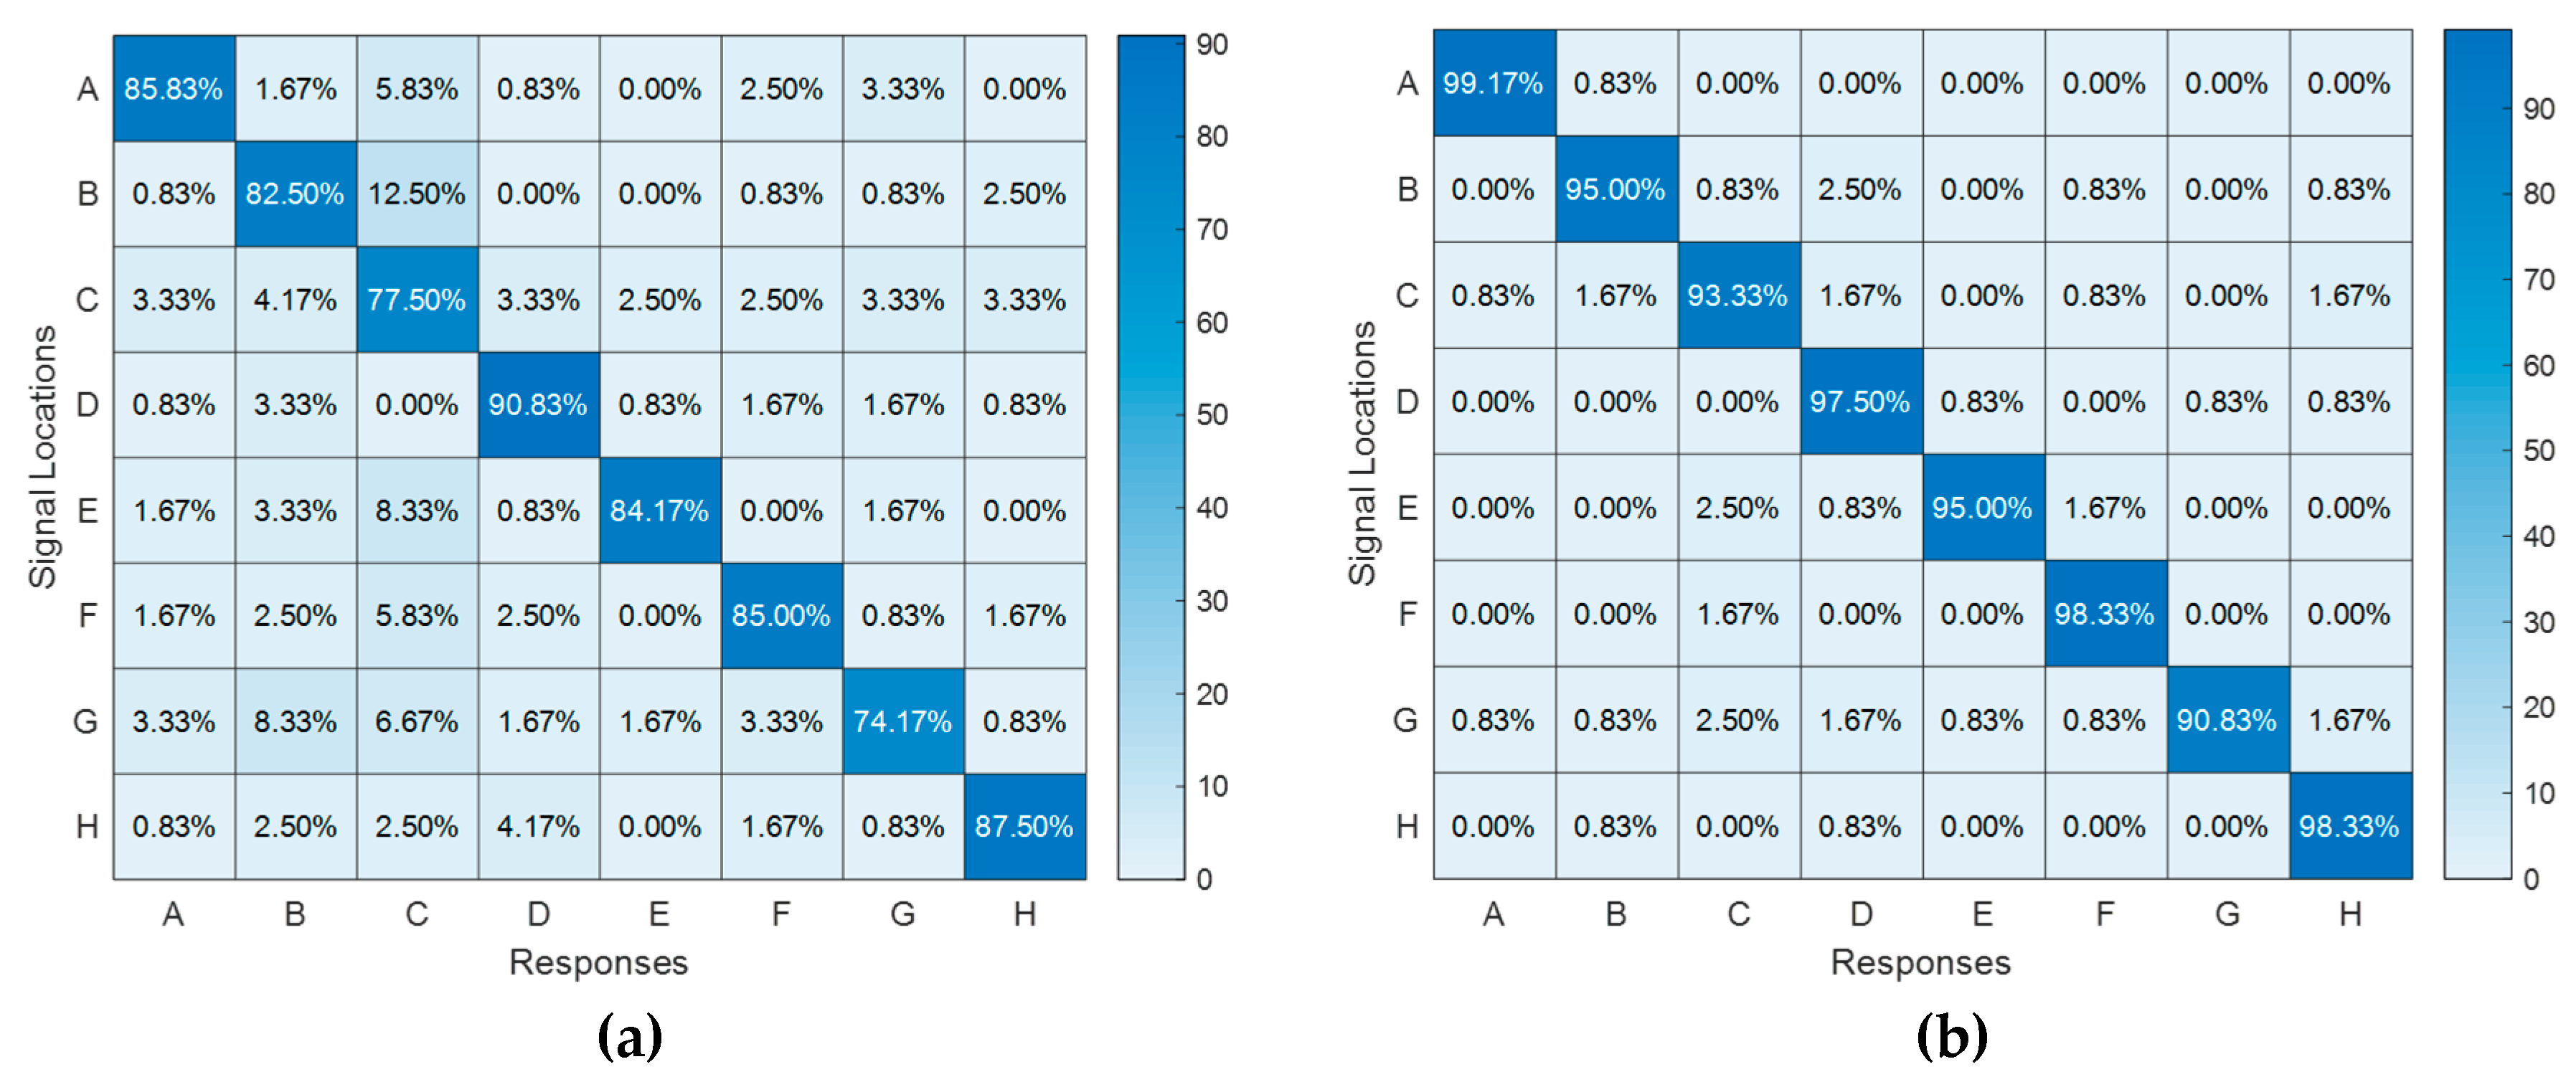

Table 1.
Basic physical parameters used in the FEM analysis.
| Parameter | Value |
|---|---|
| Density | 1780 kg/m3 |
| Elastic modulus | 2500 MPa |
| d31 | ~ +30 pC/N |
| d32 | < +5 pC/N |
| d33 | ~ -22 pC/N |
| Relative dielectric constant | εr = 13 |
Table 2.
Variation of vibration displacements with different frequencies.
| 137 Hz | 178 Hz | 230 Hz | 300 Hz | 390 Hz | |
|---|---|---|---|---|---|
| Maximum Displacement Amplitudes at 100 Vpp | 0.36 μm | 0.37 μm | 0.39 μm | 0.45 μm | 0.63 μm |
| Gain Coefficients for Normalization |
1.08 | 1.03 | 1 | 0.87 | 0.62 |
Table 3.
Variation of required voltages for detection thresholds with different frequencies.
| Frequency Value | Voltage Amplitude |
| 137 Hz | 98 Vpp |
| 178 Hz | 67 Vpp |
| 230 Hz | 52 Vpp |
| 300 Hz | 55 Vpp |
| 390 Hz | 93 Vpp |
Disclaimer/Publisher’s Note: The statements, opinions and data contained in all publications are solely those of the individual author(s) and contributor(s) and not of MDPI and/or the editor(s). MDPI and/or the editor(s) disclaim responsibility for any injury to people or property resulting from any ideas, methods, instructions or products referred to in the content. |
© 2024 by the authors. Licensee MDPI, Basel, Switzerland. This article is an open access article distributed under the terms and conditions of the Creative Commons Attribution (CC BY) license (https://creativecommons.org/licenses/by/4.0/).
Copyright: This open access article is published under a Creative Commons CC BY 4.0 license, which permit the free download, distribution, and reuse, provided that the author and preprint are cited in any reuse.


