
Submitted:
12 June 2023
Posted:
12 June 2023
You are already at the latest version
Abstract
Trace metals are essential elements that play key roles in a number of biochemical processes governing human visual physiology in health and disease. Several trace metals, such as zinc, have been shown to play important roles in the visual phototransduction process. In spite of this, there has been little research conducted on the direct effect of trace metal elements on the visual pho-toreceptor rhodopsin. In the current study, we have determined the effect of several metal ions, such as iron, copper, chromium, manganese, and nickel on the conformational stability of rho-dopsin. To this aim, we analyzed, by means of UV-visible and fluorescence spectroscopic methods, the effects of these trace elements on the thermal stability of dark rhodopsin, the stability of its active Metarhodopsin II conformation, and its chromophore regeneration. Our results show that copper prevented rhodopsin regeneration and slowed down the retinal release process after il-lumination. In turn, Fe3+, but not Fe2+, increased the thermal stability of the dark inactive con-formation of rhodopsin, whereas copper ions markedly decreased it. These findings stress the important role of trace metals in retinal physiology at the photoreceptor level, and may be useful for the development of novel therapeutic strategies to treat retinal disease.
Keywords:
rhodopsin
; trace metals
; thermal stability
; chromophore regeneration
; photobleaching
1. Introduction
The vertebrate retina contains an array of cells with a photosensitive layer composed of rod and cone photoreceptor cells. Rod cells respond to dim-light whereas cone cells are strong light and color-sensing cells that contain red, green and blue cone opsin proteins [1,2,3,4,5]. Rhodopsin (Rho) is the photoreceptor protein of rod cells responsible for dim-light vision, and a prototypic model of class A G protein-coupled receptors (GPCRs). Rho was the first GPCR whose crystallographic three-dimensional structure was solved at atomic resolution [6,7]. Rho is made up of opsin -with a distinctive 7 transmembrane helical architecture- and the 11-cis-retinal (11CR) chromophore covalently bound, through a protonated Schiff base linkage to Lys296 at helix 7, in the transmembrane core of the receptor [8]. The first step in the visual phototransduction process is the capture of photons by the 11CR chromophore. Upon illumination, 11CR isomerizes to its all-trans-retinal (ATR) configuration instantaneously and this causes a conformational change that leads to the formation of the active Metarhodopsin II (Meta II) species. The active Meta II state is formed through a complex cycle of short-lived photointermediates, including bathorhodopsin, lumirhodopsin, and Meta I, which are formed on the picosecond to millisecond time scale [9]. The Meta II conformation eventually decays, with the ATR formed subsequently leaving the retinal binding pocket [10,11]. The active Meta II conformation can activate the G protein transducin and elicit a cascade of biochemical reactions by means of downstream effectors that eventually result in a visual signal to the brain [12,13,14].
Trace metals are indispensable for biochemical processes and are important cofactors for up to 40% of proteins to function properly [15]. Furthermore, these trace elements play an essential role in human visual physiological function [16]. The absence or excess of trace elements may lead to various diseases [17,18]. For instance, insufficient iron levels can result in anemia, inadequate iodine intake can lead to thyroid disorders, and a deficiency in zinc can cause dysfunction of retinal cells, contributing to the development of diverse eye diseases [19,20,21,22,23]. The role of different metal ions on retinal phototransduction has been poorly investigated and the effect of these elements at the photoreceptor Rho level has not been analyzed to date. Therefore, it is important to clarify the potential effects of such ions at the molecular level on the photoreceptor protein Rho. This knowledge can shed light on the molecular mechanisms underlying the pathophysiology of visual disorders, and facilitate the development of innovative therapeutic approaches to address them. The presence and accumulation of some metals in the eye structures has been previously investigated and it has been shown to be critical for visual function, especially at the retinal level [24,25]. In particular, changes in zinc levels have been linked to age-related eye diseases, vision loss, age-related macular degeneration and cataracts [26,27]. Specific and nonspecific binding sites for zinc ions have been reported for Rho [28,29,30] and changes in these binding sites affect the stability of Rho. However, there are no available reports on the effects of other trace metal ions on the conformational stability of Rho which is of interest to clarify the role of such metals at the photoreceptor cell structural level and particularly on the key photoreceptor protein Rho.
To study the effects of trace metal elements on Rho conformational properties, we have selected iron (Fe3+and Fe2+), copper (Cu2+), chromium (Cr3+), manganese (Mn2+) and nickel (Ni2+), which are known to be present in the retina, as representative ions for our study. We have investigated the effect of such metals (in the form of chloride salts) on the thermal stability of the inactive (dark-state) and active (Meta II formed after photoactivation) conformations and in the chromophore regeneration process of purified Rho. We find that Fe3+, but not Fe2+, clearly stabilizes the inactive dark-state conformation of Rho, whereas Cu2+ destabilizes it. In turn, Cu2+ prevents chromophore regeneration and dramatically slows down the Meta II decay process.
2. Results
2.1. Purification and Spectroscopic Analysis of Rho Isolated from Rod Outer Segments (ROS) of Bovine Retinas
We purified bovine ROS Rho by immunochromatography using the Rho-1D4 monoclonal antibody. Bovine Rho has been extensively used for structural studies because of its availability in large amounts. Therefore, it was of interest to investigate the effect of the metal ions on this Rho for a proper comparison with previously published data using purified Rho. The spectrum of the purified ROS Rho from bovine retinas showed the characteristic UV-vis profile with two main bands corresponding to opsin (280 nm) and 11CR covalently bound to opsin (500 nm) (Figure 1). The absorbance of Rho at 500 nm was 0.23 and the A280/A500 ratio was 1.95 which indicated a successful purification. This, and analogous samples, were used in the experiments described below.
2.2. Photobleaching and Acidification of Rho Treated with Different Trace Elements
Upon illumination, the protonated Schiff base (PSB) formed between 11CR and opsin undergoes deprotonation, resulting in a blue shift of the visible absorption band to 380 nm. Subsequently, addition of H2SO4 causes the Schiff base (SB) to re-protonate, but the visual protein undergoes denaturation, leading to a red shift of the maximum absorption band to 440 nm. In this experiment, we treated the Rho samples with Fe3+,Fe2+,Cu2+,Cr3+,Mn2+, and Ni2+ individually and recorded the corresponding spectra (Figure 2 and Figure S1). The samples treated with Cr3+ and Mn2+ exhibited similar behavior to that of the control Rho sample without metal ion added. However, samples treated with Fe3+,Fe2 and Cu2+ did show not show complete conversion to the 380 nm species upon illumination and we could detect some small remaining band at 500 nm. This may indicate the presence of some small fraction of PSB-linked species remaining in these cases.
2.3. Effects of Trace Metal Elements on Rho Thermal Stability in the Dark State
Although the contents of trace elements in the human body is significantly low, they serve essential biological functions of utmost importance. These trace metals are involved in the metabolism of enzymes, hormones and nucleic acids, and also assist in the transport of macro elements. There are also different trace elements distributed in different areas of the eye, and among those we selected Fe3+, Cr3+, Mn2+, Ni2+, Cu2+and Fe2+ to explore their effects on the thermal stability of the dark inactive conformation of Rho. The thermal decay process of Rho can be divided into two steps. In the first step, as the temperature increases, the 11CR bound to opsin undergoes isomerization to form ATR. In the second step, the deprotonated SB linkage is hydrolyzed and free ATR is released from opsin [31]. In our experiment, the thermal stability of the Rho samples, with and without metal elements, was tested by UV-Vis spectrophotometry in the dark at 48ºC. The thermal decay of purified Rho is clearly altered in different ways by the different metal ions (Figure 3). The t1/2 for the process, particularly for Fe3+, but also for Cr3+, Ni2+, and to a lesser extent for Mn3+, was clearly increased indicating that these metal ions enhance the thermal stability of the dark inactive conformation of Rho. It is noteworthy that the other iron species, Fe2+, did not cause any change in the thermal stability compared to the control sample without any added metal ion. On the other side, Cu2+ produced a decrease in the thermal stability as judged by the lower t1/2 value of the corresponding decay process.
2.4. Effects of Trace Elements on the Chromophore Regeneration of Rho
The regeneration of Rho is an important step in the visual process. The chromophore regeneration process was followed by measuring the increase at 500 nm after illumination of a Rho sample containing exogenously added free 11CR. The results obtained indicate that only Cu2+ affected the chromophore regeneration process by basically impairing it (Figure S2), but all the other metal ions did not significantly affect it (Figure 4). Analyses of the t1/2 of Rho regeneration showed no significant difference between the metal-treated and control untreated samples (Figure 4a). The t1/2 of the sample containing Fe3+ was essentially the same to that of the control sample, whereas the t1/2 of the other metal-containing samples were slightly lower than that of the control. Finally, the percentage of regenerated Rho, with respect to the original Rho, was determined, and it was found to be about 80% under our experimental conditions (Figure 4b). These results indicate that the metal ions, except for Cu2+, did not differentially affect the final percentage of chromophore regeneration.
2.5. Effects of Trace Elements on the Meta II Decay Process
Upon illumination, the 11CR covalently linked to opsin by means of a PSB linkage, changes its configuration to ATR. As a consequence, activated Meta II is formed which decays to free ATR and opsin with time. Under our experimental conditions, the Meta II decay process closely parallels the retinal release from the binding pocket. This allows Trp265 fluorescence increase due to the fact that it was previously quenched by the presence of retinal in the binding pocket [9,32]. The effect of trace elements on the Meta II can be analyzed by monitoring this fluorescence increase as a function of time.
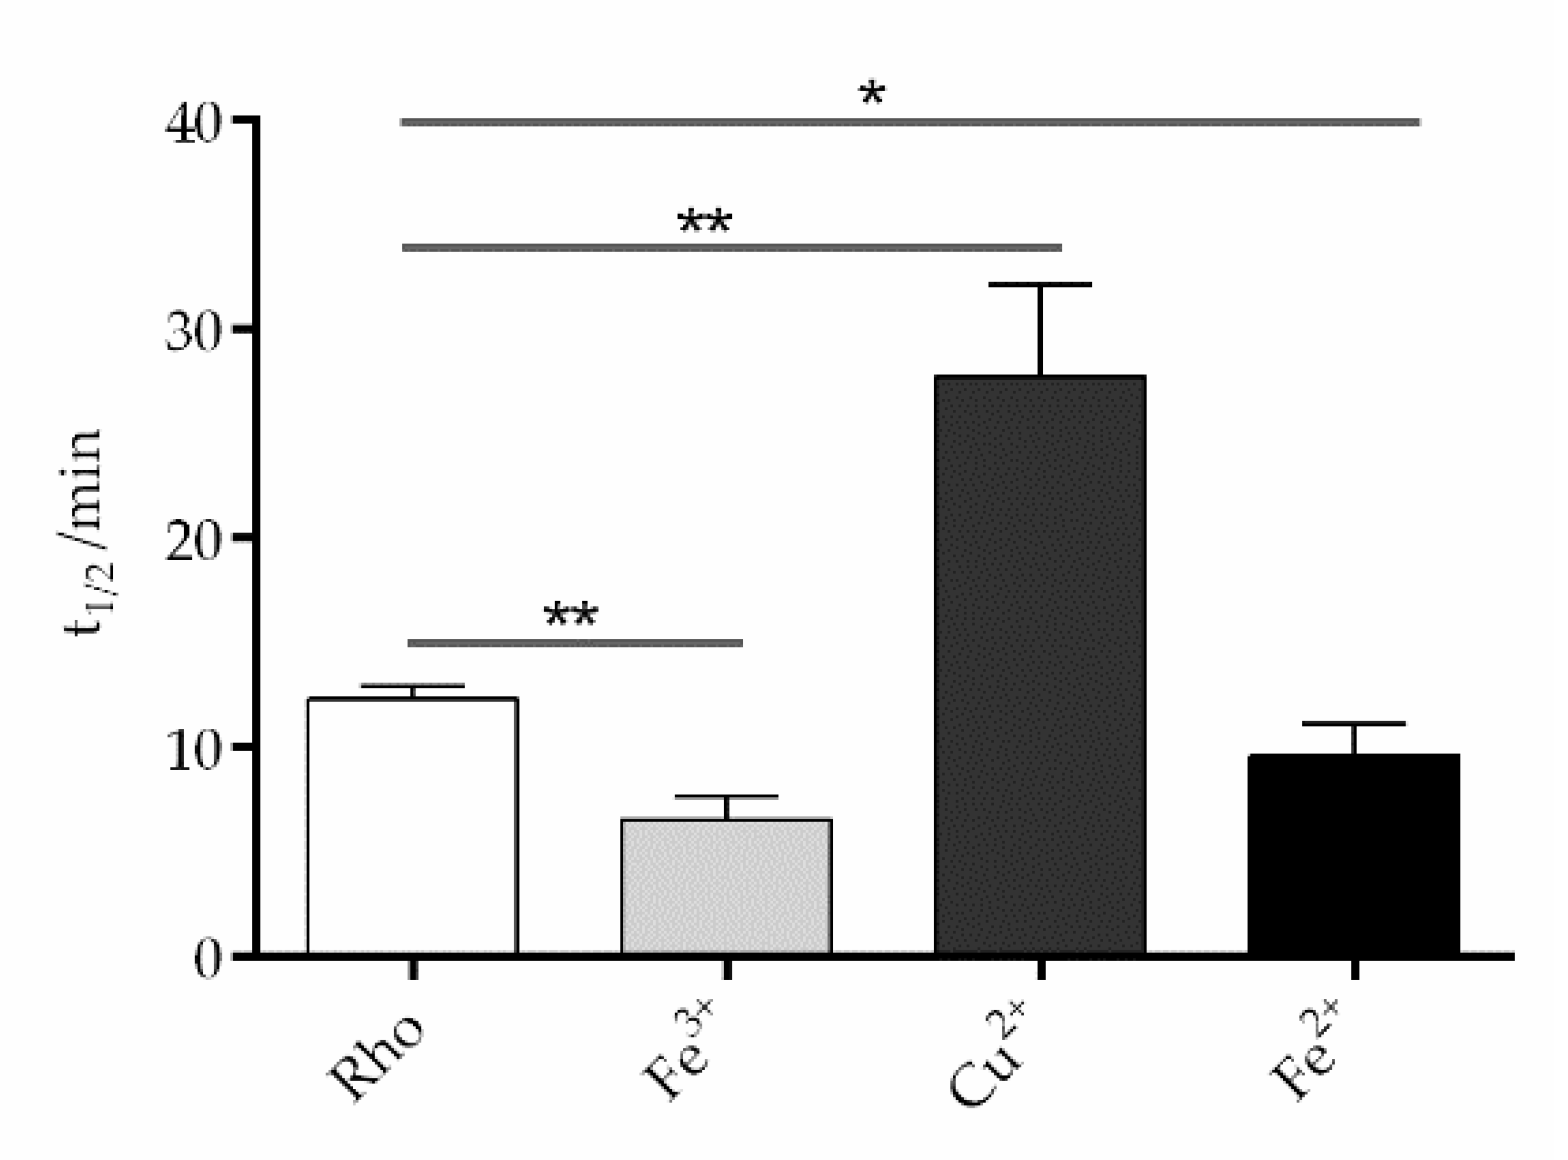
The fluorescence curves were recorded in the dark, after illumination of the sample for 40 s, at 20ºC (Figure 5). The samples treated with divalent iron and trivalent iron reached their maximum fluorescence faster than the control without metals and, consequently, had a reduced t1/2, particularly Fe3+ (Figure 6). However, Cu2+-treated sample took much longer to reach its maximum fluorescence value, clearly reflecting a slower process compared to the other two cases. The behavior for chromium, manganese, and nickel samples was similar to that of the control sample. The sample treated with Cu2+ showed a much slower process than the control sample 27.7±2.5min vs 12.3±0.3min, respectively. In the case of ferrous ion (9.6±0.9min) and ferric iron (6.6±0.6min) these values reflected significantly faster processes compared to the control sample without metal ions. There was no significant difference in t1/2 between the control sample and the samples treated with chromium, manganese, and nickel, respectively.
3. Discussion
Trace elements are indispensable cofactors for more than 40% of protein active sites and are very important for human health. Several studies have shown that the absence or deficiency of certain trace elements can lead to disease. Trace elements are found throughout the body, including the eyes and its influence on retinal physiology in connection with visual health has been the matter or previous investigations [33]. In the case of zinc, there is a certain concentration of zinc in the retina, which appears to play an important role in the structural stability of the visual photoreceptor protein Rho. In this regard, abnormal concentrations of zinc in the retina can lead to vision loss and cataract formation [34]. In spite of this, there are scarce studies dealing with the effect of trace elements on Rho structure and conformational stability. To fill this gap, we have conducted an analysis of the effects of different selected trace metal ions, namely, Fe3+, Cr3+, Mn2+, Ni2+, Cu2+and Fe2+ on Rho conformation and structural stability.
We focused on the effect of trace elements on three main parameters of Rho: thermal stability, chromophore regeneration, and the decay of the active conformation of Rho, Meta II, formed upon illumination. A very interesting feature of our results is the differential effect of Fe3+ and Fe2+ particularly concerning the thermal stability in the dark state. These results indicate that only Fe3+ provides increased stability to Rho but Fe2+ did not affect this property. Moreover, Fe3+ showed a more pronounced effect in the retinal release process than Fe2+. In contrast the two iron species showed no significant effects on the chromophore regeneration process compared to the control sample (see Figure 4). This result provides increased evidence of the importance of metal ions homeostasis in biochemical processes and the relevance of this fine-tuned regulation. In this regard, the differential effect of iron in different oxidation states should be further stressed and taken into account in future studies. It has been recent reported that ferrous iron, but not its ferric counterpart, can cause oxidative stress, and photoreceptor cell death in a mouse model of retinal degeneration [35]. Iron accumulation has been also associated with lipid peroxidation and ferroptosis as a result of disturbance of iron homeostasis in age-related macular degeneration. Fe2+ has also been associated with ferroptosis photoreceptor degeneration in mice with defects in ATR clearance [36].
On the other side, a specific behavior for Cu2+ was also observed. In this case, this metal ion would cause an important decrease in the thermal stability and at the same time would dramatically slow down the retinal release process, after photoactivation, and this would be a possible cause of its lack of chromophore regeneration. These results point to a deleterious effect of copper on the structural stability of retinal Rho, at least under our experimental conditions. A potential explanation of the observed behavior with Cu2+ may be found in the fact that a high binding affinity of copper for Rho was previously reported in a study where only this metal could compete for zinc binding to Rho [37]. This suggests that copper interacts with Rho and impairs retinal release, and subsequent free 11CR uptake, and this would explain the lack of chromophore regeneration observed in the Cu2+-treated sample (Figure 4). Therefore, the significantly increased t1/2 value for copper (Figure 6) can be interpreted as a very slow retinal release process that would preclude chromophore regeneration by impairing free 11CR binding to the protein. In contrast, iron did show a faster process indicating that retinal could readily enter the binding pocket to regenerate Rho. An alternative explanation for the effect seen for copper is that this metal ion would bind at a site which is in the pathway of retinal entry and this would cause the observed lack of chromophore regeneration.
In conclusion, copper has a strong negative effect on Rho stability possibly as a result of its strong binding to the photoreceptor protein, whereas ferric iron is beneficial for improving Rho thermal stability. Interestingly, ferrous ions are not able to stabilize Rho towards thermal bleaching. A differential effect of iron at different oxidation states has been previously observed in other biochemical pathways [35,36]. Noteworthy, the stabilizing effect of Fe3+, but not Fe2+, on Rho dark-adapted conformation detected in our study may have implications for retinal physiology, and opens up novel avenues for the use of such metal in combination with other molecular entities in the development of successful therapeutic strategies to treat inherited visual disorders.
4. Materials and Methods
4.1. Materials
All metal compounds were used as chloride salts and were purchased from Sigma (Madrid, Spain). DM was purchased from Anatrace Inc (Maumee, OH, USA). Bovine retinas were purchased from WL Lawson (Omaha, NE, USA). 11CR was provided by the National Eye Institute, National Institutes of Health (USA) and ATR from Sigma (Madrid, Spain). The mAb rho-1D4 antibody was obtained from Cell Essentials (Boston, MA, USA). H-TETSQVAPA-OH (9-mer) peptide was synthesized by Unitat de Tècniques Separatives i Síntesi de Pèptids (Barcelona, Spain).
4.2. Methods
4.2.1. Purification of Rho from ROS of Bovine Retinas
The whole purification process of Rho was carried out in the dark or under dim-red light of Kodak safelight filter-1521624. ROS membranes from bovine retinas were resuspended with 2 mM NaPi buffer, pH 6.0, and solubilized using 1% DM (w/v), by gently shaking for 1 h, and the samples were subsequently centrifuged. The supernatant was collected and mixed with 1D4-coupled Sepharose beads, gently nutated for 3 h and centrifuged again. The beads were washed multiple times (at least 3 times), and Rho was eluted with a buffer containing the 9-mer peptide corresponding to the last 9 amino acids of the C-terminal tail of Rho. The absorbance of all samples was recorded with a Varian Cary 100 UV-Vis spectrophotometer in the dark at 20ºC. The concentration of the purified Rho was determined by measuring the absorbance at 500 nm with an ε=40.600 M-1. cm-1.
4.2.2. Photobleaching and Acidification
First, the spectrum of the sample in the dark state was recorded (dark spectrum). Then, the sample was exposed for 30 s to a Dolan-Jenner MI-150 light source, with a cut-off filter at 495 nm, and the spectrum after photolysis was recorded (light spectrum). Finally, 2N H2SO4 was added to the sample, and the spectrum was immediately recorded (acid spectrum). The maximum absorption peak of the sample exhibited a shift from 500 nm to 380 nm upon photobleaching, and to 440 nm upon subsequent acidification.
4.2.3. Thermal Decay Kinetics in the Dark State
Thermal decay kinetics experiments were conducted with purified Rho in 2 mM NaPi buffer, pH 6.0 and 0.05% DM. First, the UV-vis spectrum in the 250 nm-650 nm interval region of the Rho sample was measured, in the dark, at 20ºC. Then, the temperature of the instrument was set at 48ºC, and spectral cycles were measured to follow the decay of the visible absorption band with time. Samples with metals contained a final concentration of 50 µM (added from a concentrated stock of the corresponding chloride salt) and spectra of the corresponding samples without added metal were also measured as a control. The specific spectra acquisition parameters were 50 cycles in total, 2 min for each cycle, and a scan speed of 400 nm/min. Finally, the equation A500 = A/A0, where A is the absorbance recorded at 500 nm at different times, and A0 is original absorbance at 500 nm, was used to normalize the data, and the obtained curves were fitted to an exponential function. All experiments were repeated three times for statistical significance.
4.2.4. Chromophore Regeneration Assay
The chromophore regeneration assay was carried out at 20ºC in the dark. Briefly, the initial dark UV-vis spectra of the Rho samples, with or without metal ions (final concentration 50 µM), were measured. Next, exogenous 11CR (from a concentrated stock ethanol solution) was added to the Rho sample and the UV-vis spectrum was recorded again. Then, the Rho samples were bleached by means of a FIBER-LITE-MI-150 light source (Dolan Jenner) equipped with a λ > 495 nm cut-off filter for 40 s, and the increasing absorbance at the visible maximum was continuously measured with time. The spectral absorption data were recorded using the following procedure: the specific parameters were 50 cycles in total, 2 min for each cycle, and a scan speed of 400 nm/min. All experiments were repeated three times. The obtained data were finally curve fitted to an exponential function and the half-life time derived.
4.2.5. Meta II Decay by Fluorescence Spectroscopy
This assay was conducted on a PTI Quanta Master 4 Spectrofluorometer. A 0.5 µM Rho sample was added to a fluorometric cuvette. The whole experiment was carried out at 20ºC in dark. The excitation wavelength was set to 295 nm and the sample was irradiated through a 0.5 nm beam slit for 2 s. Then, a beam shutter was used to block the excitation light for 28 s. The tryptophan fluorescence signal was recorded at 330 nm through a 10 nm slit. Initially the sample was measured in the fluorometer, in the dark, until the fluorescence signal was stable and the sample was then irradiated with a 150-W Dolan-Jenner Mi-150 power source using a λ > 495 nm cut-off filter for 40 s. The fluorescence signal of Trp265 gradually increased over time, as a result of retinal leaving its binding pocket, until it reached a plateau. Finally, the experimental data were fitted to an exponential function and the t1/2 of the process was determined.
4.2.6. Statistical Analysis
The results were presented as the mean value ± standard error of the mean which were calculated from independent replicates (n = 3). Statistical analysis was performed using GraphPad Prism 6 (GraphPad Software Inc., USA). To determine the statistical significance of the findings, an unpaired two-tailed t-test was conducted with a significance level set at p < 0.05.
Author Contributions
Conceptualization, P.G. and M.M.; methodology, E.R, P.F.-G. and F.W.; validation, F.W. and P.G.; formal analysis, F.W. and P.G..; investigation, F.W., P.F-G.; writing—original draft preparation, F.W. and P.G.; writing—review and editing, F.W., E.R., M.M. and P.G.; visualization, F.W. and P.G..; supervision, P.G.; project administration, P.G.; funding acquisition, P.G. All authors have read and agreed to the published version of the manuscript.
Funding
This research was funded by grants from Ministry of Science and Innovation, Spain (PID2019-104817GB-I00), and from the Government of Catalonia to Research Consolidated Groups (2021 SGR 00342) to P.G. F. W. is the recipient of a predoctoral grant from the Secretariat for Universities and Research of the Ministry of Business and Knowledge of the Government of Catalonia and the European Social Fund (2021 FI_B 00228).
Data Availability Statement
All original spectral data used to obtain the spectral graphs is available upon request.
Acknowledgments
The authors acknowledge helpful discussions with Prof. Juan Jesus Perez, Dr. Laia Bosch and Dr. Arnau Cordomí.
Conflicts of Interest
The authors declare no conflict of interest. The funders had no role in the design of the study; in the collection, analyses, or interpretation of data; in the writing of the manuscript; or in the decision to publish the results.
References
- Hargrave, P. A.; McDowell, J. H. , Rhodopsin and phototransduction: a model system for G protein-linked receptors. FASEB J 1992, (6), 2323–31. [Google Scholar] [CrossRef] [PubMed]
- Mendes, H. F.; van der Spuy, J.; Chapple, J. P.; Cheetham, M. E. , Mechanisms of cell death in rhodopsin retinitis pigmentosa: implications for therapy. Trends Mol Med 2005, (4), 177–85. [Google Scholar] [CrossRef] [PubMed]
- Menon, S. T.; Han, M.; Sakmar, T. P. , Rhodopsin: structural basis of molecular physiology. Physiol Rev 2001, (4), 1659–88. [Google Scholar] [CrossRef] [PubMed]
- Srinivasan, S.; Guixa-Gonzalez, R.; Cordomi, A.; Garriga, P. , Ligand Binding Mechanisms in Human Cone Visual Pigments. Trends Biochem Sci 2019, (7), 629–639. [Google Scholar] [CrossRef]
- Zhou, X. E.; Melcher, K.; Xu, H. E. , Structure and activation of rhodopsin. Acta Pharmacol Sin 2012, (3), 291–9. [Google Scholar] [CrossRef]
- Hofmann, K.P.; Scheerer, P.; Hildebrand, P.W.; Choe, H.W.; Park, J.H.; Heck, M.; Ernst, O.P. A G protein-coupled receptor at work: the rhodopsin model. Trends Biochem Sci 2009, 34, 540–552. [Google Scholar] [CrossRef] [PubMed]
- Okada, T.; Palczewski, K. Crystal structure of rhodopsin: implications for vision and beyond. Curr Opin Struct Biol 2001, 11, 420–426. [Google Scholar] [CrossRef] [PubMed]
- Bartl, F.J.; Vogel, R. Structural and functional properties of metarhodopsin III: recent spectroscopic studies on deactivation pathways of rhodopsin. Phys Chem Chem Phys 2007, 9, 1648–1658. [Google Scholar] [CrossRef]
- Kim, T.Y.; Schlieter, T.; Haase, S.; Alexiev, U. Activation and molecular recognition of the GPCR rhodopsin--insights from time-resolved fluorescence depolarisation and single molecule experiments. Eur J Cell Biol 2012, 91, 300–310. [Google Scholar] [CrossRef]
- Geva, P.; Caruso, G.; Klaus, C.; Hamm, H.E.; Gurevich, V.V.; DiBenedetto, E.; Makino, C.L. Effects of cell size and bicarbonate on single photon response variability in retinal rods. Front Mol Neurosci 2022, 15, 1050545. [Google Scholar] [CrossRef]
- Varma, N.; Mutt, E.; Muhle, J.; Panneels, V.; Terakita, A.; Deupi, X.; Nogly, P.; Schertler, G.F.X.; Lesca, E. Crystal structure of jumping spider rhodopsin-1 as a light sensitive GPCR. Proc Natl Acad Sci U S A 2019, 116, 14547–14556. [Google Scholar] [CrossRef]
- Borhan, B.; Souto, M.L.; Imai, H.; Shichida, Y.; Nakanishi, K. Movement of retinal along the visual transduction path. Science 2000, 288, 2209–2212. [Google Scholar] [CrossRef]
- Mustafi, D.; Engel, A.H.; Palczewski, K. Structure of cone photoreceptors. Prog Retin Eye Res 2009, 28, 289–302. [Google Scholar] [CrossRef]
- Srinivasan, S.; Cordomi, A.; Ramon, E.; Garriga, P. Beyond spectral tuning: human cone visual pigments adopt different transient conformations for chromophore regeneration. Cell Mol Life Sci 2016, 73, 1253–1263. [Google Scholar] [CrossRef]
- Kircheva, N.; Dobrev, S.; Nikolova, V.; Angelova, S.; Dudev, T. Zinc and Its Critical Role in Retinitis pigmentosa: Insights from DFT/SMD Calculations. Inorg Chem 2020, 59, 17347–17355. [Google Scholar] [CrossRef] [PubMed]
- Organisciak, D.; Wong, P.; Rapp, C.; Darrow, R.; Ziesel, A.; Rangarajan, R.; Lang, J. Light-induced retinal degeneration is prevented by zinc, a component in the age-related eye disease study formulation. Photochem Photobiol 2012, 88, 1396–1407. [Google Scholar] [CrossRef] [PubMed]
- Chaudhari, V.; Bagwe-Parab, S.; Buttar, H.S.; Gupta, S.; Vora, A.; Kaur, G. Challenges and Opportunities of Metal Chelation Therapy in Trace Metals Overload-Induced Alzheimer's Disease. Neurotox Res 2023, 10.1007/s12640-023-00634-7. [CrossRef]
- Liu, F.; Li, M.; Lu, J.; Lai, Z.; Tong, Y.; Wang, M. Trace Metals (As, Cd, Cr, Cu, Hg, Ni, Pb, Zn) and Stable Isotope Ratios (delta(13)C and delta(15)N) in Fish from Wulungu Lake, Xinjiang, China. Int J Environ Res Public Health 2021, 18. [Google Scholar] [CrossRef]
- Dascalu, A.M.; Anghelache, A.; Stana, D.; Costea, A.C.; Nicolae, V.A.; Tanasescu, D.; Costea, D.O.; Tribus, L.C.; Zgura, A.; Serban, D.; et al. Serum levels of copper and zinc in diabetic retinopathy: Potential new therapeutic targets (Review). Exp Ther Med 2022, 23, 324. [Google Scholar] [CrossRef]
- McMillen, S.A.; Dean, R.; Dihardja, E.; Ji, P.; Lonnerdal, B. Benefits and Risks of Early Life Iron Supplementation. Nutrients 2022, 14. [Google Scholar] [CrossRef]
- Pao, P.J.; Emri, E.; Abdirahman, S.B.; Soorma, T.; Zeng, H.H.; Hauck, S.M.; Thompson, R.B.; Lengyel, I. The effects of zinc supplementation on primary human retinal pigment epithelium. J Trace Elem Med Biol 2018, 49, 184–191. [Google Scholar] [CrossRef]
- Ugarte, M.; Osborne, N.N.; Brown, L.A.; Bishop, P.N. Iron, zinc, and copper in retinal physiology and disease. Surv Ophthalmol 2013, 58, 585–609. [Google Scholar] [CrossRef]
- Zhou, Q.; Xue, S.; Zhang, L.; Chen, G. Trace elements and the thyroid. Front Endocrinol (Lausanne) 2022, 13, 904889. [Google Scholar] [CrossRef]
- Ugarte, M.; Geraki, K.; Jeffery, G. Aging results in iron accumulations in the non-human primate choroid of the eye without an associated increase in zinc, copper or sulphur. Biometals 2018, 31, 1061–1073. [Google Scholar] [CrossRef]
- Ugarte, M.; Grime, G.W.; Lord, G.; Geraki, K.; Collingwood, J.F.; Finnegan, M.E.; Farnfield, H.; Merchant, M.; Bailey, M.J.; Ward, N.I.; et al. Concentration of various trace elements in the rat retina and their distribution in different structures. Metallomics 2012, 4, 1245–1254. [Google Scholar] [CrossRef]
- Emri, E.; Cappa, O.; Kelly, C.; Kortvely, E.; SanGiovanni, J.P.; McKay, B.S.; Bergen, A.A.; Simpson, D.A.; Lengyel, I. Zinc Supplementation Induced Transcriptional Changes in Primary Human Retinal Pigment Epithelium: A Single-Cell RNA Sequencing Study to Understand Age-Related Macular Degeneration. Cells 2023, 12. [Google Scholar] [CrossRef] [PubMed]
- Handa, J.T.; Cano, M.; Wang, L.; Datta, S.; Liu, T. Lipids, oxidized lipids, oxidation-specific epitopes, and Age-related Macular Degeneration. Biochim Biophys Acta Mol Cell Biol Lipids 2017, 1862, 430–440. [Google Scholar] [CrossRef] [PubMed]
- Beyersmann, D.; Haase, H. Functions of zinc in signaling, proliferation and differentiation of mammalian cells. Biometals 2001, 14, 331–341. [Google Scholar] [CrossRef] [PubMed]
- Gleim, S.; Stojanovic, A.; Arehart, E.; Byington, D.; Hwa, J. Conserved rhodopsin intradiscal structural motifs mediate stabilization: effects of zinc. Biochemistry 2009, 48, 1793–1800. [Google Scholar] [CrossRef] [PubMed]
- Toledo, D.; Cordomi, A.; Proietti, M.G.; Benfatto, M.; del Valle, L.J.; Perez, J.J.; Garriga, P.; Sepulcre, F. Structural characterization of a zinc high-affinity binding site in rhodopsin. Photochem Photobiol 2009, 85, 479–484. [Google Scholar] [CrossRef] [PubMed]
- Liu, M.Y.; Liu, J.; Mehrotra, D.; Liu, Y.; Guo, Y.; Baldera-Aguayo, P.A.; Mooney, V.L.; Nour, A.M.; Yan, E.C. Thermal stability of rhodopsin and progression of retinitis pigmentosa: comparison of S186W and D190N rhodopsin mutants. J Biol Chem 2013, 288, 17698–17712. [Google Scholar] [CrossRef] [PubMed]
- Farrens, D.L.; Khorana, H.G. Structure and function in rhodopsin. Measurement of the rate of metarhodopsin II decay by fluorescence spectroscopy. J Biol Chem 1995, 270, 5073–5076. [Google Scholar] [CrossRef] [PubMed]
- Kaminska, A.; Romano, G.L.; Rejdak, R.; Zweifel, S.; Fiedorowicz, M.; Rejdak, M.; Bajka, A.; Amato, R.; Bucolo, C.; Avitabile, T.; et al. Influence of Trace Elements on Neurodegenerative Diseases of The Eye-The Glaucoma Model. Int J Mol Sci 2021, 22. [Google Scholar] [CrossRef]
- Miao, X.; Sun, W.; Miao, L.; Fu, Y.; Wang, Y.; Su, G.; Liu, Q. Zinc and diabetic retinopathy. J Diabetes Res 2013, 2013, 425854. [Google Scholar] [CrossRef]
- Shu, W.; Baumann, B.H.; Song, Y.; Liu, Y.; Wu, X.; Dunaief, J.L. Ferrous but not ferric iron sulfate kills photoreceptors and induces photoreceptor-dependent RPE autofluorescence. Redox Biol 2020, 34, 101469. [Google Scholar] [CrossRef]
- Zhao, T.; Guo, X.; Sun, Y. Iron Accumulation and Lipid Peroxidation in the Aging Retina: Implication of Ferroptosis in Age-Related Macular Degeneration. Aging Dis 2021, 12, 529–551. [Google Scholar] [CrossRef]
- Chen, C.; Chen, J.; Wang, Y.; Liu, Z.; Wu, Y. Ferroptosis drives photoreceptor degeneration in mice with defects in all-trans-retinal clearance. J Biol Chem 2021, 296, 100187. [Google Scholar] [CrossRef] [PubMed]
Figure 1.
UV-vis absorption spectrum of immunopurified Rho from bovine ROS, in 2 mM sodium phosphate (NaPi), pH 6.0, 0.05% n-Dodecyl-β-D-maltoside (DM). The spectrum shows the characteristic bands at 280 nm (opsin) and 500 nm (11CR bound to opsin).
Figure 1.
UV-vis absorption spectrum of immunopurified Rho from bovine ROS, in 2 mM sodium phosphate (NaPi), pH 6.0, 0.05% n-Dodecyl-β-D-maltoside (DM). The spectrum shows the characteristic bands at 280 nm (opsin) and 500 nm (11CR bound to opsin).
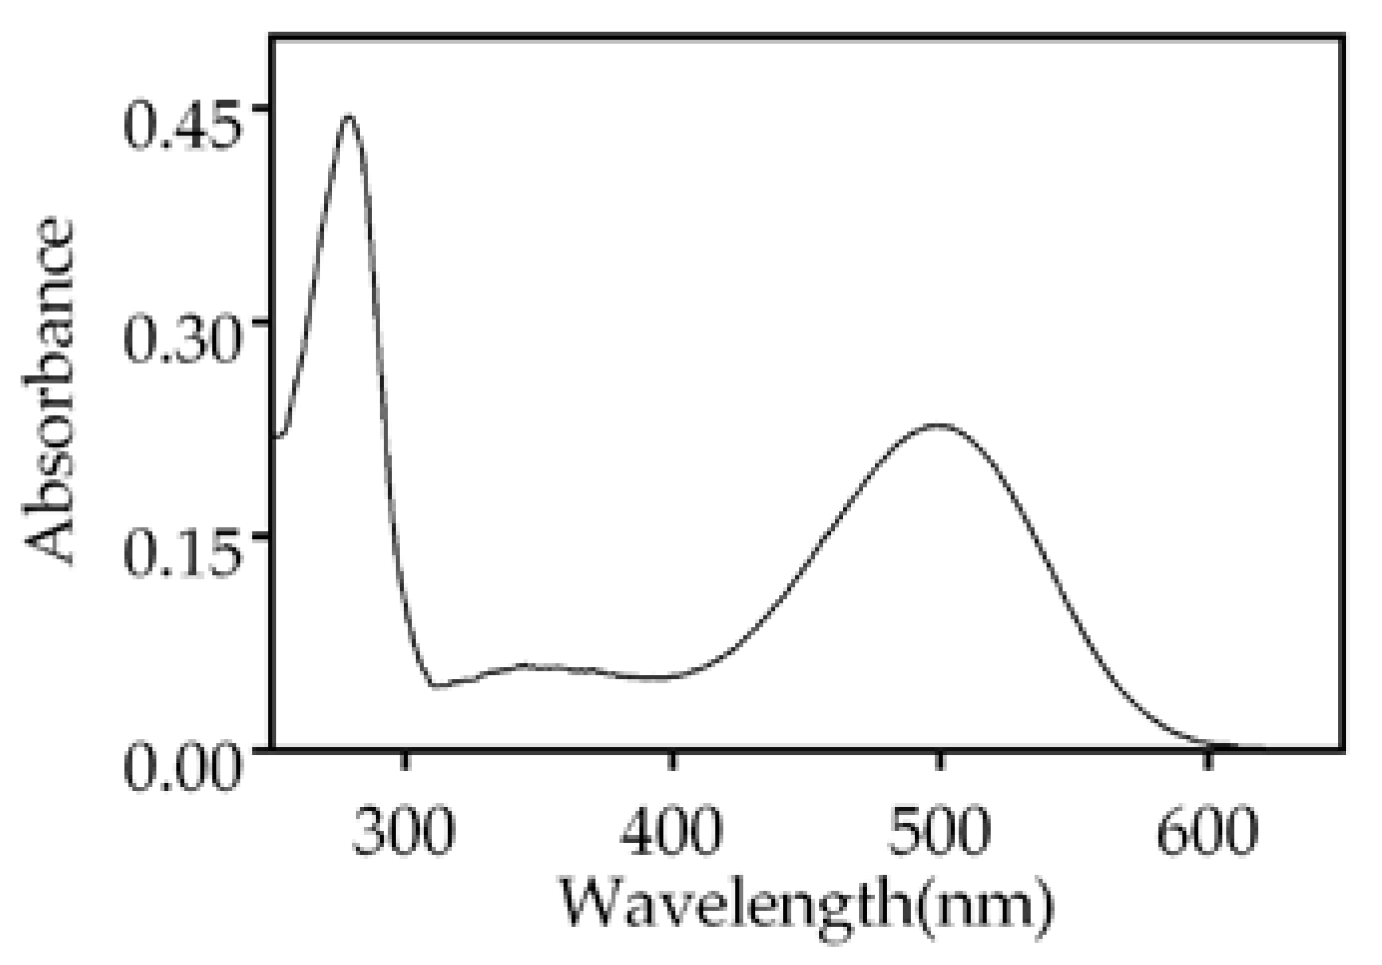
Figure 2.
The UV-vis absorption spectra of Rho were obtained following pre-treatment with various metals under different experimental conditions. Spectra of samples were recorded in the dark state (dark, solid line), after metal addition (dark, dashed red line), upon photobleaching for 30 s (light, dashed line) and after acidification with 2N H2SO4 (acid, dotted line). Samples were respectively treated with Fe3+, Cu2+ and Fe2+, at a final concentration of 50 μM. All the above experiments were conducted at 20ºC.
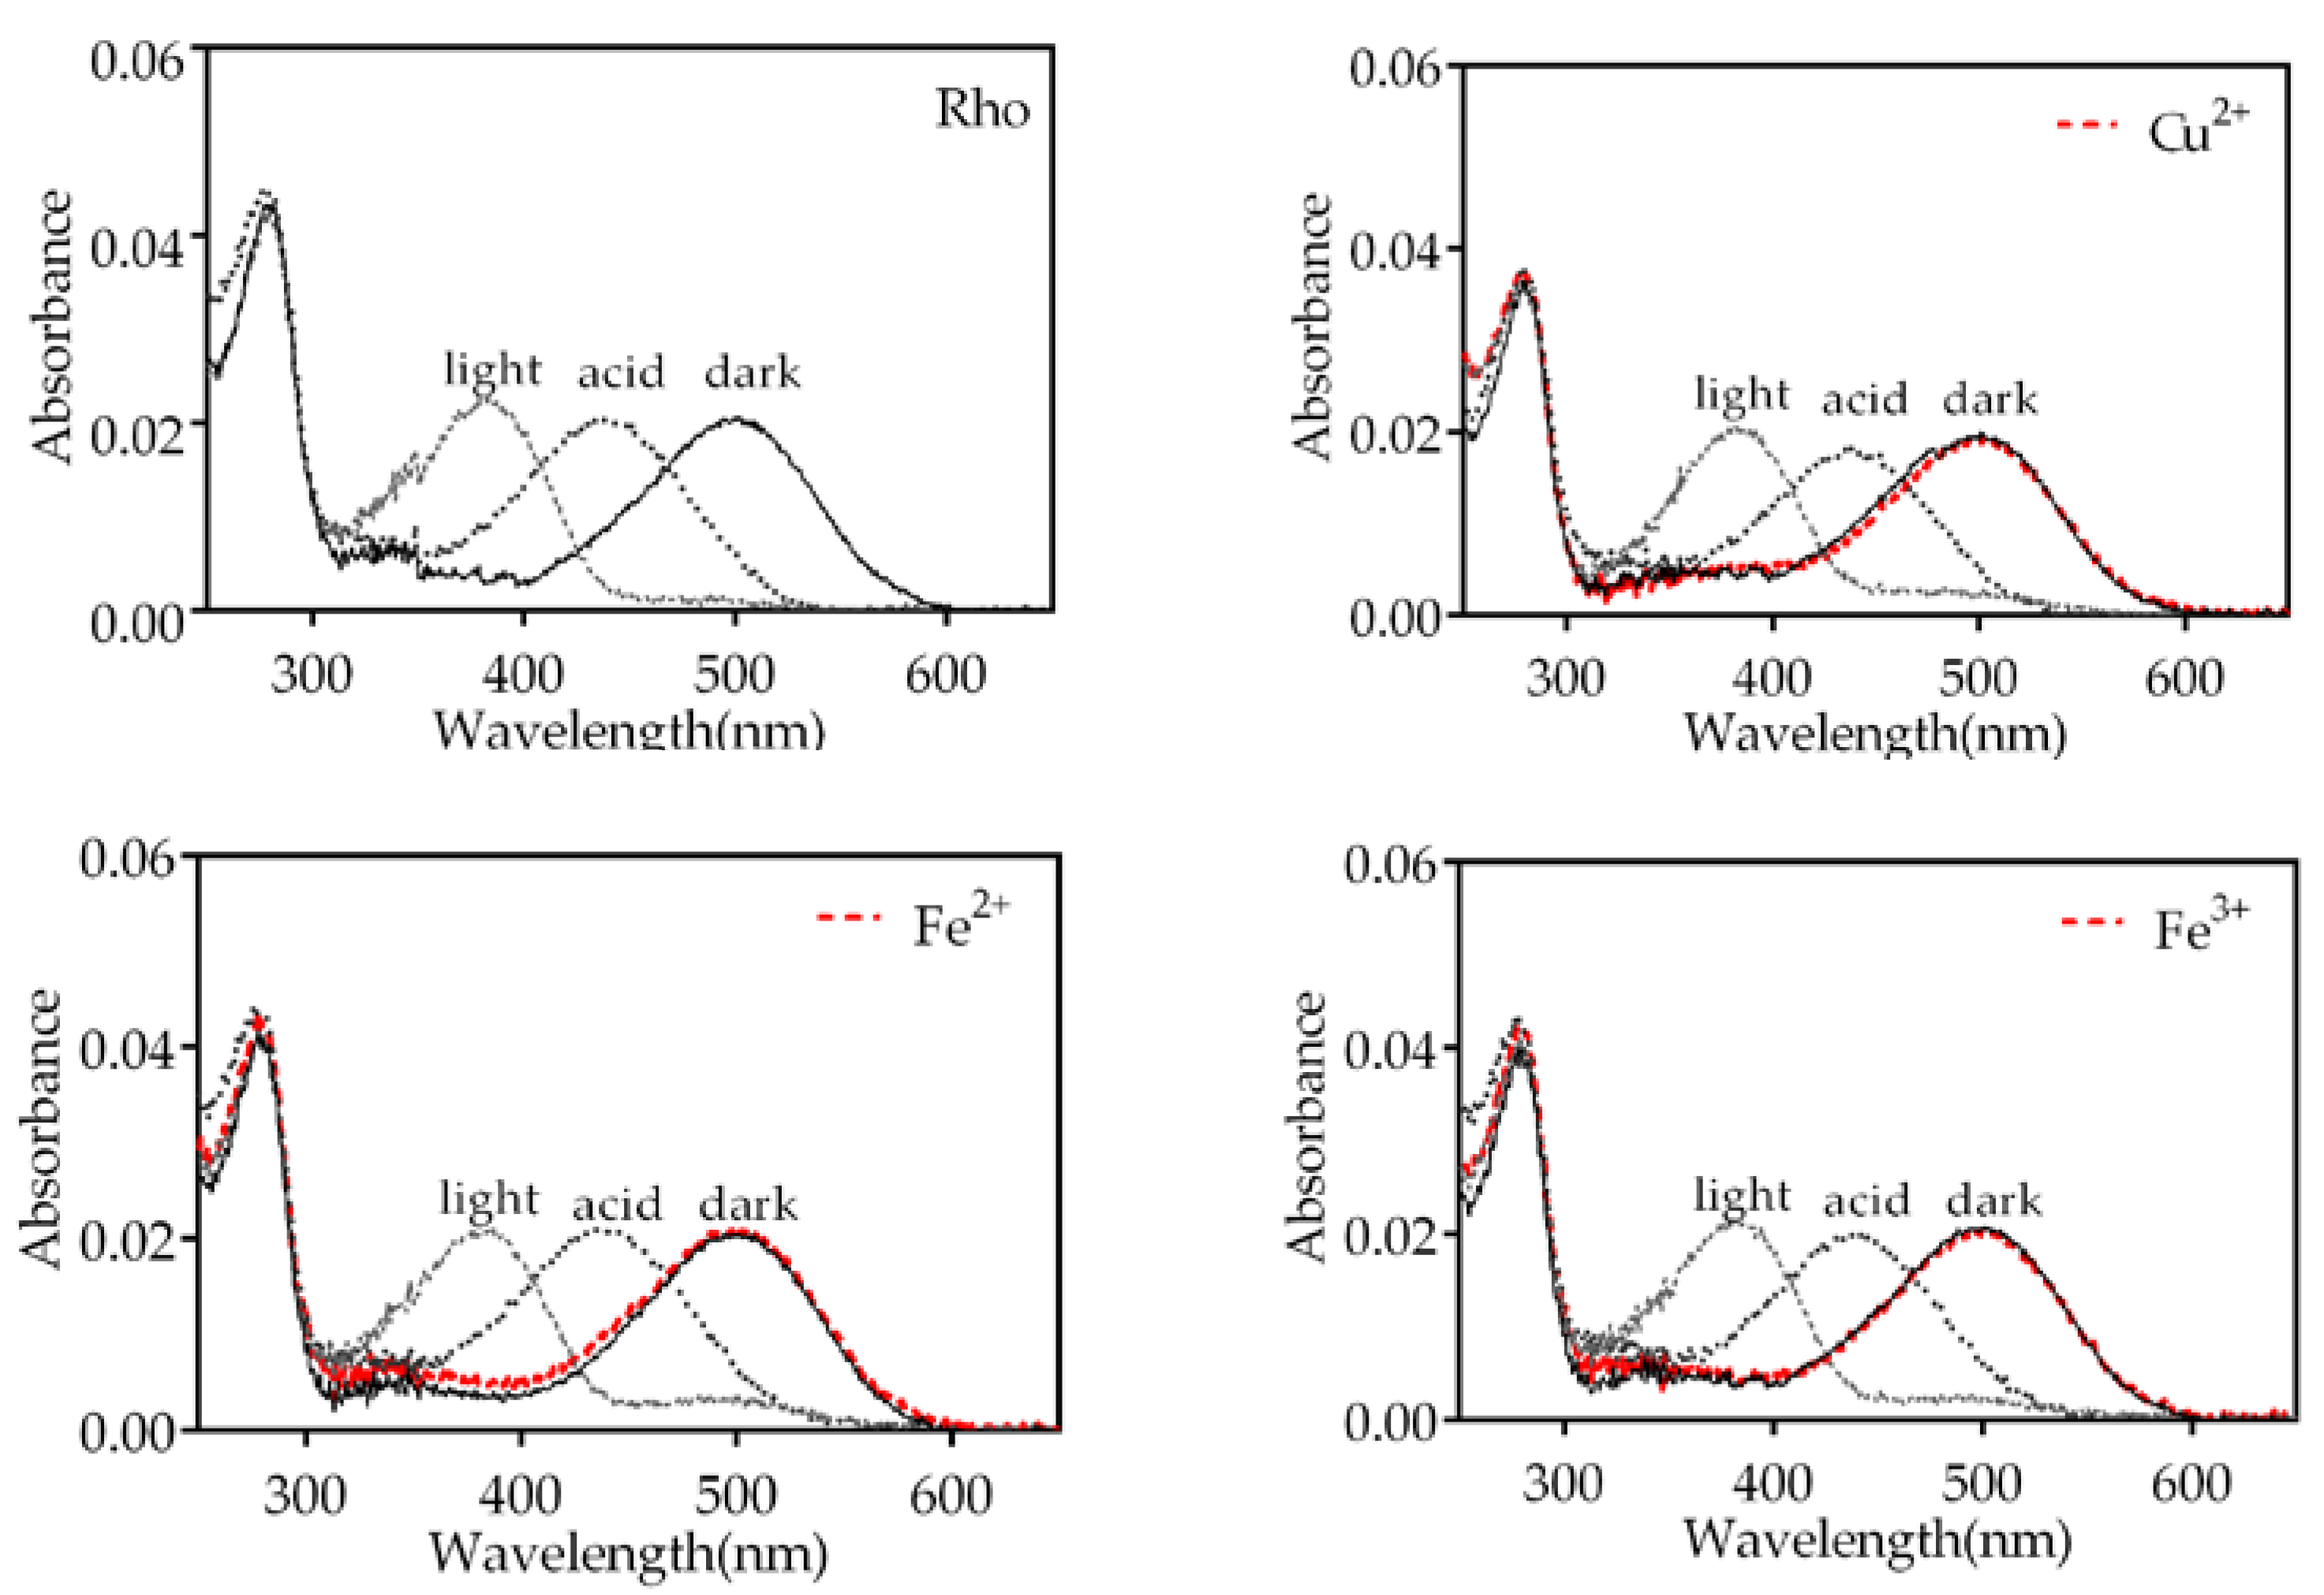
Figure 3.
Effects of selected trace metals on the thermal stability of Rho in vitro. Under dark conditions, each trace metal was added separately to the sample at a final concentration of 50 μM. The absorbance of the sample was recorded in the wavelength range of 250 nm-650 nm at 48°C, with measurements taken every 2 min for a total duration of 100 min. The absorbance at 500 nm was plotted, and the half-life (t1/2) of the process was calculated based on the fitted curves. Mean and standard error of mean values were derived from independent repeated experiments (n=3, p<0.05).
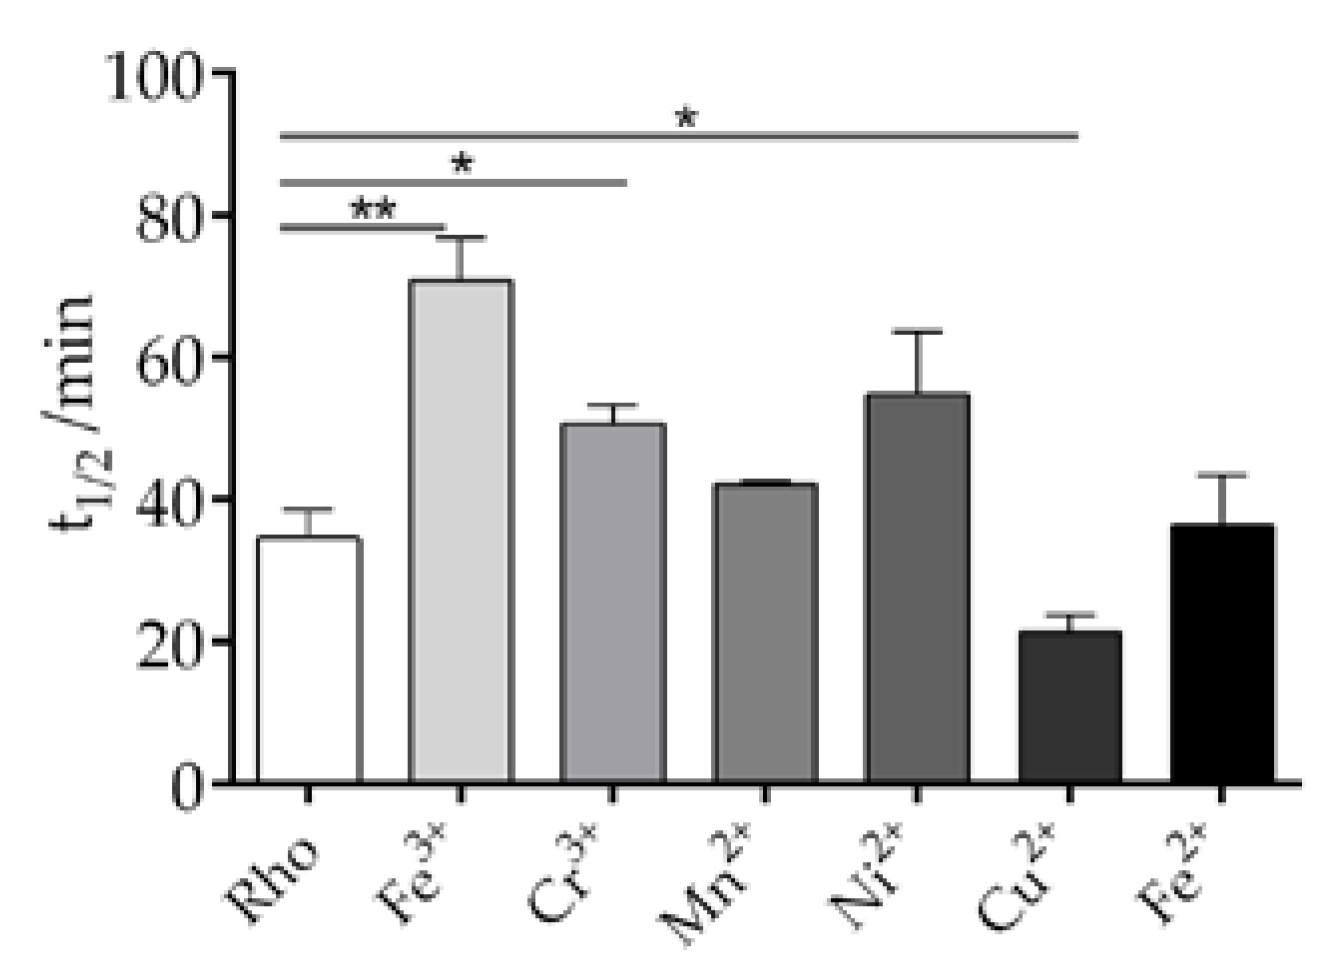
Figure 4.
Effect of trace elements on the chromophore regeneration of Rho. The impact of trace elements on Rho regeneration was determined. Different metals and 11CR were added and the dark spectra were measured. Samples were subsequently photobleached and spectra were recorded every 2 min at 20ºC min. The absorbance at 500 nm was plotted, and the mean and standard error of mean were calculated based on independent repeated experiments. a) the t1/2 of the process were calculated from the fitted curves. b) regeneration percentage of Rho. The ratio of the amount of regenerated Rho to the original Rho was calculated. Mean and standard error of mean values were derived from independent repeated experiments (n=3).
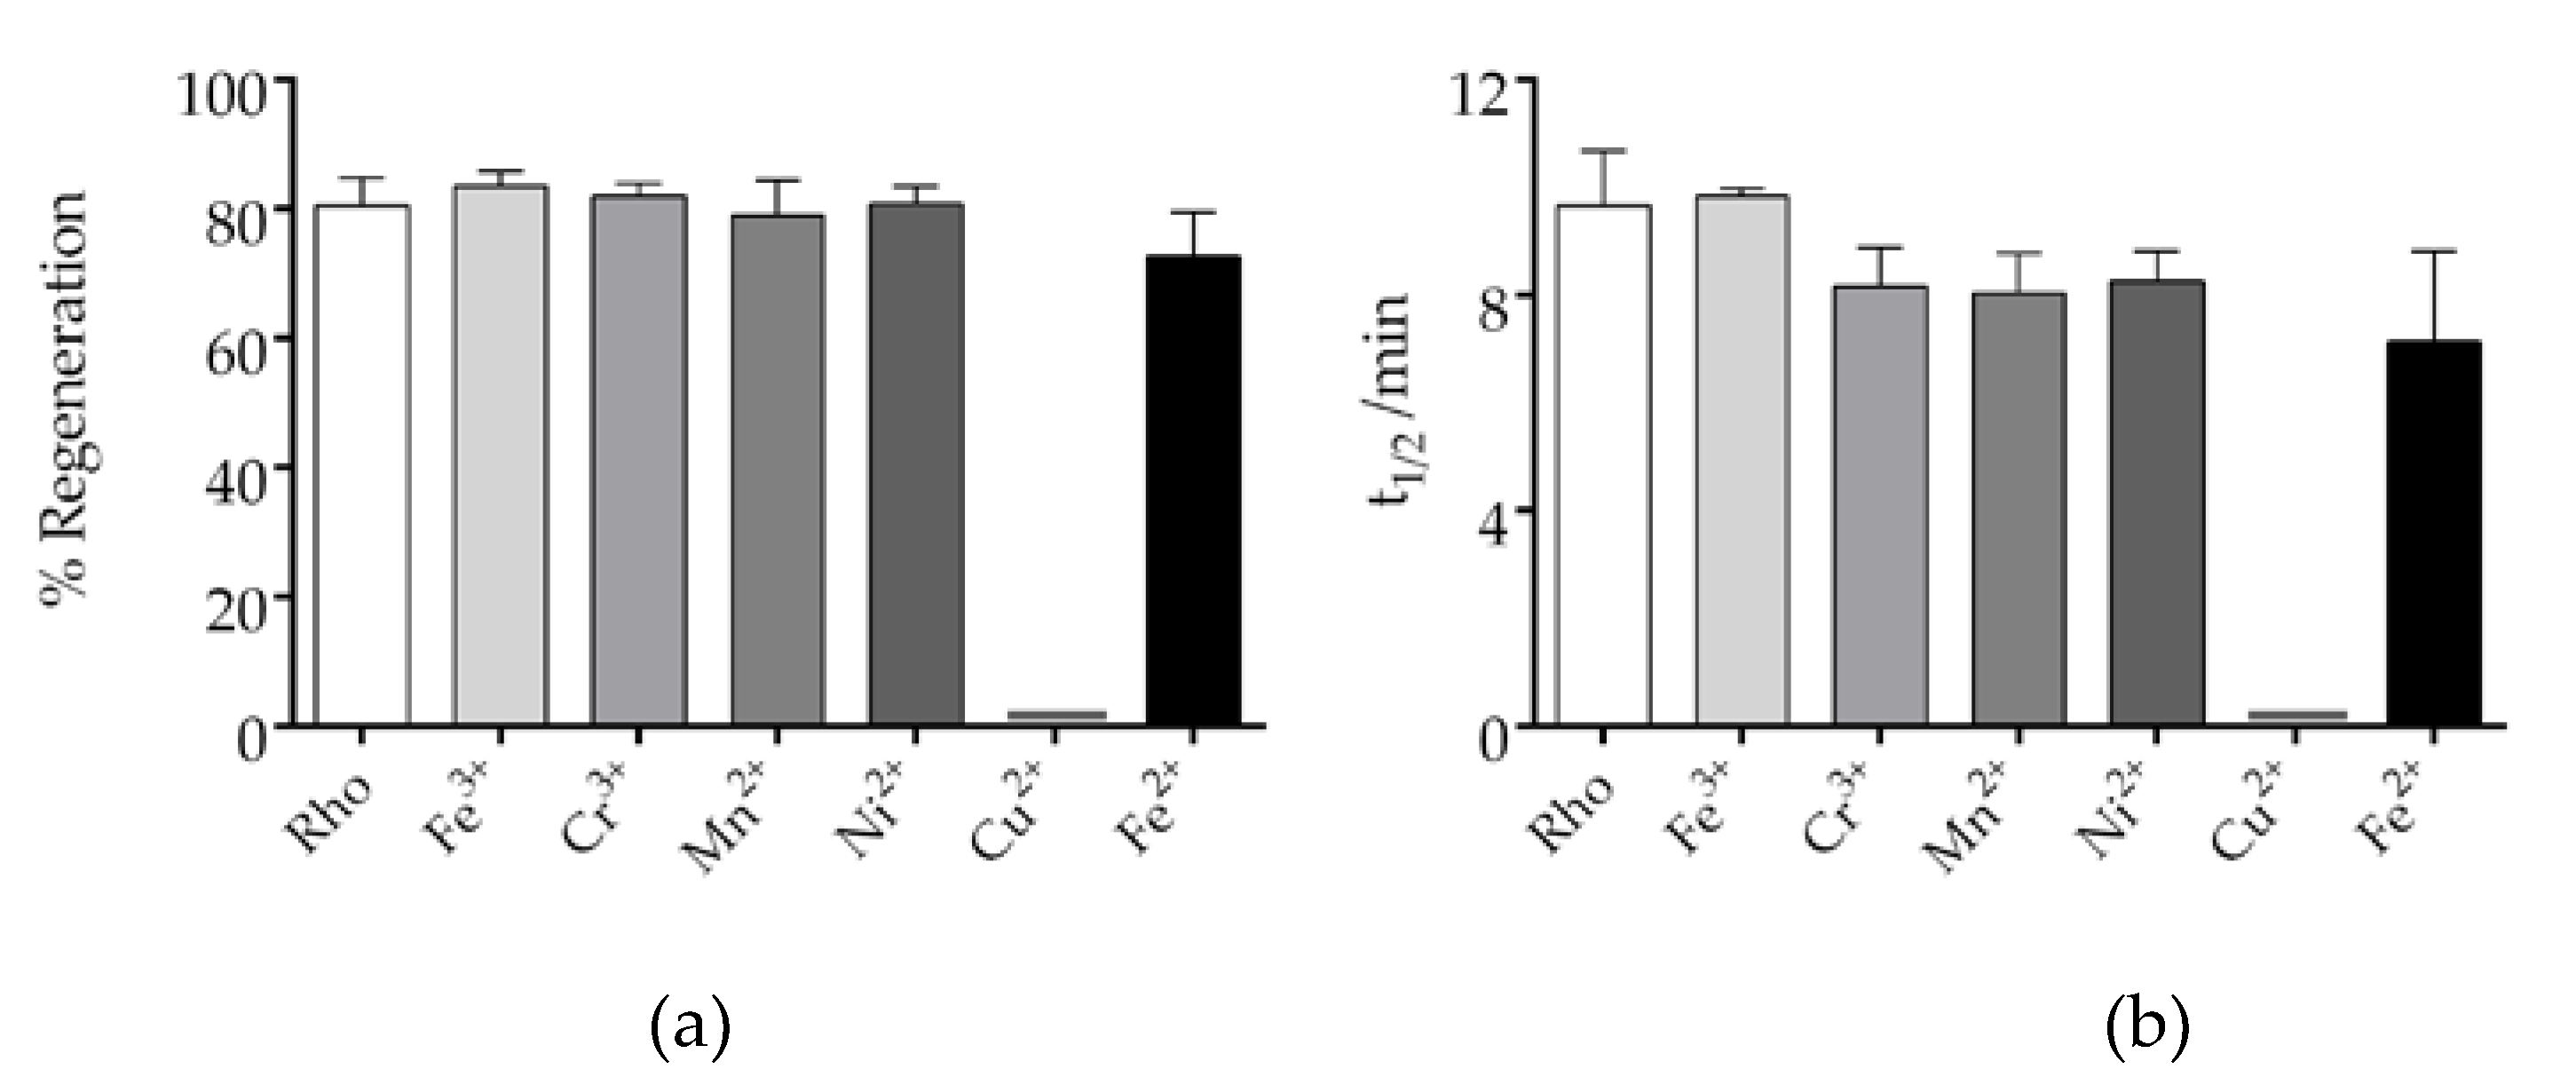
Figure 5.
Meta II stability of Rho treated with or without metals. Fluorescence curves were recorded on a PTI Quanta Master 4 spectrofluorometer with a sample 0.5 µM Rho in the absence and the presence of metals at 20ºC. The fluorescence signal of Trp265 gradually increased over time, as a result of retinal leaving its binding pocket, until it reached a plateau.
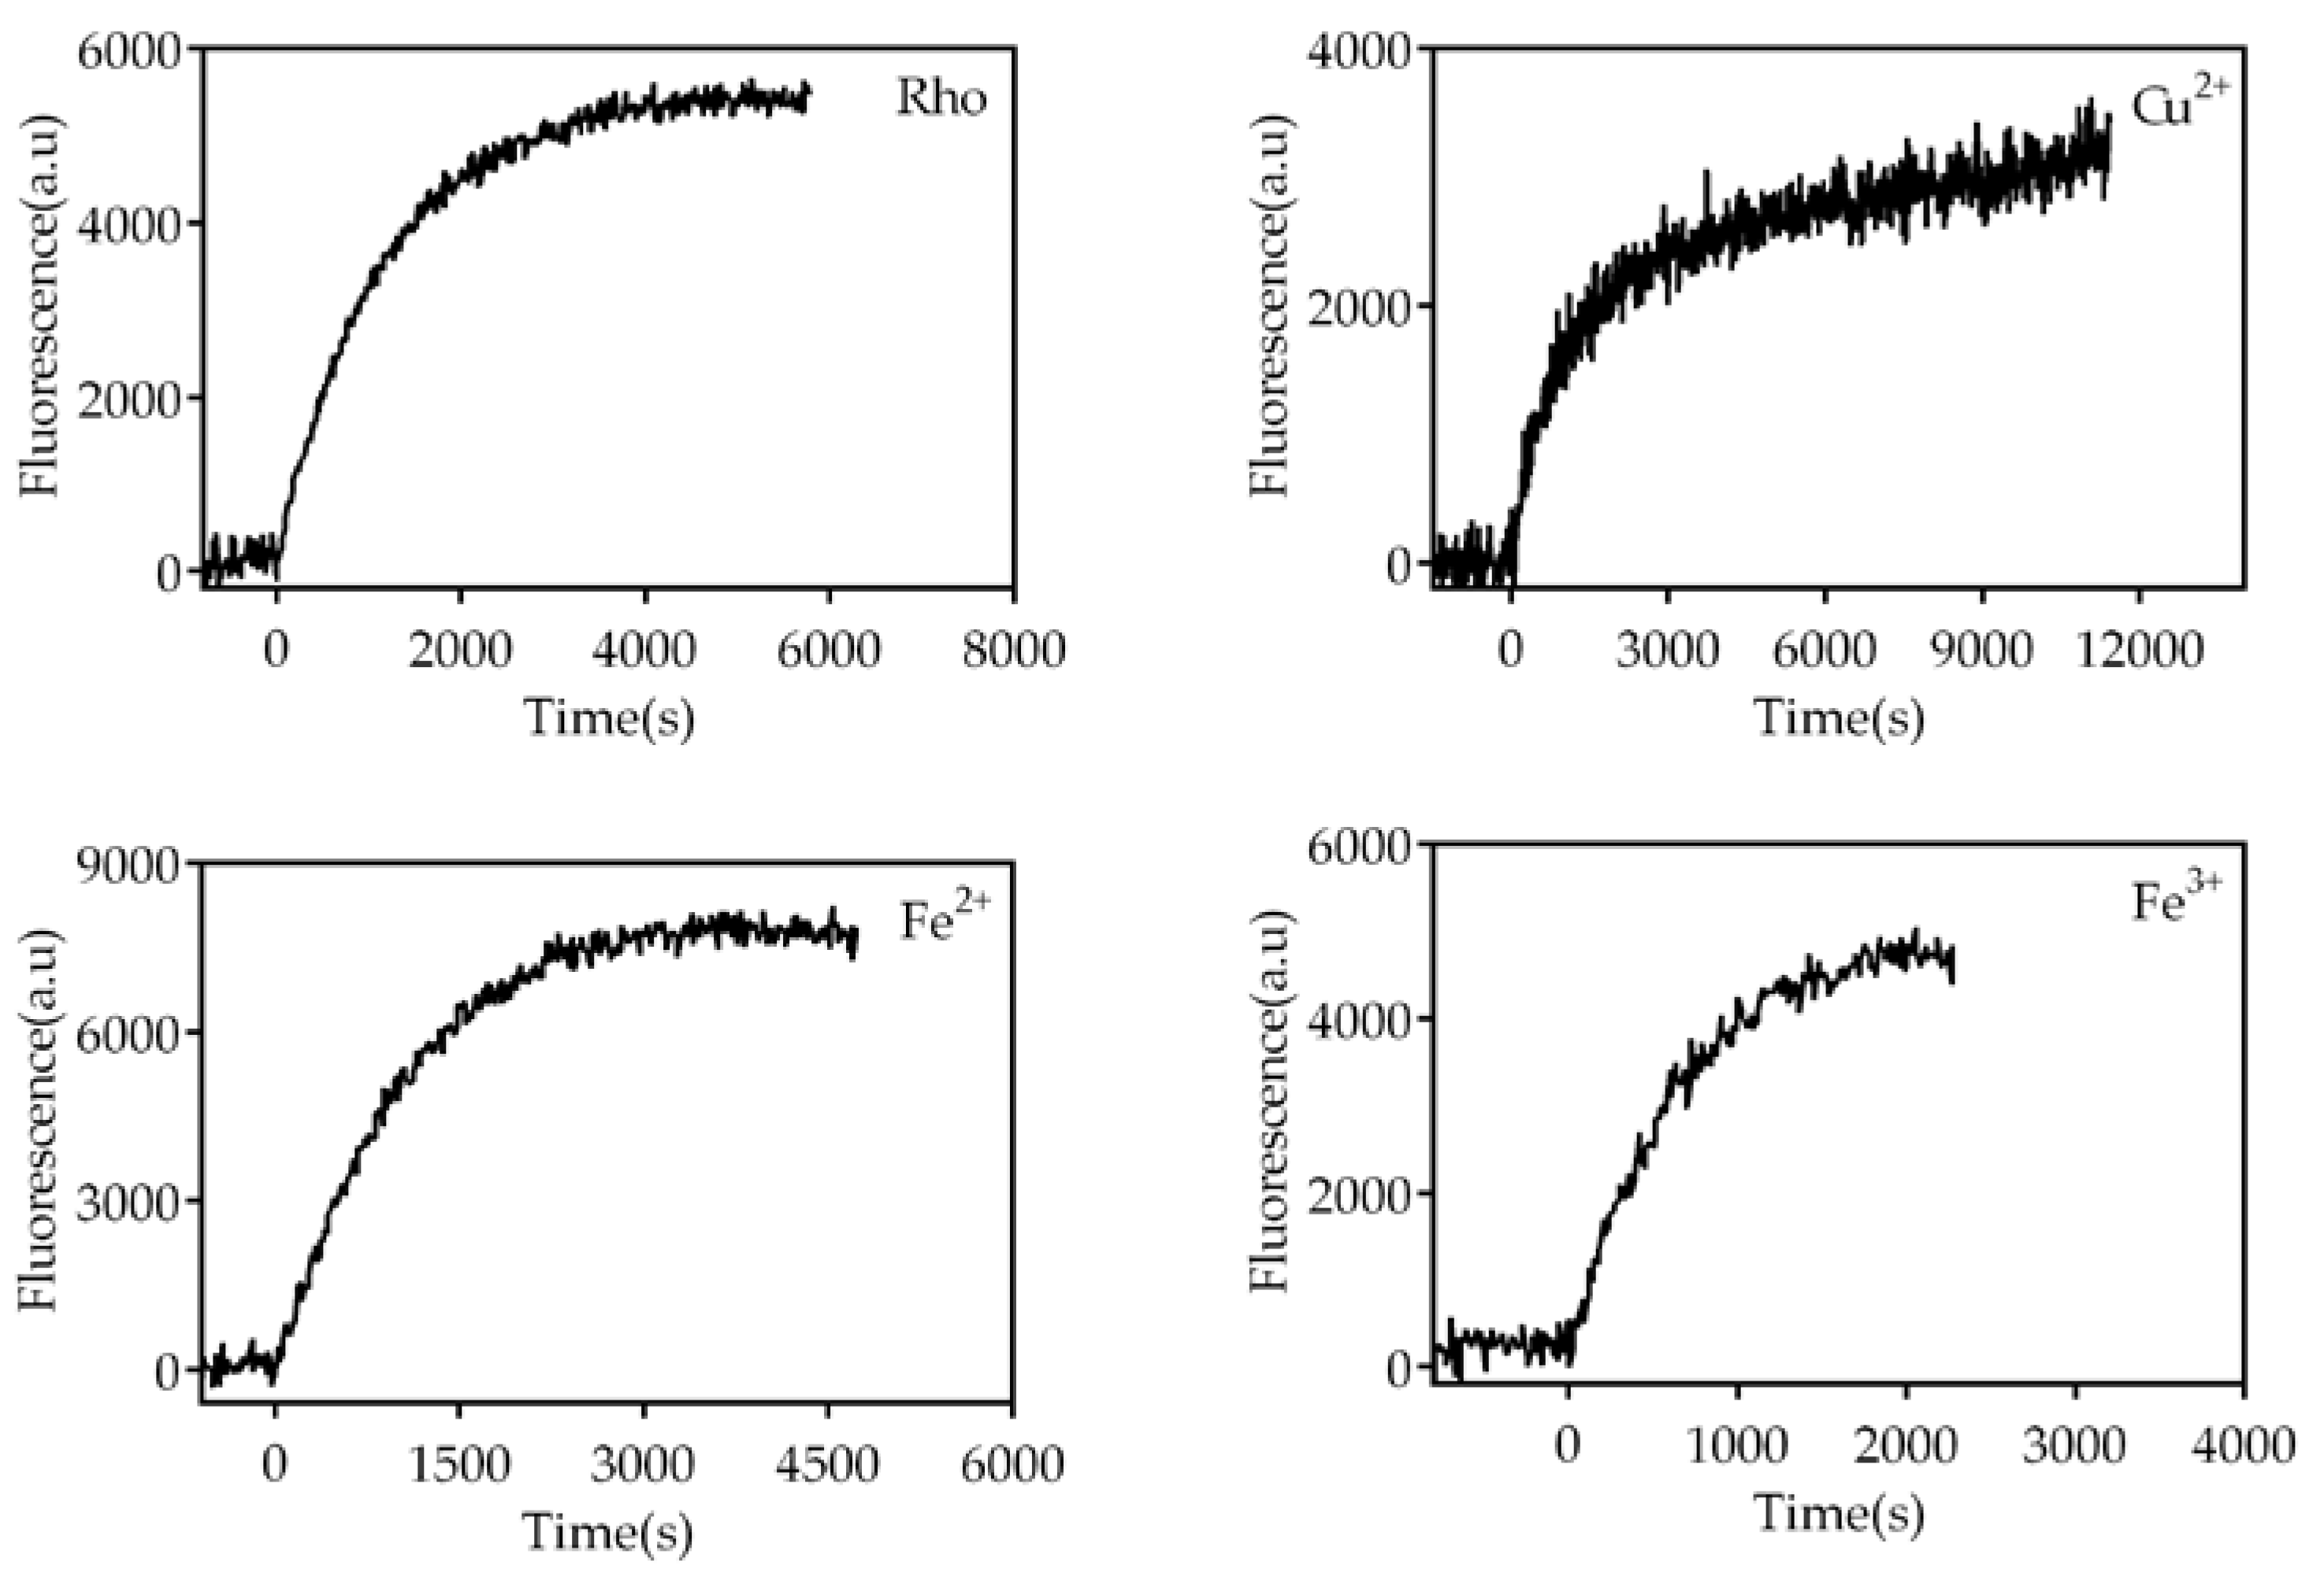
Figure 6.
Effects of trace elements on Meta II. half-life time Upon excitation with light at 295 nm, Rho undergoes conformational changes, causing the release of bound retinal from the binding pocket and the fluorescence emission of a previously shielded Trp265. The fluorescence signal increase was recorded using a spectrofluorometer and the t1/2 of the Meta II decay process was determined. Mean and standard error of mean values were derived from independent repeated experiments (n=3, p<0.05).
Disclaimer/Publisher’s Note: The statements, opinions and data contained in all publications are solely those of the individual author(s) and contributor(s) and not of MDPI and/or the editor(s). MDPI and/or the editor(s) disclaim responsibility for any injury to people or property resulting from any ideas, methods, instructions or products referred to in the content. |
© 2023 by the authors. Licensee MDPI, Basel, Switzerland. This article is an open access article distributed under the terms and conditions of the Creative Commons Attribution (CC BY) license (http://creativecommons.org/licenses/by/4.0/).
Copyright: This open access article is published under a Creative Commons CC BY 4.0 license, which permit the free download, distribution, and reuse, provided that the author and preprint are cited in any reuse.


