Submitted:
11 June 2023
Posted:
12 June 2023
You are already at the latest version
Abstract
Extreme heat is a climate, public health, and environmental justice issue. This case study examined public transit exposure and vulnerability to extreme heat by investigating the microenvironment, land cover characteristics, and social vulnerability of heat-vulnerable bus stops in Knoxville, Tennessee. The community’s temperature and Heat Index information, bus stop point data, land cover characteristics data, and the microenvironment of bus stops (i.e., trees and shelters) were processed and mapped with ArcGIS Pro. The pictures of the microenvironment of the bus stop were collected from Google Maps, and the social vulnerability of the area where the bus stops are located was investigated by analyzing the Center for Disease and Prevention's Social Vulnerability Index. Results found that the most heat-vulnerable bus stops were concentrated in West Knoxville, South, North, Northeast, and Northwest Knoxville. In addition, the most heat-vulnerable bus stops were concentrated in commercial complexes and areas a large number of systematically marginalized populations reside.
Keywords:
environmental justice
; urban heat island
; extreme heat
; heat vulnerability
; public transportation infrastructure
1. Introduction
Climate change can exacerbate existing urban quality of life challenges, including social inequality, deteriorating infrastructure, and ecological stress [1]. The combination of rising average temperatures due to climate change and urbanization contributes to an intensified “Urban Heat Island (UHI),” where temperatures in cities are higher than in suburbs or rural areas [2]. UHIs increase the intensity and duration of extreme heat, raising the physical damage and fatality rates caused by heat stress [3]. Extreme heat causes more deaths (around 1,500 per year) than other severe weather events in the USA [4]. The majority of heat-related deaths in the U.S. over the past 15 years have happened in the 175 largest U.S. cities, which account for 65% of the country’s population [5].
Extreme heat is a climate, public health, and environmental justice issue [6]. Due to historical urban policies like redlining, there are currently disparities in exposure to intra-urban heat [7]. Communities predominantly inhabited by people of color are more likely to be at risk from urban heat due to limited access to green space [8]. Also, systematically marginalized populations are more likely to rely on public transport due to lower income [9]. Despite the increased risk of heat exposure from using public transport, not many studies have investigated the relationship between the microenvironment of public transport infrastructure and the social vulnerability of the area where it is located.
This study examines the relationship between public transportation infrastructure and social vulnerability in the context of UHI in Knoxville, Tennessee. By identifying the most heat-vulnerable bus stops, investigating microenvironments (i.e., characteristics of land cover, presence of trees and shelters) of identified bus stops, and the social vulnerabilities of census tracts where the bus stops are located, this study provides a foundation for strategies to develop urban infrastructure to mitigate UHI effects at the community level.
2. Background
2.1. Extreme HEAT and Spatial Inequality
Place-based structural disparities can seriously impact systematically disadvantaged populations’ health [10]. Redlining was one of the policies that formalized racial and ethnic segregation and further cemented housing segregation that has linked disparities of income, education, community infrastructure, and built environments, and declining home values [11,12,13,14]. Redlined neighborhoods have historically had more enormous proportions of residents who are socioeconomically disadvantaged as well as more deteriorated housing and infrastructure, all of which contribute to the communities’ poor performance during extreme heat, lack of heat mitigation amenities, and higher levels of exposure to ambient heat [7]. For example, the proportion of trees and canopies critical to mitigating UHIs is lower in areas populated primarily by Black/African Americans, Hispanics/Latinos, and low-income populations [7,15].
One of the health consequences increasingly related to cities’ spatial characteristics is urban heat stress and heat-related health risks [4,16]. In the United States, extreme heat is the severe weather event that results in the most fatalities [4]. Previous studies have revealed racial and socioeconomic disparities in heat-related mortality and morbidity [7]. Health burden from extreme heat is disproportionately increased in groups physiologically sensitive to heat events or with fewer adaptive resources, such as older people, people with less income, and less social connectivity [17]. These socioeconomic and demographic factors, described as the social vulnerability related to the interaction of hazards of place (risk and mitigation) with the communities’ social profile [18,19], can help explain the disparities in heat-related health risks [7].
Hazard (i.e., the spatial distribution of potential harm), exposure (i.e., the intersection of the spatial distribution of human populations with the hazard), and vulnerability (i.e., the propensity to suffer harm when exposed to the hazard) are the three components that typically make up an environmental risk analysis [4]. A comprehensive examination of the physical characteristics of heat exposure areas, the degree and distribution of heat, and the intersection of social vulnerabilities in heat-exposed populations will help better explain the relationship between structural and spatial inequality and socioeconomic disparities and understand heat-related health risks in urban areas.
2.2. Extreme Heat and Urban Transport Infrastructure
To mitigate the adverse effects of UHIs and protect the health of residents from extreme heat, state and local governments have undertaken a range of interventions and actions, such as implementing urban greening and microclimate modification [20]. These initiatives mainly concentrate on planting trees, creating urban gardens and forests, and modifying commercial buildings by adding living walls and green roofs. These actions focus on modifying the physical environment of urban surfaces and modifying the architecture of buildings [21,22].
However, to improve the development of more resilient cities and protect the health of citizens from the UHIs, sustainable urban infrastructure requires improvements in public transportation [23,24]. So far, policies on the relationship between public transport and UHIs have focused on reducing emissions and preventing environmental pollution by increasing commuters’ options for using public transportation [25] by adopting ‘Transit-oriented development planning (TOD)’ [26,27]. The policy is characterized by access to general urban landscapes rather than focusing on specific areas and populations vulnerable to UHI. However, considering that the effects of UHI vary between regions and populations, and systematically marginalized populations are more likely to rely on public transport, it is essential to identify areas and populations more vulnerable to extreme heat and to relate public transport infrastructure and social vulnerabilities.
3. Methods
3.1. Study Area
Knoxville is the third largest city in Tennessee, with a population of about 192,648 in 2021 [28]. It is located at the western foot of the Great Smoky Mountains, part of the Appalachian Mountains in eastern Tennessee. Knoxville’s average temperatures range is from 26~53 ºF in the winter to 57~87 ºF in the summer, with an average of 34 days per year of extreme heat (>= to 90 ºF) and 68 days per year of extreme cold (<= 32 ºF). The average rainfall is 51.93 inches [29]. In a year between 1985-2005, residents in Knoxville experienced about seven days above 93.1ºF in a year. By 2050, people in Knoxville will experience an average of about 46 days per year over 93.1ºF [30]. The city’s population is predominantly white (74.9%), with 16.4% black/African American and 5.7% Latino/Hispanic population. The median household income is $44,308, $23,192 less than the national average of $67,500 [28].
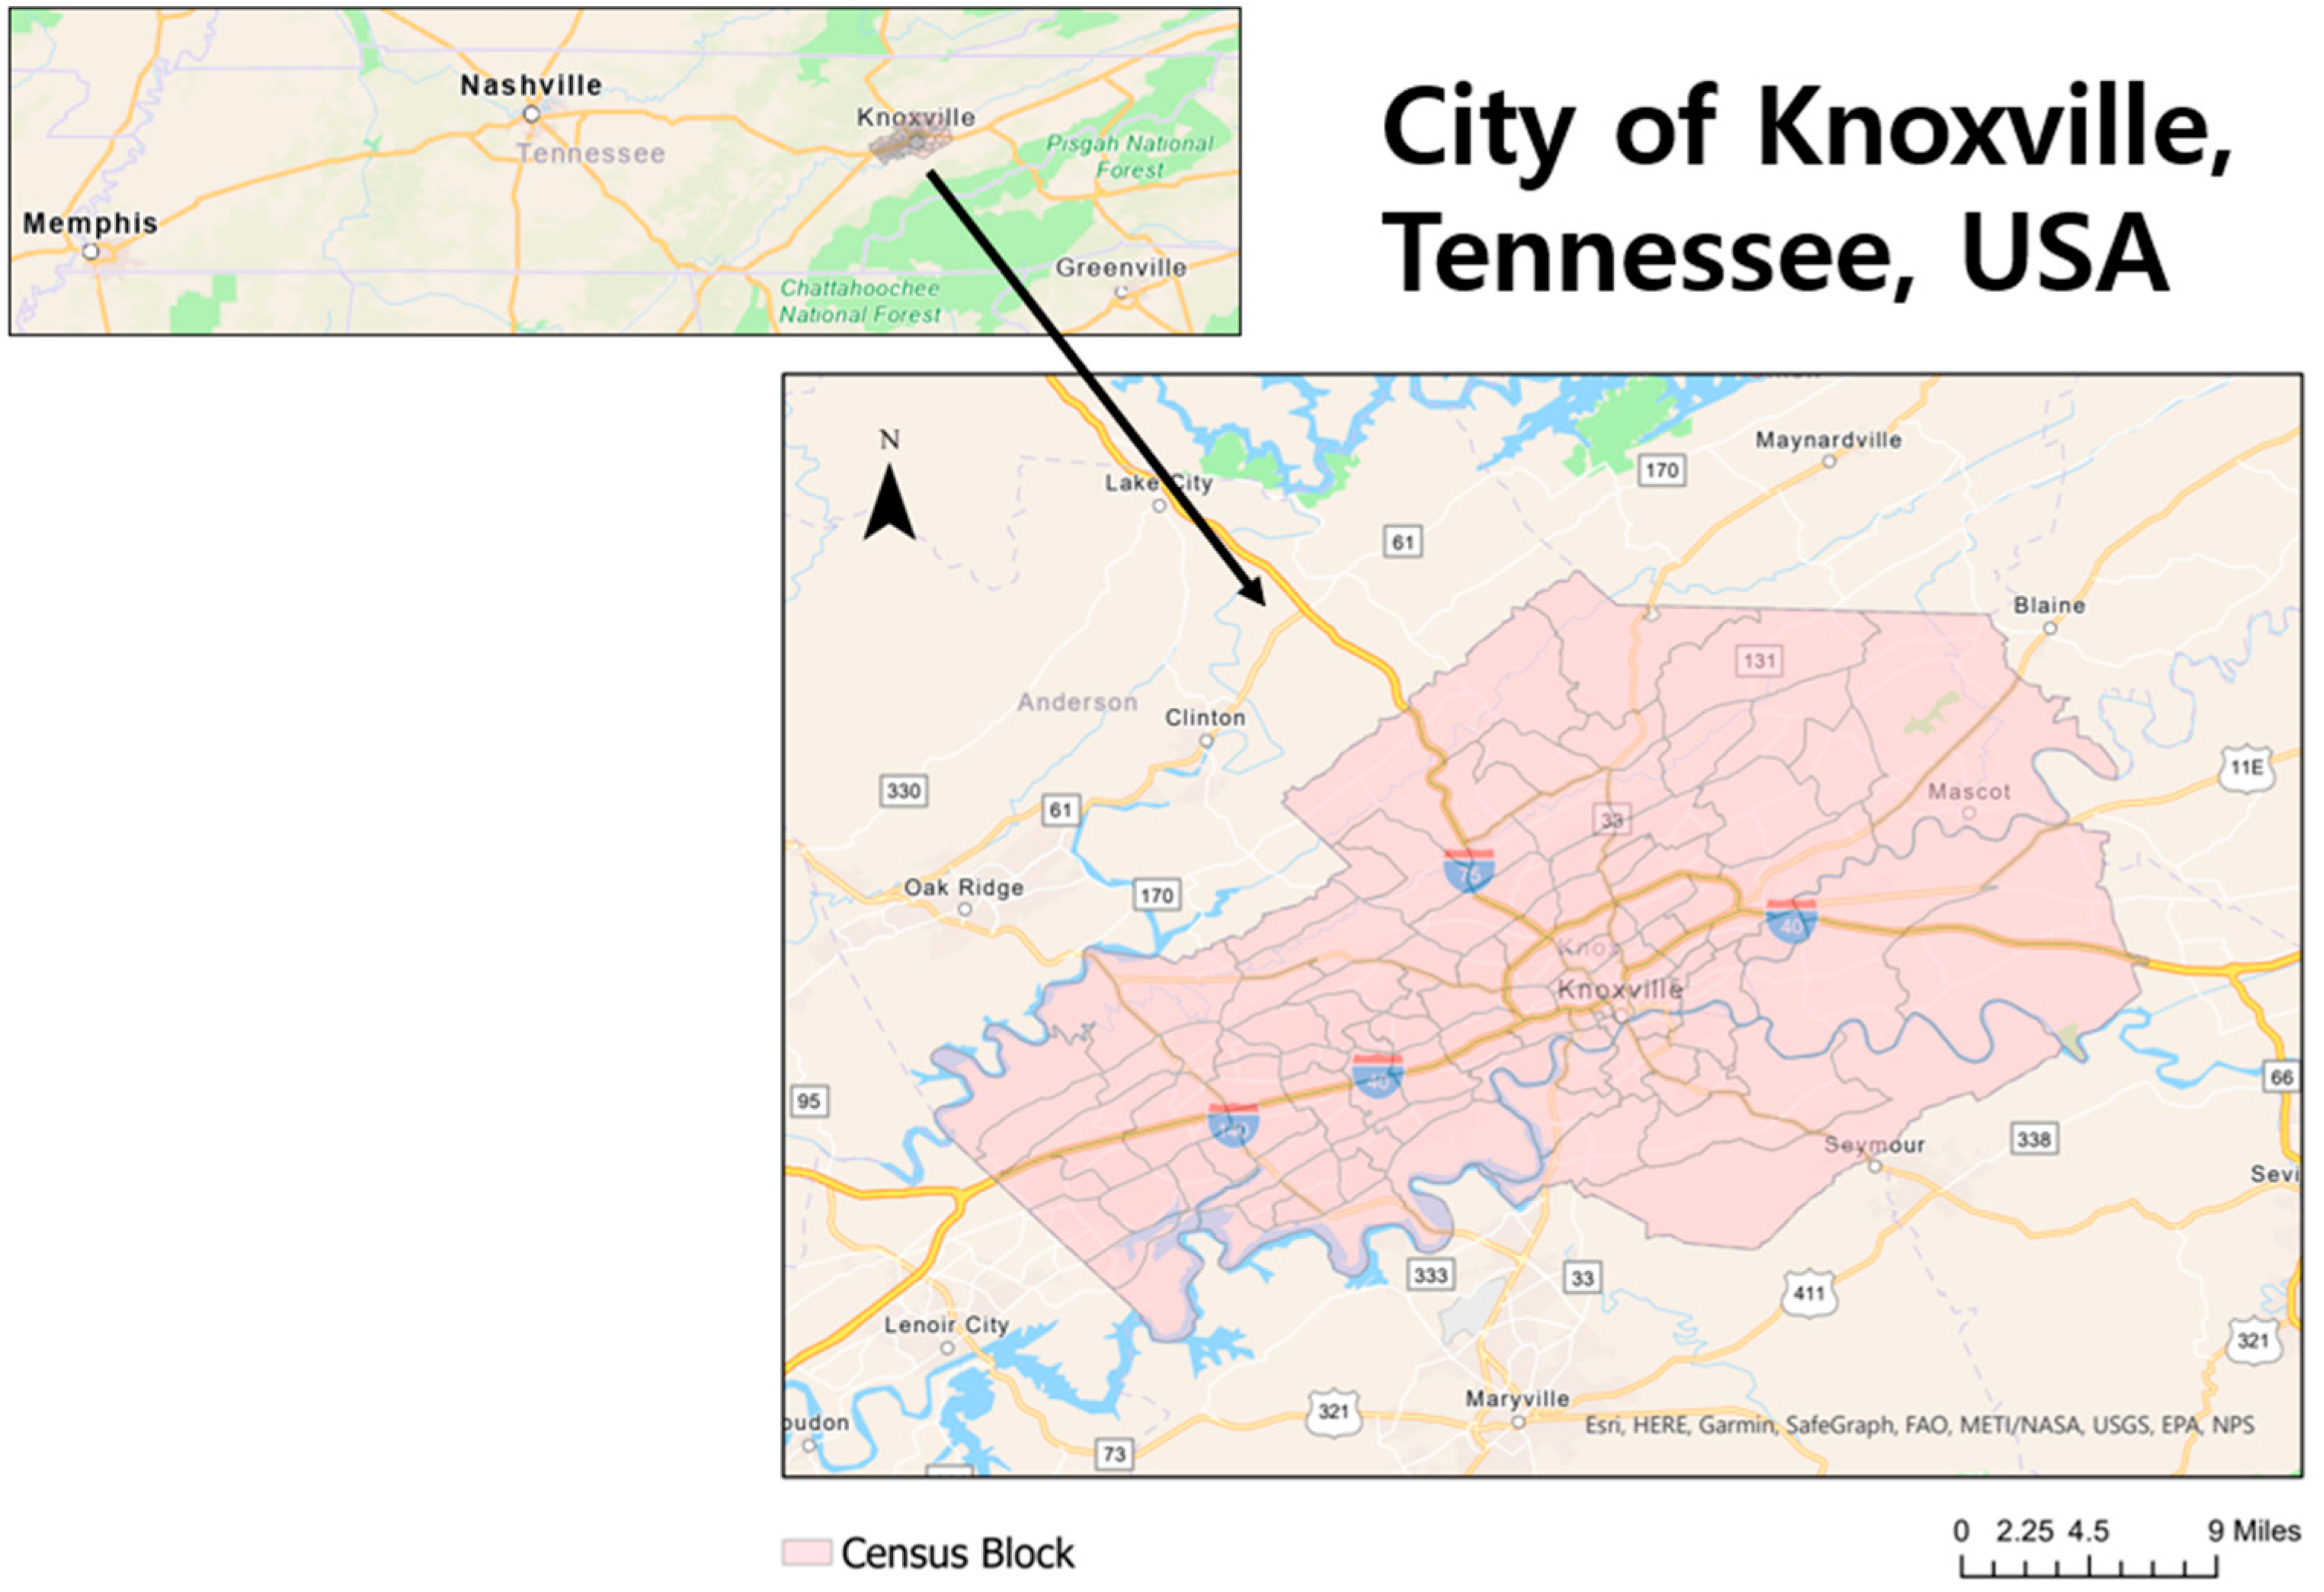
Figure 1.
Reference map for the City of Knoxville.
3.2. Data Acquisition and Processing
3.2.1. Maps of Temperature and Heat Index
Heat map shape files were obtained from the Knoxville Heat Equity Coalition website’s ‘2022 Knoxville’s Heat Mapping Report’ [31]. In August 2022, Knoxville community members drove routes across the city to collect three periods of data collection including 58,264 measurements: morning (6-7am), afternoon (1-2pm), and evening (7-8pm) driving 9 routes over a 104mi2 area. ArcGIS Pro (version 2.8.0) was used to map the raster files of six heat maps (morning, afternoon, and evening temperatures for Knoxville and morning, afternoon, and evening HI for Knoxville).
3.2.2. Location of Bus Stops
We geo-processed the points at Knoxville Area Transit (KAT) bus stops on the heat maps to identify the most heat-vulnerable bus stops. Shapefile of KAT bus stops data was obtained from the General Transit Feed Specification, available on the City of Knoxville’s website [32]. ArcGIS Pro (version 2.8.0) was used to map the bus stop points.
3.2.3. Characteristics of Land Cover
Temperature changes are related to climate change and UHIs. The UHI effect occurs when heat is absorbed and re-radiated due to the conditions associated with the built environment, such as the impervious surfaces’ concentration and loss of tree and canopy cover, creating a heat pocket or “heat island” [33].
We acquired the National Land Cover Dataset 2019 (NLCD 2019) of the United States Geological Survey [34]. We mapped it to examine the characteristics of the land surface where the bus stop is located. NLCD 2019 includes 28 different land cover classes characterizing land cover and land cover change. ArcGIS Pro (version 2.8.0) was used to map the raster data of the NLCD.
3.2.4. Microenvironment of Bus Stops
Trees and shelters at bus stops have been found to protect bus users from extreme heat when using public transport [35,36]. We acquired data from the United States Department of Agriculture (USDA)’s National Agriculture Imagery Program (NAIP) County Mosaic. We mapped it to examine bus stops with shelters and trees [37]. ArcGIS Pro (version 2.8.0) was used to map the raster data of the NAIP raster data. Also, we used Google Maps to collect pictures of some bus stops.
3.2.5. Social Vulnerability
We mapped the US Census Bureau’s TIGER/Line Files shapefile [38] to identify the Census tracts with heat-vulnerable bus stops. We analyzed the 2018 Social Vulnerability Index (SVI) from the Centers for Disease Control and Prevention (CDC) to identify social vulnerabilities in the identified areas. SVI was extracted in CSV File format [39].
4. Results
The 45 most vulnerable stops in Knoxville were identified. 28 bus stops with the highest temperatures on 14 census tracts and 13 areas adjacent to those census tracts (i.e., areas with populations expected to use those heat-vulnerable bus stops) were identified. 17 bus stops with the highest HI on six census tracts and four regions adjacent to the census tracts were identified.
4.1. Bus Stops with the Highest Temperature and with the Highest Heat Index
As a result of mapping the 10 bus stops with the highest temperatures in the morning (6-7 am), afternoon (3-4 pm), and evening (7-8 pm), a total of 28 bus stops were identified, excluding one station that was closed. In addition, as a result of extracting 10 stations with the highest HI (i.e., apparent temperature: the temperature on the human body when relative humidity and air temperature are combined) in the morning, afternoon, and evening, a total of 17 bus stops were identified, excluding one station that was closed.
4.1.1. Bus Stops with the Highest Temperature
The bus stops with the highest temperatures in the study area are located around Kingston Pike and downtown Knoxville. Kingston Pike is the primary route that links West Knoxville and other municipalities in Knox County’s western region with Downtown Knoxville. The route follows a merged stretch of US Route 11 and US 70. The road is a significant commercial thoroughfare home to hundreds of shopping malls, restaurants, and other retail businesses [40]. Identified bus stops are characterized by the following:
1. Morning: The average temperature of the 10 bus stops with the highest temperature in the morning was 74.7 ºF, about 4.2 ºF higher than the average temperature of 70.5 ºF at all bus stops in Knoxville. It was identified that the 10 bus stops with the highest temperature in the morning were distributed around West Town Mall, the largest shopping mall in Knoxville.
2. Afternoon: The average temperature of the 10 bus stops with the highest temperature in the afternoon was 93.2 ºF, about 2.8 ºF higher than the average temperature of 90.5 ºF at all bus stops in Knoxville. Three of the 10 bus stops with the highest afternoon temperatures are located on Broadway, north Knoxville. The other three were found on the east side of the downtown, and the other two were on the west Kingston Pike. One stop was located in Westhaven, approximately 2 miles north of Interstate of I-40 highway, and one was located northwest of I-40.
3. Evening: The average temperature of the 10 bus stops with the highest temperature in the evening was 91.0 ºF, about 3.1 ºF higher than the average temperature of 87.9 ºF at all bus stops in Knoxville. Three of the 10 bus stops with the highest evening temperatures were located west of Kingston Pike. Two are located near the University of Tennessee, and the other two are located on Western Avenue just north of the University of Tennessee. The other two were located east of Knoxville, and one in Nordwood, north of Knoxville.
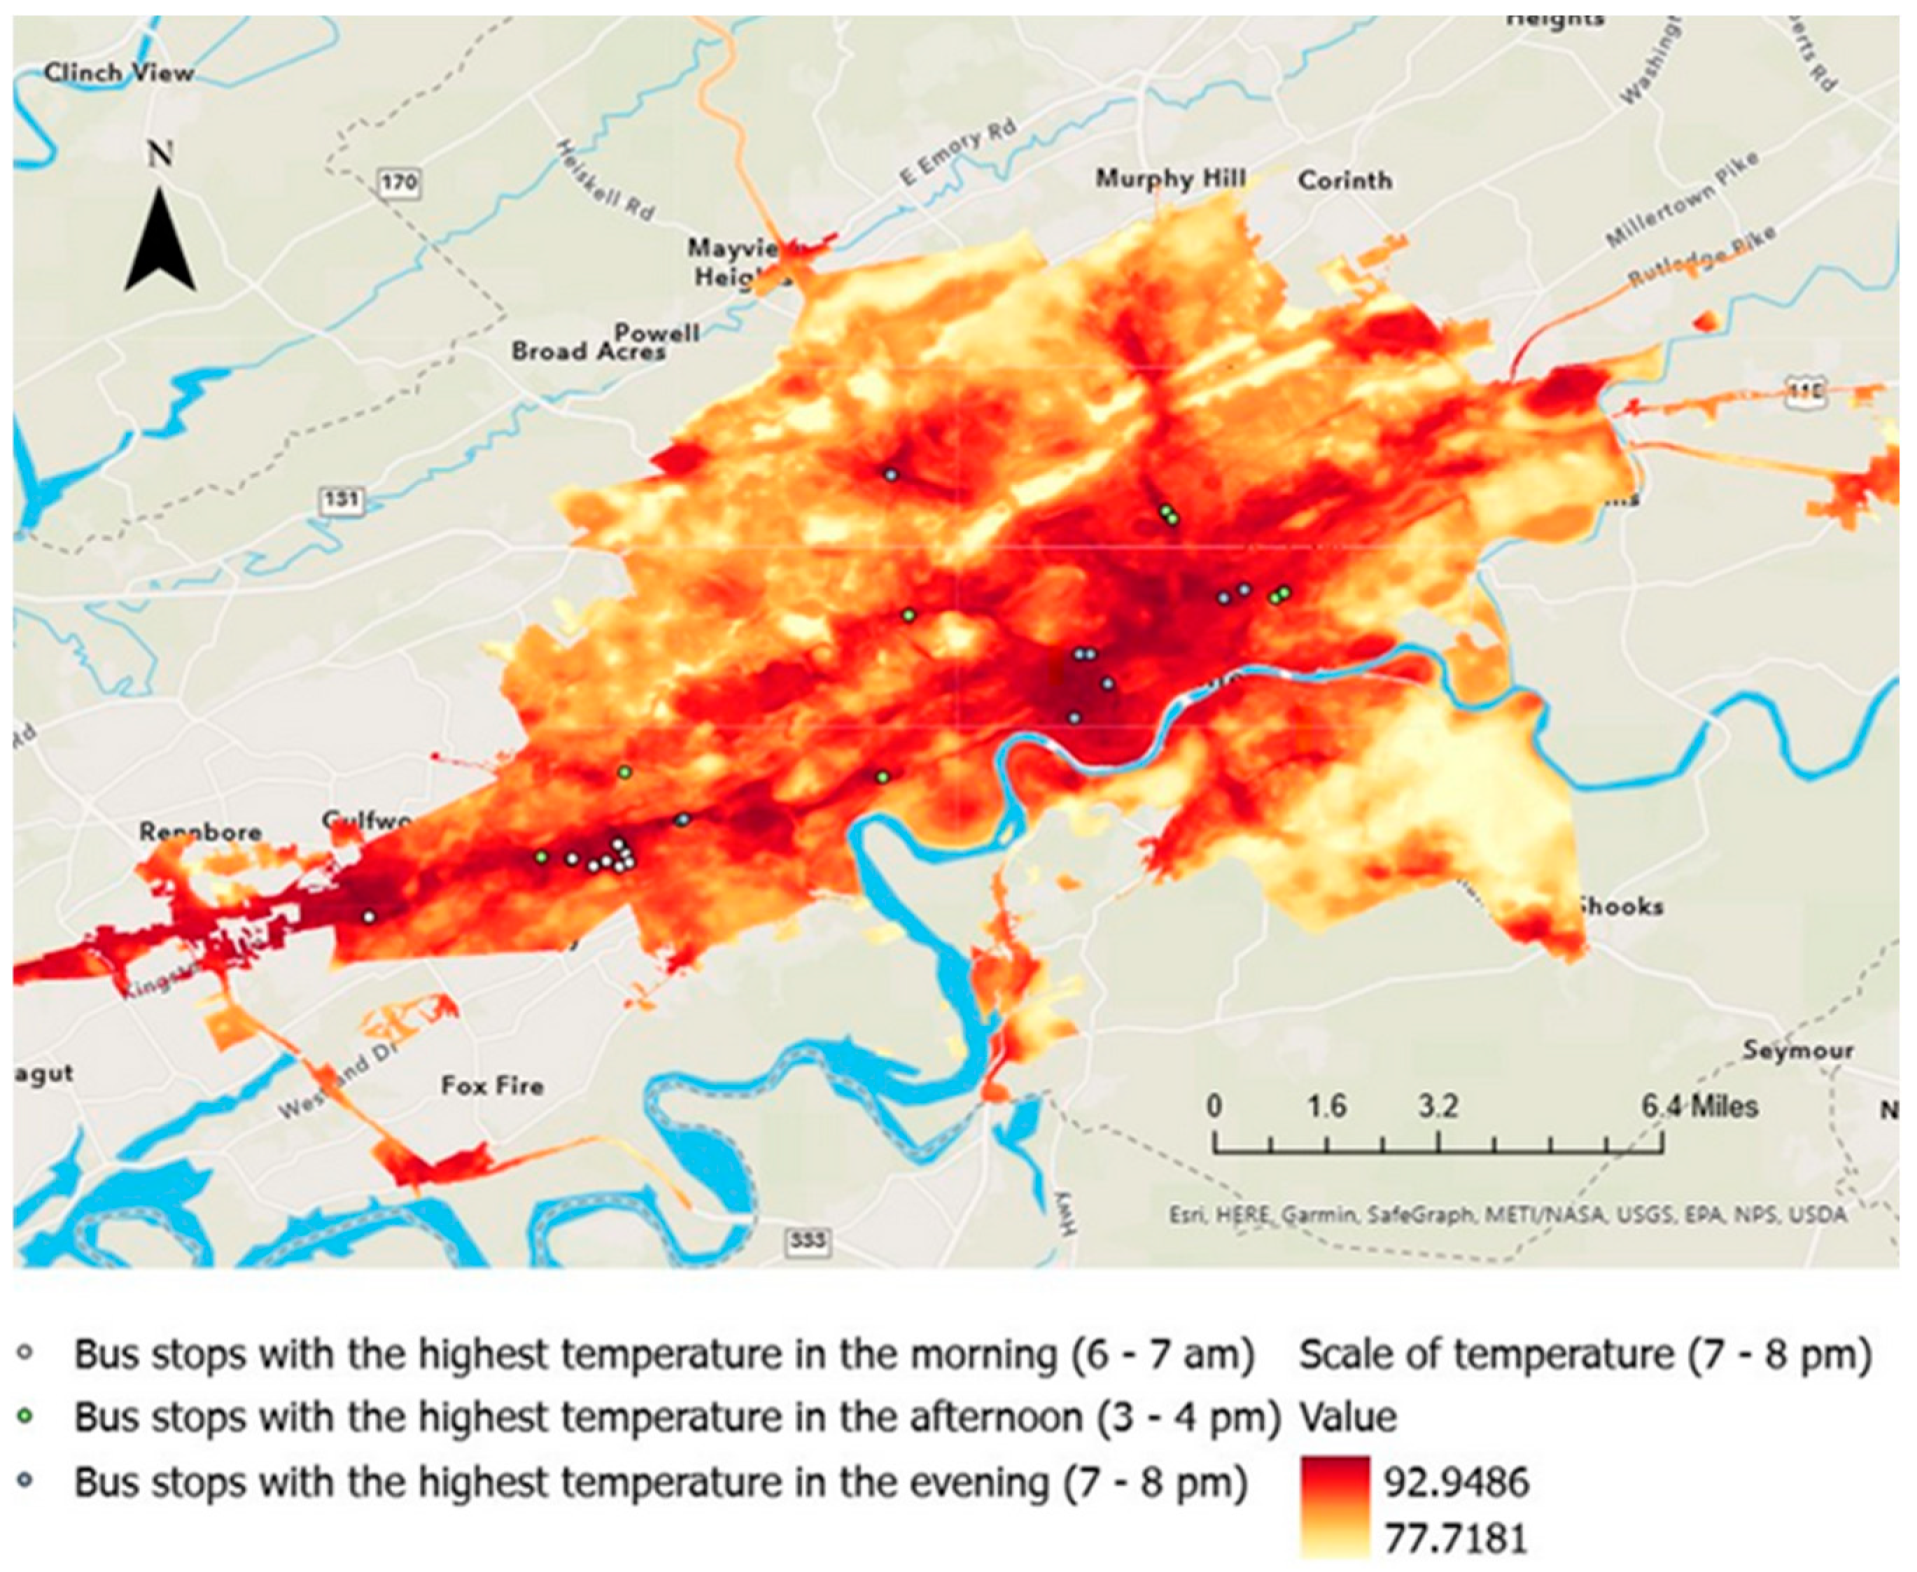
Figure 2.
Bus stops with the highest temperature in the study area.
4.1.2. Bus Stops with the Highest Heat Index
Most bus stops with the highest HI in the study area are clustered around North and South Knoxville and are characterized by the following:
1. Morning: The average temperature of the 10 bus stops with the highest HI in the morning was 105.0 ºF, about 13.5 ºF higher than the average temperature of 91.5 ºF at all bus stops in Knoxville. 10 bus stops are located in Fountain City and Smithwood, approximately 5 miles north of downtown Knoxville.
2. Afternoon: The average temperature of the 10 bus stops with the highest HI in the afternoon was 104.2 ºF, about 8.9 ºF higher than the average temperature of 95.3 ºF at all bus stops in Knoxville. Three bus stops are located in Smithwood, approximately 5 miles north of downtown Knoxville, and seven bus stops are located near the Chapman Highway, about 3.5 miles south of downtown Knoxville.
3. Evening: The average temperature of the 10 bus stops with the highest HI in the evening was 105.0 ºF, about 13.5 ºF higher than the average temperature of 91.5 ºF at all bus stops in Knoxville. The bus stops with the highest HI in the evening coincides with the bus stop with the highest HI in the morning.
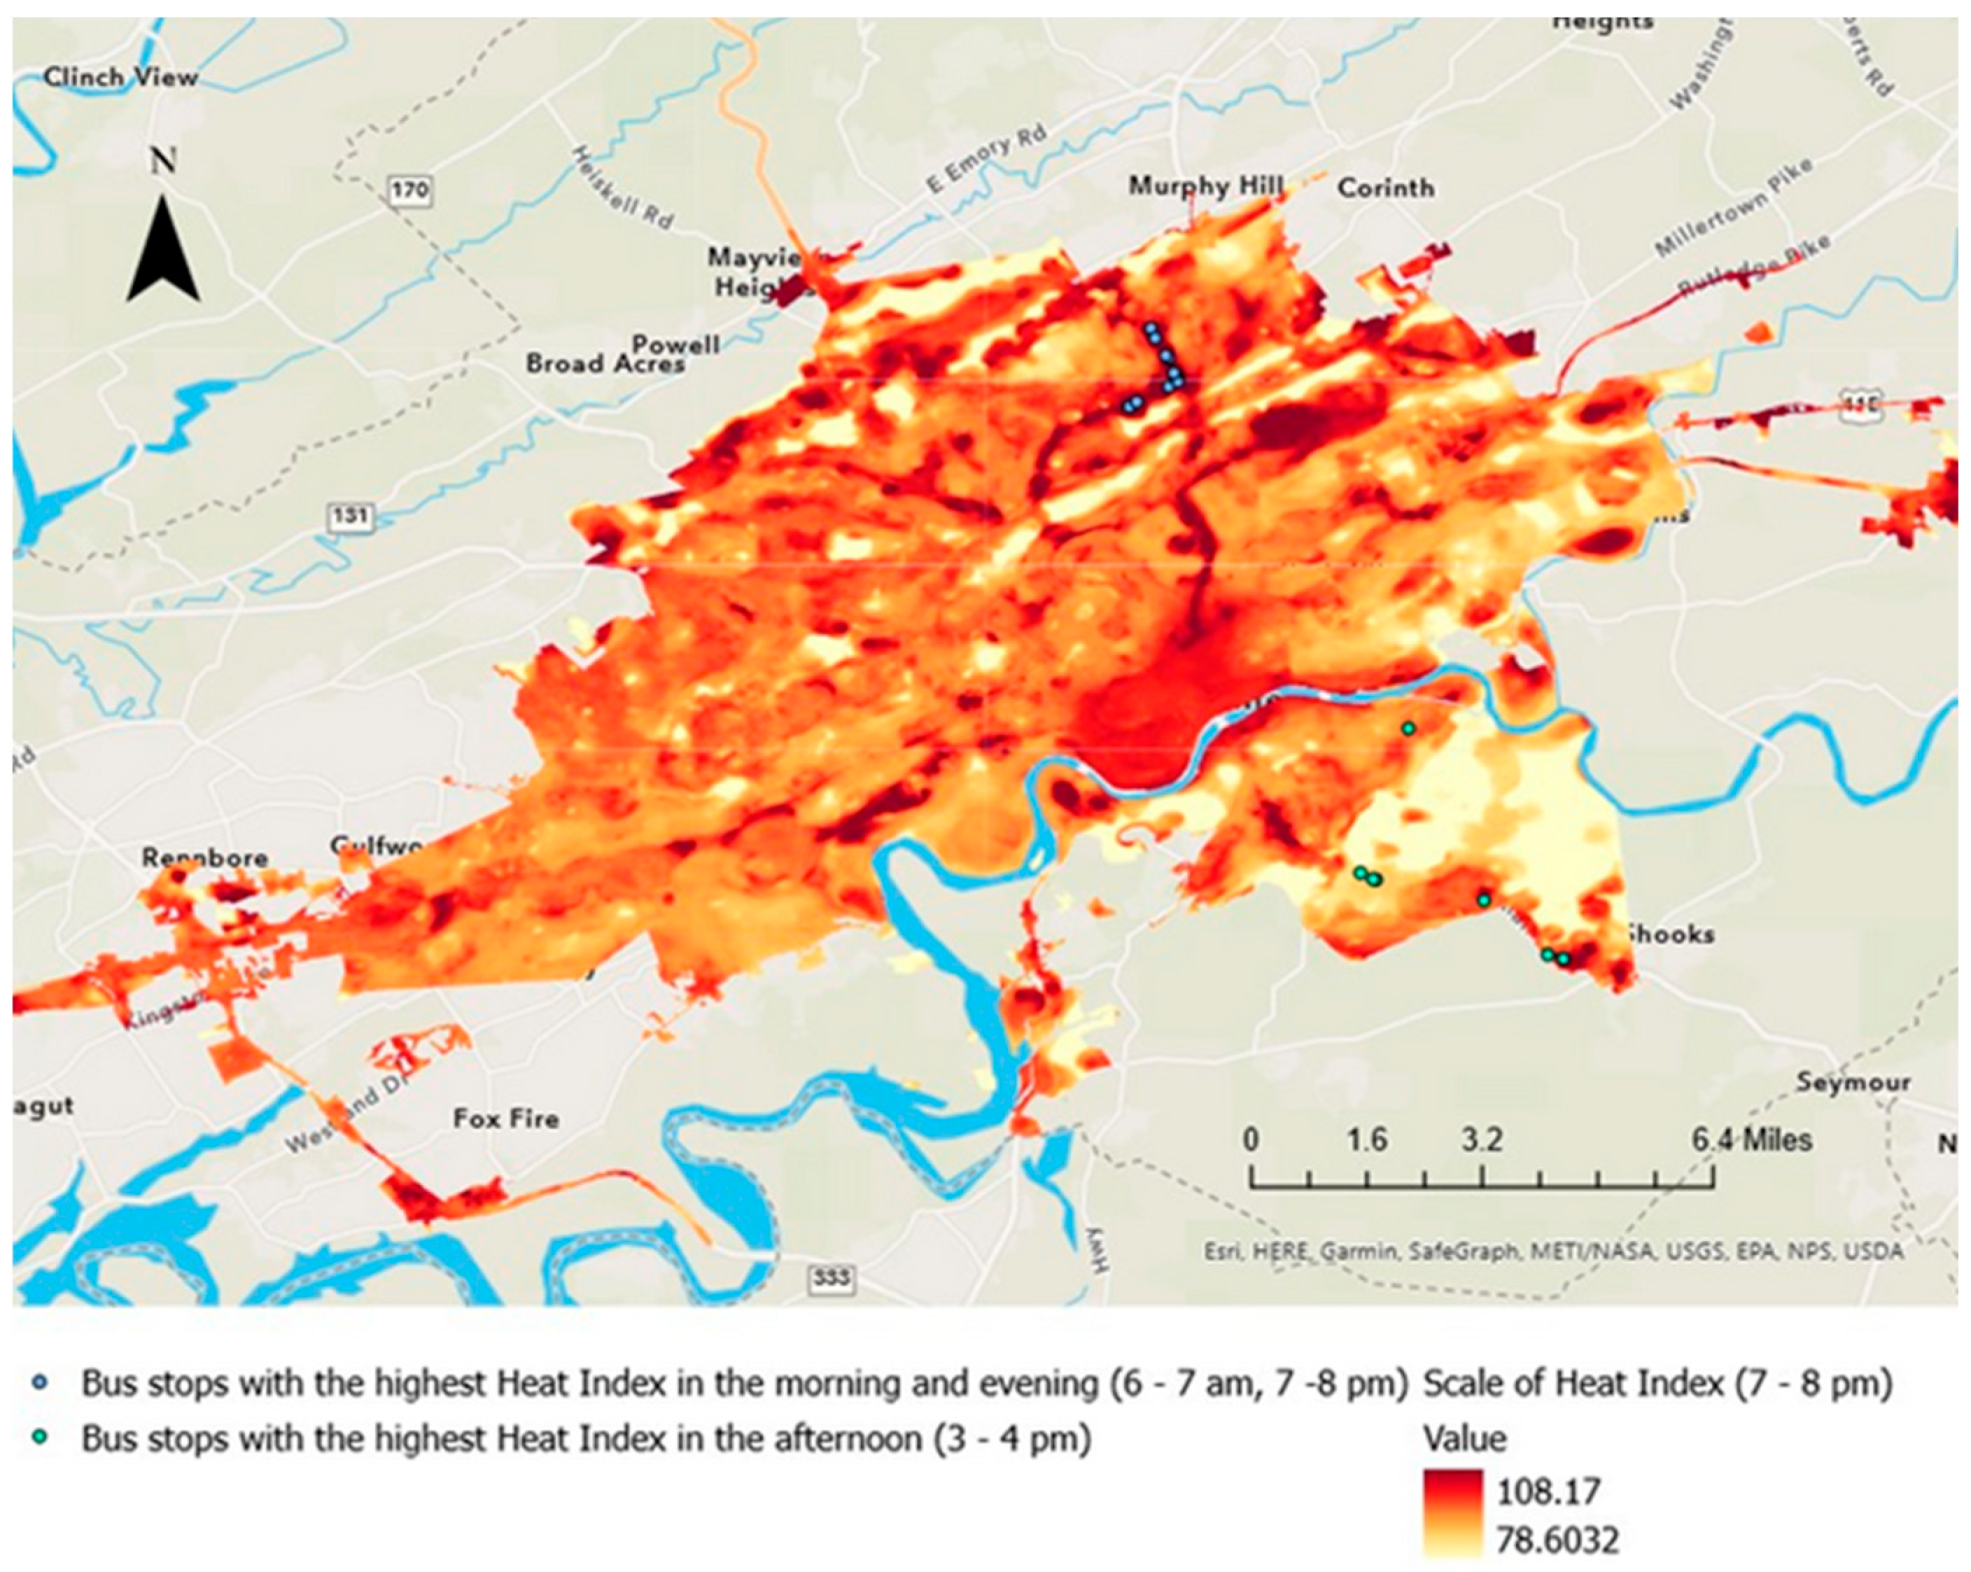
Figure 3.
Bus stops with the highest Heat Index in the study area.
4.2. Land Cover Characteristics on Bus Stops
We mapped the NLCD data to examine the characteristics of the land surface in the area where the identified bus stops are located [41]. The areas where most of the bus stops are located are developed with medium and high intensity, which means impermeable surface absorbs, and stores heat (See Figure 4).
4.2.1. Land Cover Characteristics on Bus Stops with the Highest Temperature
Of the 28 identified bus stops, 14 are located in highly developed areas (NLCD class 24). 13 bus stops are located in medium-intensity developed areas (class 23), and one bus stop is located in a low-intensity developed area (class 22).
4.2.2. Land Cover Characteristics on Bus Stops with the Highest HI
Of the 17 identified bus stops, five are located in highly developed areas (class 24). 6 bus stops are located in medium-intensity developed areas (class 23), and five bus stop is located in low-intensity developed area (class 22). One bus stop is in a developed-open space (class 21) (See Table 1).
4.3. Microenvironment of Bus Stops
Of the 28 bus stops with the highest temperatures, 17 had neither shelter nor tree, 1 had only shelter, 7 had only tree, and 3 had both shelter and tree. Also, of the 17 stops with the highest HI, 16 had neither a shelter nor a tree, and 1 had only a shelter (See Figure 5).
4.4. SVI in the Areas Where the Most Heat-Vulnerable Bus Stops Are Located
We calculated the mean value of the SVI for the census tract where the heat-vulnerable bus stops are located and the area immediately adjacent to the census tract (i.e., the area where residents of the area are presumed to use the heat-vulnerable bus stops). The items of the SVI included in the analysis are as follows: percentage of the population below poverty, persons aged 65 and older, persons aged 17 and younger, population with unemployment, civilian noninstitutionalized population with a disability, single-parent households with children under 18, persons (age 5+) who speak English "less than well," minorities, households with no vehicle available, persons in group quarters, Black/African American, and Hispanic or Latino populations (See Tables S1 and S2 Supporting Information).
4.4.1. Population Below Poverty
The poverty rate was higher than Knoxville’s average (24.1%) in 18 areas where the bus stop with the highest temperature and the neighboring area. The highest poverty rate was in census tract 6902, where one bus stop is located, and its adjacent areas 6901 and 6903 (77.0%, near the University of Tennessee, Knoxville), census tract 7000, where two bus stops are located, and its neighboring areas 1816, 1817 (Northwest, 68.7 %), census tract 6800 where three bus stops are located, and its adjacent areas 6700 (South, 57.4%), and census tract 2700 where one bus stop located, and its adjoining area 2800 (50.4%, Northwest).
The percentage of the poverty population in census tract 2200 (South, 26.7.%), where one bus stop with the highest HI is located, was slightly higher than Knoxville’s average (24.1%).
4.4.2. Older Population
The percentage of the elderly population in census tracts 4404 and 4403 (West, 17.6%), where 11 of the 28 bus stops with the highest temperature are located, was slightly higher than Knoxville’s average (15.5%). The percentage of the elderly population in census tract 5603 and its neighbor area 5501 (South, 22.2%), where two bus stops with the highest HI is located, and census tract 3400 and its neighbor area 2300 (South,15.8%), where three bus stops are located was higher than the Knoxville’s average (15.5%).
4.4.3. Unemployment Rate
Unemployment rates were higher than Knoxville’s average (4.4%) in 16 census tracts where 14 bus stops with the highest temperature were located and the neighboring area. The areas with the highest unemployment rate were census tracts 7000, where two bus stops are located (Northwest, 12.7%), and 6700, where two bus stops are located (Northeast, 10.1%).
Unemployment rates were higher than the Knoxville’s average (4.4%) in 6 census tracts where 12 bus stops with the highest HI were located or adjoining to them. The areas with the highest unemployment rate were census tract 4200, where two bus stops are located, and its adjoining area 5000 (North, 8.7%), and census tract 4100, where eight bus stops are located (North, 5.8%).
4.4.4. Persons with Disabilities
Areas with a higher percentage of residents with disabilities than the average in Knoxville were census tract 3902, where one bus stop is located and its neighbor 4800 (North, 19.6%), 1700, where two bus stops are located, and its neighbors 1600 and 6600 (Northeast, 18.8%), and 6700, where two bus stops are located (Northeast, 18.4%).
The percentage of persons with disabilities residents in ten census tracts where all bus stops with the highest HI are located or adjoin to those areas was higher than Knoxville’s average (12.2%). Census tracts 4200, where two bus stops are located, and its neighbor 5000 (North, 16.8%), census tract 2200, where one bus stop is located (South,15.9%), and 4300, where one bus stop is located, and its neighbor 4200 (North, 15.8%) showed the highest percentage of residents with disabilities residents.
4.4.5. Residents with no Available Car
In 19 of the 24 census tracts, the percentage of people without an available car was higher than Knoxville’s average (5.9%). The areas with the highest percentage of the population without an available car were census tract 6800 (South, 39.6%), where three bus stops were located, and its neighbor 6700, where two bus stops are located (Northeast, 29.9%), and 7000, where two bus stops are located (Northwest, 27.7%).
4.4.6. Minority Population
The percentage of minority populations in 13 areas where 12 bus stops with the highest temperature are located, and the neighboring area was higher than Knoxville’s average (19.2%). The places with the highest percentage of minority population were census tracts 6700, where three bus stops are located, and its neighbor 6800 (South, 58.7%), 6700, where two bus stops are located (Northeast, 57.4%), and 7000, where two bus stops are located (Northwest, 58.1%).
4.4.7. Black/African American Population
12 census tracts where the 12 stops with the highest temperature are located, and the neighboring area to those bus stops had a higher percentage of the Black/African-American population than Knoxville’s average (9.7%). The highest percentage of those populations was found in 6700, where three bus stops with the highest temperature are located, and its neighbors 6800 (South, 58.7%), 7000, where one bus stop is located (Northwest, 58.1%), and 6700 where two stops are located (Northwest, 57.4%).
Census tract 4100, where eight bus stops with the highest HI is located, had a higher percentage of the Black/African-American population (11.6%) than Knoxville’s average (9.7%).
4.4.8. Hispanic/Latino Population
The ten census areas with the six highest temperature bus stops and the neighboring area had a higher Hispanic/Latin population percentage than Knoxville’s average (4.3%). These most Hispanic/Latin populous areas are census tract 2700, where one bus stop is located and its neighbor 2800 (Northwest, 11.9%), 4902, where one bus stop is located and its neighbor 4800 (Northwest, 10.1%), 4615 where one bus stop is located, and its neighbor 4501 (Northwest, 9.2%).
Census tract 2400, where the three highest HI bus stops are located, and its neighbor 2300, had a slightly higher percentage of the Hispanic/Latino population (South, 5.0%) than Knoxville’s average (4.3%).
5. Discussion
The results of the current study represent several key findings. First, analysis of maps of temperature and Heat Index and NLCD land cover data maps shows that Knoxville's most heat-vulnerable bus stops are located in more populated areas than other parts of Knoxville. 38 of the total 45 most heat-vulnerable bus stops were found to be located in highly developed areas. Those bus stops are located near Kingston Pike, the busiest area in Knoxville, West Knoxville, where the largest shopping complex is located, Central Knoxville, where the University of Tennessee, commercial districts, and public offices are located, and Broadway, which connects downtown and North Knoxville. These areas are densely populated with apartment complexes, housing estates, and commercial and industrial areas. They are characterized by impervious surfaces ranging from at least 50% to a maximum of 100%. The stops with the highest HI are concentrated in the Suburban areas of Knoxville (North and South). Historically, the area has been perceived as lacking infrastructure, including bus stops, compared to other parts of Knoxville.
Second, by investigating the microenvironment of bus stops, we found that Knoxville's most heat-vulnerable bus stops had a lack of shelters and trees. Of the total 45 bus stops, 33 bus stops were found to have neither trees nor shelters, and only three bus stops had both shelters and trees.
Third, as a result of examining SVI of the areas where bus stops are located and adjacent areas, it was confirmed that the social vulnerability of areas where bus stops are located is higher than in other regions of Knoxville. Of the 27 census tracks where the 28 most heat-vulnerable bus stops were located, 18 of the census tracts had higher poverty rates than Knoxville’s average. Census tracts 4403 and 4404 (West Knoxville), where the 11 bus stops with the highest temperature are located, had a slightly higher percentage of older people than Knoxville’s average. As for the unemployment rate, 22 census tracts with 26 heat-vulnerable bus stops located had higher unemployment percentages than Knoxville’s average. The percentage of persons with disabilities was higher than the average of Knoxville in 24 census tracks, where 30 of the 45 most heat-vulnerable bus stops are located. The highest proportion of people without accessible cars was in the census tract 6800 (South, 39.6%), 6700 (Northeast, 29.9%), and 7000 (Northwest, 27.7%) regions where total 19 bus stops are located. That was well above the average in Knoxville (5.9%).
For the minority percentage, it was found that the minority percentage of the 13 census tracks in the South (58.7%), Northwest (58.1%), and Northeast (57.4%) of Knoxville, where the 12 bus stops with the highest temperature are located, reached about 60 percent each. The census tracts with the highest percentage of the black/African American population were census tracts 6800 (Three bus stops, South, 53.8%), 7000 (two bus stops, Northeast, 52.3%), and 7000 (two bus stops, Northwest, 41.5%), where a total of seven bus stops are located. For the Hispanic/Latino population percentage, the census tract 2700 (one bus stop, Northwest), 3902 (one bus stop, North), and 4615 (one bus stop, Northwest) are higher than Knoxville’s average (4.3%). The Hispanic/Latino population percentage here is 11.9%, 10.1%, and 9.2%, respectively, more than double Knoxville’s average.
This study, which identifies the intersection of bus stops exposed to extreme heat, spatial characteristics of identified bus stops, and social vulnerability where bus stops are located, has limitations, and these limitations can be an opportunity for future research based on our findings. First, the heat maps used in this study are not a perfect indicator of the heat experience of residents in a community. The experience of heat can be described by including a number of factors, including not only the heat itself but also the length of the extreme heat [42] and its impact on access to resources at the individual level [43]. We relied on heat maps from the 2022 Knoxville’s Heat Mapping Report and USGS’s NLCD land cover maps to determine which bus stops were vulnerable to heat, and there were limitations in acquiring and implementing knowledge of residents’ experiences using actual bus stops. However, as shown in other natural hazards studies, the availability of physical and social protective resources is related to the ability and vulnerability of individuals to respond to climate-related hazards [44,45,46]. Therefore, future research may need to focus on other aspects, such as residents' perspectives on public transportation experience, response strategies, and risk and protective factors in UHIs.
Second, we understand that UHI is one of many environmental and social issues that impact Knoxville. Future studies may include variables that represent additional environmental-related factors such as air quality indicators and associated diseases, proximity to hazardous waste, etc. Future research could also incorporate variables related to residents’ perceptions, like the reliability of public transport infrastructure and perceptions of sustainability and environmental protection. Research incorporating these could help explain that environmental injustice stems from more than one hazard [33].
Finally, this study investigated four aspects of temperature and spatial characteristics of bus stops, the presence of shelters and trees, and social vulnerability separately. Future research incorporating the four dimensions and modeling, including the population in the census tracts and the number of bus passengers, will allow us to develop quantifiable metrics and identify high-risk stops that should be prioritized for community resource allocation.
6. Conclusions
To establish environmental justice-oriented climate adaptation policies and interventions, it is important for transit agencies and future transit policies to take into account the effects of climate change and extreme heat on transit riders and the corresponding risks involved. Our case study in Knoxville, Tennessee, found that the most heat-vulnerable bus stops were concentrated in West Knoxville, South, North, Northeast, and Northwest Knoxville and near the University of Knoxville and Knoxville downtown. Identified areas were primarily home to systematically marginalized populations, dense commercial areas, and urban centers, which may be exposed to a significant urban heat island effect. By examining bus stops exposed to heat hazards and the social vulnerabilities of the areas where they are located, this study provides a methodology to assess and prioritize populations and communities adversely impacted by UHI, improve transportation infrastructure, and better prepare communities to develop climate mitigation strategies.
Supplementary Materials
The following supporting information can be downloaded at the website of this paper posted on Preprints.org, Table S1: SVI in the area and adjacent areas where the highest temperature bus stops are located, and Table S2: SVI in the area and adjacent areas where the highest temperature bus stops are located.
Author Contributions
Conceptualization, S.L. and J.M.F.; methodology, S.L.; writing—original draft preparation, S.L.; writing—review and editing, J.M.F. All authors have read and agreed to the published version of the manuscript.
Funding
This research received no external funding.
Institutional Review Board Statement
Not applicable.
Informed Consent Statement
Not applicable.
Data Availability Statement
These data used to support the findings of this study are included.
within the article.
Conflicts of Interest
The authors declare no conflict of interest.
References
- Reidmiller, D.R.; Avery, C.W.; Easterling, D.R.; Kunkel, K.E.; Lewis, K.L.M.; Maycock, T.K.; Stewart, B.C. Impacts, risks, and adaptation in the United States: Fourth national climate assessment, Volume II. 2017. Available online: https://repository.library.noaa.gov/view/noaa/19487 (accessed on 10 April 2023).
- Maxwell, K.; Julius, S.; Grambsch, A.; Kosmal, A.; Larson, L.; Sonti, N. Built environment, urban systems, and cities. 2018. Available online: https://doi.org/10.7930/NCA4.2018.CH11 (accessed on 10 April 2023).
- Tan, J.; Zheng, Y.; Tang, X.; Guo, C.; Li, L.; Song, G.; Zhen, X.; Yuan, D.; Kalkstein, A.J.; Li, F.; et al. The urban heat island and its impact on heat waves and human health in Shanghai. Int. J. Biometeorol 2010, 54, 75–84. [Google Scholar] [CrossRef] [PubMed]
- Hsu, A.; Sheriff, G.; Chakraborty, T.; Manya, D. Disproportionate exposure to urban heat island intensity across major US cities. Nat Commun 2021, 12, 2721. [Google Scholar] [CrossRef] [PubMed]
- Vaidyanathan, A.; Malilay, J.; Schramm, P.; Saha, S. Heat-related deaths - United States, 2004-2018. MMWR Morb Mortal Wkly Rep 2020, 69, 729–734. [Google Scholar] [CrossRef] [PubMed]
- Ashbaugh, M.; Khemani, M.; Laird, B.; Murray, S. Environmental justice & climate change in Wichita, Kansas. 2022. Available online: https://ntrs.nasa.gov/citations/20220013018 (accessed on 9 May 2023).
- Li, D.; Newman, G.D.; Wilson, B.; Zhang, Y.; Brown, R.D. Modeling the relationships between historical redlining, urban heat, and heat-related emergency department visits: An examination of 11 Texas cities. Environ. Plan. B: Urban Anal. City Sci 2022, 49, 933–952. [Google Scholar] [CrossRef] [PubMed]
- Borunda, A. Racist housing policies have created some oppressively hot neighborhoods. National Geographic. 2021. Available online: https://www.nationalgeographic.com/science/article/racist-housing-policies-created-some-oppressively-hot-neighborhoods?rid=497634F2CCB695E0CC39205507279BCC&cmpid=org (accessed on 9 May 2023).
- Zhao, F.; Gustafson, T. Transportation needs of disadvantaged populations: Where, when, and how? 2013. Available online: https://doi.org/https://doi.org/10.21949/1503567 (accessed on 9 May 2023).
- Dankwa-Mullan, I.; Pérez-Stable, E.J. Addressing Health Disparities Is a Place-Based Issue. Am J Public Health 2016, 106, 637–639. [Google Scholar] [CrossRef]
- Rothstein, R. The color of law: a forgotten history of how our government segregated America. New York: Liveright. 2018.
- Mital, A. Change in environmental justice scores in historically redlined communities compared to non-redlined communities: A case study of Richmond, Virginia. Urban Clim 2023, 49, 101505. [Google Scholar] [CrossRef]
- Burke, L.M.; Schwalbach, J. Housing redlining and its lingering effects on education opportunity. Backgrounder. No. 3594. Heritage Foundation. 2021. Available online: https://www.heritage.org/education/report/housing-redlining-and-its-lingering-effects-education-opportunity (accessed on 9 May 2023).
- Aaronson, D.; Hartley, D.; Mazumder, B. The effects of the 1930s HOLC "Redlining" maps. Am Econ J Econ Policy 2021, 13, 355–392. [Google Scholar] [CrossRef]
- Nardone, A.; Rudolph, K.E.; Morello-Frosch, R.; Casey, J.A. Redlines and greenspace: The relationship between historical redlining and 2010 greenspace across the United States. Environ. Health Perspect 2021, 129, 17006. [Google Scholar] [CrossRef]
- Tong, S.; Prior, J.; McGregor, G.; Shi, X.; Kinney, P. Urban heat: an increasing threat to global health. Bmj 2021, 375, n2467. [Google Scholar] [CrossRef]
- Klinenberg, E. Heat wave: A social autopsy of disaster in Chicago. University of Chicago Press. 2015.
- Cutter, S.L.; Boruff, B.J.; Shirley, W.L. Social vulnerability to environmental hazards. Soc. Sci. Q 2003, 84, 242–261. [Google Scholar] [CrossRef]
- Biswas, S. A review of socio-economic vulnerability: The emergence of its theoretical concepts, models and methodologies. Nat Hazards 2023. [Google Scholar] [CrossRef]
- Erell, E. Greening Cities: Forms and functions: Advances in 21st century human settlements Springer Singapore. 2017; pp. 73–93.
- Safford, H.; Larry, E.; McPherson, E.G.; Nowak, D.J.; Westphal, L.M. Urban forests and climate change. U.S. Department of Agriculture, Forest Service, Climate Change Resource Center. 2013. Available online: www.fs.usda.gov/ccrc/topics/urban-forests (accessed on 10 April 2023).
- Degirmenci, K.; Desouza, K.C.; Fieuw, W.; Watson, R.T.; Yigitcanlar, T. Understanding policy and technology responses in mitigating urban heat islands: A literature review and directions for future research. Sustain. Cities Soc 2021, 70, 102873. [Google Scholar] [CrossRef]
- Miller, P.; de Barros, A.G.; Kattan, L.; Wirasinghe, S.C. Public transportation and sustainability: A review. KSCE J. Civ. Eng 2016, 20, 1076–1083. [Google Scholar] [CrossRef]
- Hamurcu, M.; Eren, T. Strategic planning based on sustainability for urban transportation: An application to decision-making. Sustainability 2020, 12, 3589. [Google Scholar] [CrossRef]
- Kamruzzaman, M.; Hine, J.; Yigitcanlar, T. Investigating the link between carbon dioxide emissions and transport-related social exclusion in rural Northern Ireland. Int. J. Environ. Sci. Technol 2015, 12, 3463–3478. [Google Scholar] [CrossRef]
- Deilami, K.; Kamruzzaman, M. Modelling the urban heat island effect of smart growth policy scenarios in Brisbane. Land Use Policy 2017, 64, 38–55. [Google Scholar] [CrossRef]
- Cervero, R.; Sullivan, C. Green TODs: marrying transit-oriented development and green urbanism. Int. J. Sustain. Dev. World Ecol 2011, 18, 210–218. [Google Scholar] [CrossRef]
- U.S. Census Bureau. QuickFacts: Knoxville city, Tennessee. n.d. Available online: https://www.census.gov/quickfacts/knoxvillecitytennessee (accessed on 10 May 2023).
- National Weather Service. Knoxville Climate Page. n.d. Available online: https://www.weather.gov/mrx/tysclimate (accessed on 9 May 2023).
- Climatecheck. Knoxville, TN, Top climate change risks: Precipitation, heat, fire | Climate change hazard rating for Knoxville, TN. n.d. Available online: https://climatecheck.com/tennessee/knoxville (accessed on 9 May 2023).
- The University of Tennessee, Knoxville. 2022 Knoxville Heat Equity Coalition: Knoxville’s heat mapping report. n.d. Available online: https://heatequity.utk.edu/ (accessed on 9 May 2023).
- City of Knoxville, Tennessee. Knoxville Area Transit (KAT) GTFS feed. n.d. Available online: https://www.knoxvilletn.gov/cms/One.aspx?portalId=109562&pageId=11688599 (accessed on 10 May 2023).
- Laird, B.; Ashbaugh, M.; Khemani, M.; Murray, S. Wichita climate: Using satellite data to identify neighborhoods vulnerable to extreme heat for equitable climate mitigation and planning. Tech report. 202. Available online: https://ntrs.nasa.gov/citations/20220013729 (accessed on 10 April 2023).
- U.S. Geological Survey. National Land Cover Database Active. National Land Cover Database. n.d. Available online: https://www.usgs.gov/centers/eros/science/national-land-cover-database (accessed on 10 April 2023).
- Dzyuban, Y.; Hondula, D.M.; Coseo, P.J.; Redman, C.L. Public transit infrastructure and heat perceptions in hot and dry climates. Int. J. Biometeorol 2022, 66, 345–356. [Google Scholar] [CrossRef]
- Lanza, K.; Durand, C.P. Heat-moderating effects of bus stop shelters and tree shade on public transport ridership. Int. J. Environ. Res. Public Health 2021, 18, 463. [Google Scholar] [CrossRef]
- USGS EROS Archive. Aerial Photography. National Agriculture Imagery Program (NAIP). n.d. Available online: https://www.usgs.gov/centers/eros/science/usgs-eros-archive-aerial-photography-national-agriculture-imagery-program-naip (accessed on 10 May 2022).
- U.S. Census Bureau. Tiger/line shapefiles. 2022. Available online: https://www.census.gov/geographies/mapping-files/time-series/geo/tiger-line-file.html (accessed on 10 April 2023).
- Centers for Disease Control and Prevention, Agency for Toxic Substances and Disease Registry, Geospatial Research, Analysis, and Services Program. CDC/ATSDR Social Vulnerability Index 2018 Database Tennessee. 2018. Available online: https://www.atsdr.cdc.gov/placeandhealth/svi/index.html (accessed on 10 April 2023).
- Neely. J. Down the Dixie Lee highway. From the shadow side: And other stories of Knoxville, Tennessee. Tellico Books, 2003.
- MRLC. National Land Cover Database Class Legend and description. n.d. Available online: https://www.mrlc.gov/data/legends/national-land-cover-database-class-legend-and-description (accessed on 10 April 2023).
- EPA. Technical documentation: Heat waves. 2021. Available online: https://www.epa.gov/climate-indicators/climate-change-indicators-heat-waves (accessed on 10 April 2023).
- EPA. Climate change and extreme heat: What you can do to prepare. 2016. Available online: https://www.cdc.gov/disasters/extremeheat/index.html (accessed on 10 April 2023).
- Lee, S.; First, J.M. Mental health impacts of tornadoes: A systematic review. Int. J. Environ. Res. Public Health 2022, 19, 13747. [Google Scholar] [CrossRef] [PubMed]
- First, J.M.; Ellis, K.; Held, M.L.; Glass, F. Identifying risk and resilience factors impacting mental health among Black and Latinx adults following nocturnal tornadoes in the U.S. Southeast. Int. J. Environ. Res. Public Health 2021, 18. [Google Scholar] [CrossRef] [PubMed]
- Hansson, S.; Orru, K.; Siibak, A.; Bäck, A.; Krüger, M.; Gabel, F.; Morsut, C. Communication-related vulnerability to disasters: A heuristic framework. Int. J. Disaster Risk Reduct 2020, 51, 101931. [Google Scholar] [CrossRef]
Figure 4.
Land cover characteristics on bus stops.
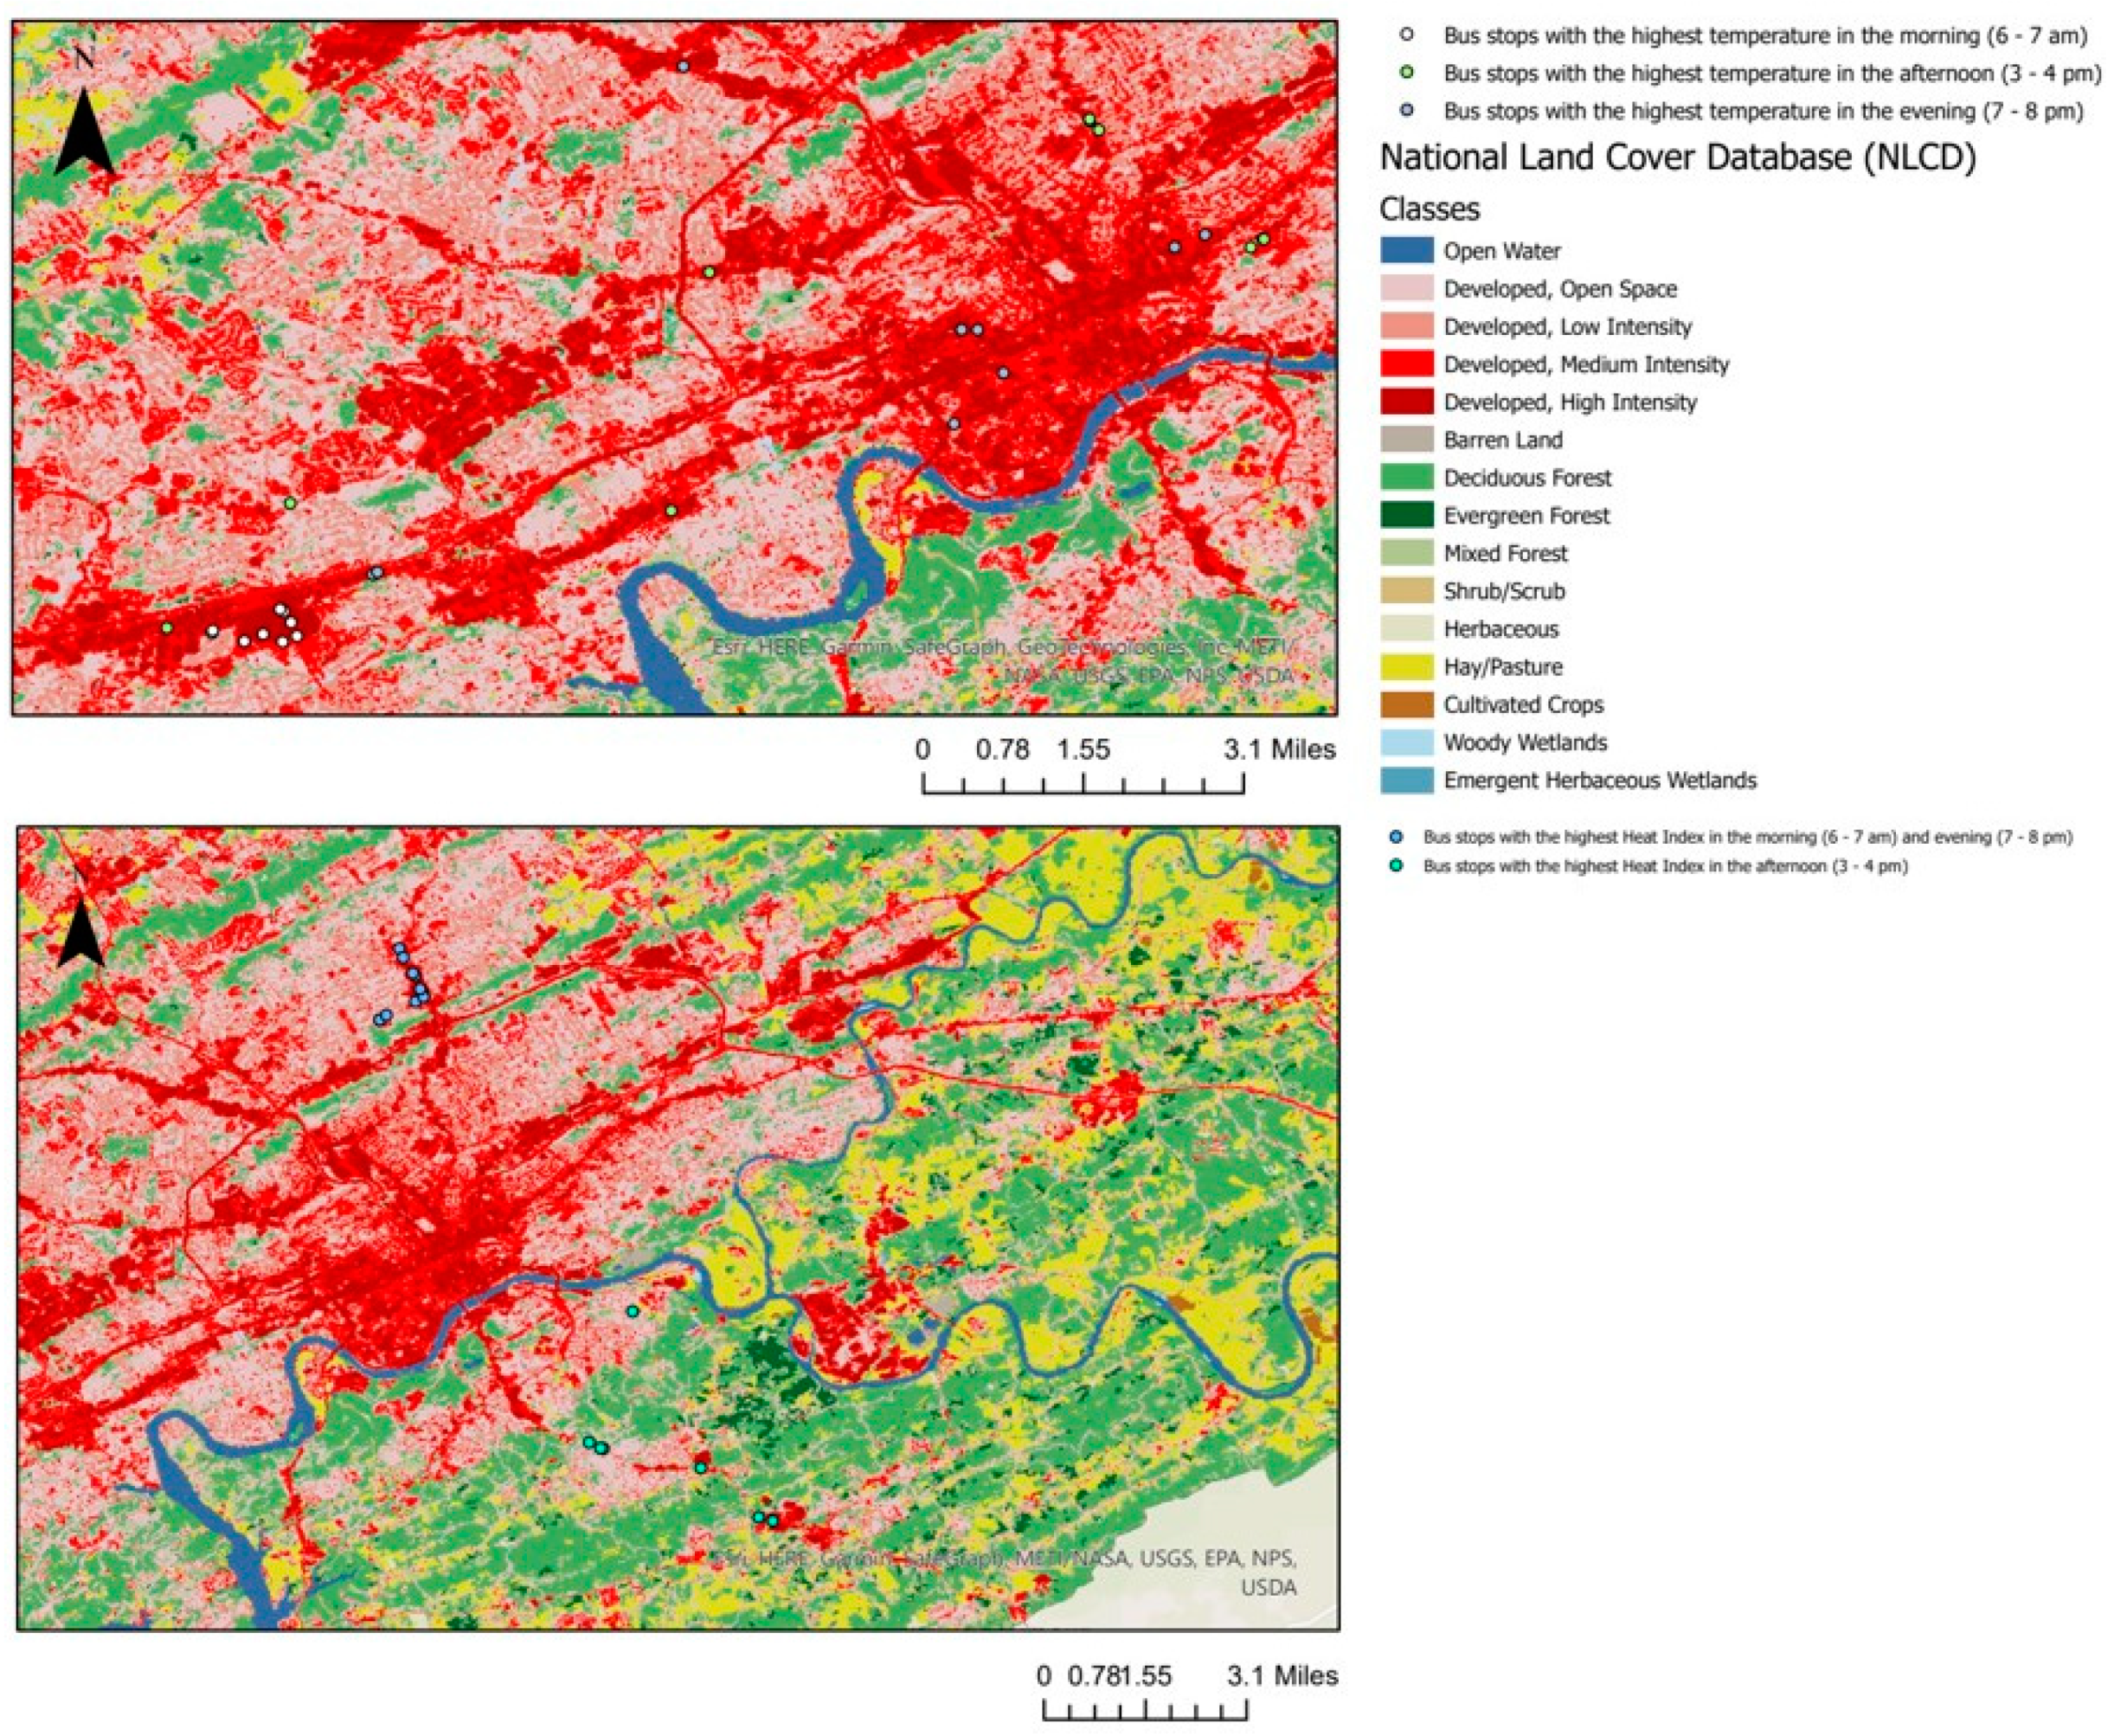
Figure 5.
The microenvironment of bus stops (Shelter and tree).
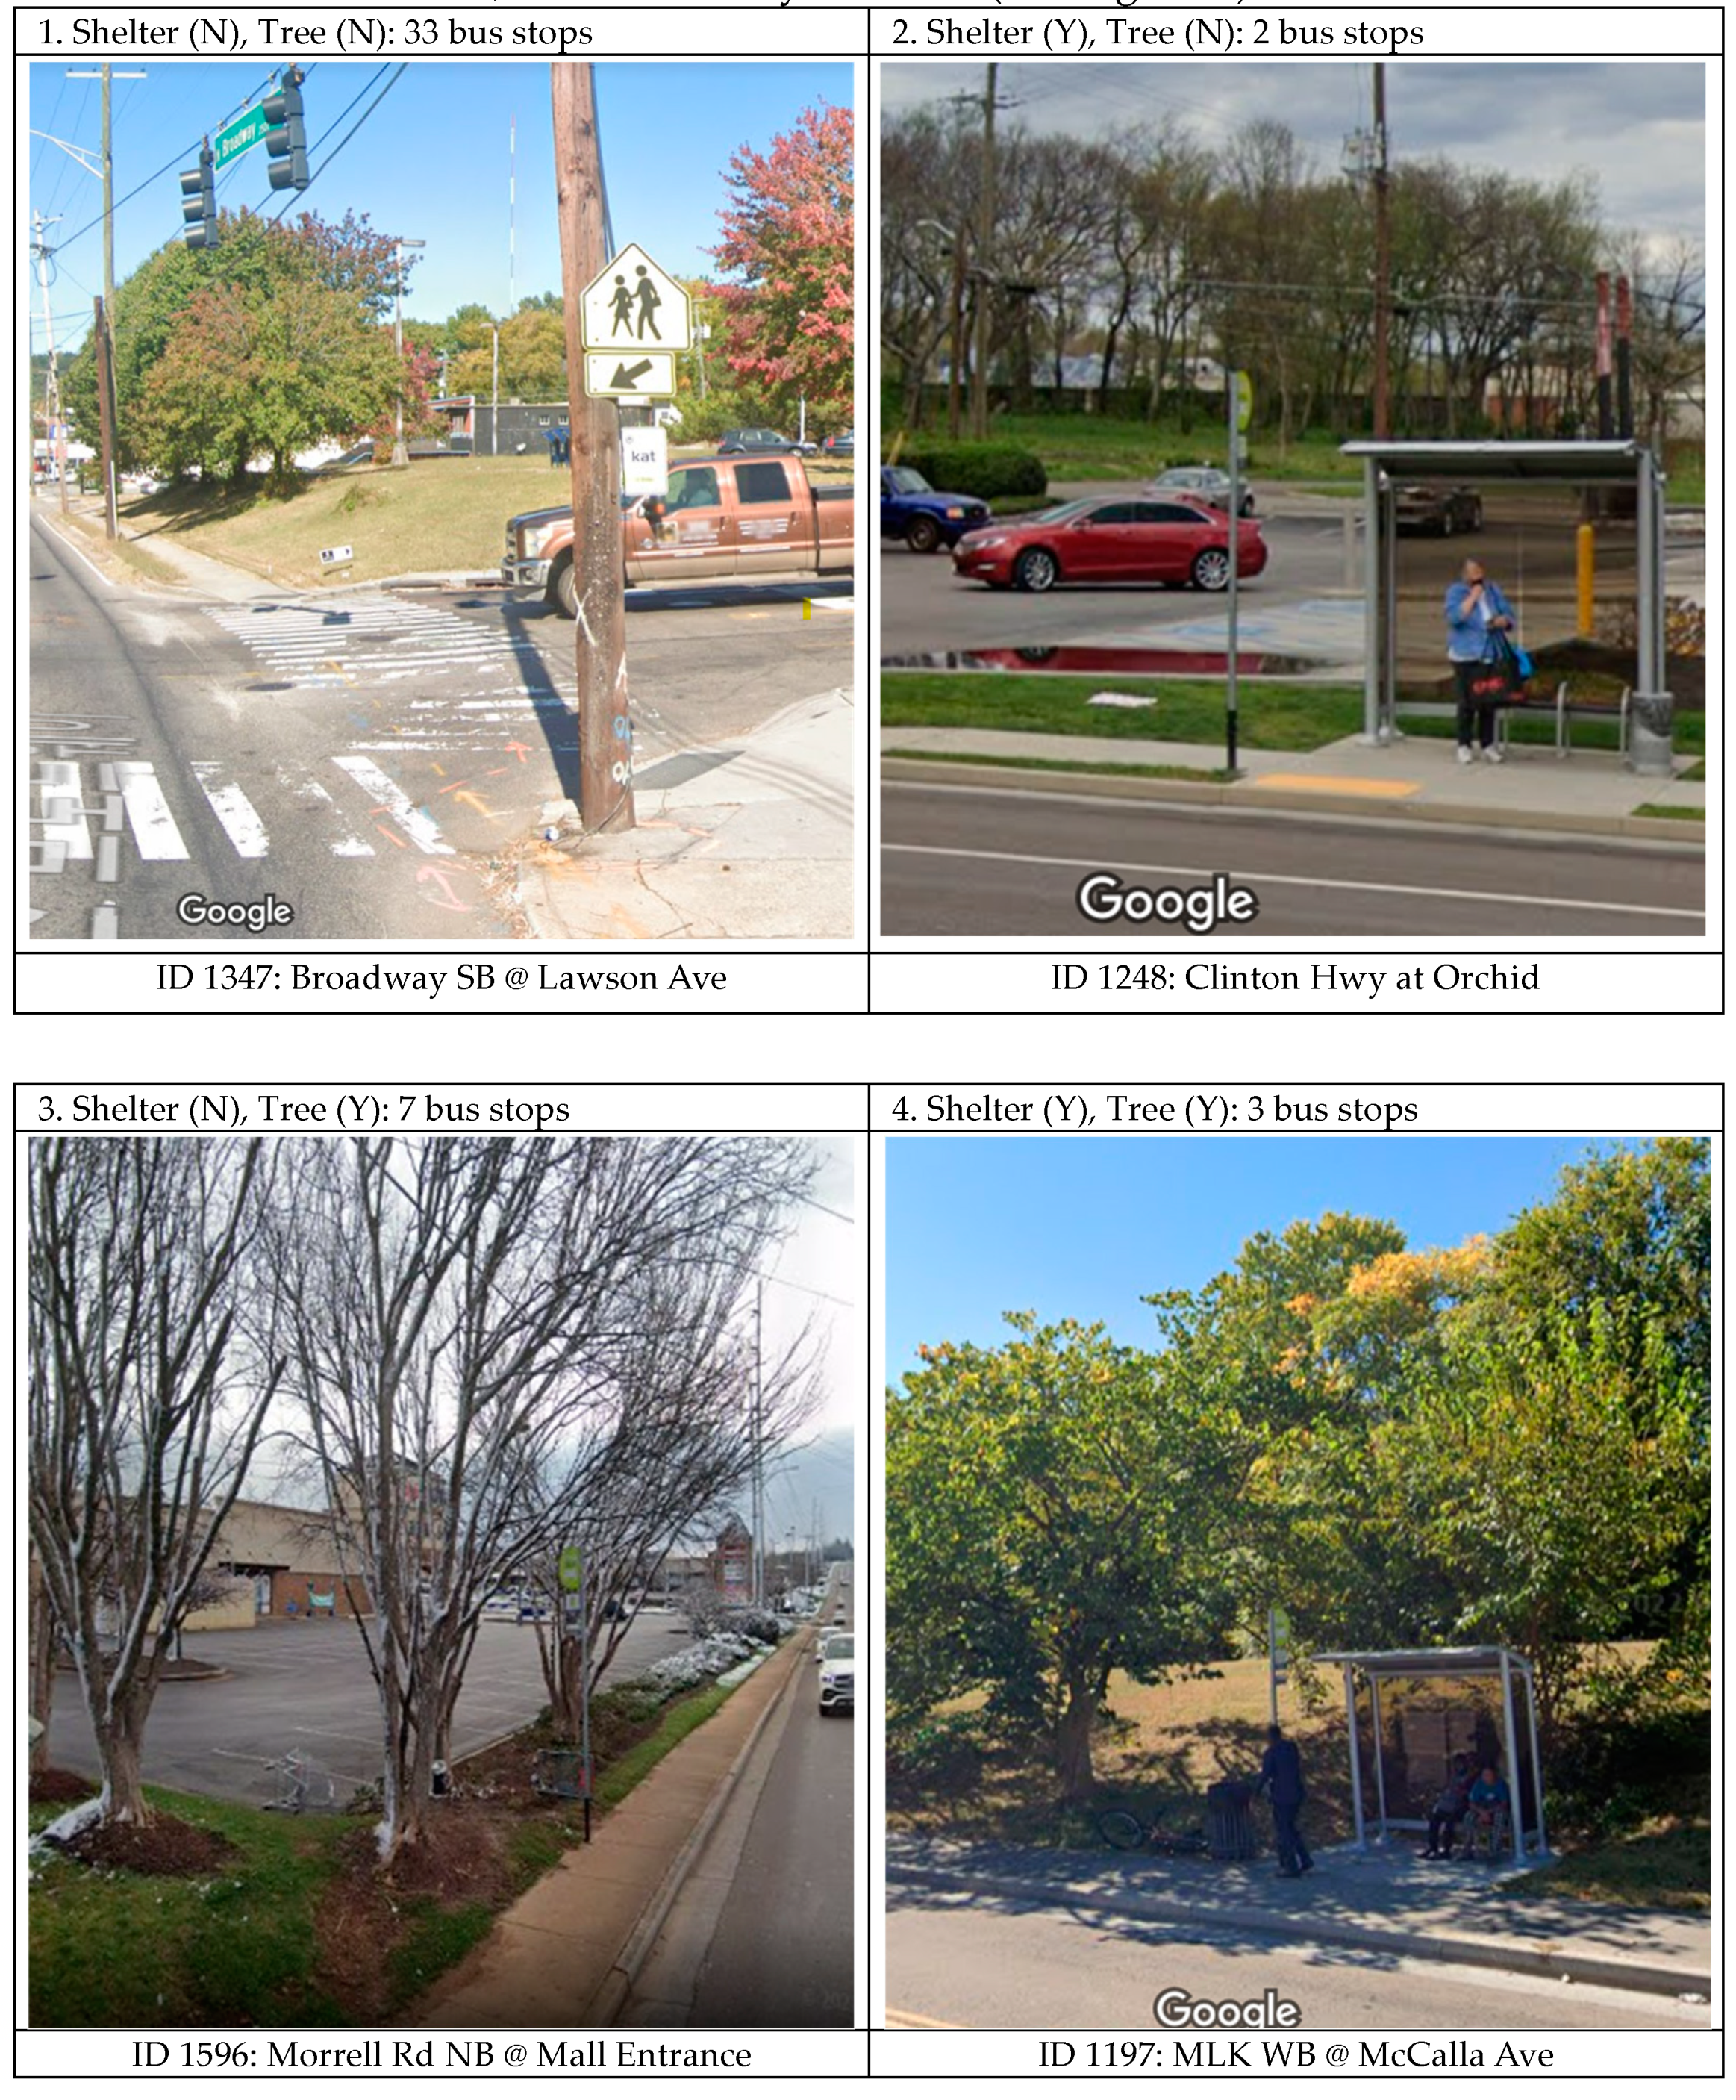

Table 1.
NLCD class legend, description, and number of bus stops.
| Class | Classification description | N. of bus stops |
| 24. Developed, High Intensity |
Highly developed areas where people reside or work in high numbers. Examples include apartment complexes, row houses and commercial/industrial. Impervious surfaces account for 80% to 100% of the total cover. | 19 |
| 23. Developed, Medium Intensity |
Areas with a mixture of constructed materials and vegetation. Impervious surfaces account for 50% to 79% of the total cover. These areas most commonly include single-family housing units. | 19 |
| 22. Developed, Low Intensity |
Areas with a mixture of constructed materials and vegetation. Impervious surfaces account for 20% to 49% percent of total cover. These areas most commonly include single-family housing units. | 6 |
| 21. Developed, Open Space |
Areas with a mixture of some constructed materials, but mostly vegetation in the form of lawn grasses. Impervious surfaces account for less than 20% of total cover. These areas most commonly include large-lot single-family housing units, parks, golf courses, and vegetation planted in developed settings for recreation, erosion control, or aesthetic purposes. | 1 |
(Source: MRLC. (n.d.). National Land Cover Database Class Legend and description. https://www.mrlc.gov/data/legends/national-land-cover-database-class-legend-and-description).
Disclaimer/Publisher’s Note: The statements, opinions and data contained in all publications are solely those of the individual author(s) and contributor(s) and not of MDPI and/or the editor(s). MDPI and/or the editor(s) disclaim responsibility for any injury to people or property resulting from any ideas, methods, instructions or products referred to in the content. |
© 2023 by the authors. Licensee MDPI, Basel, Switzerland. This article is an open access article distributed under the terms and conditions of the Creative Commons Attribution (CC BY) license (http://creativecommons.org/licenses/by/4.0/).
Copyright: This open access article is published under a Creative Commons CC BY 4.0 license, which permit the free download, distribution, and reuse, provided that the author and preprint are cited in any reuse.


