
Submitted:
08 June 2023
Posted:
08 June 2023
You are already at the latest version
Abstract
Chenodeoxycholic acid (CA) is a naturally occurring bile acid that is produced in the liver from cholesterol. Three CA complexes using Zn(II), Mg(II), and Ca(II) ions were synthesized to examine the chelation tendencies of CA towards these metal ions. The complexation reaction of CA with the metal ions under investigation was conducted with a 1:1 molar ratio (CA to metal) at 60-70°C in natural media (pH 7-8), which consisted of a binary solvent of MeOH and H2O (1:1). The resulting CA complexes were characterized using analytical data (metal, H, C, and Cl, analysis) and spectral data (UV-visible, FT-IR, and 1H NMR) to elucidate the complexes’ structures. The results suggested that CA in anion form utilized oxygen atoms of the carboxylate group (-COO−) to capture Zn(II), Mg(II), and Ca(II) ions. This produced complexes with the general compositions of [Zn(CA)(H2O)Cl], [Mg(CA)(H2O)Cl]H2O, and [Ca(CA)(H2O)Cl]2H2O, respectively. The Kirby-Bauer disc diffusion assay was then used to explore the bioactivity of the CA complexes toward three fungal species, three Gram-positive bacteria, and two Gram-negative bacteria. The Ca(II) and Mg(II) complexes exhibited marked inhibitory effects on the cell growth of the fungal species Aspergillus niger with potency equal to 127% and 116% of the activity of the positive control, respectively. The Zn(II) and Ca(II) complexes strongly inhibited the growth of Penicillium sp., while the Zn(II) and Mg(II) complexes showed strong growth inhibition towards the Gram-negative species Pseudomonas aeruginosa.
Keywords:
Chenodeoxycholic acid
; Metal-based complex
; Spectroscopy
; Microscopic images
; Antimicrobial test
1. Introduction
Bile acids (BAs) are essential factors in lipid metabolism and end products of cholesterol catabolism. Catabolism of cholesterol is the most important route for removing surplus cholesterol from the circulation [1]. The therapeutic uses of BAs have been recognized since the early 1970s. At that time, chenodeoxycholic acid (CA) and ursodeoxycholic acid were shown to be effective in solubilizing cholesterol stones. For almost two decades thereafter, they were extensively used in the treatment of gallbladder stones. In the middle of the 1990s, the clinical applications of CA and ursodeoxycholic acid declined because laparoscopic cholecystectomy was being used in therapies for gallstone dissolution. Thus, the clinical relevance of BAs in removing gallbladder stones has decreased [2]. CA or chenodiol (Figure 1) (IUPAC name: 3α,7α-dihydroxy-5β-cholan-24-oic acid) is a naturally occurring bile acid that is generated in the liver from cholesterol via several enzymatic steps. The first portion of CA’s name, “cheno,” comes from a Greek term meaning “goose” because CA was first isolated from the bile of the domestic goose. CA was used therapeutically in dissolving cholesterol stones in the gallbladder due to its ability to maintain cholesterol solubility in bile [3]. Nowadays, CA is used in investigations on its effects on the small-intestinal absorption of bile acids and as a long-term replacement therapy for cerebrotendinous xanthomatosis [4].
Considerable attention has been devoted to the chemistry of the interactions of metal ions with natural and biological active compounds in medicine, pharmacology, chemistry, and biology. Complexation data on the metal-based compounds resulting from these interactions are important for a wide range of applications in many fields, including pharmaceutical and medical applications, as well as improving and designing more biologically active drugs [5,6,7,8,9,10,11,12]. For example, several platinum-based compounds (e.g., carboplatin, oxaliplatin, and cisplatin) are approved as broad-spectrum drugs for the treatment of solid tumors of the testicles, ovaries, and bladder [13,14,15,16]. Unfortunately, resistance can be acquired to some of these drugs, and some have severe side effects [17,18,19]. Therefore, researchers are investigating the interactions of metal ions with natural and vital compounds to discover bio-active metal-based compounds with anticancer, antifungal, or antibacterial properties, as well as lower toxicity, lower drug resistance, and higher efficacy. The aim of the present study was to examine the chelation tendency of CA towards several metal ions, as well as the resulting morphology and effects on fungi and bacteria species.
The study is separated into three parts of the investigation:
(i) Chemistry:
The CA complexes with Zn(II), Mg(II), and Ca(II) metal ions were synthesized in a 1:1 molar ratio (CA to metal) at 60-70°C in natural media (pH 7-8), which consisted of a binary solvent of MeOH and H2O (1:1). The CHN elemental results and spectra obtained from Ultraviolet/visible (UV-Visible), Fourier-transform infrared (FT-IR), and nuclear magnetic resonance (1H NMR) spectroscopies were used to characterize the resultant CA complexes.
(ii) Morphology:
Crystal structure and outer surface-related information about the CA complexes were collected from images captured by scanning and transmission electron microscopies (SEM and TEM, respectively) and the X-ray powder diffractometry (XRD) spectra.
(iii) Biology:
The antifungal and antibacterial activities of the resultant CA complexes were assessed in vitro against three fungi species and two types of bacterium (Gram-positive and Gram-negative) species. The inhabitation was examined using the Kirby-Bauer disc diffusion assay technique. Streptomycin was used as standard drug for comparison antibacterial results, whereas ketoconazole was used as standard drug for comparison antifungal results.
2. Materials and methods
2.1. Materials
All materials and solvents for the preparation of metal-based complexes were analytical or spectroscopic grade. They were obtained with the highest purity available (98-99.9%) and were used as received form commercial chemical sources (Fluka (Lausanne, Switzerland) and Sigma-Aldrich (MO, USA)). CA (C24H40O4; 392.57 g/mol) was used as the ligand, while ZnCl2 (136.30 g/mol), MgCl2 (95.21 g/mol), and CaCl2 (110.98 g/mol) were used as sources of metal ions.
2.2. Preparation and characterization
Complexes of CA with the metal ions Zn(II), Mg(II), and Ca(II) were synthesized by a simple procedure involving dissolution of the ions (2 mmol) in deionized water (25 mL). A beaker containing an aqueous solution of a metal ion was placed on a hot plate with a magnetic stirrer and stirred for 2-3 minutes. A methanolic solution of CA (2 mmol in 25 mL MeOH) was introduced dropwise. The temperature of the mixture was adjusted to the range 60–70°C, and the mixture was stirred for 5 minutes. The mixture was neutralized to pH ~7-8 using drops of 5% NH3 solution, and then white precipitates began to form. The mixture was stirred for an additional 10 minutes and left overnight for completion of the precipitation process. All of the precipitates of Zn(II), Mg(II), and Ca(II) ions were removed from the reaction vessels, and any unreacted starting materials were removed by washing with deionized water and organic solvents (methanol and diethyl ether). They were then rinsed with 10 mL of solvent to remove any unreacted starting materials. The resulting CA complexes were dried in a desiccator containing anhydrous CaCl2 for 48 h. The purified CA complexes were then subjected to elemental analyses using a Perkin-Elmer 2400 Series II CHNS microanalyzer to determine the contents of carbon, nitrogen, hydrogen, and chlorine. The purified CA complexes were also subjected to spectral analyses using a Perkin-Elmer Lambda 25 UV/Vis spectrophotometer, a Shimadzu FT-IR spectrophotometer, and a Bruker DRX-250 Digital FT-NMR spectrometer to obtain the complexes’ UV-visible, FT-IR, and 1H NMR spectra, respectively.
2.3. XRD spectra and microscopic images
The phase purity and crystal structure of the synthesized CA complexes were visualized using an X’Pert Philips X-ray powder diffractometer (XRD). The XRD spectra were collected within the diffraction-angle (2θ) range of 5 to 90° using a Cu Kα1 radiation source (λ=0.154056 nm). The texture and morphological features of the CA complexes were observed using a Quanta FEI 250 scanning electron microscope (SEM) and a JEOL JEM-1200 EX II transmission electron microscope (TEM). The accelerating voltage was 20 kV for the SEM analysis and 60-70 kV for the TEM analysis.
2.4. In vitro antimicrobial experiments
In vitro antifungal screening of the CA complexes was performed using cultures of Aspergillus niger, Penicillium sp., and Candida albicans. In vitro antibacterial assays of the CA complexes were performed using cultures of two types of bacteria: i) Gram-positive species (Bacillus subtilis, Streptococcus pneumoniae, and Staphylococcus aureus) and ii) Gram-negative species (Escherichia coli and Pseudomonas aeruginosa). The inhibition was examined using the Kirby-Bauer disc diffusion assay technique [20,21,22]. An antibiotic disc containing ketoconazole (an antifungal agent) was employed as the positive control for comparison of the antifungal results. An antibiotic disc containing streptomycin (an antibacterial agent) was employed as a positive control for comparison of the antibacterial results. The bacteria and fungi were grown in appropriate fresh medium to reach a desired volume (1×10⁸ cells/mL on average), and then the actively growing microbes were spread in a Petri dish containing nutrient agar medium. The dishes were left to solidify, and then a sterile cork borer was used to make four to six holes. 0.1 mL of each complex at a concentration of 100 µg/mL in dimethyl sulfoxide (DMSO) was poured into these holes. The dishes were incubated for 48 hours at 37°C for bacteria and for 5 days at 28-30 °C for fungi [23,24,25]. Light inhibition zones were observed around the holes and used to measure the diameter of the inhibition zones in millimeters with a Vernier caliper. The screening was performed in triplicate, and each inhibition zone value represents the mean of three independent measurements.
3. Results and discussion
3.1. Chemistry
3.1.1. Elemental compositions
The metal-based complexes of CA were synthesized by dissolving CA in MeOH solvent and dissolving the metal chloride salts of Zn(II), Mg(II), and Ca(II) ions in deionized water. No precipitates were seen when mixing the solution of CA with the solutions of each metal ion until the pH of the mixture reached ~7-8. At this point, the CA molecule (C24H40O4) loses the hydrogen atom of the -COOH group and becomes an anion (C24H39O4−; CA−). The CA− anion captures the metal ions and forms white crystals with the compositions described in the following:
i) Zn(II)complex:
White crystals; C24H41O5ZnCl; molecular weight, 510.40 g mol-1; microanalytical data (%): found (calculated) for C, 56.22 (56.43); H, 7.95 (8.03); Cl, 7.09 (6.95); Zn, 12.72 (12.81); Water, 3.65 (3.53).
ii) Mg(II) complex:
White crystals; C24H43O6MgCl; molecular weight, 487.32 g mol-1; microanalytical data (%): found (calculated) for C, 58.85 (59.10); H, 8.95 (8.82); Cl, 7.16 (7.27), Mg, 5.15 (4.99); Water, 7.30 (7.39).
iii) Ca(II) complex:
White crystals; C24H45O7CaCl; molecular weight, 521.10 g mol-1; microanalytical data (%): found (calculated) for C, 55.40 (55.27); H, 8.53 (8.64); Cl, 6.95 (6.80), Ca, 7.86 (7.69); Water, 10.28 (10.36).
The microanalytical results suggest that the reaction stoichiometry is 1:1 (CA to metal) and comply with the suggested general compositions of the complexes obtained with Zn(II), Mg(II), and Ca(II) ions, which are [Zn(CA)(H2O)Cl], [Mg(CA)(H2O)Cl]·H2O, and [Ca(CA)(H2O)Cl]·2H2O, respectively.
3.1.2. UV-visible spectra
The UV-visible spectra of free CA and its complexes with Zn(II), Mg(II), and Ca(II) ions were recorded over the wavelength range of 200-1100 nm using DMSO solutions at concentrations of 1×10⁻³ M. The obtained spectra are shown in Figure 2. The DMSO solution of free CA exhibited a strong absorption band at 313 nm. This band had a medium-intensity shoulder at 270 nm. The main absorption band was attributed to n→π* transitions, while the shoulder was associated with π→π* transitions. The intensity of the main absorption band was increased when the CA complexed with the metal ions and became much broader. The width of the main band of free CA was around 88 nm, but for the Zn(II), Mg(II), and Ca(II) complexes, the widths were ~340, ~250, and ~200 nm, respectively. The maximum wavelength (λmax) of the main band was slightly shifted from 313 nm for free CA to ~315 nm for the complexes. The shoulder of the main band of free CA was still observed in the UV-visible spectra of the complexes at approximately the same position. However, new shoulder bands appeared in the spectra of the complexes. The complex of the Zn(II) ion had two shoulder bands at 395 and 413 nm. The complex of the Mg(II) ion displayed a shoulder band at 375 nm. The complex of the Ca(II) ion presented two shoulder bands at 370 and 412 nm. All of these shoulder absorptions may be assignable to the metal-to-ligand charge transfer band (MLCT) [26,27].
3.1.3. FT-IR and 1H NMR spectra
The FT-IR spectra of CA complexes with Zn(II), Mg(II), and Ca(II) ions were recorded at wavenumber of 400-4000 cm-1, as shown in Figure 3. Free CA contains one carboxylic group (-COOH), two hydroxyl groups (-OH), 10 methylene moieties (-CH2), eight -CH moieties, and three methyl groups (-CH3). The hydroxyl groups and the carboxylic acid O–H were responsible for the strong, broad absorption band observed in the FT-IR spectrum of free CA. The band was centered at 3422 cm−1 and could be attributed to ν(O–H) vibrations. The absorptions at 1368 and 906 cm−1 could be due to in-plane and out-of-plane bending vibration of O–H, respectively. The carboxyl C=O of the -COOH group was responsible for the very strong, intense absorption band located at 1714 cm−1 and could be attributed to ν(C=O)COOH vibrations. The multiple -CH, -CH2, and -CH3 moieties generated strong absorption bands at 2926 and 2864 cm−1, which could be attributed to νasym(C–H) and νsym(C–H) vibrations. Methylene (-CH2) scissoring (δscissCH2), rocking (δrockCH2), wagging (δwagCH2), and twisting (δtwistCH2) vibrations occurred at 1375, 1245, 898, and 609 cm−1, respectively. Methyl (-CH3) scissoring (δscissCH3), rocking (δrockCH3), wagging (δwagCH3), and twisting (δtwistCH3) vibrations appeared at 1452, 1310, 930, and 622 cm−1, respectively. ν(C‒O) vibration occurred at 1167 cm-1, and ν(C‒C) vibration occurred at 1053 cm-1 [28,29]. An absorption band due to the stretching vibrations of carboxyl C=O of -COOH group occurred at 1714 cm−1 in the FT-IR spectrum of free CA, but it was no longer found in the spectra of the Zn(II), Mg(II), and Ca(II) complexes. The absence of this characteristic absorption band resulted from the deprotonation of the -COOH group. The CA− anion utilized the carboxylate group (-COO−) to capture the metal ions, which generated two new absorption bands in the FT-IR spectra of the complexes. These were attributed the characteristic carboxylate bands. The first band appeared at 1555, 1552, and 1550 cm−1 in the spectra of Zn(II), Mg(II), and Ca(II) complexes, respectively, and could be attributed to νasym(COO−) vibrations of the carboxylate group. The second band was located at 1410, 1414, and 1415 cm−1 in the spectra of Zn(II), Mg(II), and Ca(II) complexes, respectively, and could be attributed to νsym(COO−) vibrations of the carboxylate group. The band-frequency differences between the νasym(COO−) and νsym(COO−) values [Δν= ν asym − ν sym] for Zn(II), Mg(II), and Ca(II) complexes were 145, 138, and 135 cm−1, respectively. These Δν values were lower than that of the free CA− anion. According to the Nakamoto criterion [30], the coordination mode of the CA carboxylate group is bidentate chelating. The -CH2 and -CH3 vibrational modes presented some shifts in their positions and intensities in the FT-IR spectra of the Zn(II), Mg(II), and Ca(II) complexes compared with those of free CA. The bands at 495 cm−1 for the Zn(II) complex, 485 cm−1 for the Mg(II) complex, and 490 cm−1 for the Ca(II) complex were due to ν(M–O) vibrations [30].
Figure 4 shows the 1H NMR spectrum of the CA complex with Zn(II) ions. In this spectrum, the signals at 3.48-3.75 ppm could be attributed to the protons of the -CH3 and -CH moieties, while the signals at 6.62 to 7.58 ppm could be assigned to the protons of the -CH2 moieties. The 1H NMR spectrum of free CA contained a single sharp signal resonating at δ ~ 11.9 ppm due to the proton of the -COOH group [29]. This signal was no longer found in the spectrum of the Zn(II) complex. The disappearance of the characteristic FT-IR band associated with the ν(C=O)COOH vibrations, the absence of the characteristic 1H NMR -COOH proton signal, and the appearance of the characteristic carboxylate FT-IR bands (νasymCOO− and νsymCOO−) suggest the deprotonation of the -COOH group. The CA− anion utilized the oxygen atoms of the resulting carboxylate group (-COO−) to capture the Zn(II), Mg(II), and Ca(II) ions. Based on the elemental and spectral observations, chemical structures for the synthesized CA complexes are proposed, as shown in Figure 5.
3.2. Morphology
XRD spectra and microscopic images obtained by SEM and TEM were used to observe the crystal structure, texture, and morphological feature of Zn(II), Mg(II), and Ca(II) complexes, and the results are presented in Figure 6, Figure 7 and Figure 8. The synthesized CA complexes displayed a single, narrow, and very strong diffraction line in their XRD spectra. This prominent diffraction line was precisely located at 2θ values of 32.647°, 8.598°, and 16.621° in the XRD spectra of Zn(II), Mg(II), and Ca(II) complex, respectively. These XRD patterns indicate the formation of well-crystallized complexes. The XRD profile of Zn(II) complex displayed five low-intensity lines that occurred in a wide range (approximately 20 to 60°), with the most intense lines located at 22.736° and 58.051°. The XRD diffraction profile of Mg(II) complex exhibited multiple low-intensity lines in the range of 10 to 40°, and the most intense lines in this range were located at 12.066°, 18.078° and 21.607°. The complex of Ca(II) ion displayed fewer low-intensity lines compared to the Mg(II) complex, with the most intense lines appearing at 28.461° and 37.715°.
Both SEM and TEM images revealed that all complexes had well-crystallized structure. The complexation of CA with Zn(II), Mg(II), and Ca(II) ions led to particles with long rod-like shapes. The heads of these rods were sharp and resembled a knife. A few rods were seen individually, but most of them accumulated together and formed individual units. Several broken rods were seen in Mg(II) and Ca(II) complexes in particular. Some of the Mg(II) complex particles showed no complete development into long or short rods.
3.3. Biological effects
In vitro antifungal screening of the CA complexes was performed using cultures of three fungi species. In vitro antibacterial assays of the CA complexes were performed using cultures of two types of bacteria: i) Gram-positive species, and ii) Gram-negative species. The antibiotic drugs ketoconazole and streptomycin (positive controls) were used to compare the antifungal and antibacterial results, respectively. Table 1 indicates the inhibition zones created by the positive controls and the synthesized CA complexes towards the tested microbes are listed in, and a diagram is shown in Figure 9.
The synthesized complexes were inactive or displayed a very low inhibitory effect against the fungal species Candida albicans. Zn(II) and Ca(II) complexes showed strong activity against Penicillium sp. with slightly lower inhibition than that of the positive control (17.0 for Zn(II) complex; 18.0 for Ca(II) complex; 21.0 mm/mg for the positive control). Mg(II) and Ca(II) complexes exhibited excellent activity against A. Niger. Their zones of inhibition of were 23.0 and 21.0 mm/mg, indicating 127% and 116% of the activity of the positive control, respectively. The synthesized complexes exhibited low to moderate activity against all the investigated Gram-positive bacterial species (B. subtilis, S. pneumoniae, and S. aureus). The sones of inhibition observed for the positive control against them were 18.0, 17.0, and 20.0 mm/mg, respectively. The zone of inhibitions for the synthesized complexes against these microbes were in the range of 4-12 mm/mg. All complexes showed moderate lethality against the Gram-negative species E. coli with zones of inhibition in the range of 9-15 mm/mg. Mg(II) and Zn(II) complexes strongly inhibited the growth of the Gram-negative species P. aeruginosa with zones of inhibition of 22.0 and 20.0 mm/mg, respectively. The zone of inhibition of the positive control against this species was 27.0 mm/mg.
4. Conclusions
Complexes of one of the naturally occurring bile acid CA with metal ions (Zn(II), Mg(II), and Ca(II)) were synthesized, and their structures were elucidated. Analytical and spectral results showed that the complexation stoichiometry was 1:1 (metal to CA), CA coordinated towards the metal ions at the carboxylate-group oxygen atoms, and the complexes were formulated as [Zn(CA)(H2O)Cl], [Mg(CA)(H2O)Cl]·H2O, and [Ca(CA)(H2O)Cl]·2H2O. The Ca(II) and Mg(II) complexes had excellent inhibitory effects on the cell growth of A. niger with potency exceeding that of the positive control. The Zn(II) and Ca(II) complexes exhibited strong inhibitory effects on the cell growth on Penicillium sp. species, while the Zn(II) and Mg(II) complexes exhibited strong inhibitory effects on the cell growth of P. aeruginosa. In future works, we plan to examine the cytotoxic potency of CA complexes toward various human cancer-cell lines to provide wide-spectrum data on the pharmacological effects of these complexes.
Funding
This research was funded by the Deputyship for Research & Innovation, Ministry of Education in Saudi Arabia through project no. (IFKSURC-1-0129).
Acknowledgements
The authors extend their appreciation to the Deputyship for Research & Innovation, Ministry of Education in Saudi Arabia for funding this research. (IFKSURC-1-0129).
References
- Lefebvre, P.; Cariou, B.; Lien, F.; Kuipers, F.; Staels, B. Role of Bile Acids and Bile Acid Receptors in Metabolic Regulation. Physiol. Rev. 2009, 89, 147–191. [Google Scholar] [CrossRef] [PubMed]
- S. Fiorucci, E. S. Fiorucci, E. Distrutti, Chenodeoxycholic Acid: An Update on Its Therapeutic Applications. In: Fiorucci, S., Distrutti, E. (eds) Bile Acids and Their Receptors. Handbook of Experimental Pharmacology, vol 256. Springer, Cham, 2019, pp 265-282.
- Bateson, M.; Maclean, D.; Evans, J.; Bouchier, I. Chenodeoxycholic acid therapy for hypertriglyceridaemia in men. Br. J. Clin. Pharmacol. 1978, 5, 249–254. [Google Scholar] [CrossRef] [PubMed]
- Eloranta, J.J.; Kullak-Ublick, G.A. Coordinate transcriptional regulation of bile acid homeostasis and drug metabolism. Arch. Biochem. Biophys. 2005, 433, 397–412. [Google Scholar] [CrossRef] [PubMed]
- A.C. Tella, J.A. A.C. Tella, J.A. Obaleye, M.D. Olawale, J.M.V. Ngororabanga, A.S. Ogunlaja, S.A. Bourned, C.R. Chimie 22 (1) (2019) 3-12.
- G.L. Eichhorn, L.G. G.L. Eichhorn, L.G. Marzilli, Advances in Inorganic Biochemistry Models in Inorganic Chemistry, PTR Prentice-Hall, Inc, New Jersey, 1994.
- M.N. Hughes, The Inorganic Chemistry of Biological Processes, 2nd ed., Wiley, Chichester [England], 1984.
- E. Alessio, Bioinorganic Medicinal Chemistry, Wiley-VCH Verlag GmbH and Co. KGaA, 2011.
- F. Trudu, F. F. Trudu, F. Amato, P. Vaňhara, T. Pivetta, E.M. Peña-Méndez. J. Havel, J. Appl. Biomed 2015, 13, 79. [Google Scholar]
- U. Singh, A.M. U. Singh, A.M. Malla, I.A. Bhat, A. Ahmad, M.N. Bukhari, S. Bhat, S. Anayutullah, A. A. Hashmi, Microb. Pathog. 93 (2016) 172.
- P.P. Netalkar, S.P. P.P. Netalkar, S.P. Netalkar, V.K. Revankar, Polyhedron 100 (2015) 215.
- M.A. Ragheb, M.A. M.A. Ragheb, M.A. Eldesouki, M.S. Mohamed, Spectrochim. Acta A 138 (2015) 585.
- Khan, T.-M.; Gul, N.S.; Lu, X.; Wei, J.-H.; Liu, Y.-C.; Sun, H.; Liang, H.; Orvig, C.; Chen, Z.-F. In vitro and in vivo anti-tumor activity of two gold(III) complexes with isoquinoline derivatives as ligands. Eur. J. Med. Chem. 2019, 163, 333–343. [Google Scholar] [CrossRef] [PubMed]
- Cao, Q.; Li, Y.; Freisinger, E.; Qin, P.Z.; Sigel, R.K.O.; Mao, Z.-W. G-quadruplex DNA targeted metal complexes acting as potential anticancer drugs. Inorg. Chem. Front. 2017, 4, 10–32. [Google Scholar] [CrossRef]
- Tavares, T.T.; Azevedo, G.C.; Garcia, A.; Carpanez, A.G.; Lewer, P.M.; Paschoal, D.; Müller, B.L.; Dos Santos, H.F.; Matos, R.C.; Silva, H.; et al. Gold(I) complexes with aryl-thiosemicarbazones: Molecular modeling, synthesis, cytotoxicity and TrxR inhibition. Polyhedron 2017, 132, 95–104. [Google Scholar] [CrossRef]
- F. Trudu, F. F. Trudu, F. Amato, P. Vaňhara, T. Pivetta, E.M. Peña-Méndez, J. Havel, Coordination compounds in cancer: Past, present and perspectives, J. Appl. Biomed. 13 (2) (2015) 79-103.
- Qin, Q.-P.; Wang, S.-L.; Tan, M.-X.; Liu, Y.-C.; Meng, T.; Zou, B.-Q.; Liang, H. Synthesis of two platinum(II) complexes with 2-methyl-8-quinolinol derivatives as ligands and study of their antitumor activities. Eur. J. Med. Chem. 2019, 161, 334–342. [Google Scholar] [CrossRef] [PubMed]
- Meng, T.; Tang, S.-F.; Qin, Q.-P.; Liang, Y.-L.; Wu, C.-X.; Wang, C.-Y.; Yan, H.-T.; Dong, J.-X.; Liu, Y.-C. Evaluation of the effect of iodine substitution of 8-hydroxyquinoline on its platinum(ii) complex: cytotoxicity, cell apoptosis and telomerase inhibition. MedChemComm 2016, 7, 1802–1811. [Google Scholar] [CrossRef]
- Hu, K.; Zhou, G.; Zhang, Z.; Li, F.; Li, J.; Liang, F. Two hydrazone copper(ii) complexes: synthesis, crystal structure, cytotoxicity, and action mechanism. RSC Adv. 2016, 6, 36077–36084. [Google Scholar] [CrossRef]
- Bauer, A.W.; Kirby, W.M.M.; Sherris, J.C.; Turck, M. Antibiotic Susceptibility Testing by a Standardized Single Disk Method. Am. J. Clin. Pathol. 1966, 45, 493–496. [Google Scholar] [CrossRef] [PubMed]
- Biemer, J.J. Antimicrobial susceptibility testing by the Kirby-Bauer disc diffusion method. Ann. Clin. Lab. Sci. 1973, 3, 135–140. [Google Scholar]
- M.C. Serrano, M. M.C. Serrano, M. Ramírez, D. Morilla, A. Valverde, M. Chávez, A. Espinel-Ingroff, R. Claro, A. Fernández, C. Almeida, E. Martín-Mazuelos, A comparative study of the disc diffusion method with the broth microdilution and Etest methods for voriconazole susceptibility testing of Aspergillus spp., J. Antimicrob. Chemo-ther. 53 (2004) 739‒742.
- A Pfaller, M.; Burmeister, L.; Bartlett, M.S.; Rinaldi, M.G. Multicenter evaluation of four methods of yeast inoculum preparation. J. Clin. Microbiol. 1988, 26, 1437–1441. [Google Scholar] [CrossRef] [PubMed]
- Beecher, D.J.; Wong, A.C. Identification and analysis of the antigens detected by two commercial Bacillus cereus diarrheal enterotoxin immunoassay kits. Appl. Environ. Microbiol. 1994, 60, 4614–4616. [Google Scholar] [CrossRef]
- National Committee for Clinical Laboratory Standards. Methods for Antimicrobial Susceptibility Testing of Anaerobic Bacteria: Approved Standard M11-A3. NCCLS, Wayne, PA, USA (1993).
- Allan, J.R.; Baird, N.D.; Kassyk, A.L. Some first row transition metal complexes of nicotinamide and nicotinic acid. J. Therm. Anal. Calorim. 1979, 16, 79–90. [Google Scholar] [CrossRef]
- Öztirk, F.; Şekerci, M.; Özdemir, E. Preparation of complexes of 1-amino-6,7-O-cyclohexylidene-4-azaheptane with transition metal acetates. Russ. J. Gen. Chem. 2006, 76, 33–36. [Google Scholar] [CrossRef]
- Mathavan, S.; Chen-Tan, N.; Arfuso, F.; Al-Salami, H. The role of the bile acid chenodeoxycholic acid in the targeted oral delivery of the anti-diabetic drug gliclazide, and its applications in type 1 diabetes. Artif. Cells, Nanomedicine, Biotechnol. 2016, 44, 1508–1519. [Google Scholar] [CrossRef] [PubMed]
- Zhang, X.; Fan, D.; Hua, X.; Zhang, T. Large-scale production of ursodeoxycholic acid from chenodeoxycholic acid by engineering 7α- and 7β-hydroxysteroid dehydrogenase. Bioprocess Biosyst. Eng. 2019, 42, 1537–1545. [Google Scholar] [CrossRef] [PubMed]
- K. Nakamoto, Infrared Spectra of Inorganic and Coordination Compounds, Wiley Interscience, John Wiley & Sons, New York, NY, USA, 2nd edition, 1970.
Figure 1.
Structure of chenodeoxycholic acid (CA).
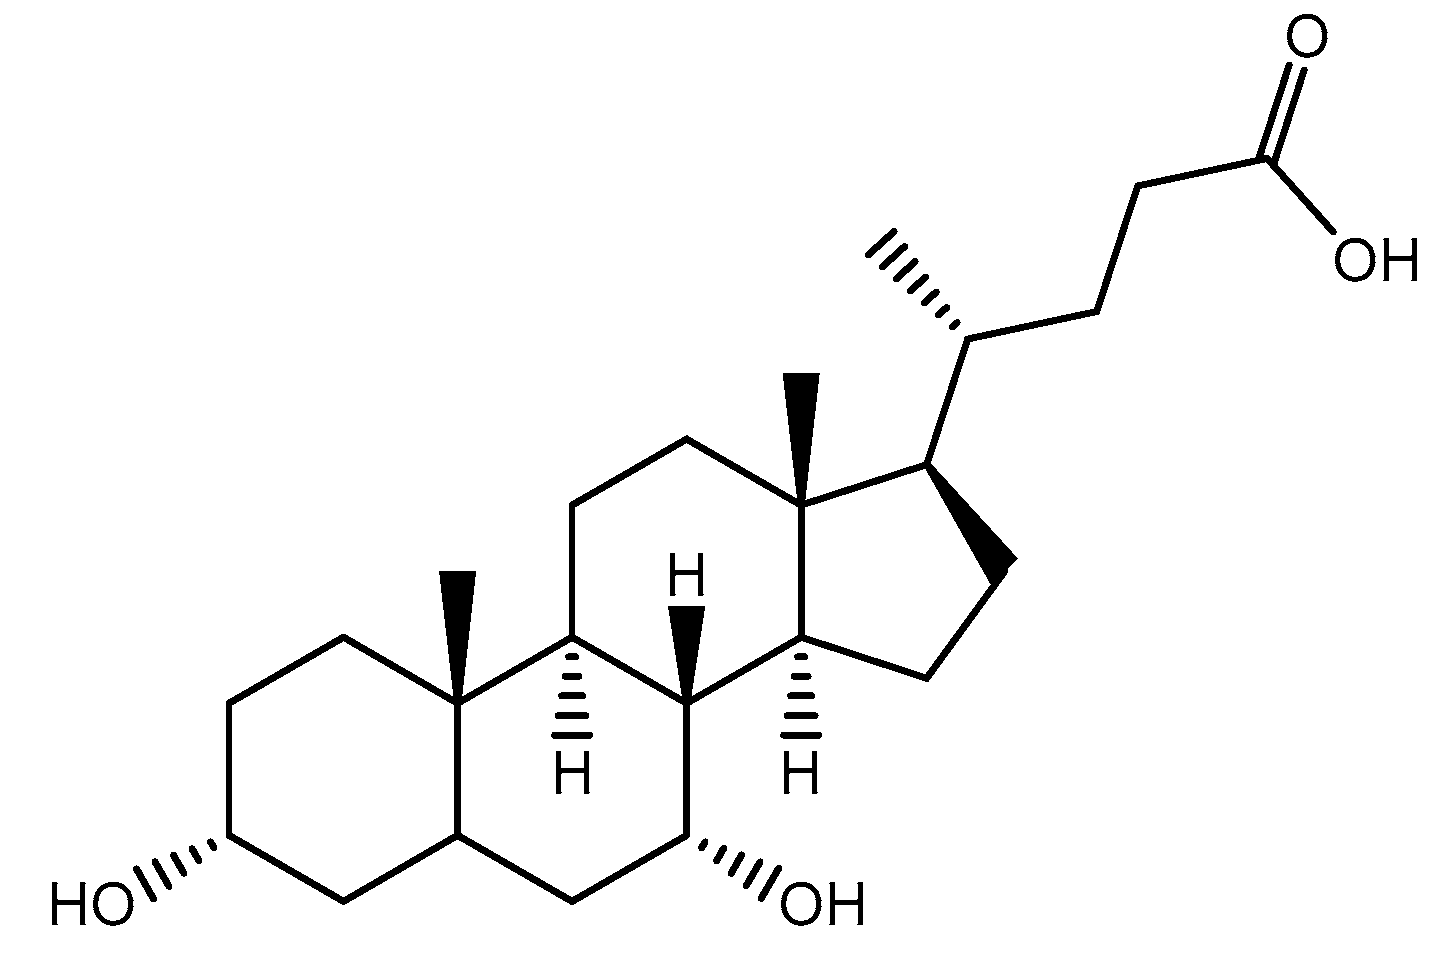
Figure 2.
The UV-visible spectra of free CA and the synthesized complexes.
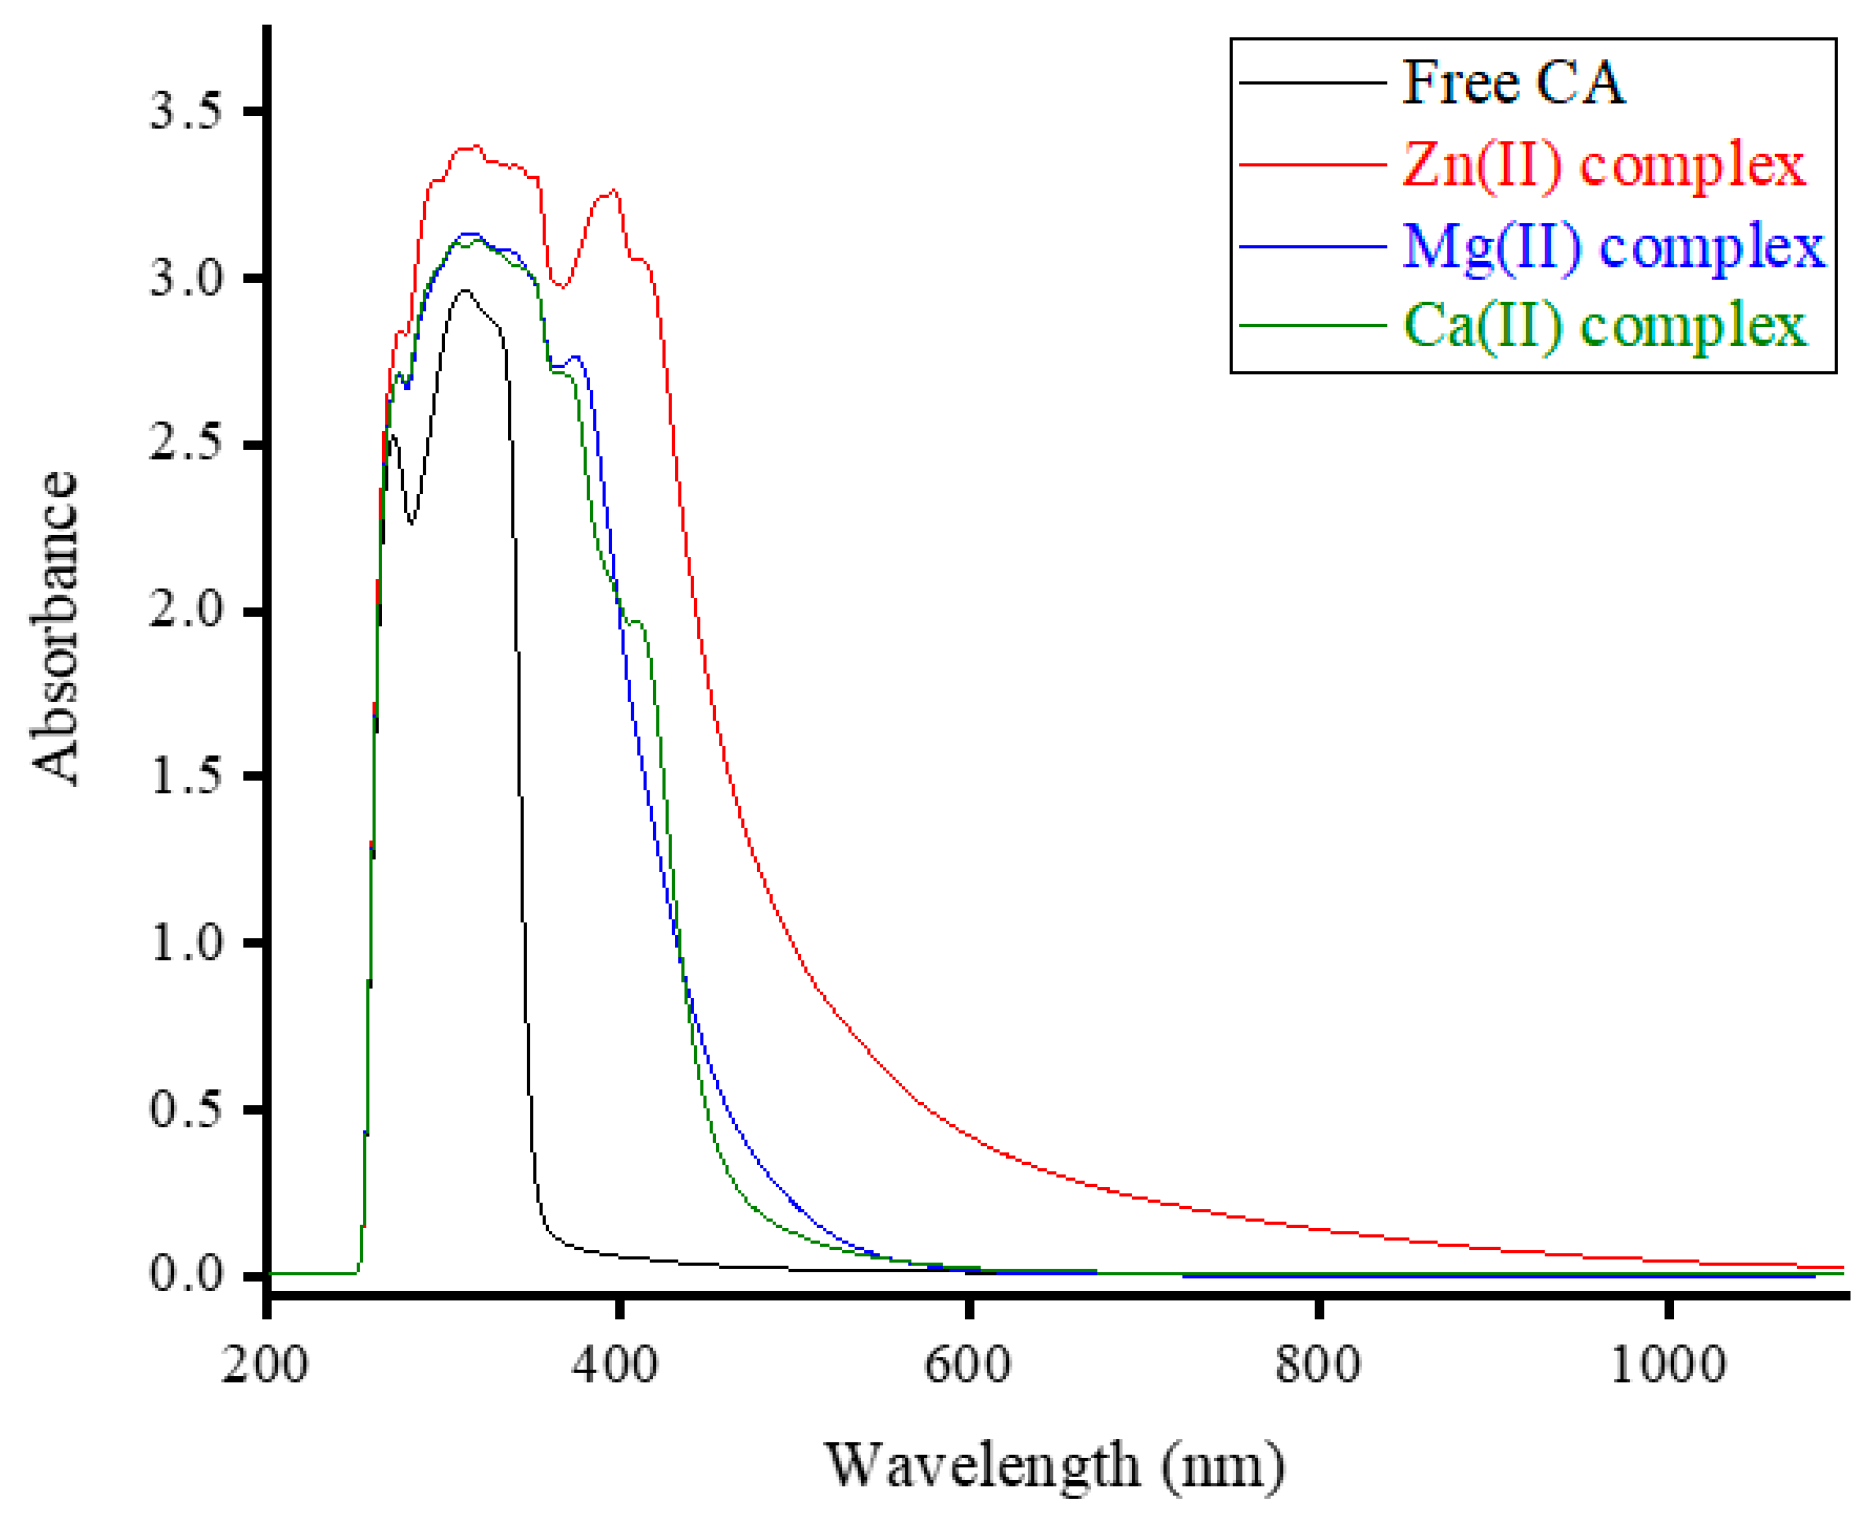
Figure 3.
The FT-IR spectra of the synthesized CA complexes.
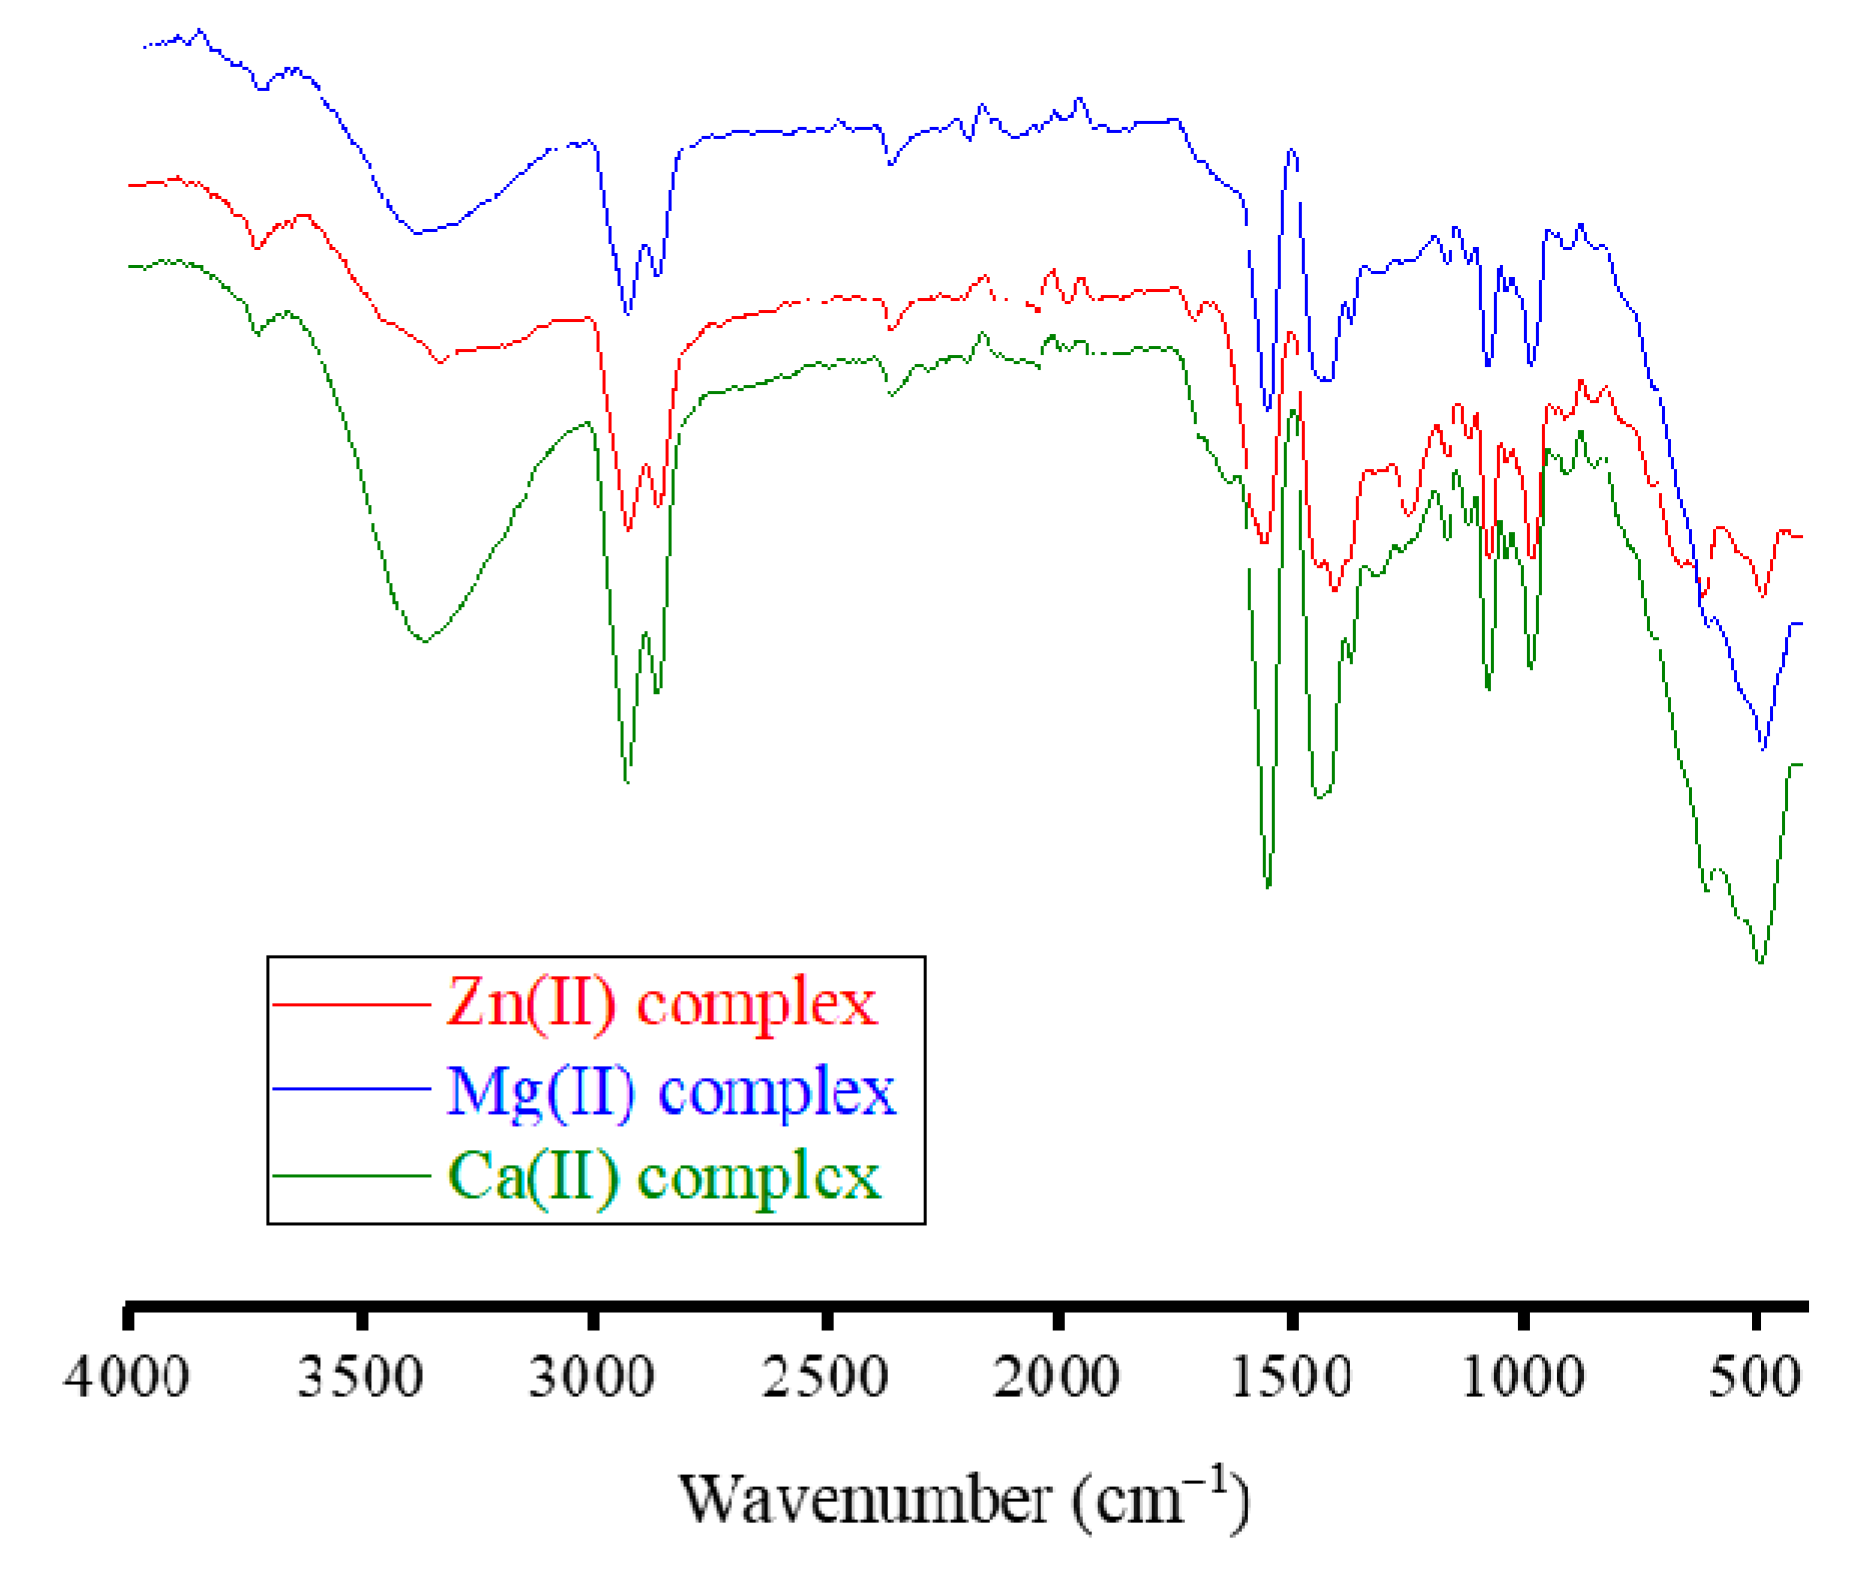
Figure 4.
The 1H NMR spectrum of CA complex with Zn(II) ion.
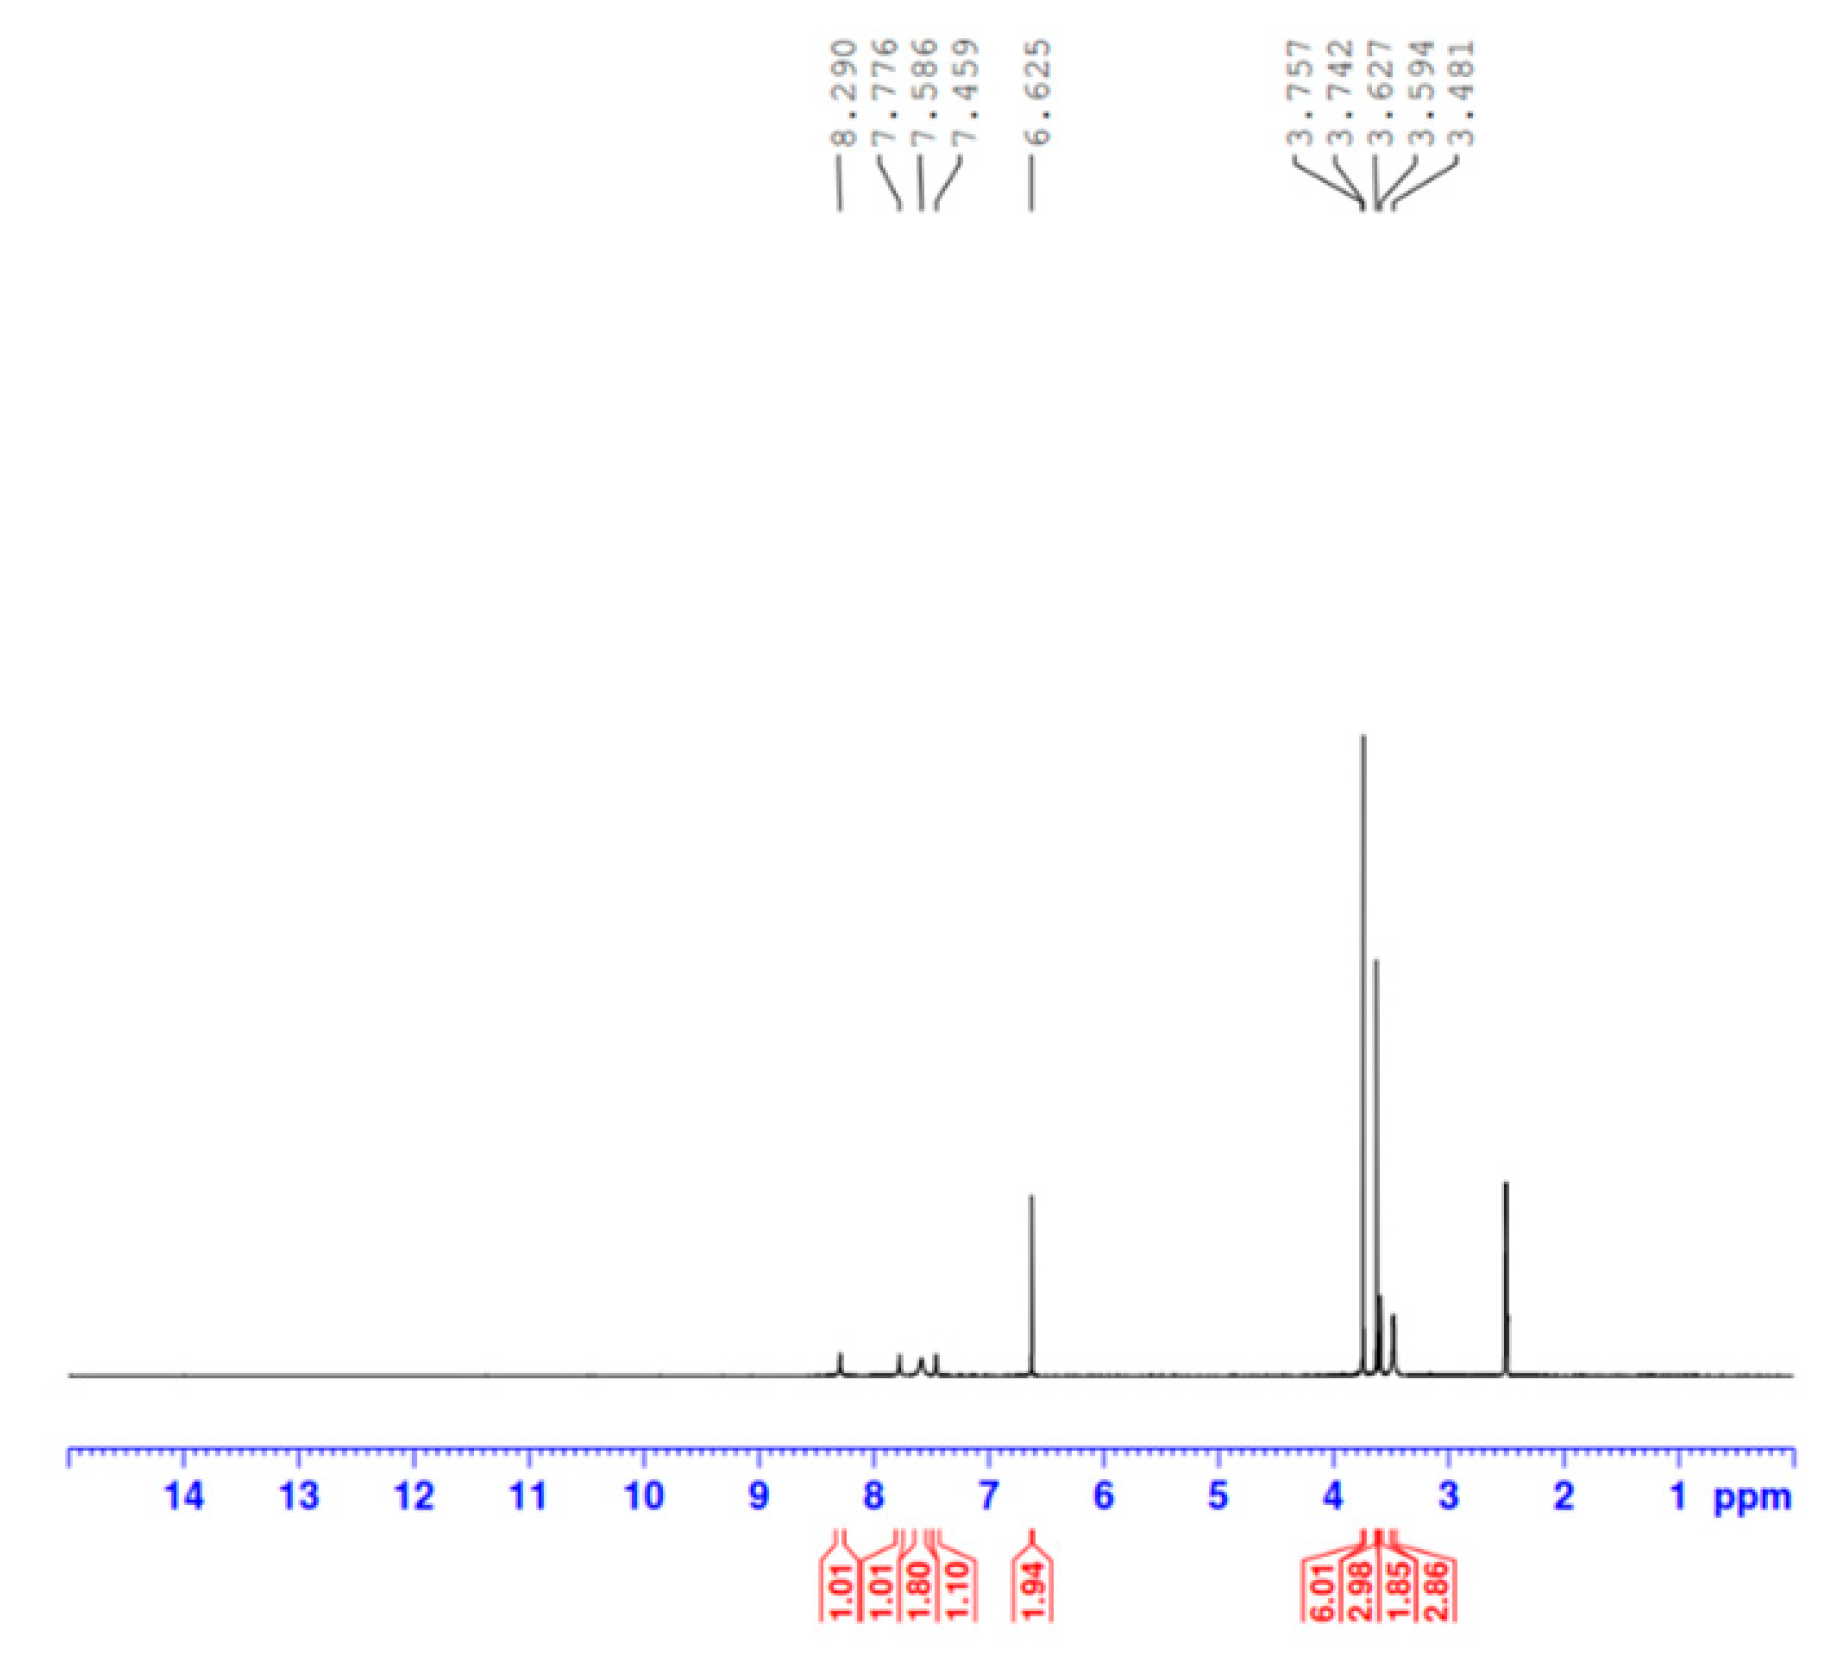
Figure 5.
Proposed structures of the CA complexes [M: Zn(II), Mg(II) and Ca(II) ions].
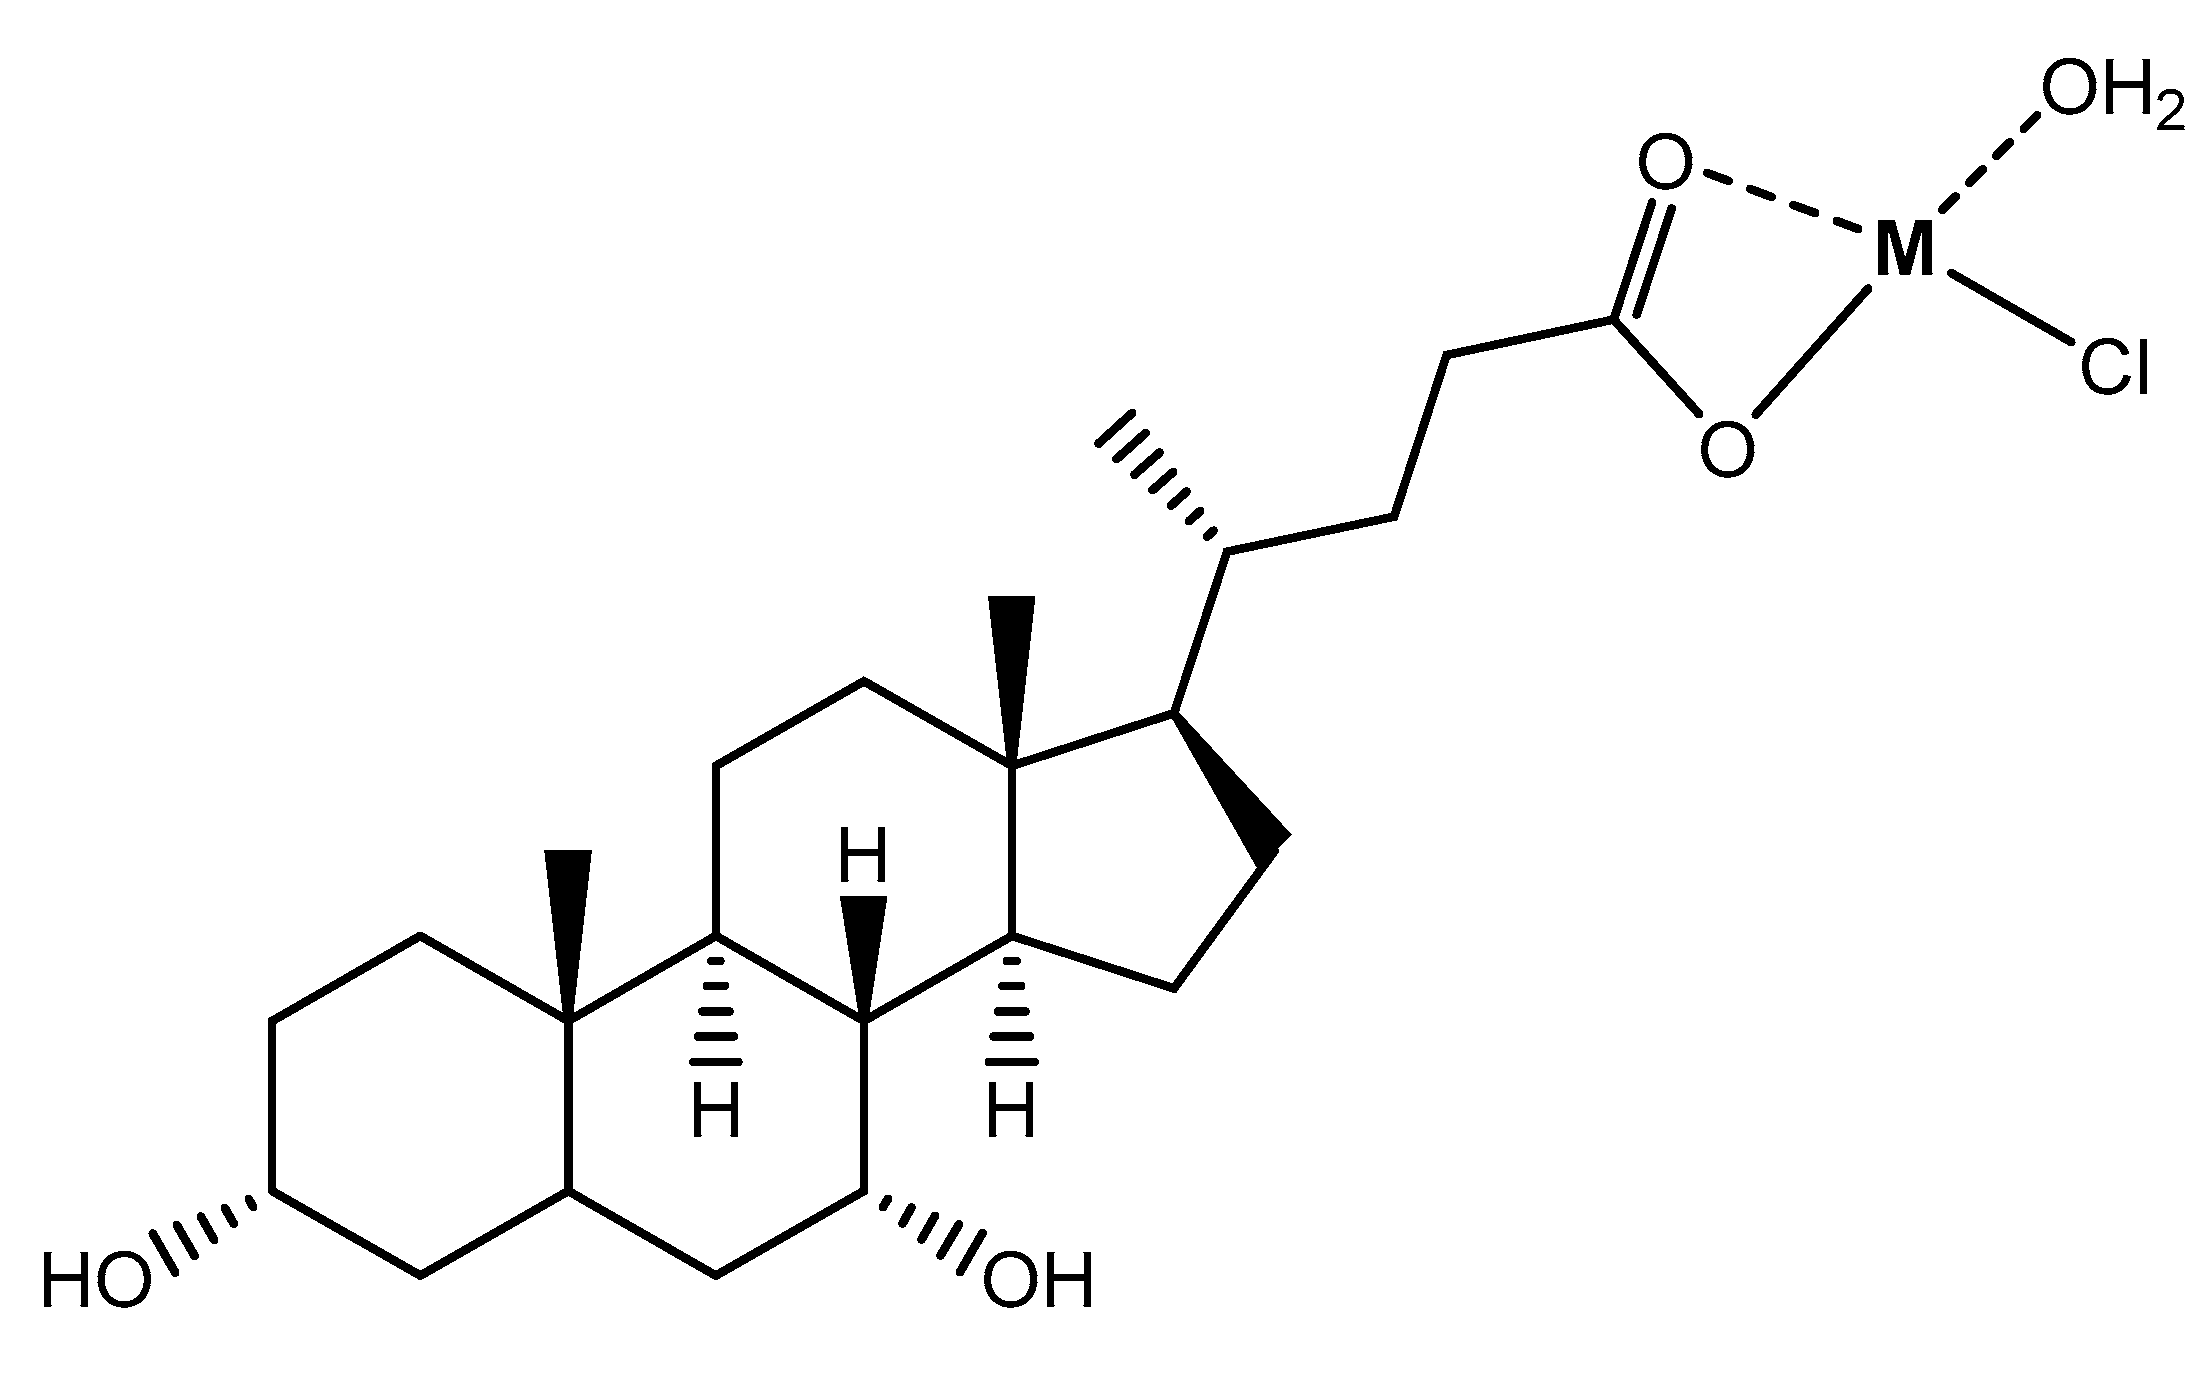
Figure 6.
XRD spectrum and microscopic images (SEM and TEM) of Zn(II) complex.
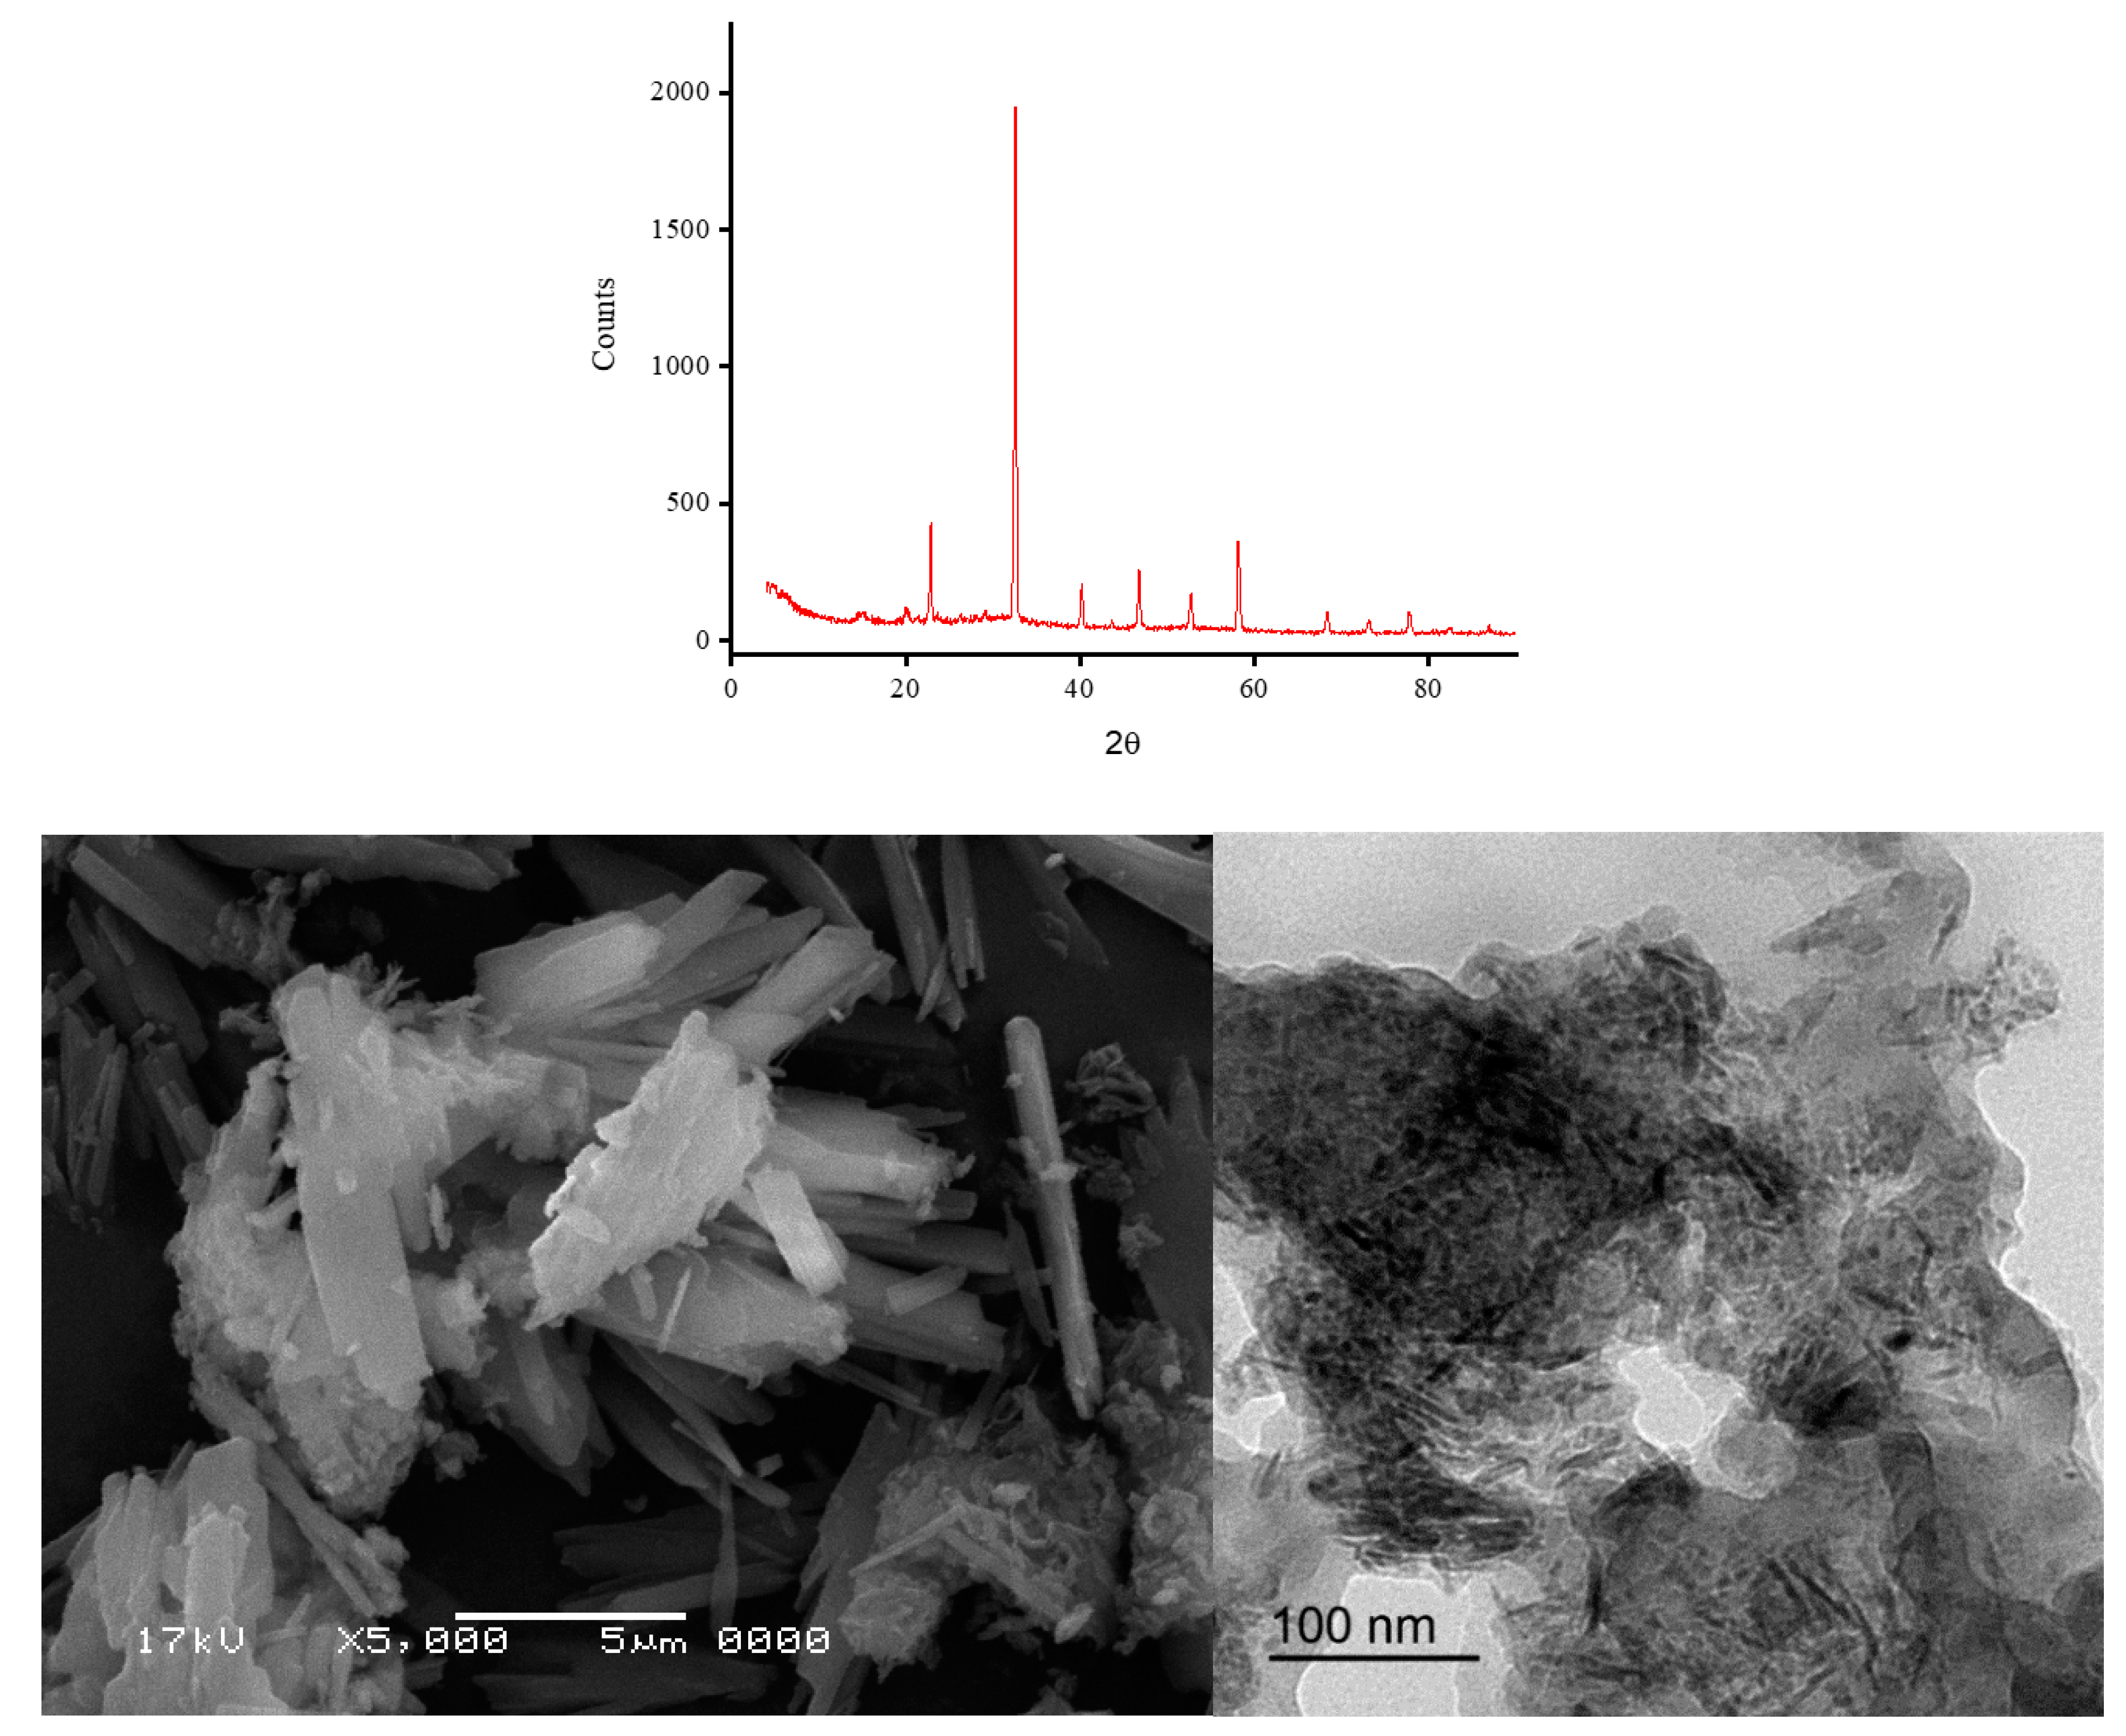
Figure 7.
XRD spectrum and microscopic images (SEM and TEM) of Mg(II) complex.
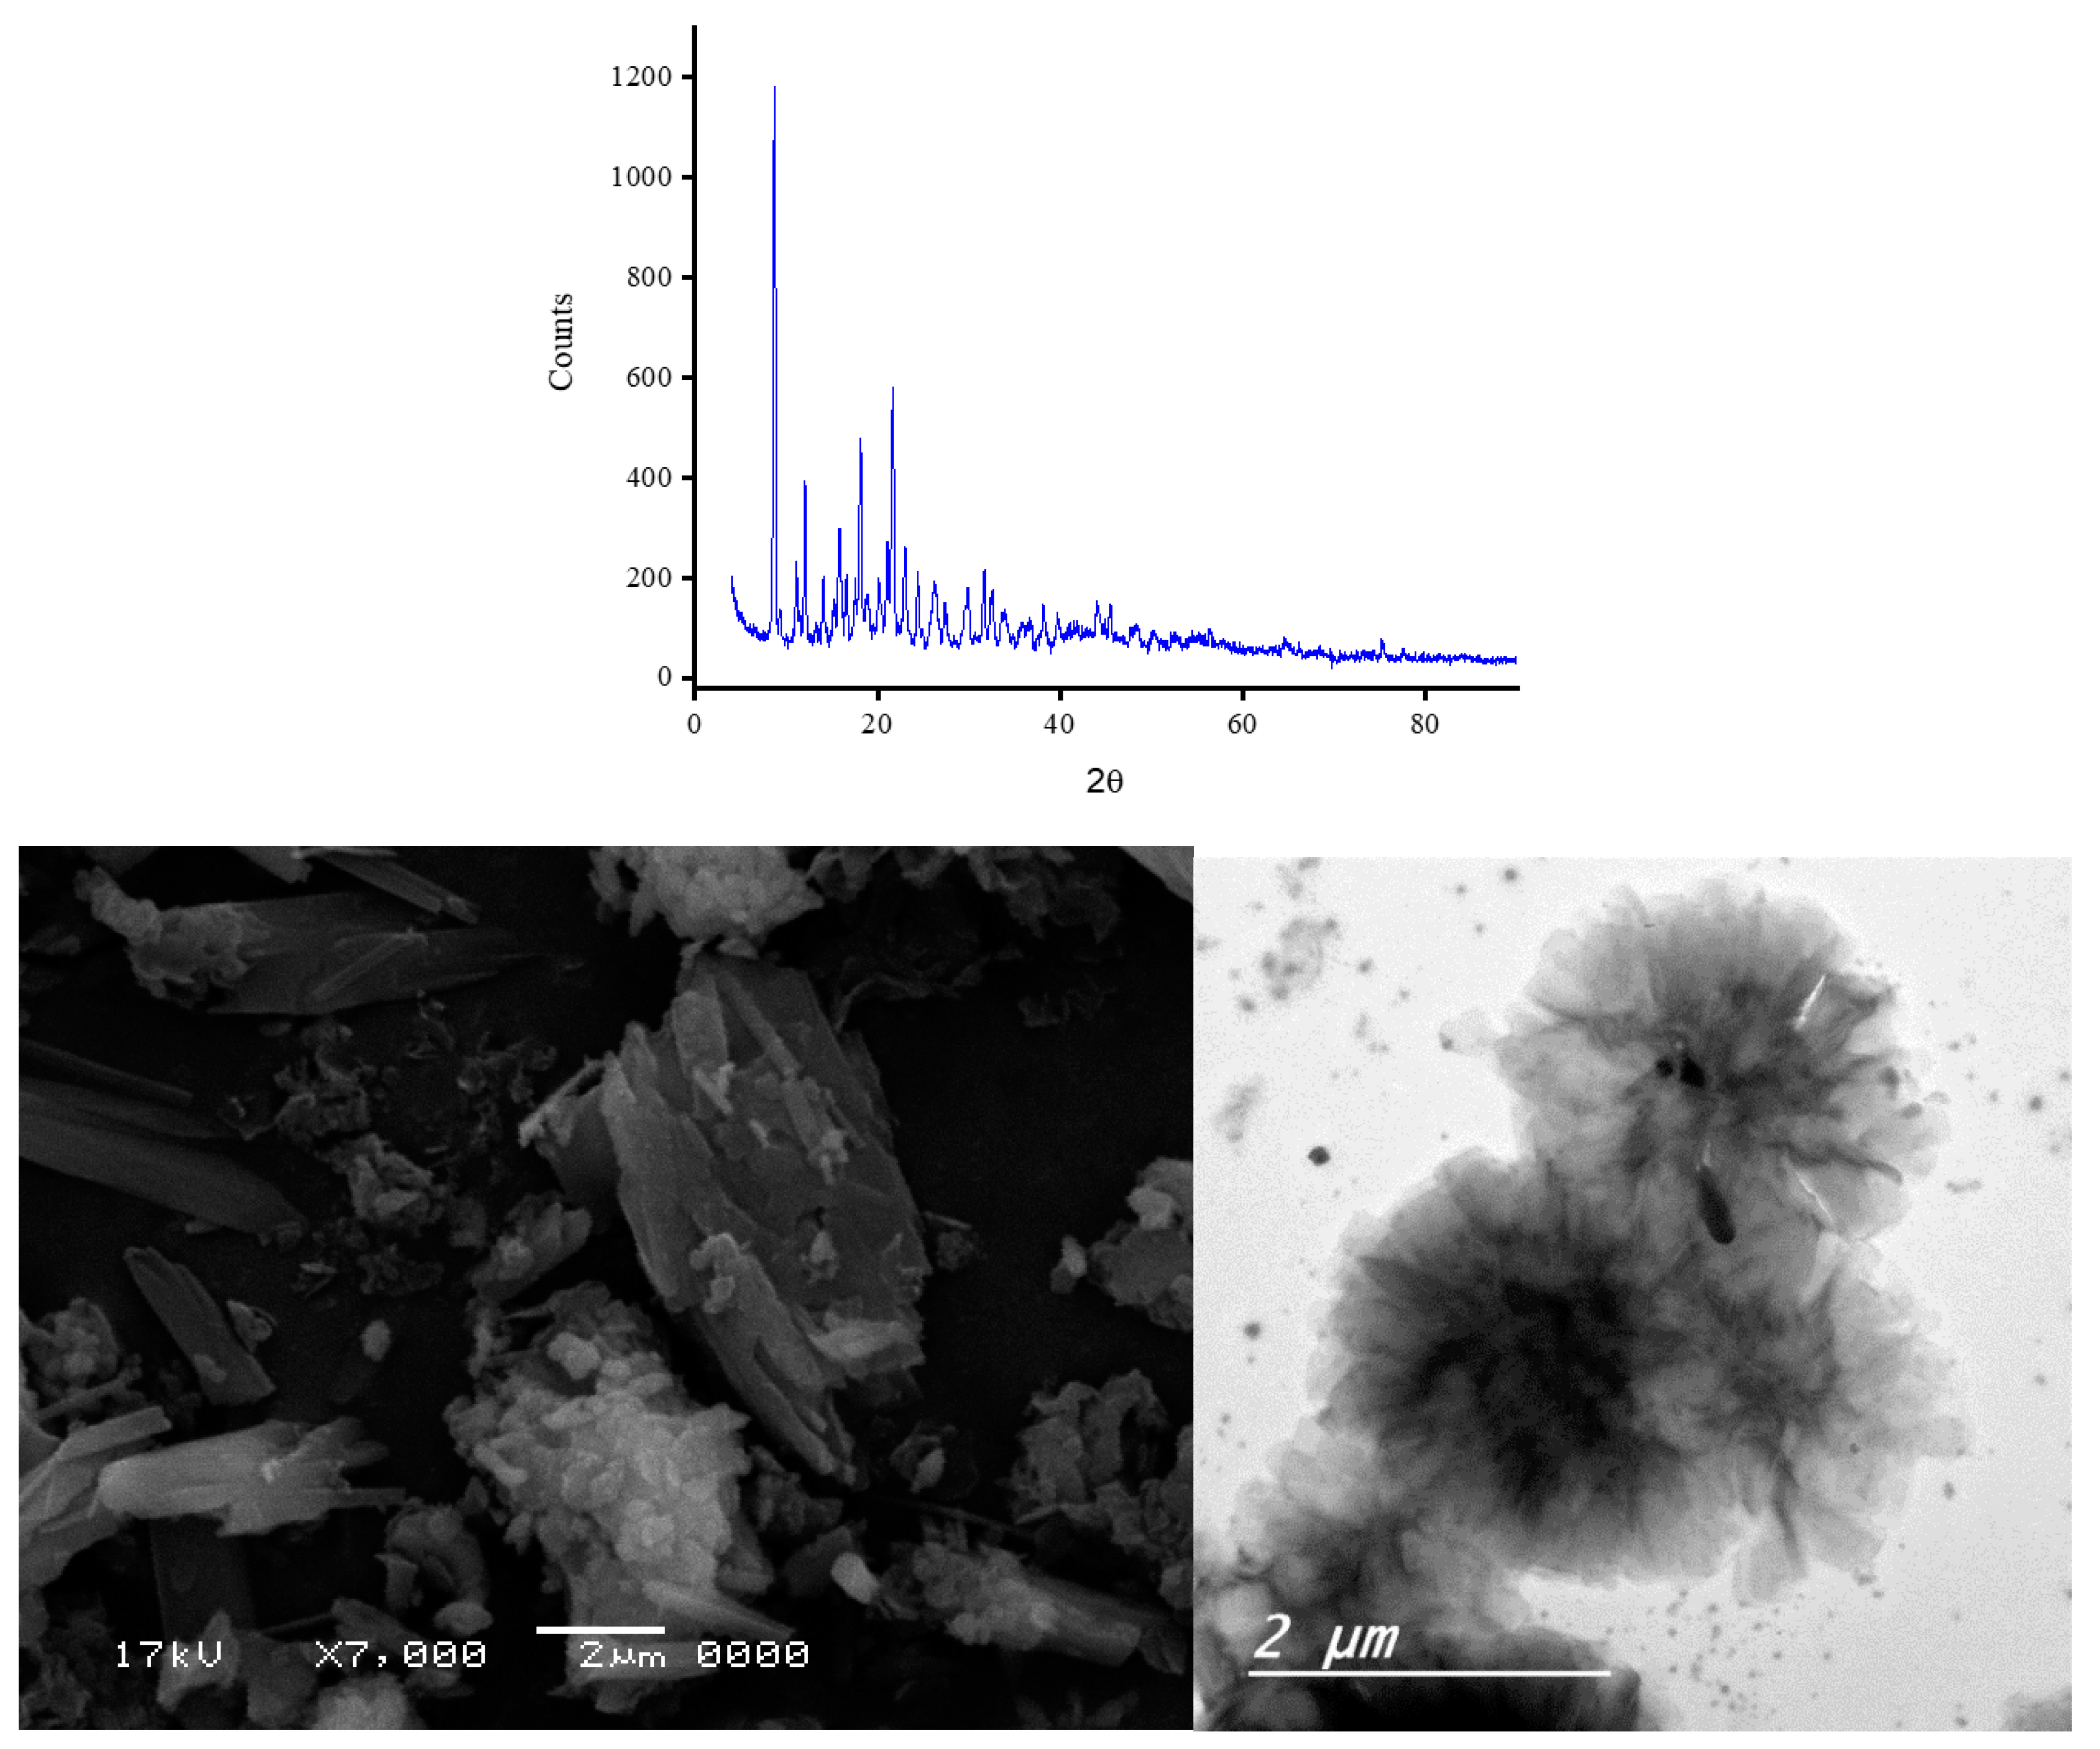
Figure 8.
XRD spectrum and microscopic images (SEM and TEM) of Ca(II) complex.
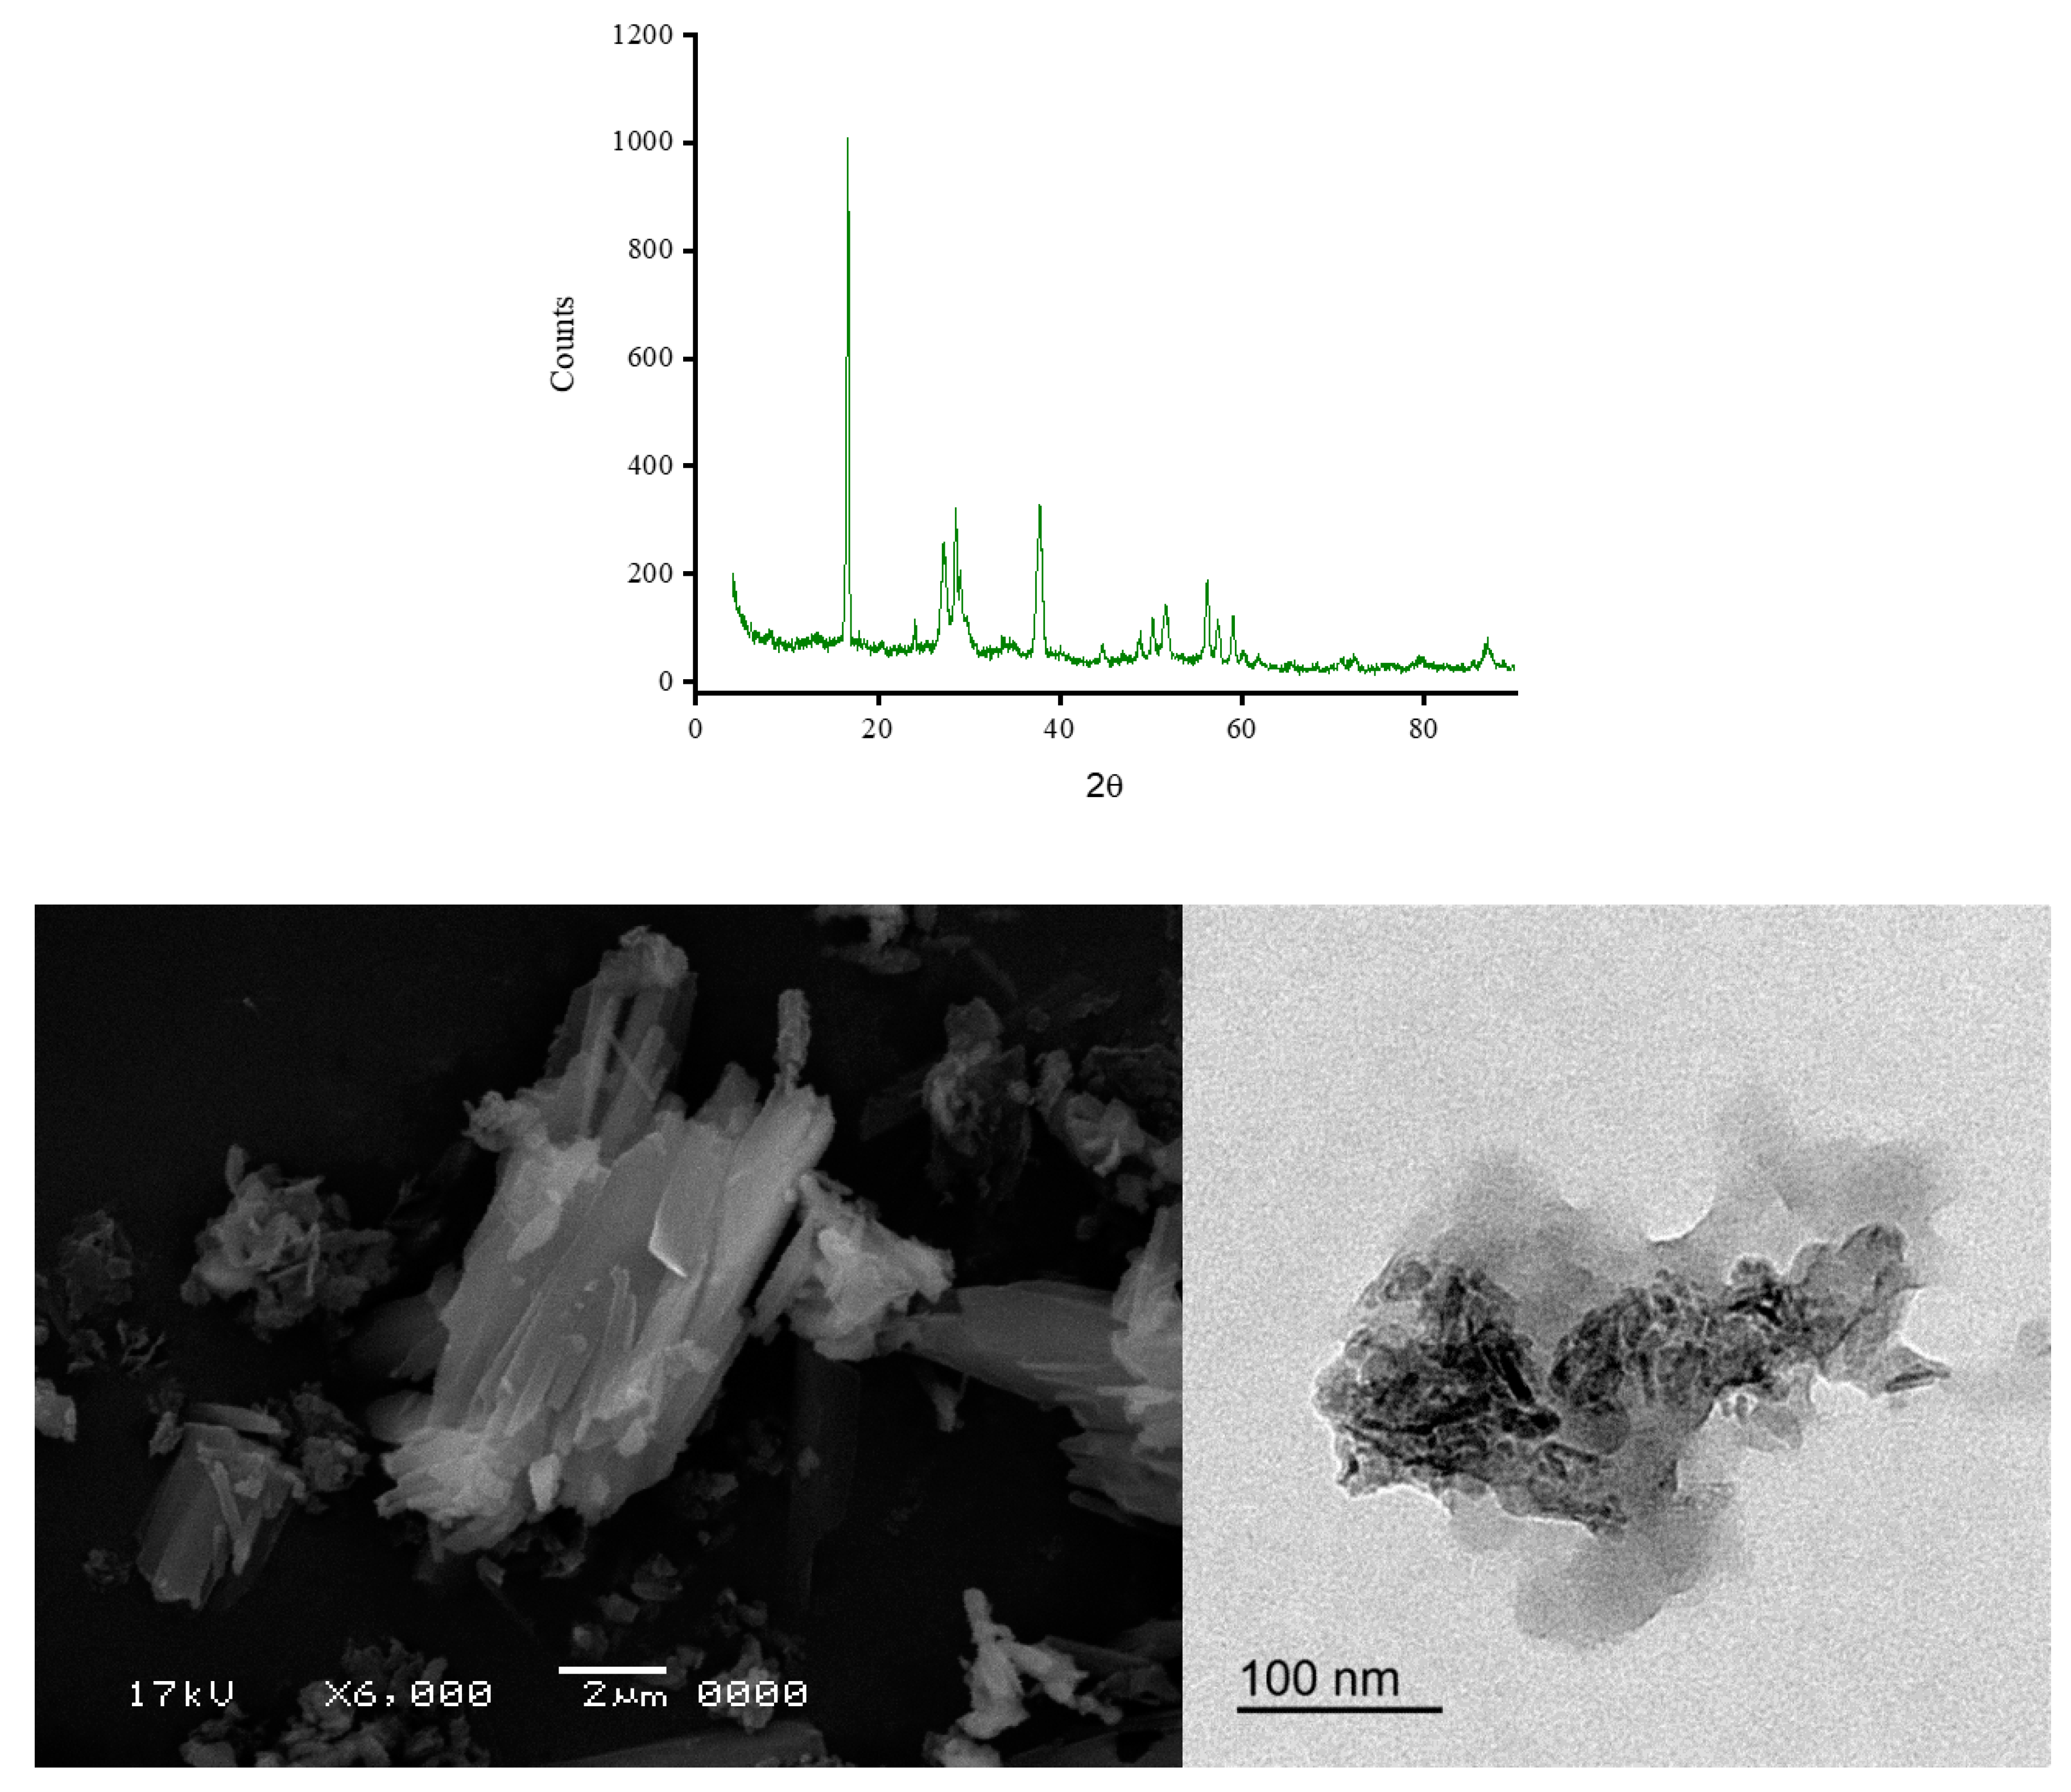
Figure 9.
Diagram of the zone-of-inhibition diameter results for the CA complexes and the positive controls toward microbes.
Figure 9.
Diagram of the zone-of-inhibition diameter results for the CA complexes and the positive controls toward microbes.
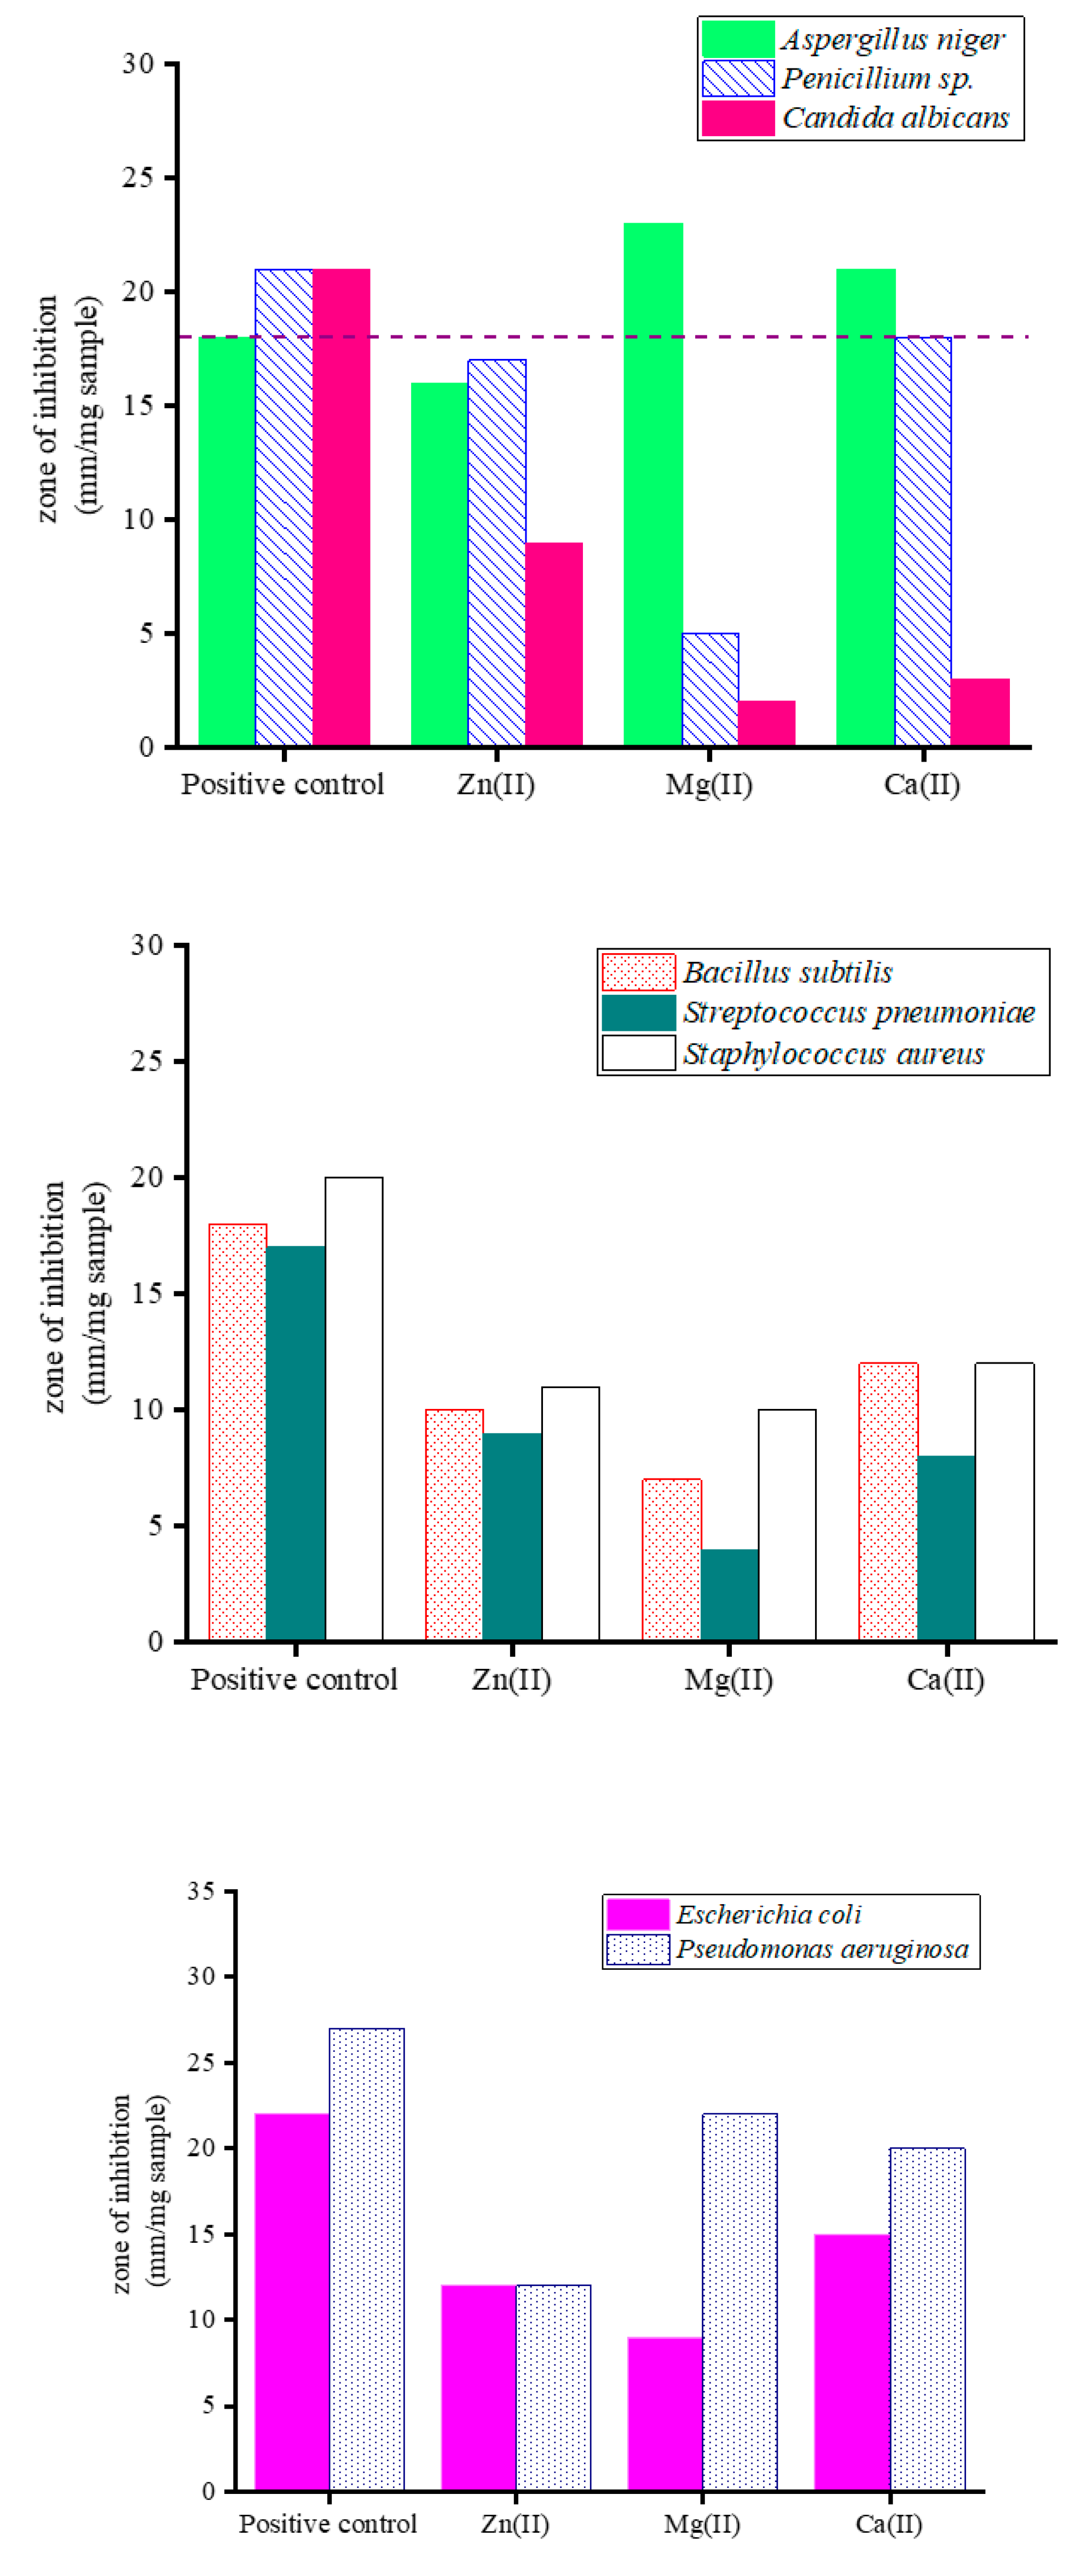

Table 1.
Screening results (mm/mg sample) for antimicrobial assays for the positive controls and the synthesized CA complexes.
Table 1.
Screening results (mm/mg sample) for antimicrobial assays for the positive controls and the synthesized CA complexes.
| Microbe | Positive controls | Complexes | |||
| Ketoconazole | Streptomycin | Zn(II) | Mg(II) | Ca(II) | |
| Fungi species: | |||||
| Aspergillus niger | 18.0 | - | 16.0 | 23.0 | 21.0 |
| Penicillium sp. | 21.0 | - | 17.0 | 5.0 | 18.0 |
| Candida albicans | 21.0 | - | 9.0 | 2.0 | 3.0 |
| Gram-positive species: | |||||
| Bacillus subtilis | - | 18.0 | 10.0 | 7.0 | 12.0 |
| Streptococcus pneumoniae | - | 17.0 | 9.0 | 4.0 | 8.0 |
| Staphylococcus aureus | - | 20.0 | 11.0 | 10.0 | 12.0 |
| Gram-negative species: | |||||
| Escherichia coli | - | 22.0 | 12.0 | 9.0 | 15.0 |
| Pseudomonas aeruginosa | - | 27.0 | 12.0 | 22.0 | 20.0 |
Disclaimer/Publisher’s Note: The statements, opinions and data contained in all publications are solely those of the individual author(s) and contributor(s) and not of MDPI and/or the editor(s). MDPI and/or the editor(s) disclaim responsibility for any injury to people or property resulting from any ideas, methods, instructions or products referred to in the content. |
© 2023 by the authors. Licensee MDPI, Basel, Switzerland. This article is an open access article distributed under the terms and conditions of the Creative Commons Attribution (CC BY) license (http://creativecommons.org/licenses/by/4.0/).
Copyright: This open access article is published under a Creative Commons CC BY 4.0 license, which permit the free download, distribution, and reuse, provided that the author and preprint are cited in any reuse.


