
Submitted:
08 June 2023
Posted:
08 June 2023
You are already at the latest version
Abstract
The dynamics of the main photosynthetic structures is studied by mathematical modeling methods in this article. Chlorophyll portion variability in phytoplankton and the formation of energy-intensive substances in the process of photosynthesis underlie the models. These cellular components are considered in terms of their participation in the growth of specific biomass. Computational experiments are presented that simulate various degrees of environmental friendliness. The corresponding functions are built in accordance with seasonal fluctuations throughout the year in the Far East region of Russia. The stability of model solutions in long-term dynamics is also investigated. The models were tested for biological adequacy and their effectiveness was compared. For the model selected as a result of the comparison, the optimal control problem has been formulated and solved. It is shown that in this way it is possible to reduce the space of the initial components of the model system.
Keywords:
Mathematical model
; differential equations
; phytoplankton
; photosynthesis
; chlorophyll
; optimal control problem
MSC: 34D20; 37N25; 92-10
1. Introduction
Phytoplankton is a key link in the global carbon cycle. The study of the mechanisms of primary production formation is paramount. Primary production is the result of the interaction of carbon dioxide and minerals when exposed to solar energy. Methods to calculate primary production using the assimilation number are known [1,2,3] This scheme is simplified because it does not take into account the variability of photosynthetic substances in phytoplankton cells. Chlorophyll and other plant cell photosynthetic substances play an important role in the primary production processes [4,5,6]. In what follows, we will refer to chlorophyll «a» as the main photosynthetic substance in cells. It actively absorbs solar energy. The absorbed photons are used to start the flow of electrons across the thylakoid membrane. The energy thus converted is used in the chemical reaction for the synthesis of organic [7,8]. Chlorophyll grows together with biomass by metabolism. The ratio of chlorophyll to phytoplankton is usually called the chlorophyll quota [8]. It is measurable but quite variable [9,10]. According to experts, the proportion can vary from 0.001 to 0.097 [11]. The ratio of chlorophyll to biomass varies depending on the state of cells and environmental conditions [12,13,14,15]. Such variations significantly affect the productivity of phytoplankton.
A substance of ATP (adenosine triphosphate) is a universal energy source for all organic biochemical processes. There is a traditional way to assess the functional indicators of primary production through the concentration of chlorophyll per unit of biomass [16]. An alternative method based on the amount of ATP is considered in a number of works [17,18,19,20]. Such works became relevant again after the methods for measuring ATP levels in cells were invented and improved [21]. In the study [19] a statistical modeling method for estimating the rate of biomass growth is presented. The method is built both on the basis of measurements of the proportion of chlorophyll per unit of biomass (chlorophyll quota), and on the basis of the estimated proportion of ATP.
We developed mathematical models that are based on the chlorophyll quota and on the concentration of energy-intensive substances. Just like many researchers [22,23,24,25,26], we based our constructions on the Droop model [27,28]. Traditionally, the functioning of phytoplankton in the aquatic environment is described by the Monod dependence [29,30]. In same times, microorganism growth continues for some time after the nutrient resources are depleted. This phenomenon is important for photosynthesis process. A detailed analysis of these mechanisms is discussed in [23]. Monod's kinetics are unable to imitate this phenomenon. Droop's concept makes it possible to separate the nutrient uptake rate from the growth rate. Many authors use it for a detailed description of nutrientically limited reproduction of phytoplankton [31,32,33]. Our models describe an important impact of energy-intensive substance concentration and chlorophyll quote on biomass dynamics.
2. Droop’s model
The Droop model for describing the growth of phytoplankton in a chemostat [34] is chosen as the base one. This model is the system of differential equations. For an open system, it has the form:
The model has next denotations:
- s is the concentration of the nutrient substance;
- p is the phytoplankton biomass in volume unity;
- ν is the pace of nutrient assimilation;
- q is the cell quota;
- μ is the rate of biomass growth;
- D is the rate of water flow;
- sin is the concentration of the nutrient substance in the inner flow.
Cell quota is the concentration of a mineral substance in a phytoplankton cell.
The pace of nutrient assimilation is described as a function
The rate of biomass growth is described as a function
A function μ(q) describes the velocity of phytoplankton growth, and is the maximum of this velocity. Parameter and are the minimum and maximum of cell quota q respectively. At biomass growth stops. This form for the function μ(q) is the traditional form for the Droop model [35]. We propose that the next conditions are true: all constant parameters have positive values, and .
The properties of Droop model were studied very well [28,31,33]. The equilibria are found in the system of equations:
The single trivial equilibrium exists always. The single positive equilibrium exist at next conditions:
The Droop model has an attractor. A common content of the nutrients will be denoted as . From model (2.1) follows a property . The proof follows from equation as a corollary of the system (2.1). We denote this attractor as set
Two possibility equilibria are contained in the set A.
3. Droop’s model modification with chlorophyll quota (Model C)
Next our models are extensivity of Droop model. O. Bernard proposed a modification of the Droop model [23]. The effect of lighting on phytoplankton growth is described using a restricted function: .
The function is discussion. In [8] a transition was made from the rate of biomass growth to the rate of carbon uptake per unit of chlorophyll. Thus, the dynamic process is transferred from the mass balance to the category of photosynthetic transformations. At this stage, the authors introduce the concept of chlorophyll quota as the ratio of the total concentration of chlorophyll in the system to the number of cells containing chlorophyll. Many researchers have a mean that the chlorophyll quota is somewhat dependent on the cell quota [36]. Our modification of the Droop’s model uses this proposition.
The Model C modification has three equations (2.1) from the Droop model, to which the chlorophyll quota dynamics relation is added:
Chlorophyll quota . The normalized chlorophyll quota seeks to normalized cell quota. Chlorophyll consumption by photosynthesis process [37] is taken into account too.
The system of equations (2.1)+(3.1) is Model C.
The formula (2.2) is true here. The growth rate of phytoplankton biomass has the form instead (2.3):
The parameters , are associated with the rate of biomass growth during the light and dark stages of photosynthesis, respectively.
In addition to the mineral nutrition constantly entering the system, PAR and water temperature are among the influencing factors. The growth rate depends on PAR as function and from water temperature as function .
The influence of cell quota to chlorophyll quota is regulated of the function
3.1. Existence and stability of equilibrium at the Model C for constant environmental
We propose that the parameters of the environment are constants in this subsection. We lose these parameters from function in this subsection.
We have for define of possible equilibrium a next system:
Theorem 3.1. The single trivial equilibrium exists always. The single positive equilibrium exists under inequations:
The values is defined unambiguously in system of equations:
Proof.
1) Trivial equilibrium. The linear function is defined at the equation (3.4d) of system (3.4). The unique value is defined from equation (3.4c) of system (3.4) for . The left part of this equation has properties of strongly decreases about q and different signs in interval .
2) The positive equilibrium is defined at equations system (3.4) for . The linear function is defined at the equation (3.4d) of system (3.4). It is increasing function. The unique is defined at the equation (3.4a) if left part of this equation has nonnegative value for
The components must do an inequation
We have then a unique from equation (3.4c). The component is calculated in the equation (3.4b). To end we have equilibrium . □
Two possibility equilibria belong to set A (2.4). There are the one trivial equilibrium and no more than one positive equilibrium for positive constant parameters in the Model C. It is possible to study the stability of these solutions in the range of changes in key parameters using a linearized system by the Lyapunov method [38,39]. The illustration of these dynamical properties is on Figure 1 in projection on plane .
The area of instability of trivial equilibrium and asymptotical stability positive equilibrium has blue color. The «green» area of parameter variation corresponds to the existence of both equilibria. Of these, the trivial equilibrium is stable, and the positive one is unstable. A stable trivial equilibrium exists in «red» set.
Depending on the area in which the model parameters fall, the phase portrait of the main components of the model system changes. The phase portraits of the system (2.1)+(3.1) show on Figure 2 for the points indicated by numbers 1 - 3 on Figure 1.
The solution of the Model C is calculated from different points of the area of the initial approximation. The system parameters are set based on hitting each of the designated stability areas. The parameter is constant for all solutions. The parameter of minimal сell quota is variable. In all cases, the solution asymptotically tends to the attractor (Section 2). For the "blue" region, solutions from different initial states tend to a positive equilibrium. The "attraction" of the equilibrium point has a global impact on the dynamics of the solution. In the "green" region, solutions from different initial states tend to different points belonging to the attractor, and then "wander" around the attractor. And in the "red" region, the "attraction" of the trivial equilibrium is global in nature. Thus, the minimal сell quota has a big role for quality characteristics of solutions.
4. Model with separation of light and dark stages of photosynthesis (Model E)
A light stage of photosynthesis includes an accumulation of energy-intensive compounds. These substances are then involved in the synthesis of organic matter at the dark stage of photosynthesis. The model has the three equations of Droop model (2.1) and the next equations:
The parameter has a sense of growth pool. This is an amount of the energy-intensive substances (ATP) in biomass. The parameter denotes a value of the energy pool below which the fusion reaction does not occur. We have the coefficient of growth biomass in the form:
The function describes an influence of to biomass growth similar to the influence of the cell quota.
The system of equations (2.1)+(4.1) is Model E.
4.1. Existence and stability of equilibrium at the Model E for constant environmental
We propose that the parameters of the environment are constants in this subsection like in subsection 3.1.
To define of possible equilibrium we have the next system:
Theorem 4.1. The Model E has no more than one trivial equilibrium. This model has no more than one positive equilibrium.
Proof.
1) Parameters of the trivial equilibrium is defined from equations (4.3c), (4.3d), (4.3e) of system (4.3)
The strong decrease function is denoted at equation (4.4a) of this system. Further there is a strong decrease function at equation (4.4c) with help of function .These functions are put in equation (4.4b).
The function on the left side is strictly decreasing. This equation has no more than one solution . A no more than one is defined from this fact.
2) The positive equilibrium is defined at equations system
This system is received from the system (4.3). The scheme of equilibrium definition is next. The strong increase function is denoted at equation (4.5c) of this system. Further the strong decrease functions , , are denoted at the equations (4.5a), (4.5b), (4.5e). These functions are put to equation (4.5d). The function in left part is a strong increase function in the variable s. Therefore, the equation (4.5d) has no more than one solution. And at most one positive equilibrium is defined. □
Two possibility equilibria belong to set A (2.4). One of them is trivial equilibrium and other one positive equilibrium .
In addition to the minimum cell quota, numerical experiments have shown a significant effect on the stability of the solutions of the parameter β. The domains of existence and stability of both solutions are in the plane of the ratios of these parameters (Figure 3).
Solutions are defined of a trivial or of a positive equilibrium. The tendency to attraction by some equilibrium is the more obvious, the farther the matching parameters point is located from the region of instability. The phase portraits of the main components of the Model E illustrate different behaviors of the solution trajectories depending on the area from which the model parameters are selected (Figure 4).
The dynamics of the solutions in Model C and Model E have similar properties. The Droop’s submodel makes some general basis in these models. A zone of instability is smaller for Model E. It represents a very narrow boundary region in which the Jacobian eigenvalues vanish. The complex dynamics can be in this “green” set on plane parameters. The attractor largely affects the dynamics of solutions. These properties connect with existence and stability of the equilibrium solutions. In general, the solutions dynamics are subject to attraction by the attractor of the Droop's submodel.
Let us illustrate the behavior of the solution of both models with consistent coefficients near the attractor.
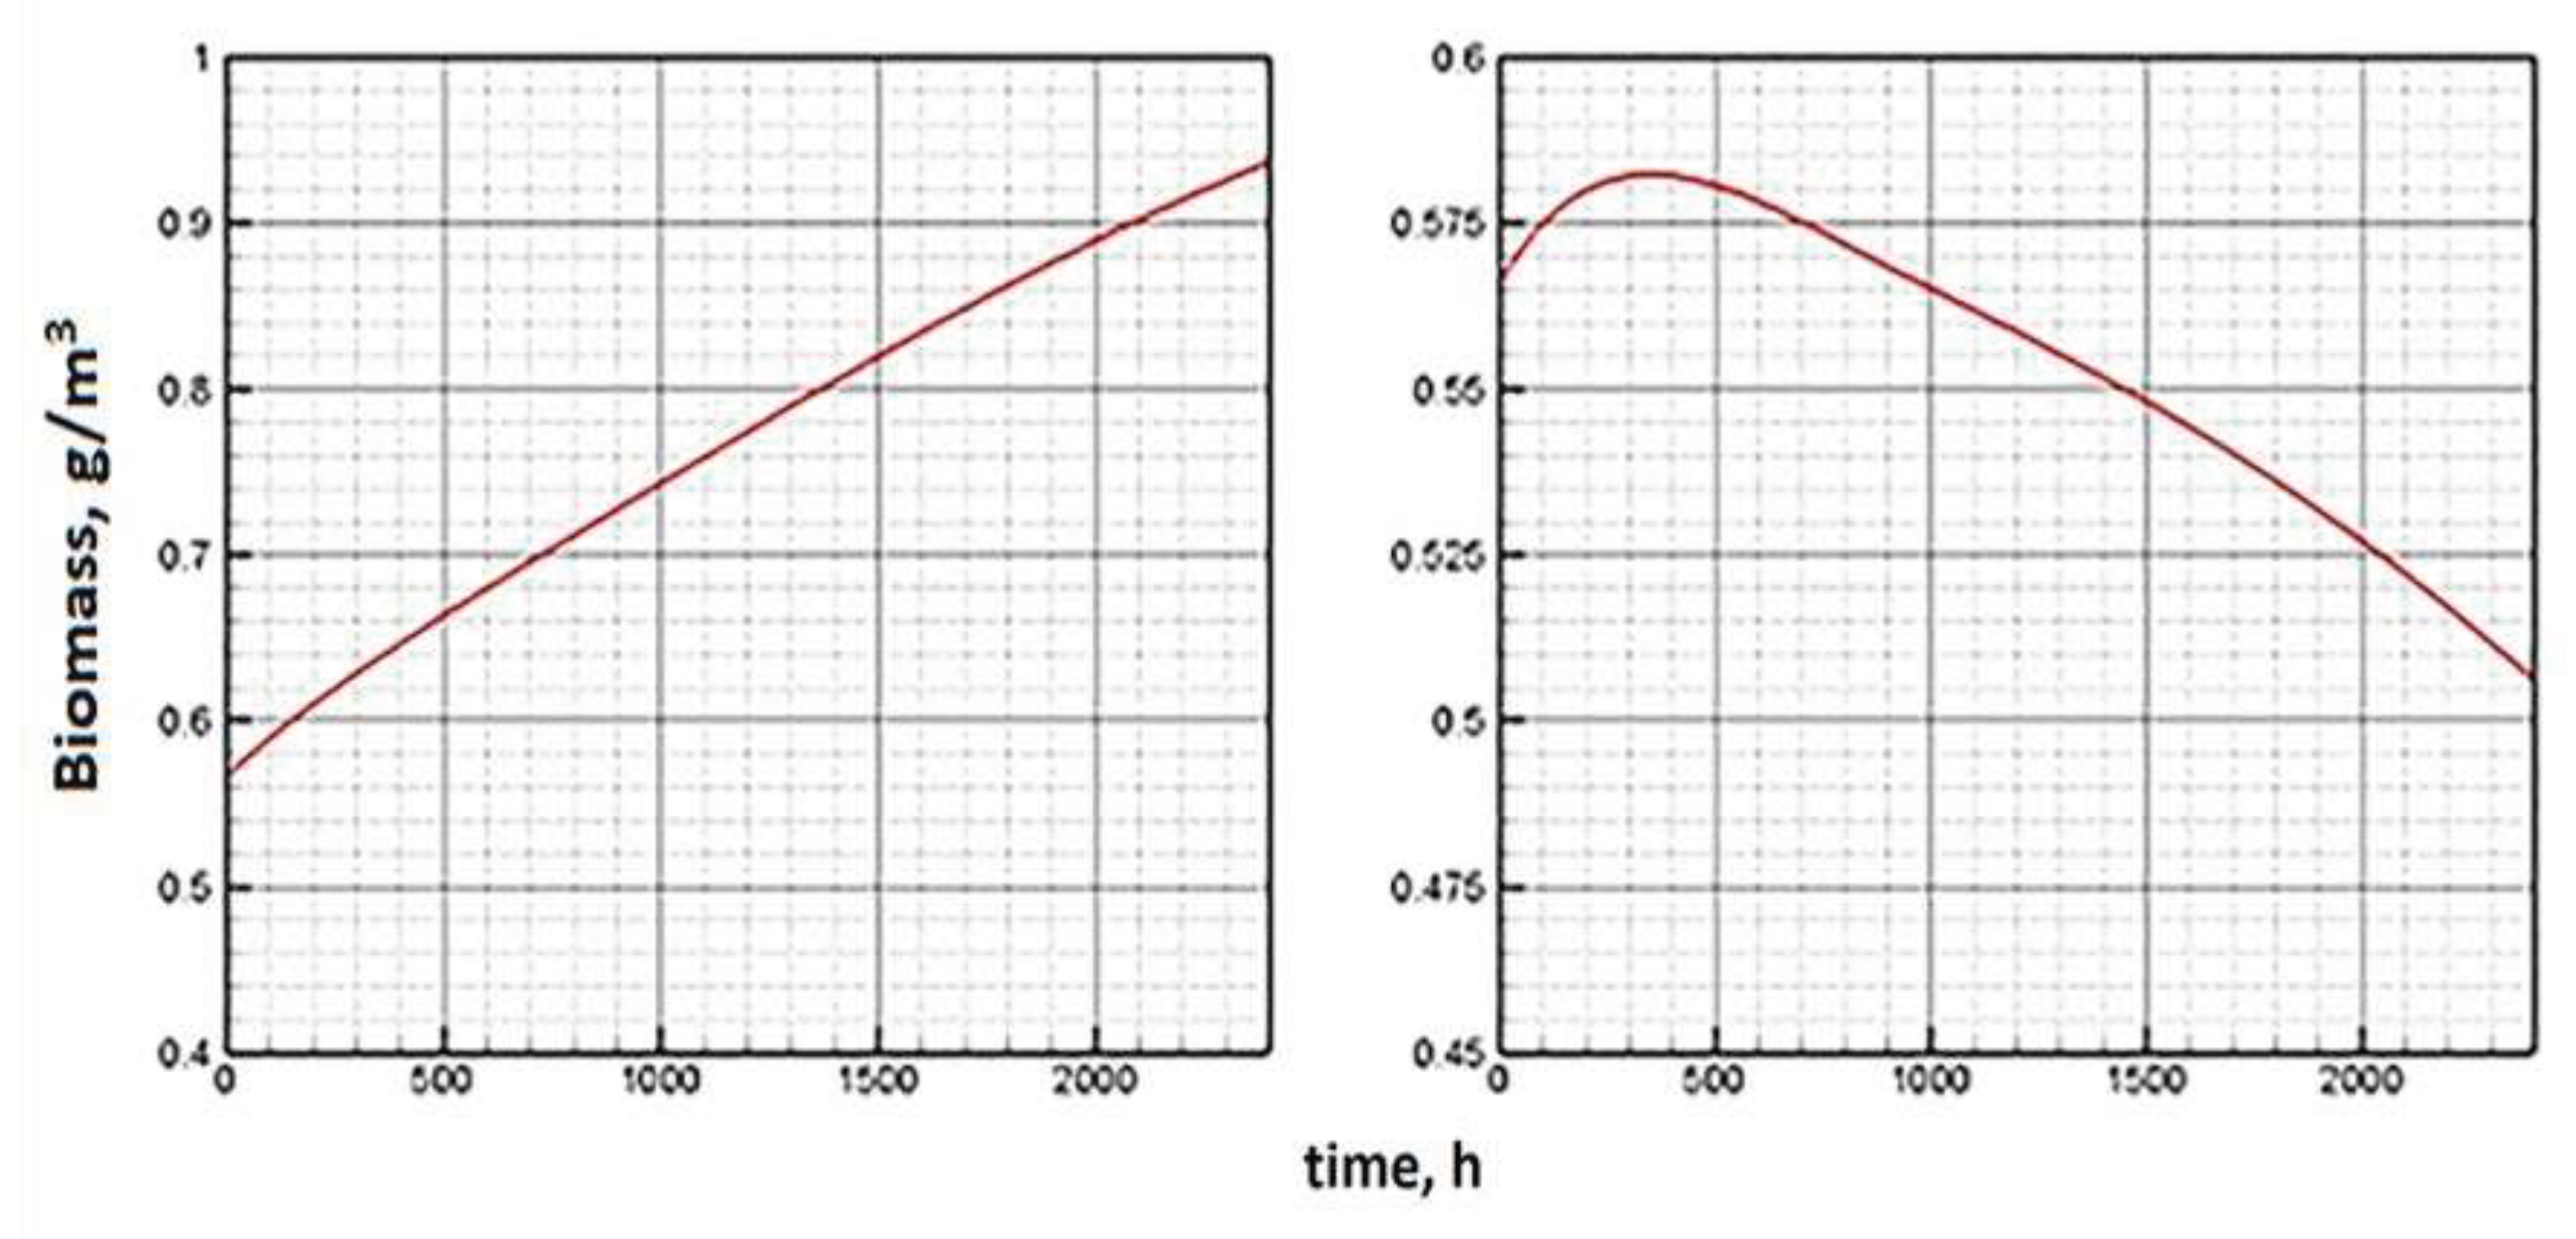
The Figure 5 shows the dynamics of biomass along the attractor under constant external conditions calculated using the Model C (left) and the Model E (right). As can be seen, according to Model C, the quasi-stationary state of biomass is reached almost four times longer. The dynamics of other indicators on the attractor is shown in Figure 6.
Figure 6 show that Model E makes it possible to reach the equilibrium state of the system in a shorter period. Obviously, the reason is in the structure of the equations of the Model E. The chlorophyll quota directly affects the growth of biomass. The Model E configuration allows cellular structures to quickly "adjust" to the biomass changes that occurred in the previous time step. Sequential (one after another) changes in the main components of the system allow you to approach equilibrium faster.
5. Model E: the optimal solution on the attractor
Studying the behavior of solutions on the attractor A (2.4) gives a more complete picture of the properties of the Model E. Let us consider the trajectories under the additional condition of optimality according to the criterion of the largest increase in phytoplankton biomass p for a fixed time.
First, we transform the Droop model for solutions on the attractor A.
Lemma 5.1.The Droop model on the attractor A is transformed to the form:
where
If the initial condition for solving the system of equations (5.1) is positive and admissible, then the solution satisfies the condition for any t.
Proof. According to the definition of the attractor A (2.4), the formula is valid. From here we substitute s into in the equation (2.1c) of the Droop model (2.1). Then the equation (2.1b) can be excluded from this system. Equations (5.1) are obtained.
Due to the validity of formula (5.2), the solution of system (5.1) at any time t satisfies the condition and for . This implies the second part of the Lemma assertion. □
5.1. Formulation of the optimal control problem
Assume the dynamics of phytoplankton biomass is modeled on the interval . We will proceed from the condition of phytoplankton biomass maximization at the final time . This is equivalent to the condition . Let us take into account equations (4.1) for c, r in the form of the comparative smallness of in the equation (4.1e). Then we get the following optimization criterion:
where ω is a relatively small positive number.
The relevant restrictions are the equations (5.1) under given initial conditions for p and q.
5.2. Solution of the optimal control problem
Compose the Lagrange function:
Then the Euler-Lagrange equation is:
under conditions
The functions c, r are determined from the condition of minimizing L with respect to these variables.
5.3. The optimal control problem modification
The minimizing c is calculated from the equation for and . Denote by the value r at which the last inequality becomes an equality.
The minimum condition for L with respect to r turns into a condition for minimizing with respect to r the expression:
It boils down to minimizing over r the expression:
Denote . Then the following condition is satisfied:
Then the equations for are simplified:
Finally, problem (5.1)+(5.3) acquires the following form.
Theorem 5.1. To solve problem (5.1)+(5.3) it is necessary to solve the following boundary value problem
for a given function with .
.
.
The boundary conditions are:

The functions included in the equations correspond to the Model Е (formula (4.2)) with a change in (5.2).
Proof. The proof is given before the statement of the theorem.
Test calculations for problem (5.4) were carried out under the following conditions: the left boundary conditions were chosen so that the initial point lay on the attractor. The right boundary conditions for are set equal to zero. The values of other parameters are presented in Table. 1 (Section 6). The calculations were made under constant external conditions. The ϕ, ψ values are constant and correspond to the average daily values of light irradiance and temperature. Experimental examples showed that in this case the solution to the boundary value problem can be found using standard numerical procedures. Some initial values may require some regularization.
More details about the selected values of environmental indicators and their changes during the daily and annual cycle are described in Section 6, devoted to numerical experiments.
6. Calculation experiments
The comparative analysis of solutions’ properties of Models C, E is a basic content of computer experiments. A data of research is defined in Table 1 from references [43,44,45].
In calculations, qualitative properties of dynamics of the main model variables are analyzed depending on significant parameters. These are α, β and Q0. All parameters are involved in the function of specific biomass growth rate. The parameter is "responsible" for the influence of illumination in the first model, and the parameter characterizes the influence of ATP in the second model. Preliminary numerical experiments showed the greatest significance of the parameters α и β (apart from Q0) for the dynamics of the described processes.
6.1. Dynamics in a variable environment. Influence of Light and Darkness
The behavior of models on an attractor under constant external conditions is considered (Section 4). It is interesting to know how sensitive they are to changes in external conditions. We simulated the conditions similar to a laboratory experiment [20]. At some initial concentrations, the dynamics of the system was calculated sequentially over a time interval corresponding to a day and for 100 days. The illumination function was modeled as follows: for 12 hours the light level was constant (60 Ein⋅m-3day-1). This was followed by a twelve-hour period of complete darkness. In this case, the temperature of the medium was assumed to be constant (7° C).
The numerical experiment demonstrates the behavior of the model components corresponding to the description of the results of a laboratory experiment under similar conditions. The daily cycle is divided into equal periods of presence/absence of light. During the light period (Figure 7, left), a decrease in the proportion of chlorophyll is observed. This is in complete agreement with the observations described in [20]. In the biological sense, such process is associated with an increase in biomass and the dispersion of the proportion of chlorophyll in it. The model behavior of the chlorophyll quota is due to the fact that it tends to correspond to the intracellular quota of nutrients. The cellular pool of nutrients is consumed during the progressive growth of biomass. The value of the chlorophyll quota decreases following the cell quota to its minimum value, below which the biomass growth stops. Next, the consumption of chlorophyll for the formation of ATP stops. In a 100-day period, after a certain surge, there is a weak trend towards a decrease in the chlorophyll quota in combination with daily fluctuations (Figure 7, right).
The proportion of ATP changes in antiphase with respect to the chlorophyll quota. This is also in line with the findings presented in [20]. Biologically, this means that during the light period, the energy to start the enzymatic reaction comes from the capture of photons by the reaction centers of the chlorophyll molecules. Energy-intensive substances, therefore, acquire the ability to accumulate. During the dark period, energy for chemical transformations can only be obtained by releasing it as a result of the breakdown of ATP. Accordingly, their pool is reduced (Figure 8, left).
In the long-term light/dark alternation, the ATP pool tends to decrease (Figure 8, right). With a long-term progressive increase in biomass (Figure 10, left), the trend towards a decrease in both indicators seems to be adequate (Figure 7, 8, right).
Other numerical experiments have shown that phytoplankton acquires a tendency to extinction with a significant deterioration in external conditions, namely, a change in temperature relative to the optimum, a reduction in the period of illumination and a decrease in the level of illumination. The dynamics of plankton with a threefold reduction in the above indicators is shown in Figure 10 (right).
At the same time, the chlorophyll quota and the proportion of ATP reveal an interesting trend (Figure 9). At first, the indicators go in the anti-phase. Under sufficient initial concentrations of phytoplankton and nutrients, at the first stage, an increase in biomass is observed. This is followed by an increase in the chlorophyll quota. A rapid consumption of ATP is due to the low level of light energy coming from outside. Then the trend changes. Both indicators show weak growth. But a slight accumulation of ATP and chlorophyll do not cope with the lack of energy and unfavorable temperature. Phytoplankton biomass is decreasing (Figure 10, right).
Figure 9.
Dynamics of the chlorophyll quota and ATP under periodic lighting changes (one day on the left, 100 days on the right). Daily period of light is 4 hours.
Figure 9.
Dynamics of the chlorophyll quota and ATP under periodic lighting changes (one day on the left, 100 days on the right). Daily period of light is 4 hours.
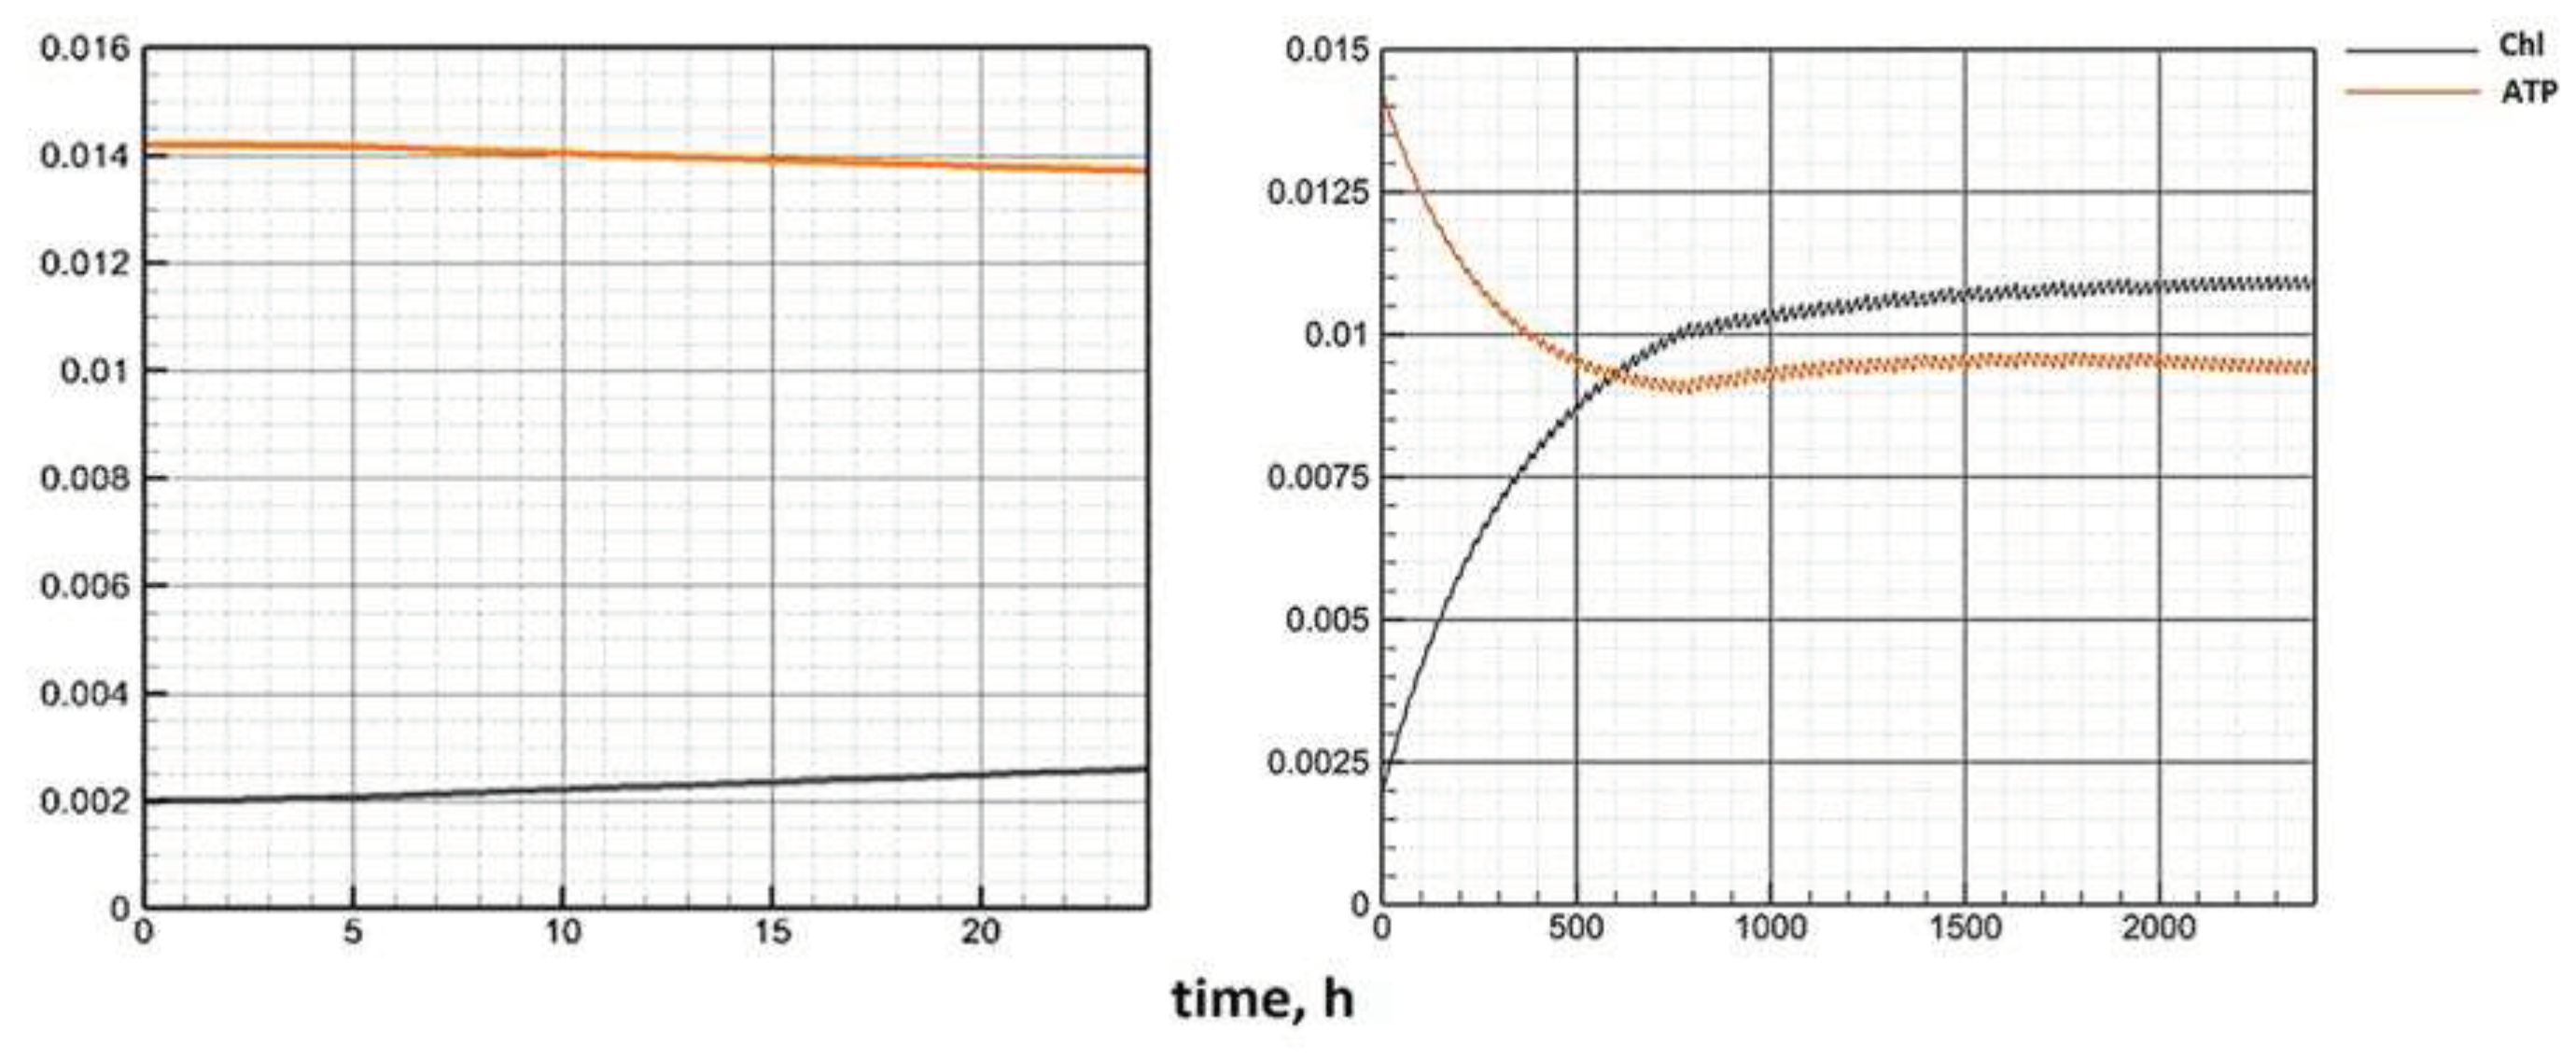
Figure 10.
Dynamics of biomass (g/m3) under periodic lighting changes during 100 days (daily period of light 12 hours on the left, daily period of light 4 hours on the right).
Figure 10.
Dynamics of biomass (g/m3) under periodic lighting changes during 100 days (daily period of light 12 hours on the left, daily period of light 4 hours on the right).
6.2. Annual cycle
6.2.1. Solution of the initial problem on the annual period
Under changing environmental conditions, the model systems of equations cease to be autonomous. The annual dynamics calculated for both models undergo two characteristic bursts, spring and autumn.
The annual cycle in Figure 11 shows the dynamics of phytoplankton biomass, typical for the Far Eastern Seas of Russia. The simulation of the annual cycle is provided by seasonal changes in ambient temperature and illumination. The daily change in illumination is considered.
It is generally accepted that the spring rise in biomass is higher than the autumn one [46,47]. In the Far East region, the temperature regime has some peculiarities. In the Far Eastern seas, cold-loving species (mainly diatoms) [48] predominate, and a certain proportion is occupied by more thermophilic (dinophyte) species [49]. The most favorable temperature for the entire plant complex forms in late summer-early autumn up to its middle. The spring increase in biomass is associated with the consumption of nutrients stored during the winter. The numerical experiment simulates the natural conditions of the region. The external illumination function is a parabolic curve with a maximum in mid-July. Temperature is a similar smooth function with a maximum in the second half of August and relatively constant values throughout the year except for summer. In accordance with the winter accumulation of mineral nutrition, their initial concentrations are high compared to average observed concentrations.
The temperature and light functions are based on real data provided by the Center for Multifunctional Satellite Environmental Monitoring, by the Institute of Automation and Control Processes, the Far Eastern Branch, Russian Academy of Sciences (IACP FEB RAS), Vladivostok [50]. Based on remote sensing data, initial approximations for the numerical solution of model systems are formed. The species composition of phytoplankton in the Far Eastern seas was formed under the influence of regional natural conditions and is tolerant to low temperatures. Biomass growth is quite intensive throughout the year. This is the reason for the intensive consumption of nutrients. Both models support this. The concentration of nutrients throughout the entire vegetative cycle approaches its value in the input flow (Figure 11, Part 1).
The value of the cell quota fluctuates between the minimum and maximum values, and these fluctuations occur in antiphase to the volume of biomass, especially during periods of its rise. With intensive growth of phytoplankton, the intracellular pool of nutrients is dispersed over an increasing number of cells. Therefore, the value of the cell quota decreases. Daily fluctuations in the chlorophyll quota (Figure 11, Part 2) become more pronounced. As already mentioned [51], this is consistent with experimental observations.
The dynamics of the share of ATP in phytoplankton repeats the annual dynamics of the chlorophyll quota with some time lag. Fluctuations around daily averages are much less noticeable in comparison with the variability of the chlorophyll quota. This is also confirmed by the conclusions contained in [20].
6.2.2. Solution of the problem of optimal control in the annual period.
Annual fluctuations in biomass can also be considered as a solution to the optimal control problem (see Section 5). By modeling the external conditions in the manner described above, it is possible to obtain the biomass dynamics presented in Figure 12.
The obtained solution of the boundary value problem (5.4) quite closely repeats the solution of the initial Cauchy problem for models C and E with a characteristic spring and autumn burst of biomass. Moreover, the maximum values of seasonal concentrations are either comparable in absolute values (spring outbreak) or equal (autumn outbreak).
Thus, under the condition that the initial-boundary conditions belong to the attractor of system (4.3), the numerical solution of the optimal control problem (5.4) can be used to predict phytoplankton dynamics. In this case, the dimension of the space of the system components decreases. At the same time, one should not ignore the fact that the numerical solution of boundary value problems is associated with problems of convergence of computational procedures. This requires additional regularization algorithms, which cannot always be effectively applied.
6.3. Climate fluctuations
The illumination and temperature functions correspond to the climatic features of the Far Eastern seas. In this case, both models demonstrate adequate behavior of the phytoplankton biomass. The solution of Model E is characterized by smoother dynamics compared to Model C. This is due to the structure of the model equations in Model E. The coefficient ρ at the chlorophyll quota ceases to be constant and becomes a function depending on external parameters. Thus, a large proportion of the dispersion due to high gradients of the illumination function is accounted for by chlorophyll. It is partially repaid due to the balance correlation with the share of ATP. This provides more smoothness for the biomass growth function. Thus, Model E seems to be more preferable for understanding the trend of biomass changes. When modeling anomalous scenarios, the emerging complex dynamics of phytoplankton is explained by changes in external parameters, and not by the properties of the model itself. On the basis of Model E, a number of calculations were undertaken to simulate climatic fluctuations during a given season. Figure 13 shows the results of changes in phytoplankton dynamics, corresponding to a 2° C cooling in winter (left) and a 2° C warming in summer. The general conclusion is that the deviation of average temperatures from the optimum within the tolerance interval has a negative effect on the growth rate. But, in general, such temperature fluctuations do not have a significant effect on the average values of biomass during the year. Thus, Model E adequately reflects the regulatory role of the temperature factor in the phytoplankton growth process [52]. This fact is a qualitative conclusion of most experimental observations [53,54,55].
More sensitive Model E is in relation to the parameter β. Even with a slight increase in its value (above 10-3), that is, with an increase in the amount of ATP consumed for the synthesis of organic matter, the specific biomass increases markedly (Figure 14). At the same time, the temperature still has an insignificant effect on the annual dynamics.
6.4. Long-term dynamics
Figure 15 shows changes in biomass dynamics over many years. Scenarios corresponding to different values of β in the presence/absence of climate change are considered.
The results of model calculations are as follows: if the value β is small and the replenishment of the nutrient resource is limited, then there is a gradual extinction of the phytoplankton biomass. Numerical experiments have shown that the smaller the value of the parameter β, the higher the negative gradient of the growth function. With a slight increase in the proportion of ATP that stimulates the synthesis reaction, the downtrend gradually breaks and turns into an exponential one. With a larger increase in β, the dynamics becomes stable, including a short-term surge, and then a transition to a quasi-stationary regime. In this case, the step in β affects the maximum biomass value at the burst stage and the average quasi-stationary value, but does not affect the dynamic contour itself (Figure 15). Among the endogenous parameters of the model, the value of the minimum cell quota Q0 has a comparable impact. The influence of this parameter does not need to be considered separately, since it has a clear biological meaning. The larger the minimum cellular quota of nutrients required to start growth, the slower it is and vice versa. The cumulative effect of the parameters β and Q0 on the equilibrium values of the specific biomass is shown in the Figure 16.
7. Conclusions
The presented models are based on Droop's concept of the relation [28] between growth rate and intracellular nutrient quota. This model makes it possible to describe the growth of biomass after the cessation of the supply of mineral nutrition to the system.
In addition to the Droop model, both proposed models are based on the concept of chlorophyll quota [56,57]. Experimental studies [37] give grounds to suspect a relationship between the proportion of chlorophyll in phytoplankton and its cell quota. Simplified, it can be a linear relationship between indicators with a certain proportionality coefficient. The presented models allow to avoid simplification and describe the relationship between chlorophyll and cell quota, taking into account the mechanics of primary production processes. Furthermore, Model E describes the stage of accumulation of the internal energy reserve necessary to start the enzymatic reaction. One of the model systems includes the percentage of ATP in biomass. The form of Droop dependence was borrowed to describe the growth of biomass in the dark stage of photosynthesis (Model E), when illumination as a necessary resource dries up. Then the only source of energy needed to start the enzymatic reaction is the energy-intensive substances stored in the light stage of photosynthesis [58,59]. Modern research methods make it possible to measure this quantity directly [17,18]. As a result of the enzymatic reaction, organic substances are formed. They are the building blocks of the living cell [60,61].
The Model C has complex dynamics when the stabile equilibria don’t exist. These dynamics are submitted to the attractor of the Droop model (see Lemma 3.2).
The behavior of the chlorophyll quota and the proportion of ATP in the biomass, calculated according to Model E, is in full agreement with the results of laboratory experiments presented [20]. In the absence of light, phytoplankton cells use ATP as an energy source. Chlorophyll begins to be consumed only when a sufficient amount of energy is accumulated. The reaction of organic matter synthesis is slower. Therefore, chlorophyll is also consumed slowly. Consequently, its highest concentration in phytoplankton cells is recorded in absolute darkness [62] (Figure 7, left). The ATP concentration, on the contrary, drops to a minimum (Figure 8, left), since the consumption of energy-intensive substances increases in the dark due to the absence of other energy sources [63].
Modeling of the annual cycle shows adequate dynamics in both models (Figure 13). Seasonal habitat changes lead to spring and autumn bursts of biomass productivity. This agrees with known field observations [46,47]. Given the availability of data from remote observations and the results of laboratory experiments, the presented models can be used to assess the biological productivity of aquatic ecosystems.
Model E can be transformed by solving the optimal control problem. The application of optimal management methods is relevant if the plant community is considered as a certain population striving for the maximum possible increase in the total biomass. The described and investigated approach (Section 5) allows us to reduce the space of the original components of the model. This can greatly simplify the collection of experimental data in the practical use of models.
Author Contributions
Conceptualization, A.A. and S.P.; methodology, A.A. and S.P.; software, S.P.; formal analysis, A.A.; investigation, A.A. and S.P.; writing—original draft preparation, S.P.; writing—review and editing, A.A. and S.P. All authors have read and agreed to the published version of the manuscript.
Funding
This research received no external funding.
Data Availability Statement
Not applicable.
Acknowledgments
This investigation is supported by the Institute of Automation and Control Processes of Far Eastern Branch of the Russian Academy of Sciences (N 121021700006-0).
Conflicts of Interest
The authors declare no conflict of interest.
References
- Finenko, Z.Z.; Suslin, V.V.; Churilova, T.Y. The regional model to calculate the Black Sea primary production using satellite color scanner SeaWiFS. Mar. Ecol. J. 2009, 8, 81–106. [Google Scholar]
- Glover, H.E. Assimilation numbers in cultures of marine phytoplankton. J. of Plankton Res. 1980, 2, 69–79. [Google Scholar] [CrossRef]
- Nakanishi, M.; Narita, T.; Suzuki, N.; Mitamura, O. Assimilation number and primary productivity of phytoplankton in the south basin of Lake Biwa. Japanese J.of Limnology (Rikusuigaku Zasshi). 1988, 49, 175–183. [Google Scholar] [CrossRef]
- Rubin, A.B.; Krendeleva, T.E. Regulation of the primary photosynthesis processes. Biofizika. 2004, 49, 239–253. [Google Scholar]
- Govindjee, G.; Weger, H.G.; Turpin, D.H.; van Rensen, J.J.S.; de Vos, O.J.; Snel, J.F.H. Formate releases carbon dioxide/bicarbonate from thylakoid membranes – measurements by mass spectroscopy and infrared gas analyzer. Naturwissenschaften. 1991, 78, 168–170. [Google Scholar] [CrossRef]
- Falkowski, P.G. The Ocean invisible fores. Scientific American. 2002, 54, 54–61. [Google Scholar] [CrossRef]
- Farquhar, G.D.; von Caemmerer, S.; Berry, J.A. A biochemical model of photosynthetic CO2 assimilation in leaves of C3 species. Planta. 1980, 149, 78–90. [Google Scholar] [CrossRef]
- Nikolaou, A.; Hartmann, P.; Sciandra, A.; Chachuat, B.; Bernard, O. Dynamic coupling of photoacclimation and photoinhibition in a model of microalgae growth. J. Theoret. Biology. 2016, 390, 61–72. [Google Scholar] [CrossRef] [PubMed]
- Dubinsky, Z.; Stambler, N. Photoacclimation processes in phytoplankton: mechanisms, consequences, and applications. Aquatic Microb. Ecology 2009, 56, 163–176. [Google Scholar] [CrossRef]
- Falkowski, P.G.; Kolber, Z. Variations in chlorophyll fluorescence yields in phytoplankton in the world oceans. Functional Plant Biology. 1995, 22, 341–355. [Google Scholar] [CrossRef]
- Nicholls, K.H.; Dillon, P.J. An Evaluation of Phosphorus-Chlorophyll-Phytoplankton Relationships for Lakes. Internationale Revue der gesamten Hydrobiologie und Hydrographie. 1978, 63, 141–154. [Google Scholar] [CrossRef]
- Desortová, B. Relationship between chlorophyll-α concentration and phytoplankton biomass in several reservoirs in Czechoslovakia. Internationale Revue der gesamten Hydrobiologie und Hydrographie. 1981, 66, 153–169. [Google Scholar] [CrossRef]
- Sathyendranath, S.; Stuart, V.; Nair, A.; Oka, K.; Nakane, T.; Bouman, H.; Forget, M.-H.; Maass, H.; Platt, T. Carbon-to-chlorophyll ratio and growth rate of phytoplankton in the sea. Mar. Ecol. Prog. 2009, Ser. 383, 73–84. [Google Scholar] [CrossRef]
- Lyngsgaard, M.M.; Markager, S.; Richardson, K.; Møller, E.F.; Jakobsen, H.H. How well does chlorophyll explain the seasonal variation in phytoplankton activity? Estuaries and Coasts. 2017, 40, 1263–1275. [Google Scholar] [CrossRef]
- Eilers, P.H.C.; Peeters, J.C.H. A model for the relationship between light intensity and the rate of photosynthesis in phytoplankton. Ecol. Model 1988, 42, 199–215. [Google Scholar] [CrossRef]
- Platt, T.; Caverhill, C.; Sathyendranath, S. Basin-scale estimates of oceanic primary production by remote sensing: The North Atlantic. J. of Geophysical Res.: Oceans 1991, 96, 15147–15159. [Google Scholar] [CrossRef]
- Holm-Hansen, O.; Booth, C.R. The measurement of adenosine triphosphate in the ocean and its ecological significance. Limnology and Oceanography. 1966, 11, 510–519. [Google Scholar] [CrossRef]
- Sinclair, M.; Keighan, E.; Jones, J. ATP as a measure of living phytoplankton carbon in estuaries. J. of the Fisheries Board of Canada. 1979, 36, 180–186. [Google Scholar] [CrossRef]
- Bochdansky, A.B.; Stouffer, A.N.; Washington, N.N. Adenosine triphosphate (ATP) as a metric of microbial biomass in aquatic systems: new simplified protocols, laboratory validation, and a reflection on data from the literature. Limnology and Oceanography: Methods. 2021, 19, 115–131. [Google Scholar] [CrossRef]
- Hunter, B.L.; Laws, E.A. ATP and chlorophyll a as estimators of phytoplankton carbon biomass. Limnology and Oceanography. 1981, 26, 944–956. [Google Scholar] [CrossRef]
- Imamura, H.; Nhat, K.P.; Togawa, H.; Saito, K.; Iino, R.; Kato-Yamada, Y.; Nagai, T.; Noji, H. Visualization of ATP levels inside single living cells with fluorescence resonance energy transfer-based genetically encoded indicators. Proceedings of the National Academy of Sciences. 2009, 106, 15651–15656. [Google Scholar] [CrossRef] [PubMed]
- Jørgensen, S.E. A eutrophication model for a lake. J. Ecol. Model. 1976, 2, 147–165. [Google Scholar] [CrossRef]
- Bernard, O. Hurdles and challenges for modelling and control of microalgae for CO2 mitigation and biofuel production. J. of Process Control. 2011, 21, 1378–1389. [Google Scholar] [CrossRef]
- Mairet, F.; Bernard, O.; Lacour, T.; Sciandra, A. Modelling microalgae growth in nitrogen limited photobiorector for estimating biomass carbohydrate and neutral lipid productivities. J. IFAC Proceedings. 2011, 44, 10591–10596. [Google Scholar] [CrossRef]
- Litchman, E.; Klausmeier, C.A.; Miller, J.R.; Schofield, O.M.; Falkowski, P.G. Multi-nutrient, multi-group model of present and future oceanic phytoplankton communities. Biogeosciences. 2006, 3, 585–606. [Google Scholar] [CrossRef]
- Grover, J.P. Constant-and variable-yield models of population growth: Responses to environmental variability and implications for competition. J. Theoret. Biology. 1992, 158, 409–428. [Google Scholar] [CrossRef]
- Droop, M.R. Some thoughts on nutrient limitation in algae. J. Phyeol. 1973, 9, 264–272. [Google Scholar]
- Droop, M.R. The nutrient status of algal cells in continuous culture. J. Mar. Biol. Assoc. U. K. 1974, 54, 825–855. [Google Scholar] [CrossRef]
- Monod, J. The growth of bacterial cultures. Annual Review of Microbiology. 1949, 111, 371–394. [Google Scholar] [CrossRef]
- Jørgensen, S.E. Lake management; Pergamon Press: Oxford, 1980; 167p. [Google Scholar]
- Flynn, K. Use, abuse, misconceptions and insights from quota models—the Droop cell quota model 40 years on. In Oceanogr. Mar. Biol.: An Annual Review; Gibson, R., Atkinson, R., Gordon, J., Eds.; 2008; Volume 46, pp. 1–23. [Google Scholar]
- Lemesle, V.; Mailleret, L. A Mechanistic Investigation of the Algae Growth “Droop” Model. Acta Biotheor. 2008, 56, 87–102. [Google Scholar] [CrossRef]
- Cerucci, M.; Jaligama, G.; Ambrose, R. Comparison of the Monod and Droop Methods for Dynamic Water Quality Simulations. J. of Environmental Eng. 2010, 136, 1009–1019. [Google Scholar] [CrossRef]
- Smith, H.L. The periodically forced Droop model for phytoplankton growth in a chemostat. Journal of Mathematical Biology. 1997, 35, 545–556. [Google Scholar] [CrossRef]
- Droop, M.R. 25 years of algal growth kinetics a personal view. Botanica marina. 1983, 26, 99–112. [Google Scholar] [CrossRef]
- Tett, P.; Cottrell, J.C.; Trew, D.O.; Wood, B.J.B. Phosphorus quota and the chlorophyll: carbon ratio in marine phytoplankton 1. Limnology and Oceanography. 1975, 20, 587–603. [Google Scholar] [CrossRef]
- Hendry, G.A.F. Chlorophylls and chlorophyll derivatives; Springer, 1996; pp. 131–156. [Google Scholar]
- Goldhirsch, I.; Sulem, P.L.; Orszag, S.A. Stability and Lyapunov stability of dynamical systems: A differential approach and a numerical method. Physica D: Nonlinear Phenomena. 1987, 27, 311–337. [Google Scholar] [CrossRef]
- Parks, P.C. A.M. Lyapunov's stability theory—100 years on. IMA J. Math. Control Inform. 1992, 9, 275–303. [Google Scholar] [CrossRef]
- Fisher, M.L. Optimal solution of scheduling problems using Lagrange multipliers: Part I. Operations Research. 1973, 21, 1114–1127. [Google Scholar] [CrossRef]
- Alt, W.; Malanowski, K. The Lagrange-Newton method for nonlinear optimal control problems. Computational Optimization and Applications. 1993, 2, 77–100. [Google Scholar] [CrossRef]
- Harmand, J.; Lobry, C.; Rapaport, A.; Sari, T. Optimal Control in Bioprocesses: Pontryagin's Maximum Principle in Practice; John Wiley & Sons, 2019; p. 258. [Google Scholar]
- Tanaka, Y.; Manoa, H. Functional traits of herbivores and food chain efficiency in a simple aquaticcommunity model. Ecol. Model. 2012, 237, 88–100. [Google Scholar] [CrossRef]
- Ryabov, A.B.; Rudolf, L.; Blasius, B. Vertical distribution and composition of phytoplankton under the influence of an upper mixed layer. Journal of Theoretical Biology. 2010, 263, 120–133. [Google Scholar] [CrossRef]
- Silkin, V.A.; Abakumov, A.I.; Pautova, L.A.; Pakhomova, S.V.; Lifanchuk, A.V. Mechanisms of regulation of invasive processes in phytoplankton on the example of the north-eastern part of the Black Sea. Aquatic Ecology. 2016, 50, 221–234. [Google Scholar] [CrossRef]
- Martinez, E.; Antoine, D.; d'Ortenzio, F.; de Boyer Montégut, C. Phytoplankton spring and fall blooms in the North Atlantic in the 1980s and 2000s. Journal of Geophysical Research 2011, 116. [Google Scholar] [CrossRef]
- Colebrook, J.M. Continuous plankton records: seasonal cycles of phytoplankton and copepods in the North Atlantic Ocean and the North Sea. Marine Biology. 1979, 51, 23–32. [Google Scholar] [CrossRef]
- Mock, T.; Junge, K. Psychrophilic diatoms: mechanisms for survival in freeze-thaw cycles. Algae and cyanobacteria in extreme environments. 2007, 343–364. [Google Scholar]
- Lepskaya, E.V.; Kolomeitsev, V.V.; Tepnin, O.B.; Koval, M.V. Phytoplankton off the southwestern coast of Kamchatka in 2007. Issled. Vodn. Biol. Resur. Kamchatki Sev.-Zapadn. Chasti Tikhogo Okeana. 2009, 15, 21–33, (in Russ.). [Google Scholar]
- Aleksanin, A.I.; Kachur, V.A. Specificity of atmospheric correction of satellite data on ocean color in the Far East. Izv. Atmos. Ocean. Phys. 2017, 53, 996–1006. [Google Scholar] [CrossRef]
- Dubinsky, Z.; Noga, S. Photoacclimation processes in phytoplankton: mechanisms, consequences, and applications. Aquat. Microb. Ecol 2009, 56, 163–176. [Google Scholar] [CrossRef]
- Grimaud, G.M.; Mairet, F.; Sciandra, A.; Bernard, O. Modeling the temperature effect on the specific growth rate of phytoplankton: a review. Reviews in Environmental Science and Bio/Technology. 2017, 16, 625–645. [Google Scholar] [CrossRef]
- Eppley, R.W. Temperature and phytoplankton growth in the sea. Fish. bull. 1972, 70, 1063–1085. [Google Scholar]
- Goldman, J.C. Temperature effects on phytoplankton growth in continuous culture 1. Limnology and Oceanography. 1977, 22, 932–936. [Google Scholar] [CrossRef]
- Dongfang, Y.; Zhenhui, G.; Yu, C.; Peigang, W.; Peiyan, S. Influence of seawater temperature on phytoplankton growth in Jiaozhou Bay, China. Chinese Journal of Oceanology and Limnology. 2004, 22, 166–175. [Google Scholar] [CrossRef]
- Guo, S.; Zhao, Z.; Liang, J.; Du, J.; Sun, X. Carbon biomass, carbon-to-chlorophyll a ratio and the growth rate of phytoplankton in Jiaozhou Bay, China. J. Ocean. Limnol. 2021, 39, 1328–1342. [Google Scholar] [CrossRef]
- Zonneveld, C. A cell-based model for the chlorophyll a to carbon ratio in phytoplankton. Ecological Modelling 1998, 113, 55–70. [Google Scholar] [CrossRef]
- Yang, C.; Hua, Q.; Shimizu, K. Energetics and carbon metabolism during growth of microalgal cells under photoautotrophic, mixotrophic and cyclic light-autotrophic/dark-heterotrophic conditions. Biochem. Eng. J. 2000, 6, 87–102. [Google Scholar] [CrossRef] [PubMed]
- Carmeli, C.; Avron, M.A. Light-Triggered Adenosine Triphosphate-Phosphate Exchange Reaction in Chloroplasts. European Journal of Biochemistry. 1967, 2, 318–326. [Google Scholar] [CrossRef] [PubMed]
- Biochemistry and molecular biology of plants; Buchanan, B.B., Gruissem, W., Jones, R.L., Eds.; John wiley & sons, 2015; 1280p. [Google Scholar]
- Reynolds, C.S. The ecology of phytoplankton; Cambridge University Press, 2006; 552p. [Google Scholar]
- Adamson, H.Y.; Hiller, R.G.; Vesk, M. Chloroplast development and the synthesis of chlorophyll a and b and chlorophyll protein complexes I and II in the dark in Tradescantia albiflora (Kunth). Planta. 1980, 150, 269–274. [Google Scholar] [CrossRef]
- Post, A.F.; Loogman, J.G.; Mur, L.R. Regulation of growth and photosynthesis by Oscillatoria agardhii grown with a light/dark cycle. FEMS microbiology ecology. 1985, 1, 97–102. [Google Scholar] [CrossRef]
Figure 1.
Areas of existence and stability of equilibria in the plane of parameters α and Q0 for Model C.
Figure 1.
Areas of existence and stability of equilibria in the plane of parameters α and Q0 for Model C.
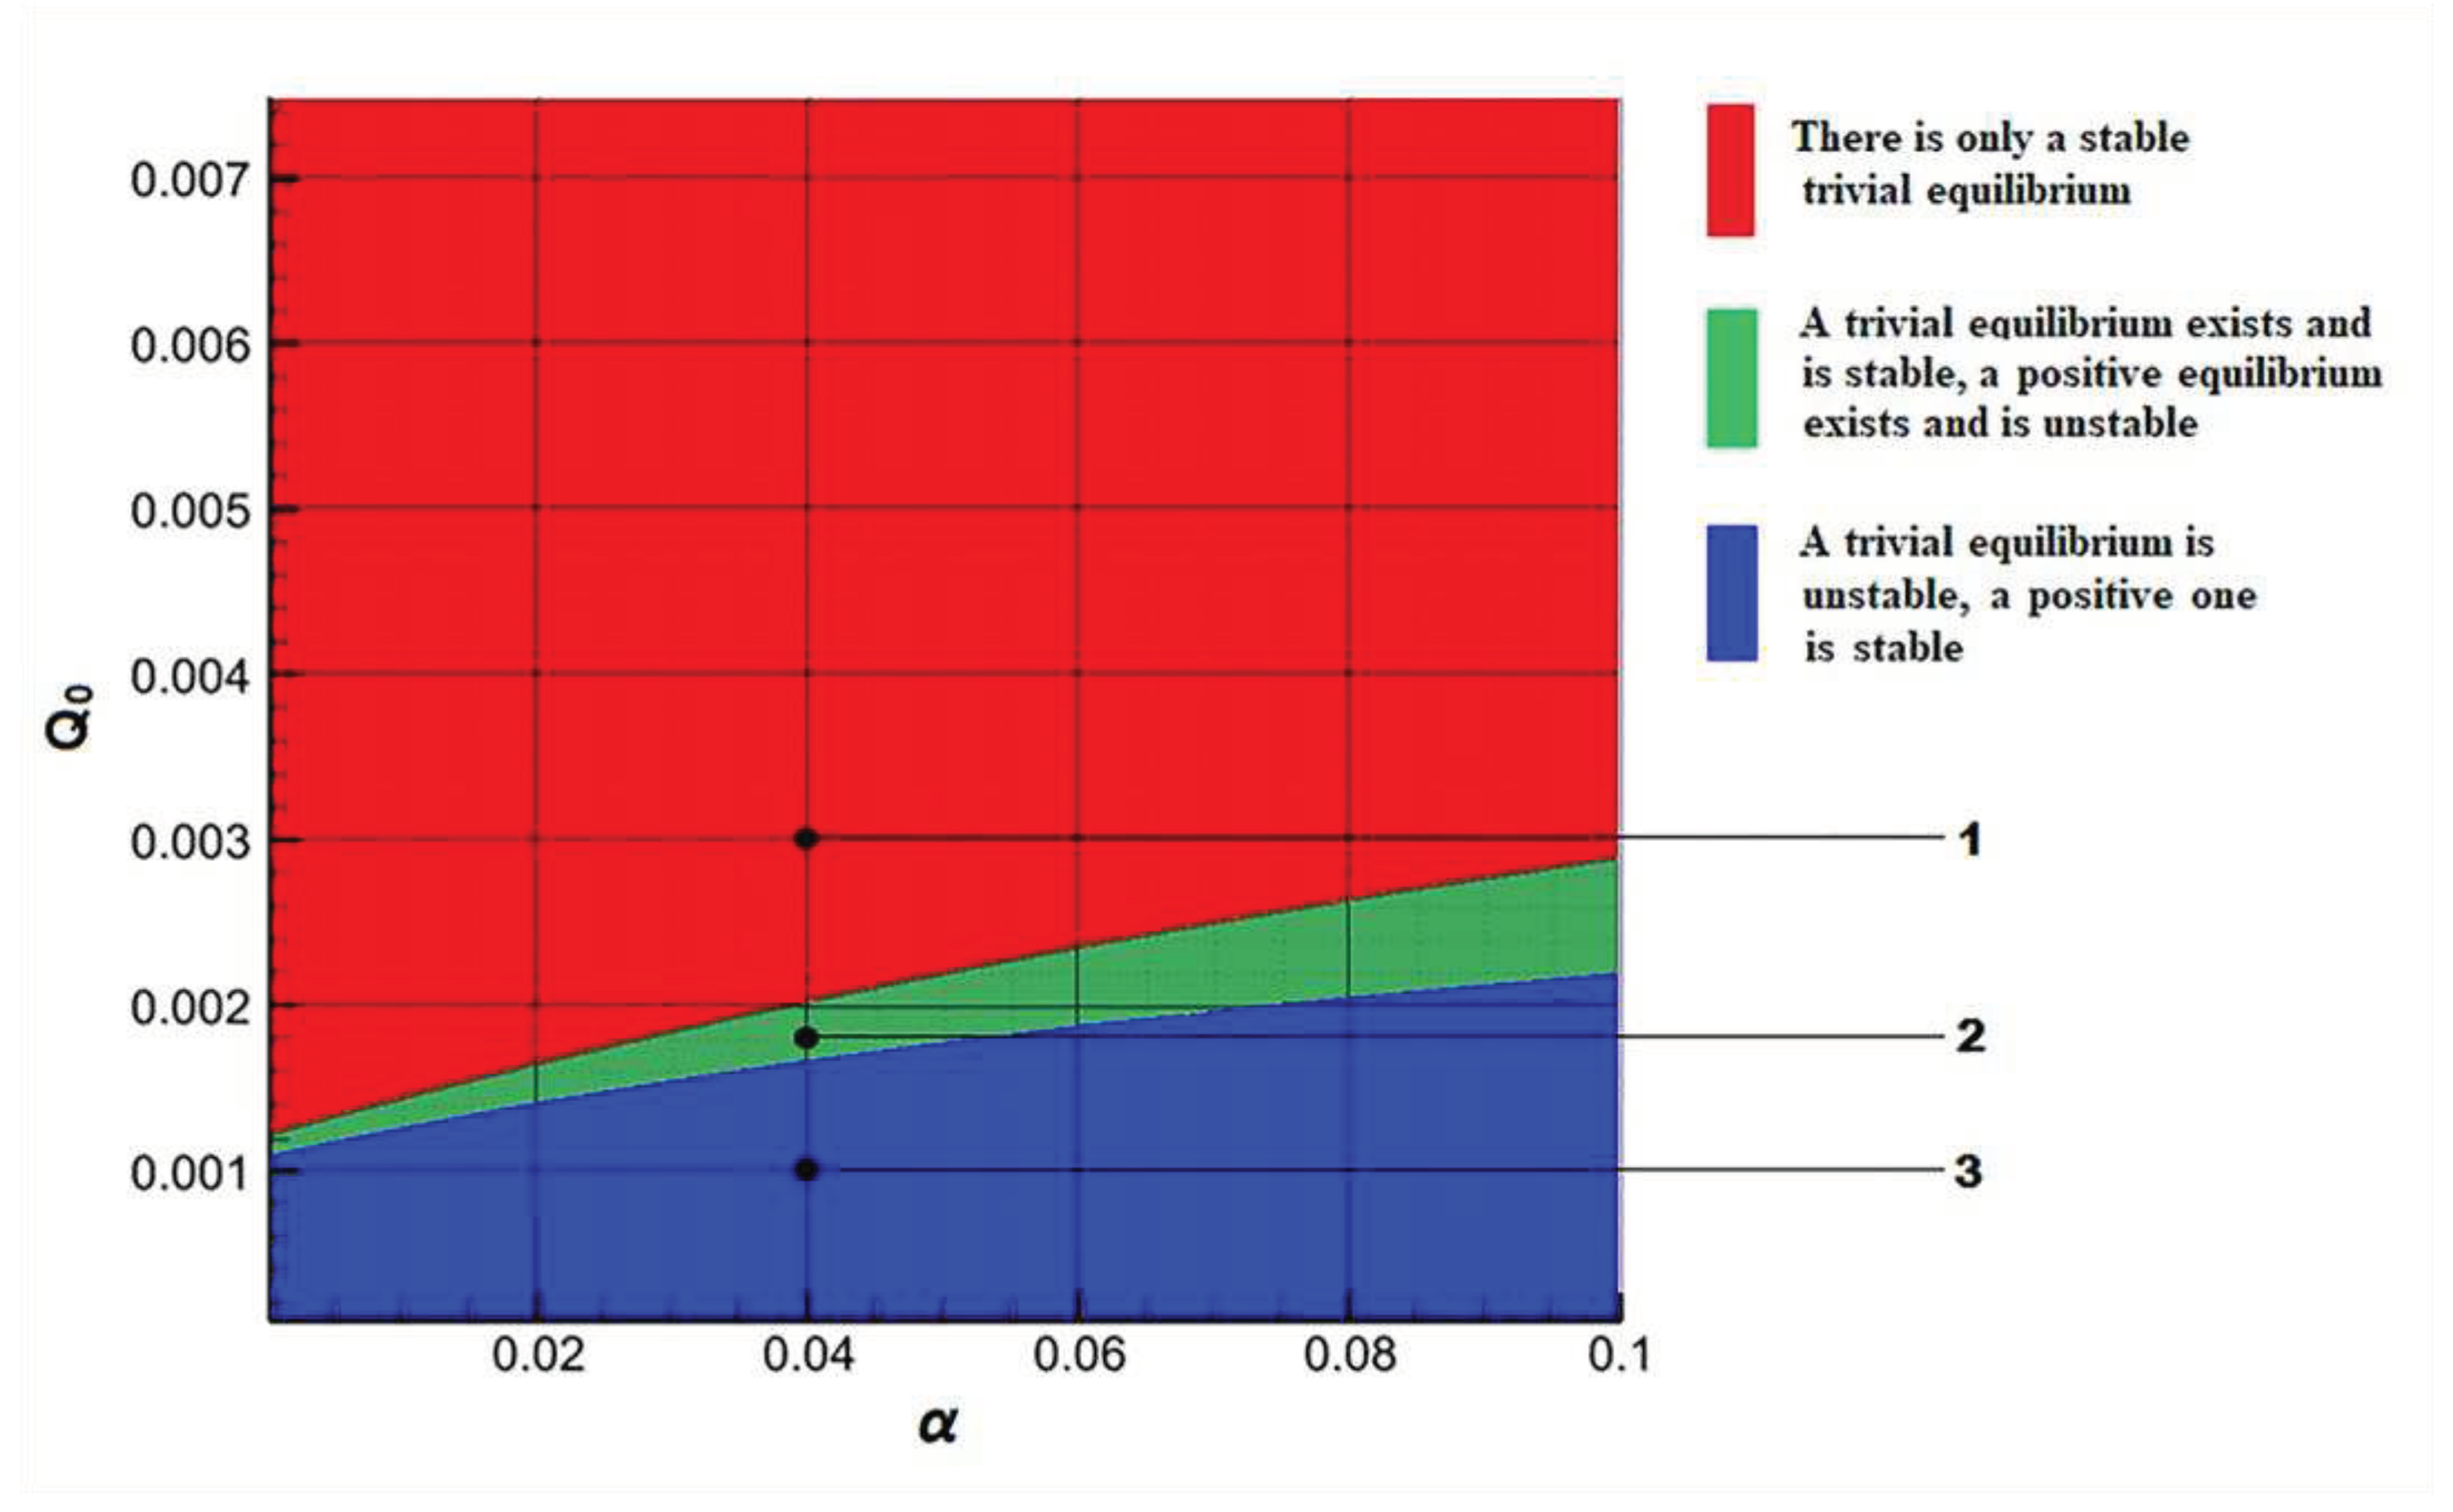
Figure 2.
Phase trajectories of system (2.1)+(3.1) for values α and Q0 in points 1, 2, 3 from Figure 1.
Figure 2.
Phase trajectories of system (2.1)+(3.1) for values α and Q0 in points 1, 2, 3 from Figure 1.
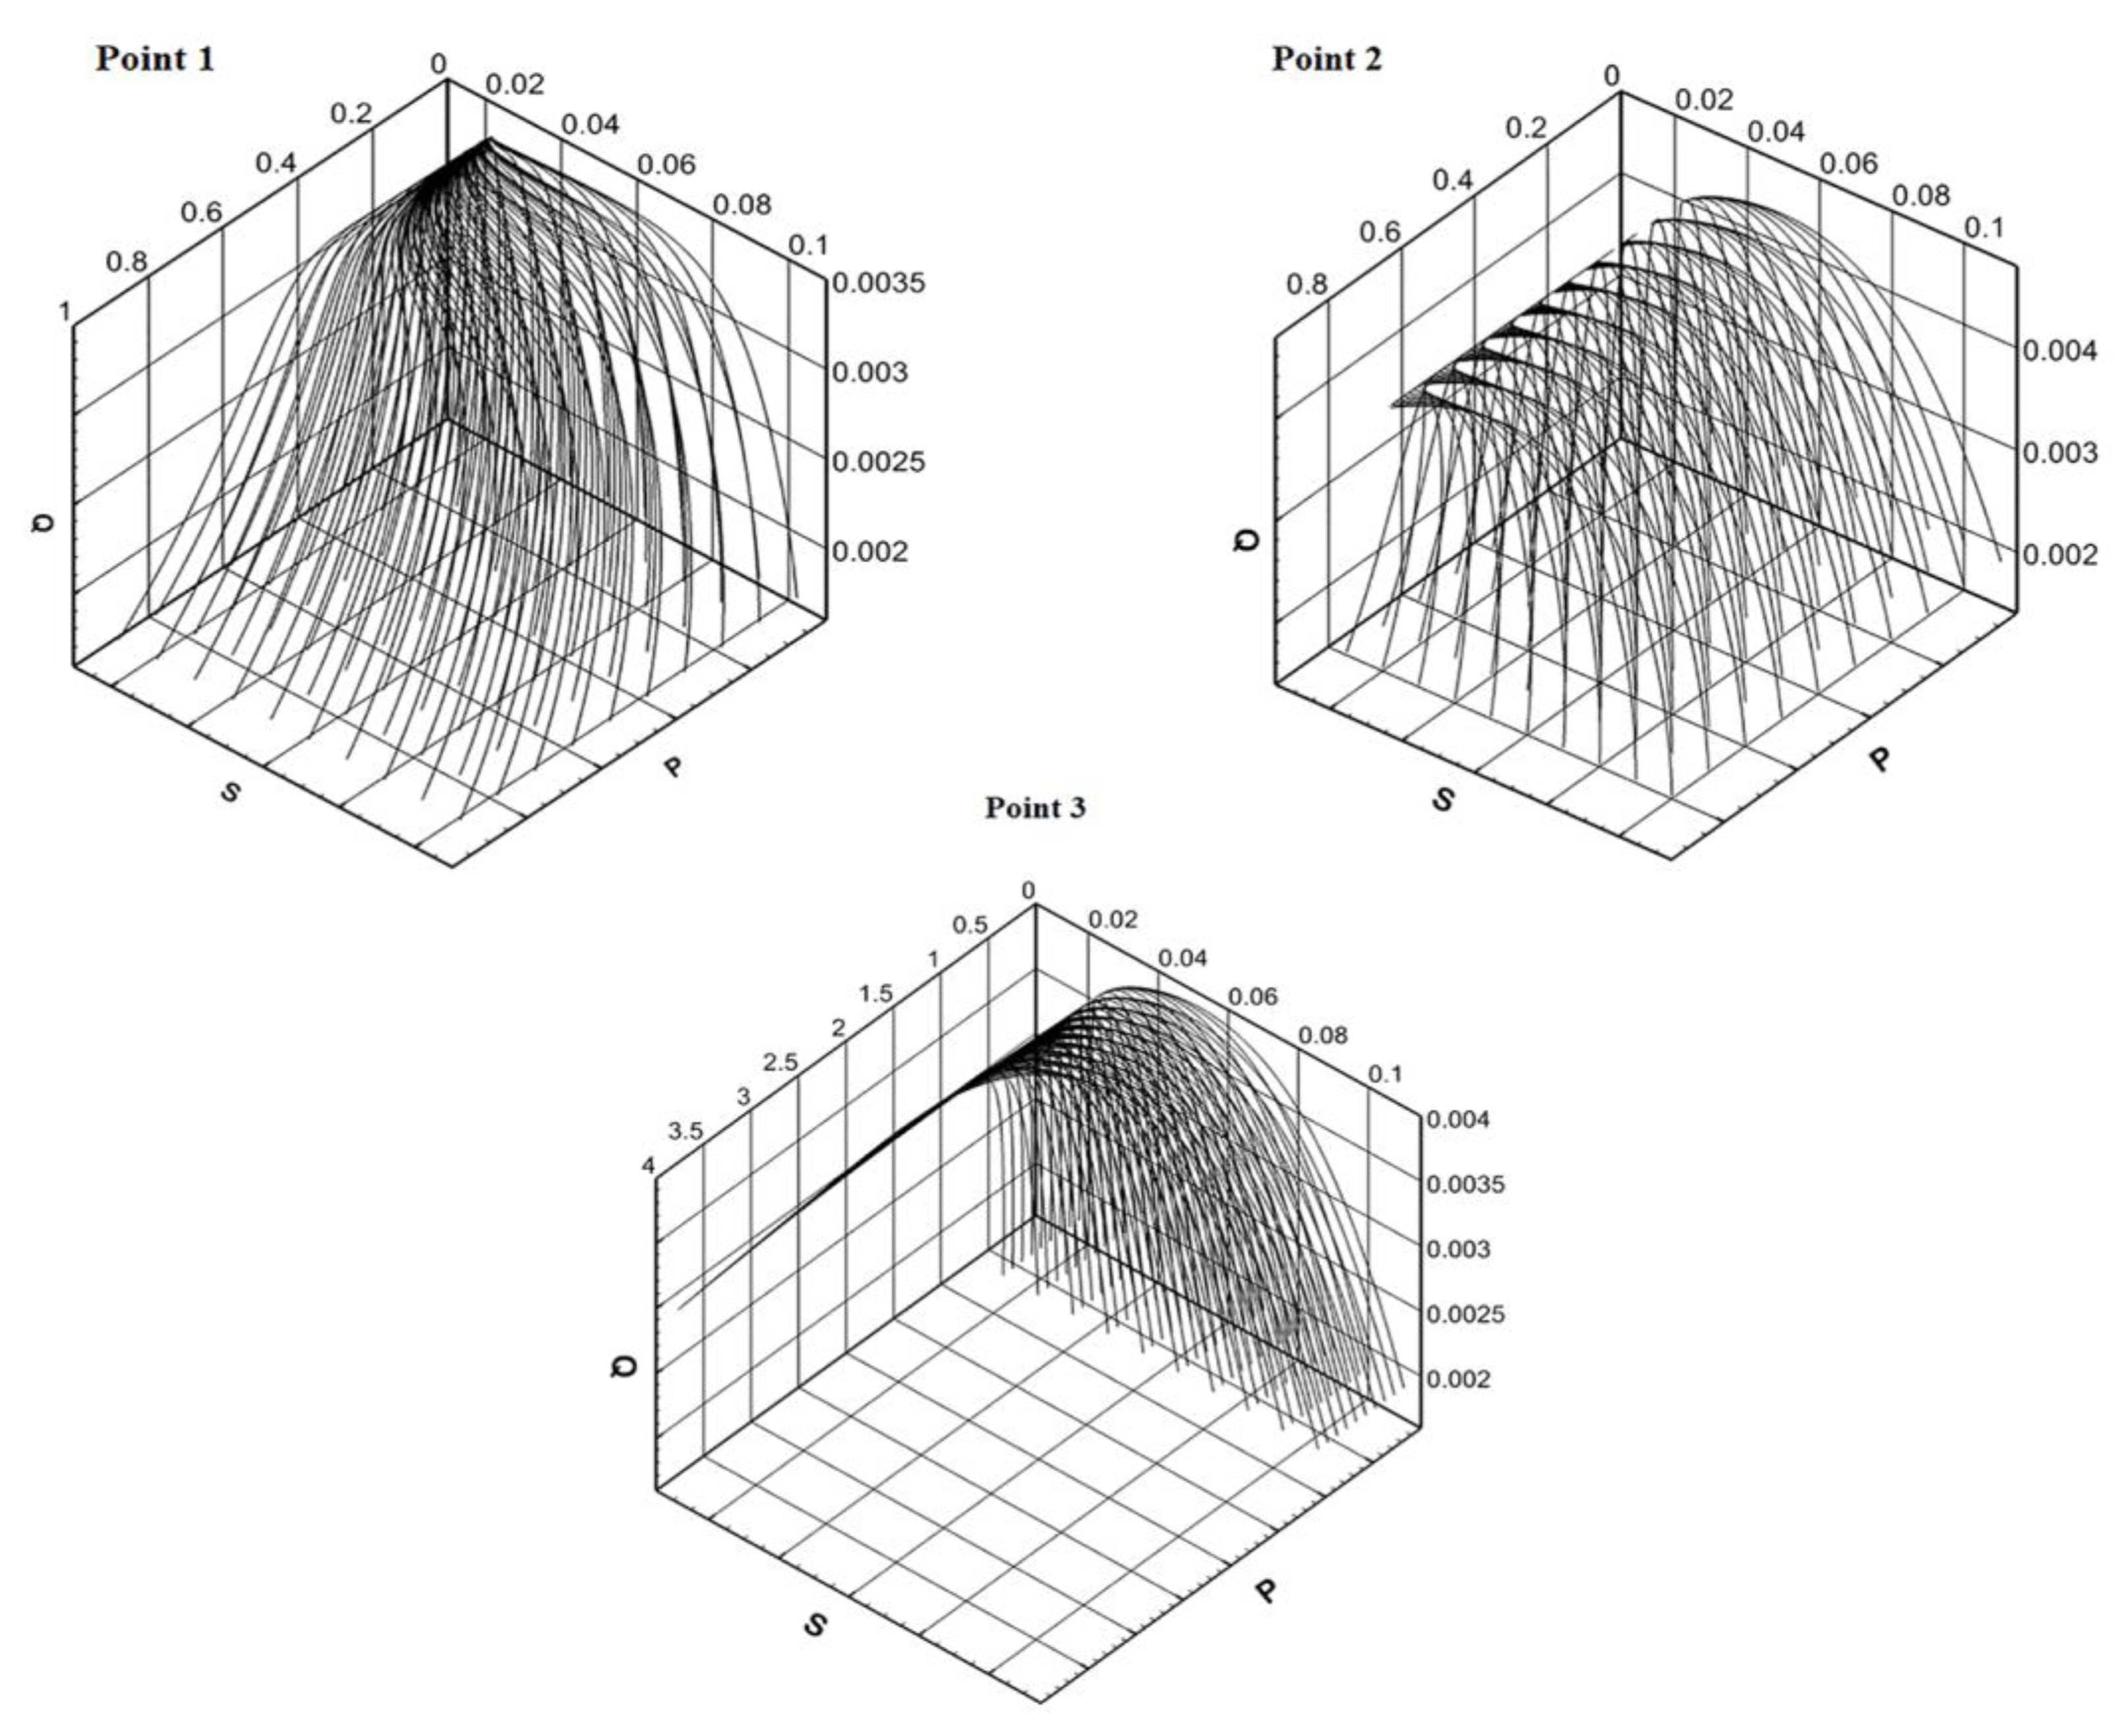
Figure 3.
Areas of existence and stability of equilibria in the plane of parameters (β, Q0) for Model E.
Figure 3.
Areas of existence and stability of equilibria in the plane of parameters (β, Q0) for Model E.
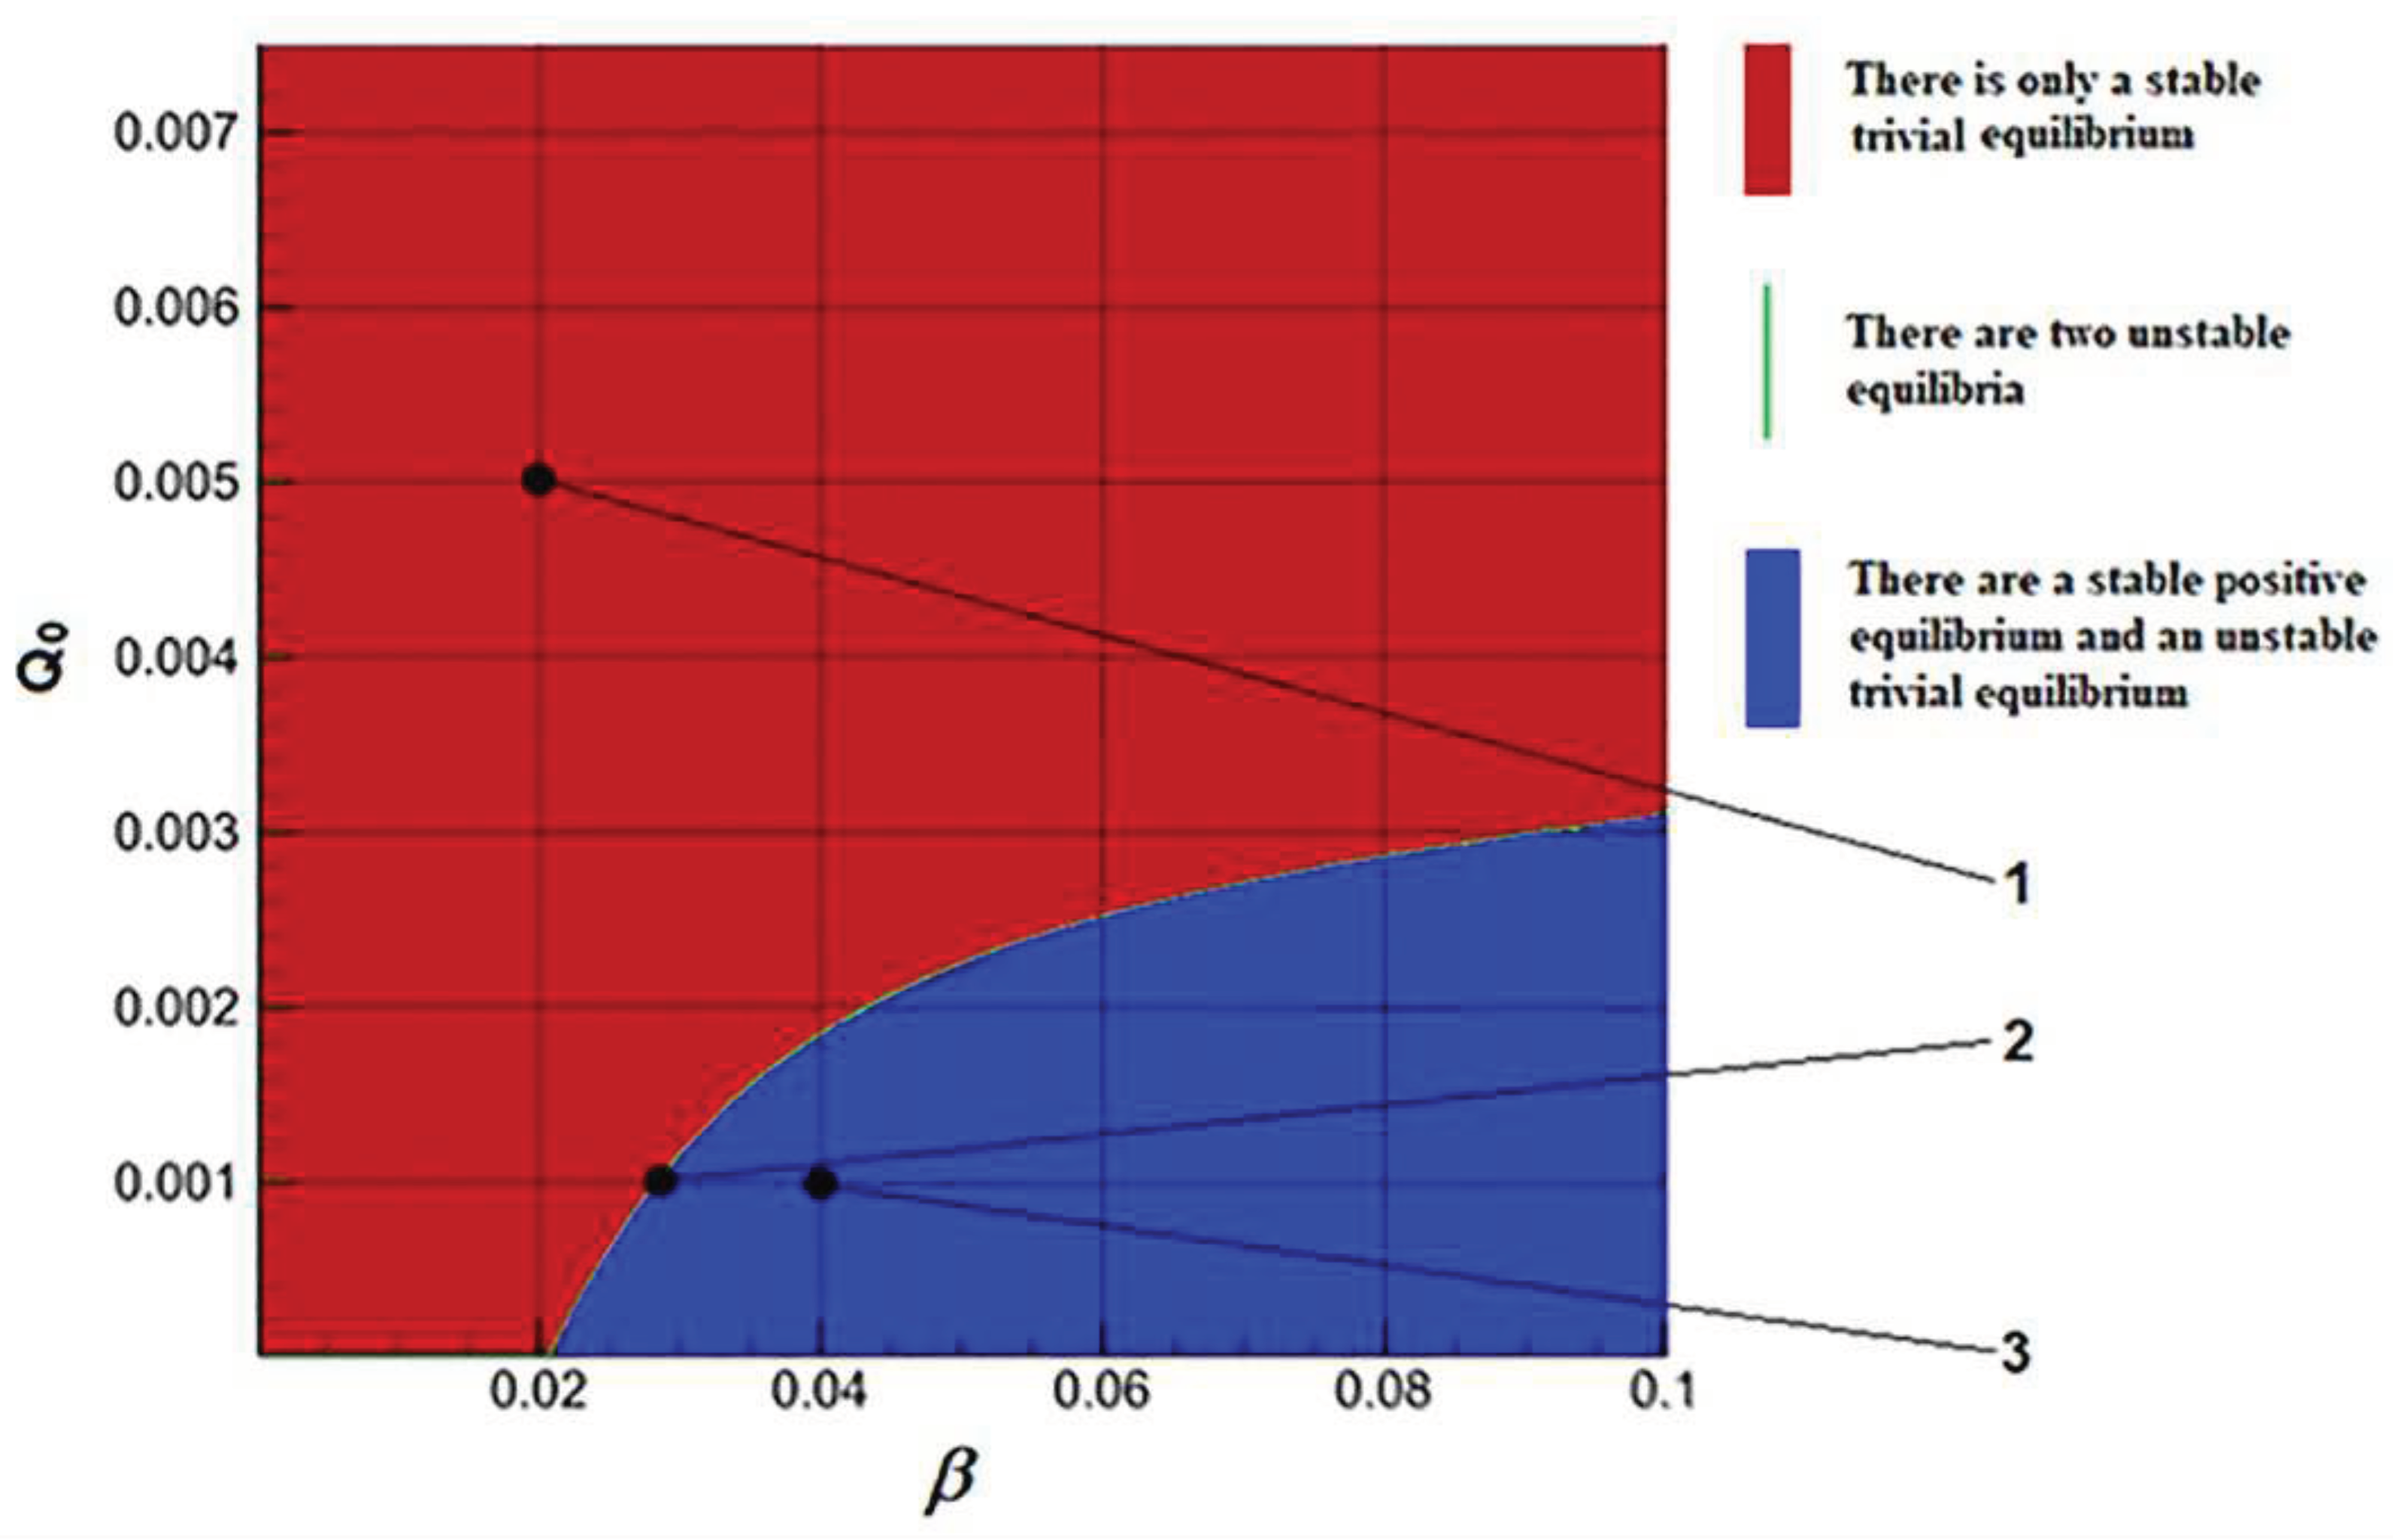
Figure 4.
a. Phase portraits in the space of components p,s,q/c/r for the region of stability of trivial equilibrium (point 1 in Figure 3). b. Phase portraits in the space of components p,s,q/c/r for the region of instability of both equilibria (point 2 in Figure 3). c. Phase portraits in the space of components p,s,q/c/r for the region of stability of positive equilibrium (point 3 in Figure 3).
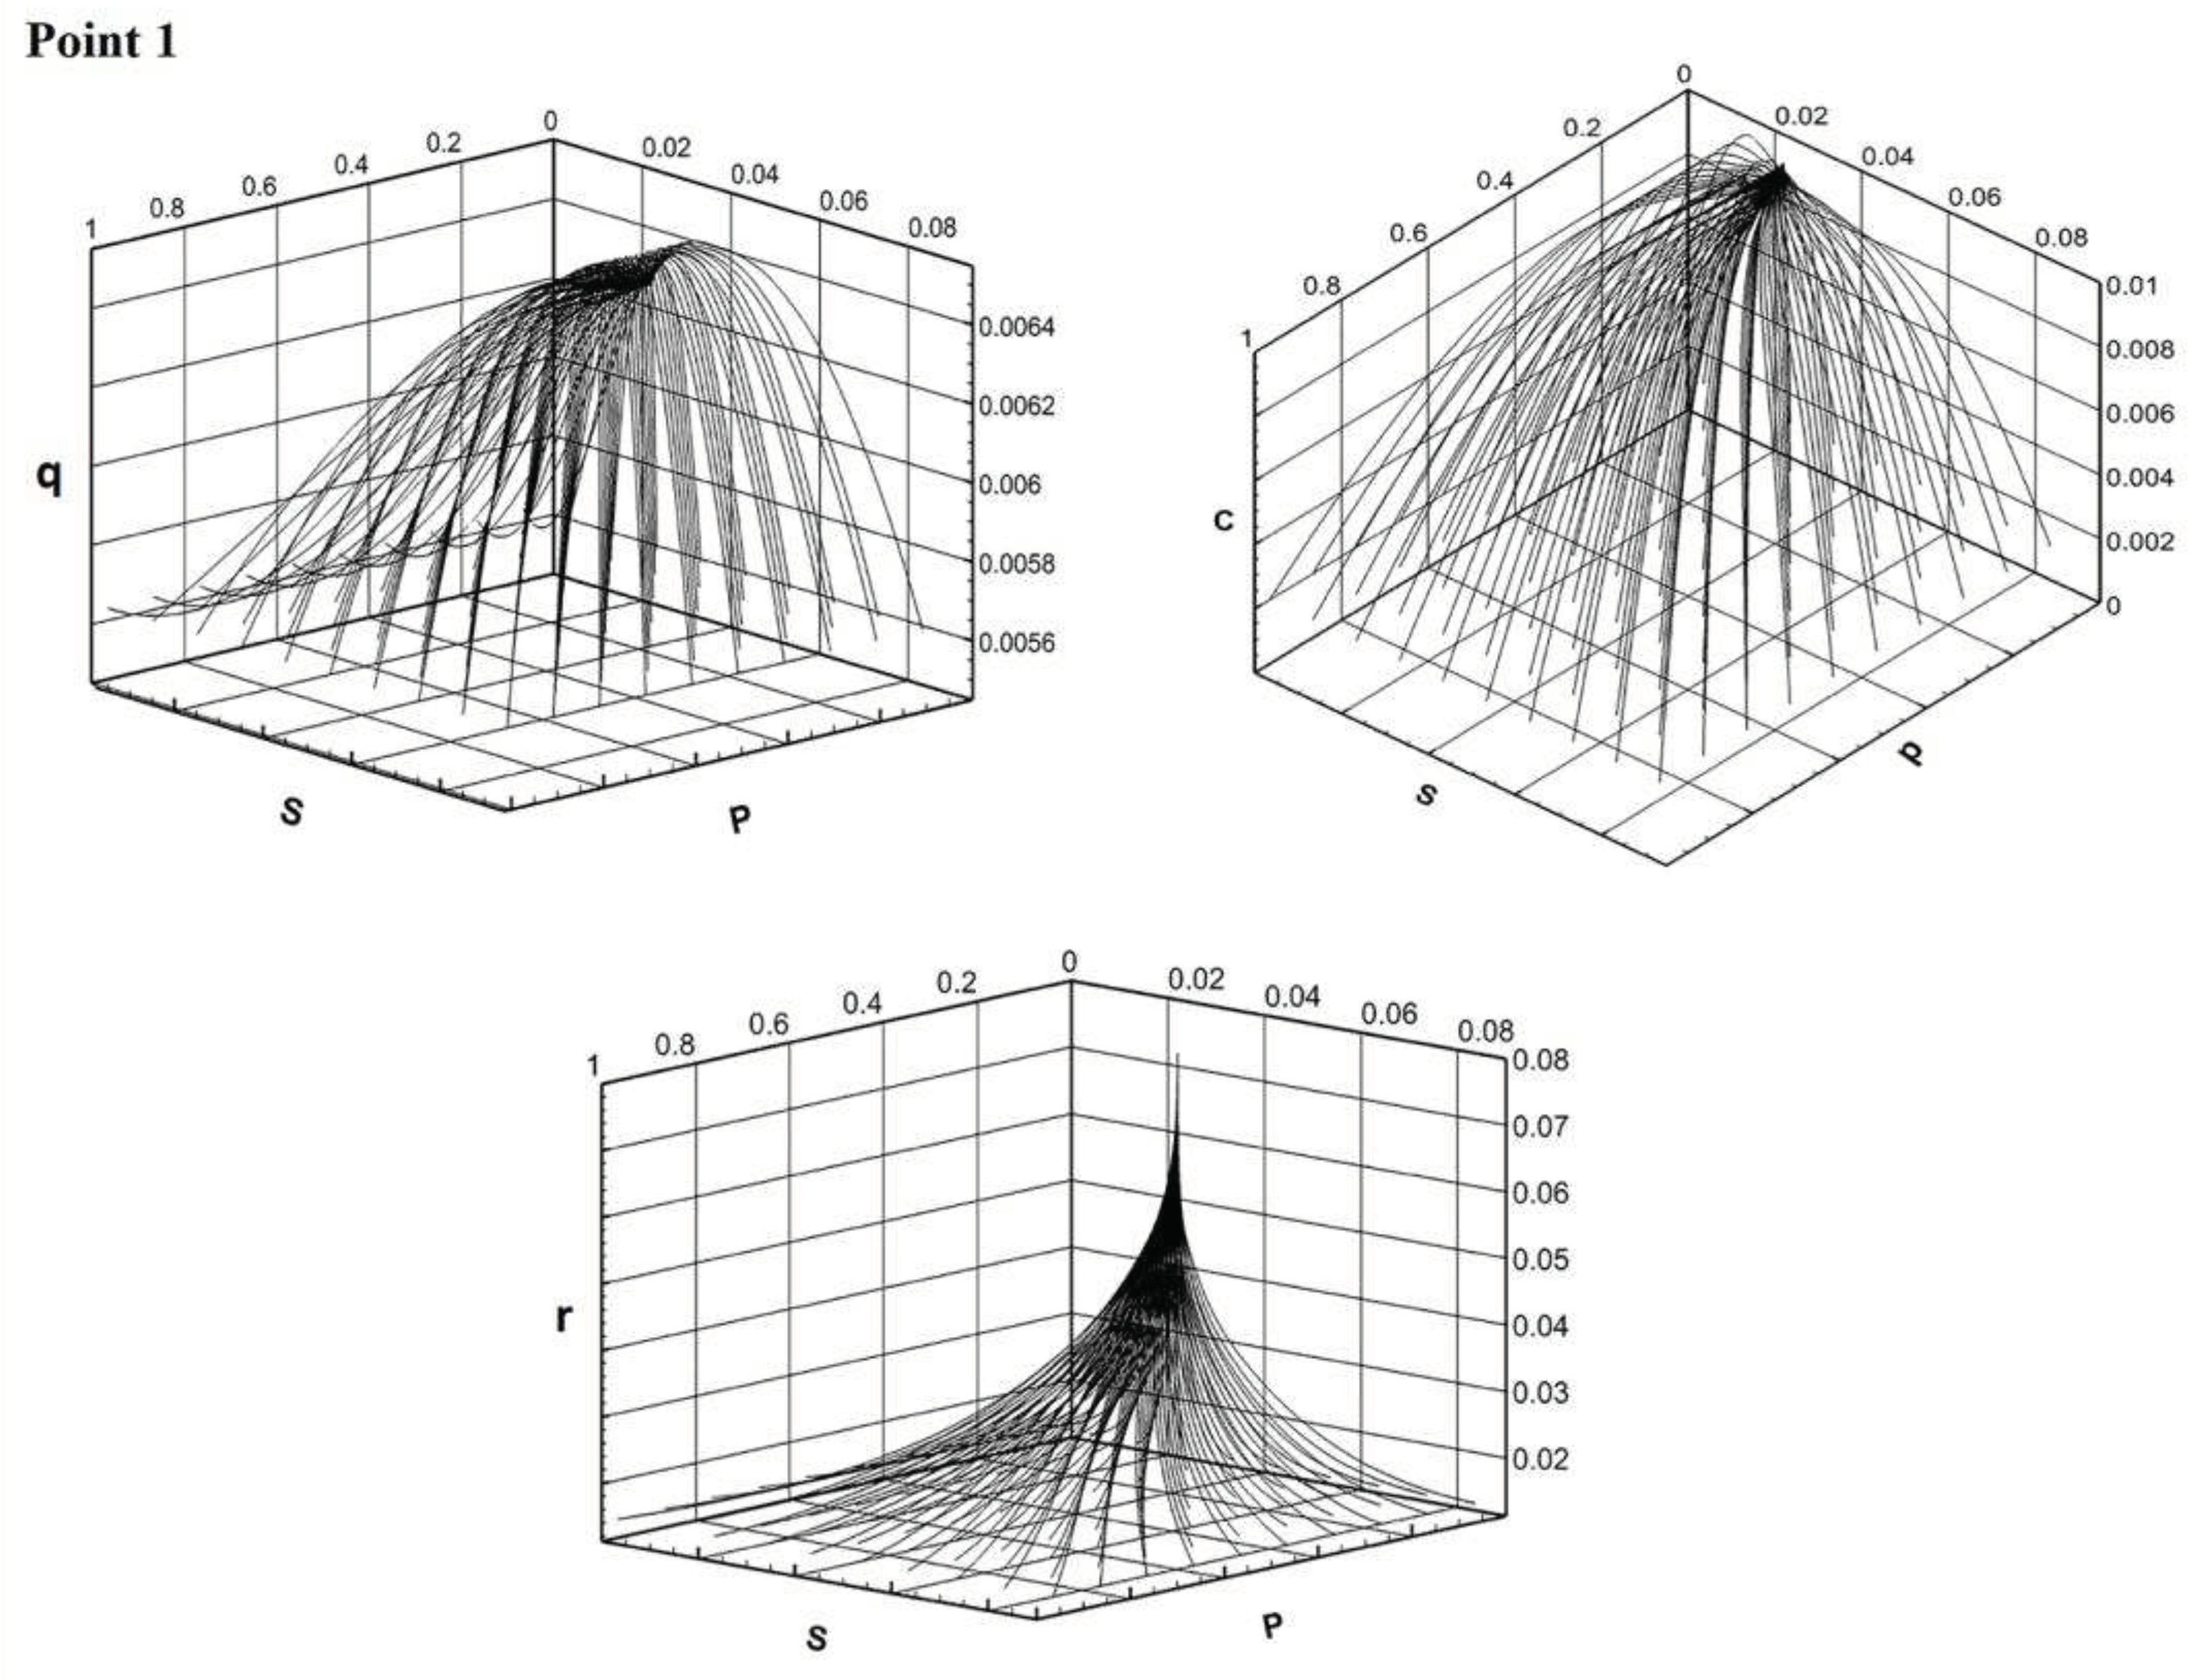
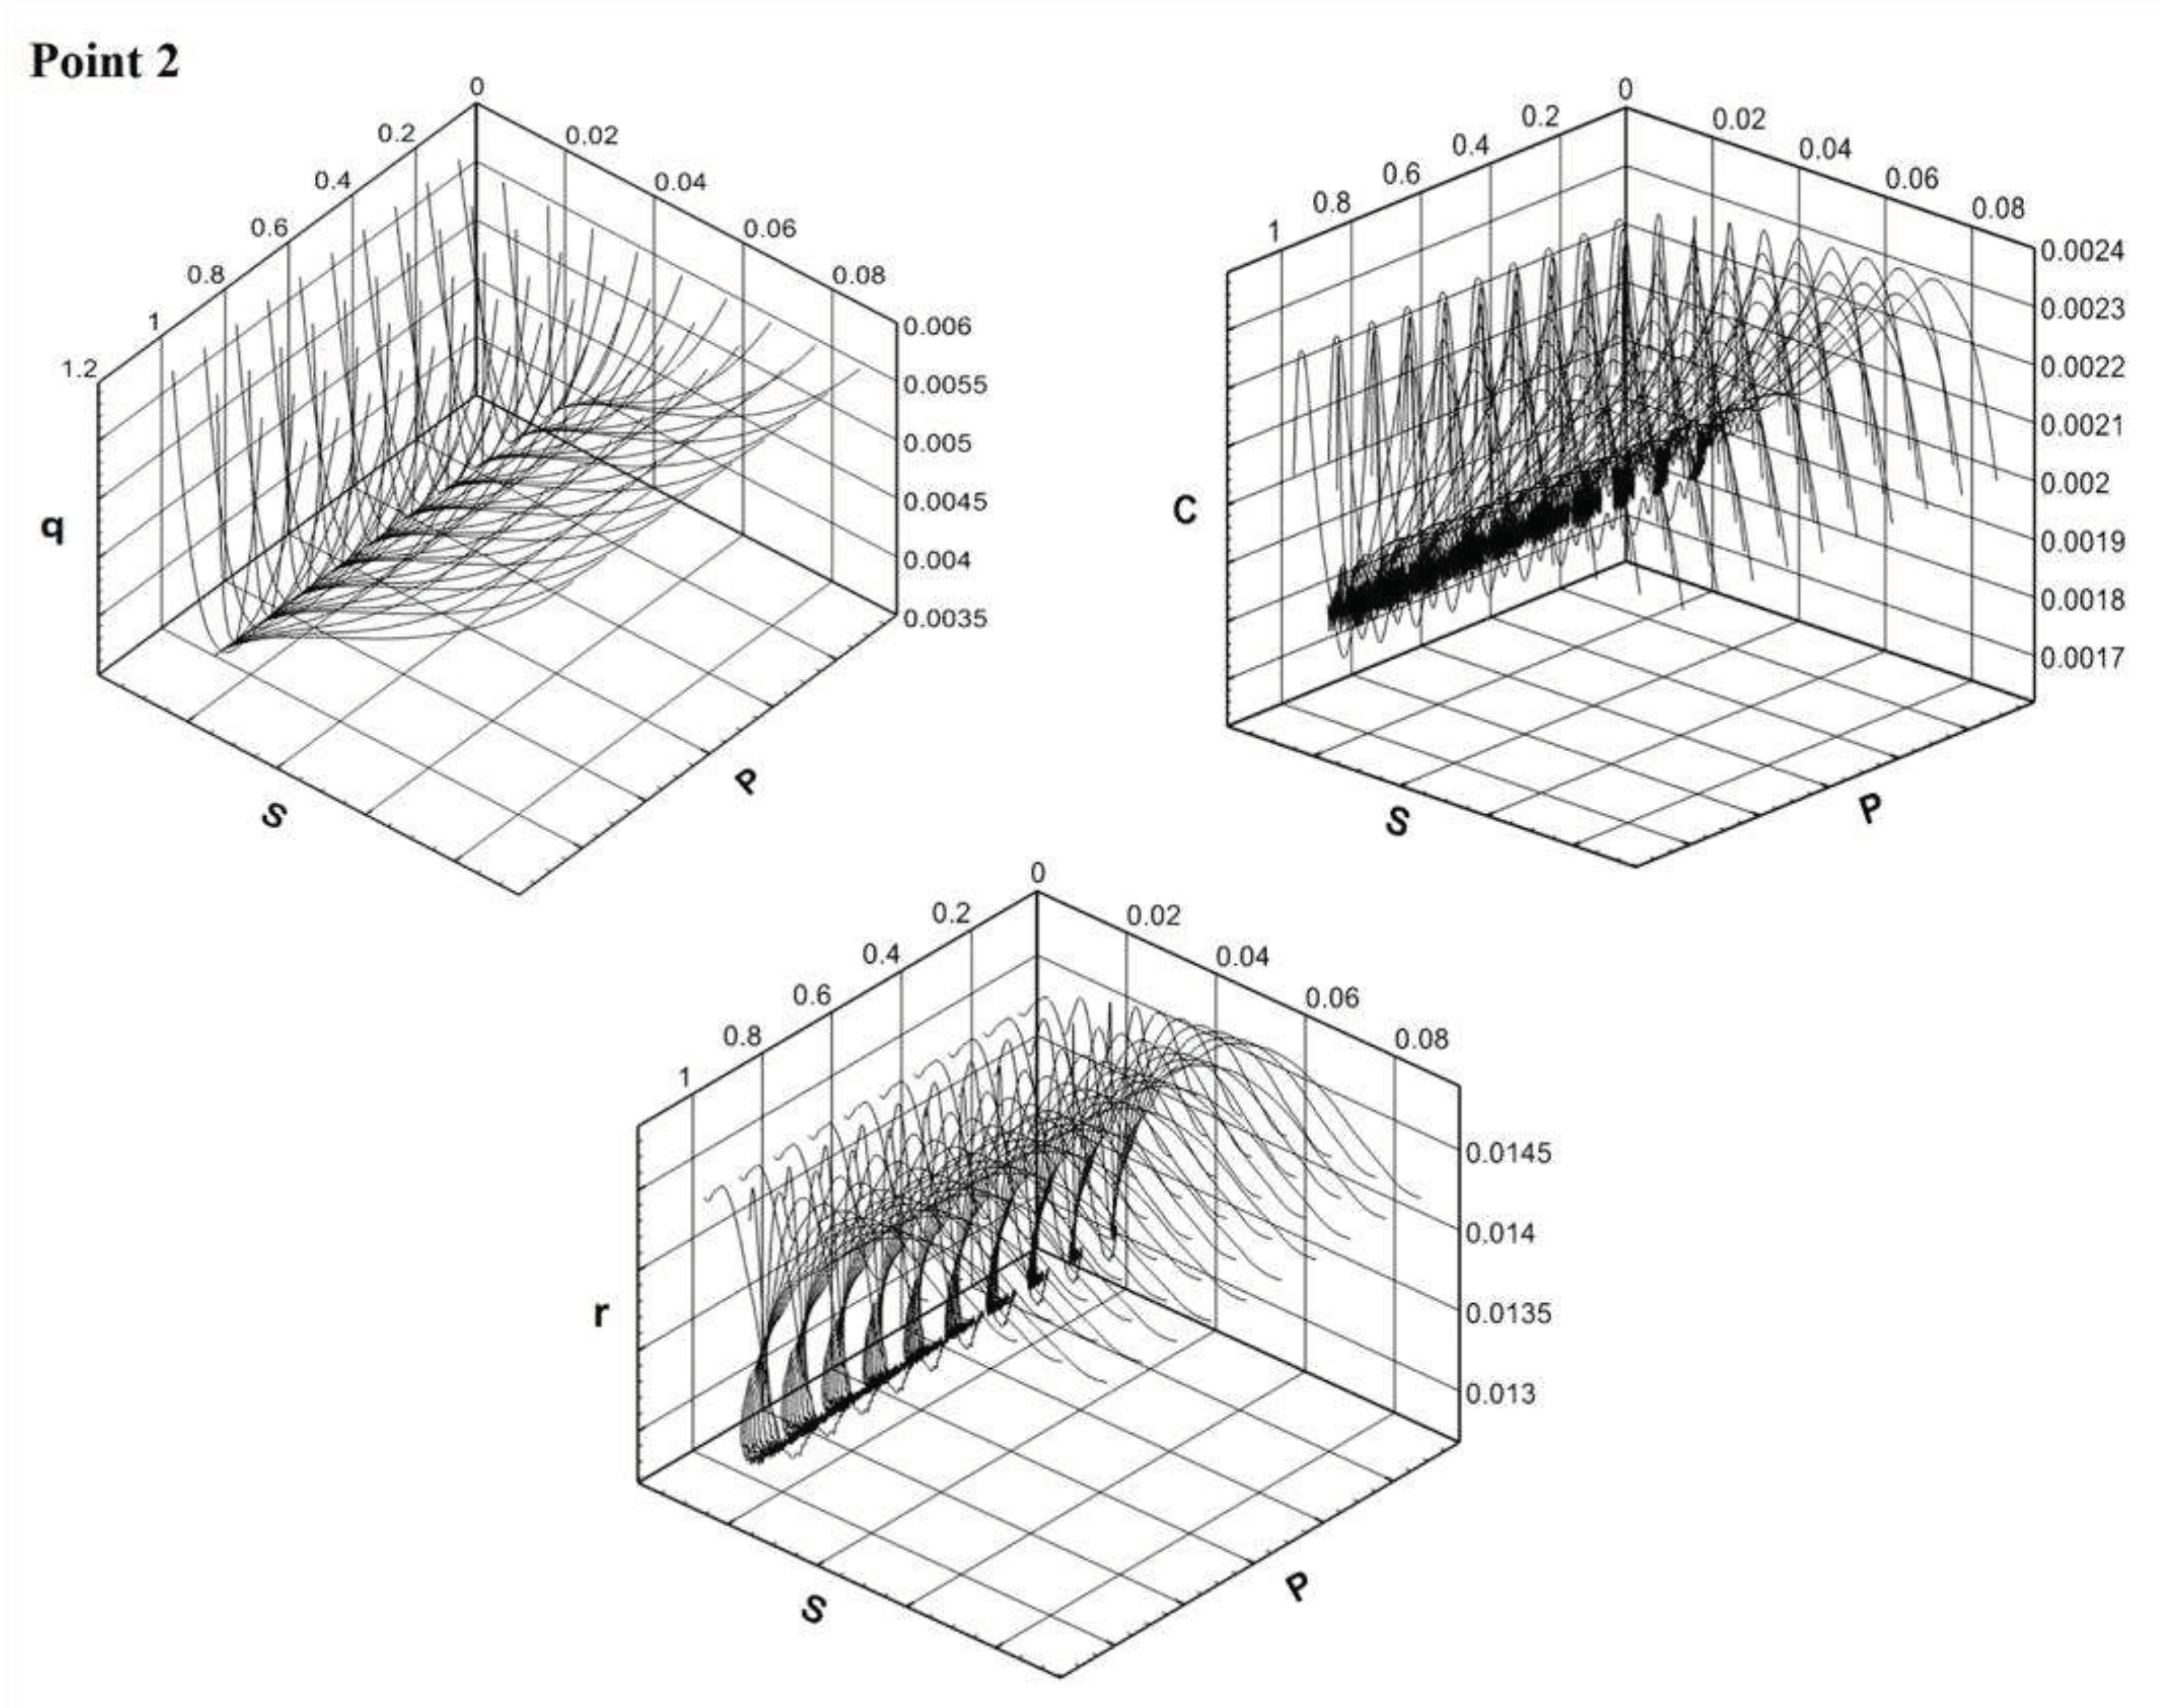
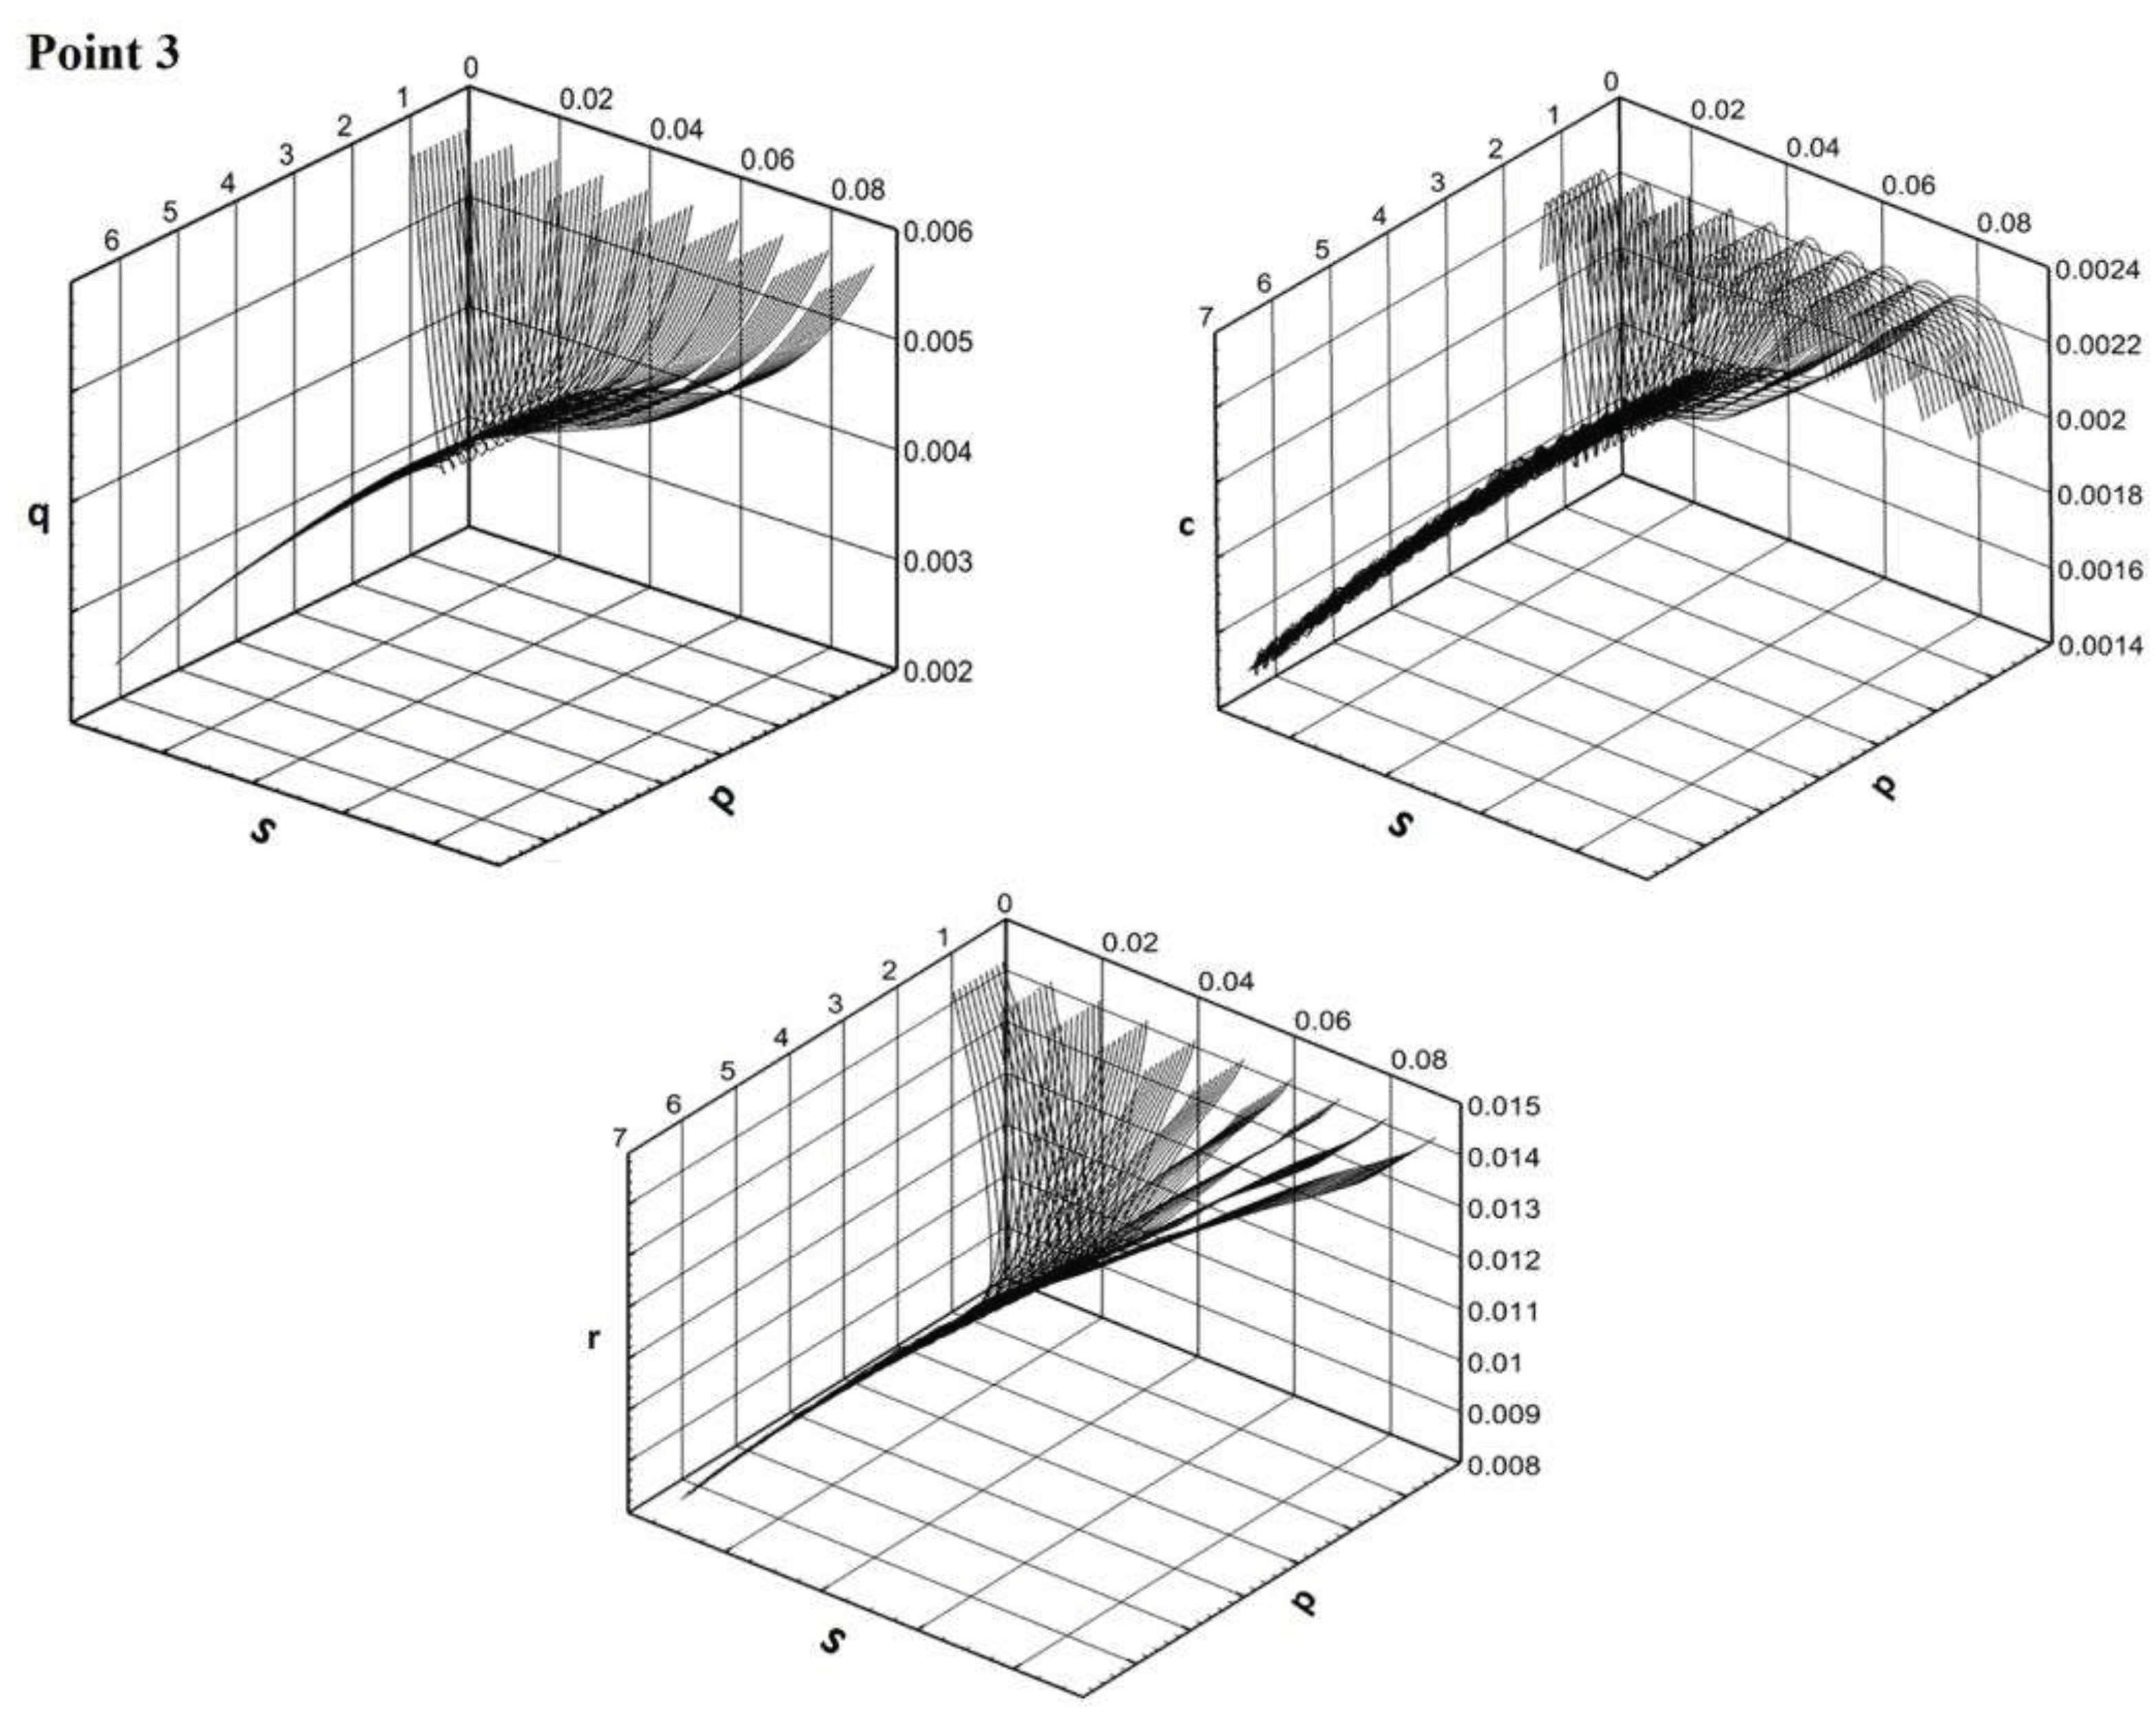
Figure 5.
Phytoplankton dynamics on attractor (Model C – left, Model E – right).
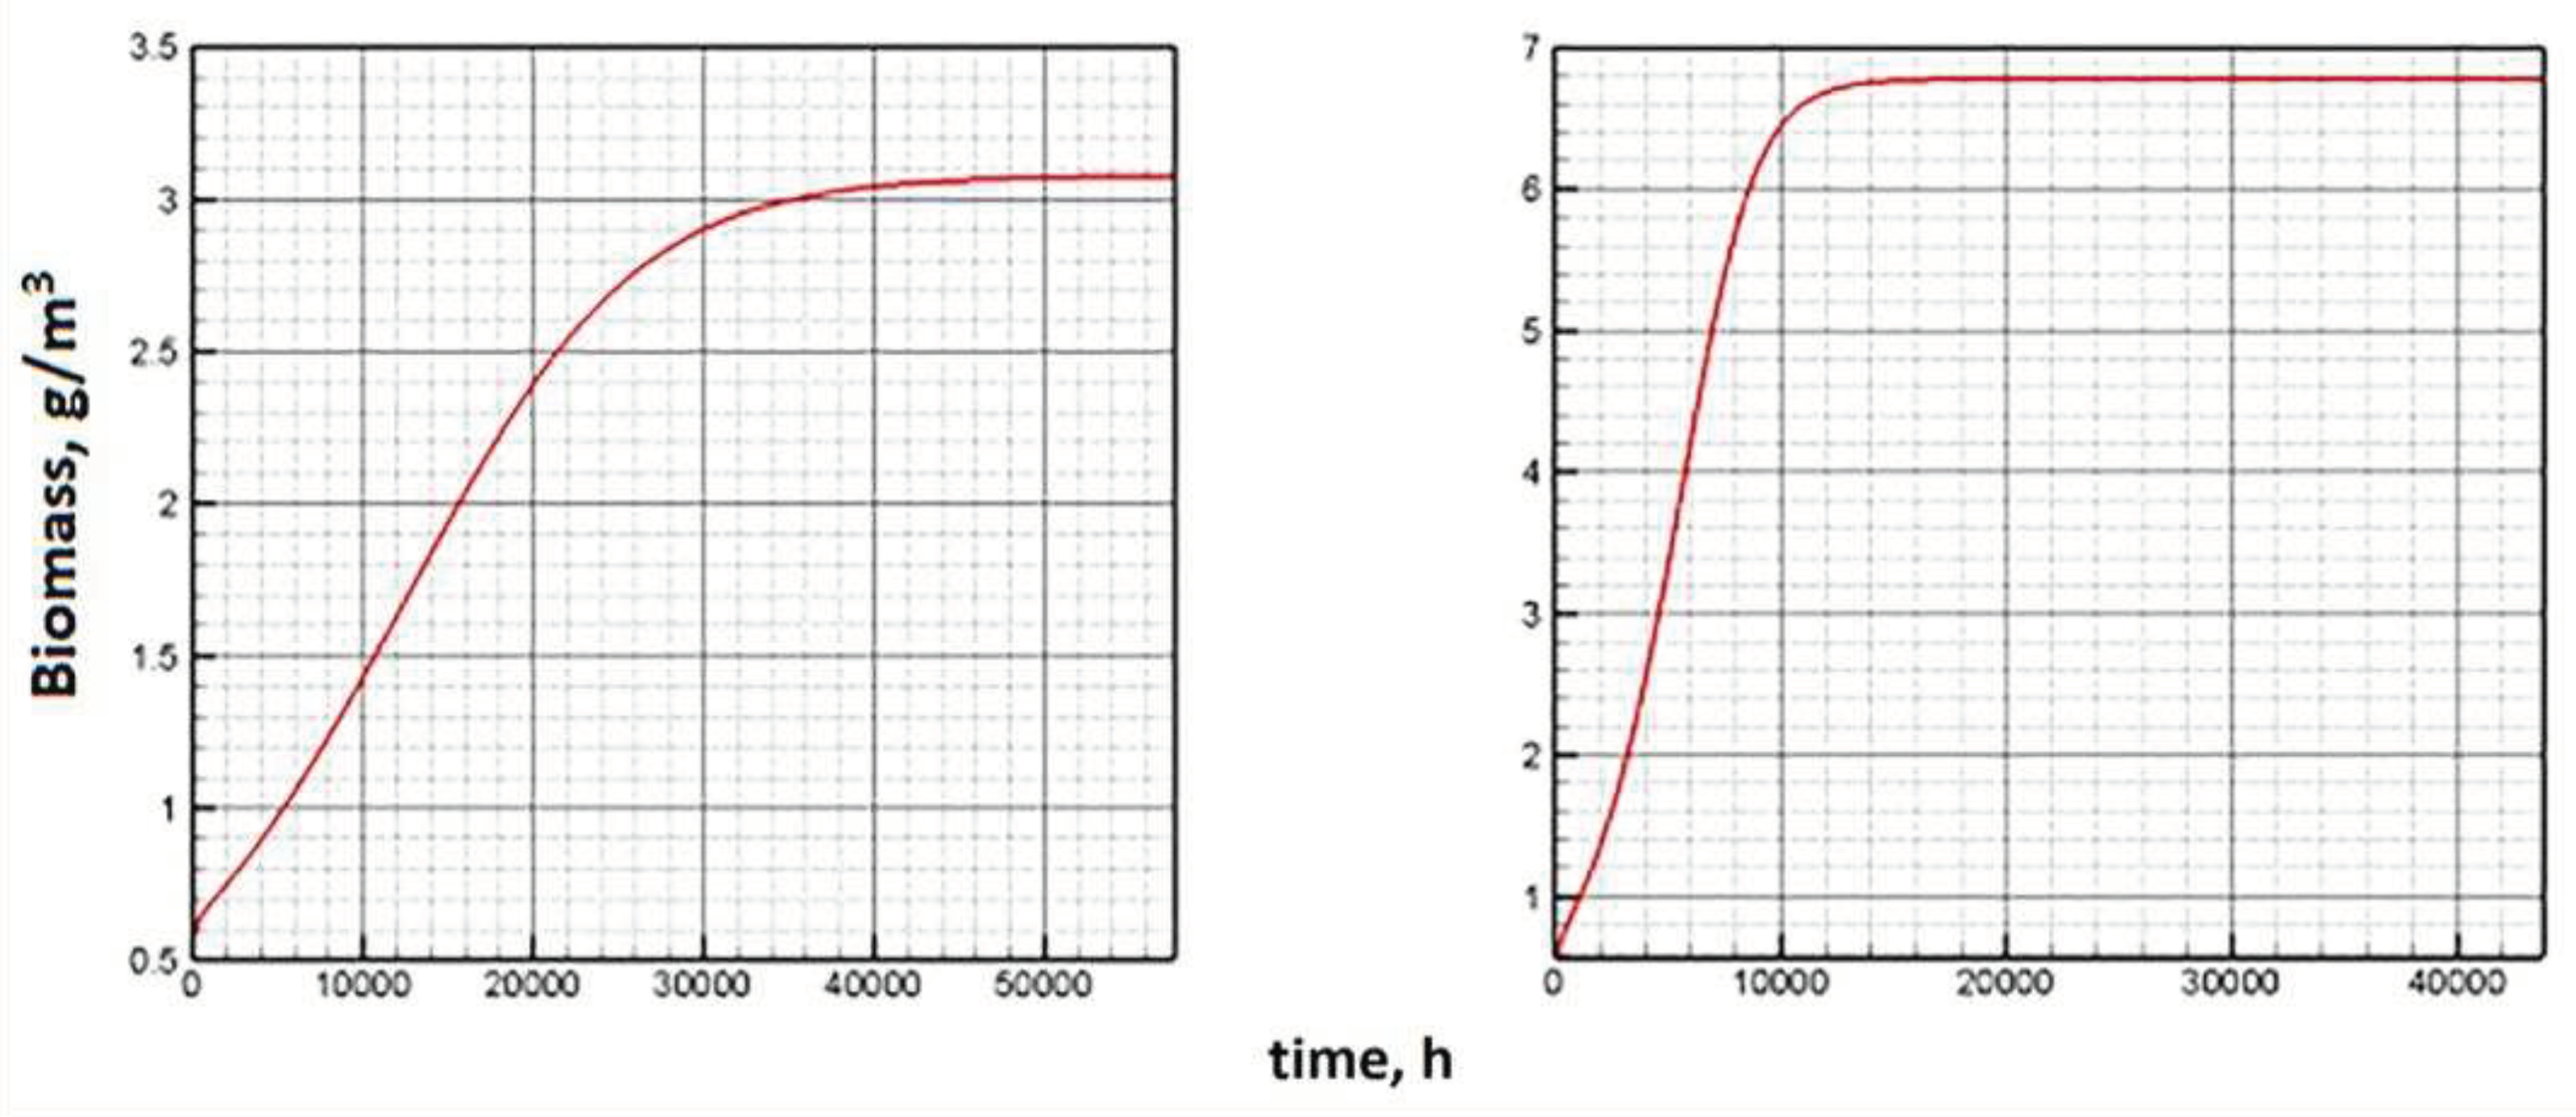
Figure 6.
Longtime dynamics on attractor, represented by nutrients (green), intracellular (cell) quota (blue), chlorophyll quota (dark grey), and ATP fraction (orange) (Model C – left, Model E – right).
Figure 6.
Longtime dynamics on attractor, represented by nutrients (green), intracellular (cell) quota (blue), chlorophyll quota (dark grey), and ATP fraction (orange) (Model C – left, Model E – right).
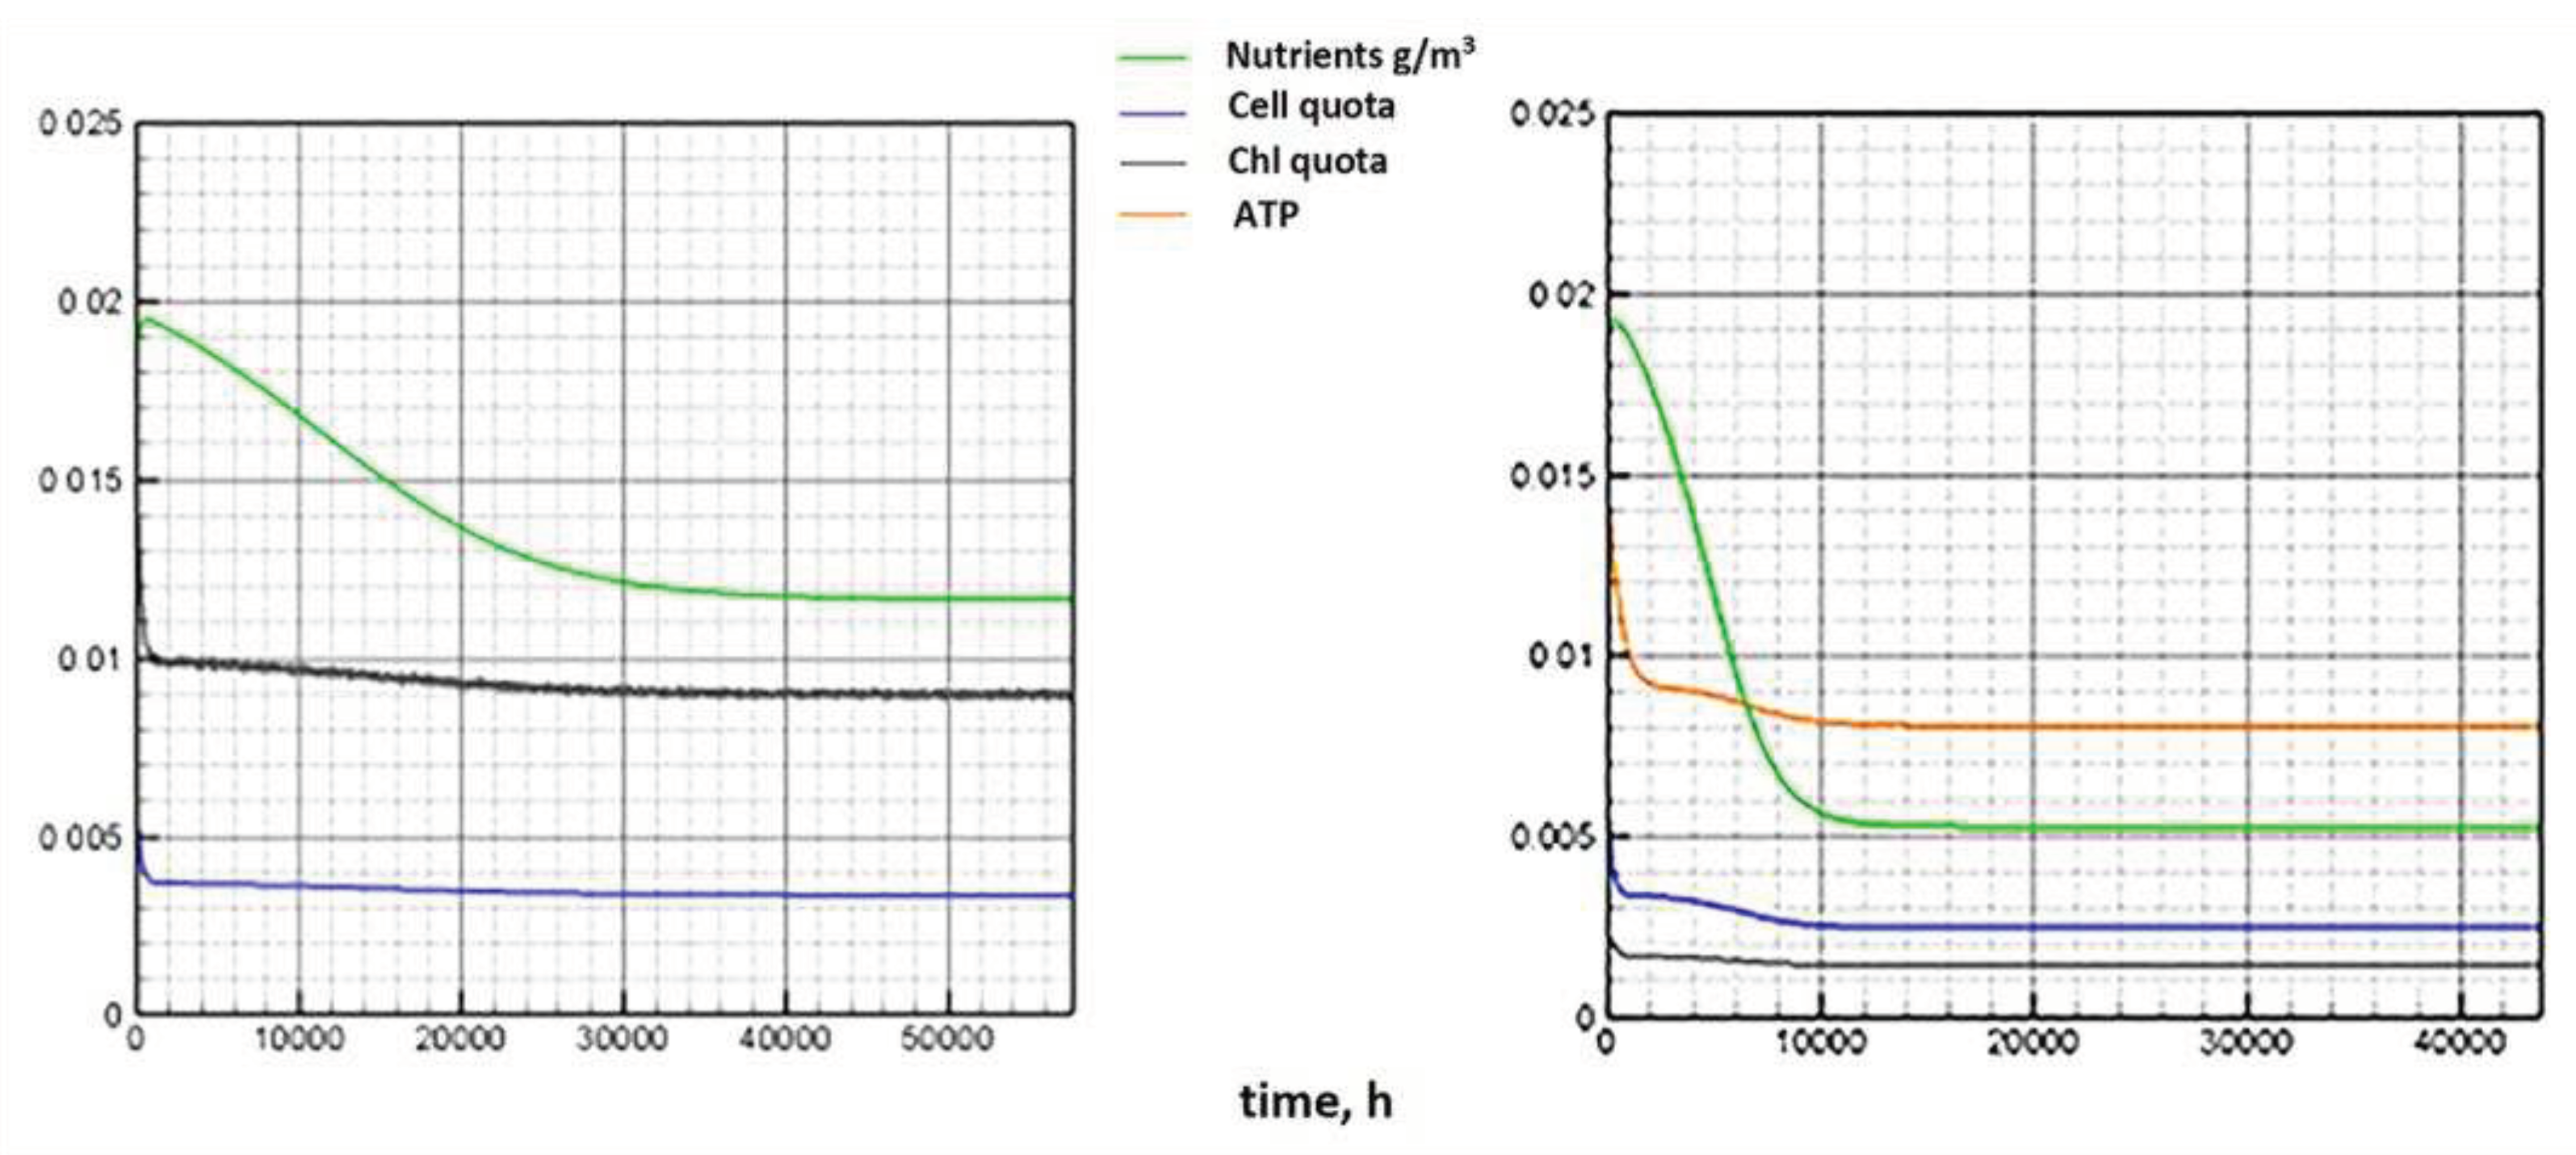
Figure 7.
Dynamics of the chlorophyll quota under a periodic change in illumination (one day on the left, 100 days on the right). Daily period of light is 12 hours.
Figure 7.
Dynamics of the chlorophyll quota under a periodic change in illumination (one day on the left, 100 days on the right). Daily period of light is 12 hours.
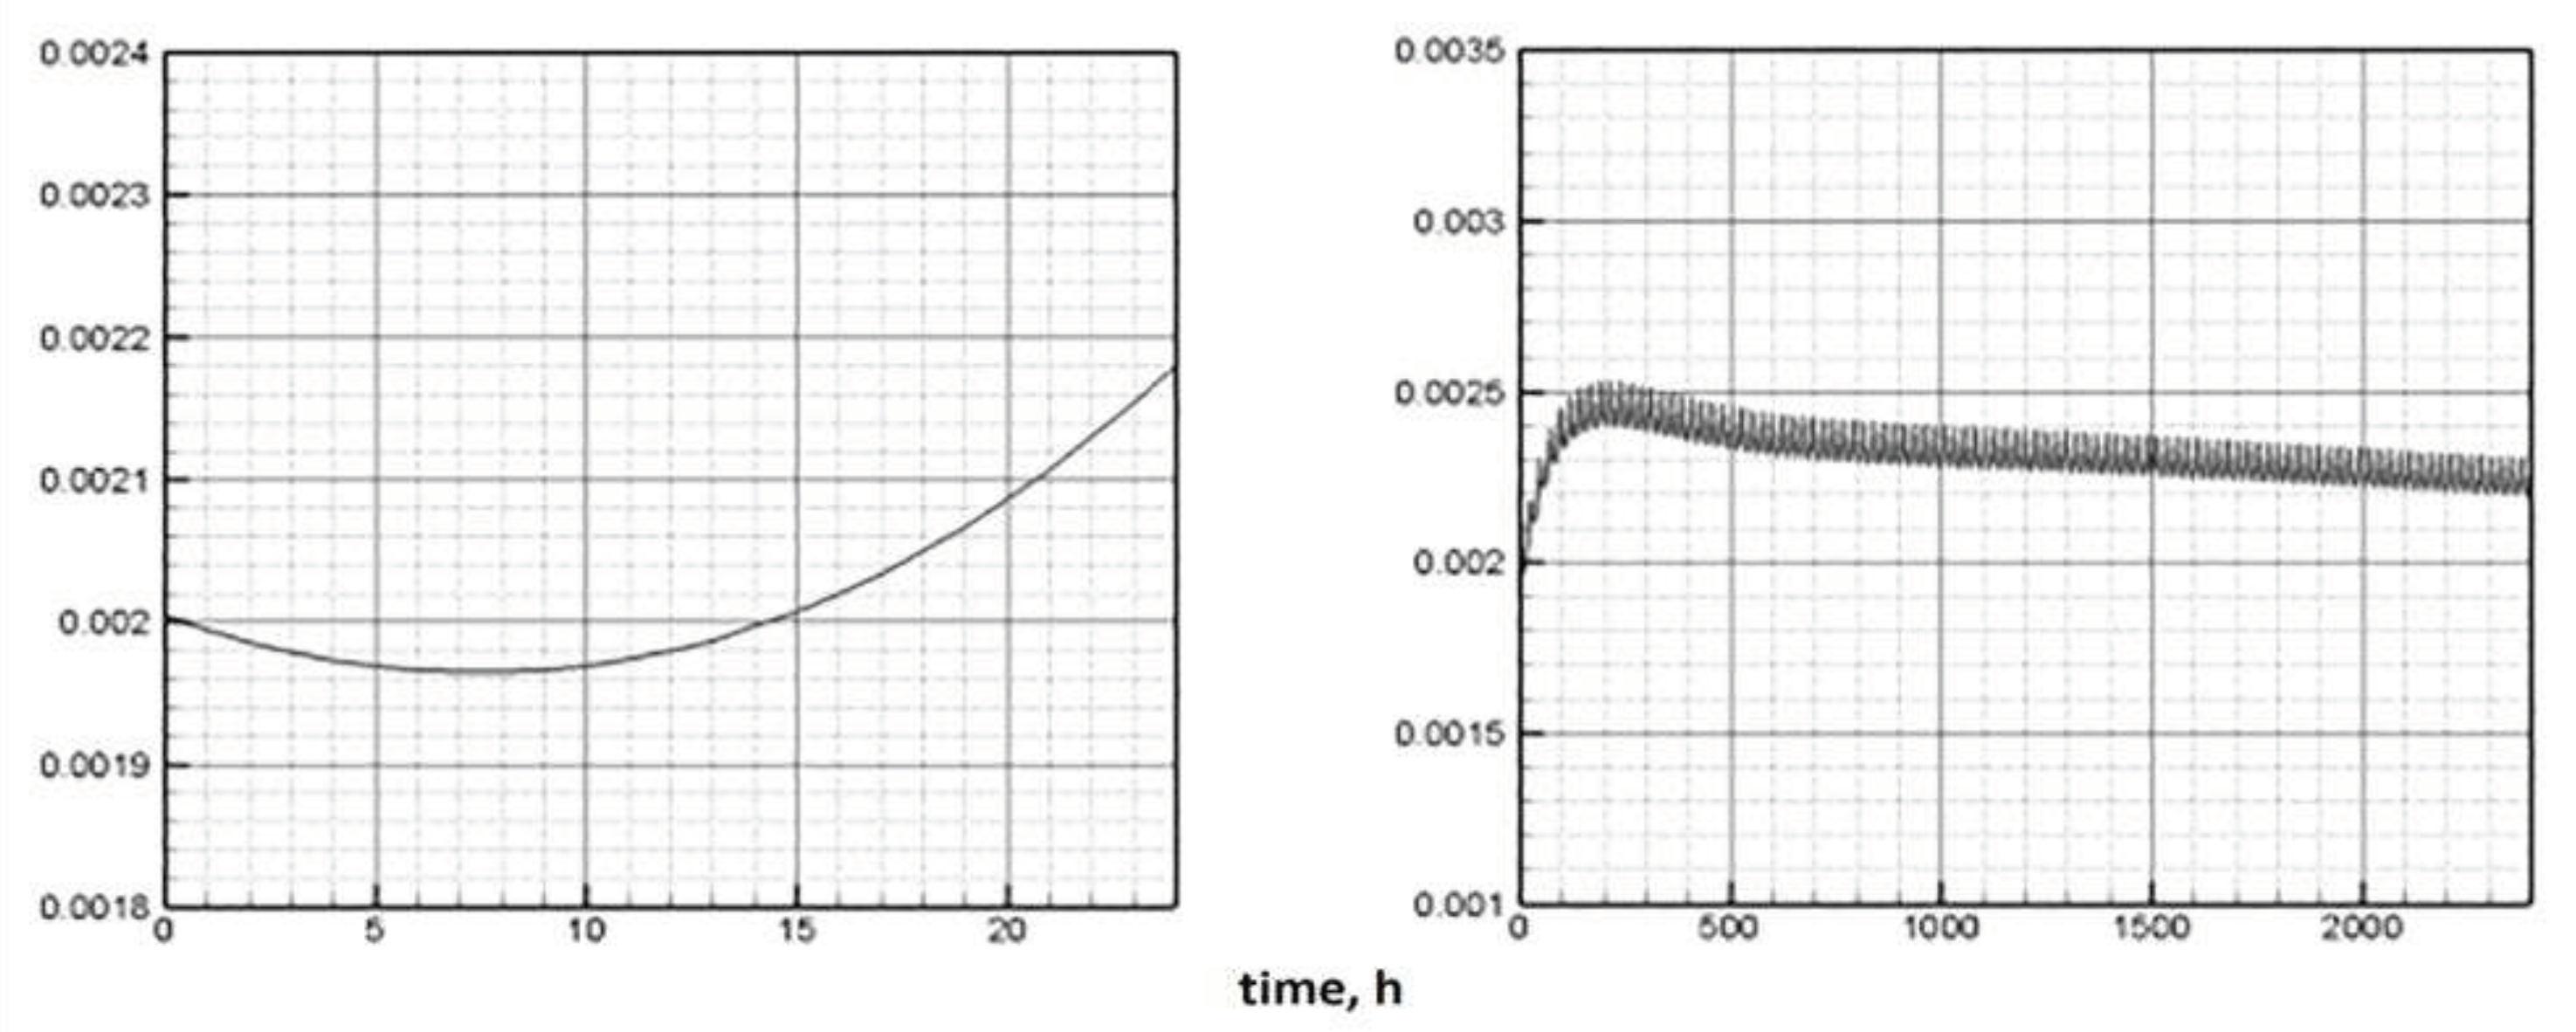
Figure 8.
Dynamics of ATP under a periodic lighting change (one day on the left, 100 days on the right). Daily period of light is 12 hours.
Figure 8.
Dynamics of ATP under a periodic lighting change (one day on the left, 100 days on the right). Daily period of light is 12 hours.
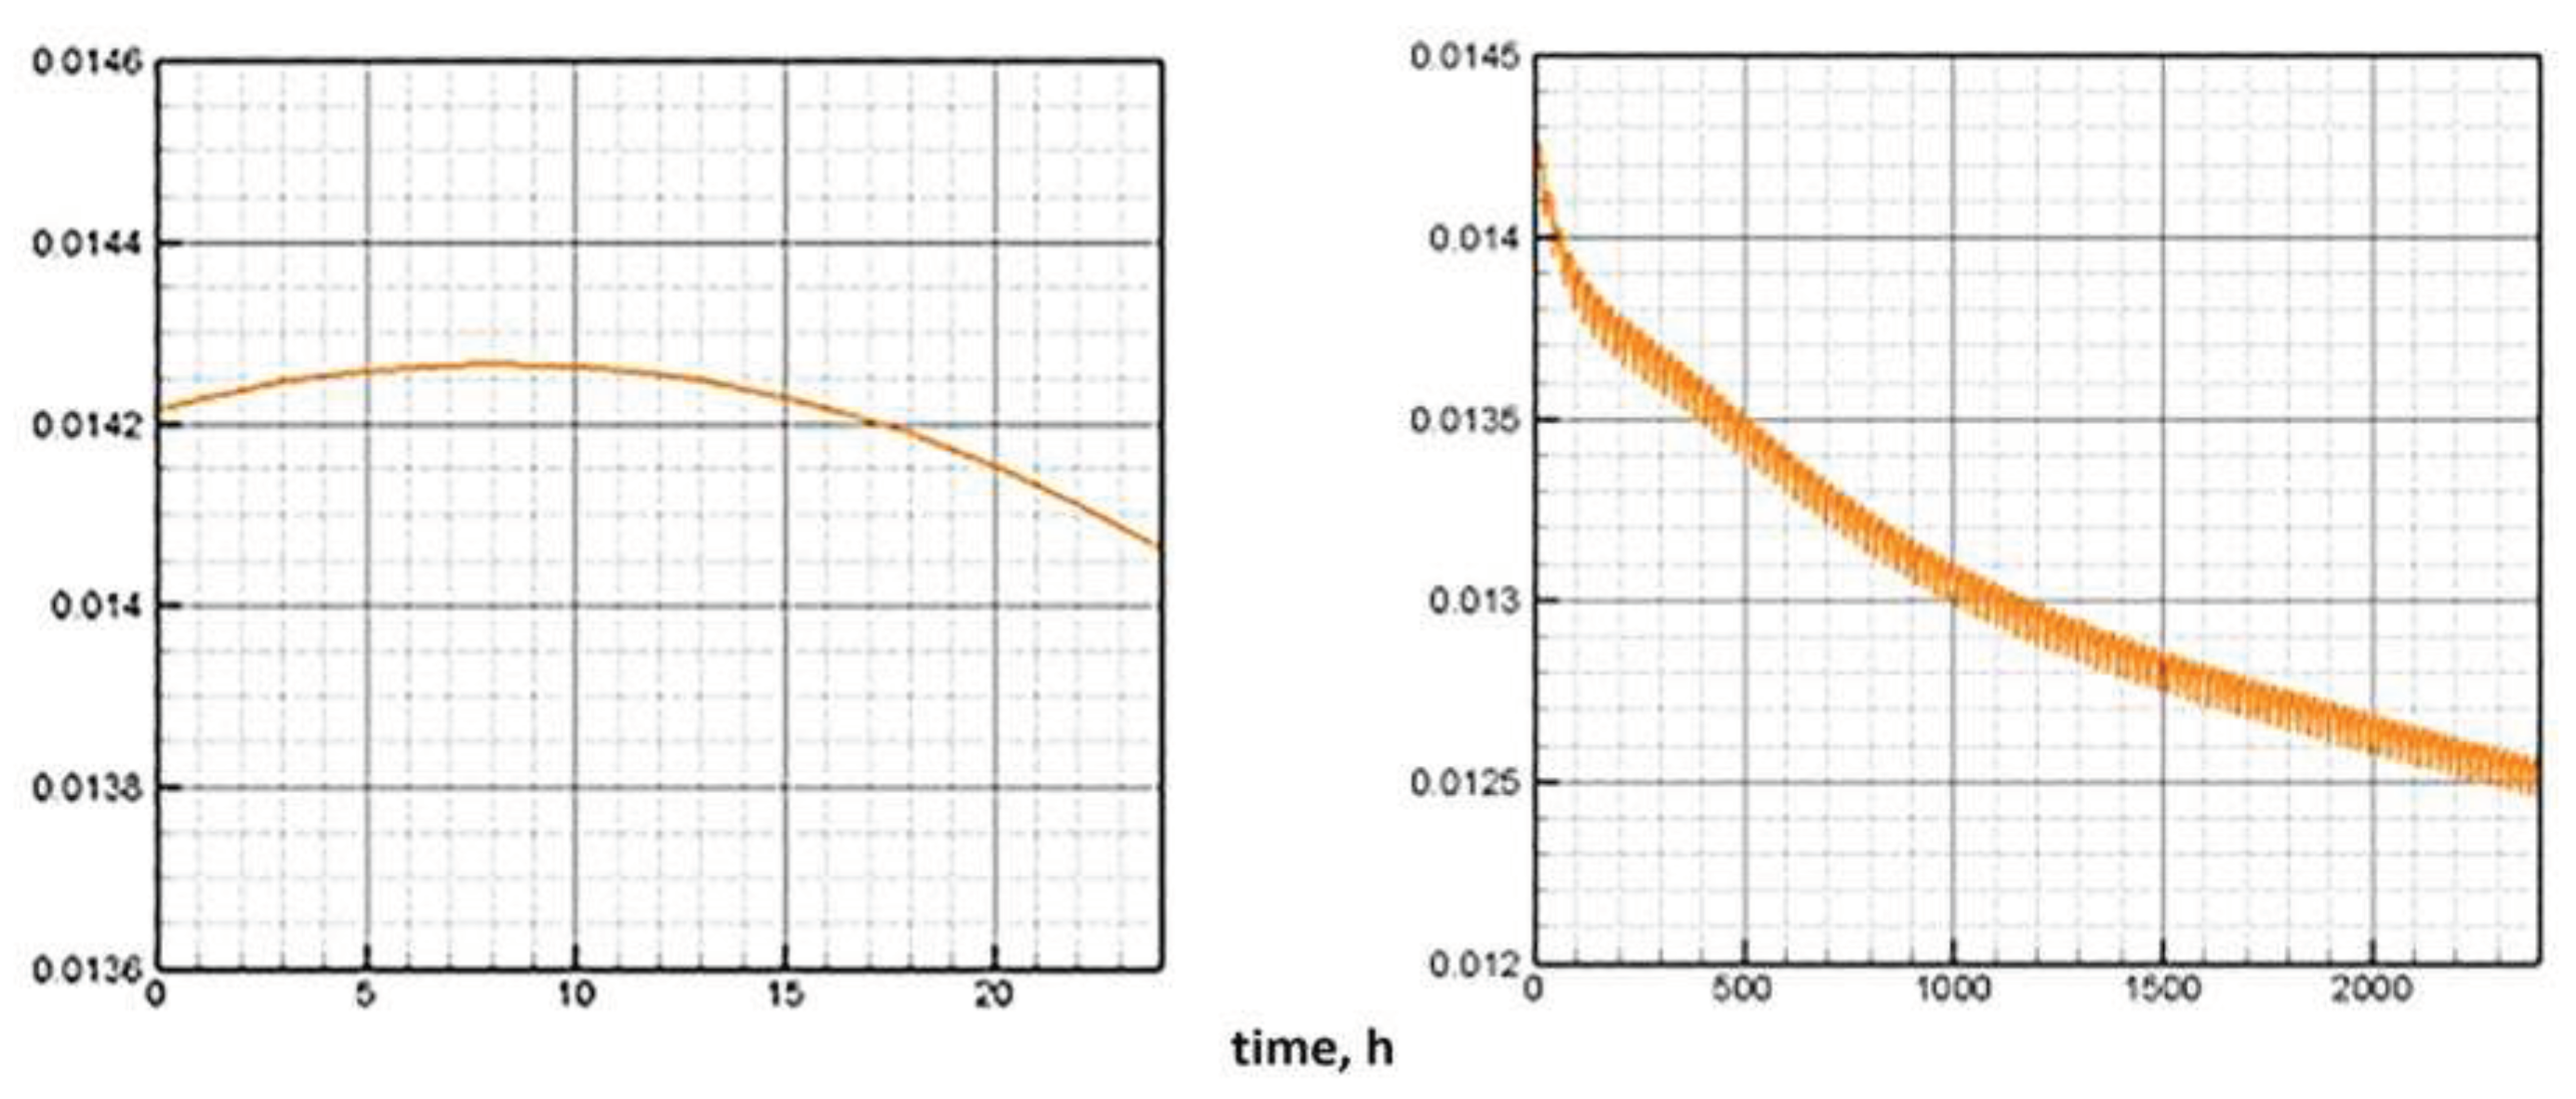
Figure 11.
Comparative annual dynamics of the main components of models C and E.
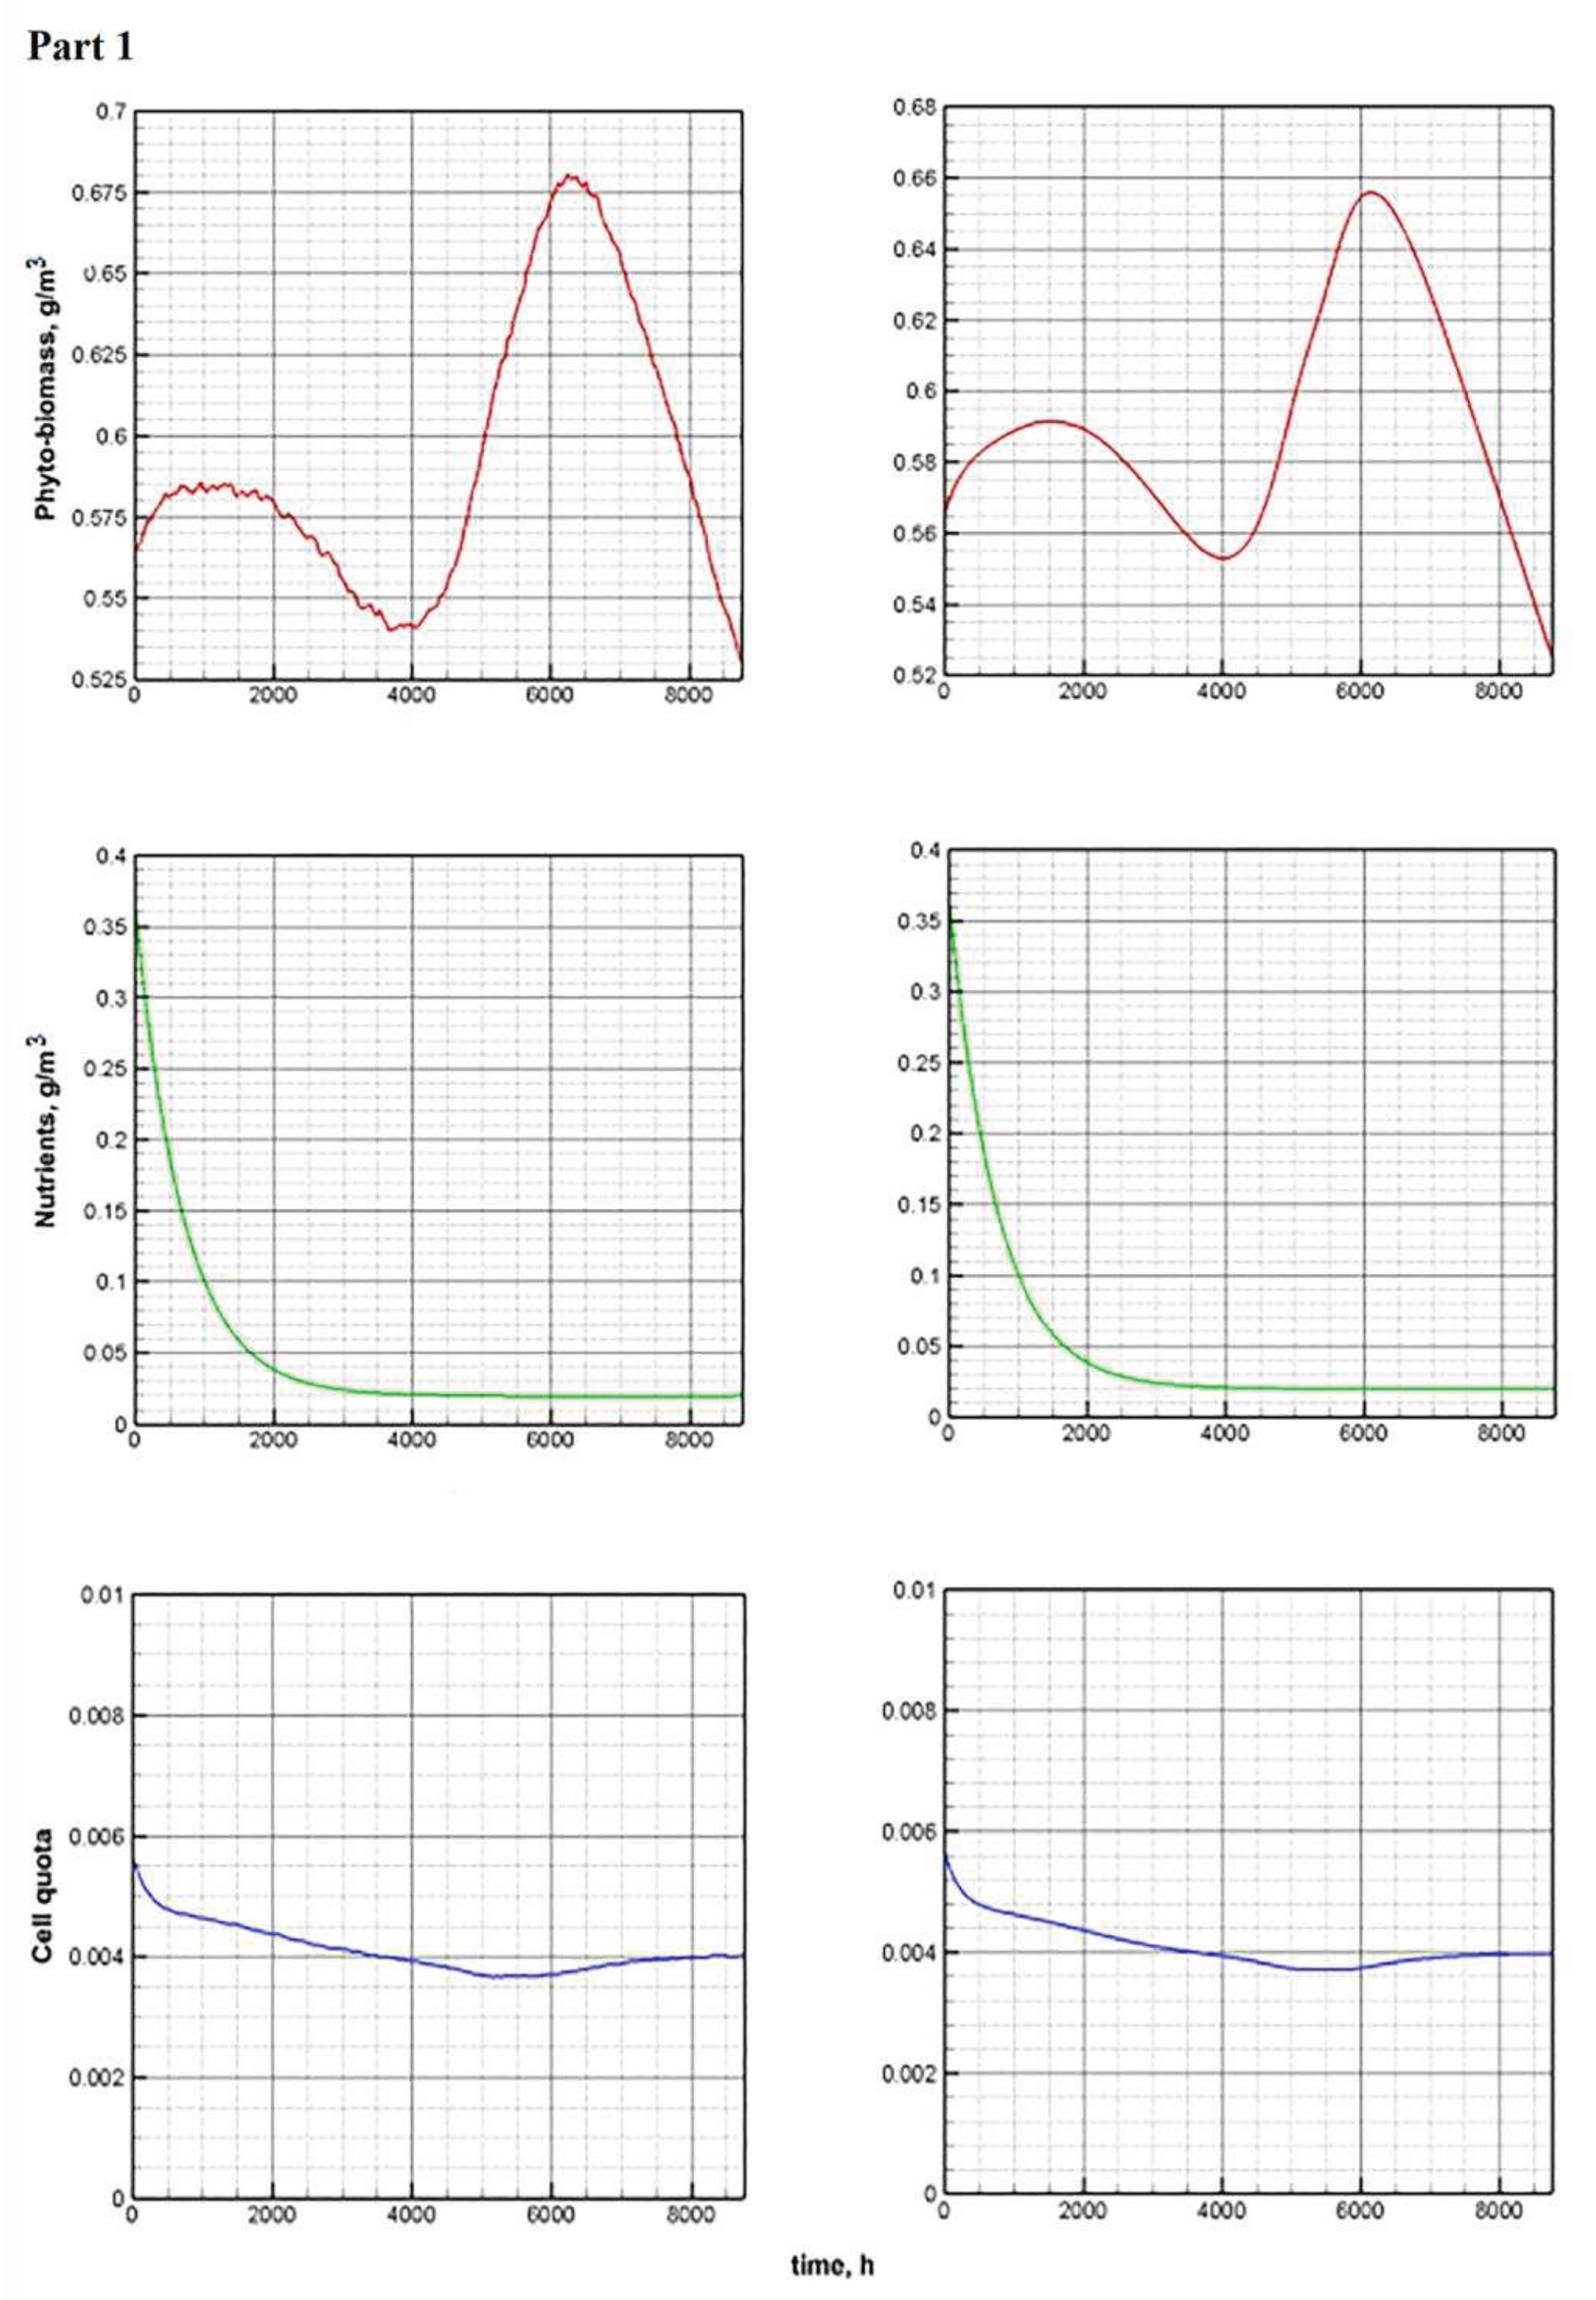
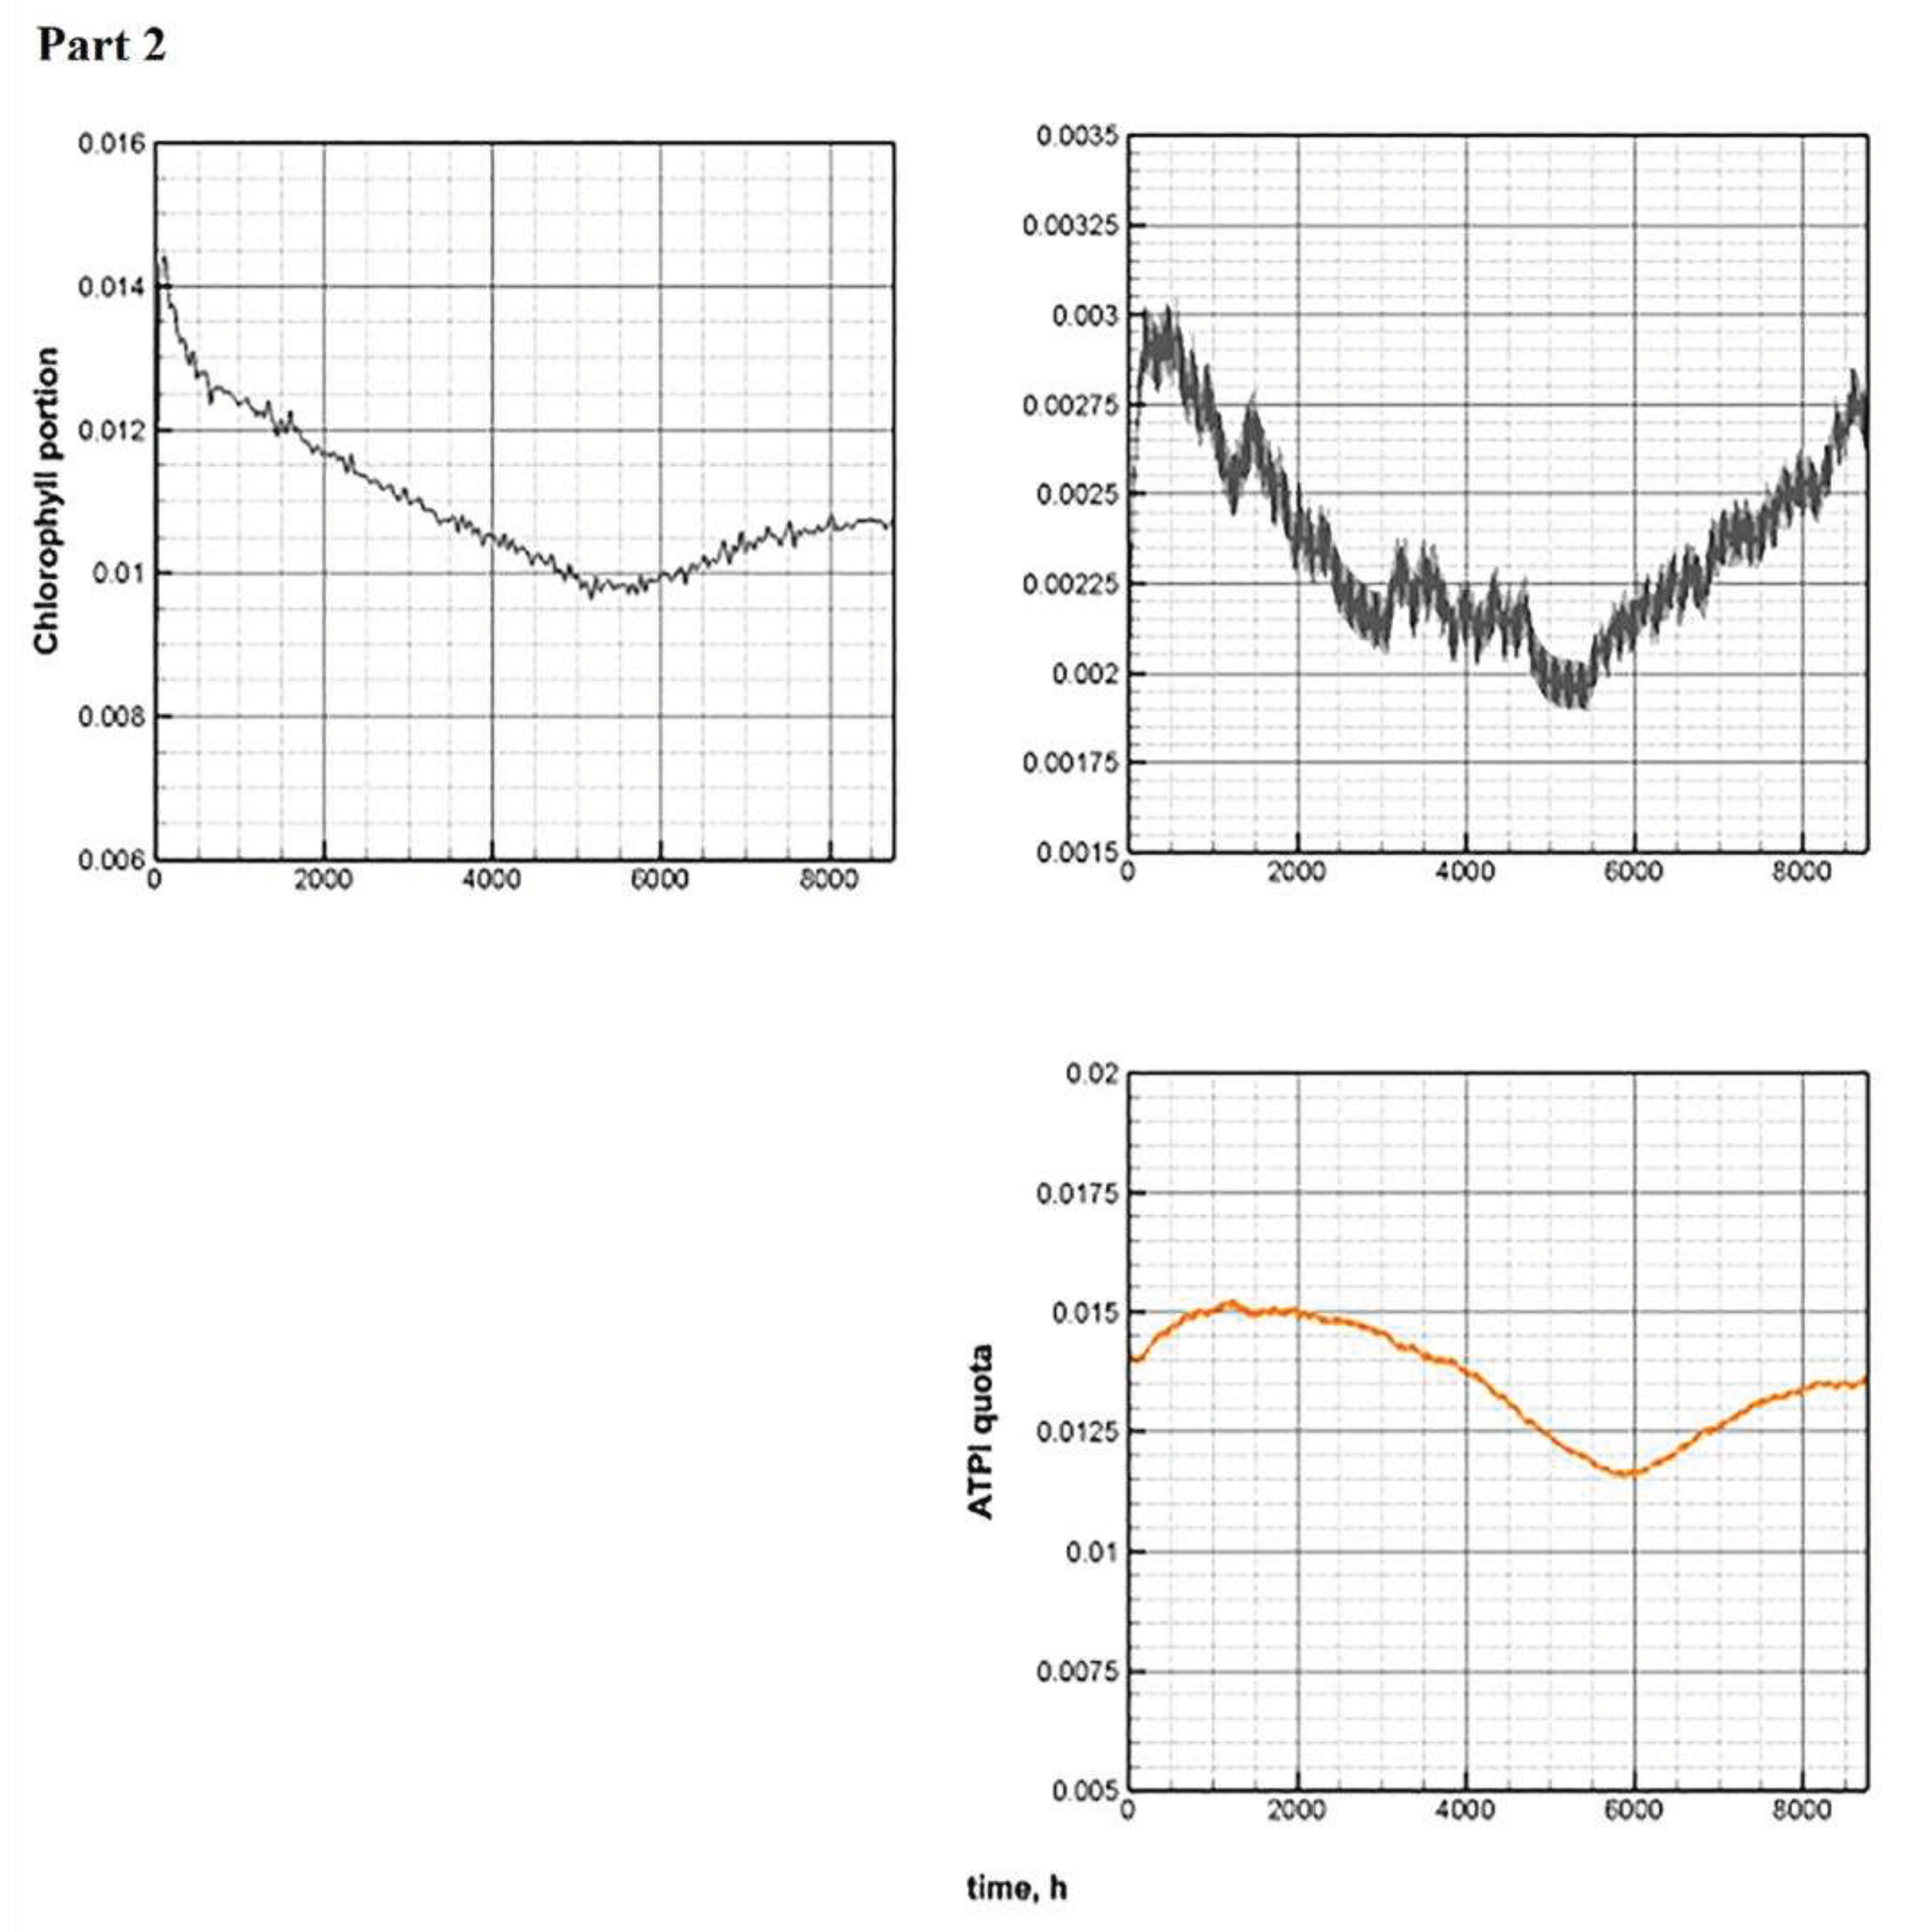
Figure 12.
Annual fluctuations in biomass obtained as a result of solving the optimal control problem (5.4).
Figure 12.
Annual fluctuations in biomass obtained as a result of solving the optimal control problem (5.4).
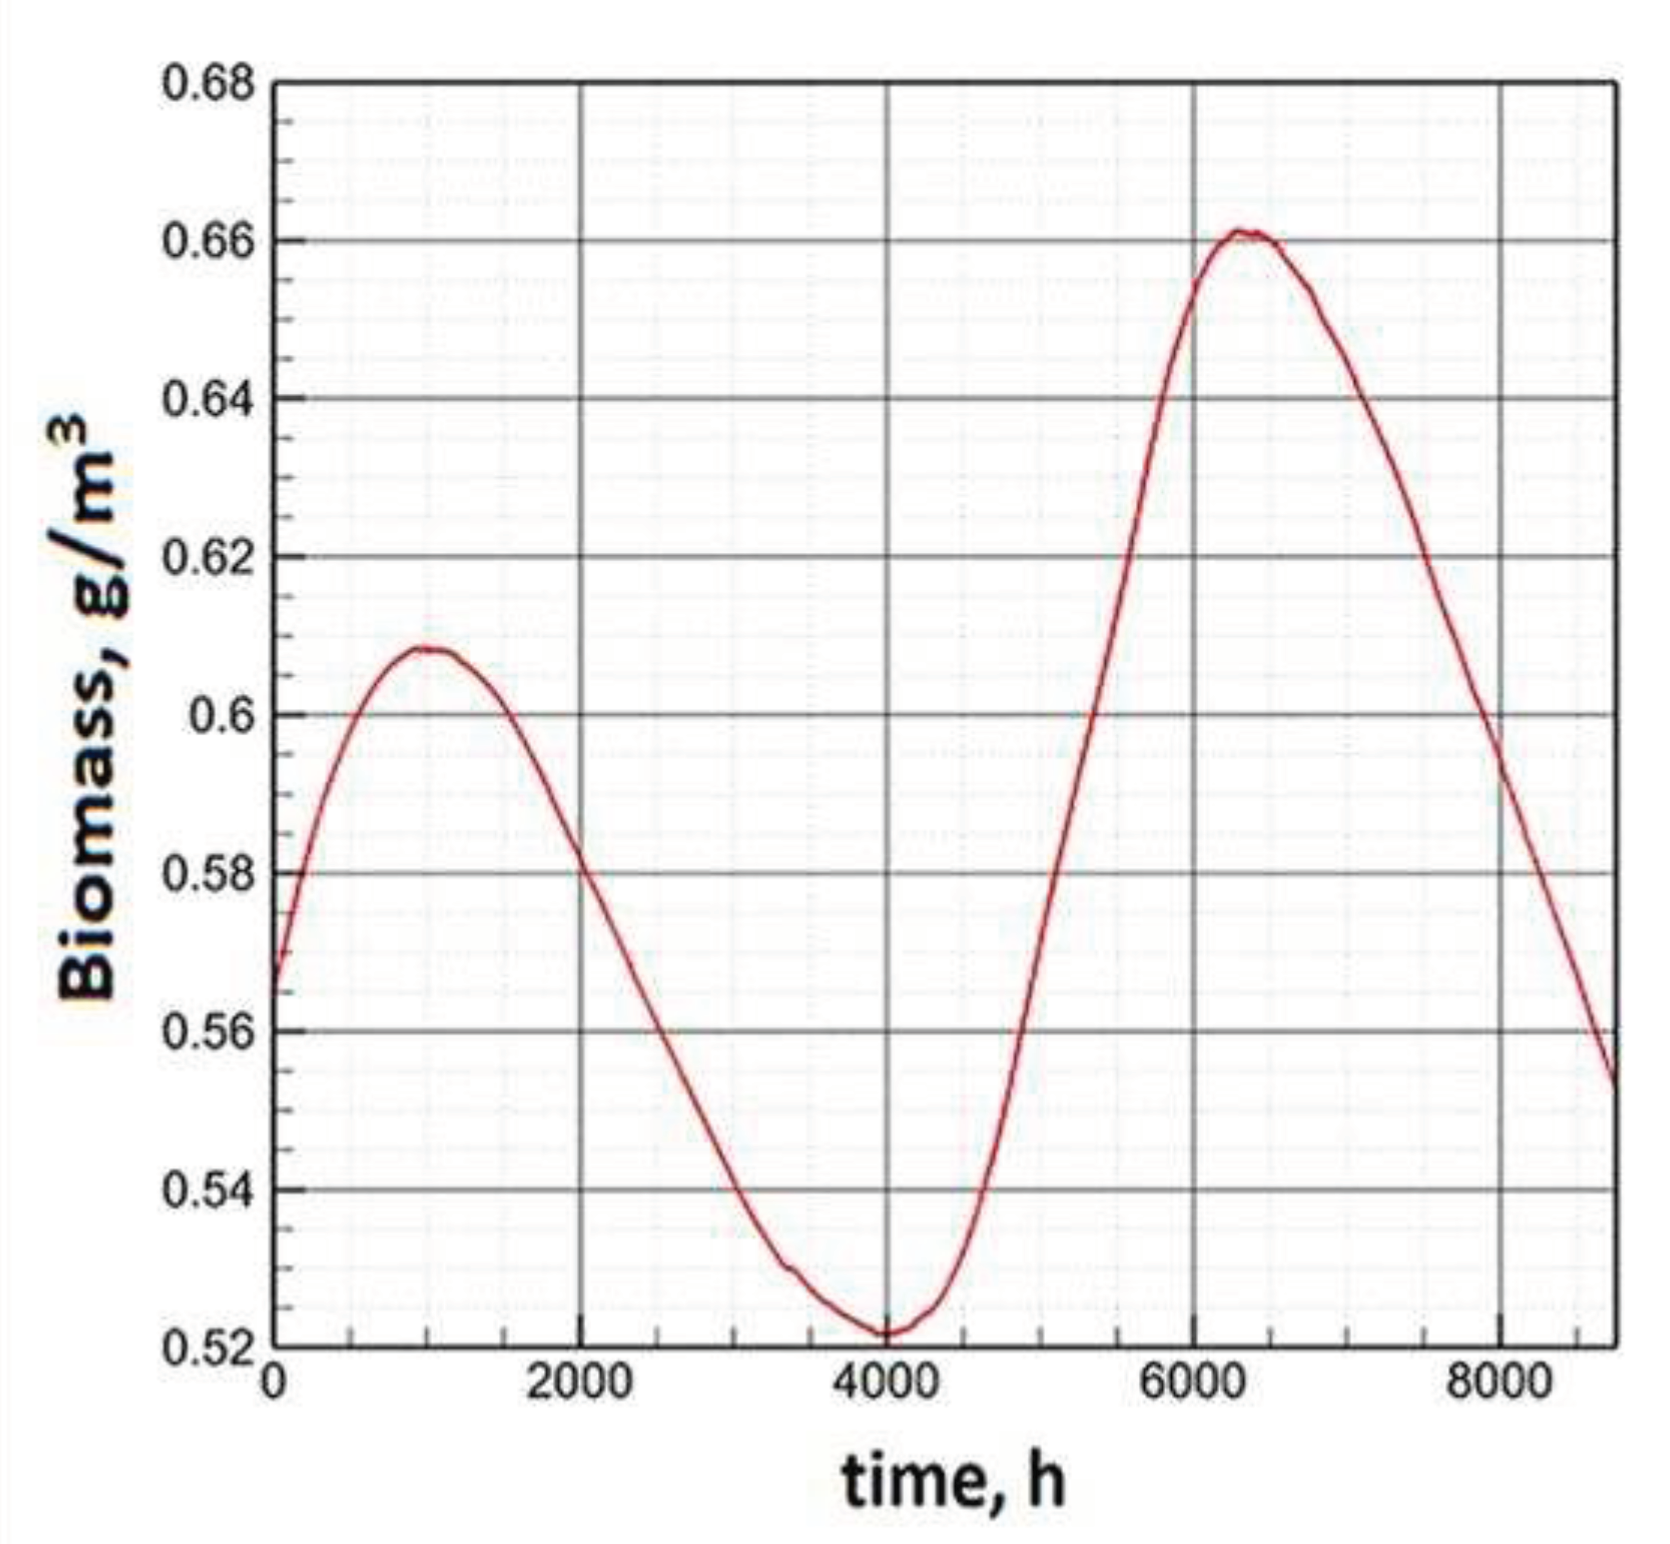
Figure 13.
Annual dynamics of biomass under climate change, winter cooling (left) and summer warming (right).
Figure 13.
Annual dynamics of biomass under climate change, winter cooling (left) and summer warming (right).
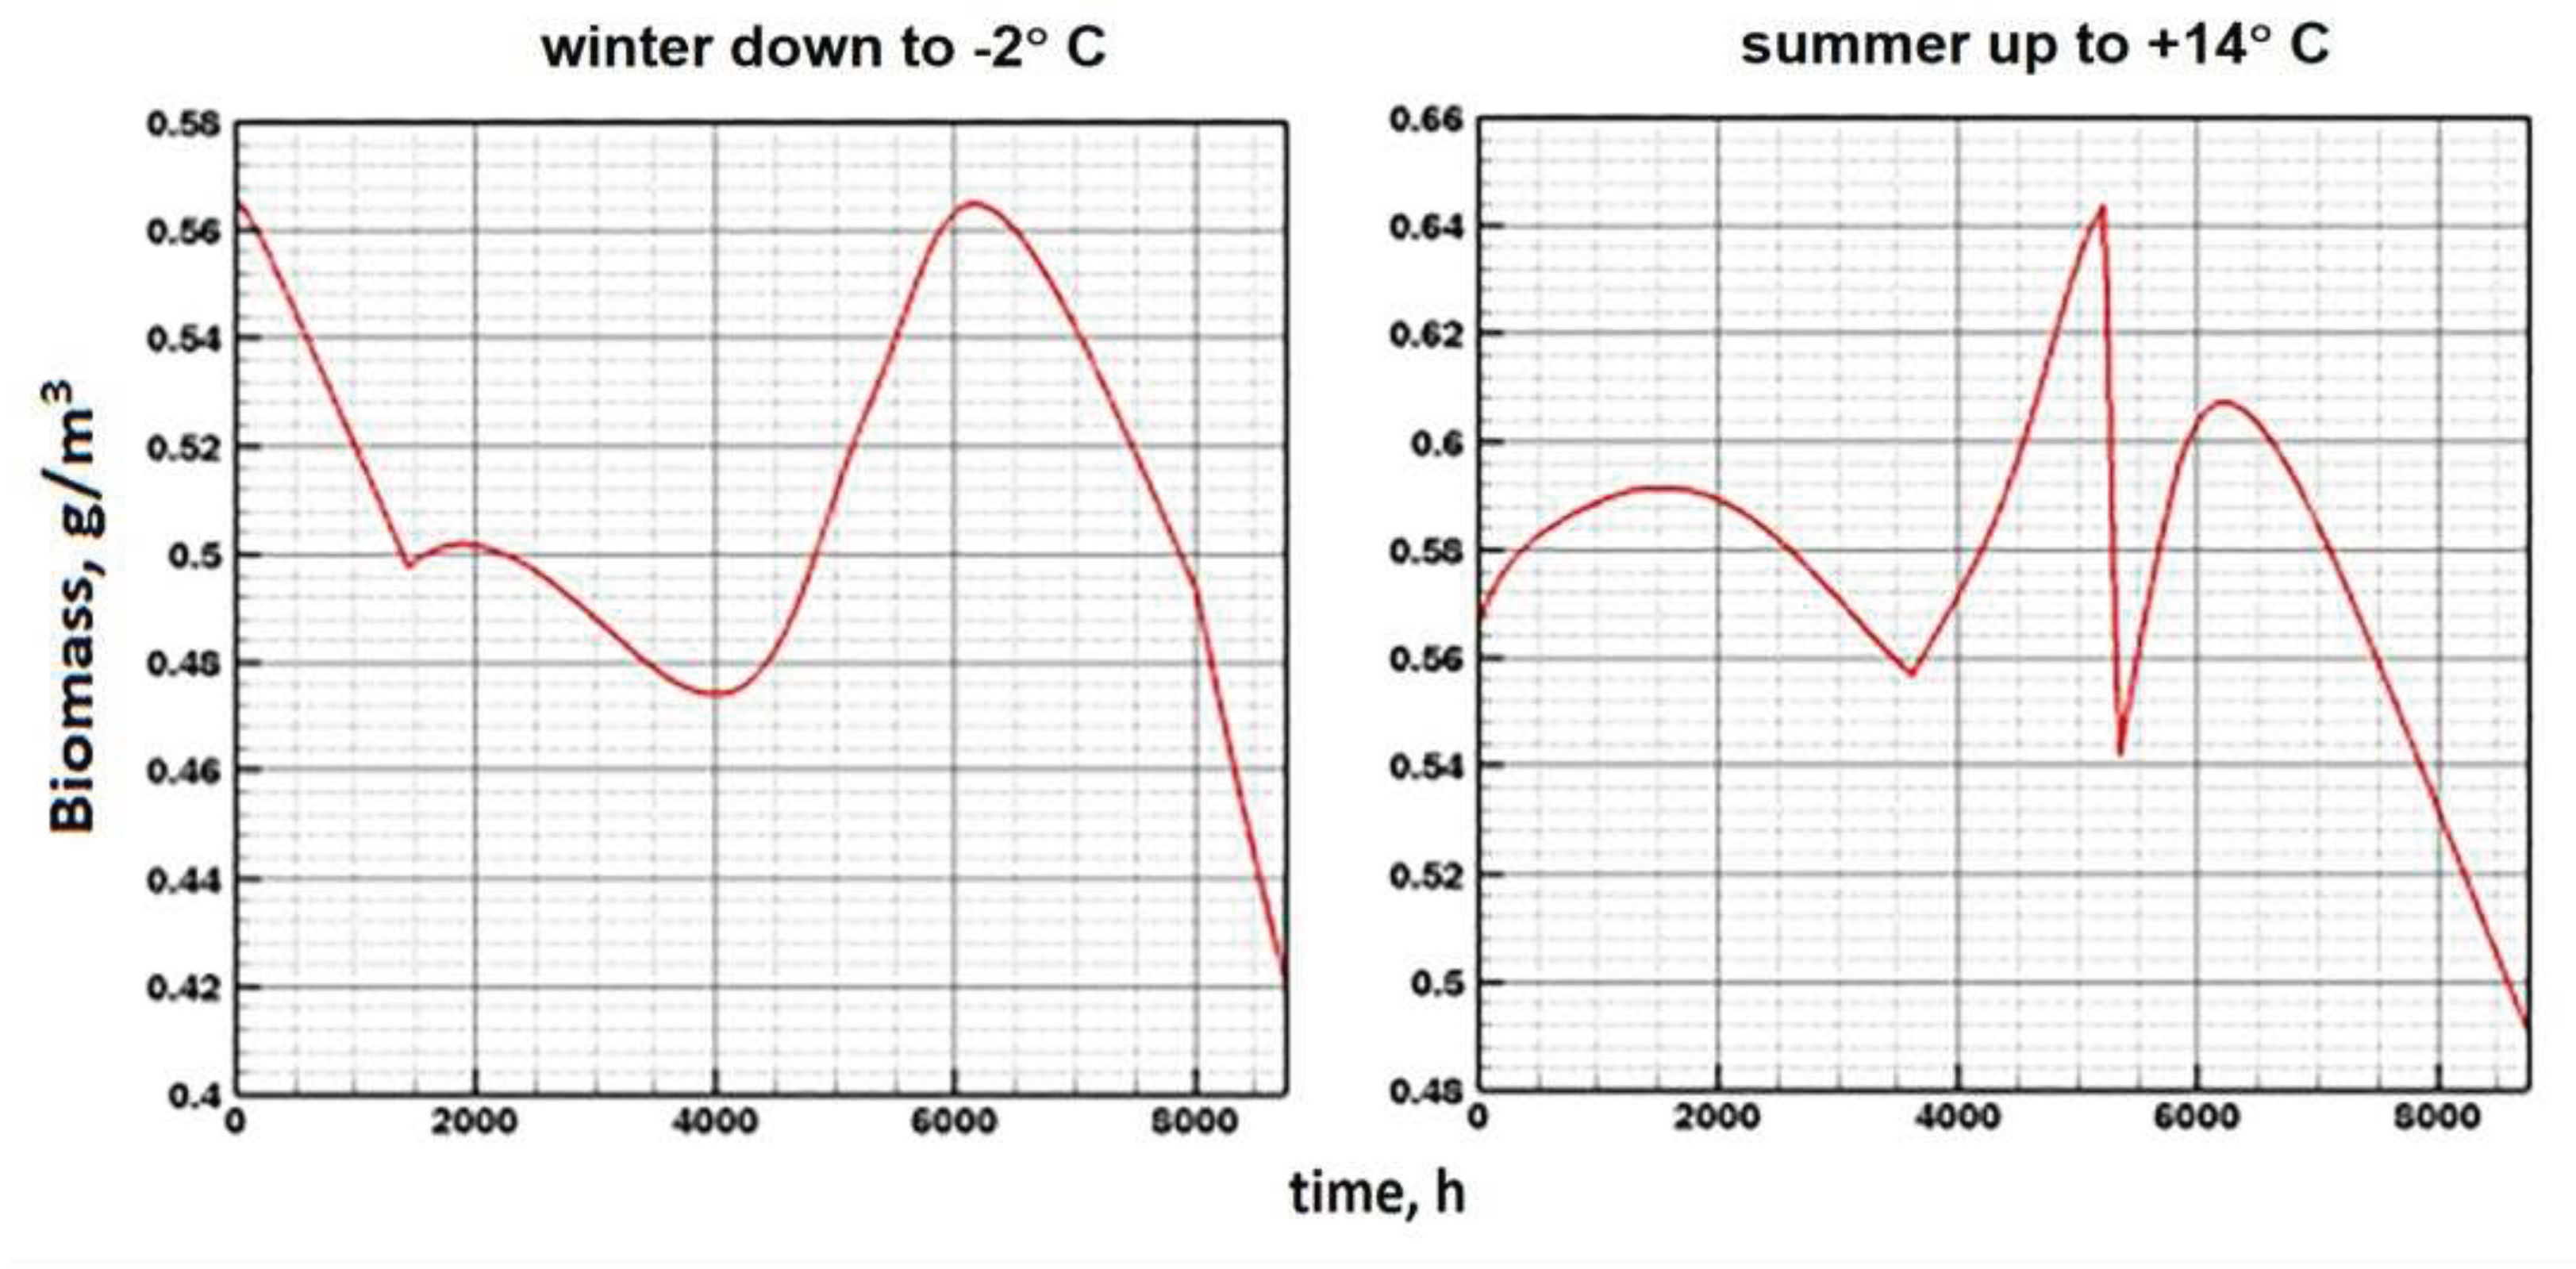
Figure 14.
Annual dynamics under climate change, winter cooling (left) and summer warming (right). The value β is increased by 0.005.
Figure 14.
Annual dynamics under climate change, winter cooling (left) and summer warming (right). The value β is increased by 0.005.
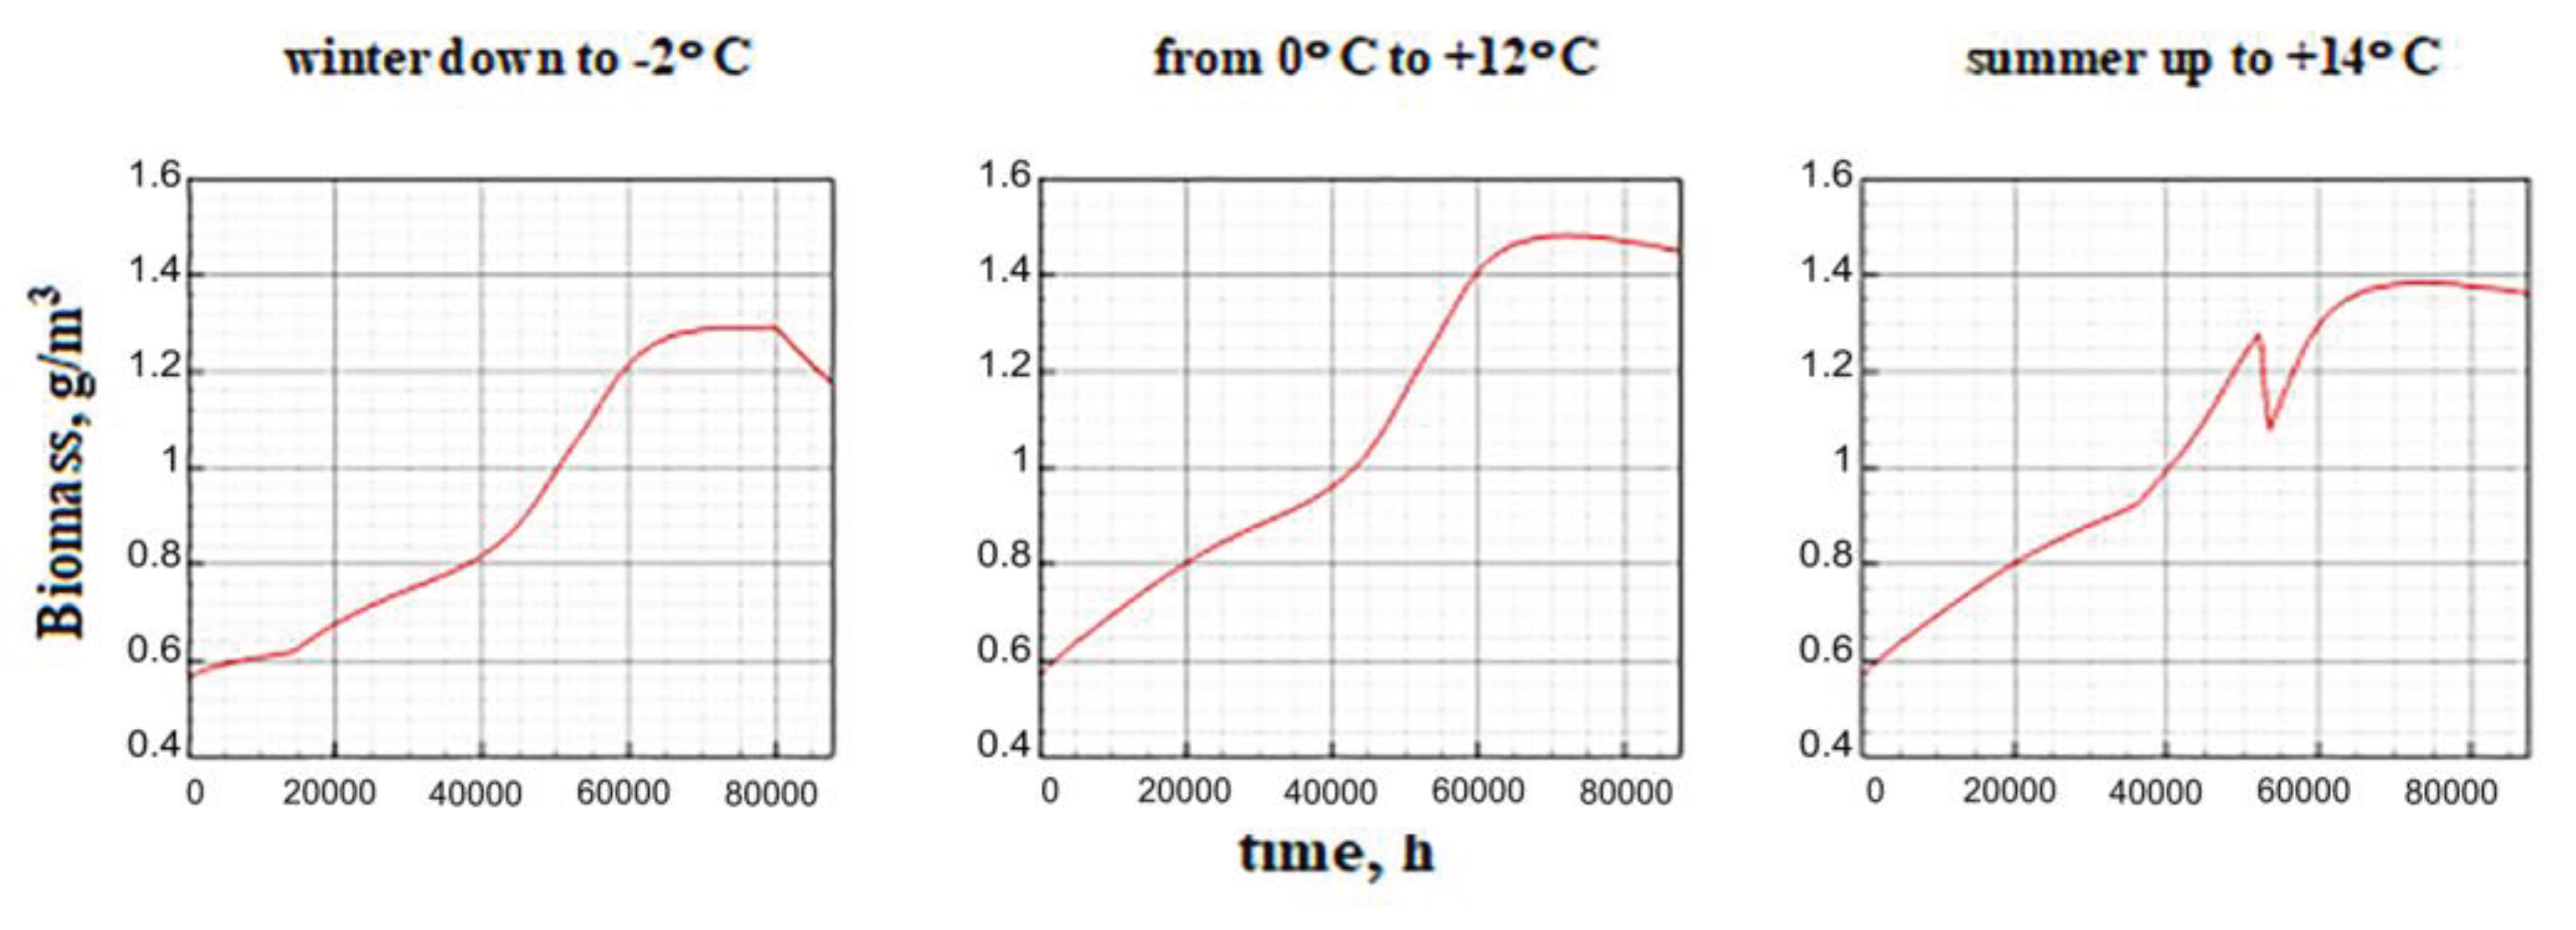
Figure 15.
Long-term dynamics of biomass under different values β and climatic fluctuations.
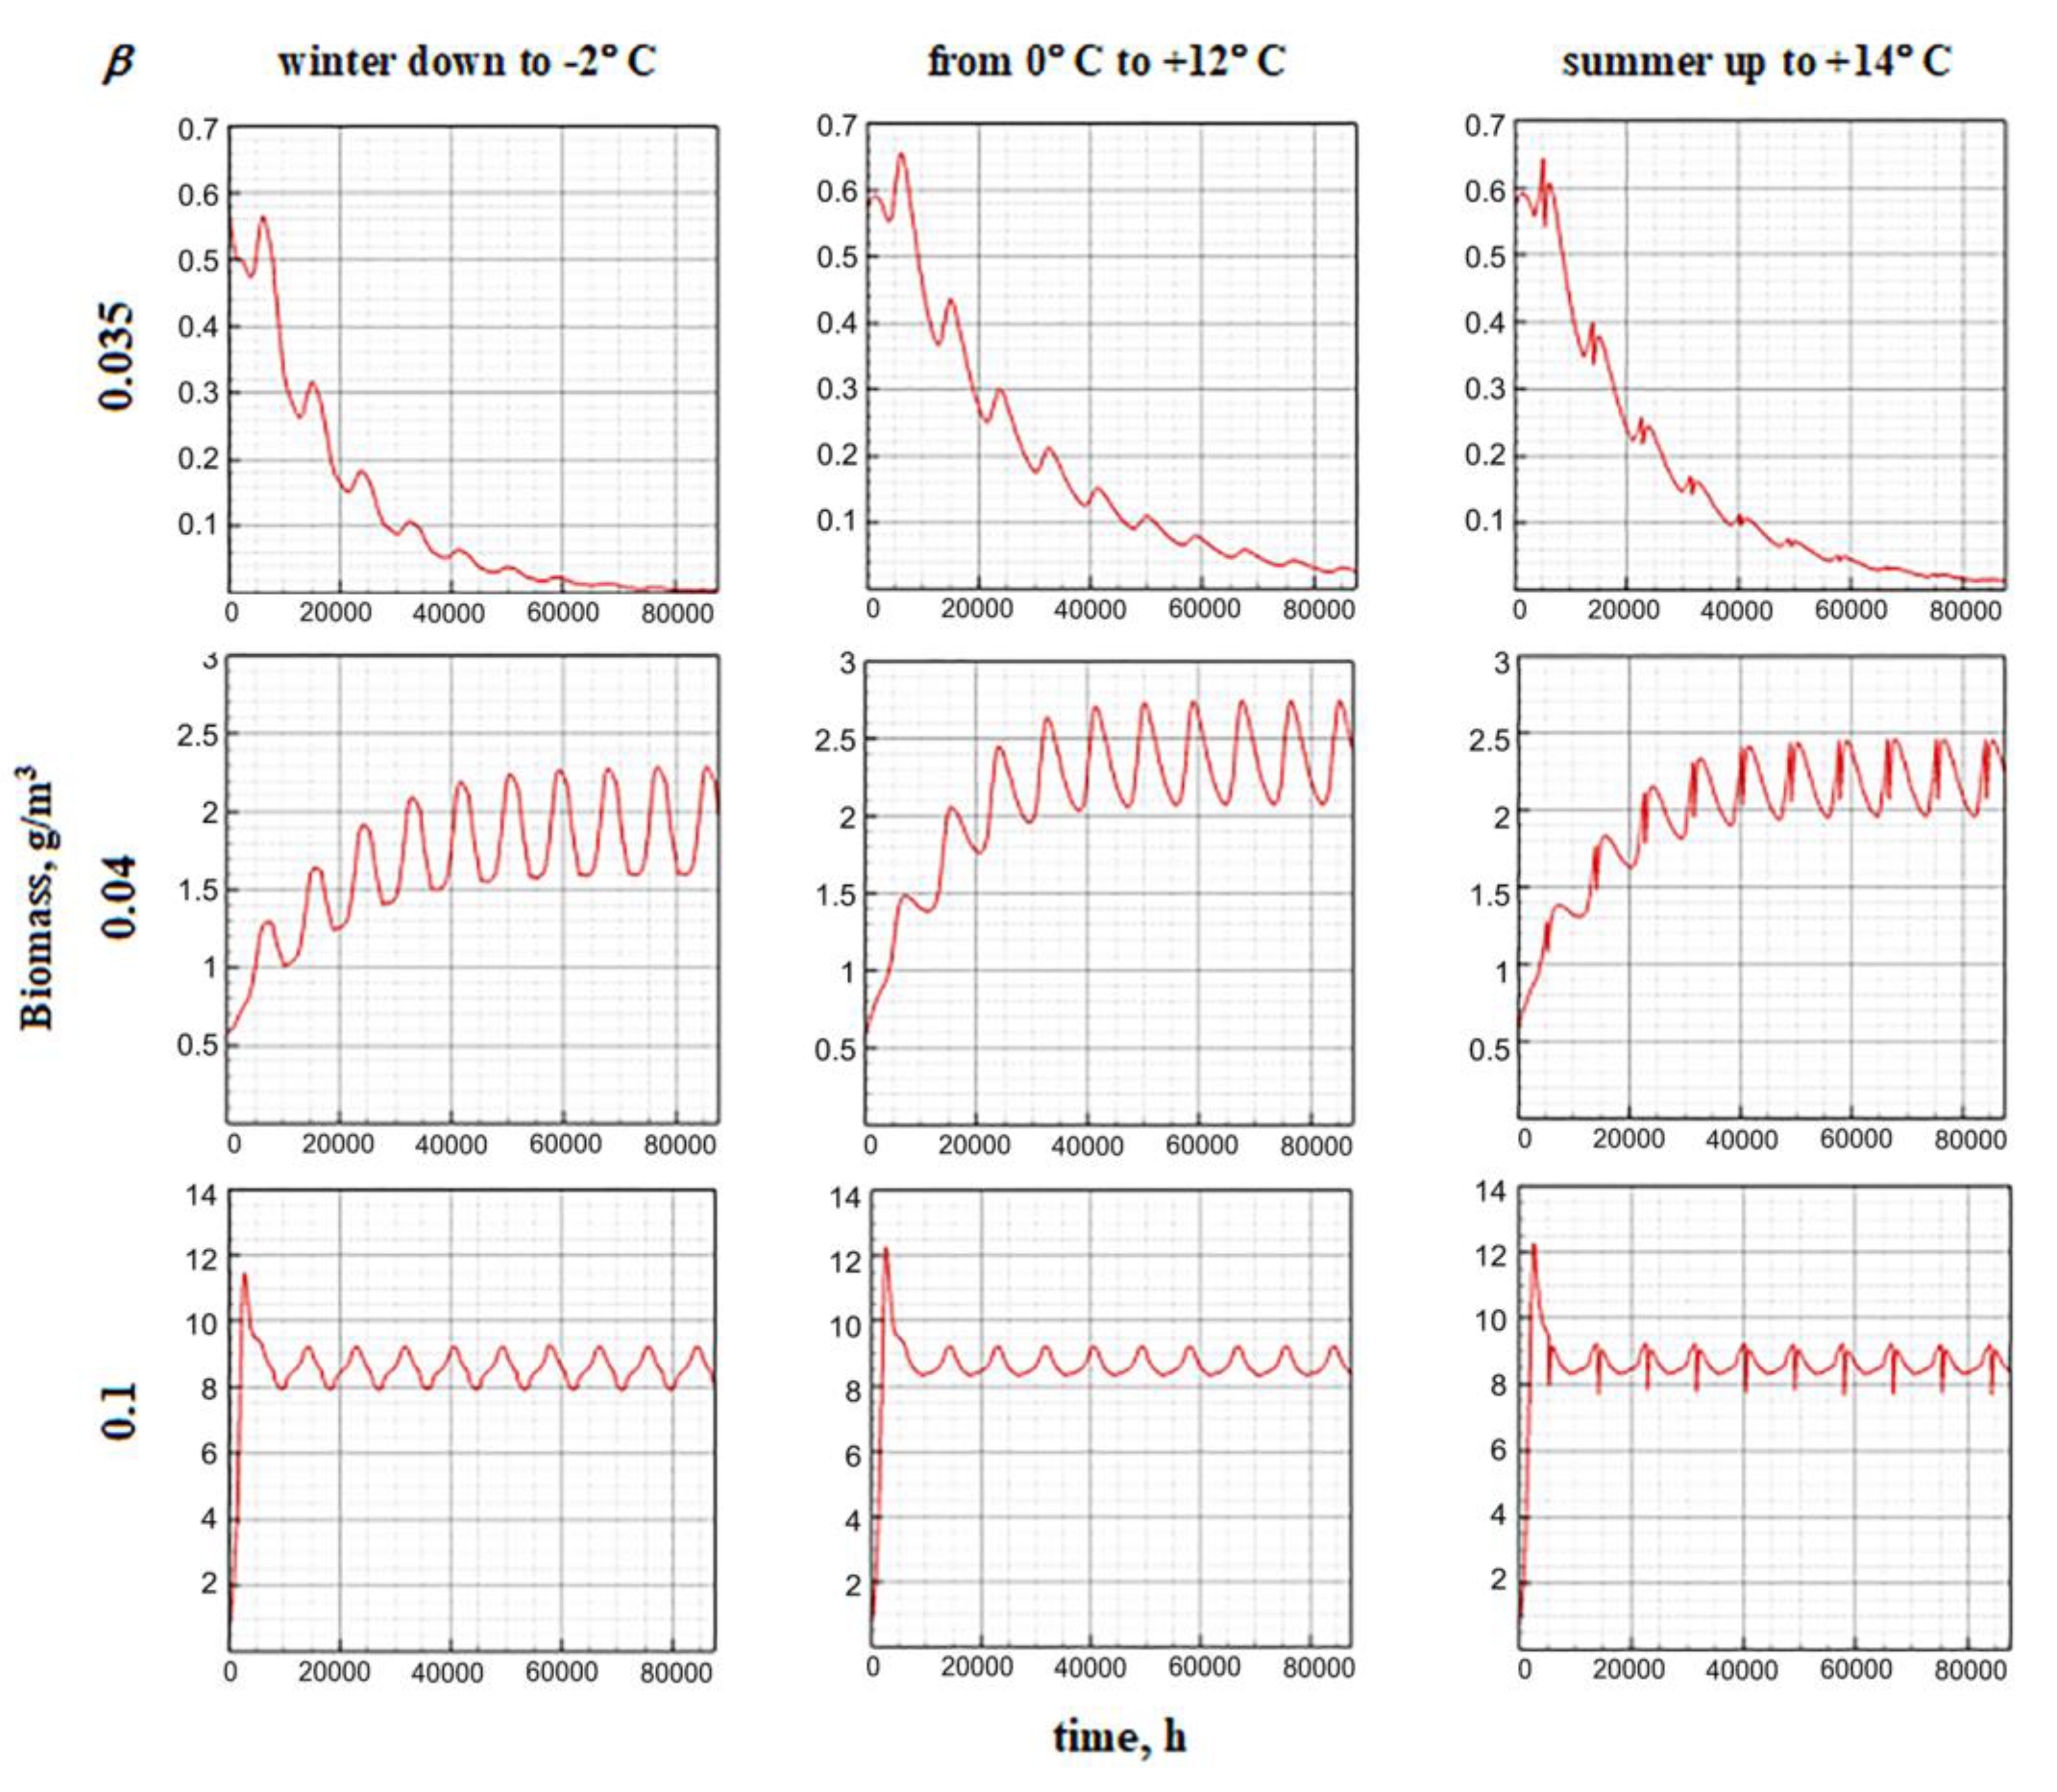
Figure 16.
Influence of the minimum cell quota and the proportion of ATP involved in photosynthesis on the equilibrium values of the specific biomass.
Figure 16.
Influence of the minimum cell quota and the proportion of ATP involved in photosynthesis on the equilibrium values of the specific biomass.
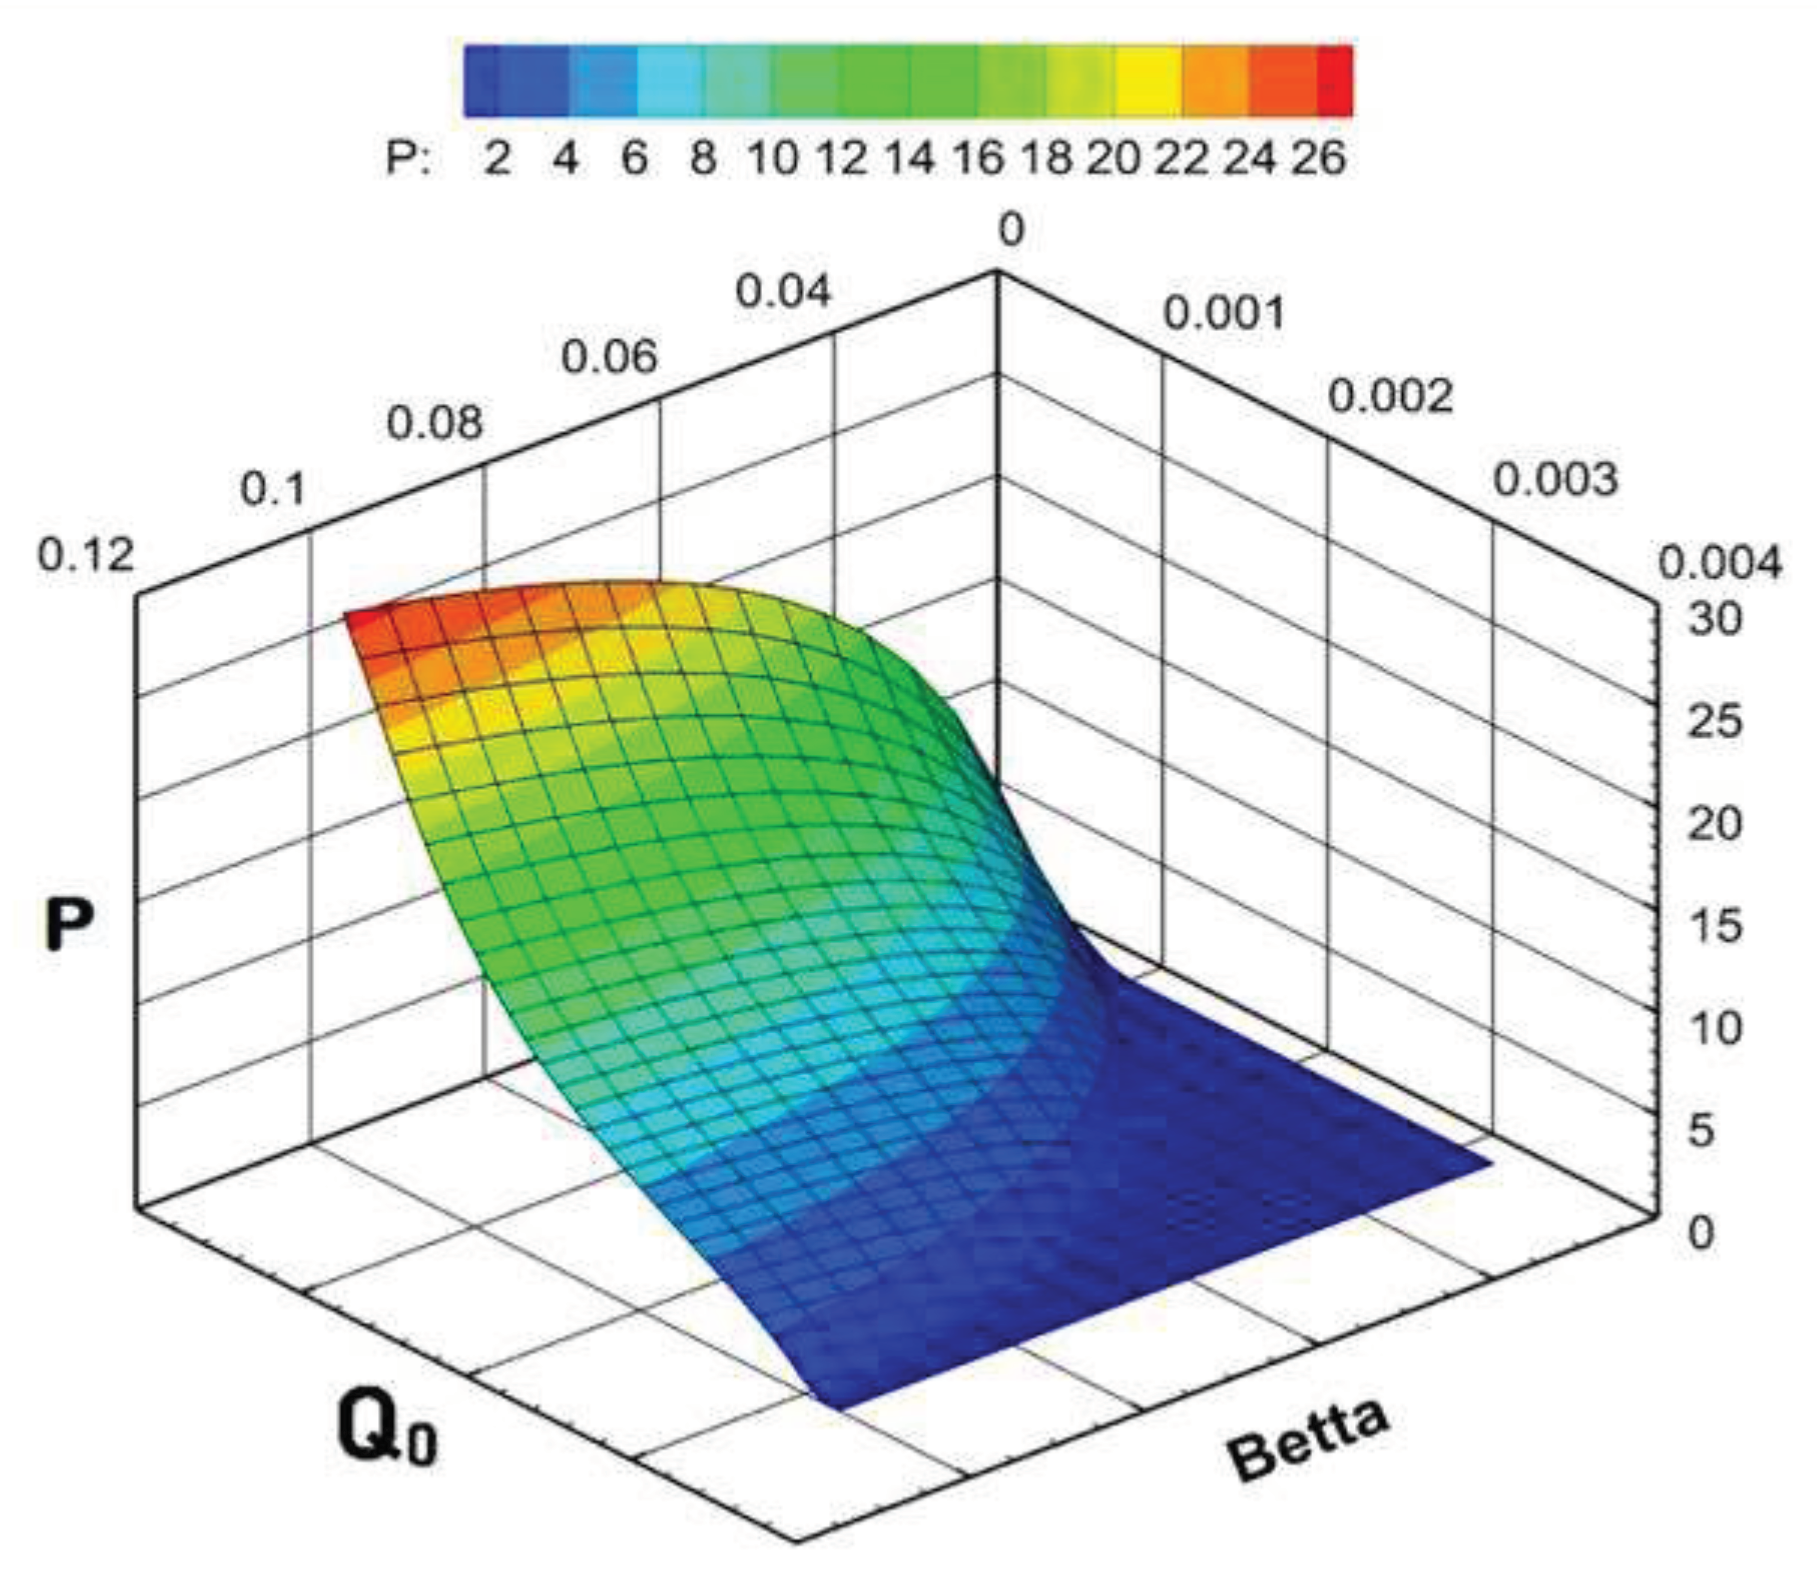

Table 1.
Data for research.
| Name | Denote | Measure units | Value |
|---|---|---|---|
| Maximal of growth velocity | μ0 | 1/hour | 0.09 |
| Semi-saturation constant by nutrientes by illumination |
s0 I0 |
g/m3 E/(m2 hour) |
0.014 1.25 |
| Optimum temperature for phytoplankton growth | Topt | °C | 10.0 |
| Minimum temperature for phytoplankton growth | T0 | °C | 0.0 |
| Maximum temperature for phytoplankton growth | T1 | °C | 20.0 |
| Maximum nutrient absorption rate | ν0 | 1/hour | 1.95·10–5 |
| Flow rate | D | 1/hour | 0.00145 |
| Concentration of nutrients in the input stream | sin | g/m3 | 0.022 |
| Minimum cell quota | Q0 | – | 0.0015 |
| Maximum cell quota | Q1 | – | 0.0075 |
| Proportion of biomass associated with the light stage of photosynthesis | α | – | 0.037 |
| Proportion of biomass associated with the dark stage of photosynthesis | α0 | – | 0.025 |
| Maximum proportion of chlorophyll in phytoplankton | cm | – | 0.04 |
| Proportion of chlorophyll consumed in the light stage of photosynthesis | ρ | – | 1·10–3 |
| Maximum rate of chlorophyll quota change | γ0 | 1/hour | 1·10–3 |
| Proportion of phytoplankton biomass generated from stored energy-intensive substances | β | – | 0.035 |
| Maximum of proportion of chlorophyll consumed in the light stage of photosynthesis | δ0 | – | 0.04 |
| Proportion of chlorophyll involved in energy-intensive substances | ε | – | 1 |
| Minimum proportion of energy-intensive substances required to initiate enzymatic reaction | r0 | – | 0.002 |
∗ E denotes one Einstein=one mole photons.
Disclaimer/Publisher’s Note: The statements, opinions and data contained in all publications are solely those of the individual author(s) and contributor(s) and not of MDPI and/or the editor(s). MDPI and/or the editor(s) disclaim responsibility for any injury to people or property resulting from any ideas, methods, instructions or products referred to in the content. |
© 2023 by the authors. Licensee MDPI, Basel, Switzerland. This article is an open access article distributed under the terms and conditions of the Creative Commons Attribution (CC BY) license (http://creativecommons.org/licenses/by/4.0/).
Copyright: This open access article is published under a Creative Commons CC BY 4.0 license, which permit the free download, distribution, and reuse, provided that the author and preprint are cited in any reuse.


