
Submitted:
05 June 2023
Posted:
06 June 2023
You are already at the latest version
Abstract
It has been known for nearly over 150 years that fatigue life data exhibits a considerable amount of variability. Furthermore, statistically modeling fatigue life adequately is challenging. Different empirical approaches have been used, each of which has merit; however, none is appropriate universally. Even when a sufficiently robust database exists, the scatter in the fatigue lives may be extremely large and difficult to characterize. The complications in empirical modeling are exacerbated for long life estimation when experimental observations are rare. The purpose of this work is to review traditional and more modern empirically based methodologies for estimating the cumulative distribution functions for fatigue life, given an applied load. To assess the applicability of the methods confidence bounds will be estimated. The analyses will be performed on an historic set of data for annealed aluminum wire tested in reverse torsion fatigue. These data are available in publications. It is recommended that a time dependent distribution function that is an based on principles of reliability that can be generalized for a variety of modeling applications should be considered for fatigue life estimation.
Keywords:
fatigue life
; mean square error
; statistical modeling
; stress – life modeling
; Weibull distribution function
1. Introduction
It is universally accepted that an essential characteristic of fatigue is variability in life data. These data often range over an order of magnitude, and sometimes even more [1]. The reasons for this scatter can be categorized as epistemic and aleatoric uncertainty. Error cannot be eliminated from experimentation; material microstructure cannot be explicitly prescribed; and processing cannot be controlled perfectly. An excellent paper on the history of fatigue was written by Schütz [2], in which, he credits Wöhler [3] as the first to implicitly consider scatter in fatigue data. One of the first times that scatter was addressed was in the book by Moore and Kommers [4]. They include the following footnote on page 168: “So far as the writers have been able to ascertain, the term "scatter" as applied to the irregularity shown by plotted test data was coined by Prof. G. B. Upton of Cornell University.”
One of the earliest research efforts which develops rich fatigue life databases is contained in the paper by Ravilly [5]. The testing procedure, microstructure, and manufacturing of those wires may not have been as controlled as is the case currently. Scatter between different applied loads and replicates for each given loading condition should be expected. These datasets are some of the very first in the open literature in which systematic experimental investigations of fatigue that were conducted for multiple stress levels and for which an adequate number of replicates were performed in order to make a statistical analysis possible. Consequently, these data are considered herein to focus on statistical modeling rather than the experimental or processing techniques.
Freudenthal extensively statistically analyzed Ravilly’s data [5] in a series of publications. In [6] he considered the annealed aluminum wire data, the annealed Armco iron wire, and the annealed electrolytic copper wire. As an aside, Armco stands for American Rolling Mill Company, which was founded in 1899. It continued operation until its purchase in 2020. In collaboration with Gumbel, Freudenthal published a paper [7], which was even more statistically orientated using the annealed aluminum wire and the annealed electrolytic copper wire data. Another paper [8] was produced using the nickel wire data and referring to the annealed aluminum wire results from the previous papers. Gumbel [9] published a paper making a few additional extensions and modifications to the work that he had previously reported. Other investigators [10,11,12], for example, mention Ravilly’s data [5], but they do not do any significant analyses with the data. In the ensuing pages, Ravilly’s data [5] will be statistically presented and analyzed. Some of this will be similar to the authors cite above, but new analyses will be shown, as well.
Prior to looking at Ravilly’s data [5] specifically, it is appropriate to recall others who have contributed to statistical modeling of fatigue life. Modeling the cumulative distribution function (cdf) for fatigue life, given the applied loading conditions, is of supreme importance. There are several authors, [6,13,14,15,16], for example, who use the log-normal cdf. This cdf, however, is primarily used for mathematical expediency for parameter estimation and graphical presentation. Philosophically, the log-normal cdf is not appropriate, especially for very high cycle fatigue analyses because its hazard function decreases as fatigue life increases. A decreasing hazard function indicates that the material improves the longer it survives. Almost never does this occur in reality. Rather, fatigue of physical components or structures leads to increasing deterioration and damage, which necessitates an increasing hazard function.
The cdf for fatigue life that has become the most commonly used is the Weibull cdf. Weibull first introduced the cdf in 1939 [17] for strength of materials, and in 1951 [18], he extended the application to fatigue. Even though the name of the cdf is universally known as the Weibull cdf, Fréchet [19] introduced the cdf in 1927. Fisher and Tippet [20] and Gnedenko [21] proved that one of the only three possible limiting types of cdfs for the minimum of a sample of random variables is a Weibull cdf. When failure of a specimen, component, or structural is well characterized by an initial failure of the microstructure, then the Weibull cdf is the appropriate choice. The Weibull cdf has an increasing hazard function when its coefficient of variation (cv) is greater than one. Its applicability is extremely wide-ranging. Bolotin [22] advocated for the use of a Weibull cdf for the statistical modeling of fatigue. An example of a more recent reference using a Weibull cdf for fatigue life is [23]. Consequently, the Weibull cdf will be the underlying cdf used herein. As an interesting aside, the printed discussion following Freudenthal’s paper [6] has several contributions from leading researchers at that time that advocate for either the log-normal cdf or the Weibull cdf. Specifically, one of the commenters is W. Weibull.
It is also necessary to make a few comments about the stress (S) versus number of cycles (N) diagrams, commonly known as an S-N diagram or graph. Similar remarks could be made about strain versus life diagrams, but since Ravilly’s data [5] will be used below, the discussion will be for S-N diagrams. One of the most quoted papers for fatigue testing is by Wöhler [3], who is credited for introducing the S-N diagram. Frequently, it is called the Wöhler diagram. Certainly, by the time that Weibull [18] and Freudenthal [6] analyzed fatigue data, it was recognized that there was substantial variability in fatigue lives. Some authors use P-S-N to designate a probabilistic (P) S-N diagram. An excellent review of P-S-N analyses can be found in [24].
2. Materials and Methods
Ravilly’s paper [5] contains fatigue data for annealed aluminum wire data, annealed Armco iron wire, and annealed electrolytic copper wire. The fatigue lives were obtained by using a wire fatigue testing machine where the loading is in reversed torsion for a controlled strain level. The loading is equivalent to constant stress amplitude σ fatigue loading. Also, the explicit fatigue data are presented in tabular format in Freudenthal [6]. The data considered herein will be the annealed aluminum wire data and the annealed electrolytic copper wire, both of which have 20 replicate fatigue lives for 10 different values for σ. There is sufficient data for statistical modeling and analyses. Figure 1 shows the fatigue live data for the annealed electrolytic copper wire. The both axes for the graph are natural logarithm scaling. To give further insight into the data, consider Table 1. As σ decreases the median and average fatigue lives increase; however, there is little difference in their values. When σ = 7.25 kg/mm2, the sample cv is the largest for the different values of σ, and when σ = 10.0 kg/mm2, the cv is the smallest. For fatigue live data none of the cvs is excessively large.
Figure 2 is similar to Figure 1 except that it contains the fatigue live data for the annealed aluminum wire. Also, Table 2 is similar to Table 1. The trends for the medians and averages for the aluminum wire are comparable to those for the copper wire. The cvs, however, are not ordered. The largest cv is for σ = 7.5 kg/mm2, and the least is for σ = 5.25 kg/mm2. Typically, the amount of scatter in fatigue live data increases as the stress amplitude approaches normal operating conditions. Nevertheless, these data present an interesting statistical circumstance for modeling.
3. Results
The annealed electrolytic copper wire and the annealed aluminum wire will be analyzed below. The first analyses will be for statistical modeling of the S-N data. The next effort will be statistical modeling of the cdfs for fatigue live for each given σ. The final investigation will be an attempt to combine the S-N behavior with the cdf characterizations.
3.1. S-N Modeling
3.1.1. Annealed Electrolytic Copper Wire
Figure 3 is identical to Figure 1 with some additions. The hollow points are the medians for each σ. Recall that the medians correspond to the 50th percentile of the sample. The solid line on Figure 3 is the linear least squares fit through the medians. The correlation coefficient r2 for the regression is 0.95, which indicates that the regression is quite good. The linear behavior on Figure 3 implies that the relationship between σ and N is given by
where m and b are the slope and intercept of the regression line; m = 0.32 and b = 6.15. Obviously, the slope is negative. The dashed line is a lower confidence bound. It is constructed by using mean square error (MSE) analysis. The error ei is the difference between the model estimate and the data. For Figure 3 the model estimate is assumed to be the linear regression. The MSE is given by
The root mean square error σMSE is the square root of the MSE, and it is often used as the standard deviation to create confidence intervals. Confidence intervals can be developed by using a suitable multiple of the σMSE. One of the most common confidence intervals is constructed by adding and subtracting 2×σMSE to the model estimate because this produces an approximation for a 95% two-sided confidence bound. A good introduction to this type of analysis is [25], and MSE is explained in detail in statistics books, for example [26]. If only 2×σMSE is subtracted from the model estimate, then a 97.5% lower confidence bound is computed. The reason for considering just the lower bound is that the minimum life is required for design and life cycle assessment. In other words, a component or structure can be certified only up to the minimum life given a loading condition. Such a lower confidence bound is shown on Figure 3. Notice that all of the data is greater than the lower bound, except for 2 data which are on the lower bound. Also, the lower bound is reasonably close to the data except when σ = 7.25 kg/mm2. The curvature in the lower bound as σ decreases is an indication of slightly more scatter in the fatigue lives. This nonparametric statistical analysis for the copper wire data is quite good because the median behavior is characterized well by the linear regression.
3.1.1. Annealed Aluminum Wire
Figure 4 reproduces the S-N data from Figure 2. Again, the hollow points correspond to the medians for each σ. Clearly, a linear regression through the medians would not be an appropriate estimation of their behavior. Consequently, a nonlinear regression is needed. The equation of choice is as follows:
where a, b, c, and d are parameters to be determined. Equation 2 is similar to the shape of the Coffin-Manson model, which is designated frequently as the universal slopes method for strain life behavior [27,28]. The universal slopes method coupled with MSE analysis was used in [29] for a couple sets of strain life data; it should be consulted for further details. Also, an equivalent form of Equation 3 was suggested in [30]. Standard nonlinear regression for Equation 3 yields the following parameter estimations: a = 1.38×10⁸ (kg/mm2)-cycb, b = 1.74, c = 25.11 (kg/mm2)-cycd, and d = 0.115. The correlation coefficient r2 is 0.98, which indicates that the fit is excellent. Only 3 of the medians do not lie on the regression. The dashed line is the MSE -2σMSE lower confidence bound. Obviously, the lower bound is not acceptable for the higher values of σ. There are about 7 data to the left of the lower bound. For the lowest 3 values of σ the lower bound is a full order of magnitude too small. While the Equation 3 is an excellent representation of the medians, the MSE analysis is not acceptable. Thus, another method is required for characterization of the aluminum fatigue lives.
3.2. cdf Modeling
3.2.1. Annealed Electrolytic Copper Wire
The copper wire fatigue lives can be used in statistical analyses in order to estimate the cdfs given σ. The data is presented graphically on Figure 5. The graph is two-parameter Weibull probability paper, which means that a two-parameter Weibull cdf will be linear on such paper. The nonparametric estimate for the probability plotting points pk,n used are as follows:
where n is the sample size, and k is the index for the kth ordered data. This form for pk,n is preferred because it has the smallest MSE [31]. Visually, the data appear to be reasonably linear. Thus, the two-parameter Weibull cdf is considered to be the appropriate parametric form for characterizing the data. The two-parameter Weibull cdf is
where α is the shape parameter and β is the scale parameter. Graphical estimation, however, is not ideal for statistical parameter estimation. It is far better to use maximum likelihood estimation (MLE). A very efficient method for computing the MLE estimates for the parameters for the two-parameter Weibull cdf can be found in [32]. Table 3 contains the MLE estimated parameters, mean μ, and cv for each given value of σ. The hat over the parameters indicate an estimate. Also included in Table 3 are the Kolmogorov-Smirnov (KS) and Anderson-Darling (AD) goodness-of-fit values. The KS test indicates that the two-parameter Weibull cdf is acceptable for any level of significance less than 0.25. Likewise, the AD test yields the same conclusion. Therefore, the two-parameter Weibull cdfs with the MLE parameters in Table 3 are excellent characterizations of the copper wire fatigue live data.
Figure 6 is similar to Figure 3 except that the medians are estimated from the MLE Weibull cdfs. The sample medians and the MLE estimated medians are very close in magnitude. The largest percentage difference is about 9% when σ = 7.25 kg/mm2. The solid line is the curve through those medians. Clearly, the line is not linear, but it does follow the slight curvature of the S-N data. The lower confidence bound is constructed by using the 2.5 percentiles from the MLE Weibull cdfs. The dashed curve is the lower bound. Because the S-N data are somewhat different for each value of σ, the MLE Weibull cdfs behave slightly differently. Thus, the lower bound is irregular in shape. It is, however, quite tight to the data, which implies that the lower bound is highly representative of the behavior. Based on the copper wire S-N data, the analysis using MLE for two-parameter Weibull cdfs is preferred to the nonparametric analysis above.
3.2.2. Annealed Aluminum Wire
The aluminum wire fatigue data are plotted on two-parameter Weibull probability paper in Figure 7. The data are nearly linear for many of the values of σ; however, when σ is 13.75 kg/mm2 the data do not appear to be linear. Table 4 contains the MLE parameters, as in Table 3, and the KS and AD values. The KS values imply that the MLE two-parameter Weibull cdfs are acceptable for any significance less than 0.25. The AD test infers that the MLE two-parameter Weibull cdfs are acceptable for any significance less than 0.25 for σ not equal to 13.75 or 5.25 kg/mm2. The significance must be lower than 0.20 when σ = 13.75 kg/mm2 and less than 0.01 when σ = 5.25 kg/mm2 in order to be acceptable. This is a clear example in the difference between the KS and AD goodness-of-fit tests. The KS test is more focused on the central portion of the cdf while the AD test emphasizes the tail behavior. By careful inspection, when σ equals 13.75 or 5.25 kg/mm2, the tails are visually different. Freudenthal and Gumbel [8] suggested that a Weibull cdf with a minimum life would be more appropriate. It should be noted that they did not use goodness-of-fit tests to validate their results. The standard three-parameter Weibull cdf is
where γ is the minimum life. Assuming that Equation 6 is appropriate for characterizing the aluminum wire fatigue data, the MLE is required. The MLE for the three-parameter Weibull is a bit more challenging. An excellent method for its computation is given in [33]. The MLE parameters are shown in Table 5. As with the other examples, the KS test infers that the three-parameter Weibull cdf is acceptable for any level of significance less than 0.25. The AD test, however, indicates that the three-parameter Weibull cdf is not acceptable when σ equals 13.75 and 7.5 kg/mm2. For σ = 7.25 kg/mm2 the level of significance can only be 0.01. When σ is 30.0, 18.0, and 8.5 kg/mm2, the three-parameter Weibull cdf is acceptable for only significance levels less than 0.05. All in all, it is suggested that the two-parameter Weibull cdf is preferred over the three-parameter Weibull cdf for the aluminum wire data.
In order to consider a lower confidence bound for the aluminum data; the two-parameter Weibull cdfs will be used analogously to that on Figure 6. Consider Figure 8 where the MLE estimated medians are shown. The difference between the sample medians and the MLE estimated medians is quite small. The percentage difference ranges from about 0.1% to about 7.5%. Again; the solid line is the curve through the MLE medians; and it closely follows the curvature of the S-N data. The 2.5% lower confidence bound constructed from the MLE Weibull cdfs is quite good. The only data to the left of the bound are the minimum values for σ equal to 8.5 and 7.5 kg/mm2. The minimum value for σ = 7.5 kg/mm2 is 7,500 cycles; which is so much smaller than the rest of those fatigue lives. In fact; using the MLE Weibull cdf its probability of occurrence is only 0.00023. It causes one to wonder about its integrity. These experiments were conducted so long ago that describing this behavior would be pure speculation. Other than those two data; the lower bound is very close to the remaining data. It is suggested that for engineering purposes that the analysis using MLE for two-parameter Weibull cdfs is acceptable
3.3. Time Dependent Modeling
3.3.1. Annealed Electrolytic Copper Wire
Coleman {34-40] developed a generalized cdf that included the time dependence of the mechanical breakdown of materials. The cdf is a natural extension of the fundamentals of reliability theory. The proposed cdf has the following form:
where Ψ(x) is the hazard function, κ(x) is the breakdown rule, and L(t) is the time dependent load function. An excellent summary of the features of Equation 7 is contained in [41]. The functional form of κ(x) in Equation 7 is heuristically mechanistically based on the material damage accumulation. Frequently, Ψ(x) is assumed to be a Weibull hazard. Since constant amplitude loading is often used for fatigue experiments, L(t) can be considered to be constant. Examples where Equation 7 has been the foundational cdf can be found in [42,43,44].
Since the two-parameter Weibull cdf is acceptable for characterizing the copper wire fatigue data, a Weibull hazard function of the form
is assumed. Because a linear regression is suitable for modeling the medians on Figure 3, a power law breakdown function given by
is considered. The applied loading for the copper wire fatigue experiments was constant amplitude. Thus,
Substituting Equations 8-10 into Equation 7 and simplifying yields the following cdf:
The constants α, β, and ρ, are non-negative, and they are statistically estimated from the life data. It should be mentioned that the power law breakdown rule given in Equation 9 produces linear percentile curves for S-N data plotted on logarithmic versus logarithmic axes. In order to evaluate Equation 11 graphically, the ensuing transformation is considered:
For a fixed value of σ, Equation 12 is linear in ln{-ln[1 – F(t|σ)]} versus ln(t) with slope α. For a fixed probability, say F(t|σ) = p, Equation 12 is linear in ln(σ) versus ln(t) with slope -1/ρ. Given F(t|σ) and σ, after α and ρ are estimated, the final parameter in Equation 12 to be estimated is β. A detailed numerical example for this analysis can be found in [43].
In order for Equations 11 and 12 to fully represent the S-N and probability behavior, the parameters must be constant and independent of the N and σ. Equation 12 indicates that the Weibull shape parameter σ and the power law exponent ρ must be the same for all values of σ and fixed p. The MLE shape parameters given in Table 3 are reasonably close in magnitude. Thus, the estimate for α in Equations 11 and 12 is assumed to be the average of the values in Table 3, that is, = 5.09. The linear regression shown on Figure 3 can be used to estimate ρ. The Equation 12 leads to the relationship that ρ is the negative reciprocal of the slope m. Thus, = 3.12. With estimates for α and ρ, β can be estimated from the S-N graph by fixing a probability, say p = 0.5, or by fixing a value for σ and using the probability graph. On Figure 3, the linear regression is very close to the median when σ = 19 kg/mm2. Using these values, = 4.40×10⁻⁹ 1/[cyc-(kg/mm2)ρ]. Figure 9 is a facsimile of Figure 3 except that the median, the 2.5 percentile and the 0.5 percentile lines are obtained from Equations 11 and 12 with the above estimated values. The 2.5 percentile line corresponds to the 97.5% lower confidence bound, but it clearly is not appropriate as a lower bound. Several data are to the left of the line. The 0.5 percentile line, however, corresponds to a 99.5% lower confidence bound. All of the data are to the right of the bound, and it is very tight with the data. Hence, it is very acceptable as a lower confidence bound. For the copper wire fatigue data Equation 11 is an excellent representation of the behavior.
3.3.2. Annealed Aluminum Wire
The S-N data for the aluminum wire is shown on Figure 4 with the nonlinear regression given in Equation 3. Using the nonlinear for for the median behavior in Equation 7 leads to a computationally very difficult integral. In order to make the analysis more amenable, the cdf in Equation 7 will be broken into two intervals, each of which will be assumed to be linear. Thus, the S-N data are shown with the two linear estimates for the medians on Figure 10. Specifically, the estimate is given by
where ML = -0.798, BL = 37,200 (kg/mm2)/cycML, MH = -0.148, BH = 39.0 (kg/mm2)/cycMH; the subscripts L and H corresponds to the Low cyc and High cyc regions, respectively. The transition value is Nt = 39,450 cyc.
The proposed cdf for each of the two regions is Equation 11, which assumes a Weibull hazard function, power law breakdown, and constant amplitude load. The estimated parameters are obtained similarly to those described for the copper wire above. Thus, = 4.77 and = 4.51, which are the averages of the shape parameters for the L and H regions, given in Table 4. The estimates for the power law exponents are the negative reciprocal of the appropriate slopes, that is, = 1.25 and = 6.76. The final estimates are found by considering the medians on Figure 10 when σ = 18 and 5.5 kg/mm2. Thus, = 1.79×10⁻⁶ 1/[cyc-(kg/mm2)ρL] and = 1.80×10⁻¹¹ 1/[cyc-(kg/mm2)ρH]. As seen on Figure 10, the 0.5 percentile line is an acceptable confidence bound for the L region. All the data lie to the right of the lower bound. For the H region the 0.5 percentile is an excellent lower bound for all the data except for one value. It is impossible to determine, for data this old, why that single data is so far from the rest of the fatigue data when σ = 7.5 kg/mm2. It may, in fact, be an outlier. Nevertheless, the lower bound for the two regions seems reasonable. The 2.5 percentile lower bound is not shown because it is not acceptable because it has several data to the left of the bound for both the L and H regions. For the aluminum wire fatigue data Equation 11 for each region is a reasonable representation of the data.
4. Discussion
The data that were investigated herein were stress–life fatigue data for annealed aluminum wire and annealed electrolytic copper wire [5]. These historic data were selected for consideration because of the ample sample sizes of magnitude 20 produced for each of a significant number, i.e., 10, of applied stress amplitudes. The two sets of data were analyzed using traditional statistical S-N analysis and the MSE for lower confidence bounds. The basic conclusion is that these methodologies work quite well, if the S-N data are well behaved. This is the case for the annealed electrolytic copper wire. The annealed aluminum wire, however, has too much scatter for that modeling to be applicable.
Subsequently, the two sets of data were modeled statistically by using the Weibull cdf. These analyses incorporated MLE and the KS and AD goodness-of-fit tests. The two-parameter Weibull cdf is an outstanding choice to characterize the annealed electrolytic copper wire data. Furthermore, the lower confidence bound estimation using the MLE Weibull estimates is extremely good as well. Again, these data are quite regular. For the annealed aluminum wire data the MLE for the two-parameter Weibull cdf is acceptable for engineering purposes. Also, the lower bound estimate is quite good, except for one data, which may be somewhat of an outlier. Unfortunately, that single data is not on the conservative side. Further investigation would be warranted.
The third approach for statistically analyzing the two sets of data is time dependent modeling that merges the S-N behavior into the cdf. The cdf is built by using a hazard function, breakdown rule, and load function. The basic form of the cdf is the same as the cdf for reliability given a hazard rate. Because of the flexibility and scope of the Weibull cdf for life assessment, the hazard function was assumed to be the form of a Weibull hazard. The power law breakdown law was also well suited. Because the fatigue loading was constant amplitude, it was assumed that the loading was constant. The annealed electrolytic copper wire data is modeled extremely well by the proposed approach. The annealed aluminum wire, however, required the use of a bilinear power law breakdown law. The estimate for the data was the best for those considered in this effort. The only caveat is that the single, possible outlier, is still below the lower confidence bound, but it is much closer than the other methods used.
5. Conclusions
The efficacy and utility of the generalized cdf given in Equation 7 has been demonstrated herein. Its versatility is an underlying strength. Certainly, its use or consideration cdf is warranted for the characterization of other sets of fatigue life data. The mathematical form of the cdf is sufficiently great that its use is minimized only by parameter estimation. Models that explicitly incorporate stress into the cdf must be evaluated carefully. If there are minimal data for each given stress or an insufficient number of different stresses in the experimental program, the model development is difficult. While Equation 7 is still applicable in these cases, the uncertainty in the modeling is exacerbated. Accuracy always improves as the amount of data increases. All things considered, the proposed approach has sufficient promise that further investigation and analysis is certainly warranted. Consequently, it is recommended that this cdf be considered for other life testing applications.
Data Availability Statement
The data used herein is available in Freudenthal [6].
Conflicts of Interest
Declare conflicts of interest or state “The authors declare no conflict of interest.” Authors must identify and declare any personal circumstances or interest that may be perceived as inappropriately influencing the representation or interpretation of reported research results. Any role of the funders in the design of the study; in the collection, analyses or interpretation of data; in the writing of the manuscript, or in the decision to publish the results must be declared in this section. If there is no role, please state “The funders had no role in the design of the study; in the collection, analyses, or interpretation of data; in the writing of the manuscript, or in the decision to publish the results”.
References
- Shimokawa, T.; Hamaguchi, Y. Relationship between Fatigue Life Distribution, Notch Configuration, and S–N Curve of a 2024–T4 Aluminum Alloy. J Eng Mater Technol 1985, 107, 214–220. [Google Scholar] [CrossRef]
- Schütz, W. A History of Fatigue. Eng Fract Mech 1996, 54, 263–300. [Google Scholar] [CrossRef]
- Wöhler, A. Versuche zur Ermittlung der auf die Eisenbahnwagenachsen einwirkenden Kräfte und die Widerstandsfähigkeit der Wagen-Achsen. Zeitschrift für Bauwesen 1860 10, 583-616.
- Moore, H. F.; Kommers, J. B. The Fatigue of Metals, McGraw-Hill: New York, USA, 1927; pp. 168–170.
- Ravilly, E. Contribution a l’etude de la rupture des fils metalliques soumis à des torsions alternees. Publications Scientifiques et Techniques du Ministere de l’Air 1938, 120, 52–70. [Google Scholar]
- Freudenthal, A. M. Planning and Interpretation of fatigue Tests. Symposium on Statistical Aspects of Fatigue, ASTM STP 121; American Society for Testing Materials: Philadelphia, PA, USA, 1951; pp. 3–13.
- Freudenthal, A. M.; Gumbel, E. J. Statistical Interpretation of Fatigue Tests. Proc R Soc A 1953, 216, 309–332. [Google Scholar]
- Freudenthal, A. M.; Gumbel, E. J. Minimum Life in Fatigue. J Am Stat Assoc 1954, 49, 575–597. [Google Scholar] [CrossRef]
- Gumbel, E. J. Étude statistique de la fatigue des matériaux. Revue de Statistique Appliquée 1957, 5, 51–86. [Google Scholar]
- Dieter G. E.; Mehl R. F. Investigation of the Statistical Nature of the Fatigue of Metals. Technical Note 3019, National Advisory Committee for Aeronautics: Washington, D.C., USA, 1953.
- Stagg, A. M. An Investigation of the Scatter in Constant Amplitude Fatigue Test Results of Aluminium Alloys2024 and 7075. Ministry of Technology, Aeronautical Research Council: Current Papers 1093, Her Majesty’s Stationery Office: London, UK 1970.
- Kesling, G. D.; Whittaker, I. C. A Simulation Model of Railroad Reliability. Simulation 1985, 44, 168–180. [Google Scholar] [CrossRef]
- Ratnaparkhi; M. V.; Park, W. J. Lognormal Distribution - Model for Fatigue Life and Residual Strength of Composite Materials. IEEE Trans Rel 1986, 35, 312–315. [Google Scholar] [CrossRef]
- Zheng, X.-L.; Lü, B.; Jiang, H. Determination of Probability Distribution of Fatigue Strength and Expressions of P-S-N Curves. Eng Fract Mech 1995, 50, 483–491. [Google Scholar] [CrossRef]
- Ramamurty, R. P.; Rajesh, S.; Satyanarayana, B.; Ramji, K. Statistical Analysis of Fatigue Life Data of A356.2-T6 Aluminum Alloy. Tech Sci Press SDHM 2011, 7, 139–152. [Google Scholar]
- Bazaras, Ž.; Lukoševiˇcius, V. Statistical Assessment of Low-Cycle Fatigue Durability. Symmetry 2022, 14, 1–19. [Google Scholar] [CrossRef]
- Weibull, W. A Statistical Theory of the Strength of Materials. Ing Vetenskaps Handl 1939, 151, 1–45. [Google Scholar]
- Weibull, W. A Statistical Distribution Function of Wide Applicability. J Appl Mech Trans ASME 1951, 18, 293–297. [Google Scholar] [CrossRef]
- Fréchet, M. Sur la loi de probabilité de l'écart maximum. Annales de la Société Polonaise de Mathematique 1927, 6, 93–116. [Google Scholar]
- Fisher, R. A.; Tippett, L. H. C. Limiting Forms of the Frequency Distribution of the Largest or Smallest Member of a Sample. Proc Cambridge Philos Soc 1928, 24, 180–190. [Google Scholar] [CrossRef]
- Gnedenko, B. V. Sur la Distribution Limite du Terme Maximum d’une Série Aléatoire. Ann Math 1943, 44, 423–453. [Google Scholar] [CrossRef]
- Bolotin, V. V. Statistical Methods in Structural Mechanics; Holden-Day, Inc.: San Francisco, CA, USA, 1969; pp. 71–77. [Google Scholar]
- Strzelecki, P. Determination of Fatigue Life for Low Probability of Failure for Different Stress Levels using 3-parameter Weibull Distribution. Int J Fatigue 2021, 145, 106080–1. [Google Scholar] [CrossRef]
- Barbosa, J. F.; Correia, J. A. F. O.; Júnior, R. C. S. F.; Zhu, S.-P.; De Jesus, A. M. P. Probabilistic S-N Fields Based on Statistical Distributions Applied to Metallic and Composite Materials: State of the Art. Adv Mech Eng 2019, 11, 1–22. [Google Scholar] [CrossRef]
- Chai, T.; Draxler, R.R. Root Mean Square Error (RMSE) or Mean Average Error (MAE)? - Arguments Against Avoiding RMSE in the Literature. Geosci Model Dev 2014, 7, 1247–1250. [Google Scholar] [CrossRef]
- Ross, S. Introduction to Probability and Statistics for Engineers and Scientists, 4th ed.; Elsevier Academic Press: London, UK, 2009. [Google Scholar]
- Manson, S.S. A Simple Procedure for Estimating High-Temperature Low-Cycle Fatigue. Exp Mech 1968, 8, 349–355. [Google Scholar] [CrossRef]
- Manson, S.S.; Halford, G.R. Practical Implementation of the Double Linear Damage Rule and Damage Curve Approach for Treating Cumulative Fatigue Damage. Int J Fract 1981, 17, 169–192. [Google Scholar] [CrossRef]
- Harlow, D. G. Low Cycle Fatigue: Probability and Statistical Modeling of Fatigue Life. Proc ASME 2014 PVP Conf PVP2014-28114, Anaheim, CA, July 20-24, 2014, V06BT06A045; ISBN: 978-0-7918-4604-9. Proc ASME 2014 PVP Conf.
- Klemenc1, J.; Podgornik, B. An Improved Model for Predicting the Scattered S-N Curves. J Mech Eng / Strojniški Vestnik 2019, 65, 265–275. [Google Scholar] [CrossRef]
- Mann, N. R.; Schafer, R. E.; Singpurwalla, N. D. Methods for Statistical Analysis of Reliability and Life Data, Wiley: New York, USA, 1974.
- Harlow, D. G. The Effect of Proof-Testing on the Weibull Distribution. J Mater Sci 1989, 24, 1467–1473. [Google Scholar] [CrossRef]
- Harlow, D. G. Fatigue Life Estimation with Censored Data. Int J Fatigue 2020, 141, 105899–1. [Google Scholar] [CrossRef]
- Coleman, B. D. Time Dependence of Mechanical Breakdown Phenomena. J Appl Phys 1956, 27, 862–866. [Google Scholar] [CrossRef]
- Coleman, B. D. Time Dependence of Mechanical Breakdown in Bundles of Fibers. I. Constant Total Load. J Appl Phys 1957, 28, 1058–1064. [Google Scholar] [CrossRef]
- Coleman, B. D. Errata: Time Dependence of Mechanical Breakdown Phenomena. J Appl Phys 1957, 28, 1514. [Google Scholar] [CrossRef]
- Coleman, B. D.; Marquardt, D. W. Time Dependence of Mechanical Breakdown in Bundles of Fibers. II. The Infinite Ideal Bundle under Linearly Increasing Loads. J Appl Phys 1957, 28, 1065–1067. [Google Scholar] [CrossRef]
- Coleman, B. D. Statistics and Time Dependence of Mechanical Breakdown in Fibers. J Appl Phys 1958, 29, 968–983. [Google Scholar] [CrossRef]
- Coleman, B. D.; Marquardt, D. W. Time Dependence of Mechanical Breakdown in Bundles of Fibers. IV. Infinite Ideal Bundle under Oscillating Loads. J Appl Phys 1958, 29, 1091–1099. [Google Scholar] [CrossRef]
- Coleman, B. D. Time Dependence of Mechanical Breakdown in Bundles of Fibers. V. Fibers of Class A-2. J Appl Phys 1959, 30, 720–724. [Google Scholar] [CrossRef]
- Phoenix, S. L. Stochastic Strength and Fatigue of Fiber Bundles. Int J Fract 1978, 13, 327–344. [Google Scholar] [CrossRef]
- Harlow, D. G. Probability Versus Statistical Modeling: Examples from Fatigue Life Prediction. Int J Reliab Qual 2005, 12, 1–16. [Google Scholar] [CrossRef]
- Harlow, D. G. Generalized Probability Distributions for Accelerated Life Modeling. SAE Int J Mater Manuf 2011, 4, 980–991. [Google Scholar] [CrossRef]
- Harlow, D. G. Fatigue Life Modeling Using Nitinol Data. Proc. ASME. PVP2020, Volume 1: Codes and Standards PVP2020-21752, August 3, 2020, V001T01A025. [CrossRef]
Figure 1.
S-N diagram for annealed electrolytic copper wire [6].
Figure 1.
S-N diagram for annealed electrolytic copper wire [6].
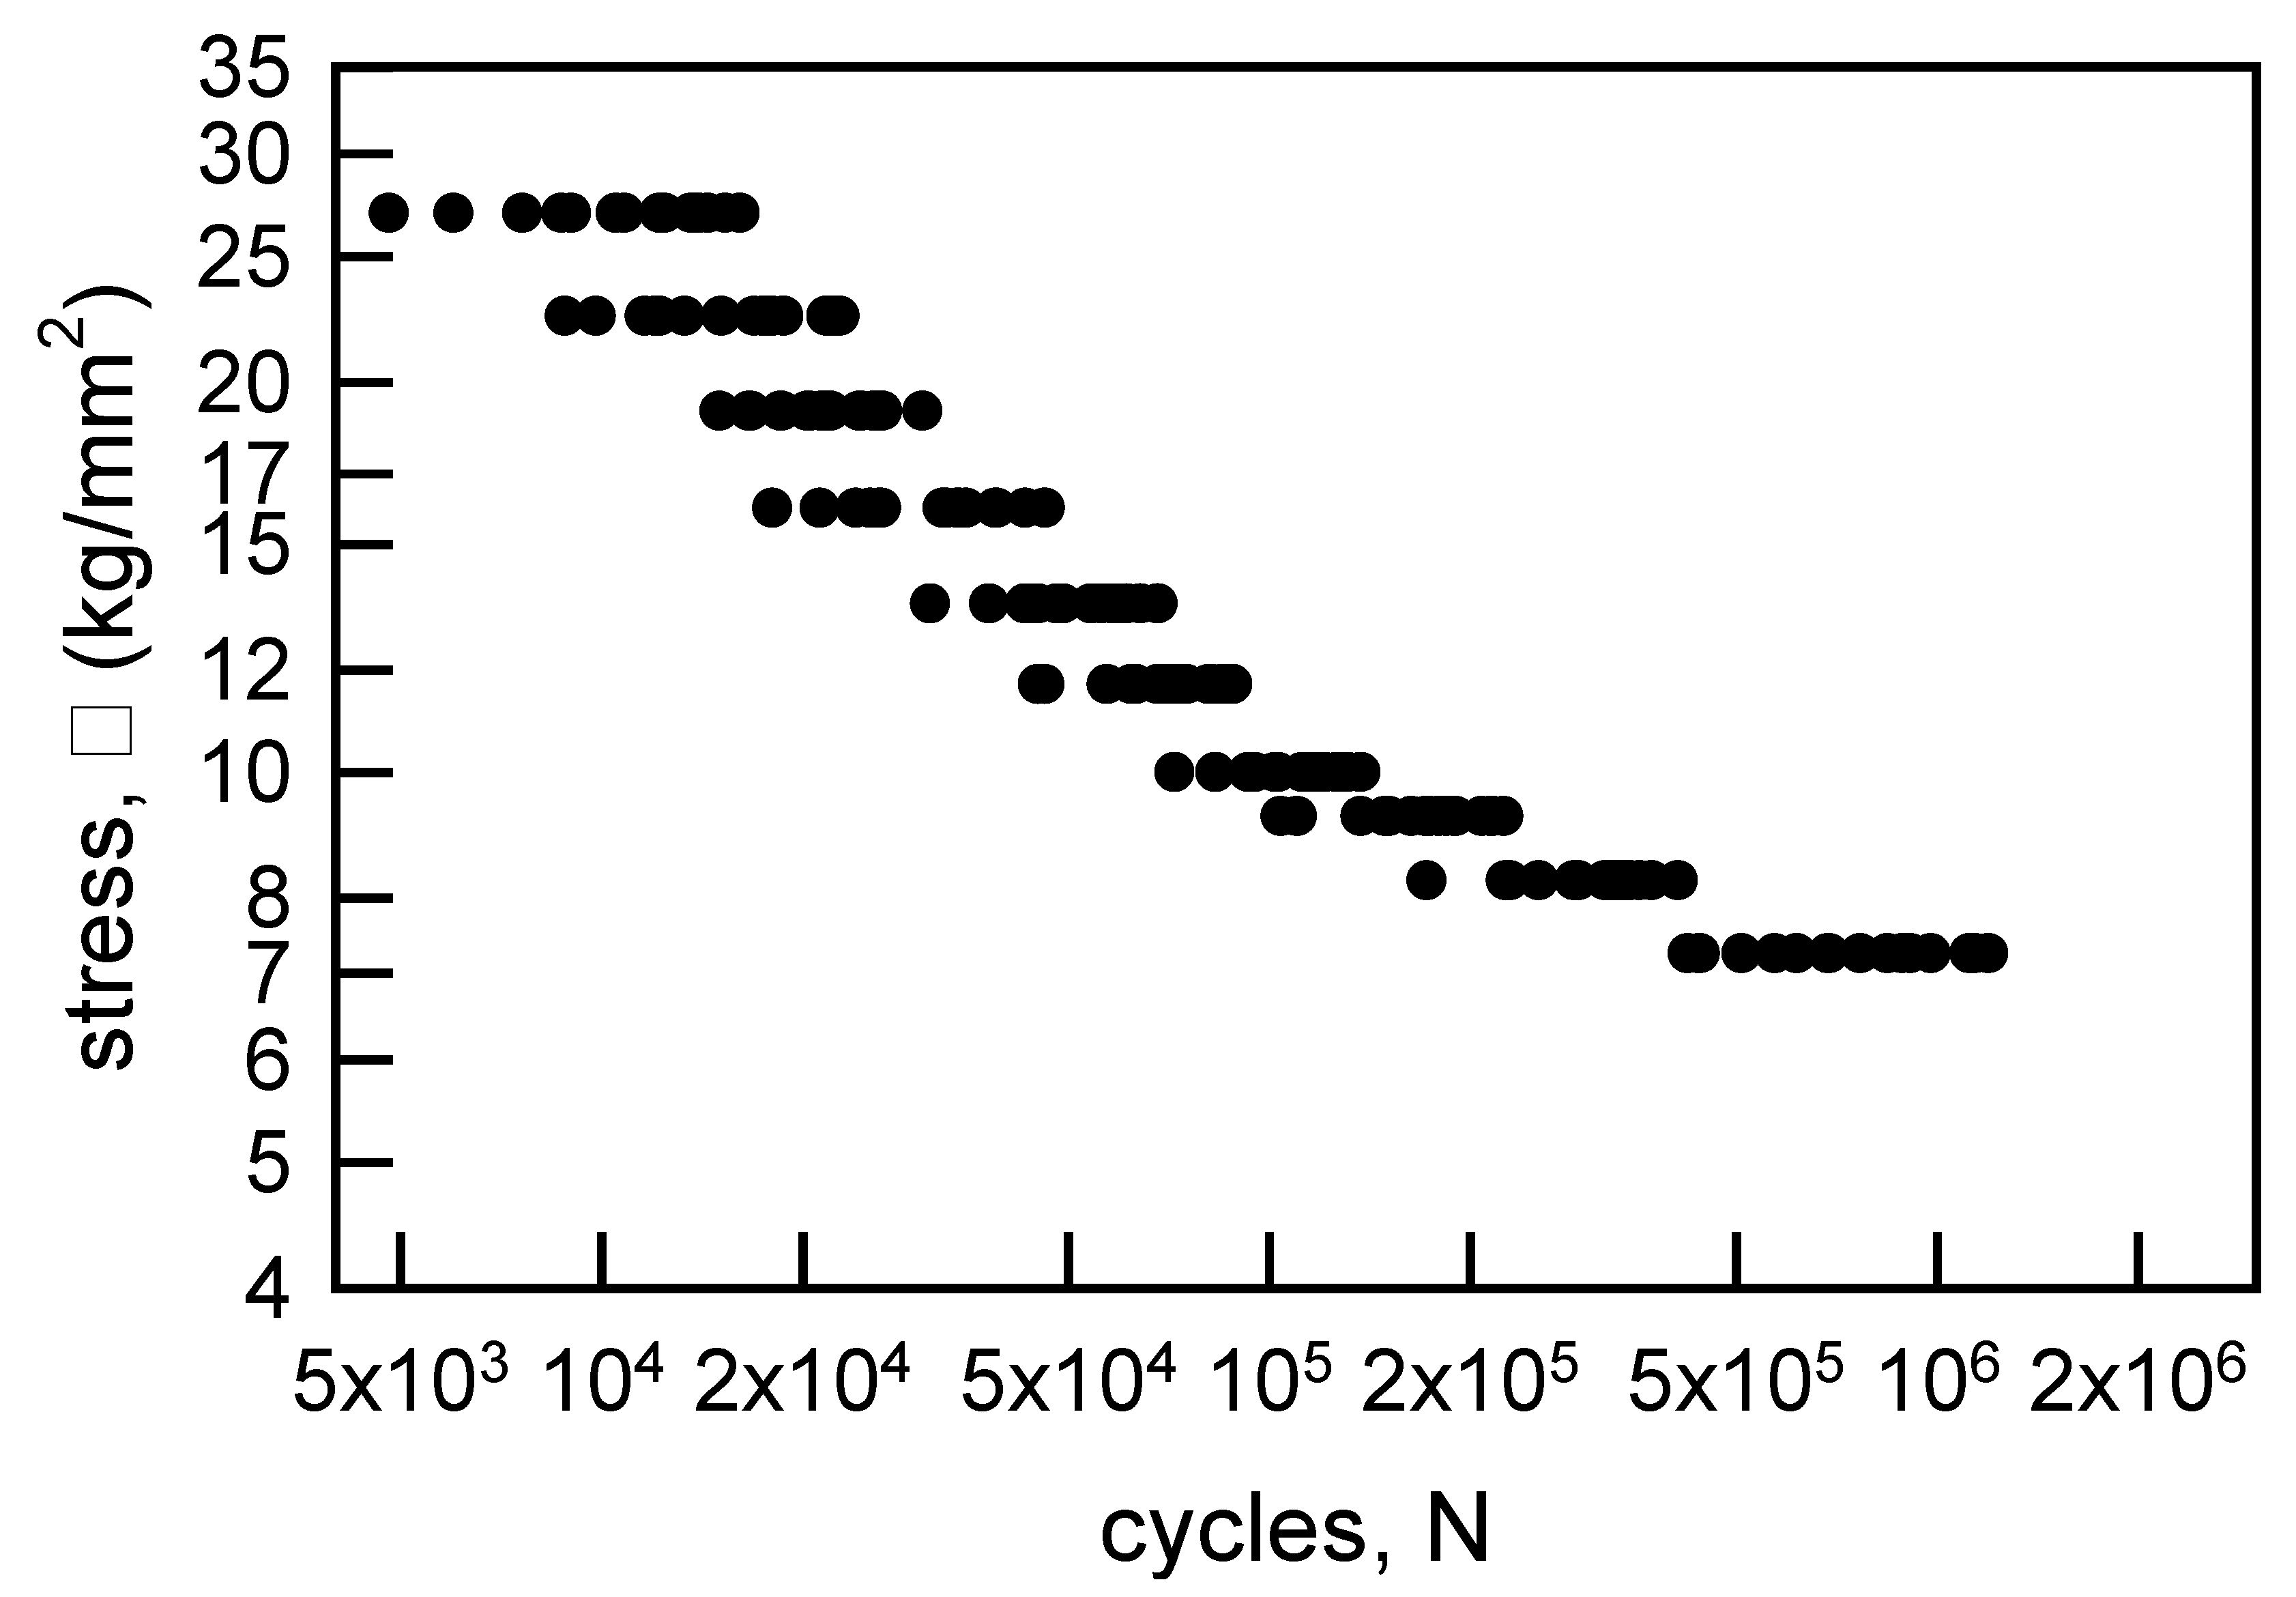
Figure 2.
S-N diagram for annealed aluminum wire [6].
Figure 2.
S-N diagram for annealed aluminum wire [6].
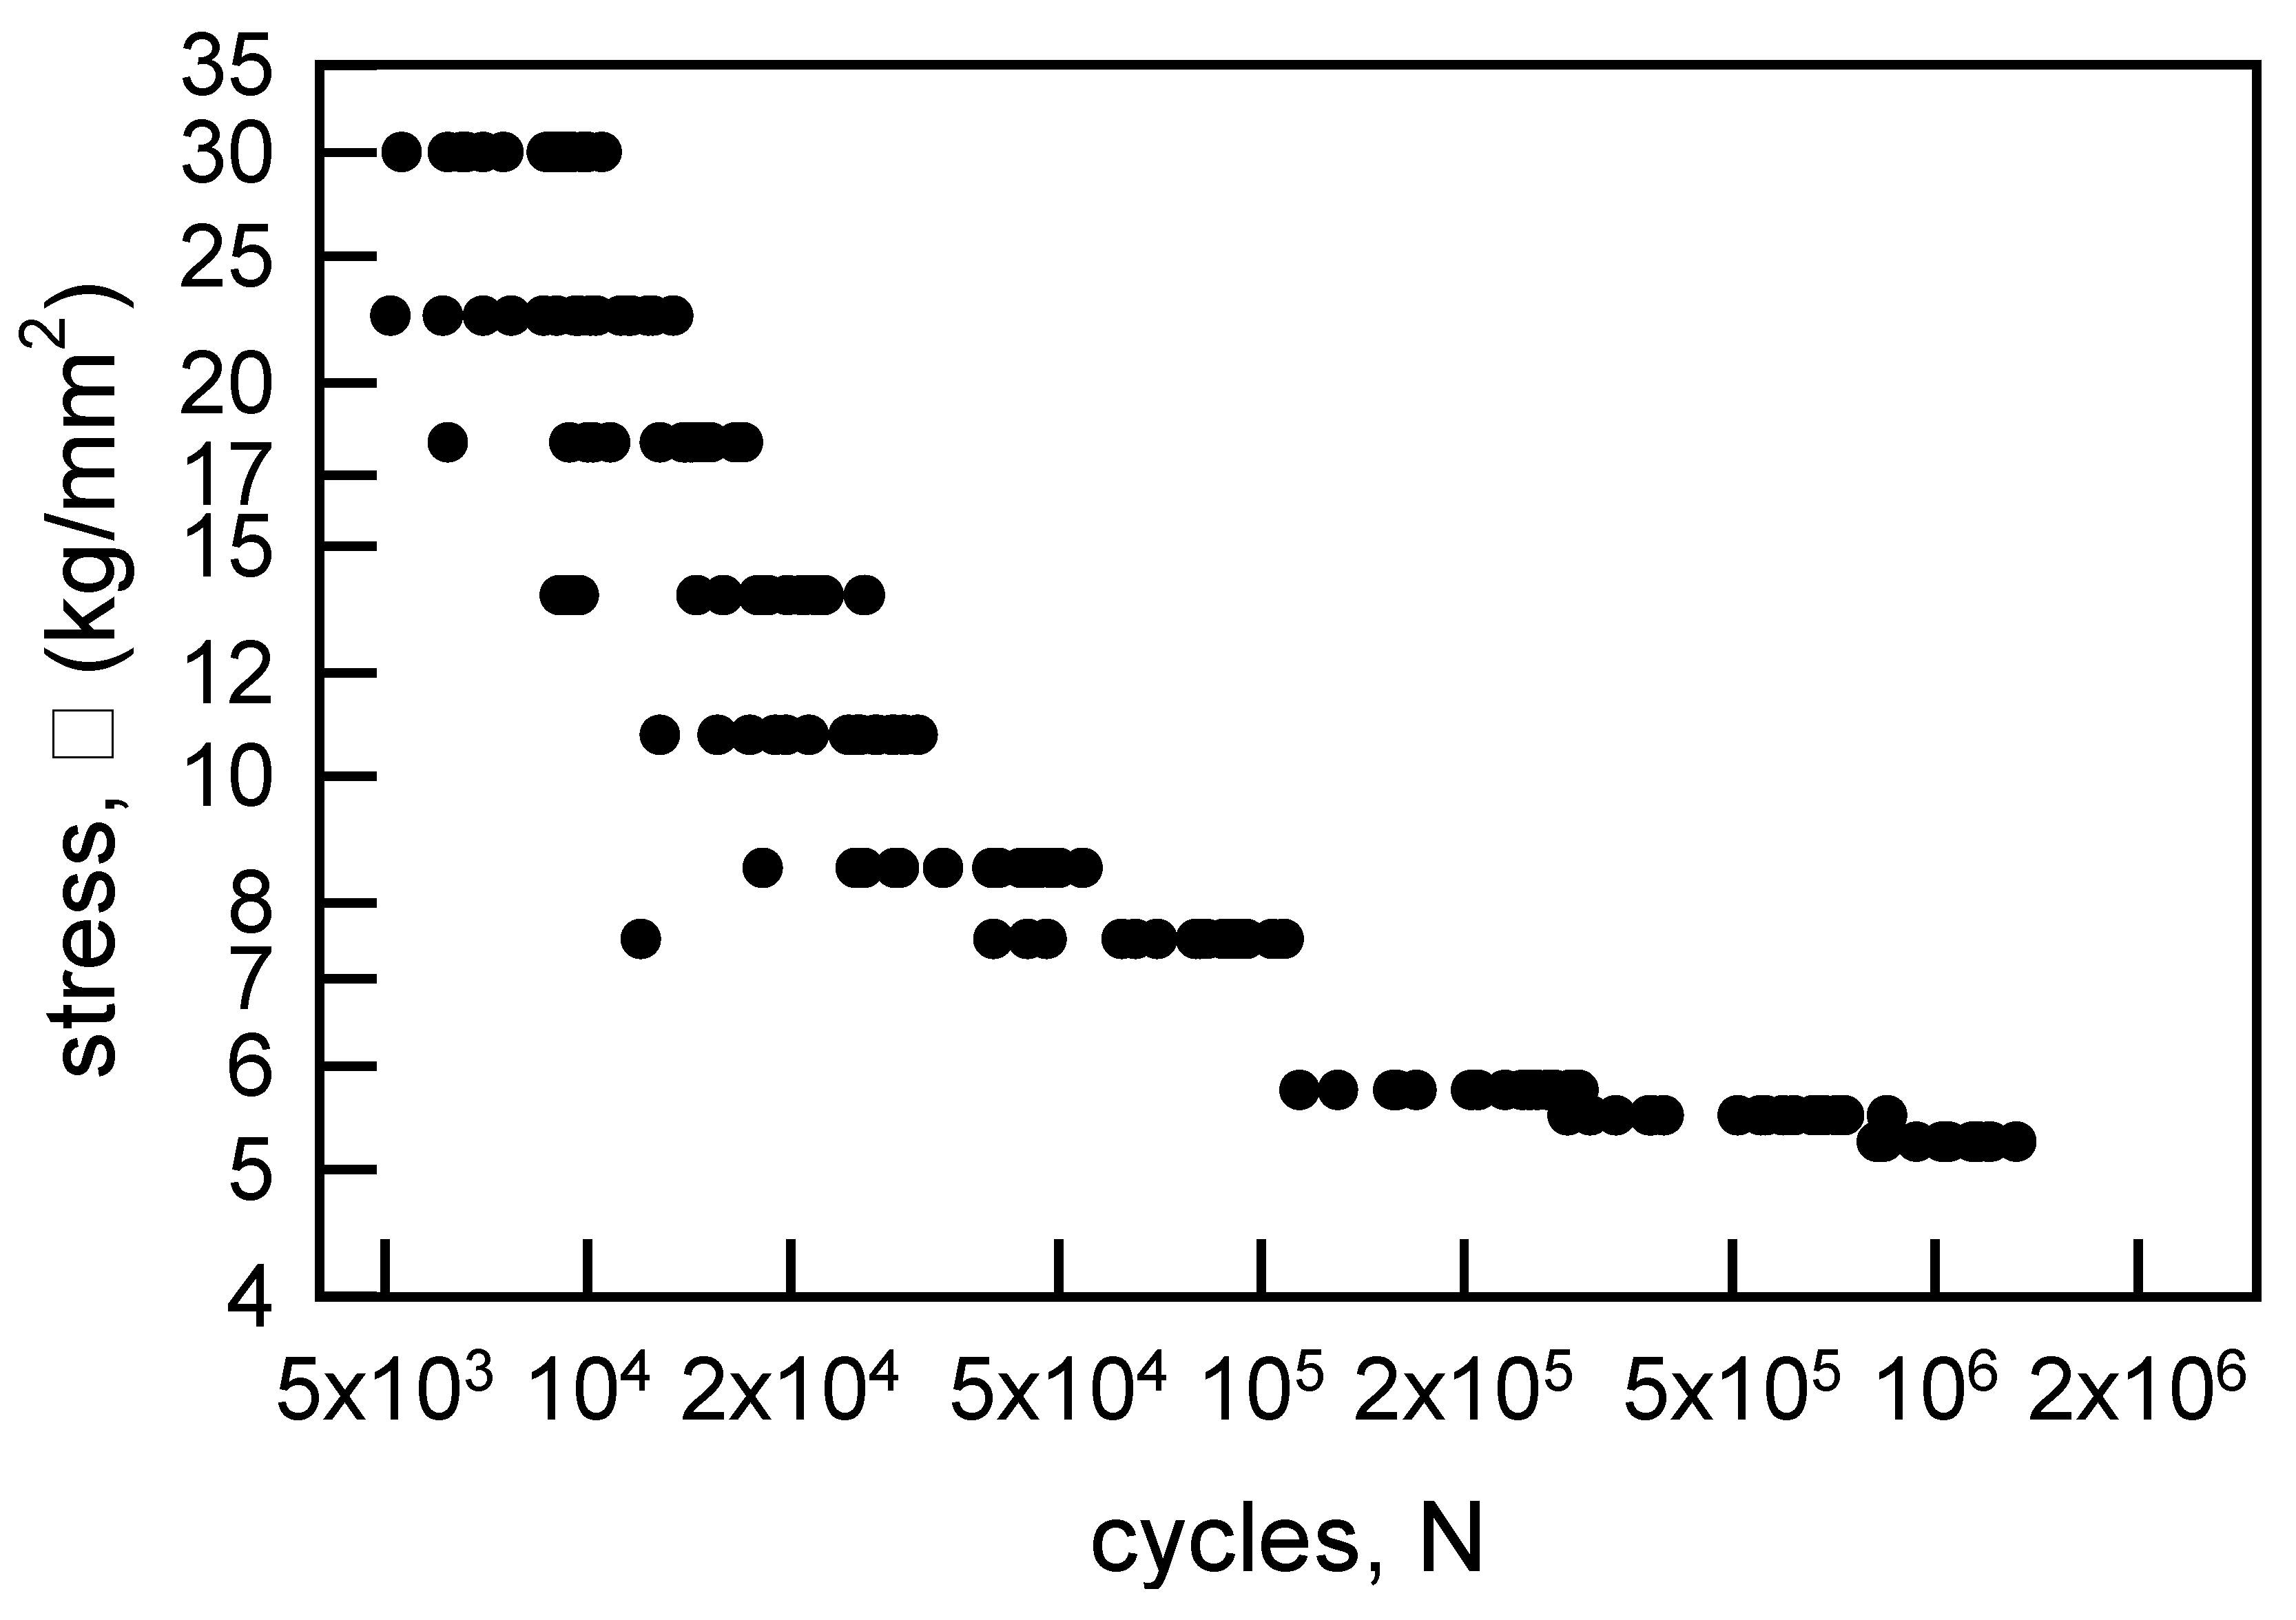
Figure 3.
S-N data for annealed electrolytic copper wire [6] with linear regression through the medians and a lower confidence bound.
Figure 3.
S-N data for annealed electrolytic copper wire [6] with linear regression through the medians and a lower confidence bound.
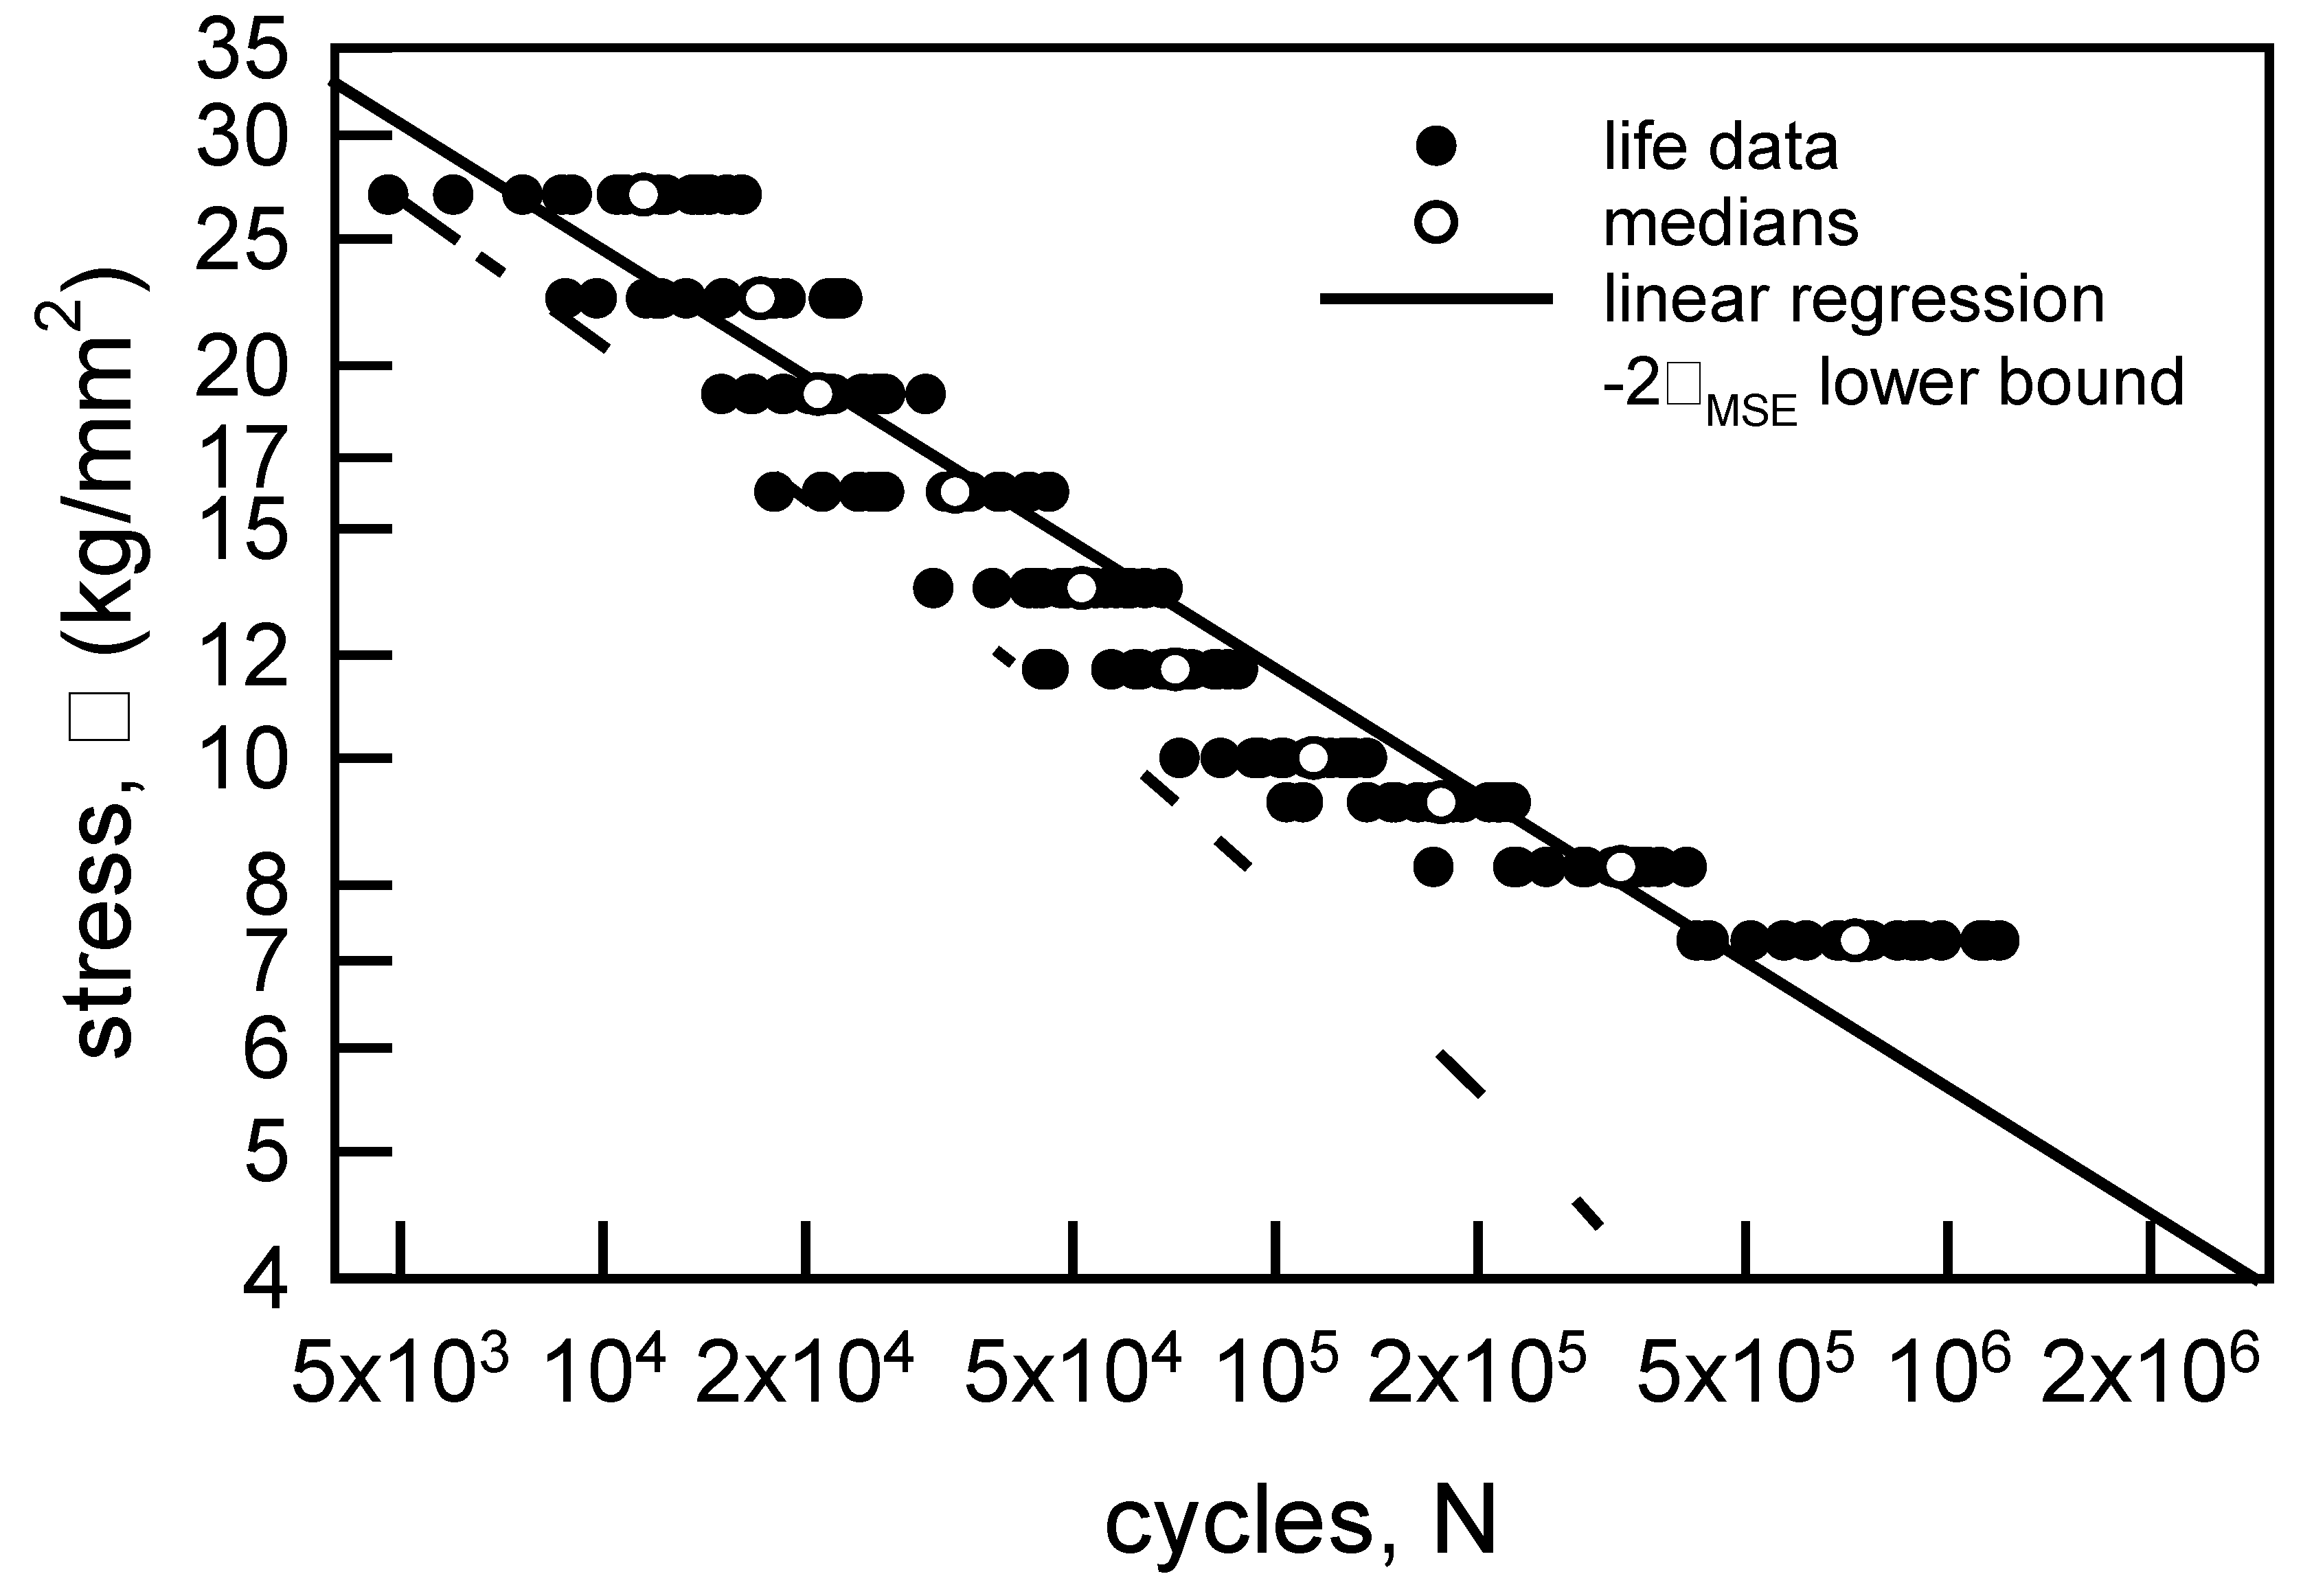
Figure 4.
S-N data for annealed aluminum wire [6] with a nonlinear regression through the medians and a lower confidence bound.
Figure 4.
S-N data for annealed aluminum wire [6] with a nonlinear regression through the medians and a lower confidence bound.
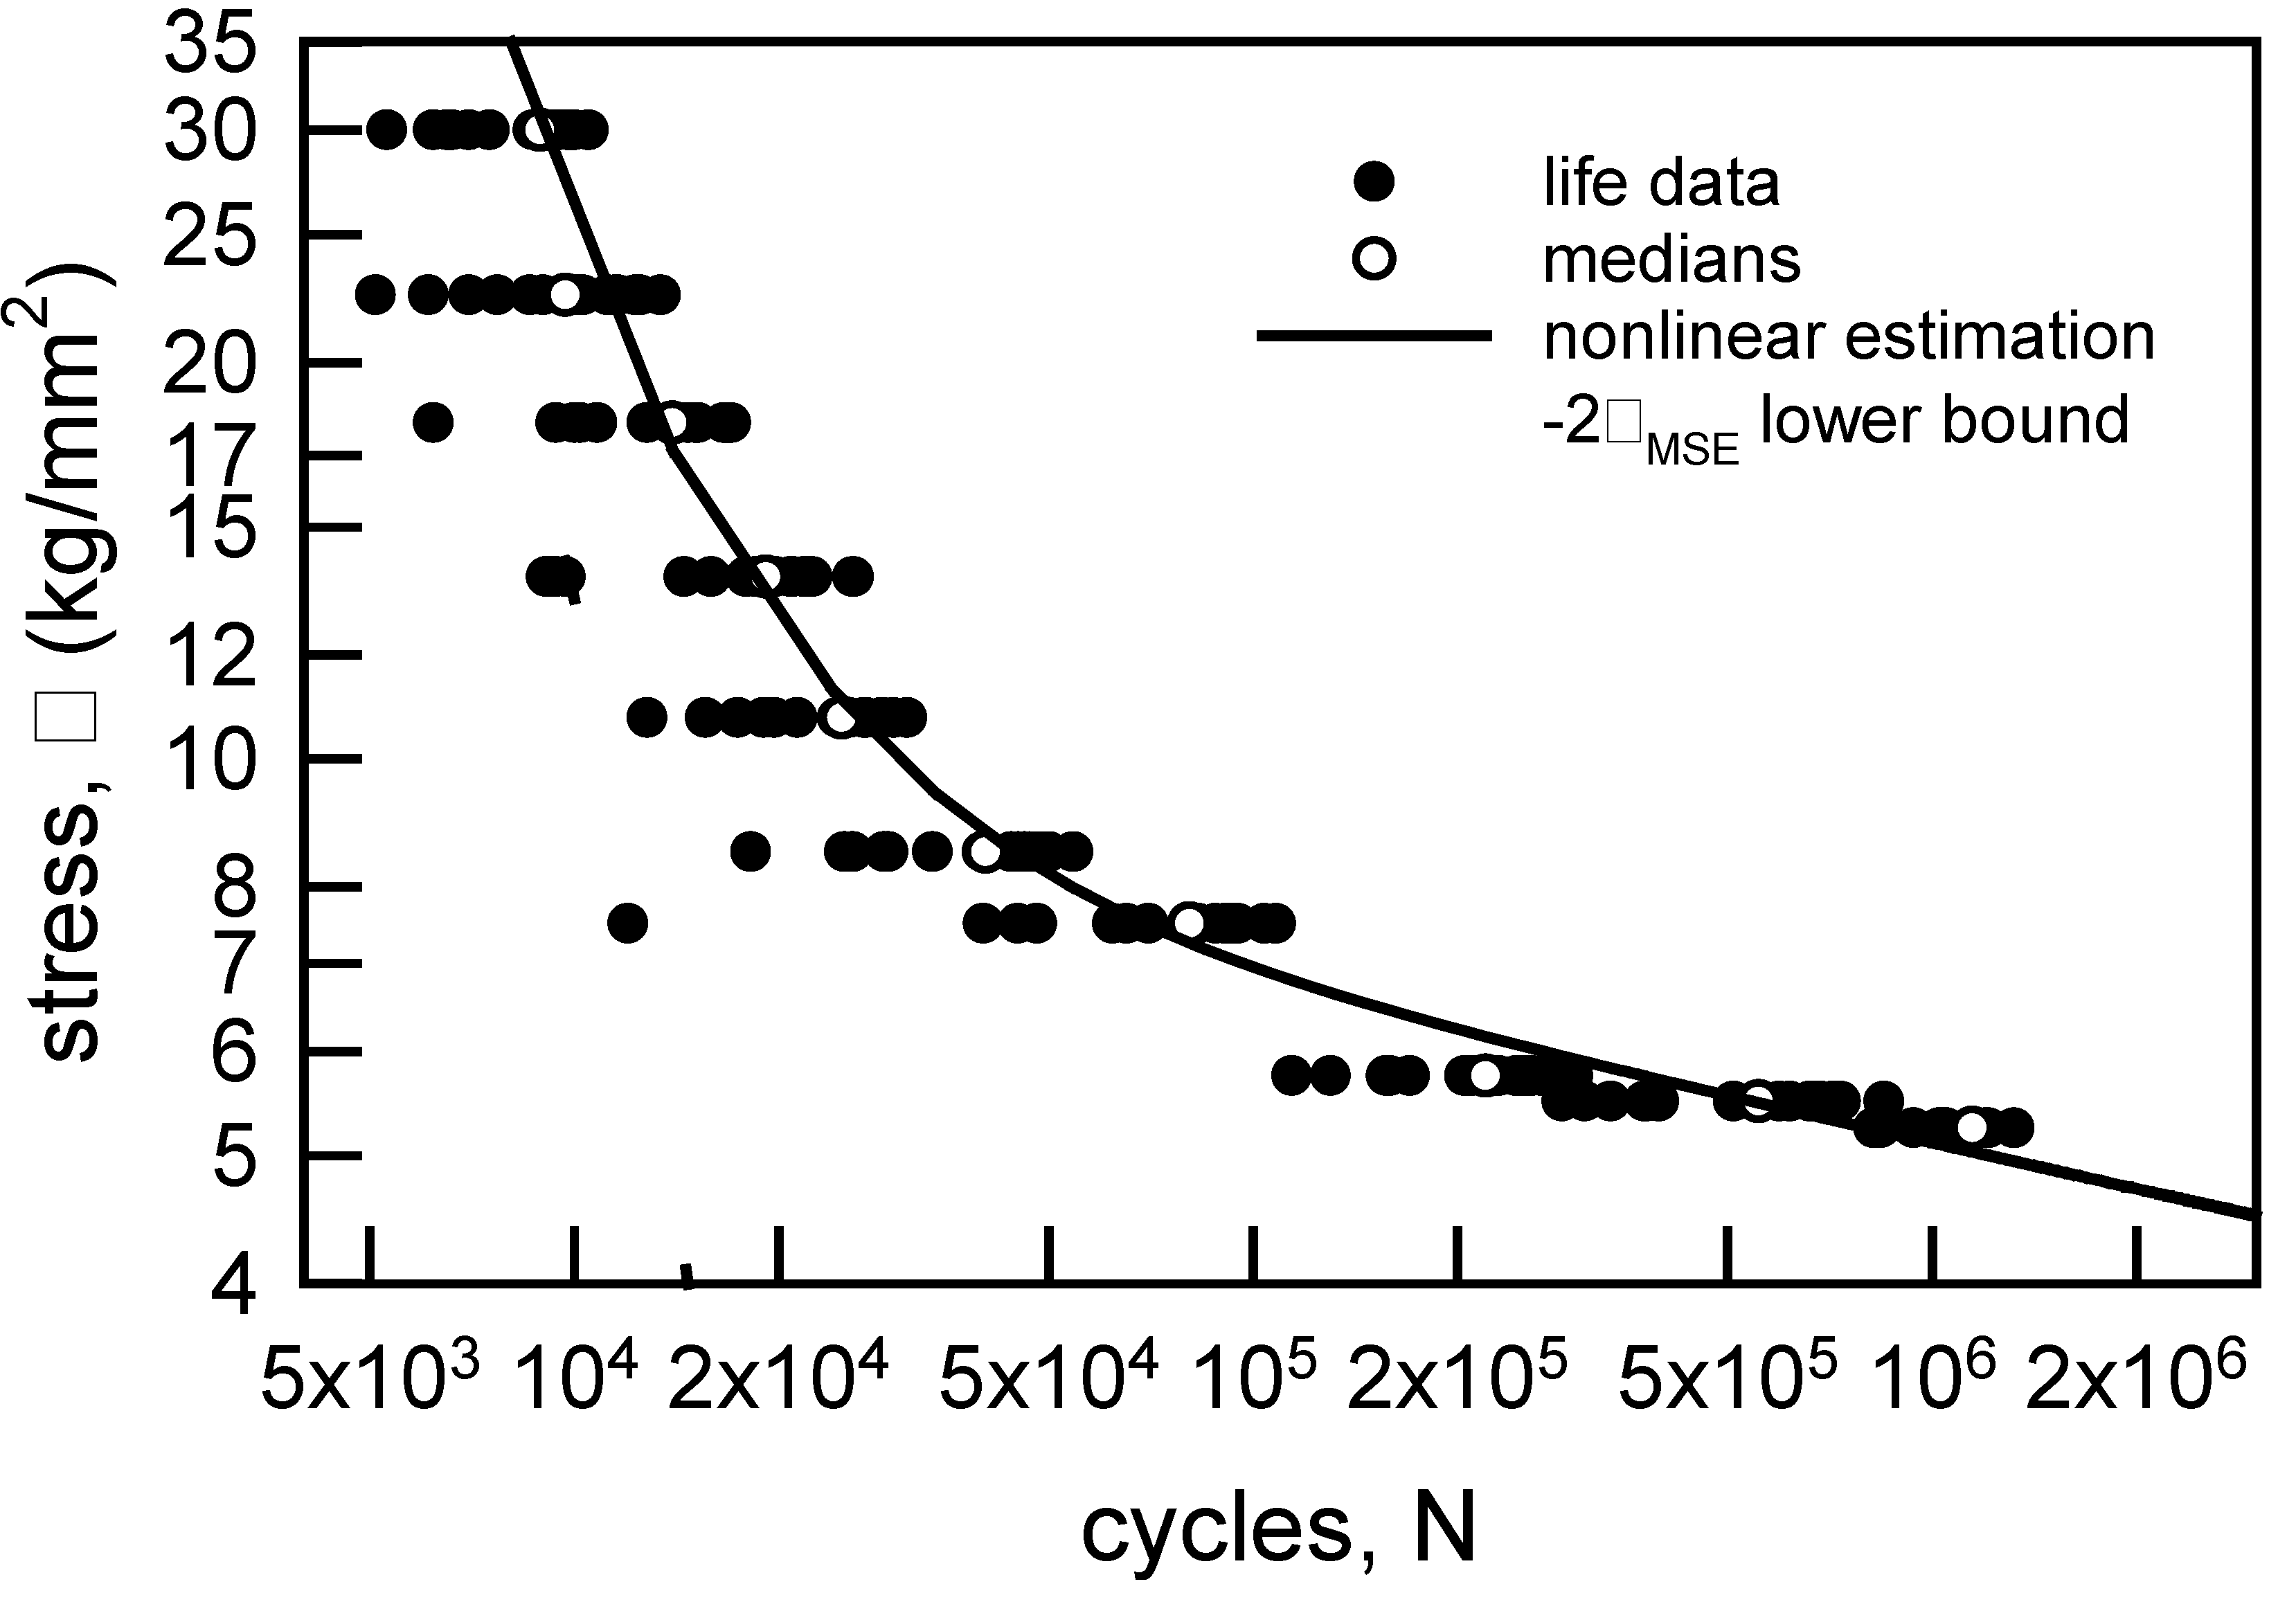
Figure 5.
Probability plot for annealed electrolytic copper wire [6]; two-parameter Weibull probability paper.
Figure 5.
Probability plot for annealed electrolytic copper wire [6]; two-parameter Weibull probability paper.
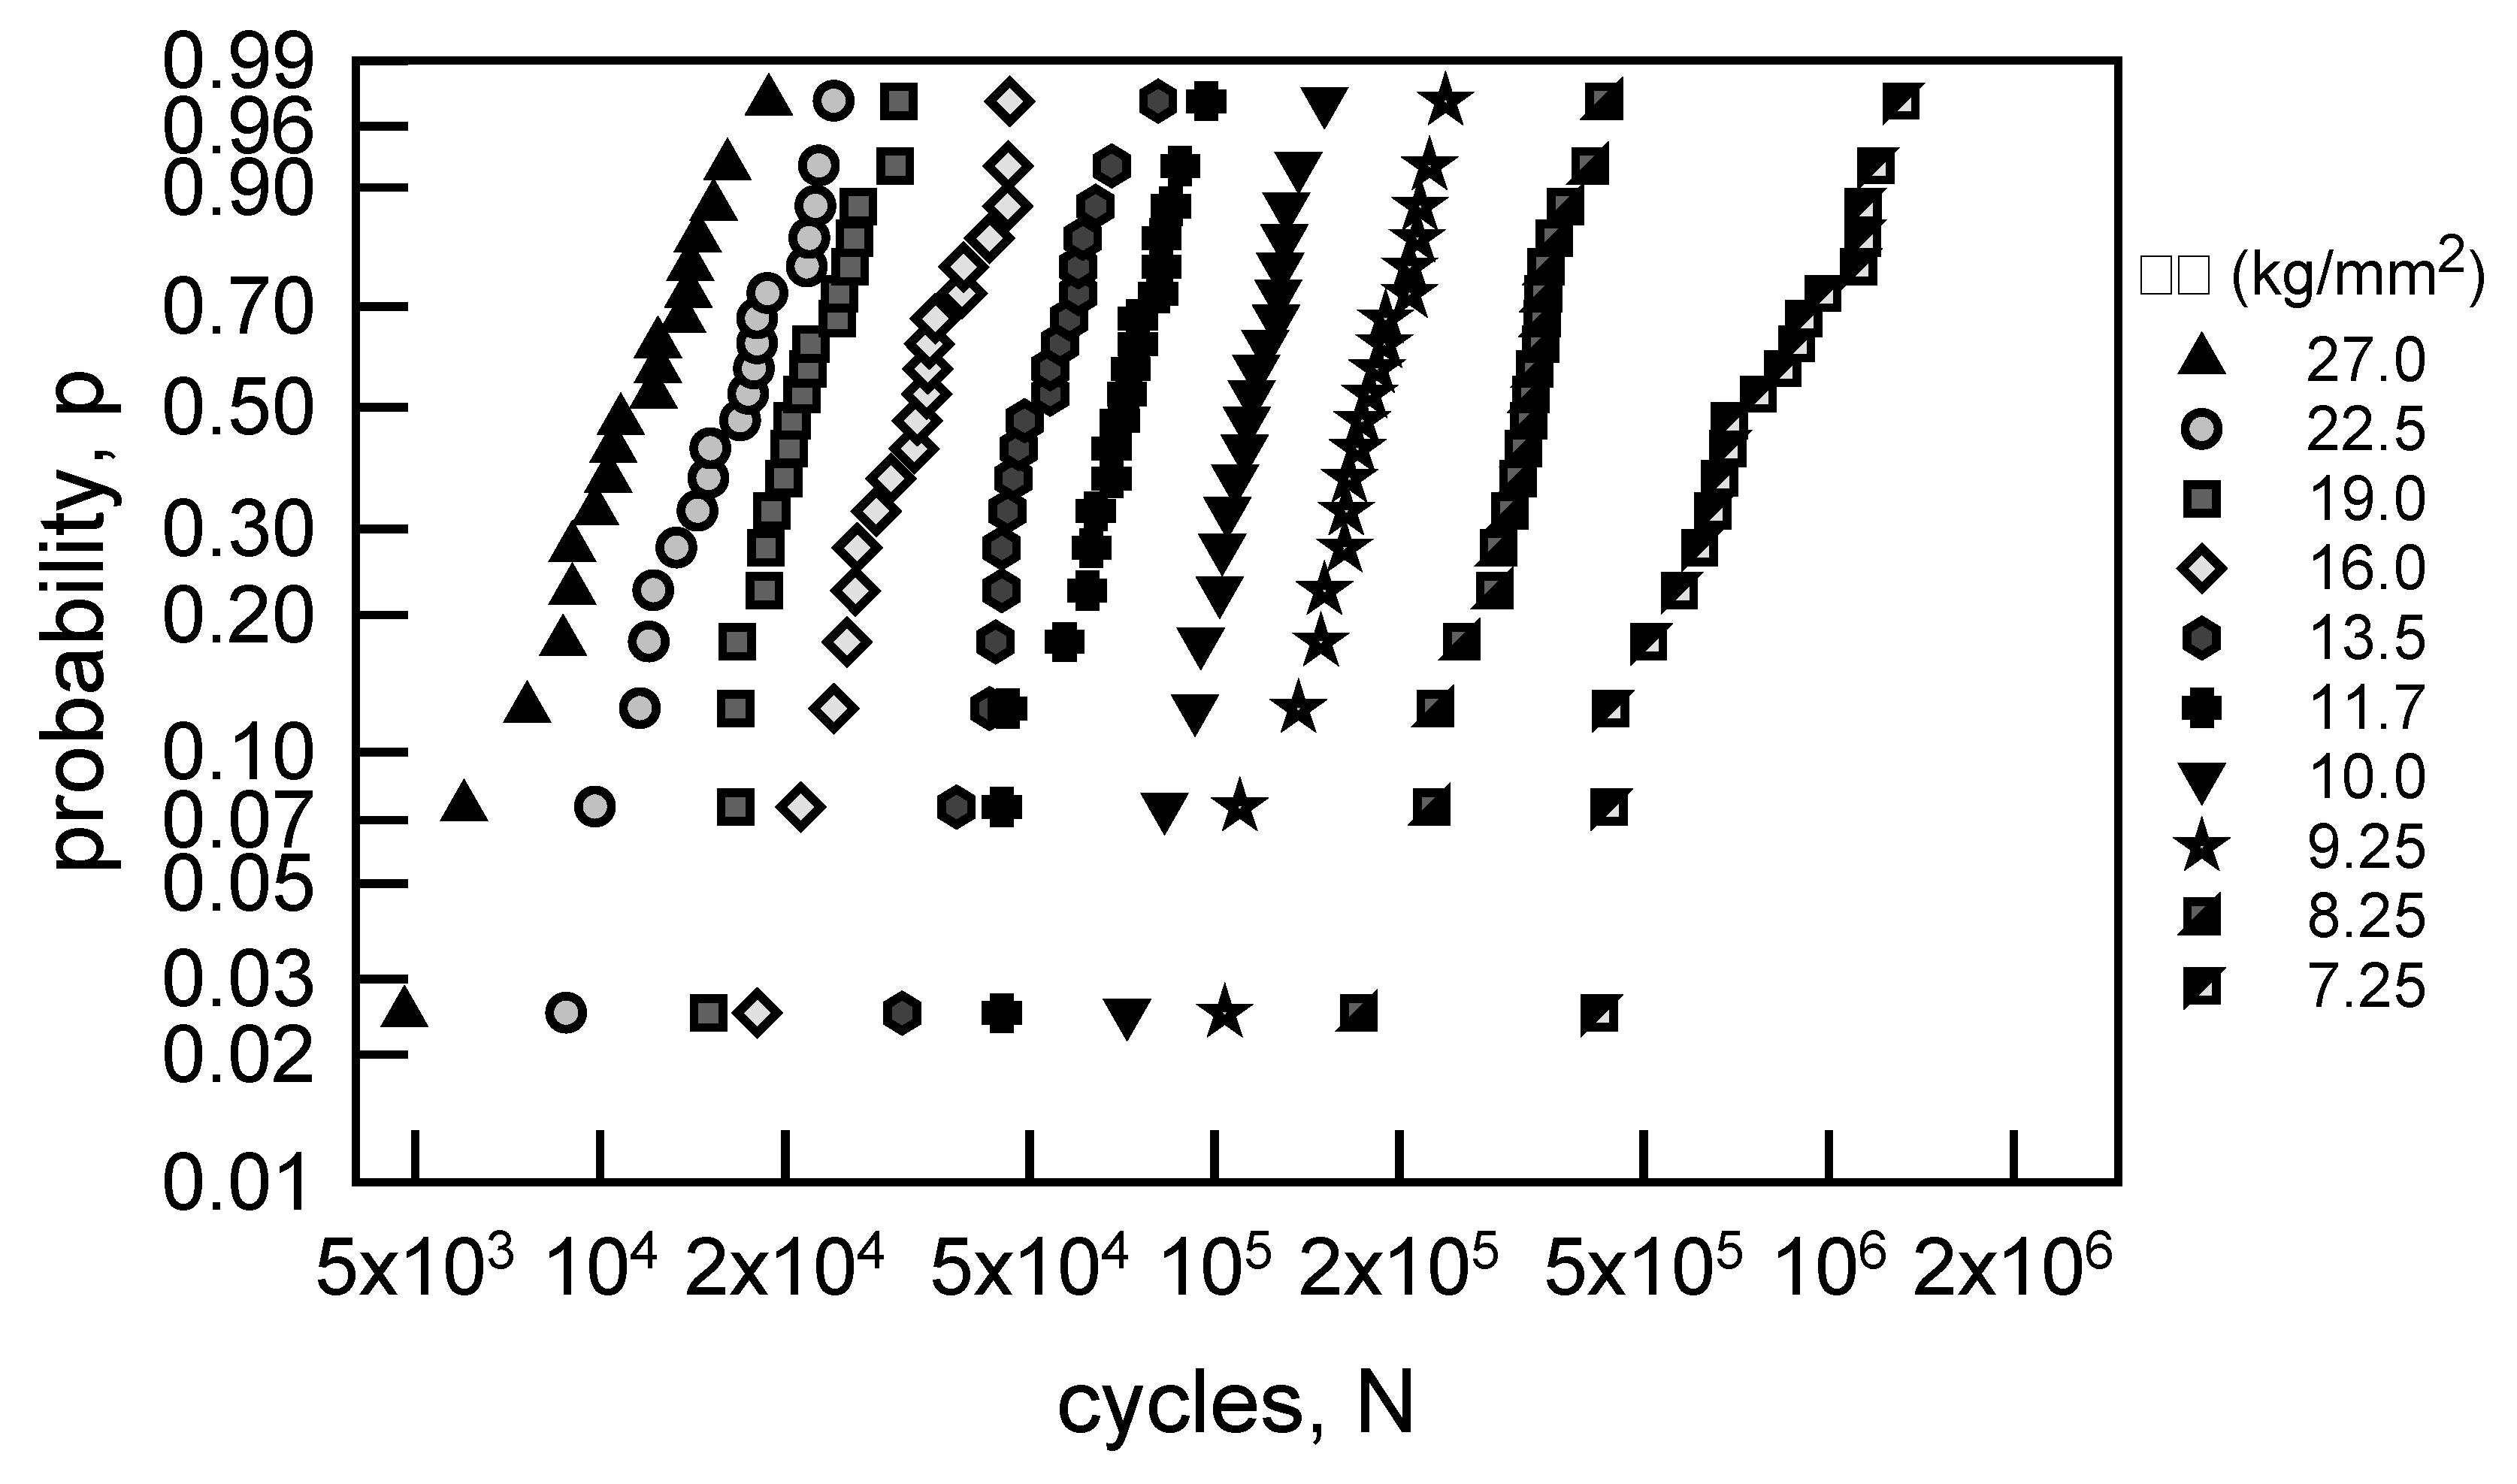
Figure 6.
S-N data for annealed electrolytic copper wire [6] with MLE estimates of medians and 2.5% probability for median curve and a lower confidence bound.
Figure 6.
S-N data for annealed electrolytic copper wire [6] with MLE estimates of medians and 2.5% probability for median curve and a lower confidence bound.

Figure 7.
Probability plot for annealed aluminum wire [6]; two-parameter Weibull probability paper.
Figure 7.
Probability plot for annealed aluminum wire [6]; two-parameter Weibull probability paper.
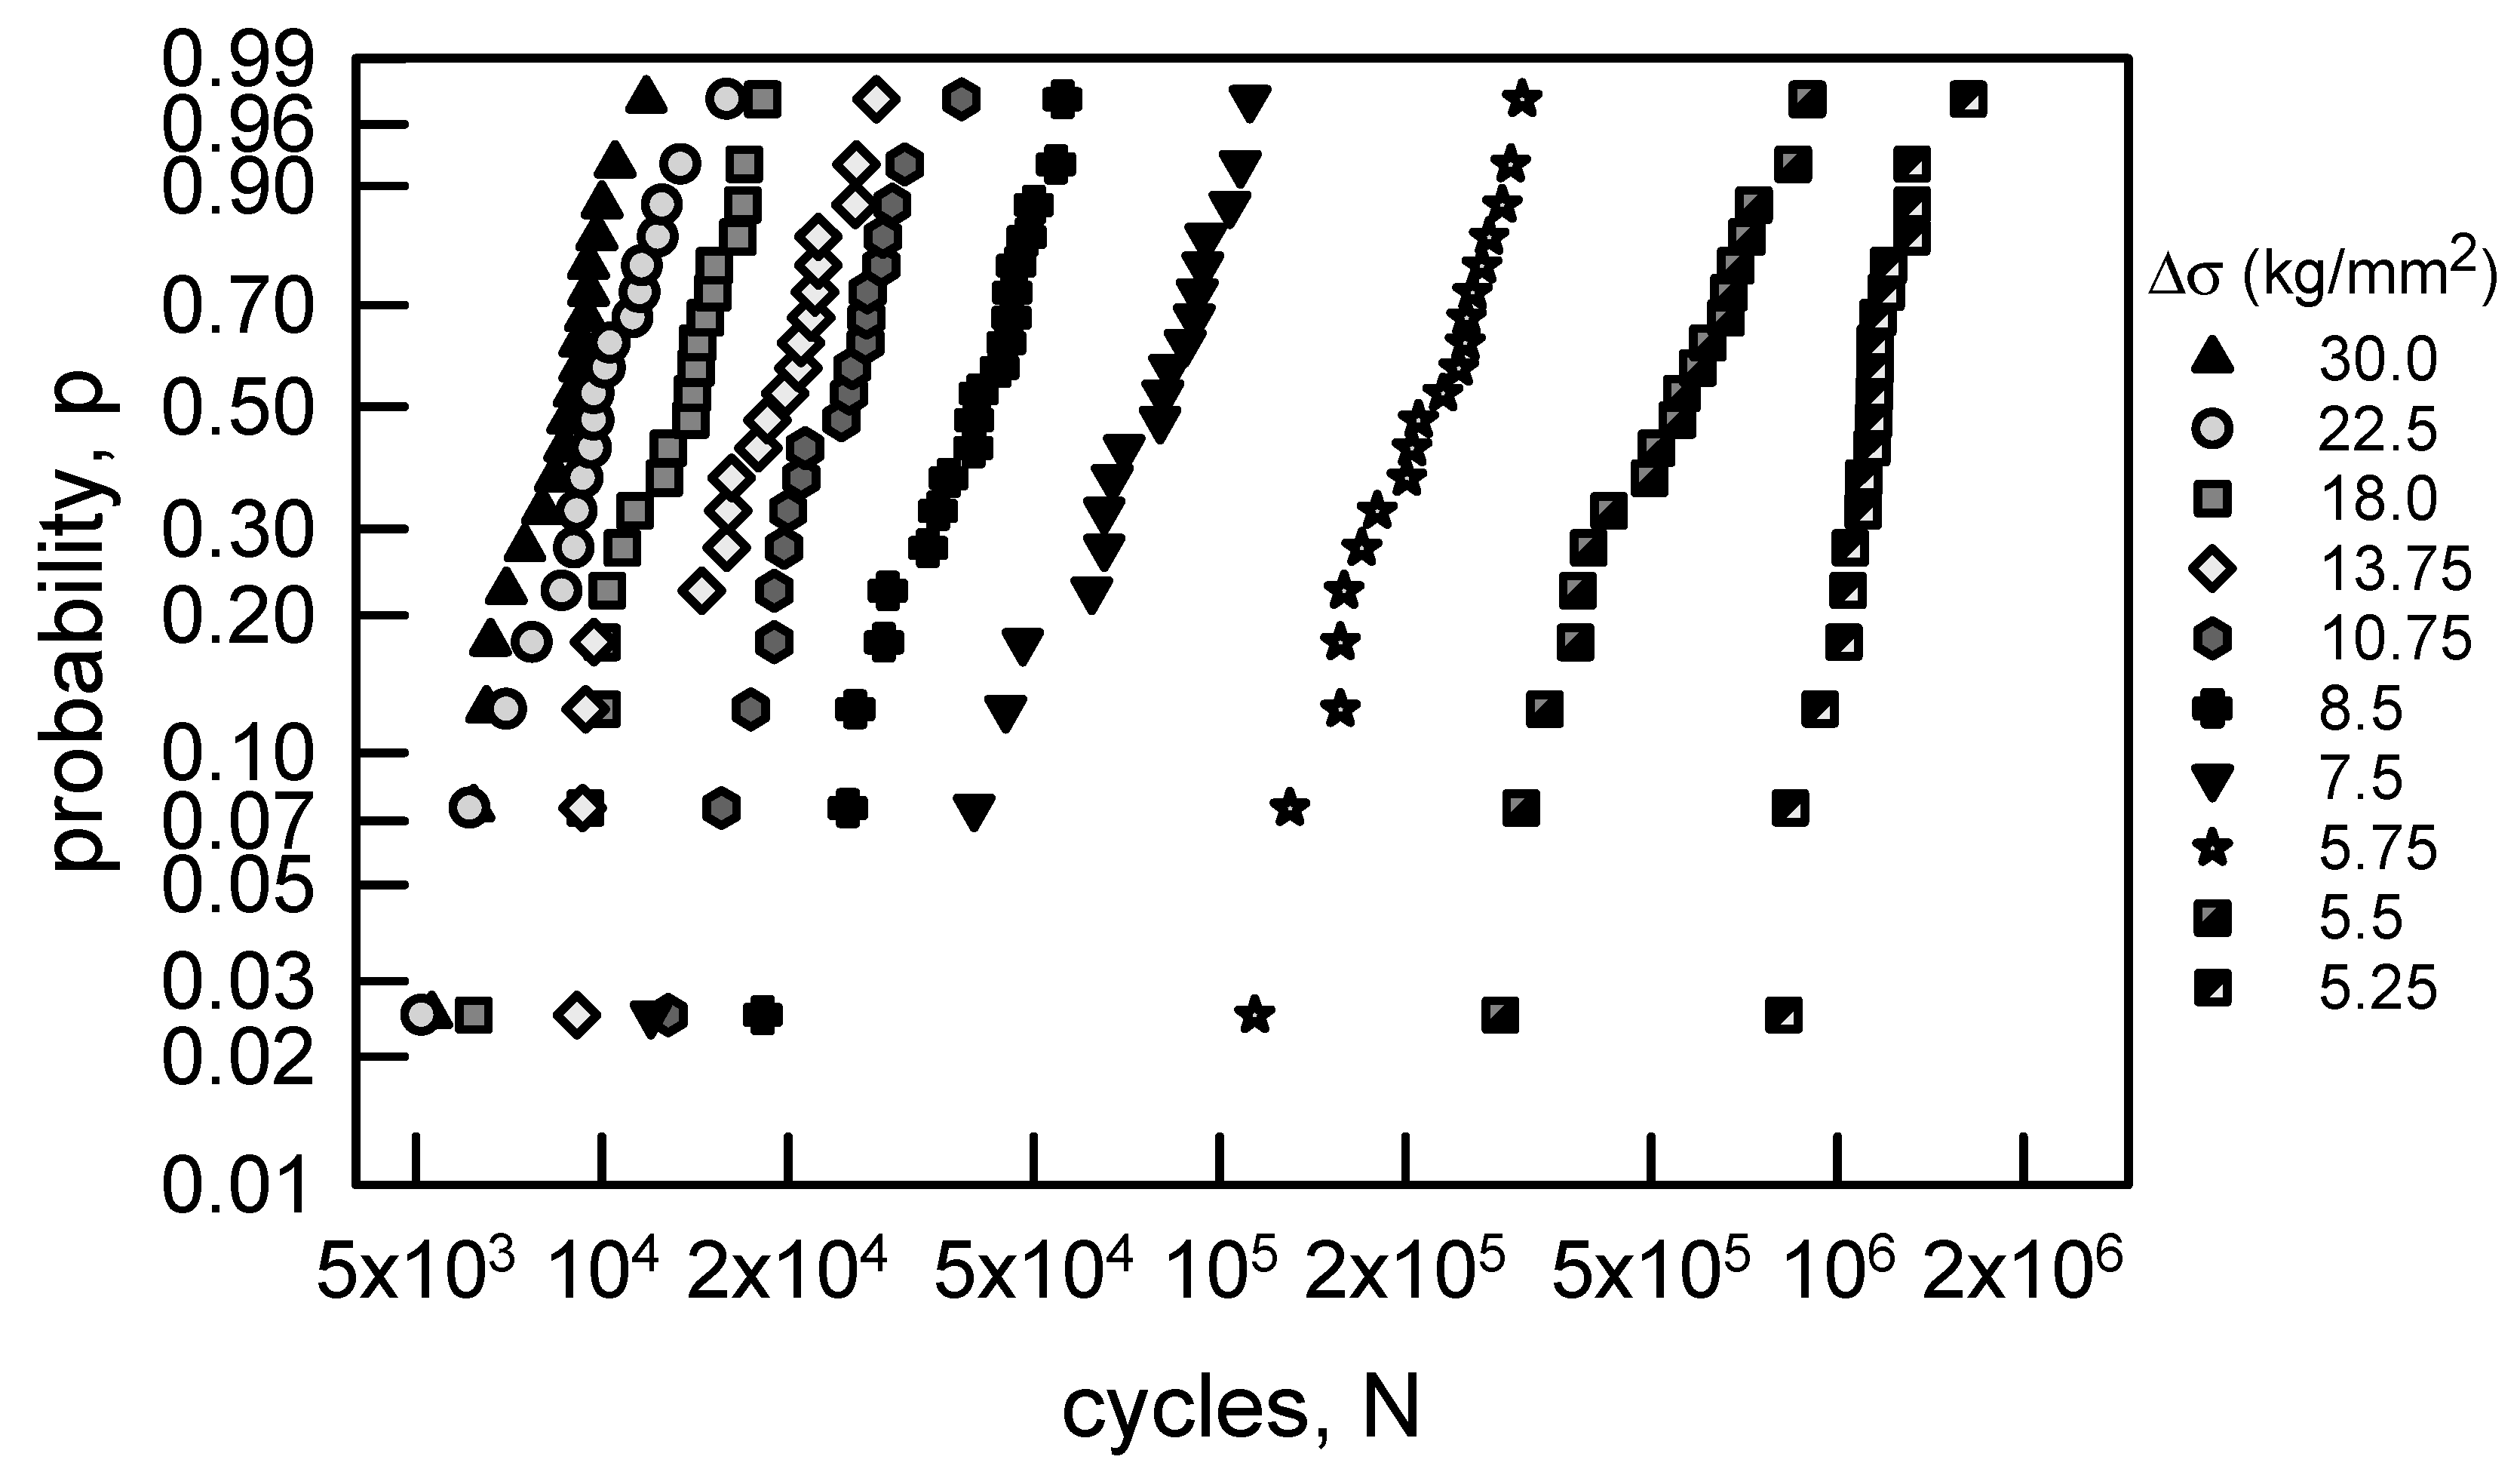
Figure 8.
S-N data for annealed aluminum wire [6] with MLE estimates of medians and 2.5% probability for median curve and a lower confidence bound.
Figure 8.
S-N data for annealed aluminum wire [6] with MLE estimates of medians and 2.5% probability for median curve and a lower confidence bound.
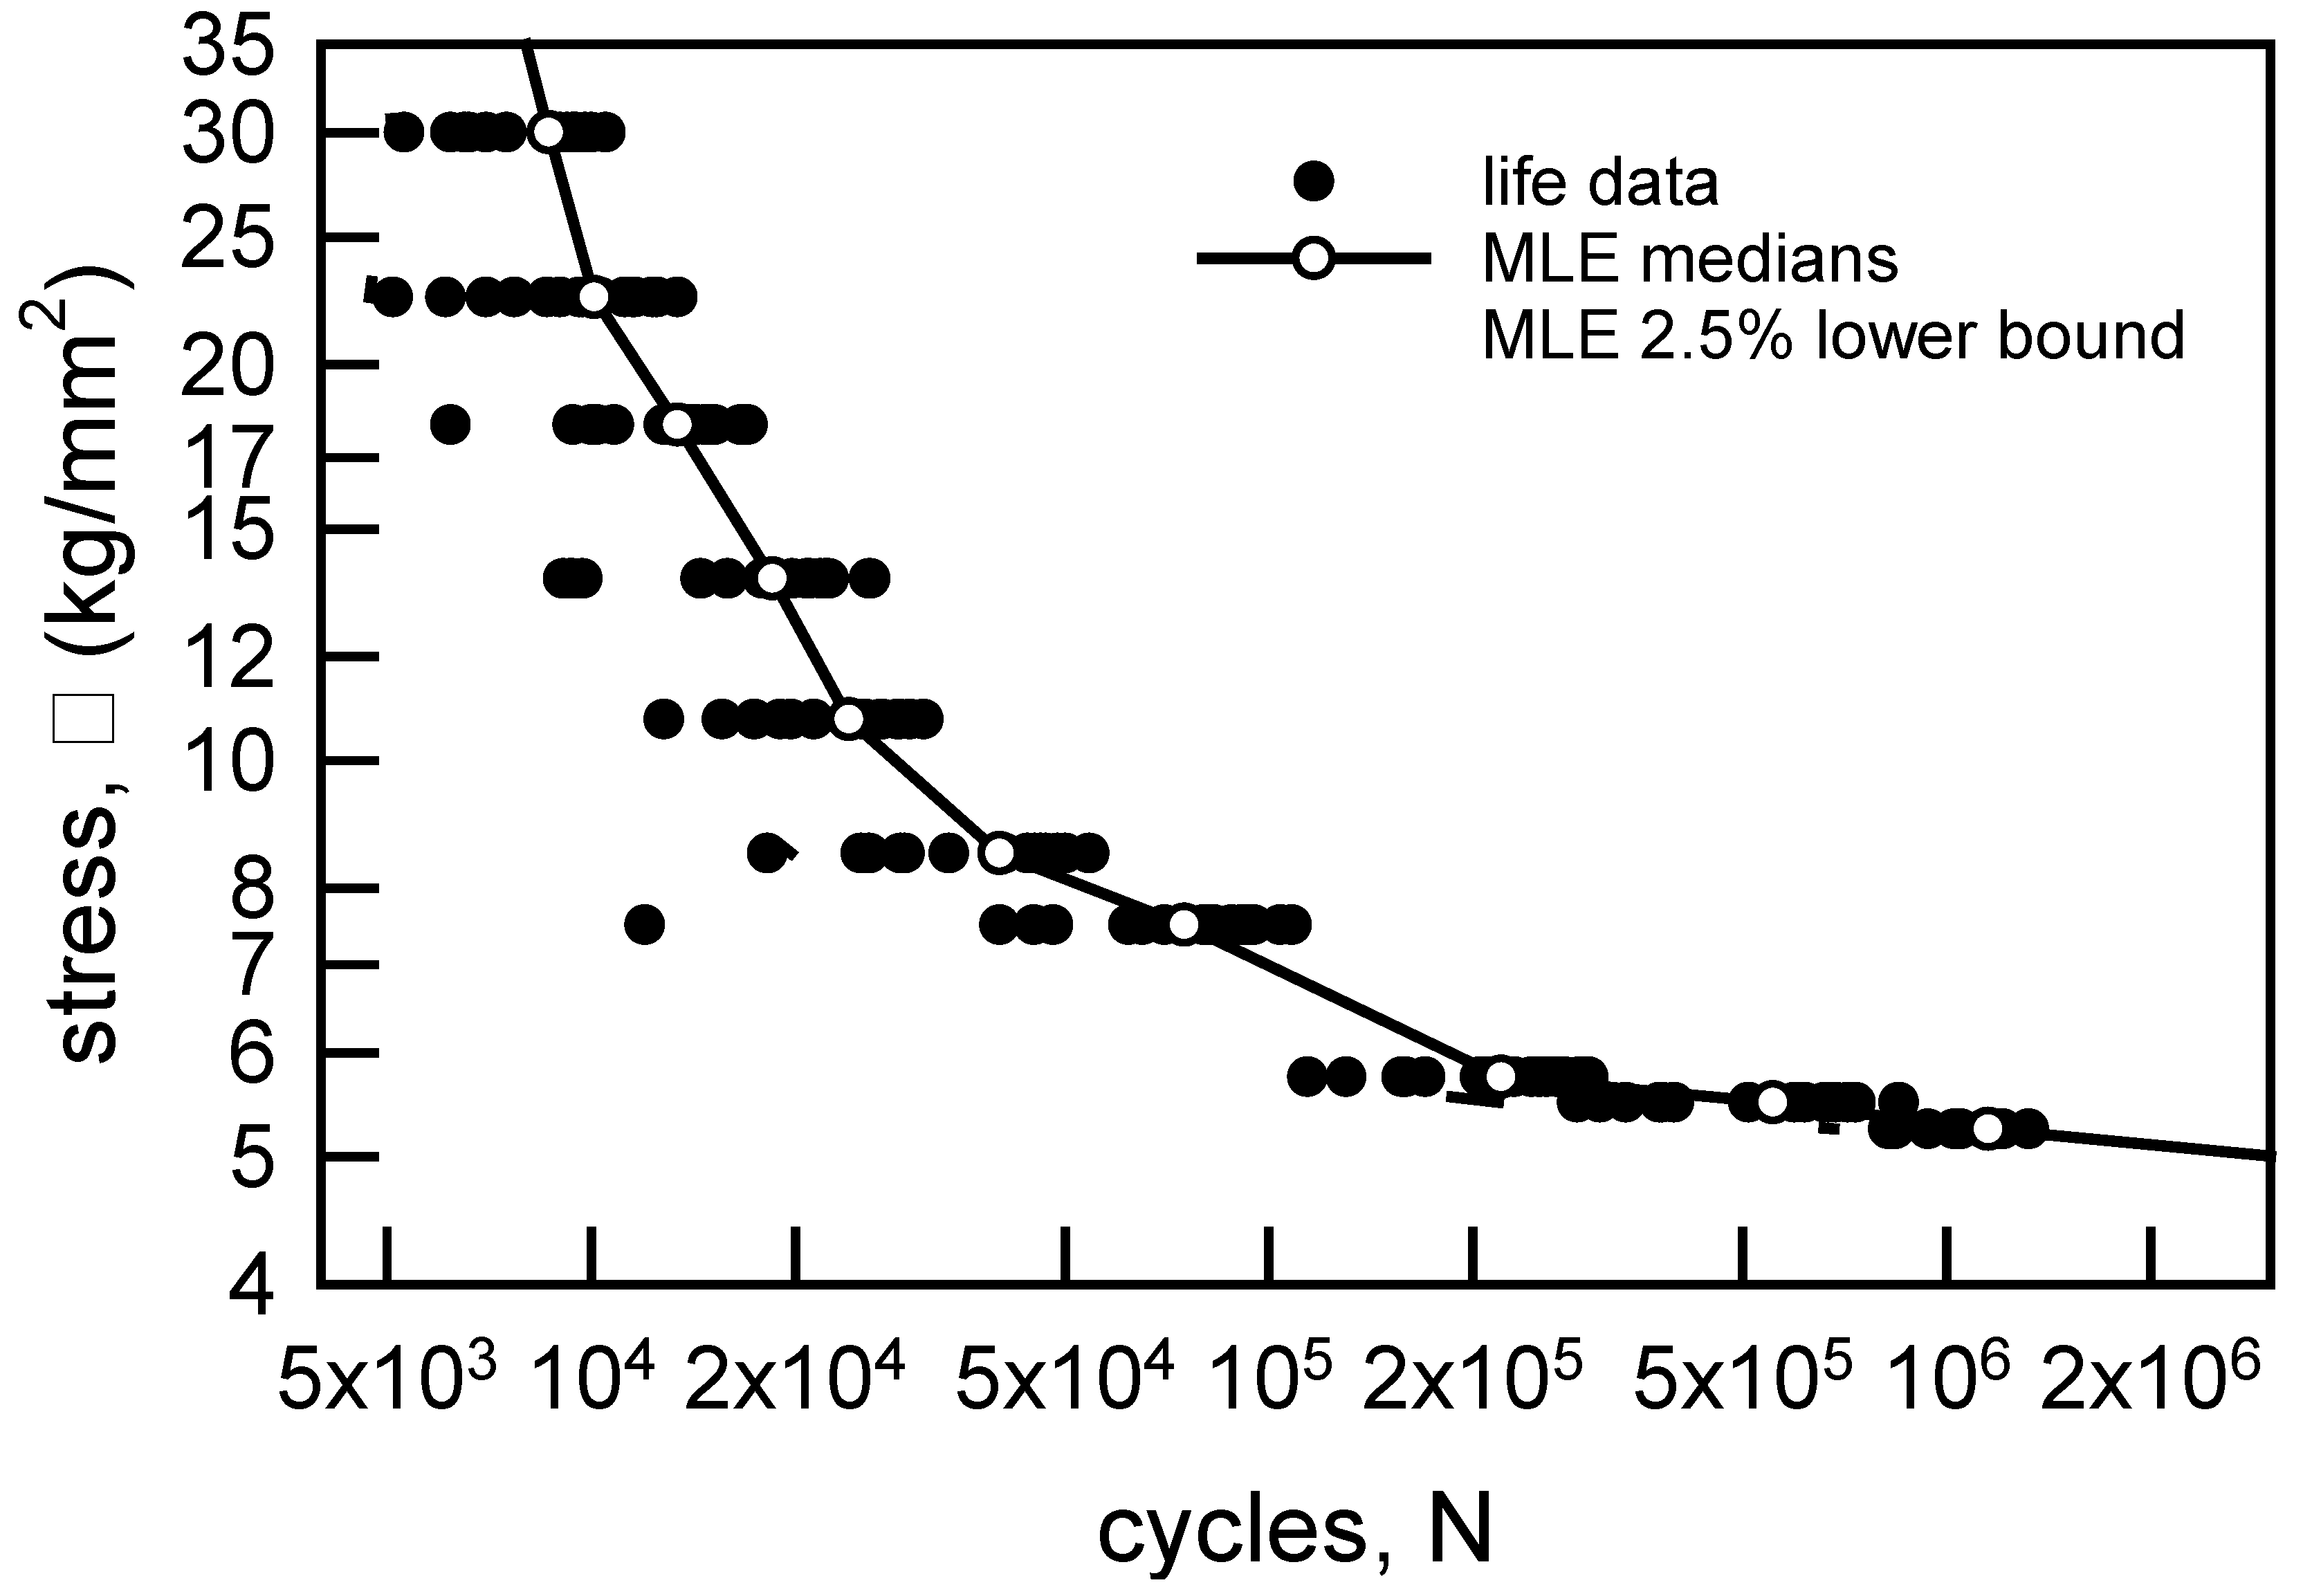
Figure 9.
S-N data for annealed electrolytic copper wire [6] with estimated median, 2.5 percentile, and 0.5 percentile lines.
Figure 9.
S-N data for annealed electrolytic copper wire [6] with estimated median, 2.5 percentile, and 0.5 percentile lines.
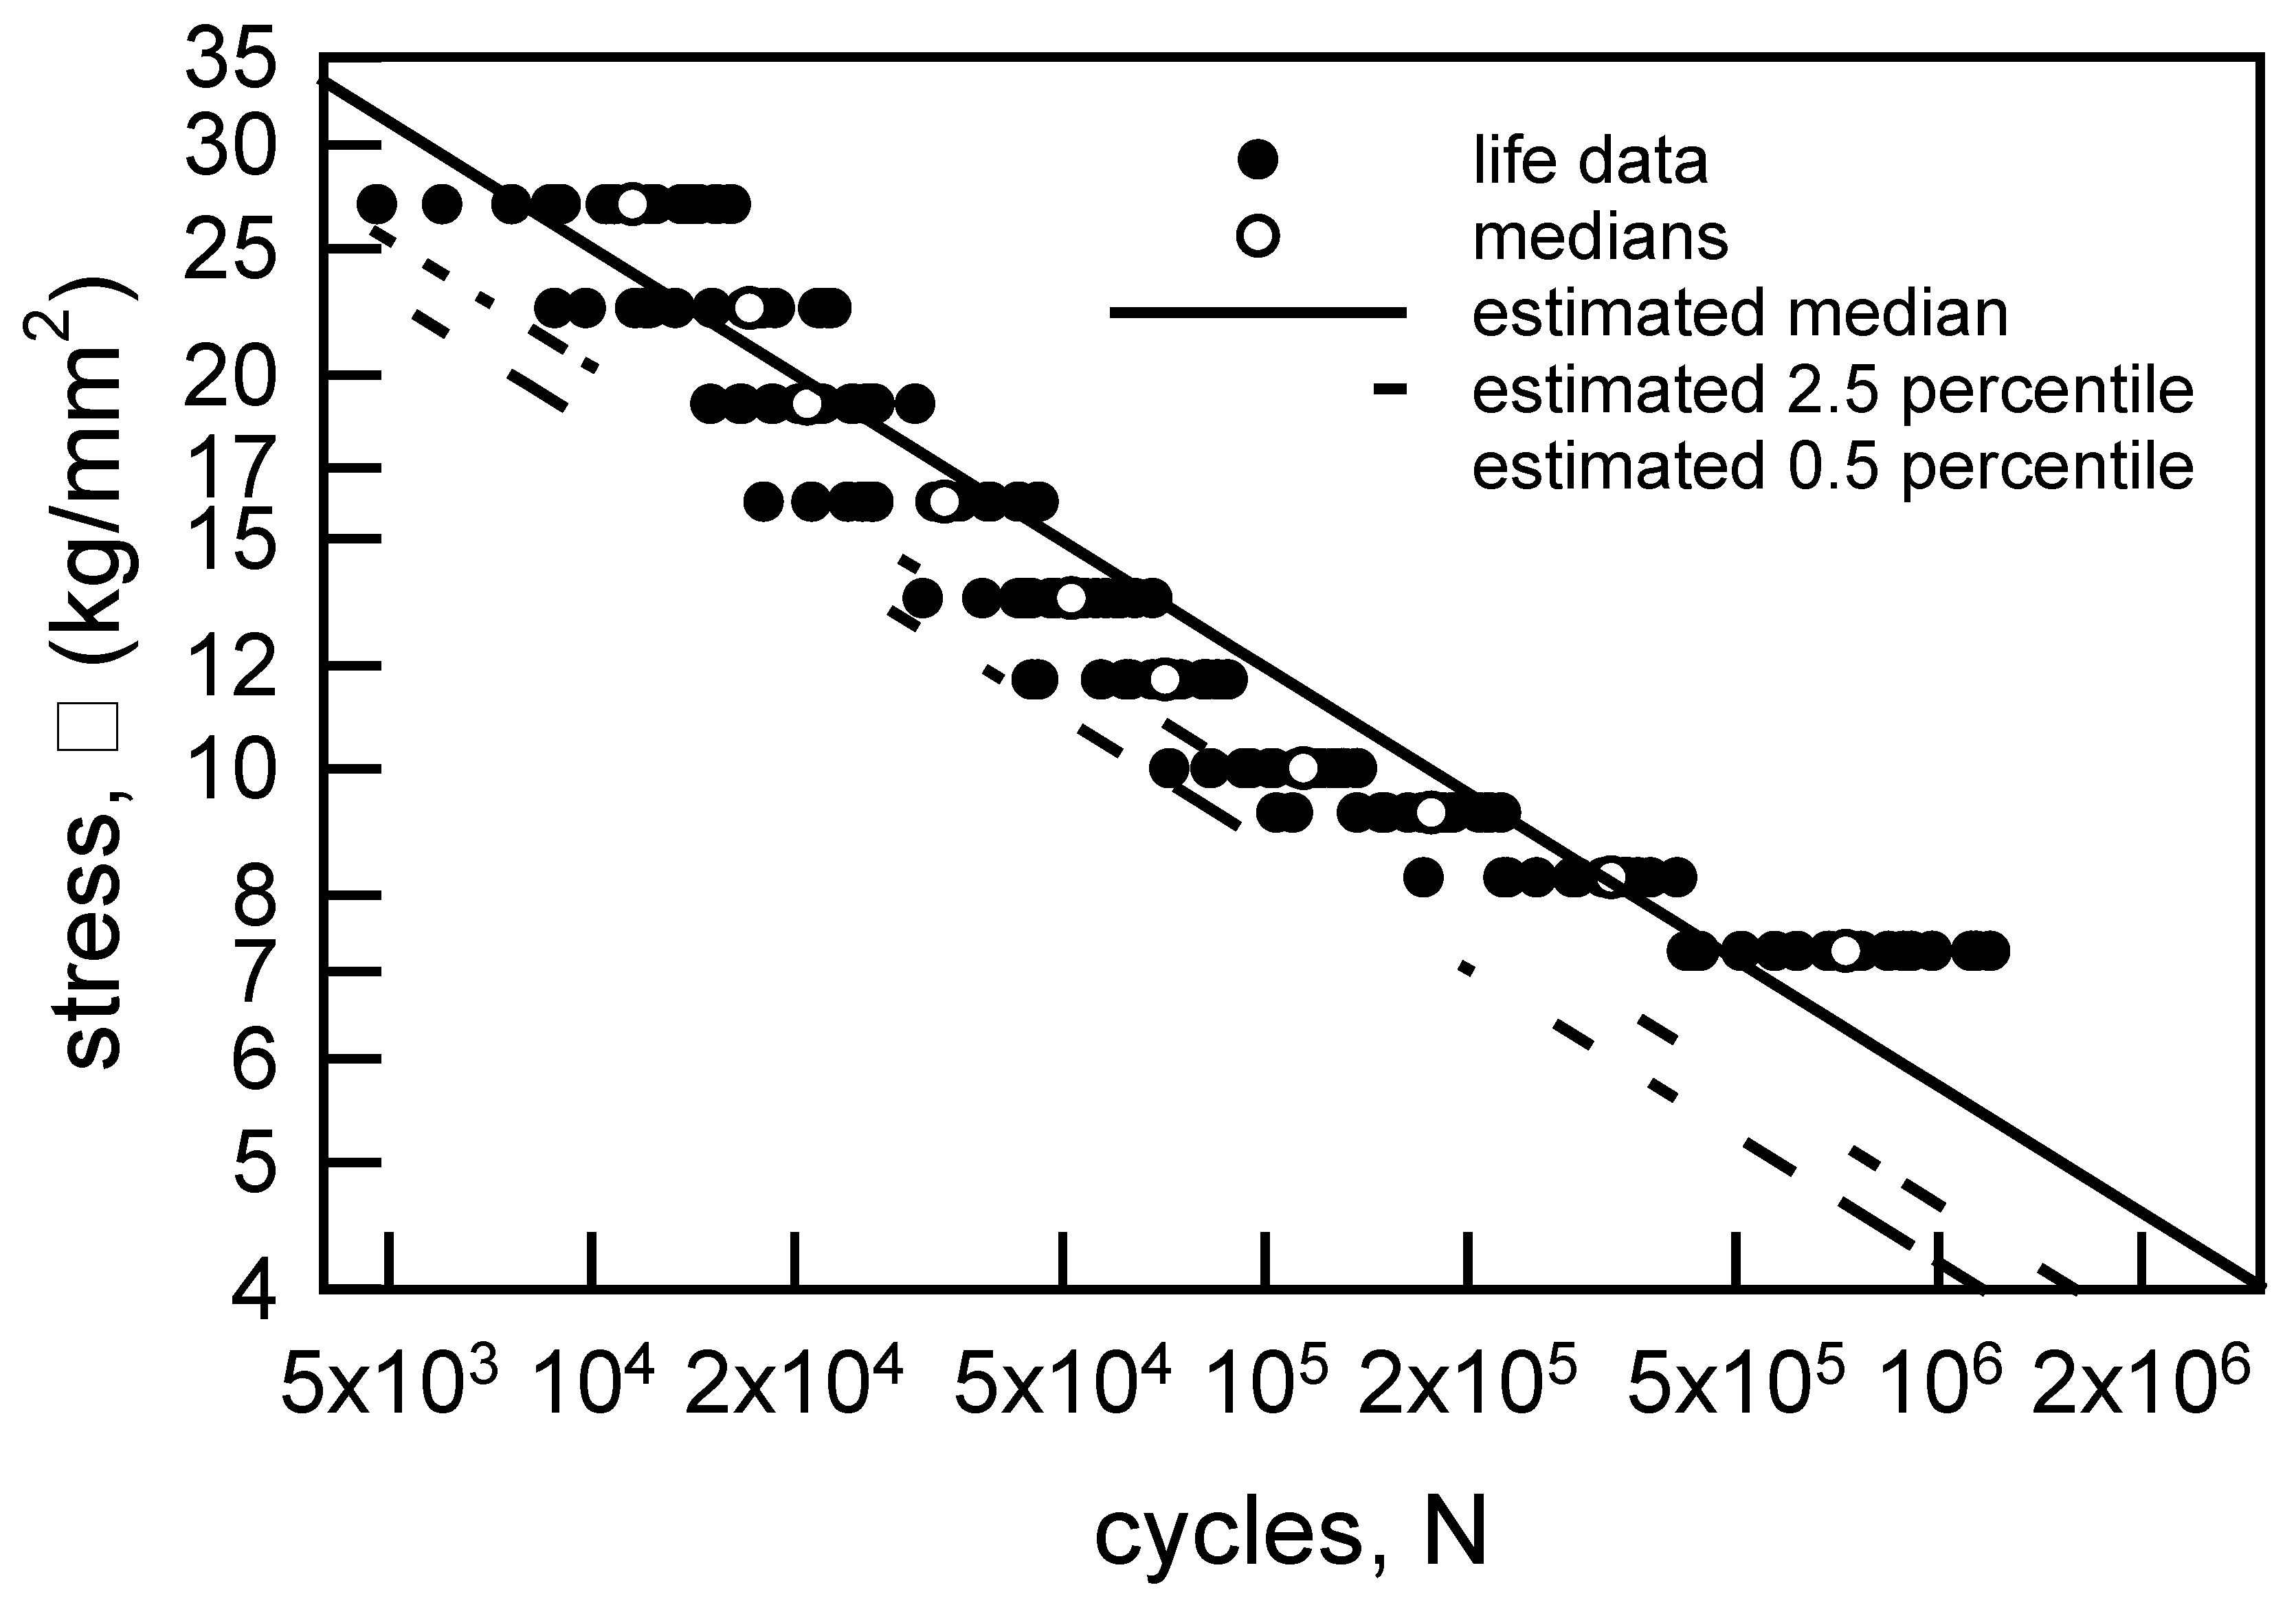
Figure 10.
S-N data for annealed aluminum wire [6] with an estimated bilinear regression for the medians and the 0.5 percentile lines.
Figure 10.
S-N data for annealed aluminum wire [6] with an estimated bilinear regression for the medians and the 0.5 percentile lines.
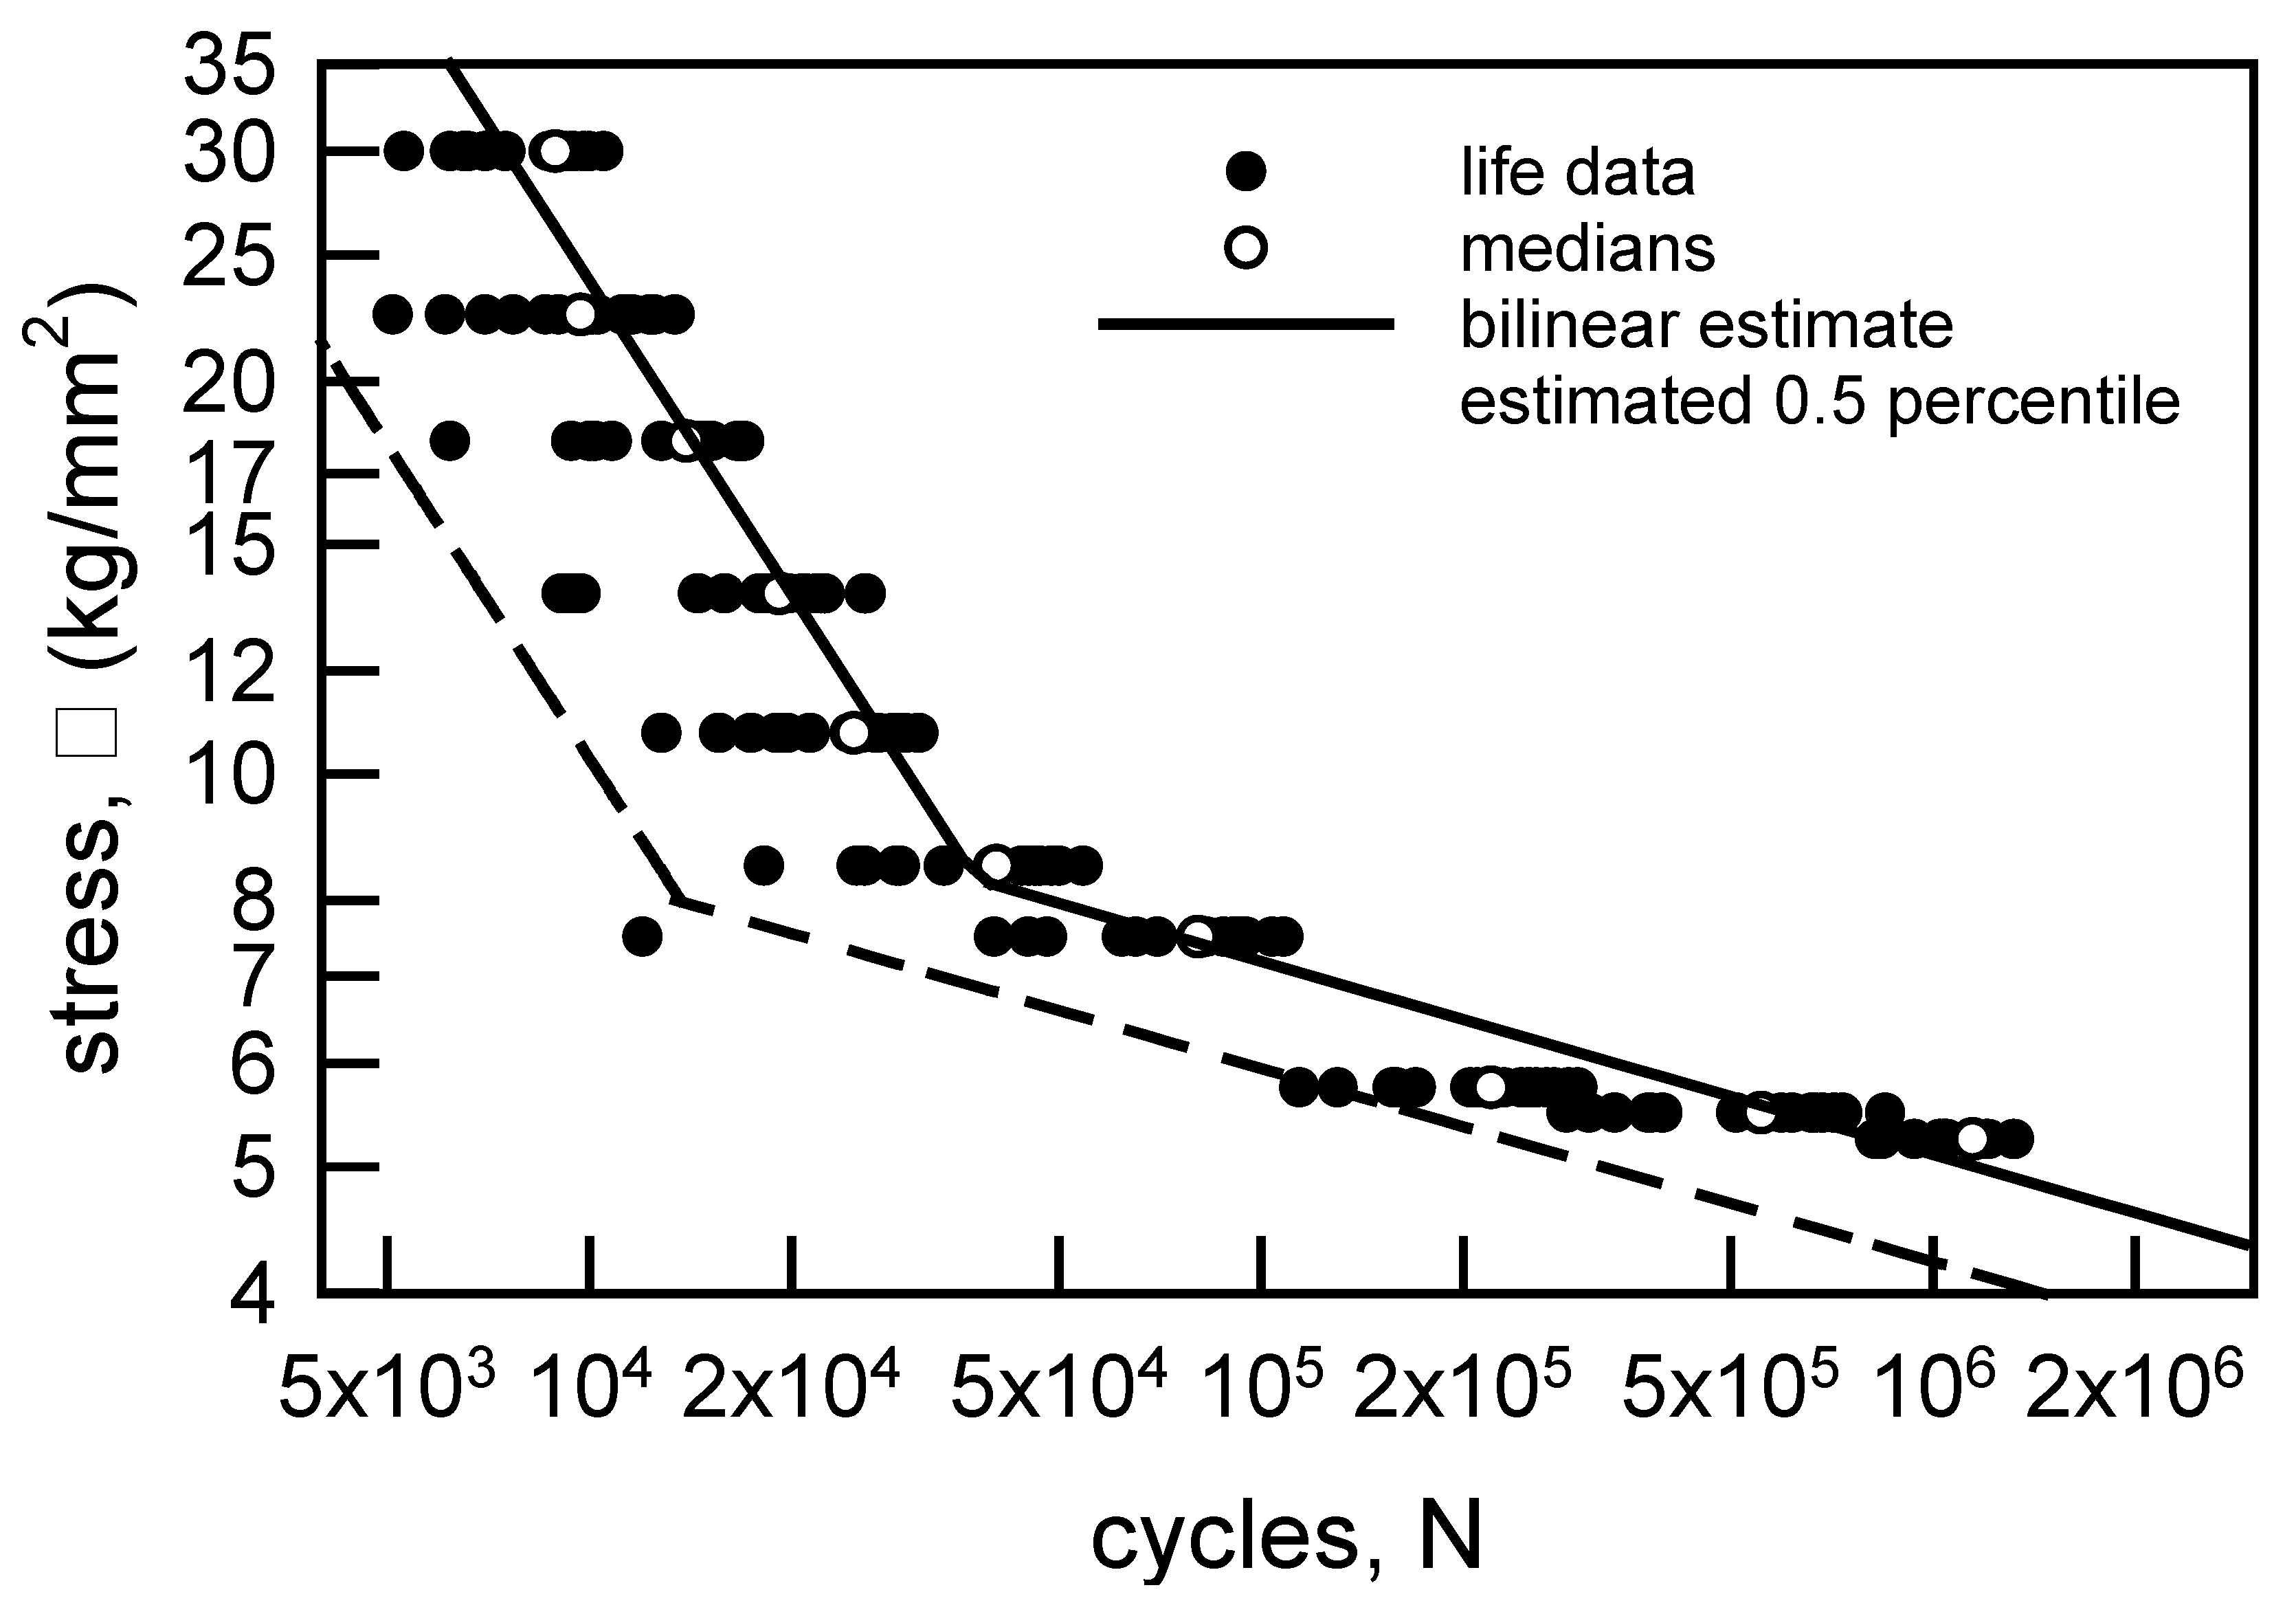

Table 1.
Sample properties for annealed electrolytic copper wire [6].
Table 1.
Sample properties for annealed electrolytic copper wire [6].
| Stress Amplitude, σ (kg/mm2) | Sample Size | Sample Median | Sample Average | Sample Standard Deviation | Sample cv (%) |
|---|---|---|---|---|---|
| 27.0 | 20 | 11500 | 11480 | 3497 | 30.5 |
| 22.5 | 20 | 17150 | 16585 | 4492 | 27.1 |
| 19.0 | 20 | 20900 | 21705 | 4444 | 20.5 |
| 16.0 | 20 | 33400 | 33020 | 8381 | 25.4 |
| 13.5 | 20 | 51500 | 52600 | 11399 | 21.7 |
| 11.7 | 20 | 71000 | 69900 | 14330 | 20.5 |
| 10.0 | 20 | 114000 | 113450 | 19083 | 16.8 |
| 9.25 | 20 | 176500 | 176950 | 35922 | 20.3 |
| 8.25 | 20 | 326500 | 315850 | 61750 | 19.6 |
| 7.25 | 20 | 728000 | 798000 | 274770 | 34.4 |
Table 2.
Sample properties for annealed aluminum wire [6].
Table 2.
Sample properties for annealed aluminum wire [6].
| Stress Amplitude, σ (kg/mm2) | Sample Size | Sample Median | Sample Average | Sample Standard Deviation | Sample cv (%) |
|---|---|---|---|---|---|
| 30.0 | 20 | 8900 | 8545 | 1616 | 18.9 |
| 22.5 | 20 | 9700 | 9985 | 2538 | 25.4 |
| 18.0 | 20 | 13950 | 13170 | 3084 | 23.4 |
| 13.75 | 20 | 19150 | 18305 | 5741 | 31.4 |
| 10.75 | 20 | 24750 | 23825 | 6004 | 25.2 |
| 8.5 | 20 | 40350 | 39440 | 10292 | 26.1 |
| 7.5 | 20 | 80500 | 75100 | 25319 | 33.7 |
| 5.75 | 20 | 220000 | 217300 | 57424 | 26.4 |
| 5.5 | 20 | 555500 | 552150 | 177149 | 32.1 |
| 5.25 | 20 | 1146000 | 1140200 | 179961 | 15.8 |
Table 3.
MLE parameter estimates for the two-parameter Weibull cdf for annealed electrolytic copper wire [6].
Table 3.
MLE parameter estimates for the two-parameter Weibull cdf for annealed electrolytic copper wire [6].
| σ (kg/mm2) | (cyc) | (cyc) | (%) | KS | AD | |
|---|---|---|---|---|---|---|
| 27.0 | 3.75 | 12,700 | 11,500 | 29.8 | 0.082 | 0.137 |
| 22.5 | 4.31 | 18,300 | 16,600 | 26.2 | 0.093 | 0.305 |
| 19.0 | 5.28 | 23,500 | 21,700 | 21.8 | 0.115 | 0.444 |
| 16.0 | 4.52 | 36,200 | 33,100 | 25.1 | 0.119 | 0.321 |
| 13.5 | 4.89 | 57,100 | 52,400 | 23.4 | 0.124 | 0.406 |
| 11.7 | 5.79 | 75,500 | 69,900 | 20.0 | 0.095 | 0.214 |
| 10.0 | 6.97 | 121,000 | 113,000 | 16.9 | 0.079 | 0.131 |
| 9.25 | 5.94 | 191,000 | 177,000 | 19.5 | 0.080 | 0.182 |
| 8.25 | 6.13 | 334,000 | 316,000 | 19.0 | 0.122 | 0.323 |
| 7.25 | 3.28 | 892,000 | 800,000 | 33.5 | 0.152 | 0.386 |
Table 4.
MLE parameter estimates for the two-parameter Weibull cdf for annealed aluminum wire [6].
Table 4.
MLE parameter estimates for the two-parameter Weibull cdf for annealed aluminum wire [6].
| σ (kg/mm2) | (cyc) | (cyc) | (%) | KS | AD | |
|---|---|---|---|---|---|---|
| 30.0 | 6.22 | 9,190 | 8,530 | 18.7 | 0.093 | 0.284 |
| 22.5 | 4.35 | 10,900 | 9,960 | 26.0 | 0.113 | 0.251 |
| 18.0 | 5.19 | 14,300 | 13,200 | 22.1 | 0.098 | 0.271 |
| 13.75 | 3.81 | 20,300 | 18,400 | 29.3 | 0.142 | 0.472 |
| 10.75 | 4.36 | 26,100 | 23,800 | 26.0 | 0.112 | 0.292 |
| 8.5 | 4.66 | 43,200 | 39,500 | 24.4 | 0.106 | 0.247 |
| 7.5 | 3.49 | 83,100 | 74,800 | 31.7 | 0.064 | 0.395 |
| 5.75 | 4.52 | 239,000 | 218,000 | 25.1 | 0.106 | 0.297 |
| 5.5 | 3.54 | 615,000 | 553,000 | 31.3 | 0.110 | 0.227 |
| 5.25 | 6.34 | 1,22,0000 | 1,130,000 | 18.4 | 0.181 | 0.847 |
Table 5.
MLE parameter estimates for the three-parameter Weibull cdf for annealed aluminum wire [6].
Table 5.
MLE parameter estimates for the three-parameter Weibull cdf for annealed aluminum wire [6].
| σ (kg/mm2) | (cyc) | (cyc) | (cyc) | (%) | KS | AD | |
|---|---|---|---|---|---|---|---|
| 30.0 | 1.95 | 3,660 | 5,130 | 8380 | 20.7 | 0.076 | 0.680 |
| 22.5 | 1.81 | 5,450 | 4,930 | 9780 | 28.4 | 0.064 | 0.484 |
| 18.0 | 2.11 | 7,730 | 5,990 | 12,800 | 26.6 | 0.073 | 0.628 |
| 13.75 | 1.20 | 9,710 | 8,830 | 18,000 | 42.6 | 0.146 | 1.669 |
| 10.75 | 1.76 | 12,300 | 12,400 | 23,400 | 27.5 | 0.079 | 0.417 |
| 8.5 | 1.91 | 23,600 | 17,600 | 38,500 | 29.6 | 0.084 | 0.643 |
| 7.5 | 2.03 | 68,100 | 11,600 | 71,900 | 43.3 | 0.111 | 1.142 |
| 5.75 | 1.66 | 115,000 | 110,000 | 213,000 | 29.9 | 0.083 | 0.548 |
| 5.5 | 1.36 | 291,000 | 276,000 | 542,000 | 36.5 | 0.062 | 0.416 |
| 5.25 | 1.74 | 364,000 | 796,000 | 1,120,000 | 17.2 | 0.101 | 0.806 |
Disclaimer/Publisher’s Note: The statements, opinions and data contained in all publications are solely those of the individual author(s) and contributor(s) and not of MDPI and/or the editor(s). MDPI and/or the editor(s) disclaim responsibility for any injury to people or property resulting from any ideas, methods, instructions or products referred to in the content. |
© 2023 by the authors. Licensee MDPI, Basel, Switzerland. This article is an open access article distributed under the terms and conditions of the Creative Commons Attribution (CC BY) license (http://creativecommons.org/licenses/by/4.0/).
Copyright: This open access article is published under a Creative Commons CC BY 4.0 license, which permit the free download, distribution, and reuse, provided that the author and preprint are cited in any reuse.


