
Submitted:
06 June 2023
Posted:
06 June 2023
You are already at the latest version
Abstract
Drag-dominant tidal turbine energy holds tremendous clean energy potential but faces significant hurdles as unsuitability of Disk Actuator theory due to the varying swept blockage area, unaccounted bypass flow downstream interaction and rotor parasitic drag whereas Blade Element Momentum theory is computably effective for majorly 3-blade lift-dominated aerofoil. This study proposes a novel method to find the optimal TSR of any turbine with a cost-effective and user-friendly Moment Balancing algorithm to support robust tidal energy development. Performance analysis CFD study of Pinwheel and Savonius tidal turbines was carried out. Dynamic TSR matrix was developed with varying rotational speeds and fluid velocities for reliability, unlike previous works simulated at a fixed fluid velocity. Novel parameters such as thrust and idle moment are introduced as functions of only inlet fluid velocity and rotational speed respectively. These relationships are verified through regression analysis, and the turbines' net moment equations are established based on these parameters. Rotational speed was a reliable predictor for Pinwheel's idle moment, while inlet velocity was a reliable predictor for thrust moment in both models. The optimal (Cp, TSR) values for Pinwheel and Savonius turbines were (2.37, 0.223) and (0.63, 0.16) respectively, within an acceptable error range for experimental validation.
Keywords:
Drag-Dominant Tidal Turbine
; Computational Sustainability
; Turbomachinery Moment Analysis
; Savonius
; Pinwheel
1. Introduction
The potential of tidal energy as a reliable source of energy has been identified as a means of providing economic relief to communities located near coastlines or tidal channels. This sustainable energy source has the capacity to generate more than 130,000 terawatt-hours of electricity per year (IRENA, 2020). By utilizing smart grid infrastructure, the energy generated from tidal and wave technologies can be used to power residential, commercial, and tourism sectors, with the potential to meet 10% of the EU’s power demand by 2050 (European Commission, 2020). For this purpose, drag-dominated tidal turbines (DDTTs) with simpler geometries and lower flow velocities are ideal for deployment in slow water currents. These turbines include axial or crossflow turbines with a horizontal or vertical axis of rotation, respectively. In this study, Pinwheel and Savonius are selected as two typical examples of turbine correspondingly.
To balance the computational cost, time and accuracy, various simulation techniques for turbomachinery simulation were developed. The Disk Actuator model, which assumes the presence of a rotating virtual disc with or without porous holes perpendicular to the inflow direction around the rotor (Yilmaz and Meyers, 2014), is found not suitable for use with vertical-axis turbines due to the varying sweep area of the rotor plate (Churchfield et al., 2017) and the unsteady effect of the unaccounted bypass flow interaction on the downstream wake for horizontal-axis turbines (Whelan, et al., 2009). Furthermore, it does not account for parasitic drag on the rotor and support walls in both turbine configurations (Muchala and Willden, 2017). The Blade Element Momentum (BEM) theory, which is computationally effective for lift-dominated aerofoils (Koh and Ng, 2016), is found unsuitable for drag-dominated hydrofoils that are not always NACA-series type (Pucci, et al., 2022). Thus, it is necessary to explore a sustainable computation method capable of testing the performance of various tidal turbine designs.
Commercial solvers like Ansys Fluent utilize expensive and labor-intensive models to optimize turbine design by coupling them with complex mathematical programming for flow simulations. However, this approach increases the complexity of the solution, necessitating a more efficient method. Experimental validation for tidal turbines is a challenge for authors, as the required apparatus is significantly more expensive compared to wind tunnel equipment. This study proposes a novel parametric study approach for performance optimisation. The proposed technique involves the integration of a cost-effective and user-friendly moment balancing algorithm, which combines the Moving Reference Frame (MRF) with hydrodynamic performance analysis. A preliminary result can be calculated to facilitate an engineer’s better understanding of the optimization process by selecting the most appropriate computational technique.
To optimize the design of a small horizontal axis wind turbine for low wind speed areas, (Islam, et al., 2019) applied the BEM theory through the Q-blade software and MATLAB script. (Nemoto and Ushiyama, 2003) conducted experimental evaluations of Pinwheel rotors with different cutting styles in a wind tunnel and found that as the number of blades increases, the Tip Speed Ratio (TSR) decreases, and the coefficient of power (CP) is maximum for the 4-bladed rotor. In another study, (Islam et al., 2021) compared the performances of eleven different configurations of Pinwheel wind turbines using Computational Fluid Dynamics (CFD) simulations and the Weibull distribution. Their findings suggest that an optimal TSR of 5.5, with a cut-in and cut-off speed of 1.65 m/s and 12.5 m/s, respectively, can be achieved. (Wihadi and Mardikus, 2020) discovered that the 2-bladed single-stage Savonius tidal turbine exhibited the highest power coefficient in experimental comparisons with those possessing 3 or 4 blades. (Biswas et al., 2007; Patel et al., 2021) performed experimental investigations in a wind tunnel that verified an inverse correlation between performance and the overlap ratio, which denotes the proportion of the turbine blade overlap area to the total blade swept area.
In the aspect of social and economic level, this paper will support the sustainable production and maximize the economic viability of tidal energy projects in coastal areas that are climate resilient, and straits form between small islands. Optimized performance can lead to reduced maintenance requirements by identifying and addressing potential performance issues, such as fatigue, wear, cavitation, or excessive loads throughout the lifespan of tidal turbines. This study also aims to promote collaboration and information sharing for faster technology maturation and widespread adoption of optimized solutions in tidal turbine development.
2. Methodology
2.1. Channel (Domain) Study and Model Description
The two rectangular channels with seawater continua for Pinwheel and Savonius turbines are indicated as in Figure 1 for further study. The simulation domains are investigating a parametric study between the two rectangular channels to equalize the aspect ratio and blockage ratio. The blockage ratio is the area occupied by the blades to the turbine inlet area whereas the aspect ratio is the ratio of a turbine blade’s length to the radius of the rotor. The downstream velocity fields are plotted under different TSRs to observe the blockage effect.
(Kumar and Saini, 2021) conducted experimental studies and numerical simulations to determine the optimal performance characteristics of a miniature Savonius turbine operating in a water channel with a low in-flow velocity of 0.5 m/s. The study revealed that the optimal TSR of 0.7 achieved the highest maximum power coefficient (CP) value of 0.23. A 2 mm sheet thickness was implemented based on (Salazar Marin and Rodríguez, 2019).
The Savonius blade and channel area from (Kumar and Saini, 2021) are utilised to calculate the blockage and aspect ratio as an example given in Eq. (1) and (2).
Similarly, these were applied to the Pinwheel’s domain for as given in Eq. (3) and (4).
Upon multiplying LHS and RHS of Eq. (3) by Y as given in Eq. (5) and substituting Y in Eq. (4), the Pinwheel channel width and height can be calculated as m.
The scales of the two models are summarized and virtual tank is shown in Table 1 and Figure 2 respectively.
The volume mesh overview and cross-sectional views are shown in Figure 3 and Figure 4 respectively. For the Pinwheel turbine, a grid number of 2,080,945 cells was selected based on a fluid velocity of 0.9 m/s, rotational velocity of 7.5 rad/s, and TSR of 2.5. For the Savonius turbine, a grid number of 1,069,955 cells was selected based on a fluid velocity of 0.5 m/s, rotational velocity of 6 rad/s, and TSR of 0.7. The grid independence tests are shown in Figure 5. Fluid temperature for Savonius and Pinwheel simulation is assumed at the default value at 25℃ and 20℃ with seawater densities of 997.56 kg/m3 and 1025 kg/m3 respectively. K-ε turbulence steady-state segregated solver with continuity criterion set to residuals of magnitude 10-3 was selected for both models. This consistent choice aids in comparison of the Cp -TSR performance curve simulation findings.
2.2. Moment Analysis
Previous works investigated moment analysis of a single turbine in either horizontal or vertical axis configuration by utilizing a fixed inlet flow speed scheme however, this study employs a dynamic TSR matrix for the simulations. In this study, two new moment definitions are introduced as the Idle and Thrust moments as functions of ICs, i.e., the rotational velocity and fluid velocity respectively. The aim is to establish an equilibrium state and describe a moment balancing equation to determine the optimal power coefficient Cp, opt. (Hara and Hayashi, 2012) study the performance dependence of VAWTs on the moment of inertia in an unsteady wind tunnel, and proposed Eq.(6) with the net angular momentum as a sum of torque of wind turbine , brake and load . The net moment when the turbine is stationary, but the fluid motion exerts load to rotate the turbine, is defined as the thrust moment, , governed by thrust coefficient and fluid velocity . Idle moment, , is defined when the turbine is rotating at constant speed in still water hence, a load is exerted on the turbine. It is governed by the viscosity and centrifugal force of the fluid.
By applying the principle of conservation of angular momentum and assuming steady operation in Eq. (6), the sum of the external moments is zero as derived in Eq. (8) or the form of Moment Balancing equation in Eq. (9):
where the thrust moment is the torque generated by the wind turbine i.e., and the idle moment is equal to the sum of the load torque and the braking torque i.e., . In the case of the horizontal axis Pinwheel turbine, the simulation result finds that the braking torque is zero, thus noted as .
The significance of Moment Balancing equation is to replace the unsteady cyclic volume force analysis with a simplified steady moment analysis. This method is useful in simulations for determining the values of and to achieve equilibrium. Engineers can determine the optimal power coefficient by observing their model results for the net moment approaching zero, indicating a neutral point where Idle and Thrust moment are equal and can be used interchangeably to calculate the power coefficient using Eq. (9).
The two varying independent variables i.e., and comprise a dynamic Tip Speed Ratio (TSR) matrix using Eq. (10), shown for both turbines as Table 2a,b. The turbine’s optimal TSR can be obtained by the Cp -TSR curve.

Table 2.
(a): Dynamic TSR matrix in different initial conditions for Pinwheel rotor.
| TSR | Rotational speed ω (rad/s) | ||||
|---|---|---|---|---|---|
| 6.67 | 7.50 | 8.00 | 8.17 | ||
|
Inlet speed U1 (m/s) |
0.40 | 0.80 | 0.80 | 0.79 | 0.81 |
| 0.50 | 1.08 | 1.15 | 1.16 | 1.19 | |
| 0.60 | 1.49 | 1.52 | 1.55 | 1.57 | |
| 0.70 | 1.94 | 1.99 | 2.03 | 2.06 | |
| 0.80 | 2.56 | 2.57 | 2.58 | 2.62 | |
| 0.90 | 3.26 | 3.23 | 3.26 | 3.29 | |
| 1.00 | 4.18 | 4.02 | 4.00 | 4.03 | |
Table 2.
b): Dynamic TSR matrix in different initial conditions for Savonius rotor.
| TSR | Rotational speed ω (rad/s) | ||||||||||
|---|---|---|---|---|---|---|---|---|---|---|---|
| 4.50 | 5.00 | 5.25 | 5.50 | 5.75 | 6.00 | 6.25 | 6.50 | 6.75 | |||
| Inlet speed U1 (m/s) | 0.33 | 0.8 | 0.89 | 0.94 | 0.98 | 1.03 | 1.07 | 1.12 | 1.16 | 1.21 | |
| 0.42 | 0.63 | 0.7 | 0.74 | 0.77 | 0.81 | 0.84 | 0.88 | 0.91 | 0.95 | ||
| 0.46 | 0.58 | 0.64 | 0.67 | 0.71 | 0.74 | 0.77 | 0.8 | 0.83 | 0.87 | ||
| 0.50 | 0.53 | 0.59 | 0.62 | 0.65 | 0.68 | 0.71 | 0.74 | 0.77 | 0.80 | ||
| 0.54 | 0.49 | 0.55 | 0.57 | 0.60 | 0.63 | 0.66 | 0.68 | 0.71 | 0.74 | ||
| 0.58 | 0.46 | 0.51 | 0.53 | 0.56 | 0.58 | 0.61 | 0.64 | 0.66 | 0.69 | ||
| 0.67 | 0.40 | 0.44 | 0.46 | 0.48 | 0.51 | 0.53 | 0.55 | 0.57 | 0.59 | ||
| 0.75 | 0.35 | 0.39 | 0.41 | 0.43 | 0.45 | 0.47 | 0.49 | 0.51 | 0.53 | ||
| 0.83 | 0.32 | 0.36 | 0.37 | 0.39 | 0.41 | 0.43 | 0.44 | 0.46 | 0.48 | ||
3. Results and Discussion
3.1. Idle and Thrust moment relationship quadratic with
and For internal validation of the simulation findings, regression analysis was performed for the Idle and Thrust moment with rotational speed and inlet fluid velocity as independent variables respectively. Rotational speed is found to be a weak predictor for Savonius owing to a low R2 ≈ 0.25 whereas inlet fluid velocity is an exceptional predictor variable, with R2 ≈ 1, for both models. Additionally, Idle and Thrust moments were selected as independent variables and the net moment as dependent variable to define an algebraic equation. This is defined as the Net Moment Balancing Equation for calculating corresponding turbine’s power coefficient in Table 3.
Note that for Pinwheel, the is the moment recorded by the simulation, while for Savonius, is intercepted with the braking torque of -0.0812 N.m. This offset value represents the counterbalancing negative and positive torque during the intrinsic rotation of the VATs. is the relative uncertainty term produced by the second order polynomial regression and is smaller than 5% for both. The fluid flow characteristics can be compared in the two models based on the same blockage and aspect ratio. The difference in the two models lies in the intercept for the VATs and the gradient of the net moment equation. These differences cause lower Cp for the Savonius than the Pinwheel turbine.
3.2. Moment plots
The relationship between the three moments is visualized in the Figure 6a,b. It can be demonstrated that the Idle moment exhibits minimal deviation from a constant value with the growth of TSR, whereas the thrust moment curve closely adheres to the shape of the net moment curve. The rotor’s balanced state is represented when net moment is zero, that is, the neutral point of the simulation.
3.3. Cp vs TSR curve
3.4. Wake Velocity Vector plots
The blade tip of the Pinwheel displays a maximum speed value of 2.5 m/s, as indicated by the red glyphs. Progressing towards the centre of the Pinwheel, the speeds gradually decrease and approach zero at the incident edge, which is highlighted by the dark blue glyphs, in the Figure 8. Figure 8 also illustrates the presence of the whirling phenomenon within the wake area of the Savonius turbine. Specifically, the downstream portion of the wake displays a gradual reduction in tangential velocity, with a maximum value of 0.8 m/s as denoted by the red glyphs. At the curved surfaces of the blades, the fluid returns to generate rotational motion of the turbine.
3.5. Flow Velocity and Wake Distribution
Figure 9 and Figure 10 below indicates the simulation results of velocity scalar plots of Pinwheel and Savonius under different TSR ranges. For Pinwheel, as TSR increases, the downstream flow field has the following principles: (1) the vortex shape tends to be irregular, particularly when TSR is greater than 4.0; (2) the backward flow gradually dissipates and then turns to forward flow; (3) the fluid in Pinwheel’s tail part maintains static flow as a dead zone.
For Savonius turbine, the characteristic bypass flow is observed due to the restricted blockage ratio. It is shown in Figure 10 that a lower TSR value has an enhanced blockage effect especially at TSR=0.32, the enhanced blockage effect also increases the wake decay, and the scale of wake length is decreasing when TSR rises. When TSR is 1.19, the vortex in downstream area has dissipated. The downstream dead zone concentrates at the ends of the blades.
The upstream velocity U1 and downstream velocity U2 for the two turbines are summarised in Table 5, where the new parameter “basin efficiency η” is indicated in Eq. (11) for both Pinwheel and Savonius. The basin efficiency measures how the turbine blockage affect the channel’s downstream and flow power collection. From Table 5, as the U1 decreases, the Pinwheel and Savonius of basin efficiency shows a similar quadratic trend, where the η reaches peak at 0.6m/s (TSR=4.0) for Pinwheel and 0.542m/s (TSR=0.63) for Savonius. However, two extinct cases on Savonius are also recorded when U1 is greater than 0.750m/s. These two cases, corresponding to Figure 10’s TSR=0.32 and 0.39, are affected by the jet flow on the bypass as a flow enhancer effect.
4. Discussion
The deviations in optimal Cp and TSR for the two models could be due to the relative viscosity, which is a measure of the fluid’s resistance to flow and decreases as its temperature increases. The water temperatures for Pinwheel and Savonius models were assumed to be 20°C and 25°C as it was not specified in the literature. K-ω model has been increasingly popular due to its accuracy for simulating rotating machinery (Yang and Lawn, 2011). Optimal TSR obtained with K-ω turbulence is 0.55 with a higher error of 22.2% as shown in Figure 11.
In terms of the blockage effect from Figure 9 and Figure 10, they both conclude that when turbine’s blockage ratio is 12% in a channel, a low TSR working condition leads to a longer wake decay length; that is to say, the blockage, by comparing the bypass flow and wake flow, exerts less effect on downstream flow. This suggests that the low TSR working condition of a tidal turbine will adversely affects the channel’s downstream flow speed. The channel ecosystem will require longer time to restore this part of speed otherwise the flow pattern alternation can result in change of sediment deposition with fluid-sediment-structure interaction or scouring, erosion patterns and migratory paths of marine species. Comprehensive Environmental Impact Assessments (EIAs) are required to investigate the blockage ratio before the installation of tidal turbines to identify and mitigate potential adverse effects.
5. Conclusion
This study successfully established the algebraic equations between newly introduced parameters with the turbine’s net moment. It is found that at the neutral point, idle and thrust moment will offset each other in the optimal state. By this method, the optimal TSR and Cp for Pinwheel turbine is 2.37 and 0.223, and for Savonius turbine is 0.63 and 0.16. Rotational speed was found to be an excellent predictor for Pinwheel’s idle moment, while the inlet velocity was an excellent predictor for thrust moment in both models. Pinwheel is observed to have greater blade load on the trailing edge of the blade. The simulation results prove that the Moment Balancing method is suitable for the application of turbine configuration design and machinery test by commercial software with less computation time and cost. Besides, through the channel parametric study, the turbines’ wake and downstream flow can be concluded that a lower TSR of turbine has longer wake decay length of the channel environment. The optimal basin efficiency is observed when TSR is approximately 4.0 for Pinwheel and 0.63 for Savonius. This provides a reference for the trade-off between optimal power performance Cp and basin efficiency η, which would be useful for any practical environmental impact assessments.
Acknowledgement
The authors would like to thank Nanyang Technological University for providing the computing facilities as needed to carry out this study, as well as the Interdisciplinary Graduate School scholarship for funding this project.
| Nomenclature | |
| Angular momentum, kg.m2/s | |
| Cross-section area of a rotor plate, m | |
| Inflow speed, m/s | |
| R | Rotor radius, m |
| Cp | Power Coefficient |
| Thrust Coefficient | |
| R | Rotor radius, m |
| CFD | Computational Fluid Dynamics |
| EU | European Union |
| DDTTs | Drag-dominated tidal turbines |
| K-ε | Kappa-Epsilon Turbulence Model |
| K-ω | Kappa-Omega Turbulence Model |
| SST | Shear-Stress Transport Turbulence Model |
| VATs | Vertical Axis Turbines |
| DDTTs | Drag-Dominant Tidal Turbines |
| BEM | Blade Element Method |
| MRF | Moving Reference Frame |
| EIAs | Environmental Impact Assessments |
| Greek Letters | |
| ρ | Density, kg/m3 |
| λ | Tip Speed Ratio |
| Turbine’s rotation speed, rad/s | |
| Dynamic Viscosity, Pa.s | |
| η | Basin efficiency |
| Subscripts | |
| opt | Optimal case |
| Superscripts | |
| * | Offset condition |
References
- Biswas, A., Gupta, R. and Sharma, K.K. (2007). Experimental Investigation of Overlap and Blockage Effects on Three-Bucket Savonius Rotors. Wind Engineering, 31(5), pp.363–368. [CrossRef]
- Churchfield, M.J., Schreck, S.J., Martinez, L.A., Meneveau, C. and Spalart, P.R. (2017). An Advanced Actuator Line Method for Wind Energy Applications and Beyond. 35th Wind Energy Symposium. [CrossRef]
- European Commission (2020). Tidal flows generate huge potential for clean electricity | Research and Innovation. [online] ec.europa.eu. Available at: https://ec.europa.eu/research-and-innovation/en/projects/success-stories/all/tidal-flows-generate-huge-potential-clean-electricity.
- Hara, Y., Hara, K. and Hayashi, T. (2012). Moment of Inertia Dependence of Vertical Axis Wind Turbines in Pulsating Winds. International Journal of Rotating Machinery, 2012, pp.1–12. [CrossRef]
- IRENA (2020). Innovation outlook: Ocean energy technologies. https://www.irena.org/. Abu Dhabi: International Renewable Energy Agency.
- Islam, Md.R., Bin Bashar, L., and Rafi, N.S. (2019). Design and Simulation of a Small Wind Turbine Blade with Qblade and Validation with MATLAB. 2019 4th International Conference on Electrical Information and Communication Technology (EICT). [CrossRef]
- Islam, R. , Sultana Snikdha, Z., Iffat, A. and Shahadat, M.Md.Z. (2021). Optimum Blade Design of Pinwheel Type Horizontal Axis Wind Turbine for Low Wind Speed Areas. [online] IEEE Xplore. [CrossRef]
- Koh, W.X.M. and Ng, E.Y.K. (2016). Effects of Reynolds number and different tip loss models on the accuracy of BEM applied to tidal turbines as compared to experiments. Ocean Engineering, [online] 111, pp.104–115. [CrossRef]
- Kumar, A. and Saini, G. (2021). Flow field and performance study of Savonius water turbine. Materials Today: Proceedings, 46, pp.5219–5222. [CrossRef]
- Menon, Sananth H., et al. “Derivation of Navier–Stokes Equation in Rotational Frame for Engineering Flow Analysis.” International Journal of Thermofluids, vol. 11, Aug. 2021, p. 100096. ISSN 2666-2027. [CrossRef]
- Muchala, S. and Willden, R.H.J. (2017). Impact of tidal turbine support structures on realizable turbine farm power. Renewable Energy, 114, pp.588–599. [CrossRef]
- Nemoto, Y. and Ushiyama, I. (2003). Experimental Study of a Pinwheel-Type Wind Turbine. Wind Engineering, 27(3), pp.227–236. [CrossRef]
- Ordonez-Sanchez, S., Allmark, M., Porter, K., Ellis, R., Lloyd, C., Santic, I., O’Doherty, T. and Johnstone, C. (2019). Analysis of a Horizontal-Axis Tidal Turbine Performance in the Presence of Regular and Irregular Waves Using Two Control Strategies. Energies, 12(3), p.367. [CrossRef]
- Patel, V. and Patel, R. (2021). Energy extraction using modified Savonius rotor from Free-flowing water. Materials Today: Proceedings, 45, pp.5190–5196. [CrossRef]
- Pucci, M., Di Garbo, C., Bellafiore, D., Zanforlin, S. and Umgiesser, G. (2022). A BEM-Based Model of a Horizontal Axis Tidal Turbine in the 3D Shallow Water Code SHYFEM. Journal of Marine Science and Engineering, 10(12), p.1864. [CrossRef]
- Salazar Marin, E.A. and Rodríguez, A.F. (2019). Design, assembly and experimental tests of a Savonius type wind turbine. Scientia et Technica, 24(3), pp.397–407. [CrossRef]
- Tian, W., Song, B., VanZwieten, J. and Pyakurel, P. (2015). Computational Fluid Dynamics Prediction of a Modified Savonius Wind Turbine with Novel Blade Shapes. Energies, 8(8), pp.7915–7929. [CrossRef]
- Wihadi, D. and Mardikus, S. (2020). Experimental investigation of blades number of savonius water turbine on performance characteristic. The 5th International Conference on Industrial, Mechanical, Electrical, and Chemical Engineering 2019 (ICIMECE 2019). [CrossRef]
- Whelan, J.I., Graham, J.M.R. and Peiro, J. (2009). A free-surface and blockage correction for tidal turbines. Journal of Fluid Mechanics, [online] 624, pp.281–291. [CrossRef]
- Yang, B. and Lawn, C. (2011). Fluid dynamic performance of a vertical axis turbine for tidal currents. Renewable Energy, 36(12), pp.3355–3366. [CrossRef]
- Yilmaz, A.E. and Meyers, J. (2014). Numerical simulations of flow fields through conventionally controlled wind turbines & wind farms. Journal of Physics: Conference Series, 524, p.012158. [CrossRef]
Figure 1.
Domain development for (a) Pinwheel and (b) Savonius turbine.
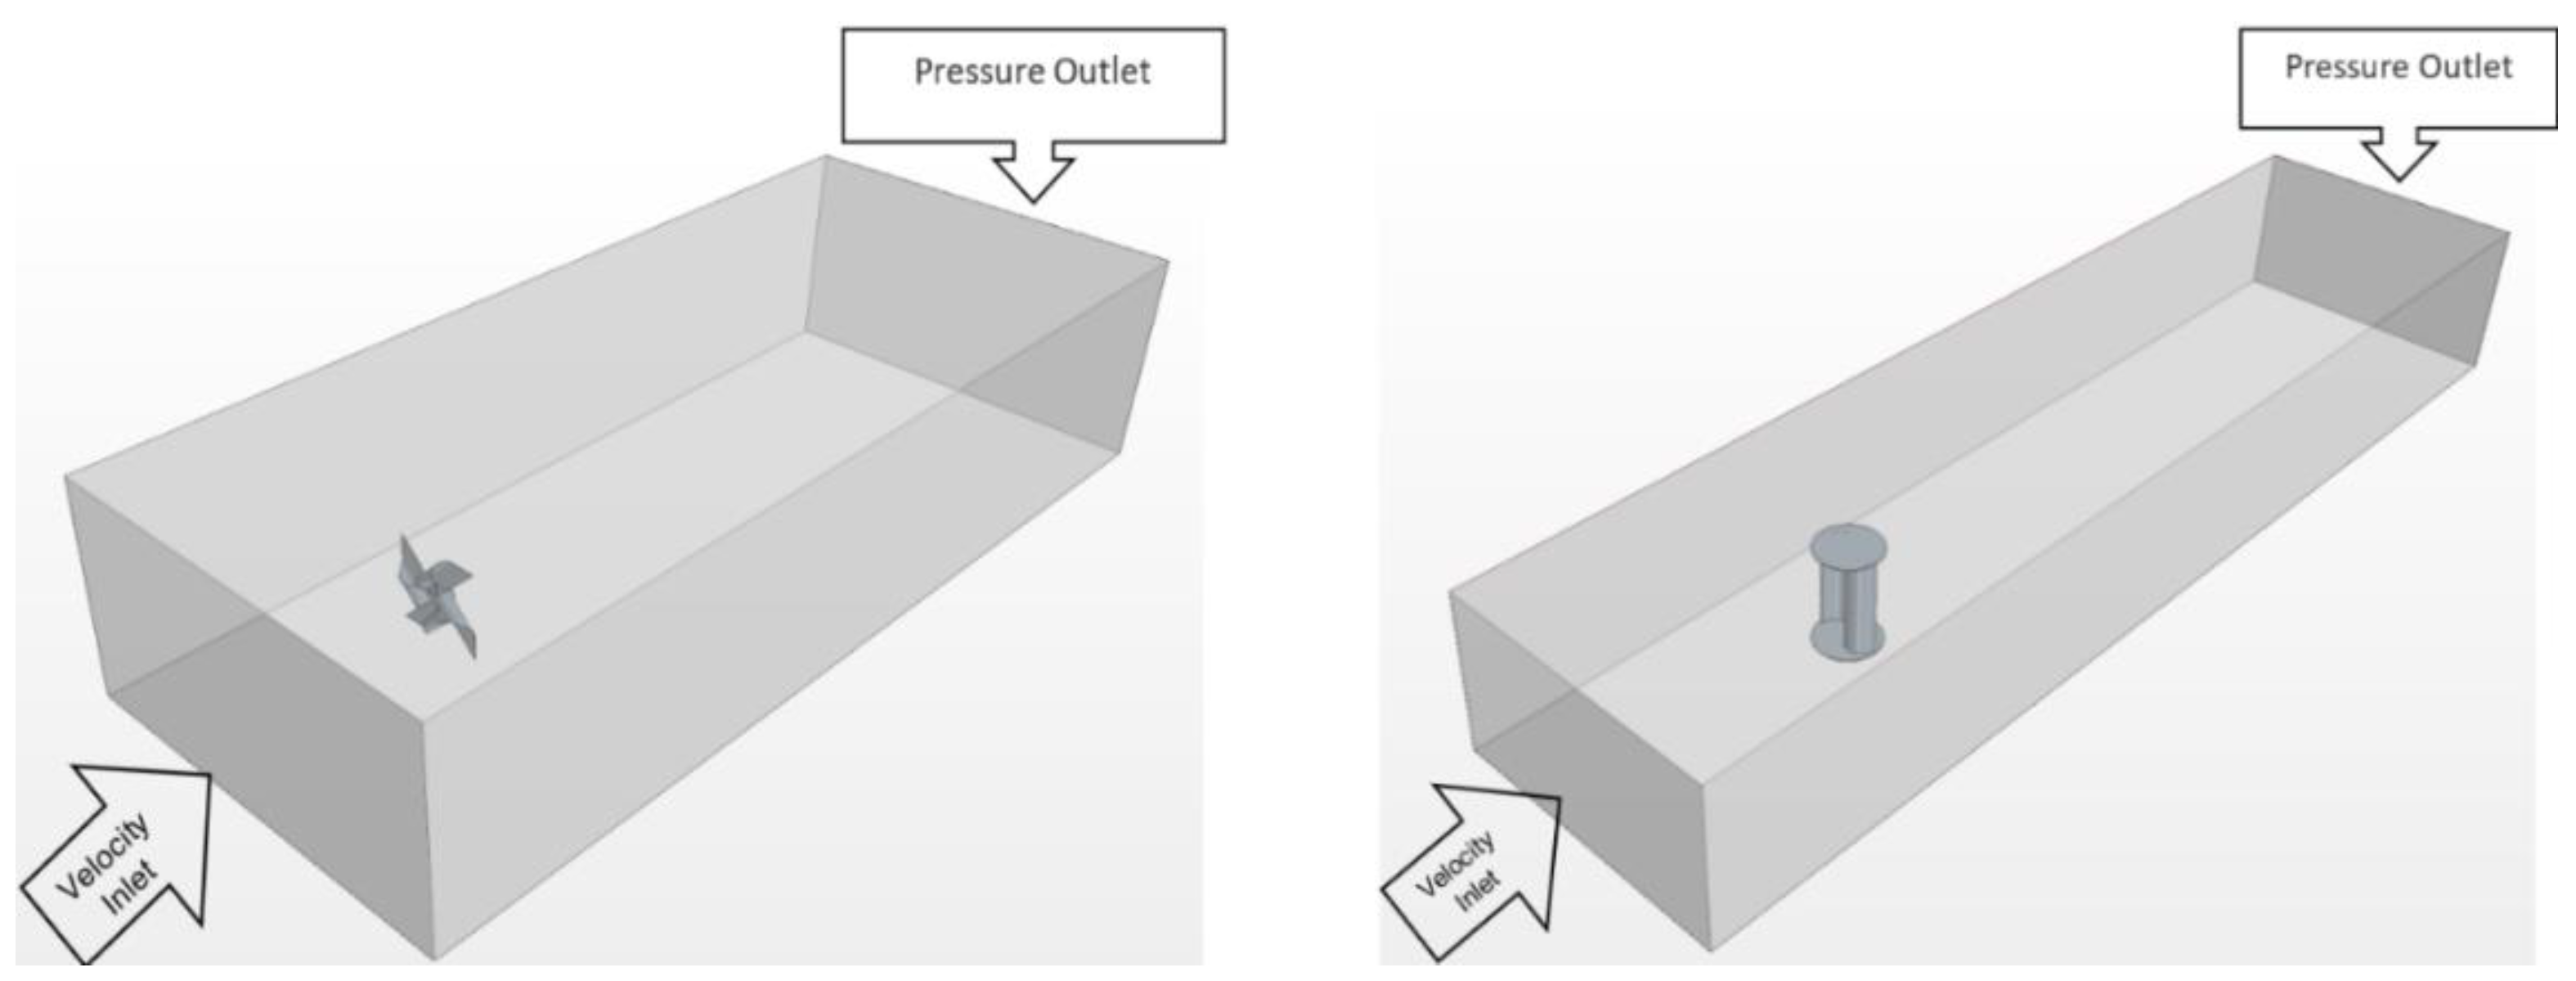
Figure 2.
Domain dimensions for (a) Pinwheel and (b) Savonius turbine.
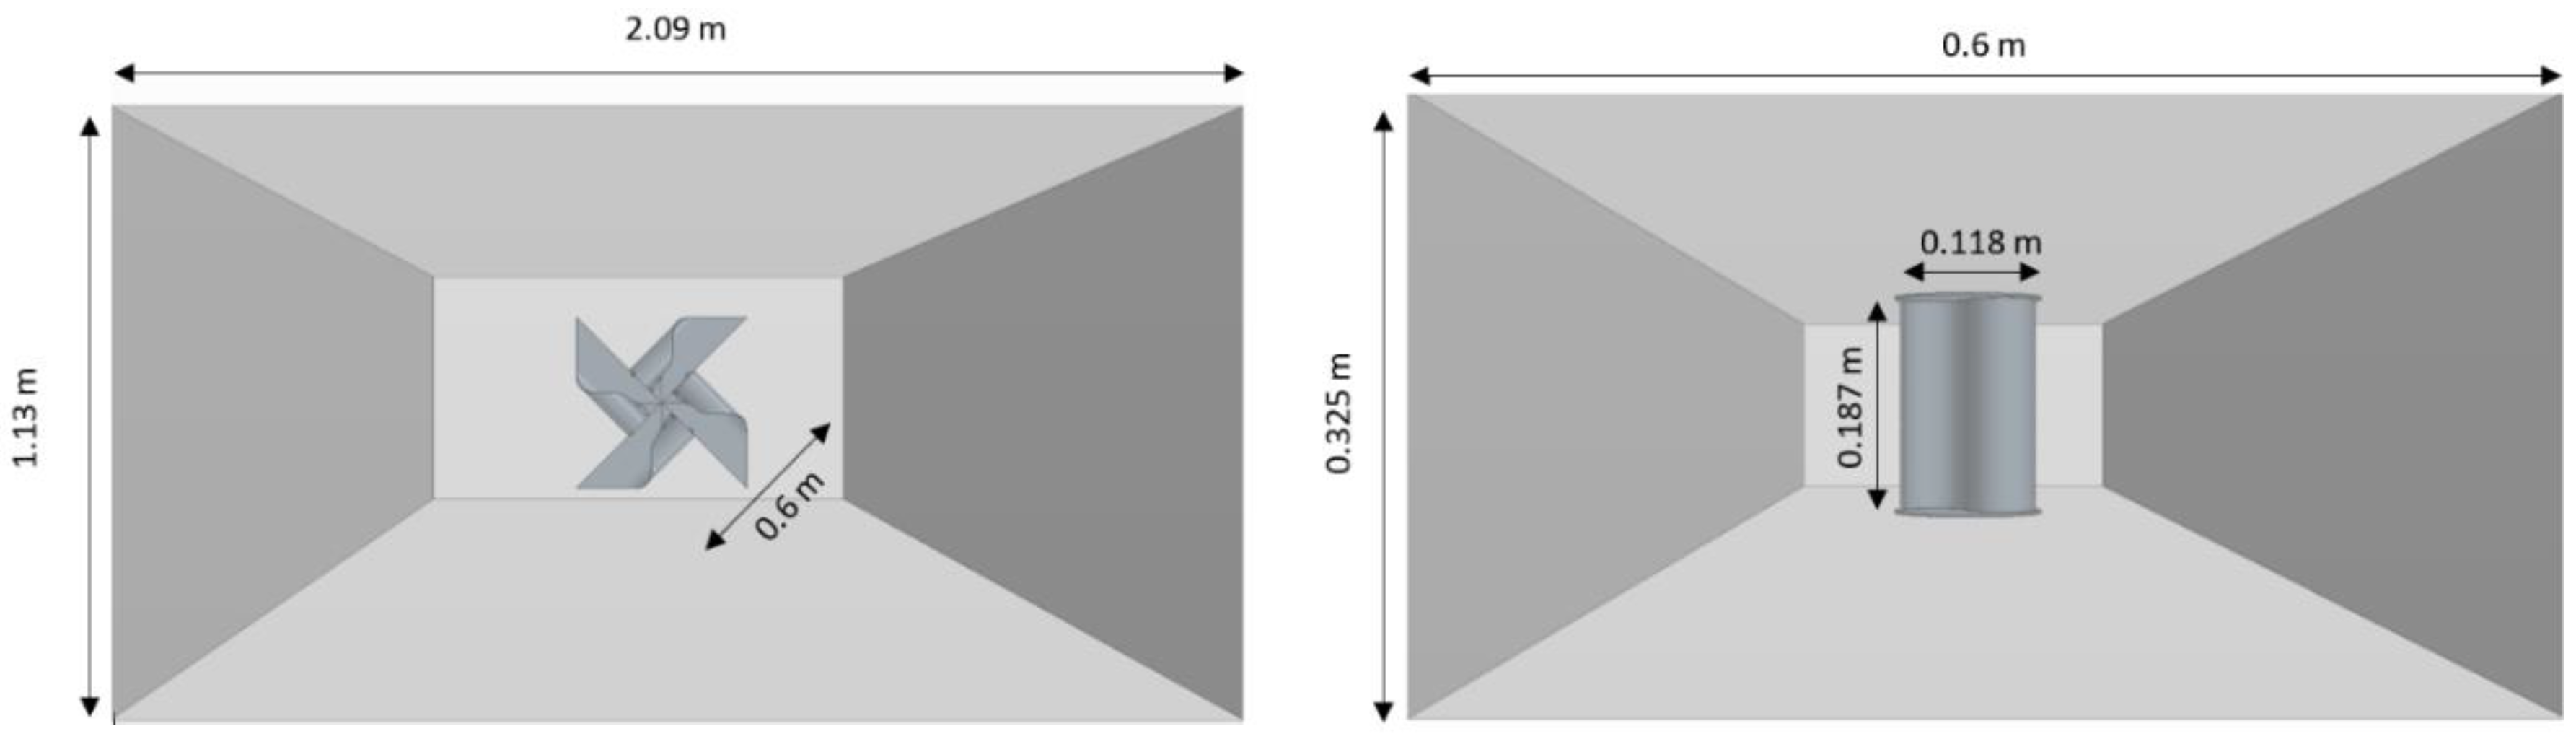
Figure 3.
Volume mesh overview for (a) Pinwheel and (b) Savonius turbine.
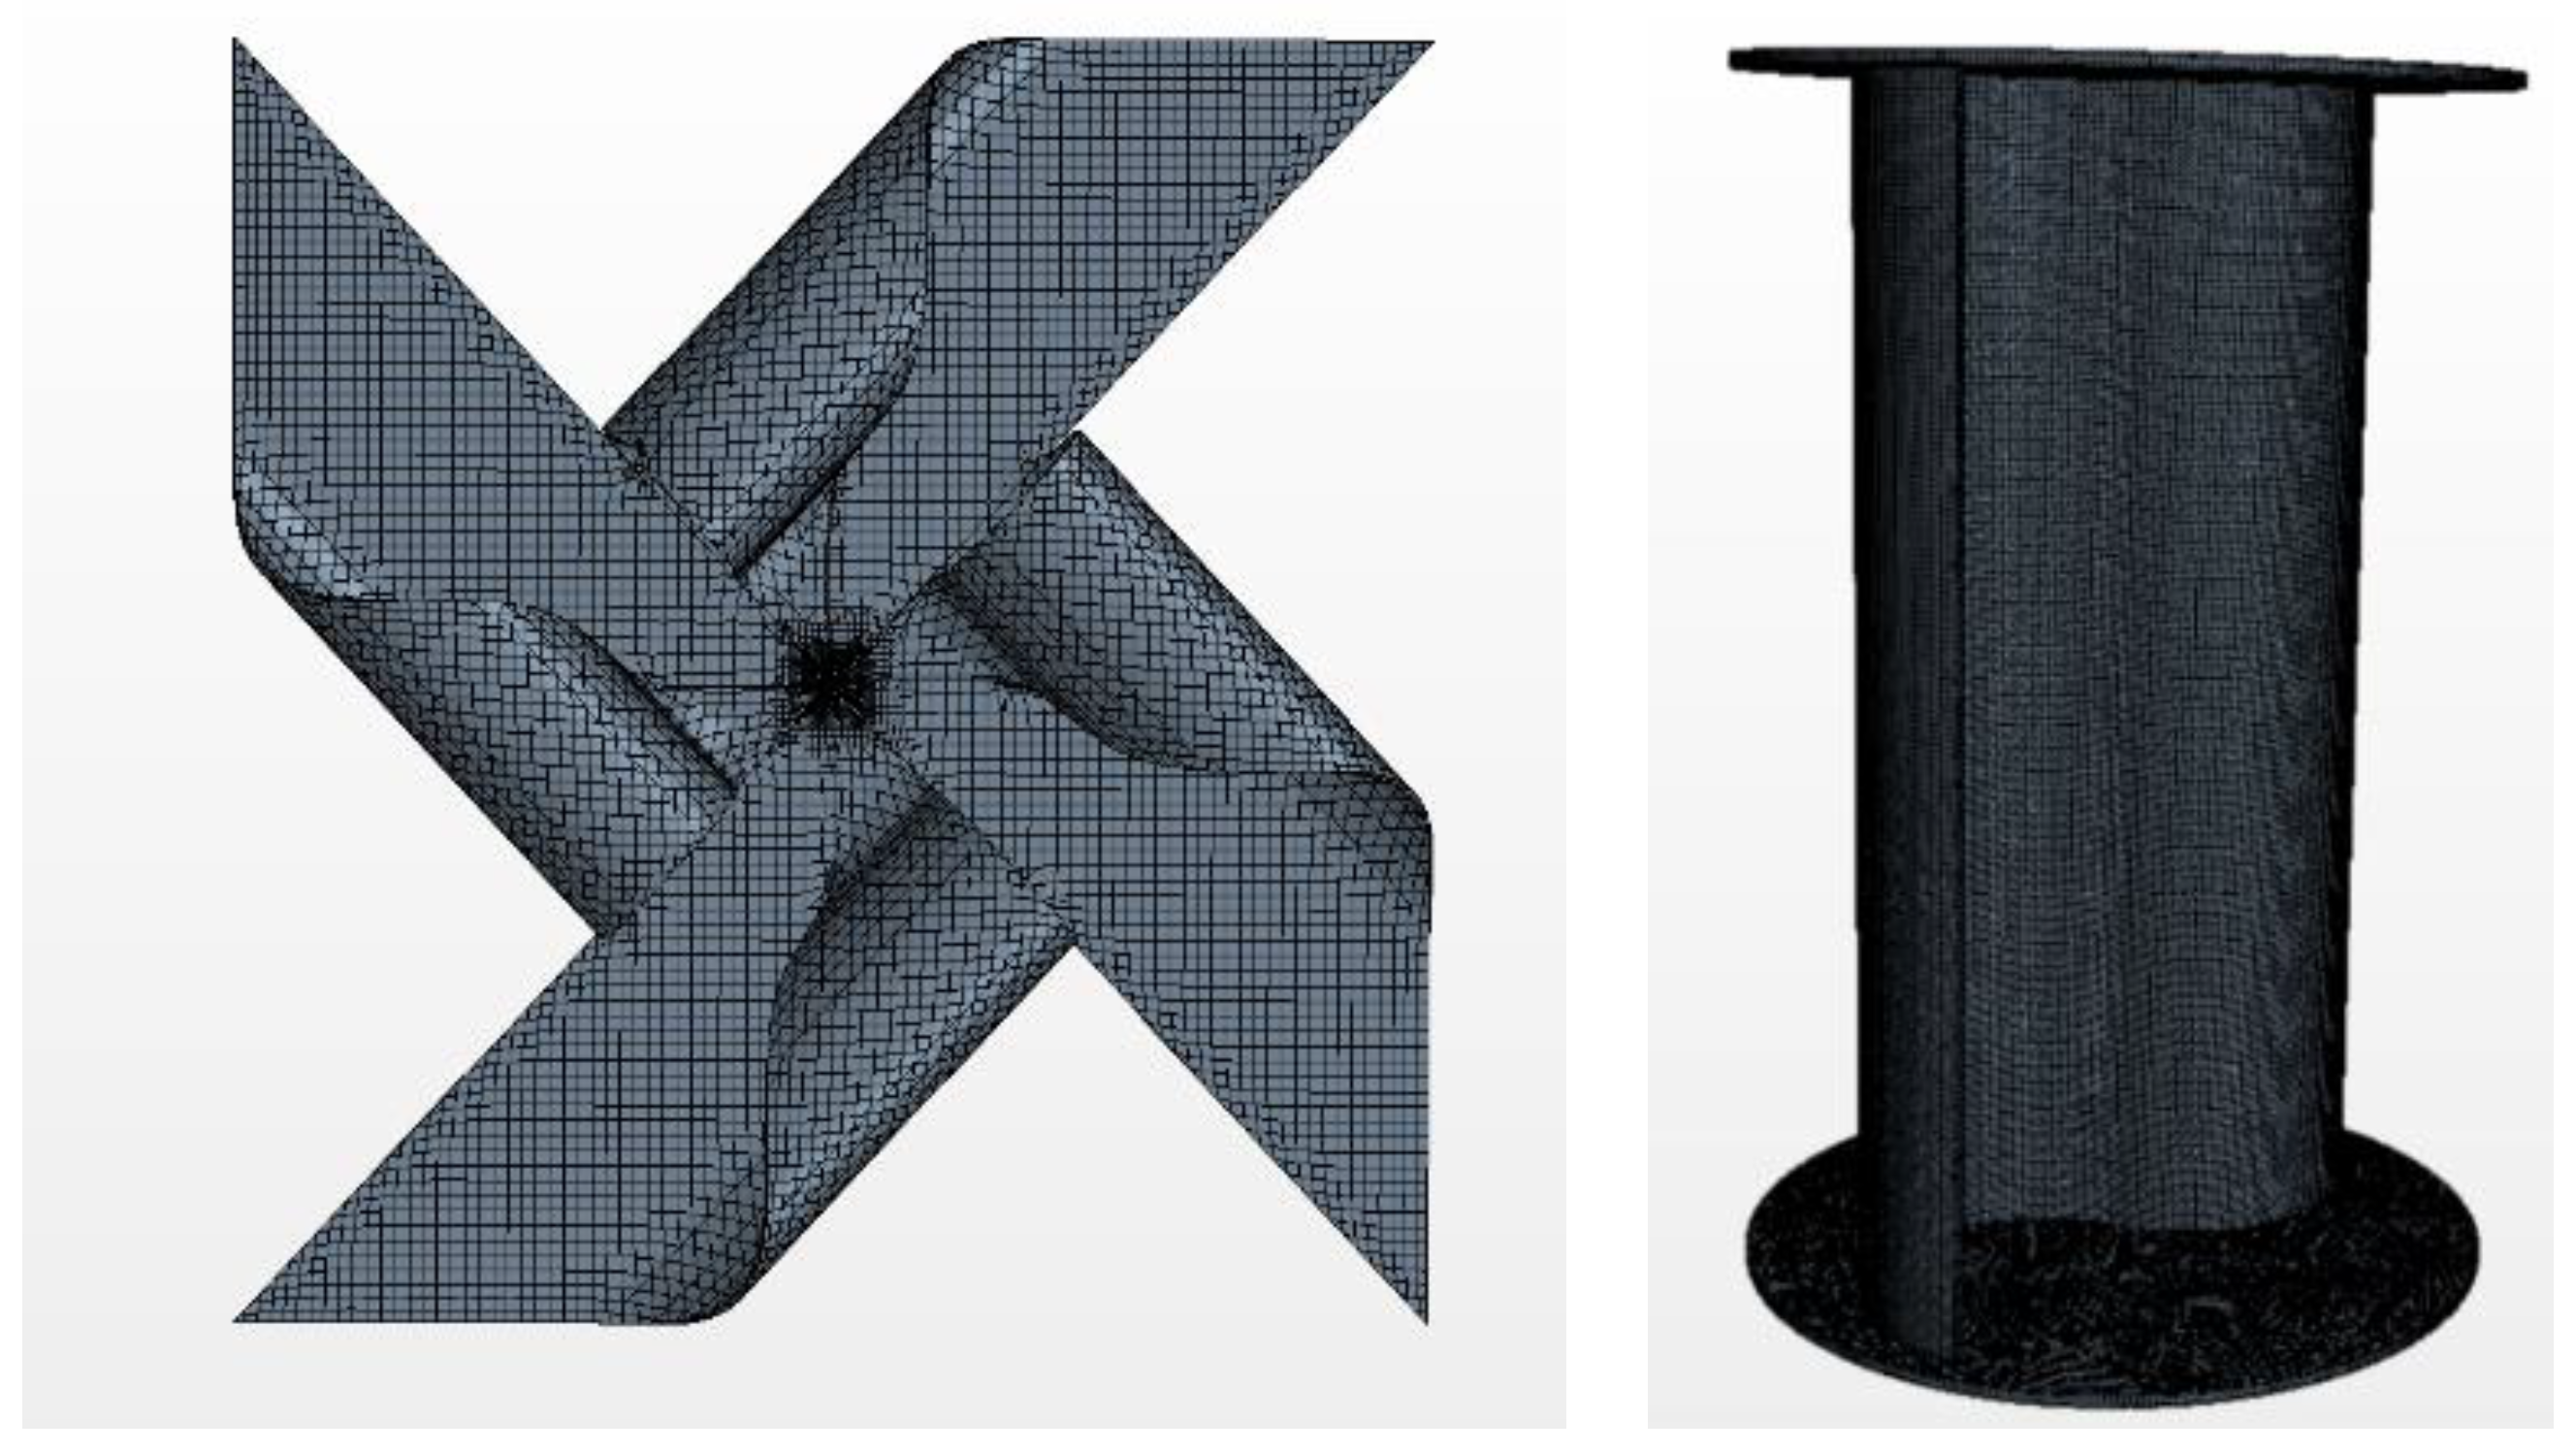
Figure 4.
Mesh cross-section views for (a) Pinwheel and (b) Savonius turbine.
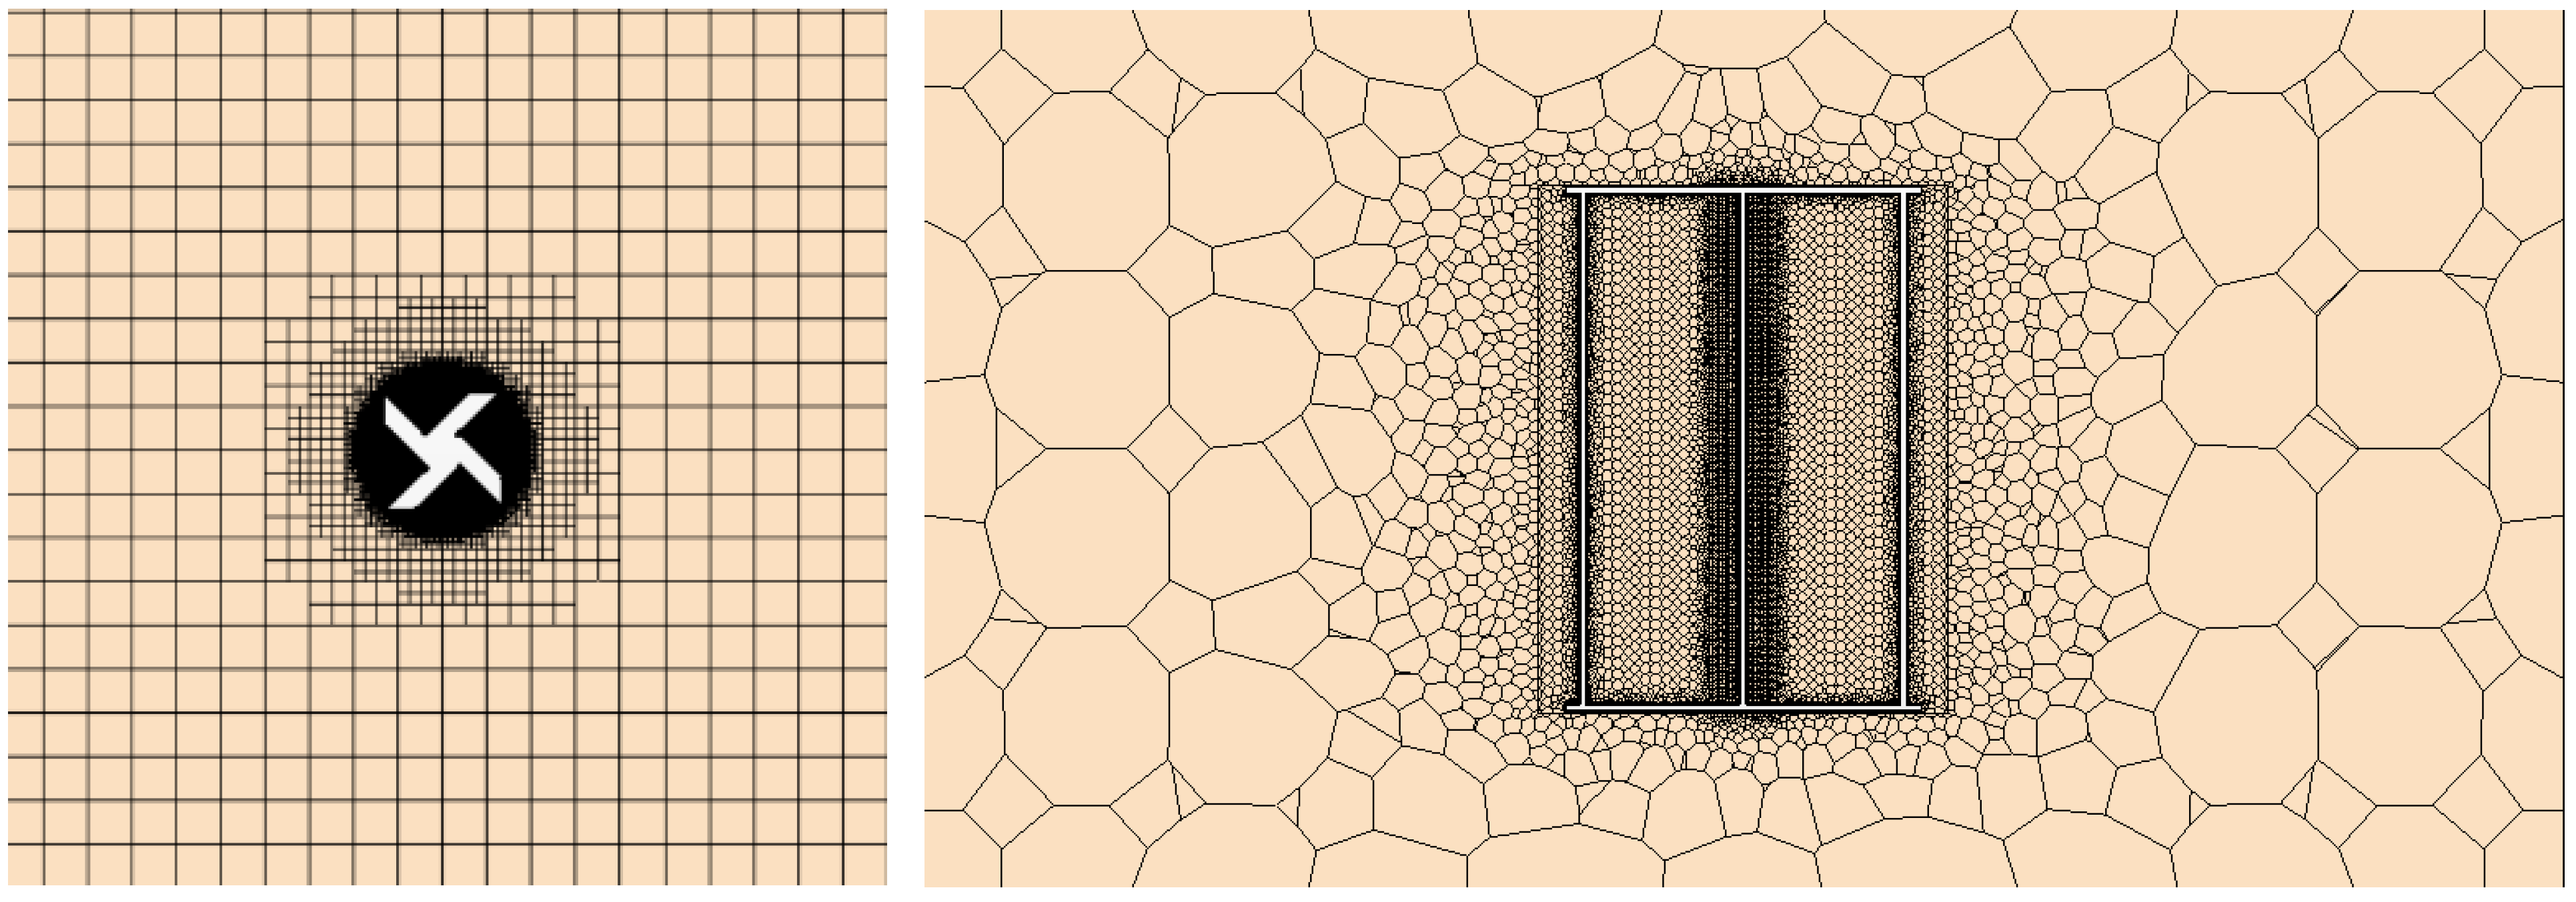
Figure 5.
Grid independence test for (a) Pinwheel and (b) Savonius turbine.
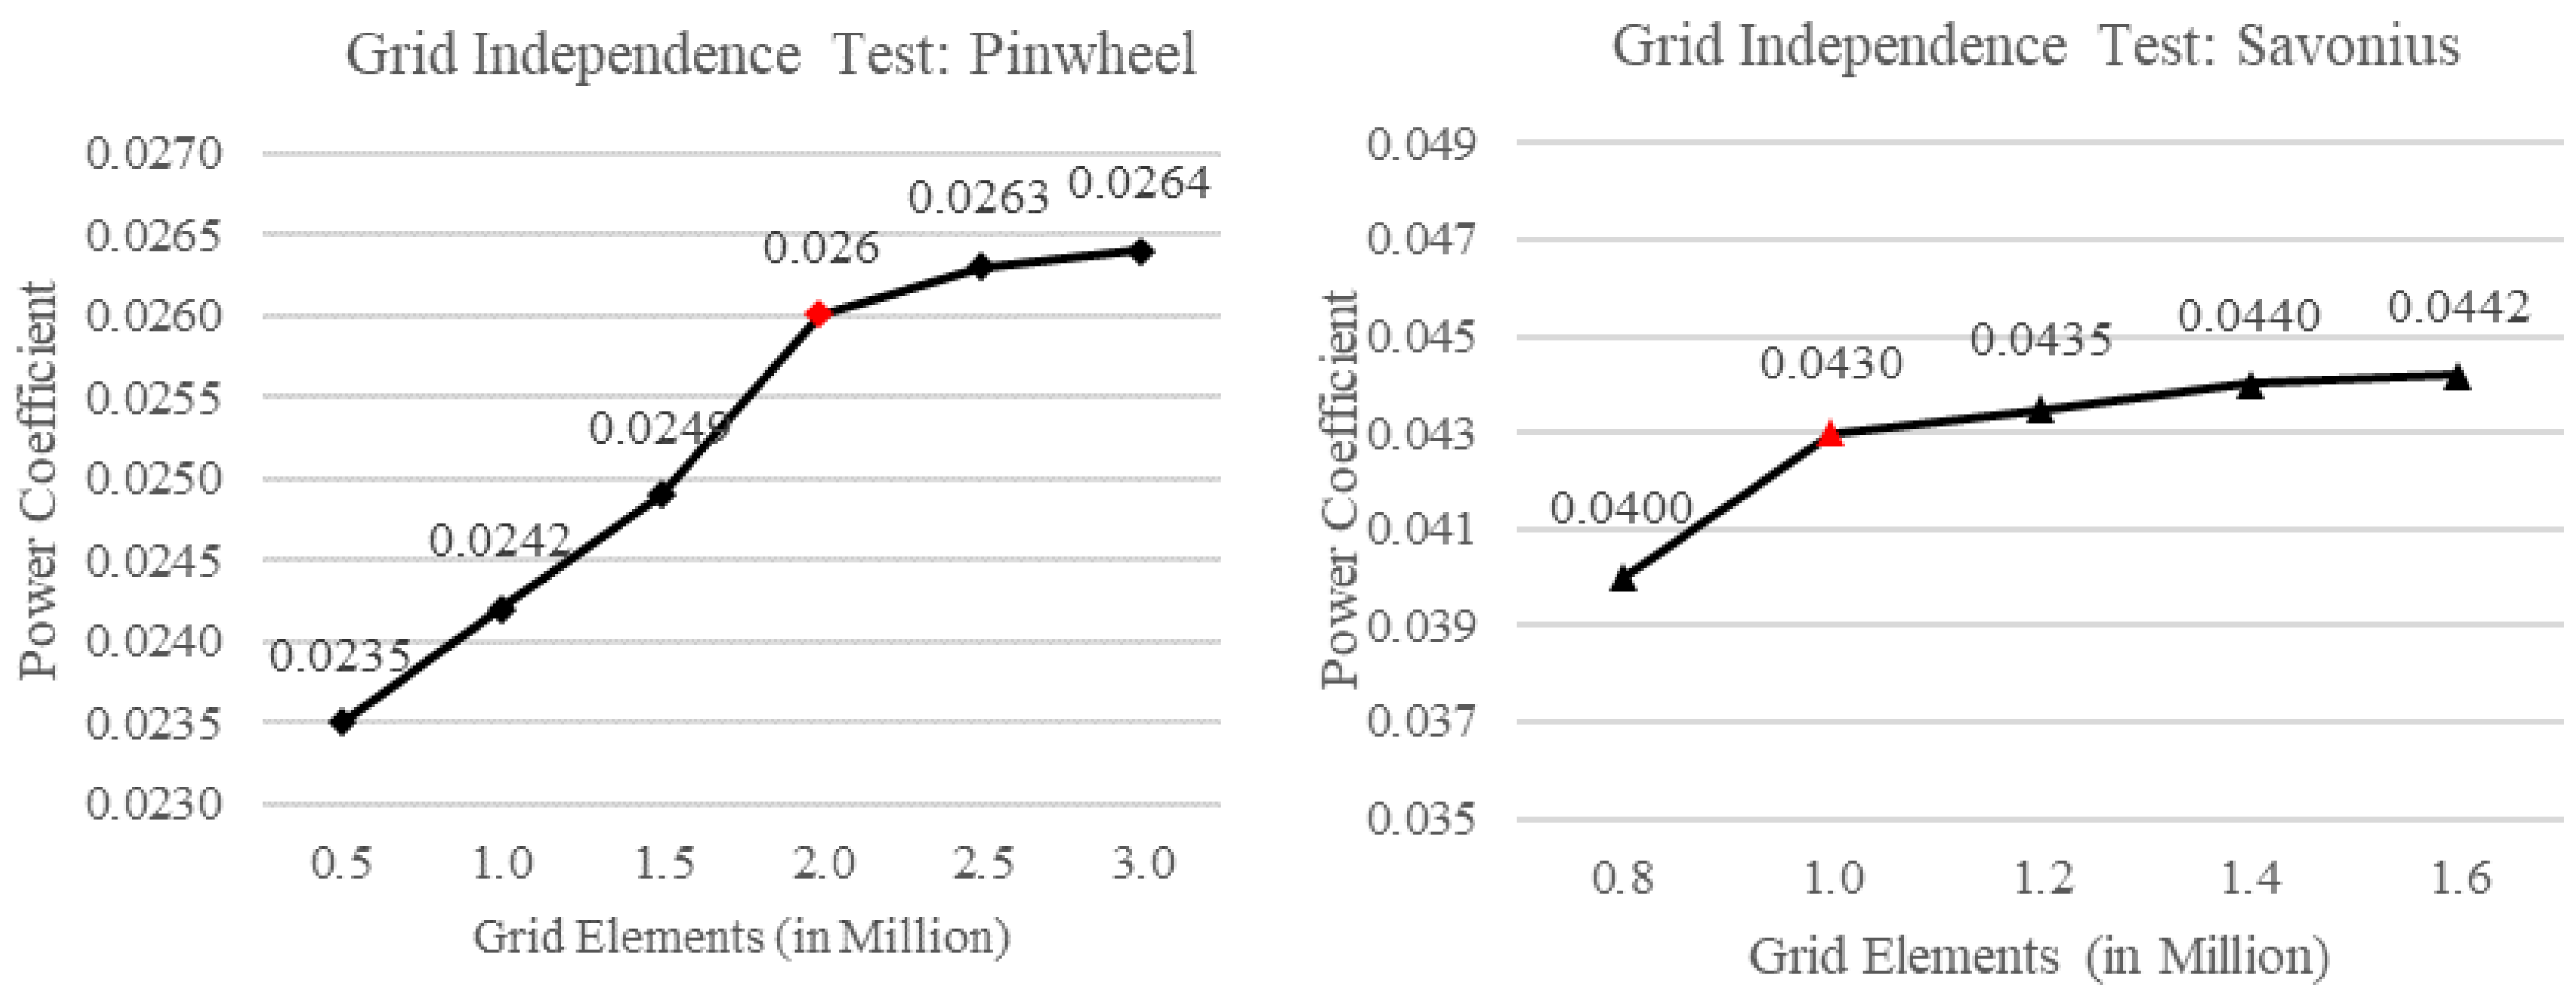
Figure 6.
Net, Thrust and Idle Moment curves with the neutral point for (a) Pinwheel and (b) Savonius.
Figure 6.
Net, Thrust and Idle Moment curves with the neutral point for (a) Pinwheel and (b) Savonius.
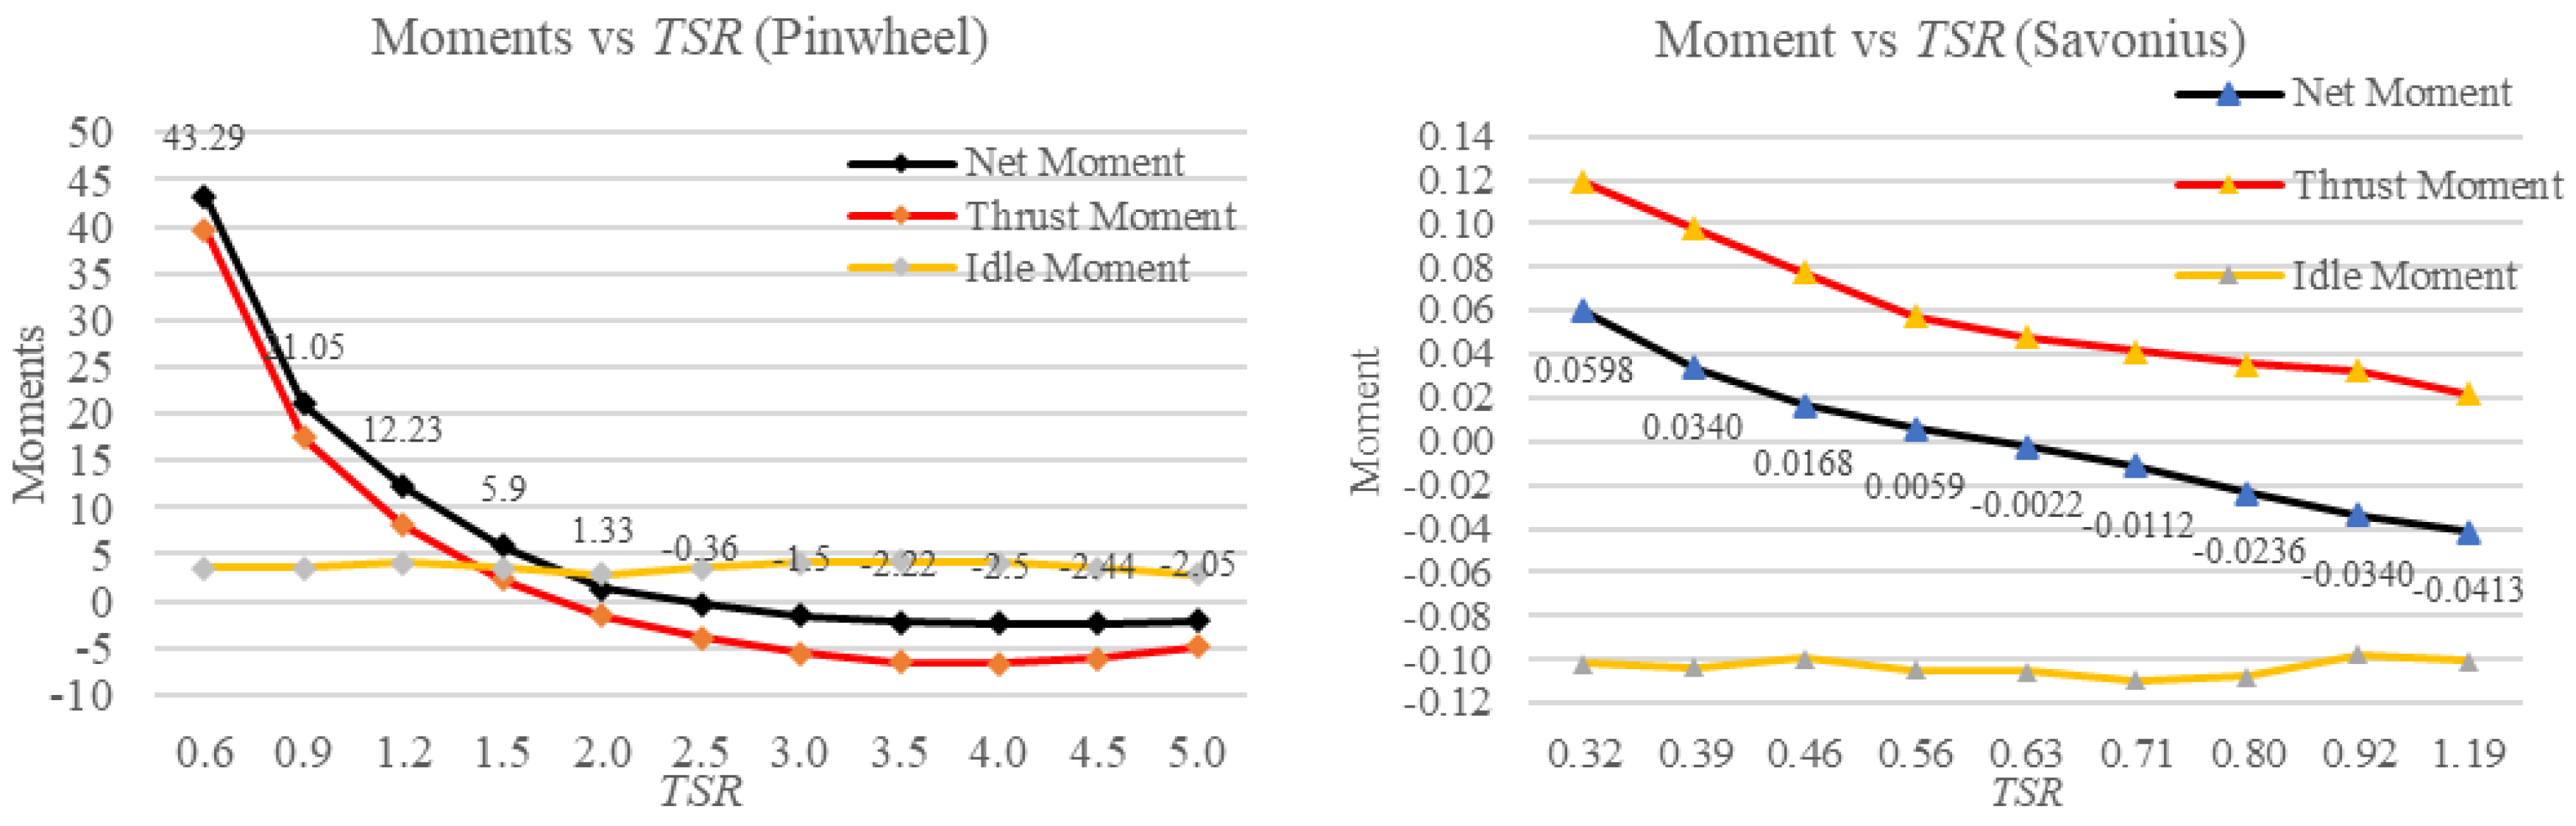
Figure 7.
Figure 7. curve for the optimal neutral point for turbine (a) Pinwheel and (b) Savonius.

Figure 8.
Flow characteristics for turbine (a) Pinwheel and (b) Savonius.
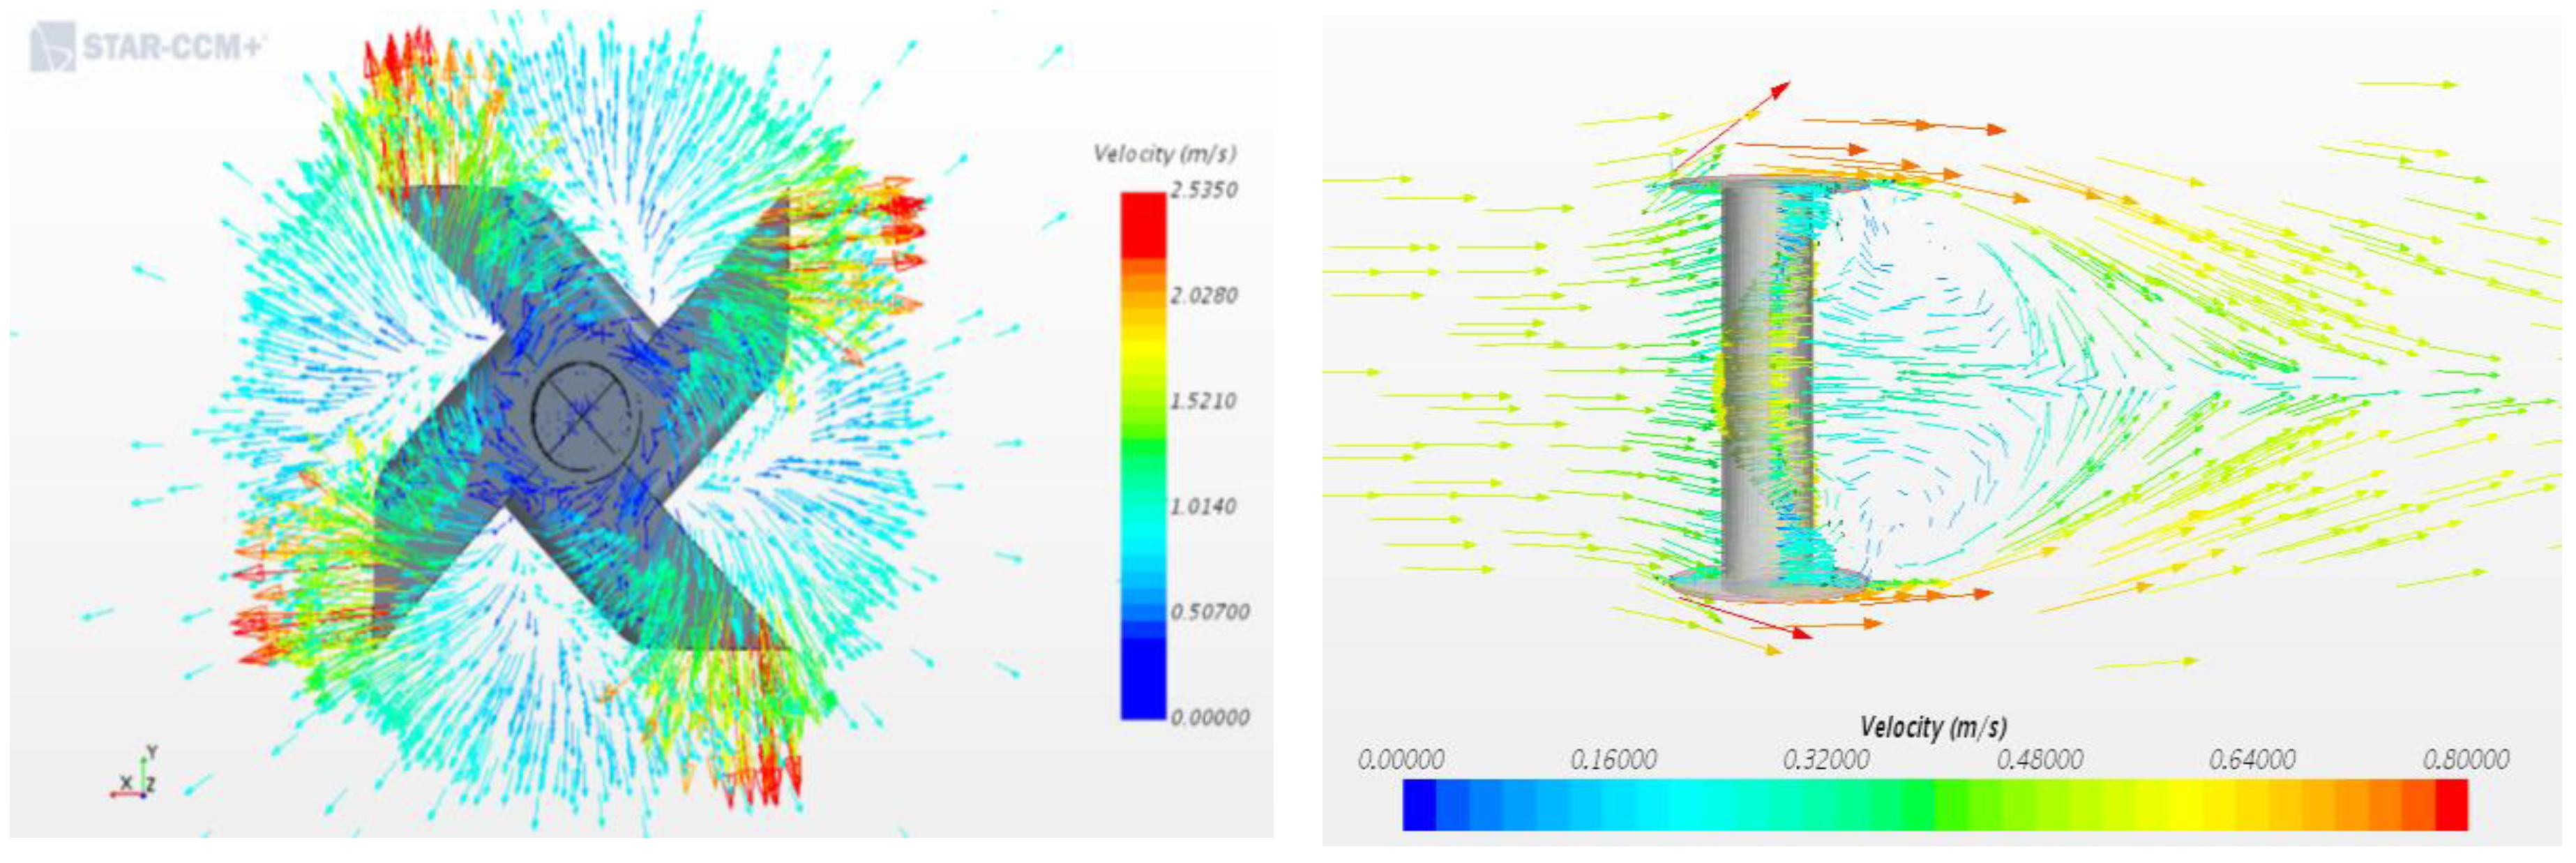
Figure 9.
The wake’s velocity field shape in Pinwheel turbine, TSR ranging from 0.9 to 5.0.
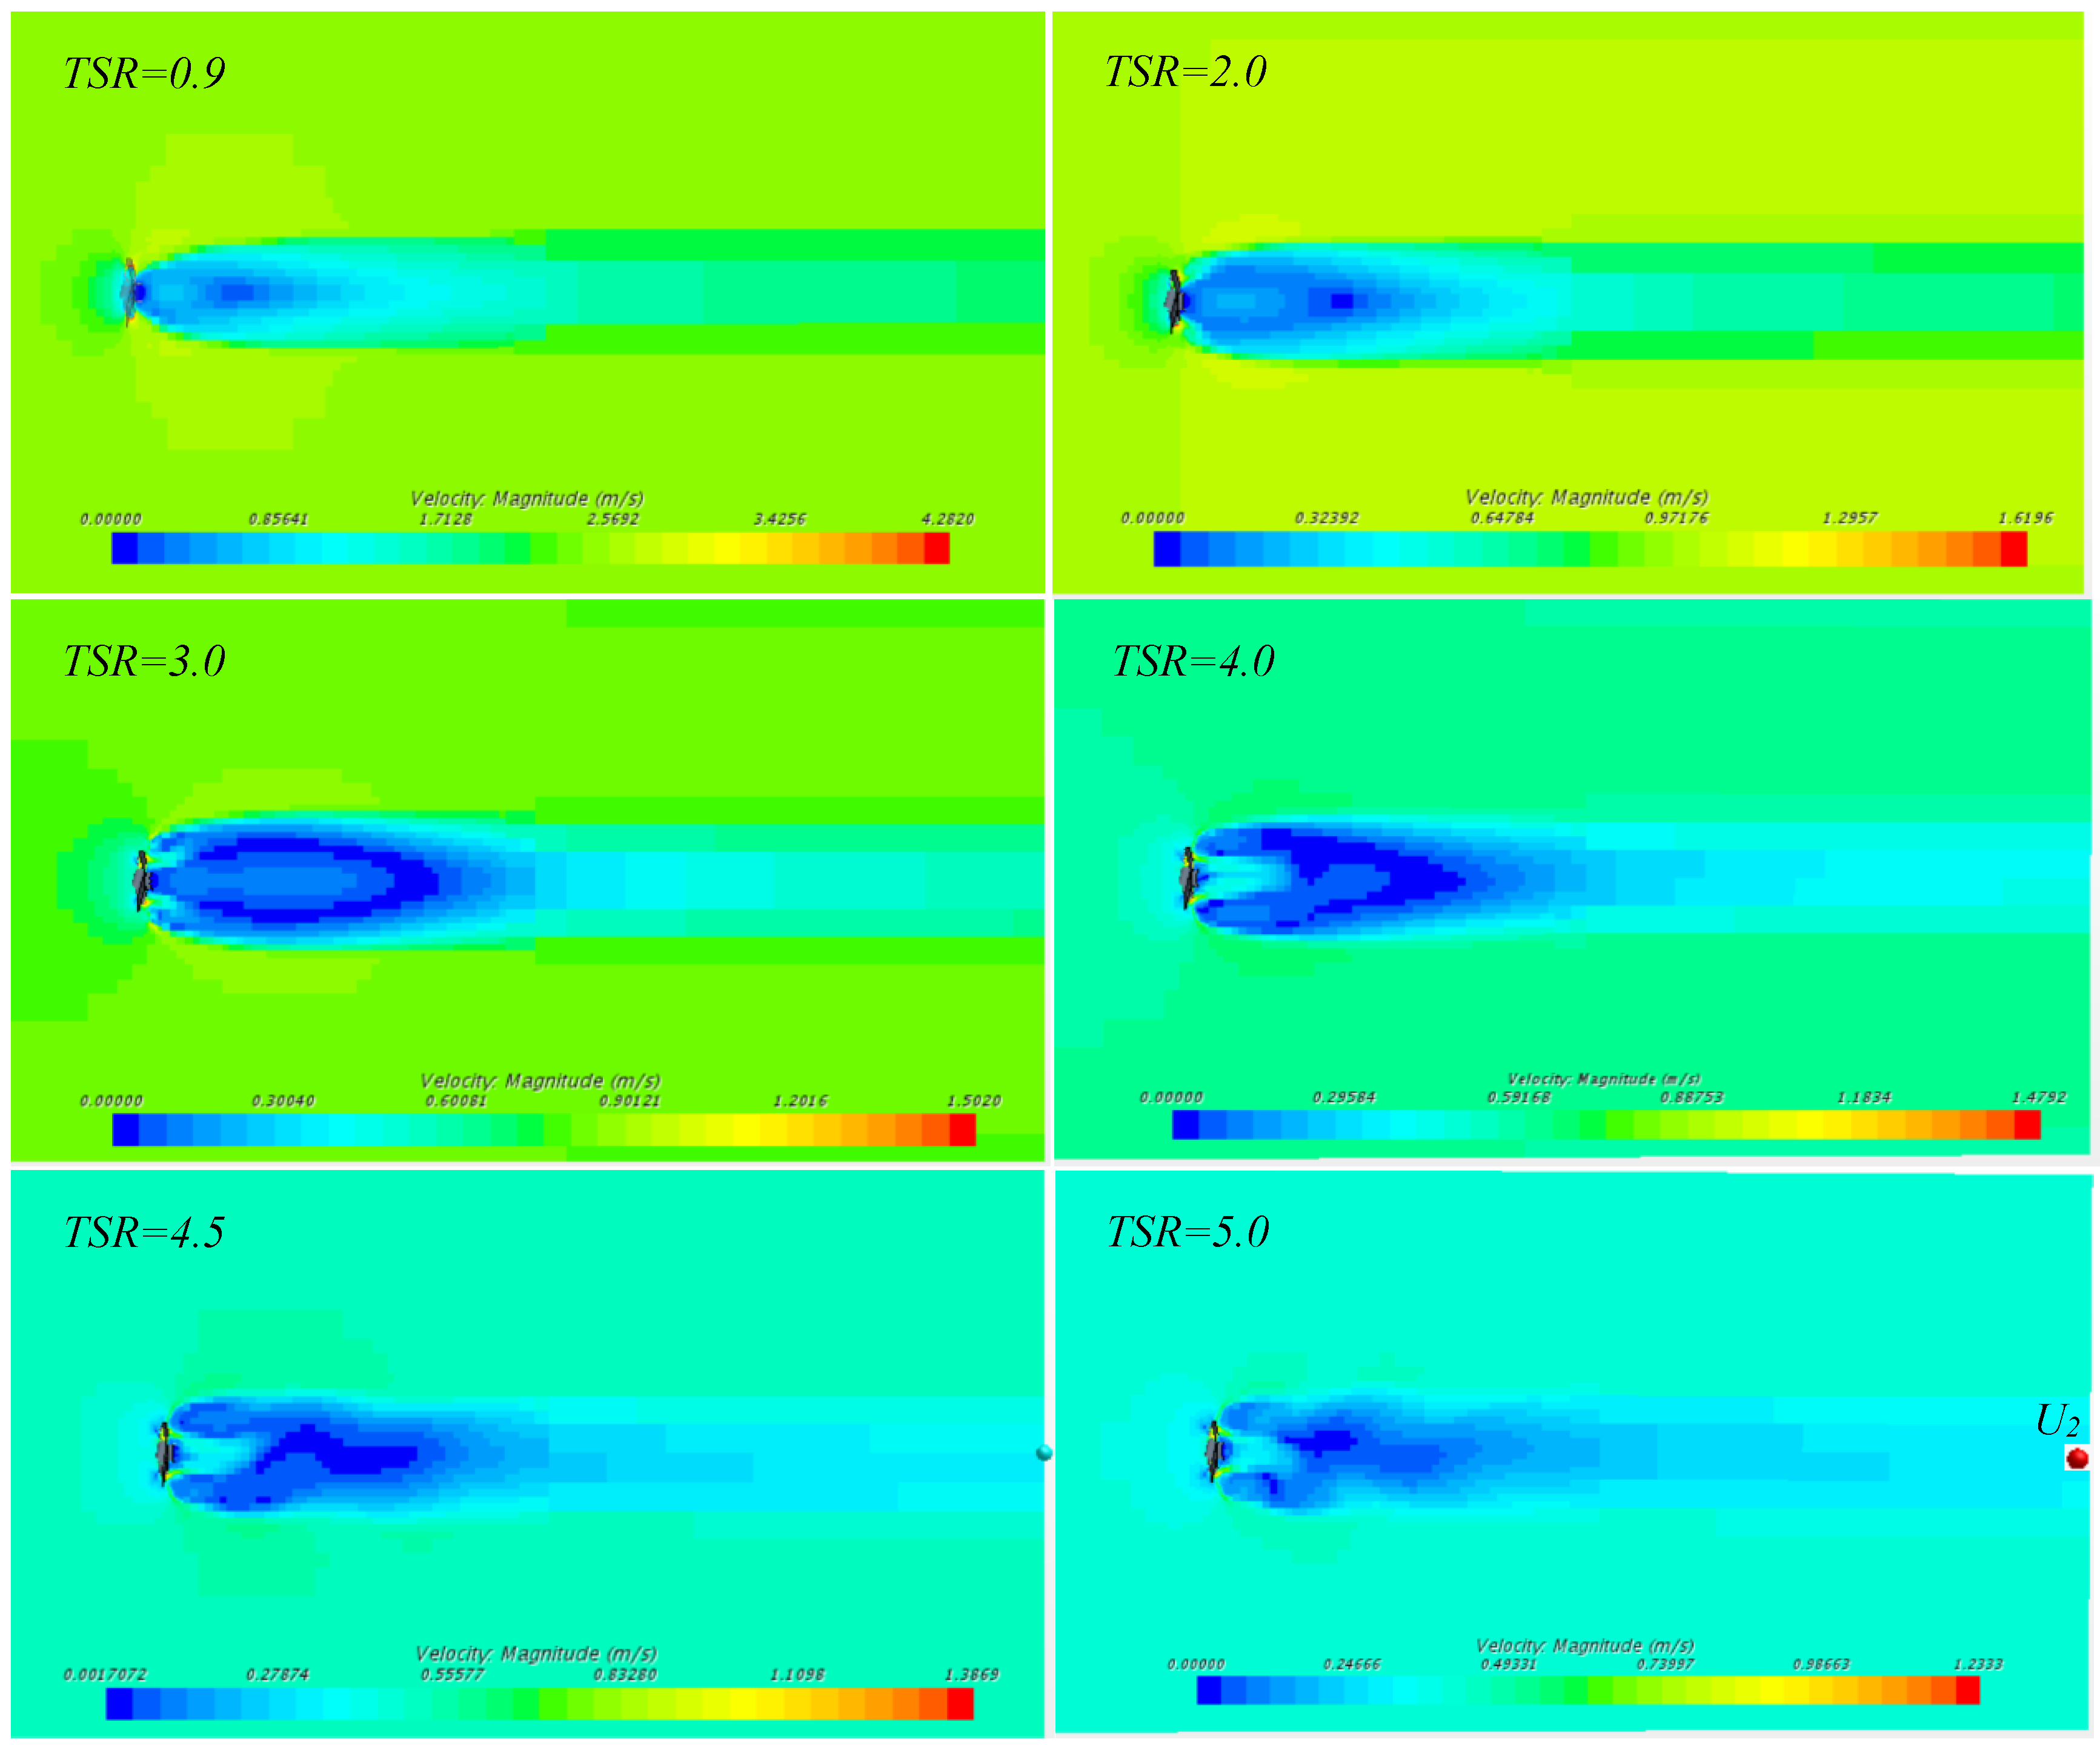
Figure 10.
The wake’s velocity field for Savonius turbine, TSR ranging from 0.32 to 1.19.
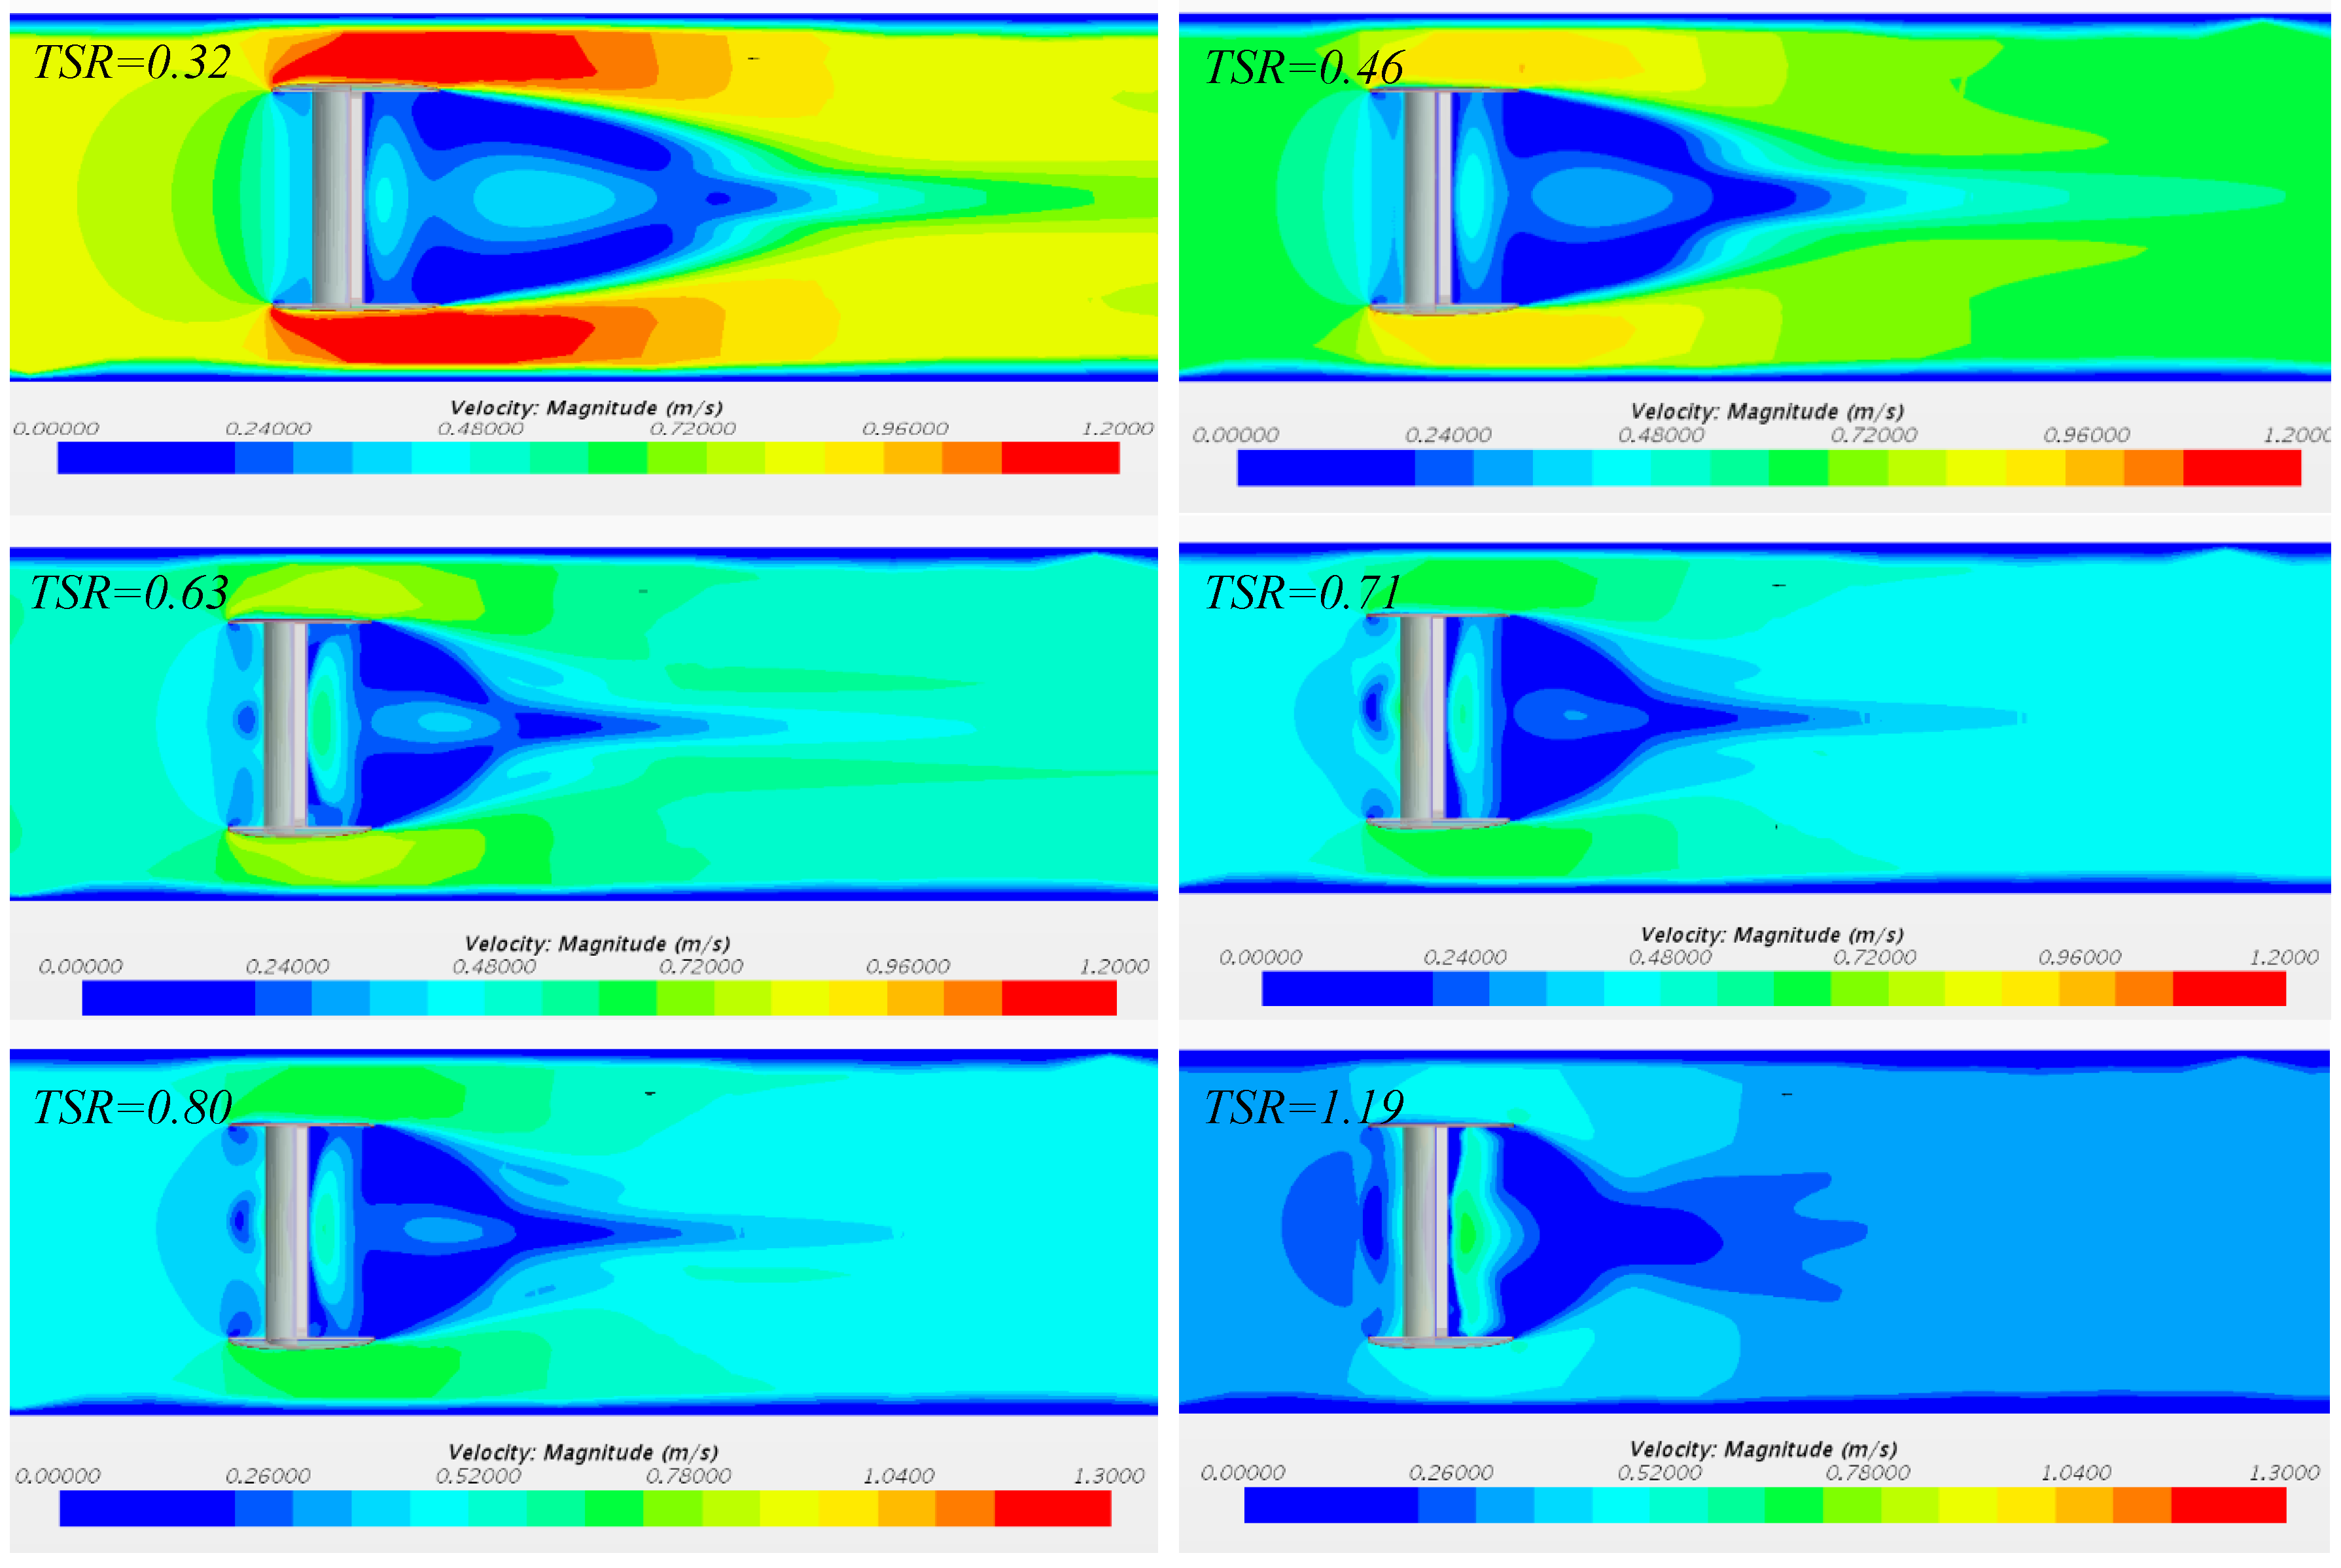
Figure 11.
Cp vs TSR curve for the Savonius turbine (K-ω model).
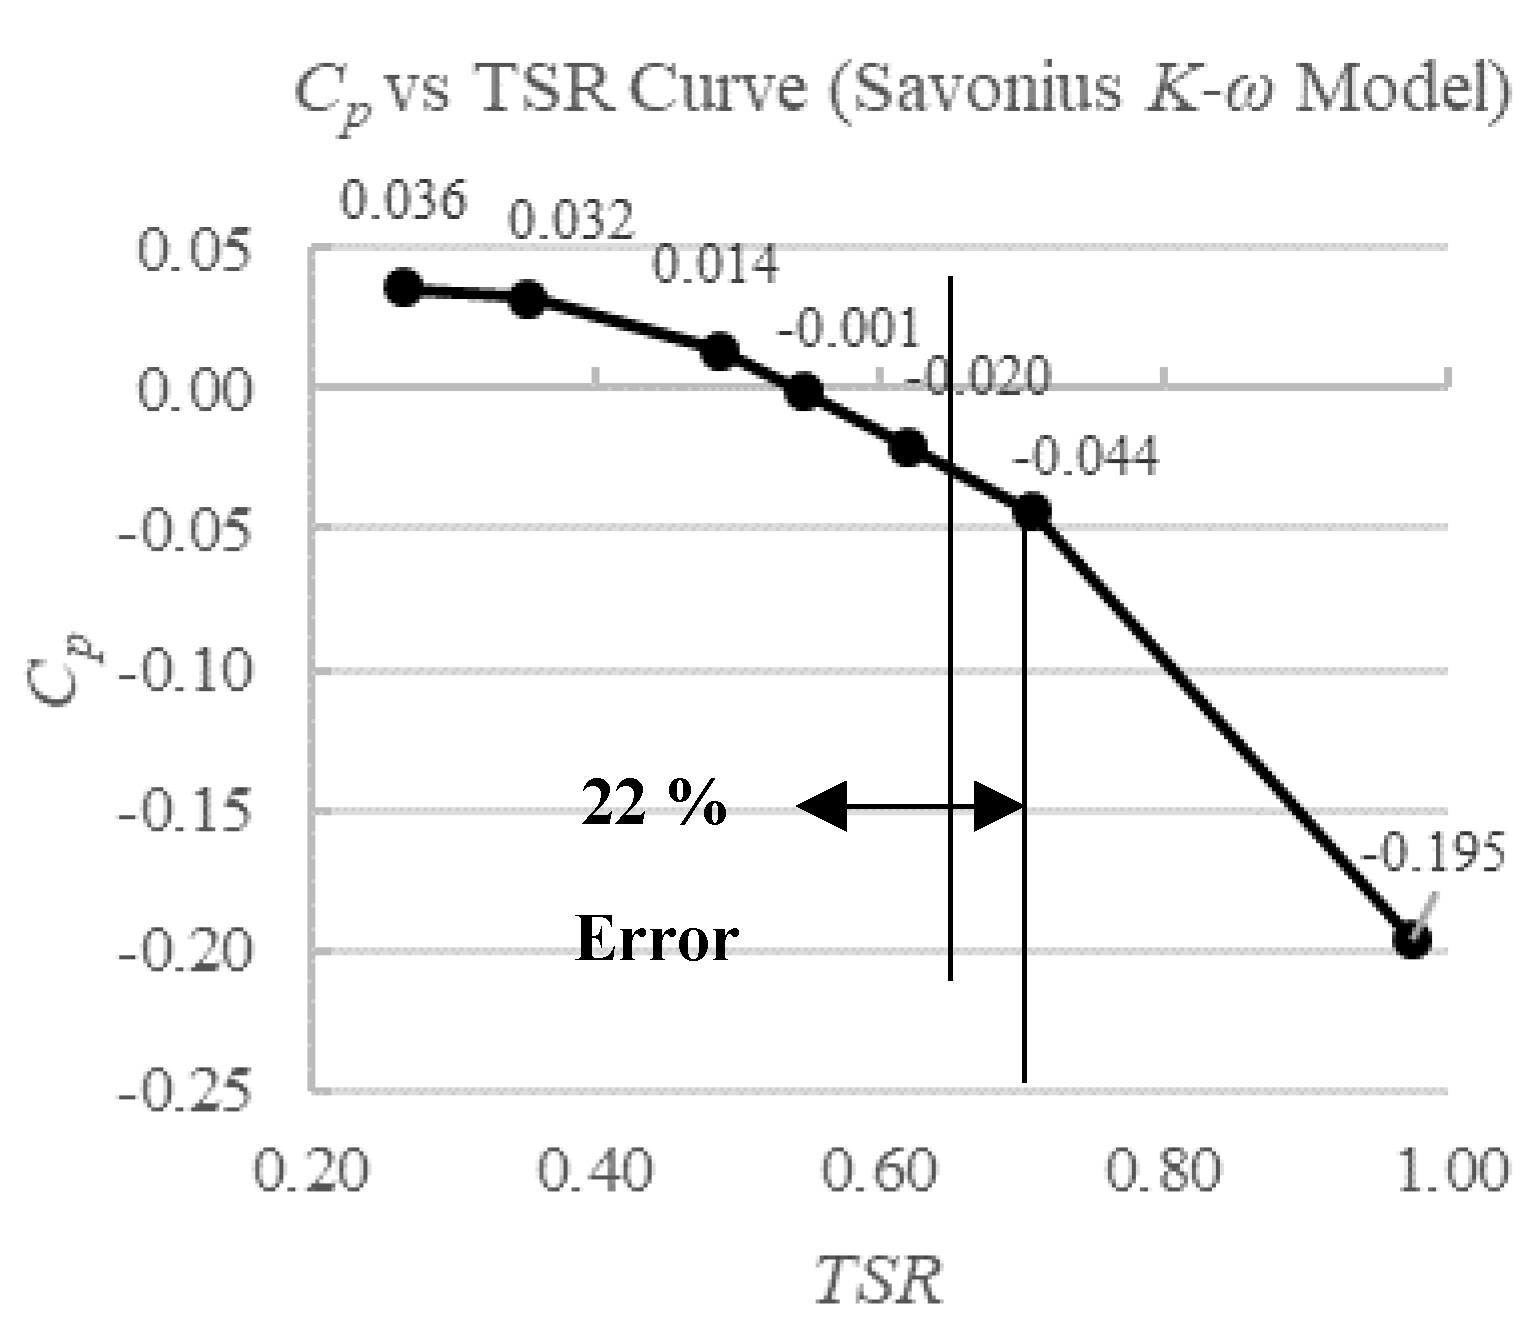
Table 1.
Scales of the CFD Models.
| Parameter | Unit | Pinwheel | Savonius |
|---|---|---|---|
| Blade Radius | m | 0.3 | 0.059 |
| Rotor Diameter | m | 0.6 | 0.118 |
| Rotor Height | m | 0.6 | 0.187 |
| End-Plate Diameter | m | - | 0.130 |
| Blade Area | m2 | 0.2826 | 0.022 |
| Channel Width | m | 2.09 | 0.600 |
| Channel Height | m | 1.13 | 0.325 |
| Channel Area | m2 | 2.36 | 0.195 |
| Aspect Ratio | / | 1.85 | 1.85 |
| Blockage Ratio | / | 0.12 | 0.12 |
Table 3.
Characteristic Net Moment Balancing Equation for Pinwheel and Savonius turbine.
| Equations | Model |
|---|---|
| Pinwheel | |
| Savonius |
Table 4.
Characteristic Net Moment Balancing Equation for Pinwheel and Savonius turbine.
| Model | Reference Study | Simulation Result | Error Percentage |
|---|---|---|---|
| Pinwheel | 2.0 (Nemoto, Y. et al. 2003) | 2.37 (Optimal TSR) | × |
| 0.17 (Nemoto, Y. et al. 2003) | 0.223 (Optimal Cp) | × | |
| Savonius | 0.7 (Kumar and Saini, 2021) | 0.63 (Optimal TSR) | (× |
| 0.23 (Kumar and Saini, 2021) | 0.16 (Optimal Cp) | (× |
Table 5.
Basin efficiency η under different inflow speeds U1 for Pinwheel and Savonius.
| Pinwheel | U1 | TSR | U2 | Puseful | Premoved | η |
| 1.00 | 2.0 | 0.610 | 18.11 | 108.96 | 16.62% | |
| 0.90 | 2.5 | 0.467 | 15.56 | 88.40 | 17.60% | |
| 0.80 | 3.0 | 0.343 | 12.30 | 66.48 | 18.49% | |
| 0.70 | 3.5 | 0.298 | 8.86 | 44.62 | 19.86% | |
| 0.60 | 4.0 | 0.278 | 5.73 | 27.42 | 20.89% | |
| 0.50 | 4.5 | 0.239 | 3.20 | 15.70 | 20.40% | |
| 0.40 | 5.0 | 0.225 | 1.46 | 7.42 | 19.69% | |
| Savonius | U1 | TSR | U2 | Puseful | Premoved | η |
| 0.833 | 0.32 | 0.789 | 0.54 | 0.96 | 55.76% | |
| 0.750 | 0.39 | 0.671 | 0.49 | 1.32 | 37.14% | |
| 0.667 | 0.46 | 0.552 | 0.41 | 1.41 | 28.91% | |
| 0.583 | 0.56 | 0.513 | 0.32 | 0.70 | 45.35% | |
| 0.542 | 0.63 | 0.470 | 0.28 | 0.61 | 45.75% | |
| 0.500 | 0.71 | 0.355 | 0.25 | 0.88 | 28.00% |
Disclaimer/Publisher’s Note: The statements, opinions and data contained in all publications are solely those of the individual author(s) and contributor(s) and not of MDPI and/or the editor(s). MDPI and/or the editor(s) disclaim responsibility for any injury to people or property resulting from any ideas, methods, instructions or products referred to in the content. |
© 2024 by the authors. Licensee MDPI, Basel, Switzerland. This article is an open access article distributed under the terms and conditions of the Creative Commons Attribution (CC BY) license (https://creativecommons.org/licenses/by/4.0/).
Copyright: This open access article is published under a Creative Commons CC BY 4.0 license, which permit the free download, distribution, and reuse, provided that the author and preprint are cited in any reuse.


