1. Introduction
According to the Pan American Health Organization (PAHO), 1.35 million people die from road traffic crashes, and millions of people are injured worldwide. In middle- and low-income countries, 90 percent of deaths are caused by traffic accidents, accounting for approximately 3 percent of PBI [
1]. In the case of Peru, in the first seven months of 2022, more than 47,600 traffic accidents were reported, causing the death of 1,853 people, which is a monthly average of 265 victims in traffic accidents. In 2021, there were more than 74,620 traffic accidents causing the death of 30,032 people [
2], which is alarming. Of all the possible causes, the human factor is one of the main factors, representing 93.9% (27396) of road accidents caused by drivers in 2022 [
3]. The majority of vehicle accidents are caused by driver drowsiness while driving.
In order to reduce these accidents due to drowsiness, there are current studies that provide different methods to detect driver drowsiness in time to avoid an accident. According to the study made by Albadawi et al. [
4], four measures are determined for the detection of drowsiness, one of them is based on the vehicle, taking the angle of the steering wheel and the deviation from the highway lane; another is based on bio-signals such as Electrocardiography (ECG), Electroencephalography (EEG), Electrooculogram (EOG), etc., This measure is very accurate but invasive for drivers; the other measure is based on image analysis, specifically focusing on the eyes, mouth and head position, this measure is widely used because it is non-invasive and does not cause discomfort to the driver, also most of the drowsiness signals are presented in facial features, so it is easier to determine when a driver shows symptoms of drowsiness; and the last one can be a combination of the three measures mentioned above.
This paper presents an approach to determine driver drowsiness by digital image analysis, exploring the state of the eyes (open or closed) using methods that implement Deep Learning such as Convolutional Neural Networks (CNNs). For the selection of the region of interest, an approach for correction of the points near the eyes was proposed. Three CNNs architectures will be used as a basis: InceptionV3 [
5], VGG16 [
6] and ResNet50V2 [
7] that use transfer learning [
8] and MediaPipe [
9] for facial point detection and region of interest (ROI) extraction. The authors also adapted the fully connected network for binary classification of drowsiness. For the identification of drowsiness in drivers in real environment the probability of the ROI belonging to the drowsiness class is evaluated and subsequently used the proposal presented by [
10], which consists of counting the time of a normal blink eye that is from 100 to 300ms, so when the eyes are closed for more than 300ms it is considered in a drowsy state.
The paper is organized as follows:
Section 2 describes the literature related to drowsiness detection;
Section 3 describes the materials and methods used;
Section 4 shows the results obtained and their analysis for each CNN architecture, obtaining a model for each of them; finally,
Section 5 presents the conclusions and future research.
2. Related Work
In the research of Park et al. [
11] an architecture called Deep Drowsiness Detection (DDD) is proposed, which processes RGB videos that focus on the driver’s entire face. The DDD architecture makes use of three architectures: AlexNet, VGG-FaceNet and FlowImageNet, where the output of the three networks are unified in order to classify the drowsiness in frames of the input videos. To test the proposed model, the authors use the NTHU Drowsy Driver Detection (NTHU-DDD) database achieving an average accuracy of 73.06% during their experimental results.
Chirra et al. [
12] propose an architecture that specifically uses the eye region. For the extraction of the eye region, the Haar Cascade technique proposed by Viola Jones is used. To detect the face and within it to detect the eyes, the ROI of the eyes becomes the input of their CNN where they used a database collected for the training of their network, obtaining an accuracy of 98% in training, 97% in validation and 96.42% in the final test.
In the approach of Zhao et al. [
13], the authors use facial characteristic points for drowsiness detection and classification. They make use of a MTCNN (Multi-task Cascaded Convolutional Networks) network for face detection and characteristic points location, extracting ROIs from the eyes and mouth they pass to their network called EM-CNN, where they make a classification of 4 classes, 2 for the eyes state and 2 for the mouth state. Their tests were performed on a database provided by the company Biteda, where they obtained 93.623% accuracy compared to other types of architectures.
In the proposal by Phan et al. [
14] two methods are proposed for drowsiness detection, the first one uses characteristic points of the face focusing on the eyes and mouth using the Dlib library, applying thresholds to determine if it is yawning or blinking; the second method uses MobileNet-V2 and ResNet-50V2 networks using transfer learning, for the training of CNNs the authors collected images from various sources to generate their dataset, obtaining an average result of 97% accuracy.
In the system presented by Rajkar et al. [
15] Haar Cascade is used to extract the eyes. The ROI extraction is performed for each eye separately after detecting the face, then the proposed architecture is used for training, using two databases: YawDDD and Closed Eyes In The Wild. The authors achieved an accuracy of 96.82%.
In the research presented by Hashemi et al. [
16] a drowsiness detection system is proposed by training 3 CNNs, one designed by the authors and the others by transfer learning using VGG16 and VGG19. The face detection is performed by Haar Cascade, and then Dlib is used to detect the eye points and thus delimit the region of interest for the training of the 3 networks using the ZJU Eyeblink database. Their results show an accuracy of 98.15% with the proposed network.
Finally, in the research of Tibrewal et al. [
17] propose a CNN architecture. For learning and testing, the MRL Eye database is used, which provides images of a single eye. For eye ROI extraction, the Dlib library is used. The authors obtained 94% average accuracy in drowsiness detection by focusing on the eye state.
3. Proposed Method
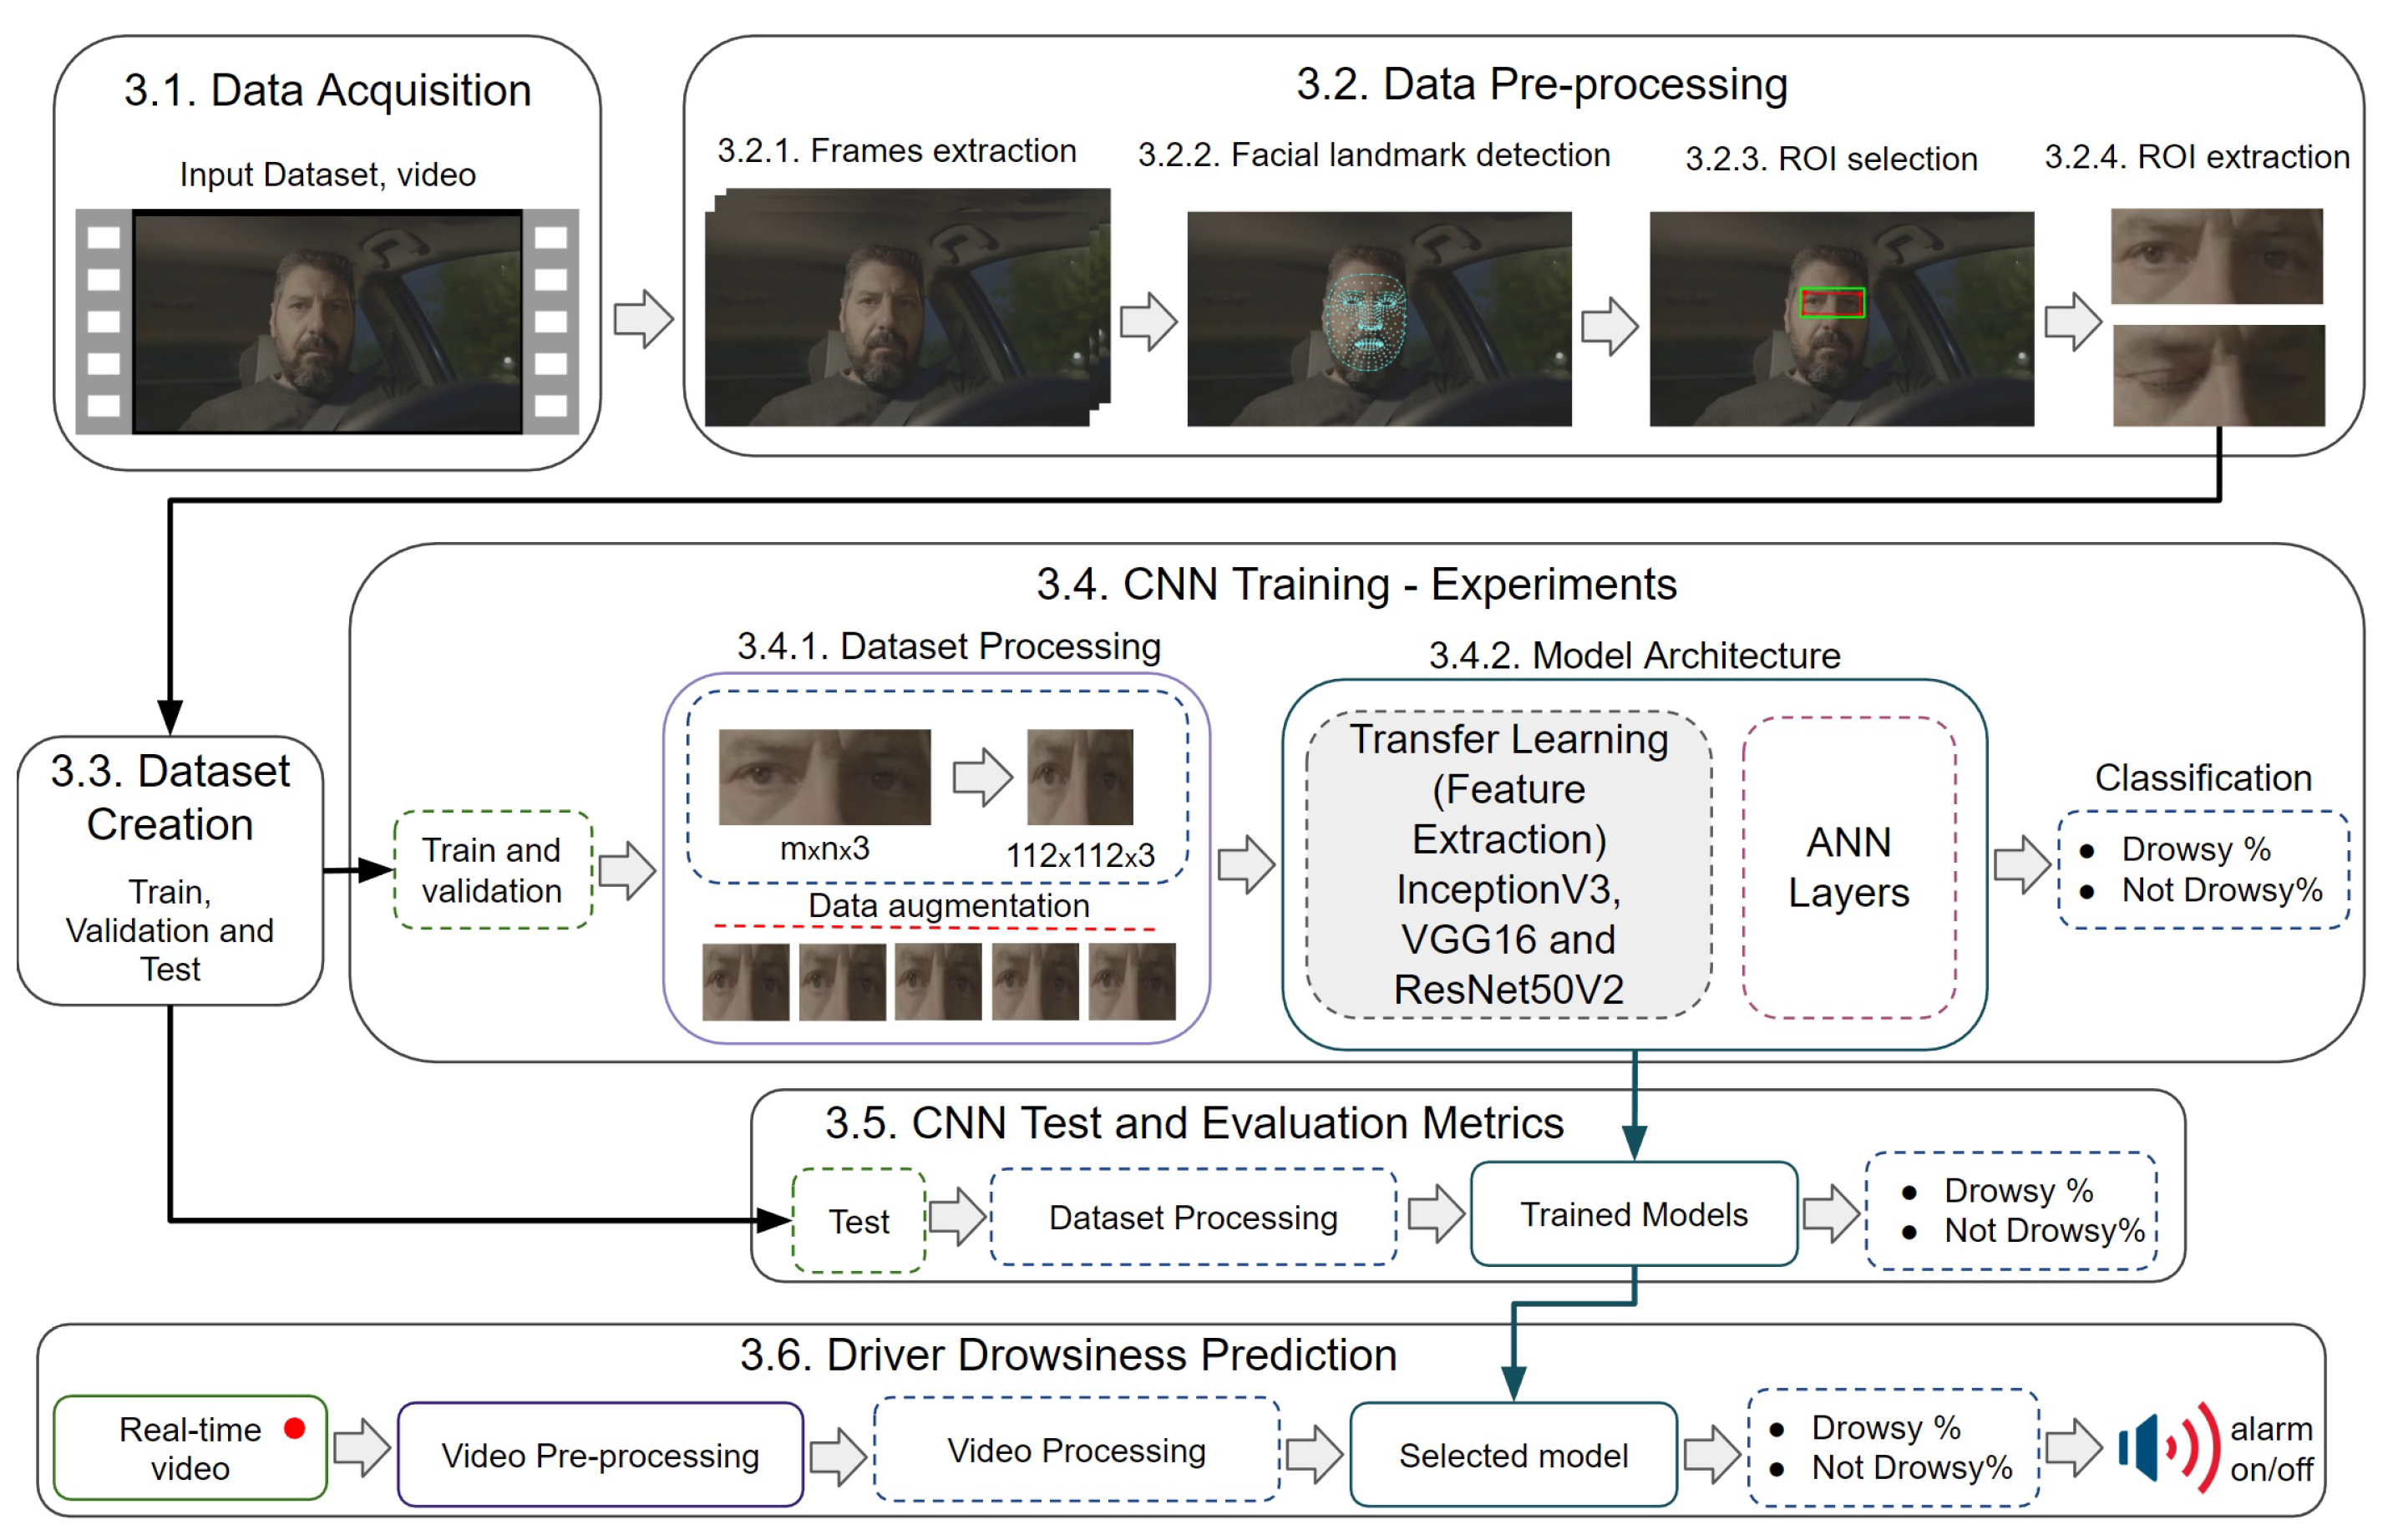
The proposed approach uses the methodology represented by the flowchart in
Figure 1 which consists of 6 stages: acquisition of the data (video), pre-processing of the images captured from the videos, creation of the dataset, training of the CNNs architectures, testing of the trained models and subsequent prediction of driver drowsiness. Firstly, the acquisition of videos showing the driver drowsiness will be performed. After obtaining the data, a pre-processing is done to extract the frames where the 468 facial points will be detected by MediaPipe. For a better selection of the ROI, a methodology is proposed that uses 4 points around the eyes and with the help of an intermediate point between the eyes calculates the distances from the extreme point of the right eye to the extreme point of the left eye and the upper and lower extreme points of the right and left eyes, comparing them and thus selecting the most significant distance to create the ROI, this method guarantees the ROI of the eyes without losing information when the driver makes head movements looking up, down, right and left. This proposed method is described in detail in point
Section 3.2.3 ROI selection. After having the ROI selected, the frames are extracted to create the dataset. All the images of the dataset go through a processing that resizes them to an image of 112 x 112 pixels and then normalizes them by dividing each pixel by 255. At this stage data augmentation is also applied to the training set in order to avoid overfitting. Then, the processed images are used for the training of the 3 CNNs architectures generating their respective accuracy and loss graphs. To run and evaluate the performance of the networks, a test is performed with the set of test images resulting in the selection of the best performing model. Finally, with the selected model, the driver drowsiness prediction test is performed.
3.1. Data Acquisition
There are currently a few databases that can be used for sleepiness detection. This proposal uses the Night-Time Yawning-Microsleep-Eyeblink-driver Distraction (NITYMED) database [
18]. This database contains videos of males and females in a real night-time driving environment, manifesting symptoms of drowsiness through their eyes and mouth. NITYMED consists of 130 videos in mp4 format at 25 fps in 1080p (FullHD) and 720p (HD) resolutions.
3.2. Data Pre-Processing
This subsection includes 4 steps, where the proposed ROI correction is shown in step 3. These steps are also used to create the training, validation and test dataset.
3.2.1. Frames Extraction
Consecutive frames are extracted from the video database. In this step a frame counter described by Equation 1 is used according to the 25 fps and duration of each video.
Considering that the average duration of the videos is 120 sec and the fps is constant
, the frames of each video are obtained using Equation 2. Where, the number of frames depends on the duration of each video in the dataset.
3.2.2. Facial Landmark Detection
In this step, use is made of MediaPipe Face Mesh [
19], which estimates 468 facial reference points of the 3D face in real time, thus detecting the face in each image. MediaPipe Face Mesh works for different head positions, where the face can be detected at different head rotation angles by employing machine learning (ML) to infer the 3D facial surface.
3.2.3. ROI Selection
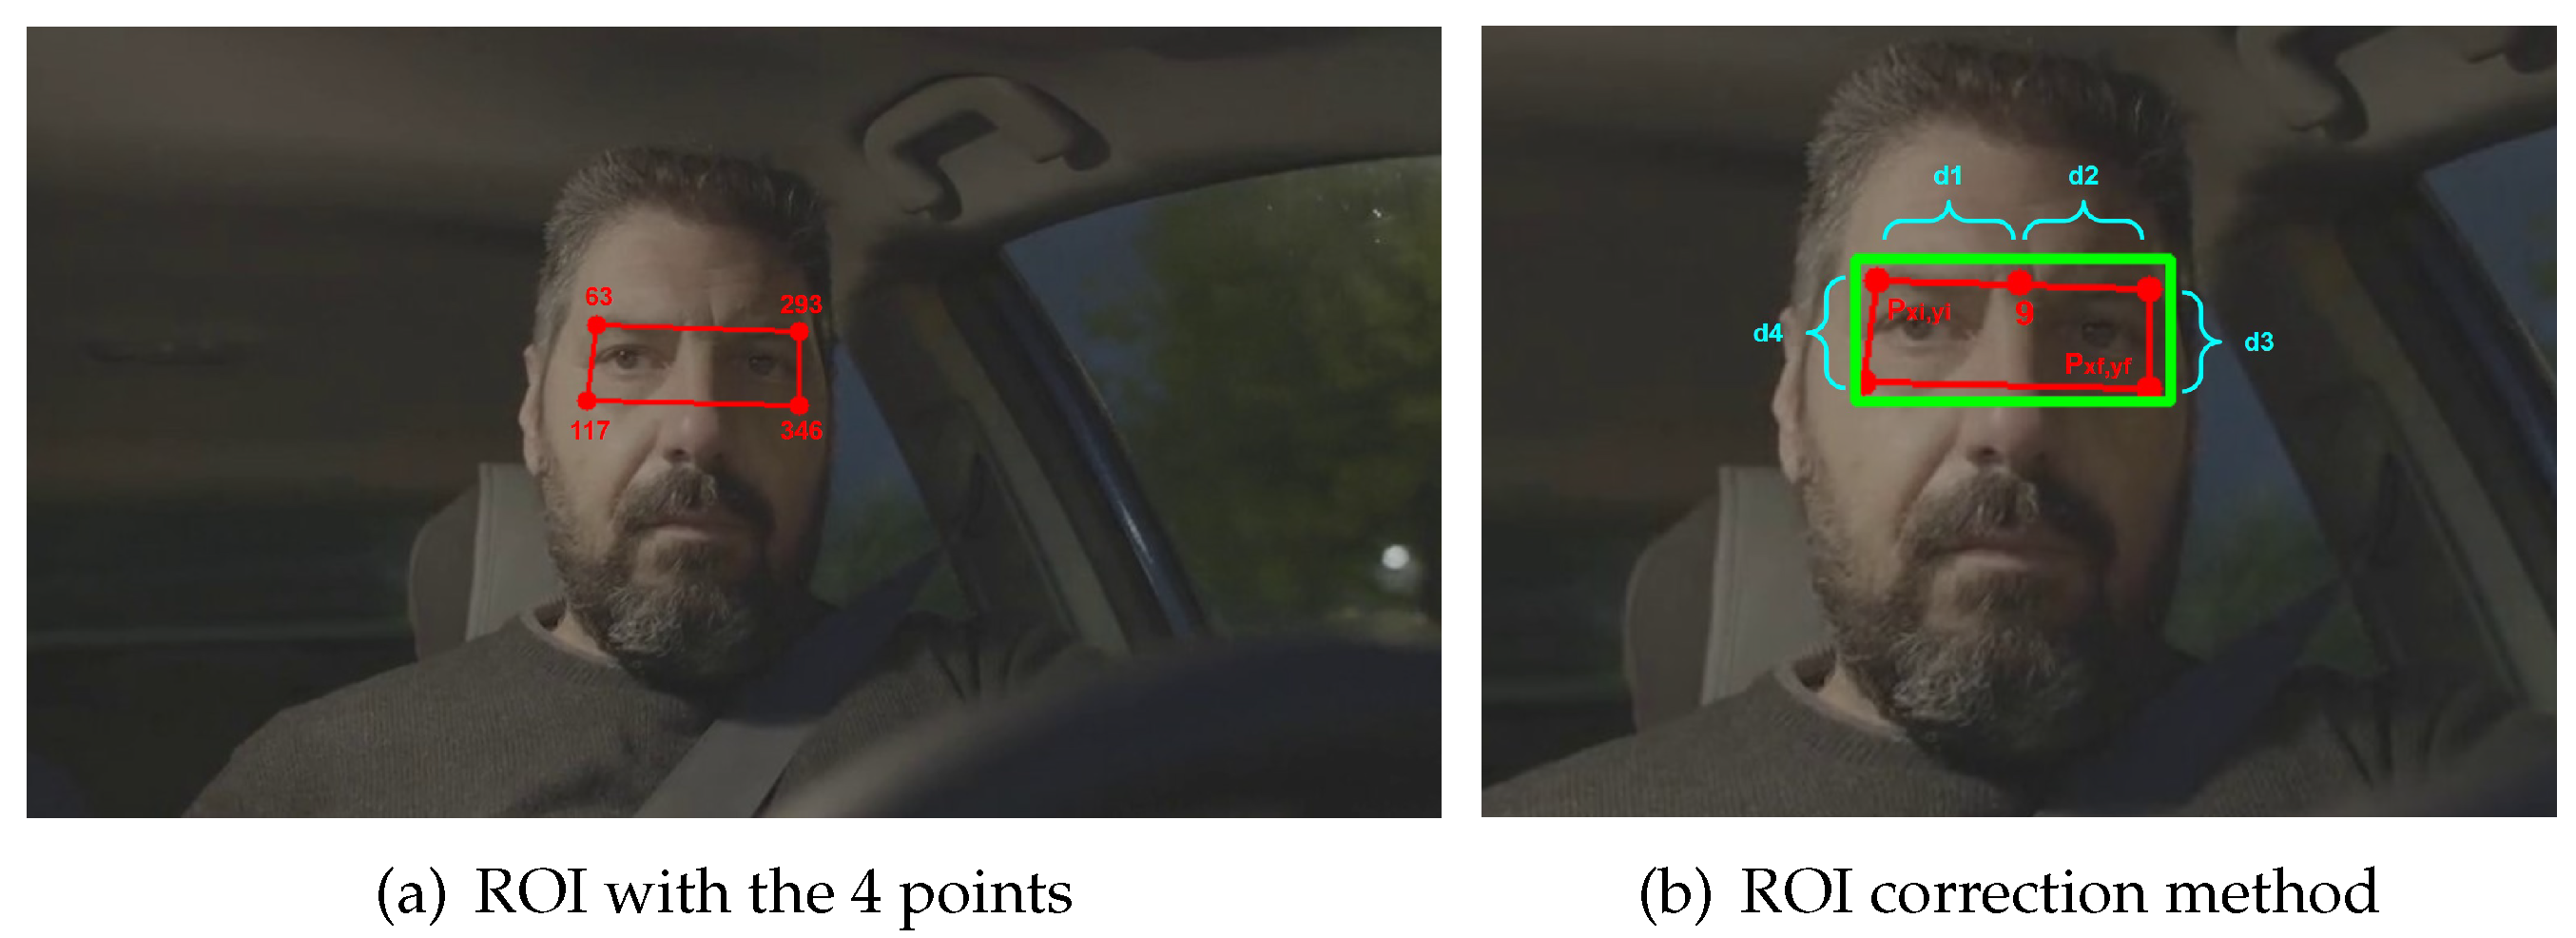
From the 468 points estimated in the previous step, only 4 points are needed to select the area of the region of interest (ROI). The points chosen within MediaPipe Face Mesh are: 63, 117, 293 and 346, where joining them to create the ROI forms an irregular rectangle as shown in
Figure 2a. From most of the existing ROI extraction algorithms [
20,
21,
22,
23],
Figure 2b shows the proposed method for ROI correction, where a point correction described to follow is performed.
It is proposed to consider as initial point the x and y components of point 63
and as final point the x and y components of point 346
. Then we find the corresponding distances to each point, d1, d2, d3 and d4, with a point in the middle of both eyes which is point 9, and then make a comparison of extreme points at different head movements stored in the variables
and
. The pseudocode used for ROI correction is shown in Algorithm 1.
|
Algorithm 1: ROI Correction |
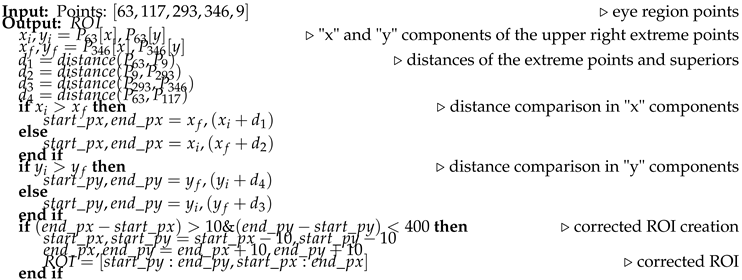 |
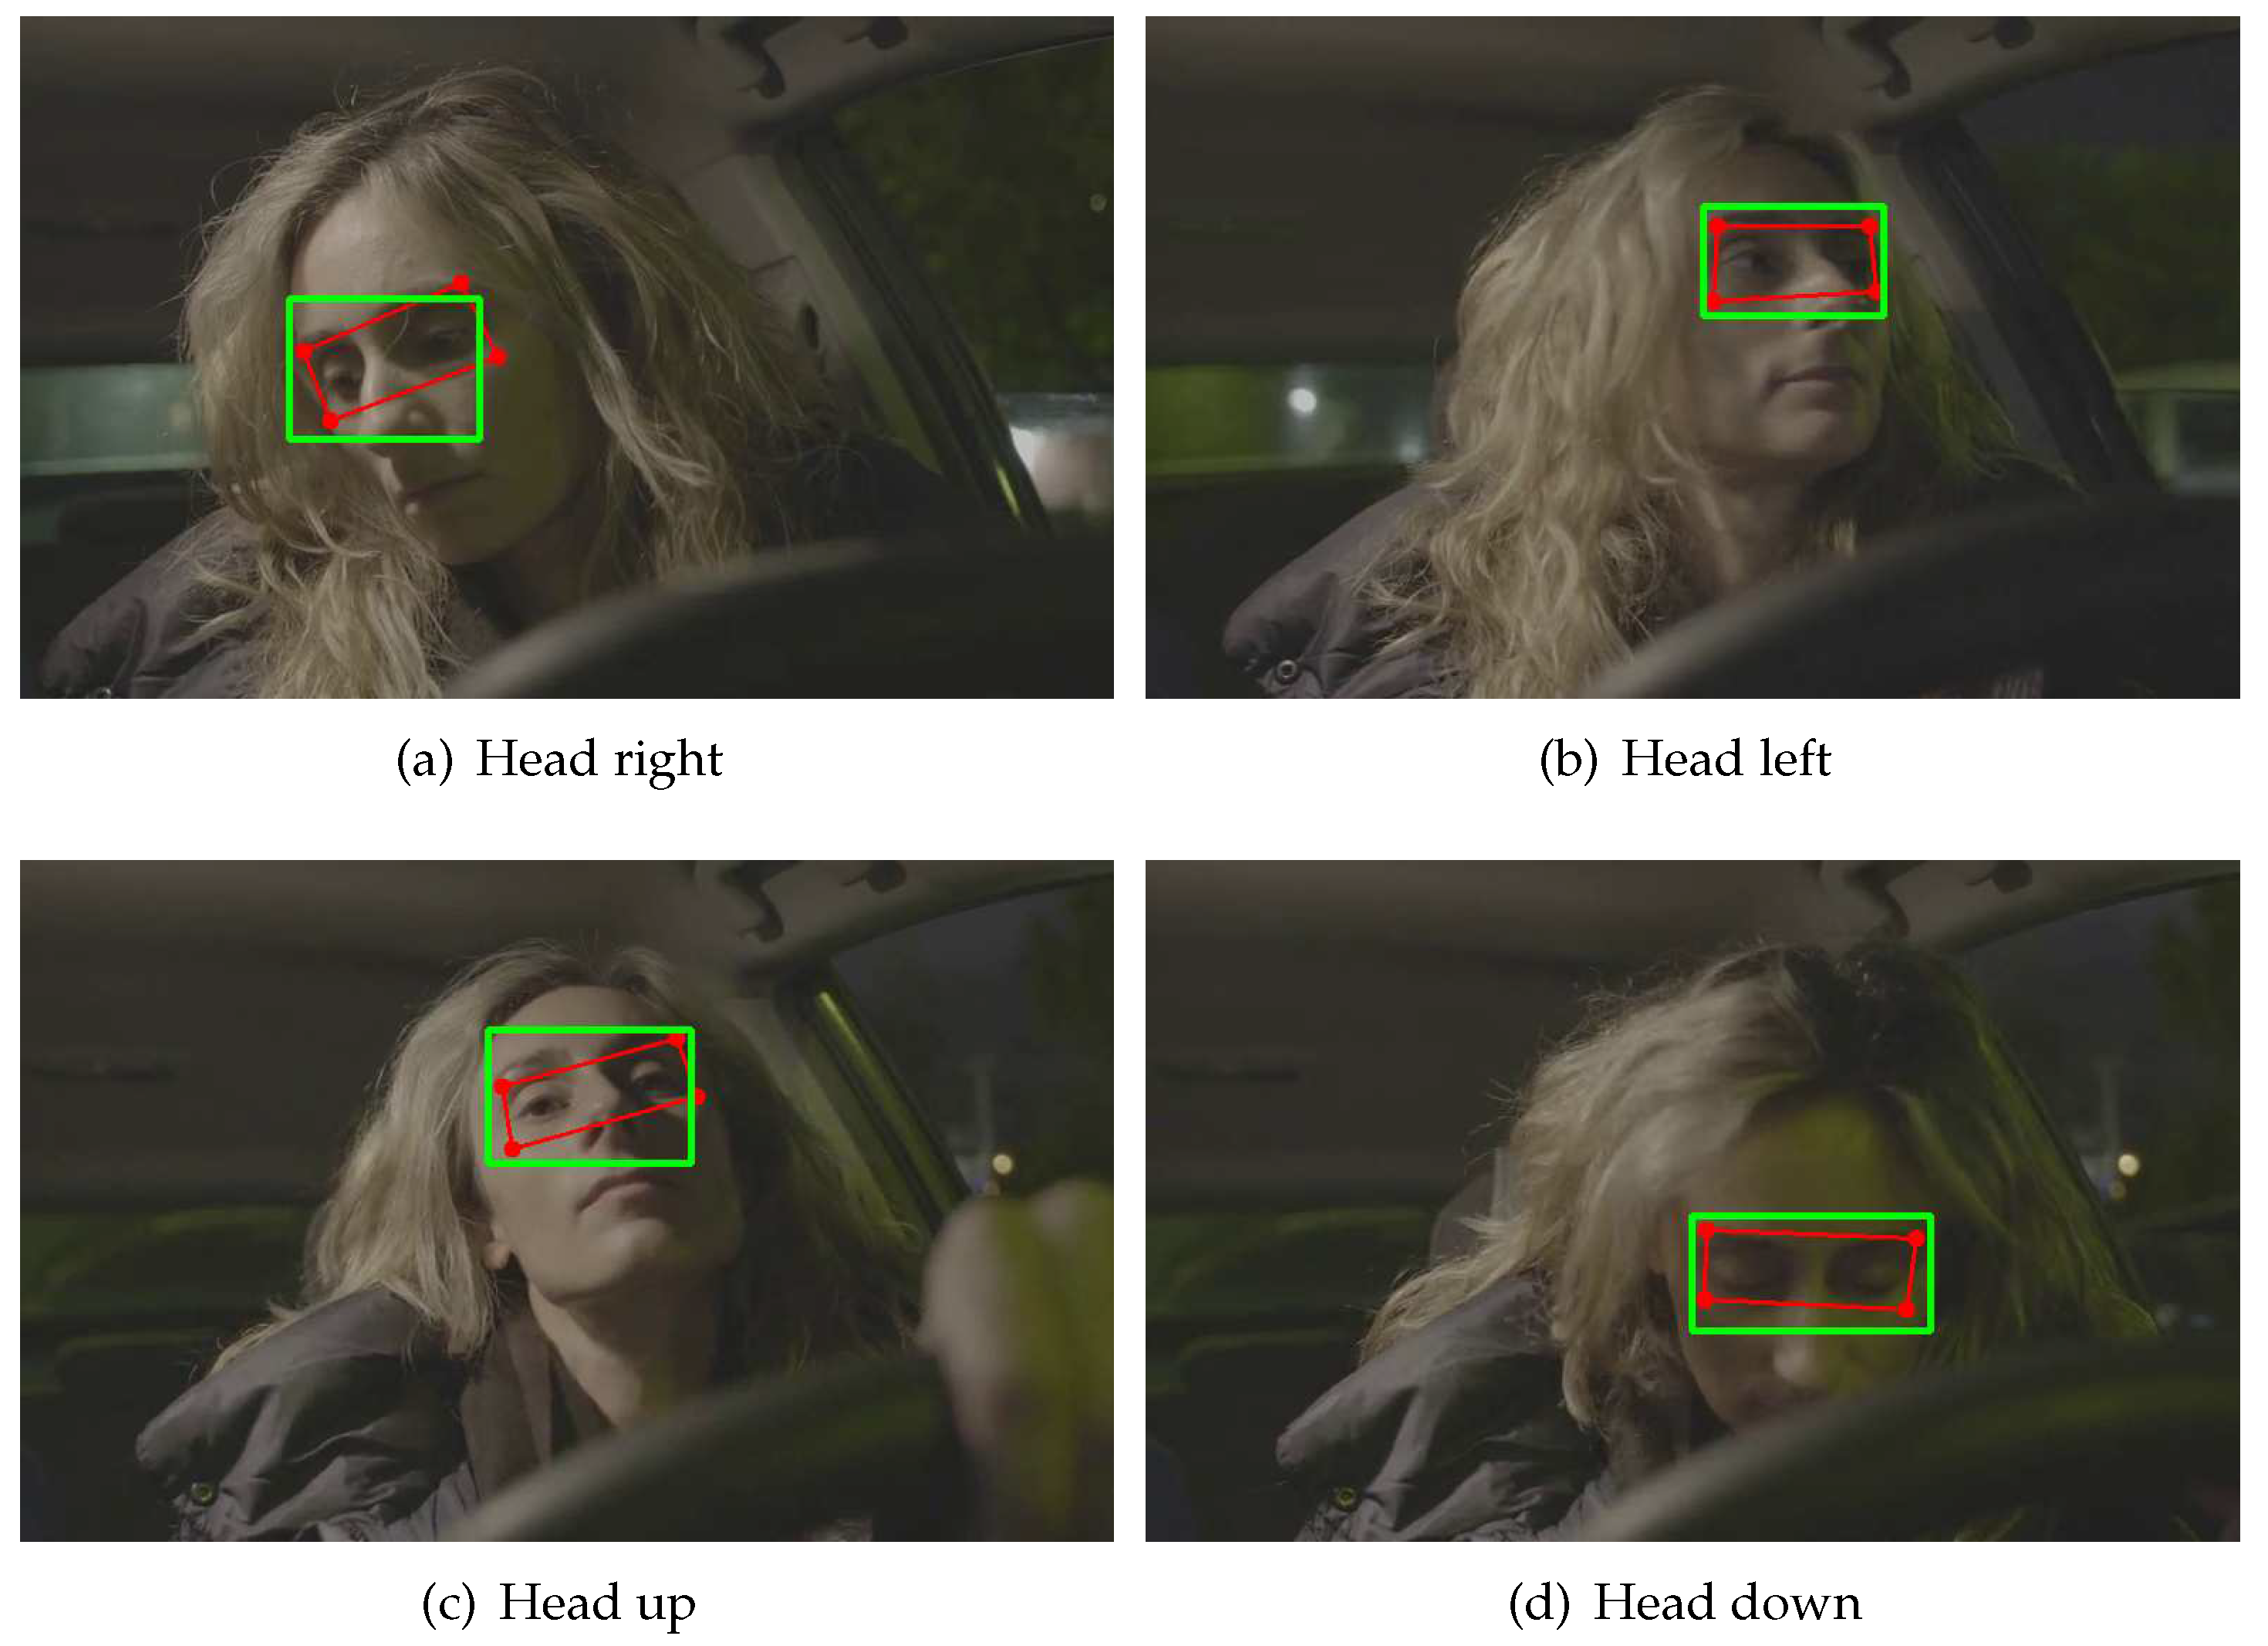
An example of application of the ROI correction method can be seen in
Figure 3, where the results are shown at 4 different positions of the driver’s head. Where the red outline represents the irregular or deformed ROI, while the green outline is the corrected ROI.
3.2.4. ROI Extraction
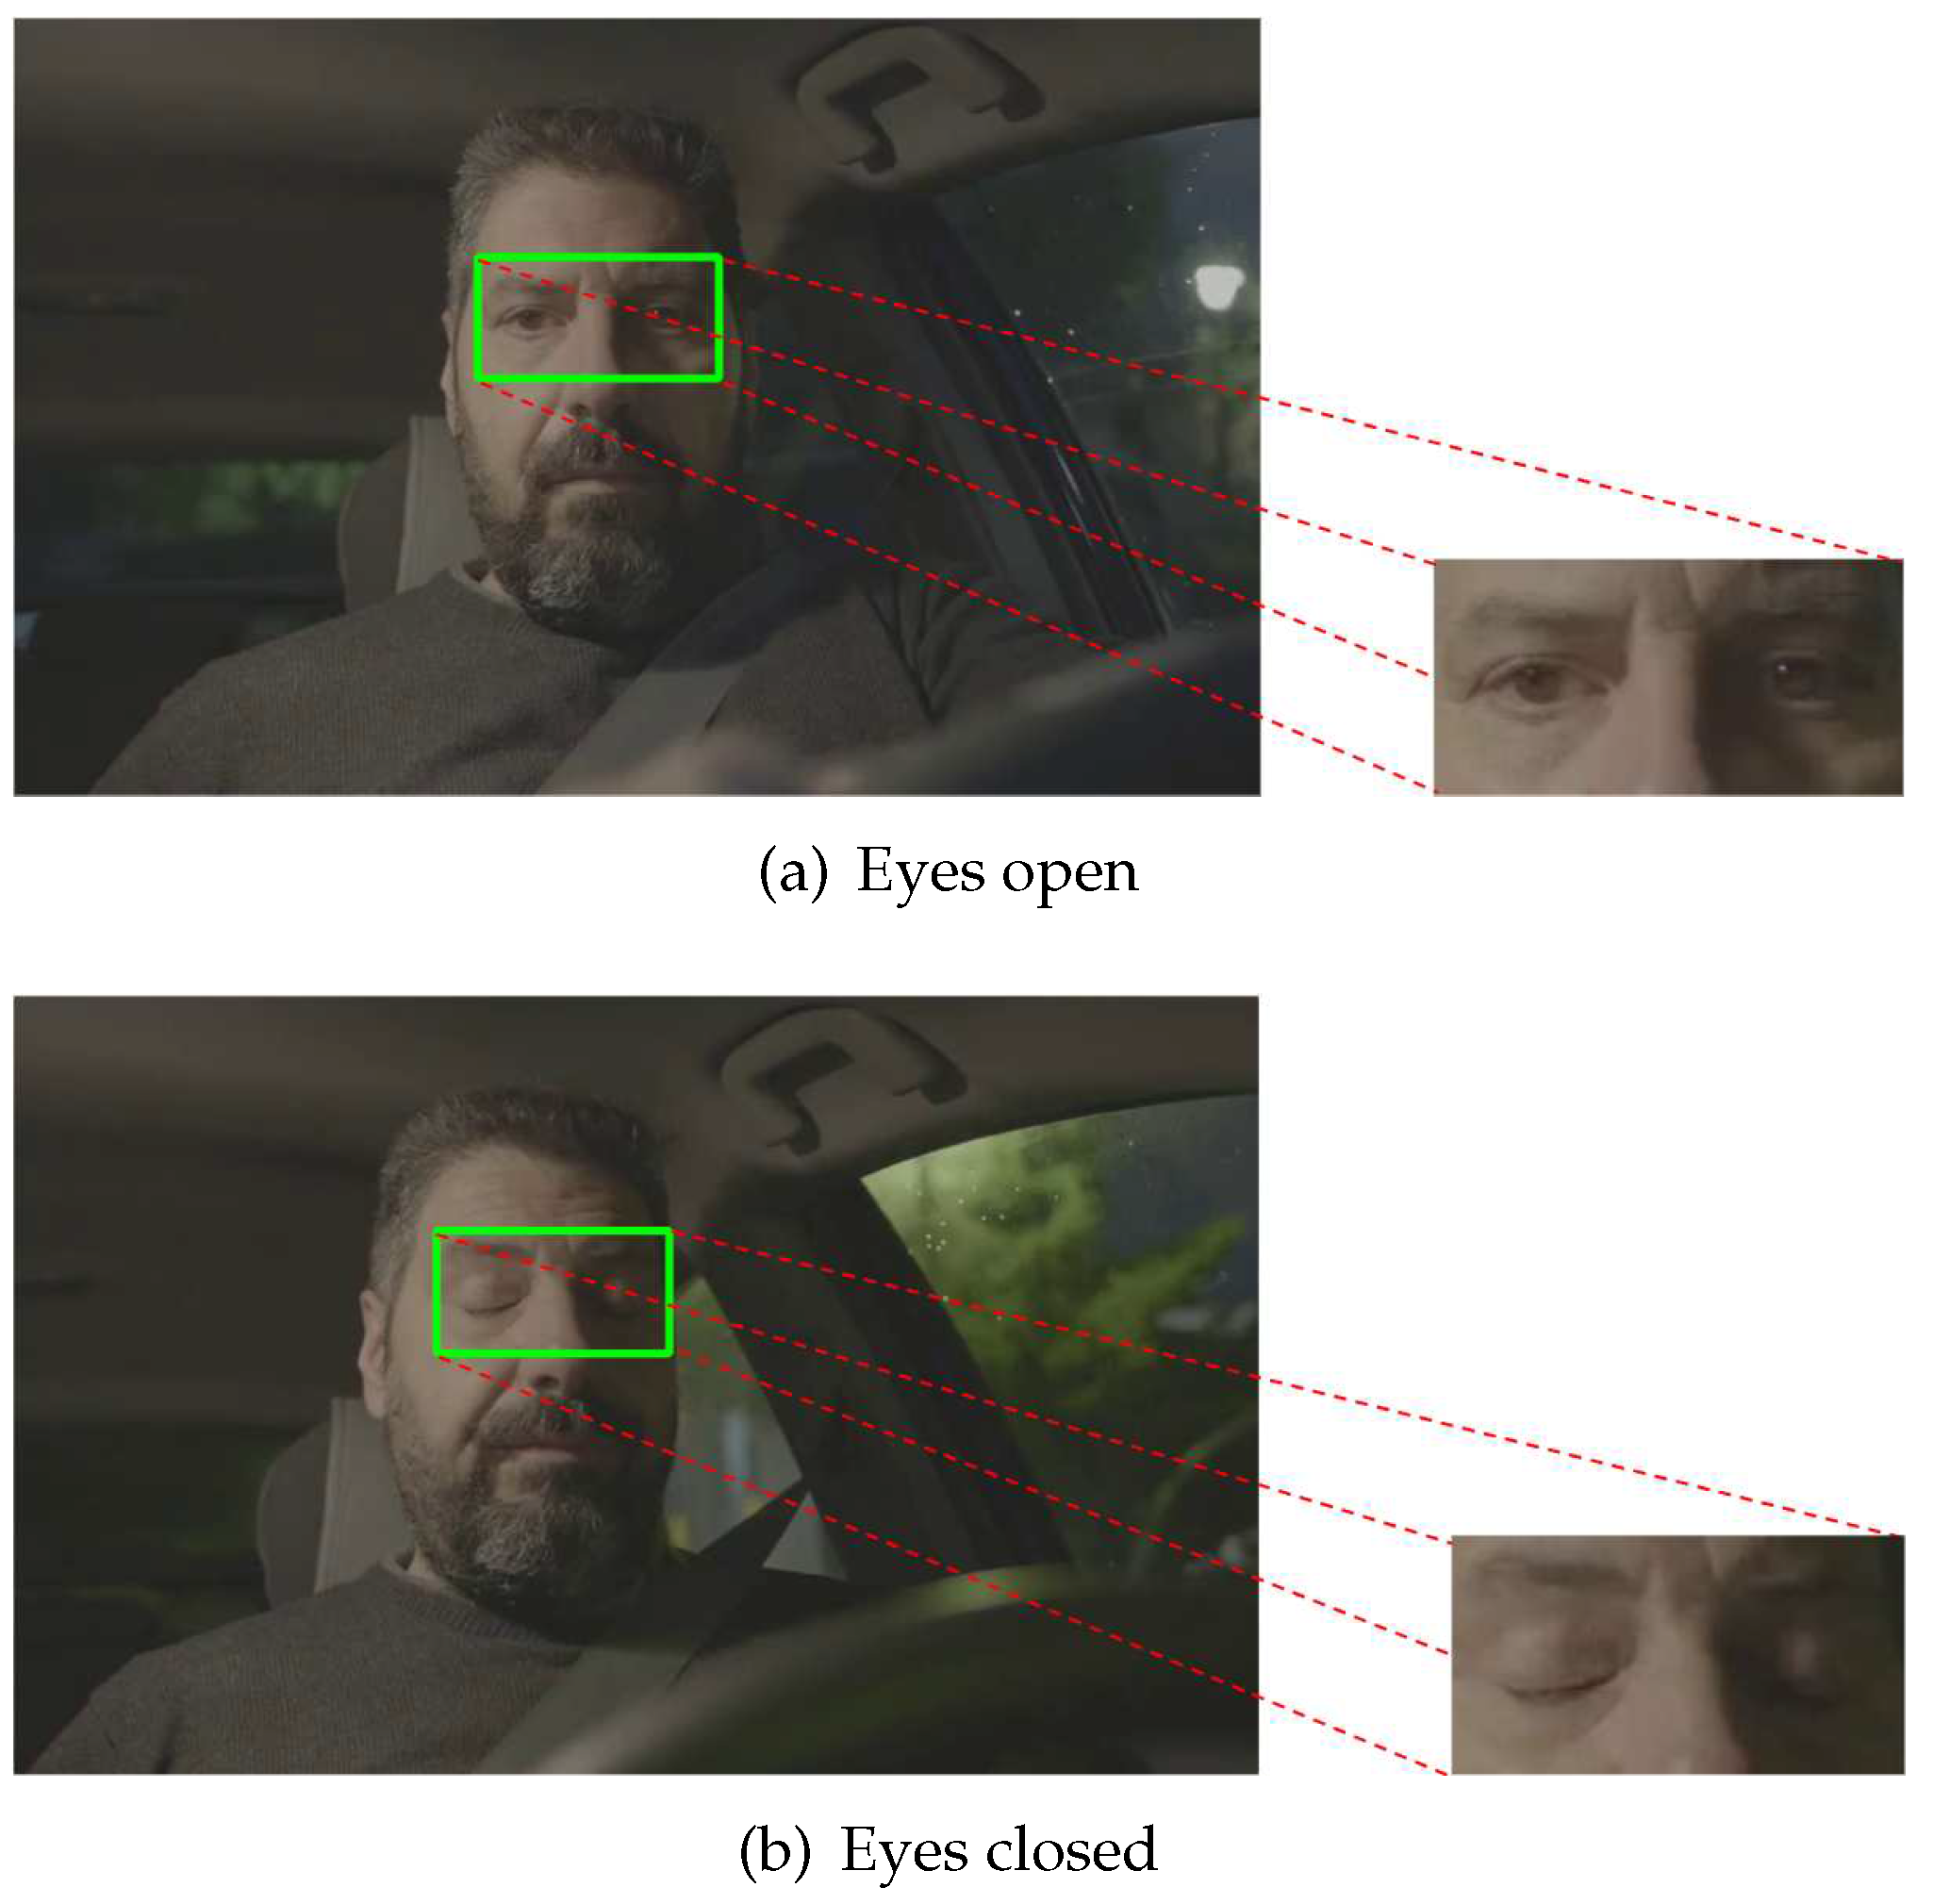
After making the ROI correction, the eye area that will serve as the CNN input is extracted. Even this step is useful for real-time analysis, since all the previous steps will be applied to the live video input. Depending on the drowsiness state of the driver the ROI may characterize sleep or wakefulness, represented by eyes open and eyes closed, respectively (
Figure 4).
3.3. Dataset Creation
The database was created with the ROI images obtained in the previous steps, focusing only on the eye region. From NITYMED, 6 videos were chosen for the creation of the training, validation and test data, obtaining a total of 6800 images. Being a binary classification, 2 classes
and
are labeled. Of the total number of images, 4760 (75%) images were divided for train data, 1020 (15%) images for validation data and 1020 (15%) images for test data. This data distribution was done to avoid overfitting due to the limited amount of data. The final distribution of the created dataset is shown in the
Table 1.
3.4. CNN Training - Experiments
3.4.1. Dataset Processing
Before training the CNNs, an image processing is performed. The extracted ROI has different pixel sizes with 3 layers of depth (mxnx3), therefore resizing to a size accepted by the CNNs is necessary. All images are adjusted to a size of 112x112x3 pixels, then normalized by changing each pixel value from 0 - 255 to 0 - 1. Then, to avoid overfitting, data augmentation is applied with the following parameters: rotation range is 20%, horizontal flip is and fill mode is , resulting in the creation of 5 images from each image of the training set.
3.4.2. Model Architecture
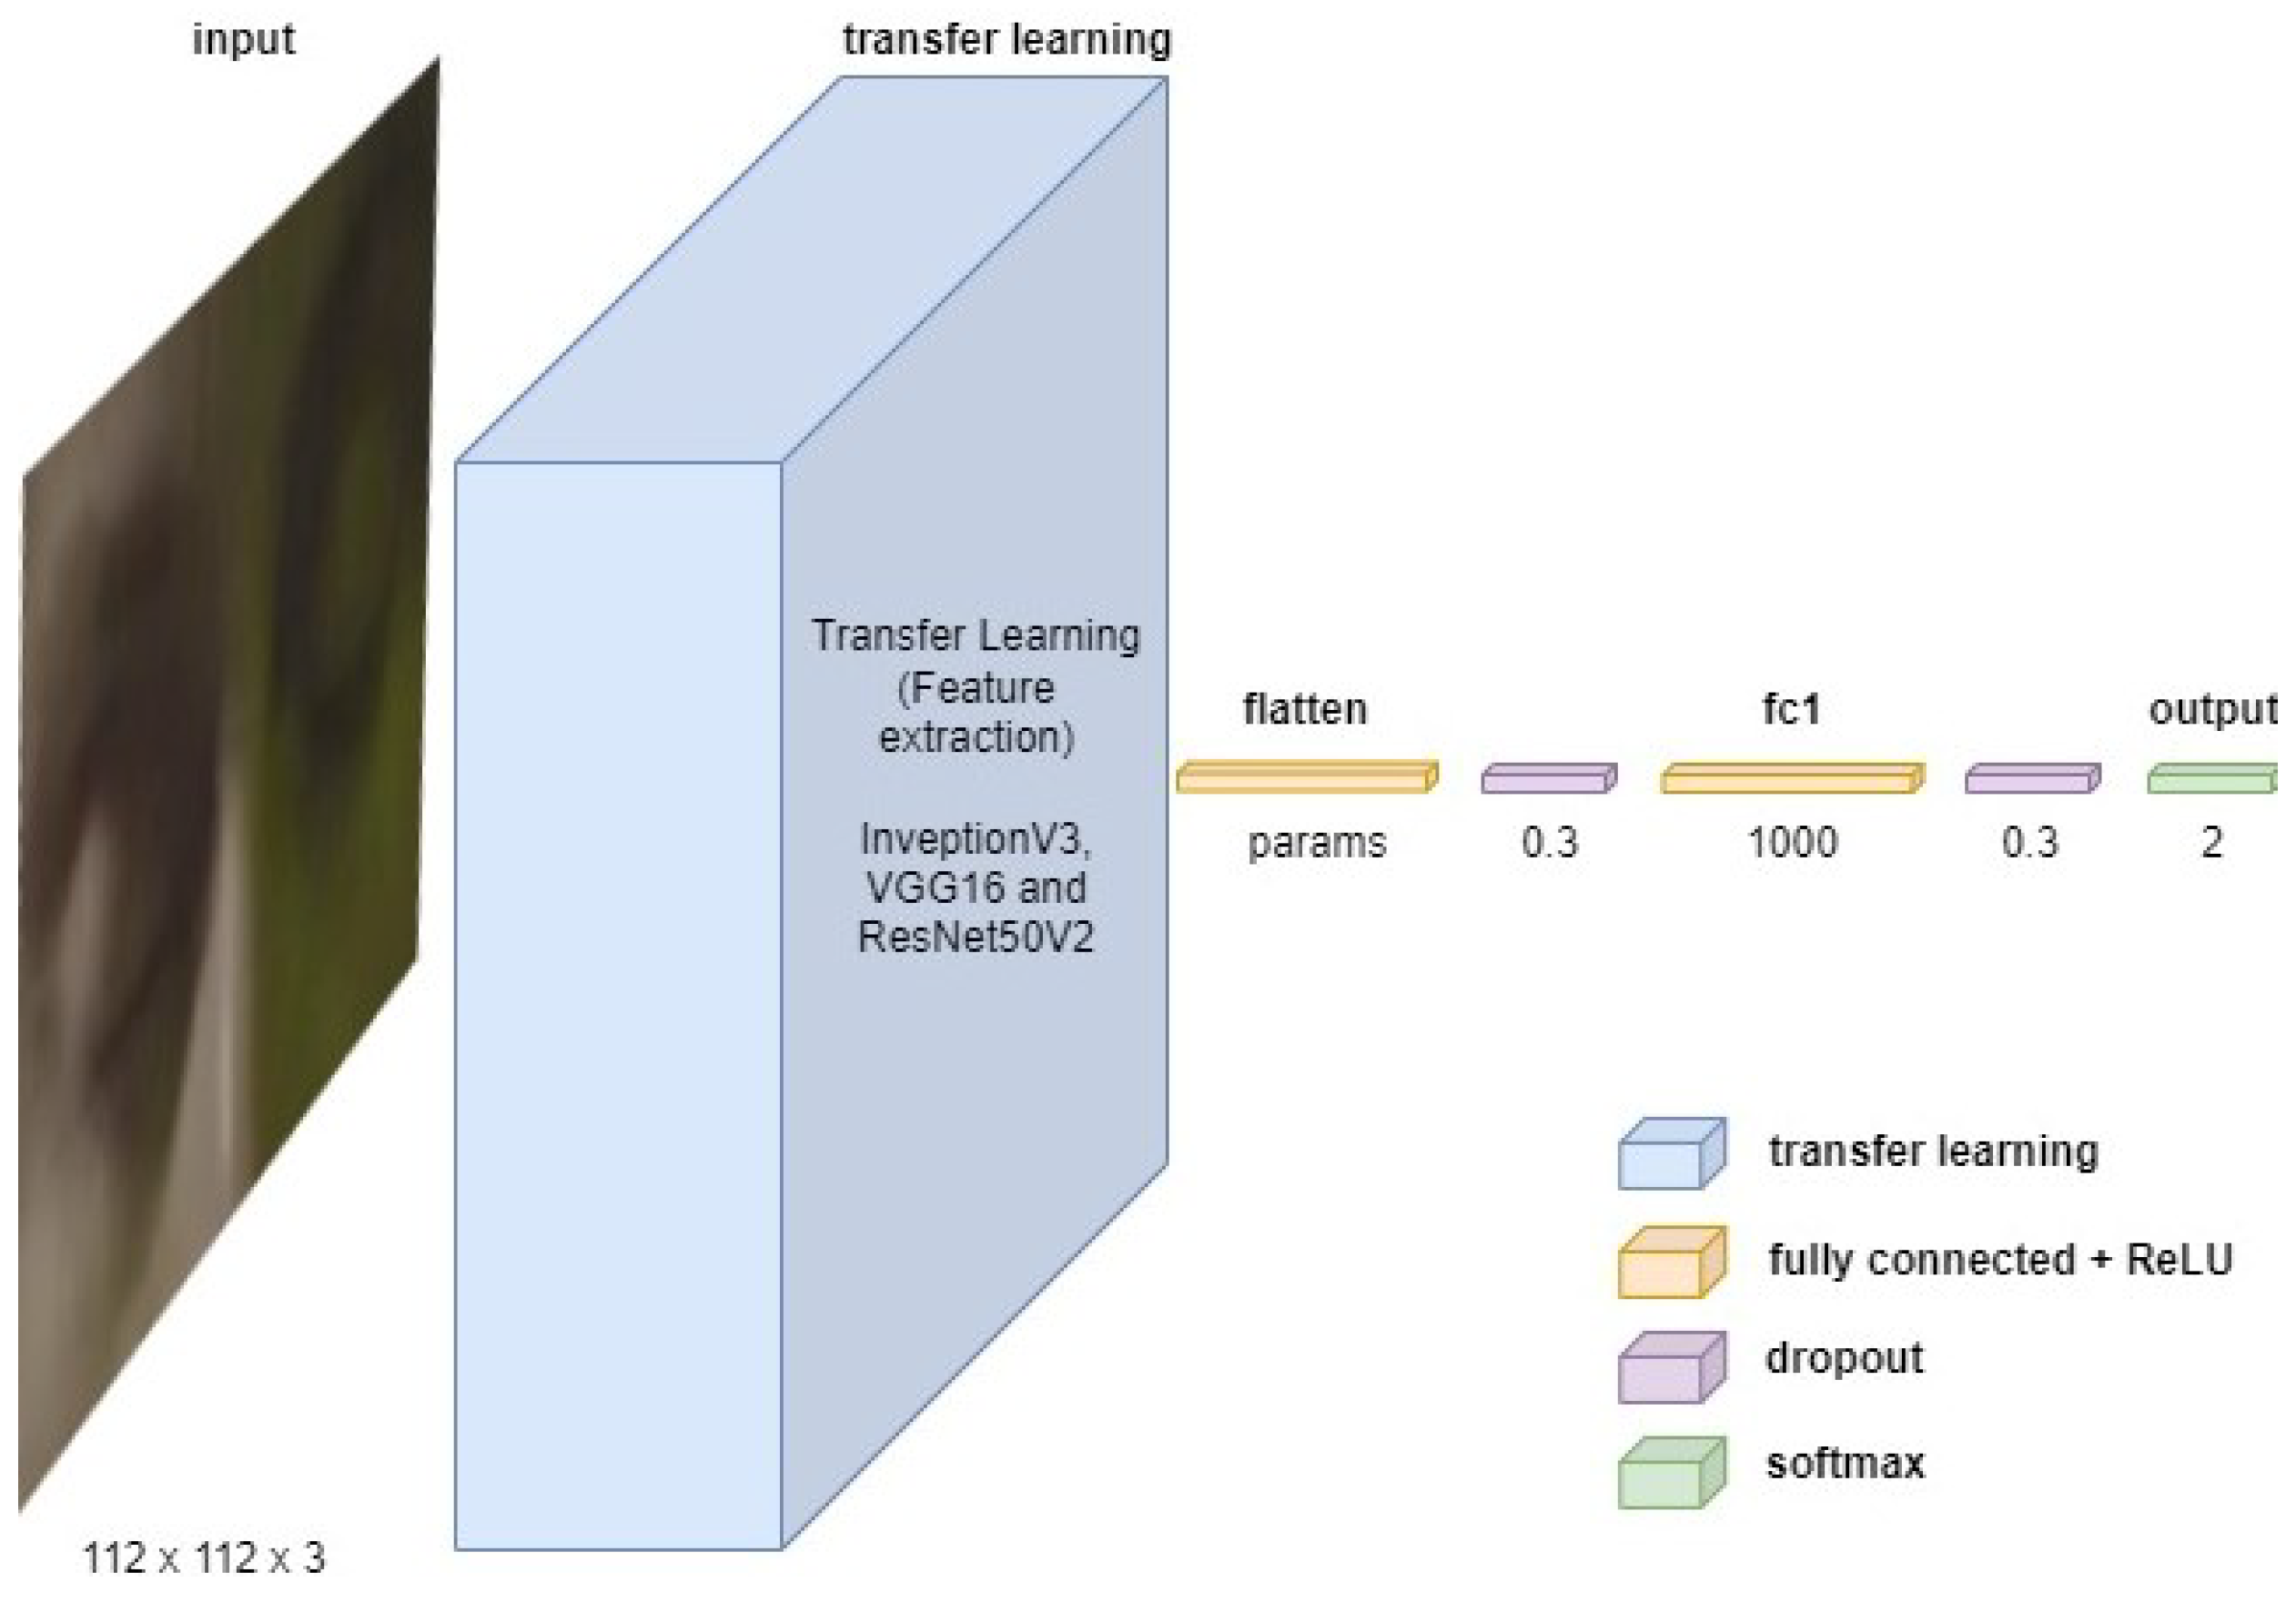
Three CNN architectures were trained based on: InceptionV3, VGG16 and. By means of transfer learning, the feature extraction weights of each CNN are obtained. Next, the binary classification architecture (Not drowsy and Drowsy) is designed by flattening the transfer learning output, followed by a 30% dropout with a dense hidden layer of 1000 neurons with ReLU activation and a 30% dropout with a dense layer of 2 outputs with SoftMax activation. The classification process is the same for all 3 CNNs. The proposed architecture is shown in
Figure 5.
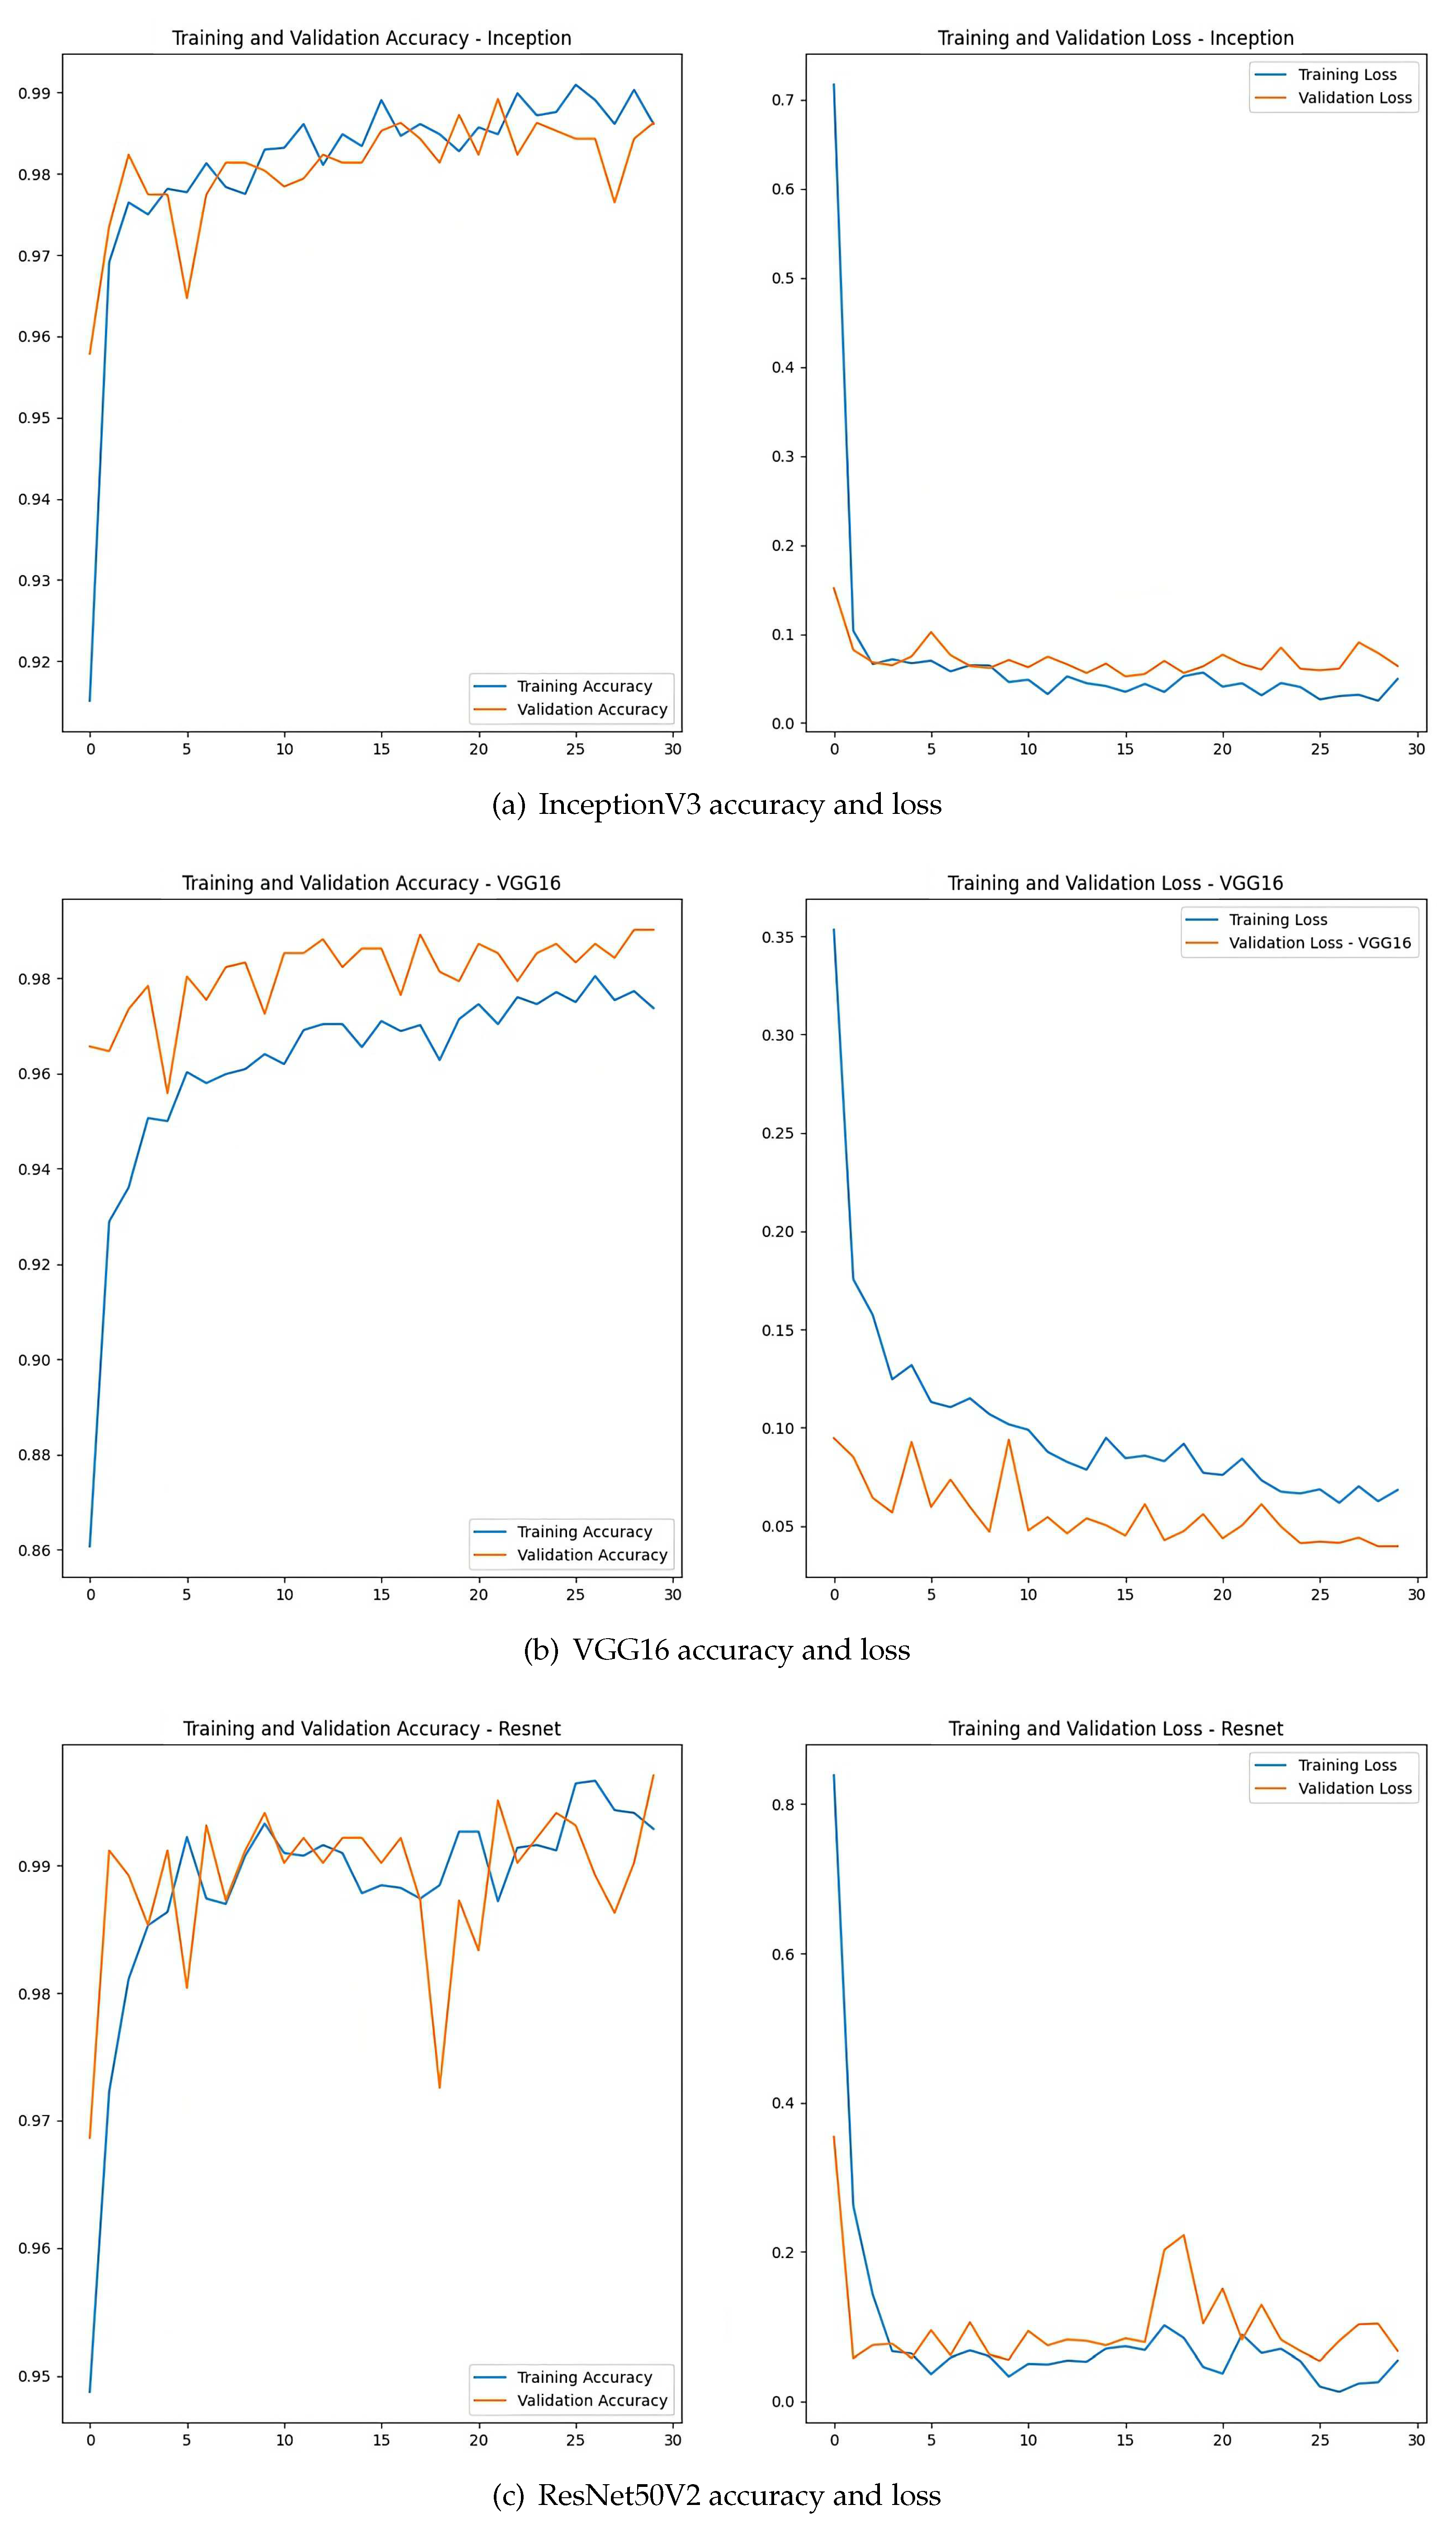
The parameters used in the training are: batch size of 32, ADAM optimizer, with learning rate of 0.001, beta 1 of 0.9 and beta 2 of 0.999, training each CNN with 30 epochs with a total of 10 trainings and taking into account loss of categorical crossentropy and accuracy metrics. A summary of all the parameters used is shown in
Table 2.
An example (arbitrarily chosen) of the resulting training plots for each architecture, respectively, is shown in
Figure 6.
3.5. CNN Test and Evaluation Metrics
3.5.1. CNN Test
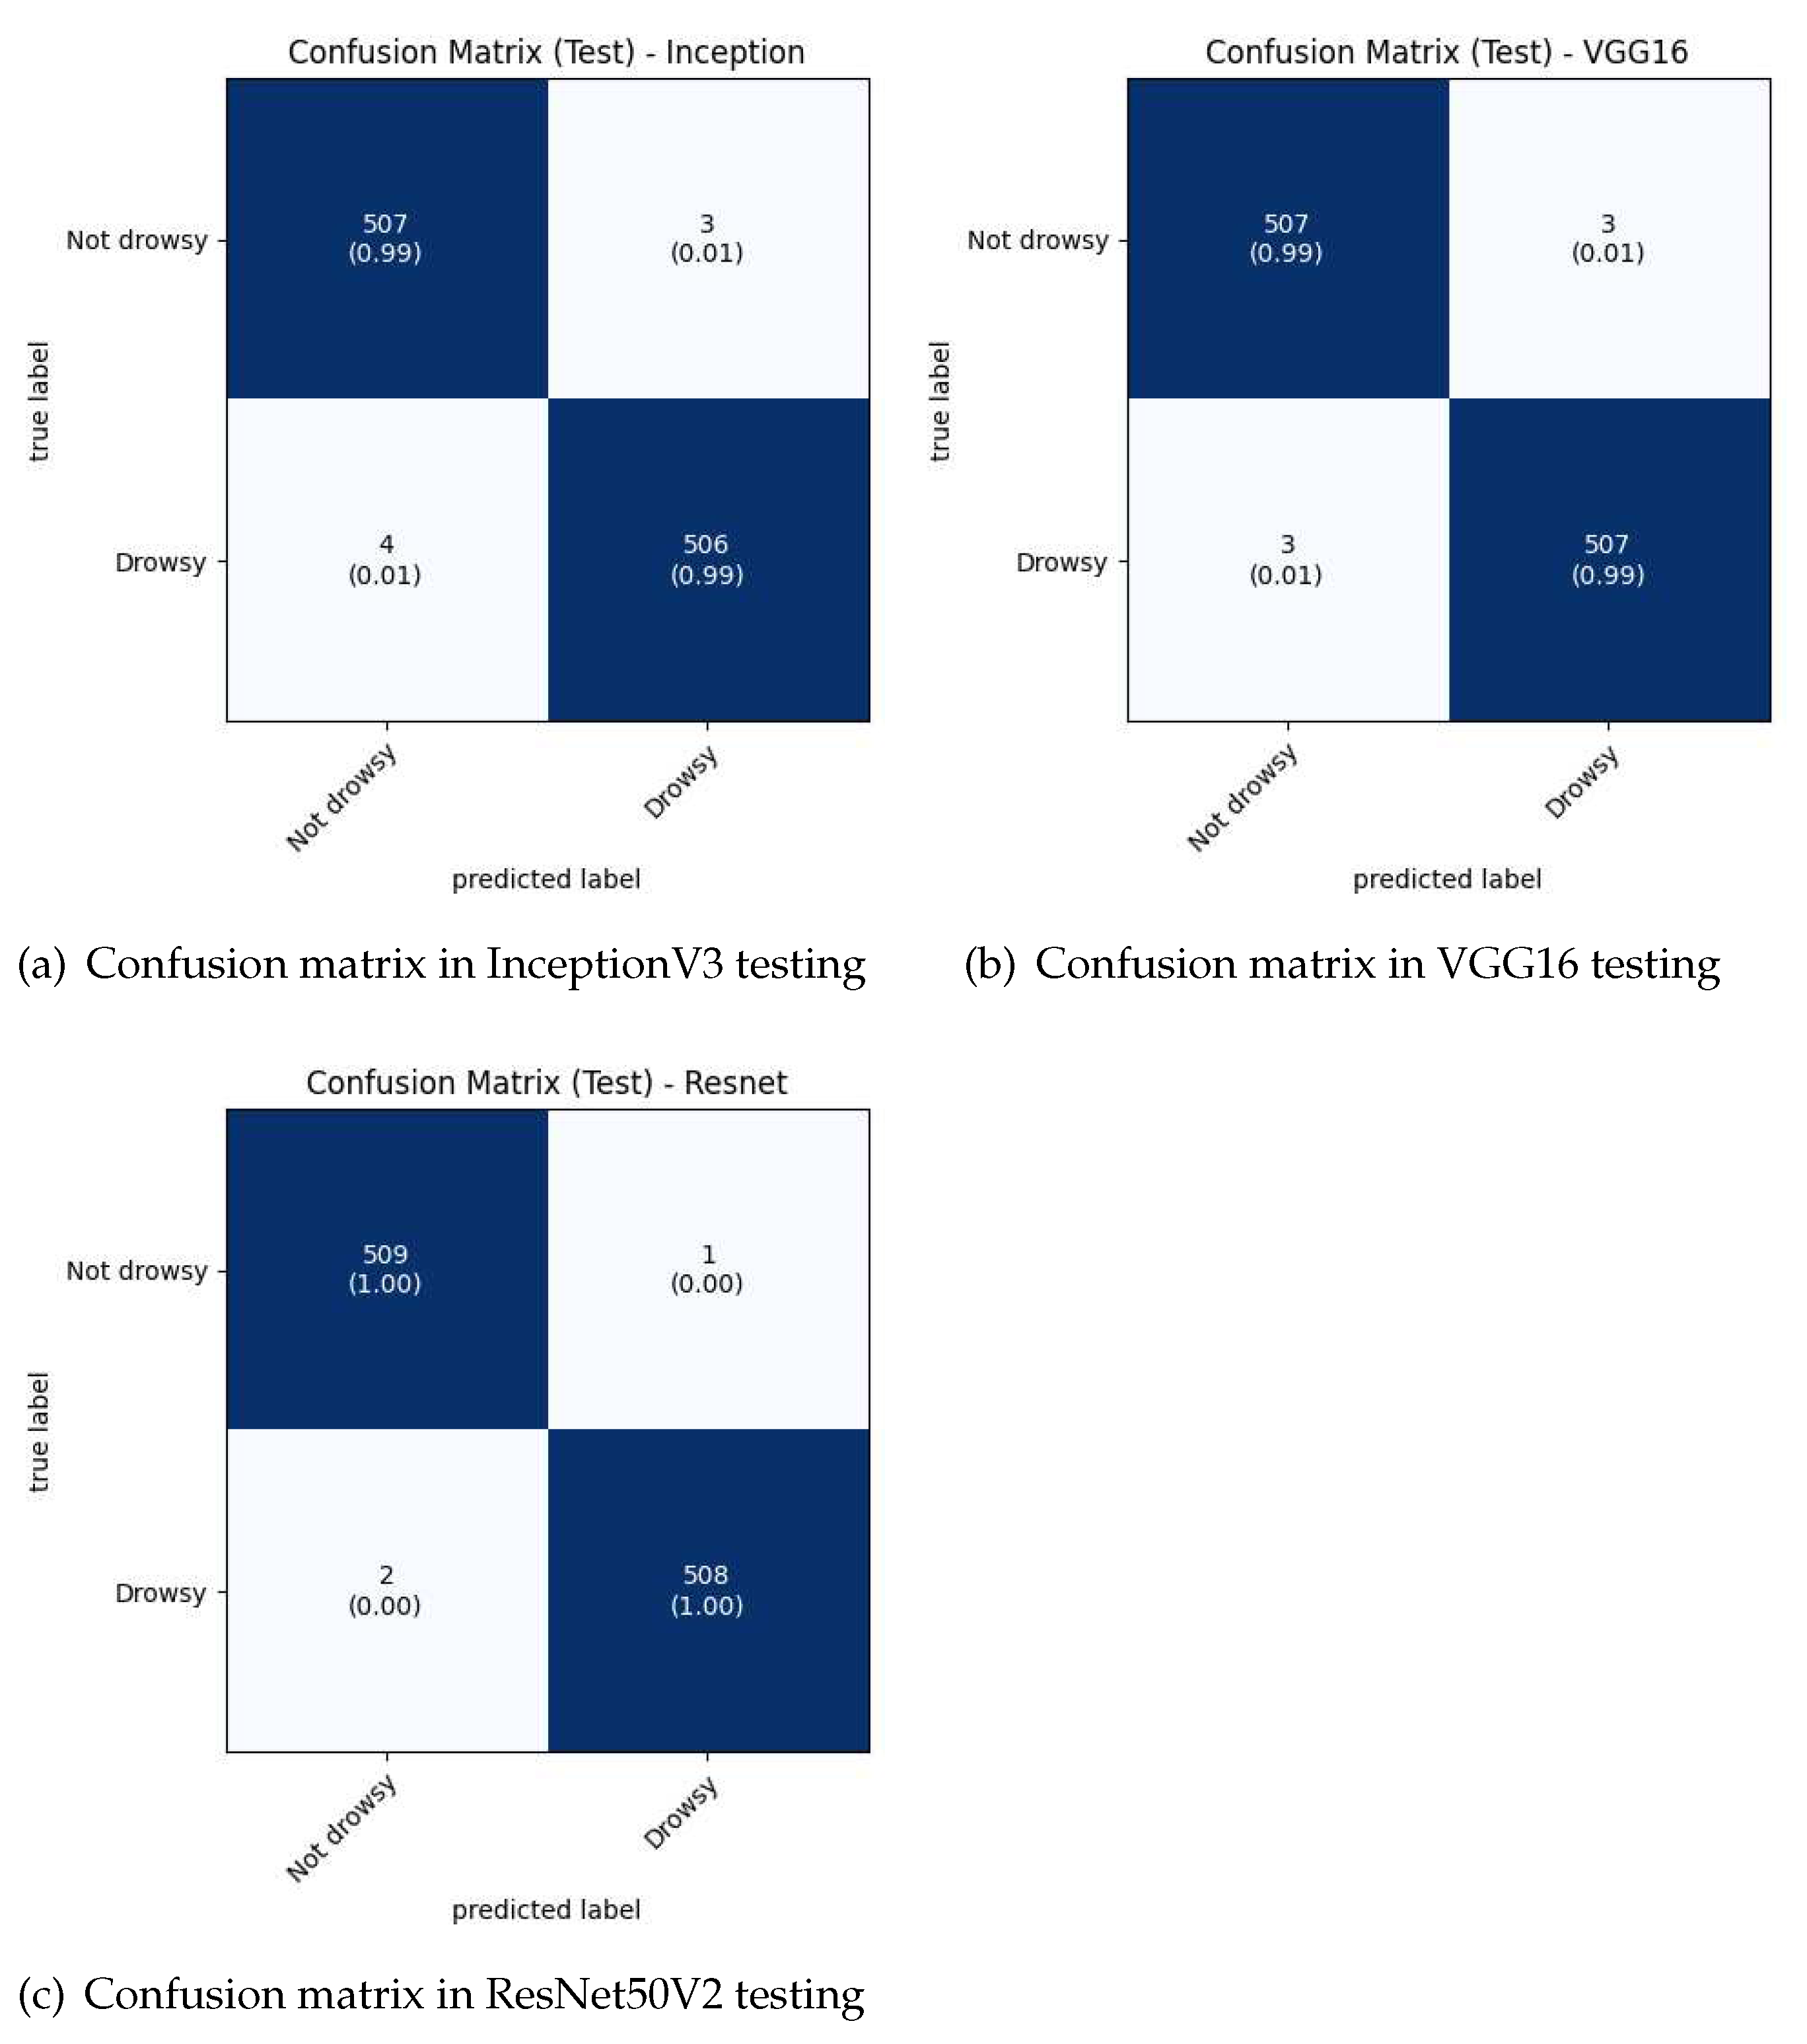
After training the CNNs, it is necessary to do the tests with the Test data. Where the processing of the images of the set (without data augmentation) is also performed. A batch size of 1 was used to analyze each image, testing 10 times with each trained network. An example of the confusion matrices for each CNN Test is shown in
Figure 7.
3.5.2. Evaluation Metrics
By training the Train and Validation dataset, and testing the trained CNN models on the Test dataset, the confusion matrices were obtained. From these confusion matrices the evaluation metrics such as precision, recall, f1-score and accuracy that define the system behavior are calculated. Based on [
24] and considering TP as true positive, FP as false positive, TN as true negative and FN as false negative, the metrics used are:
3.6. Driver Drowsiness Detection
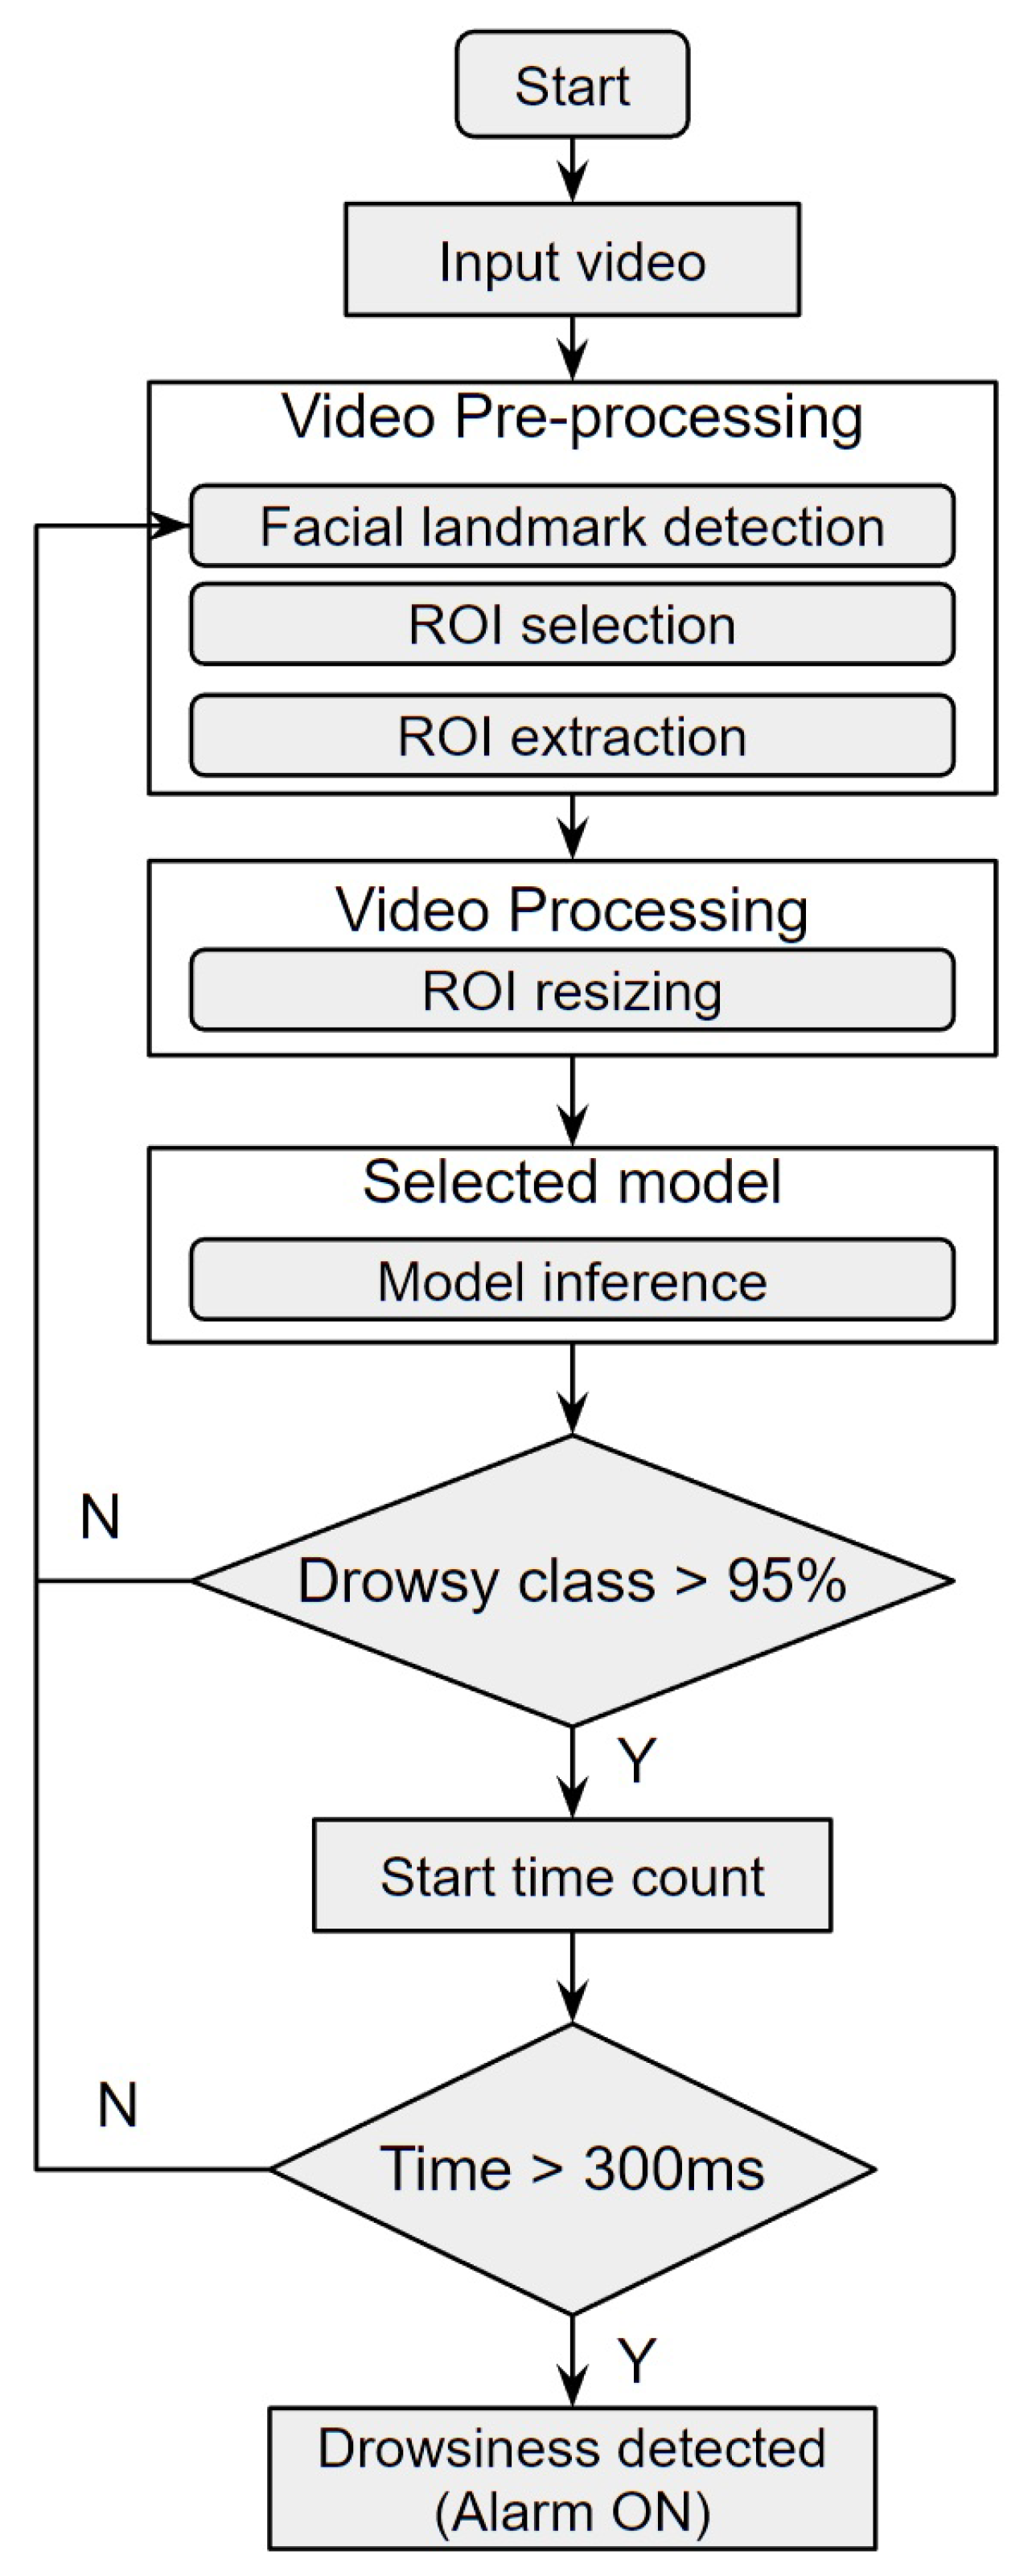
With the models trained and tested, it is finally appropriate to try out the best approach (accuracy) in a real environment. To determine driver drowsiness, first the model estimates if the probability of the ROI extraction belongs to the Drowsy class is higher than 95%. If so, it is necessary to count the time that the eyes remain closed, if it is more than 300ms, it is considered drowsiness and an audible alarm will be triggered. The flowchart of the driver drowsiness detection process in a real environment is show in
Figure 8.
4. Experimental Results
4.1. CNN Training
Using the equations
3,
4,
5 and
6, the metrics are calculated. In
Table 3, the averages of each metric and its standard deviation corresponding to the training of the CNNs, seen in
Section 3.4 CNN Training - Experiments of
Section 3 respectively, are presented.
As can be seen in
Table 3, during training the CNN based on ResNet50V2 obtains a higher accuracy with 99.89%±0.1% average, followed by InceptionV3 with 99.56%±0.1% average accuracy and finally the one based on VGG16 with 99.43%±0.1% average accuracy. In the case of drowsiness detection, an important metric is the Recall, because the goal is to reduce as much as possible the false negatives of the Drowsy class. Thus, the CNN based on ResNet50V2 obtained the best average Recall with 99.82%±0.2%.
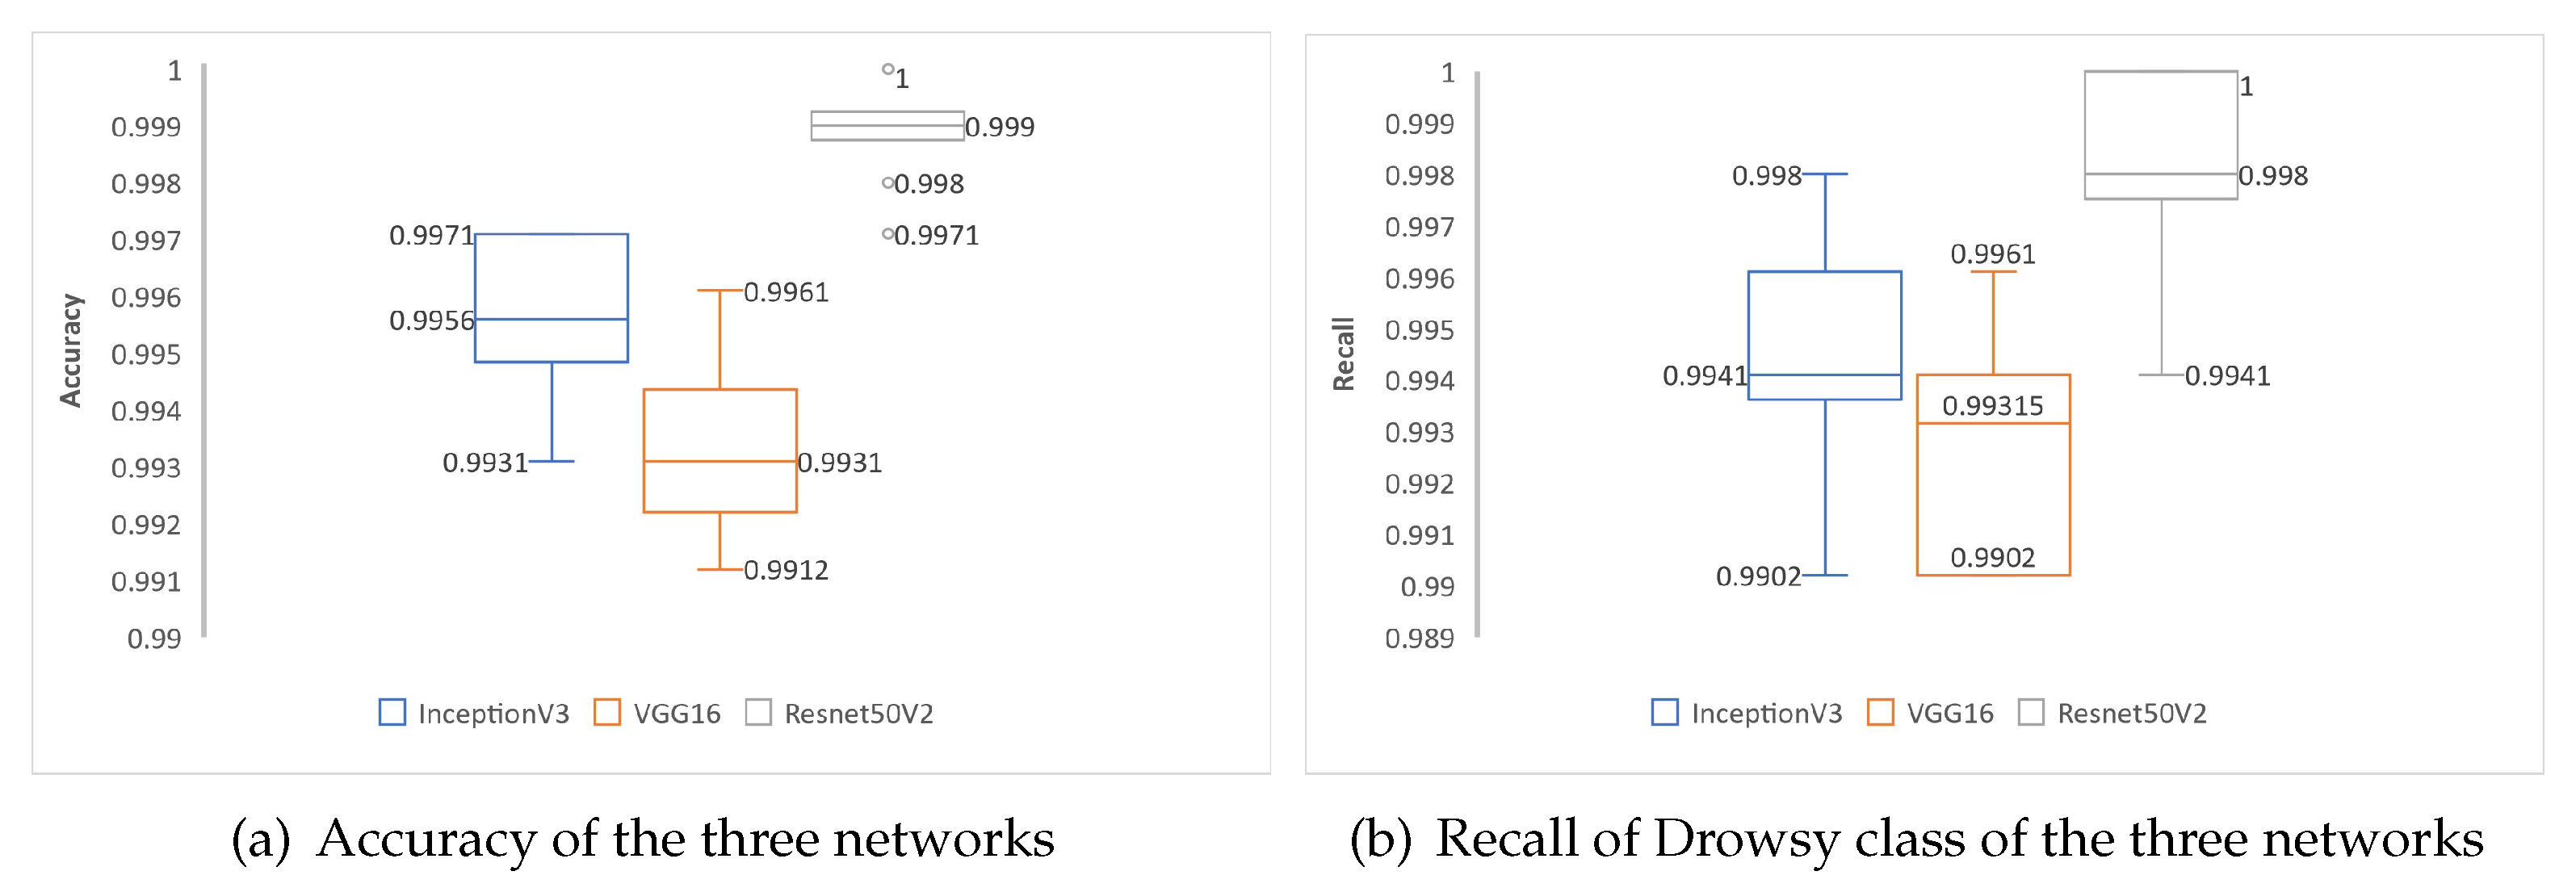
Figure 9 presents the comparative boxplot for the performance of the CNNs in the training phase, where the performance variations of
Table 3 in the accuracy and recall metrics of the Drowsy class of each of the three networks in 10 training samples can be observed. In
Figure 9a, the CNN based on ResNet50V2 presents a better performance in data validation with a median of 99.9% of the 10 training runs. Similarly, in
Figure 9b, the ResNet50V2-based CNN has the best Recall performance of the Drowsy class with a median of 99.8%, thus minimizing the false negatives of the Drowsy class.
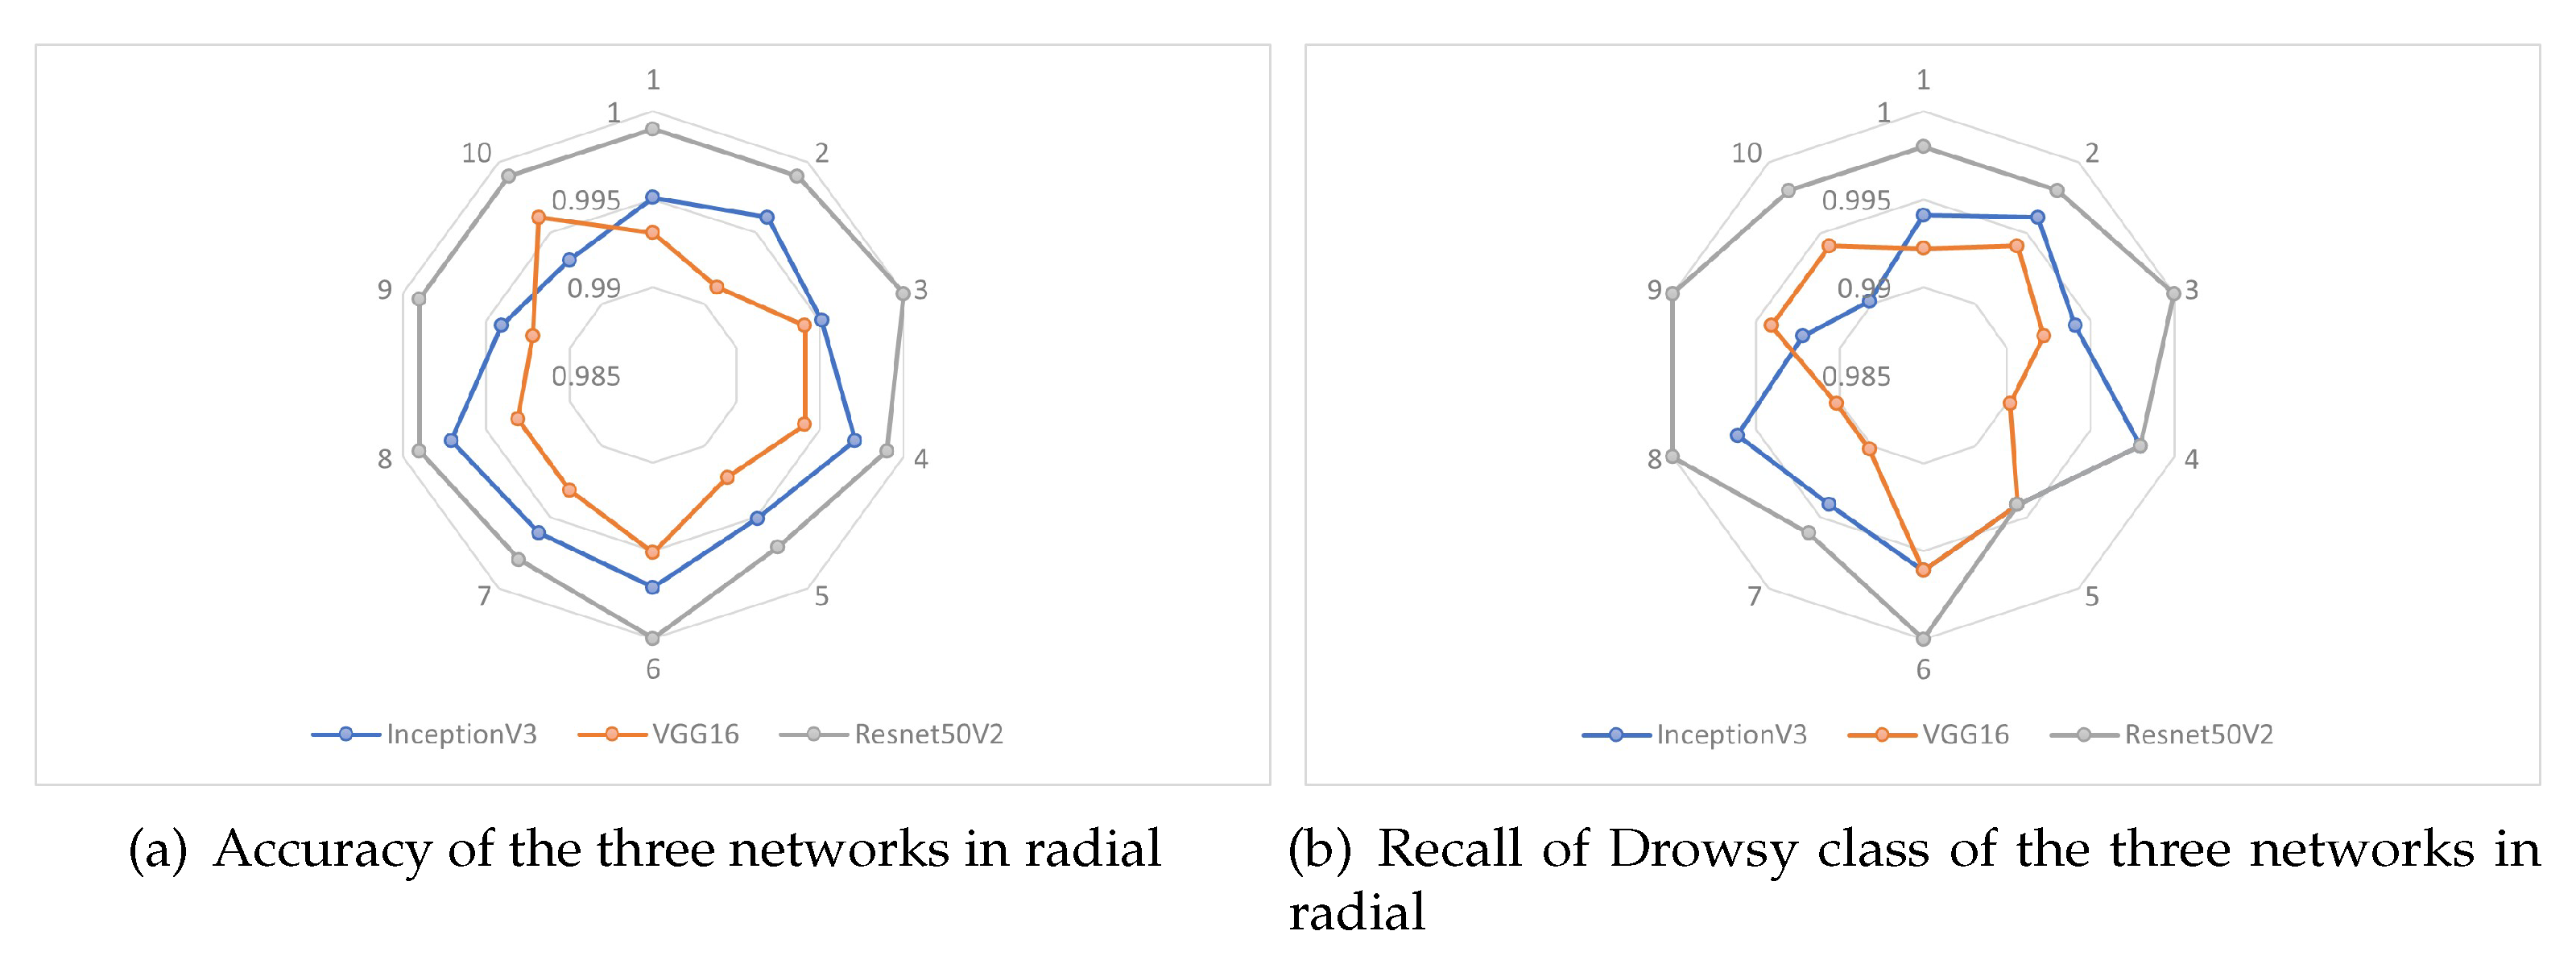
Figure 10 shows the radial behavior of the three CNNs, for the two metrics of the 10 trainings (experiments) performed. Where in
Figure 10a, the CNN based on ResNet50V2 has an almost constant behavior in the 10 experiments, on the other hand the network based on VGG16 has a lower behavior compared to the other two networks, presenting as maximum an accuracy of 99.61% in the last (10) experiment, and a minimum accuracy of 99.12% in the second experiment. While in
Figure 10b, the CNN based on RedNest50V2 also presents a better performance compared to the other 2 networks, in the fifth experiment of this network, a 99.41% of recall in the Drowsy class was obtained, being the minimum value obtained, and likewise the CNN based on VGG16 presents a lower performance in recall of the Drowsy class.
4.2. CNN testing evaluation
When testing the CNNs, it is observed from the evaluation metrics presented in
Table 4, that the CNN based on ResNet50V2 obtains the highest accuracy with 99.71%±0.1% average, followed by VGG16 with 99.39%±0.2% average. At the same time, the ResNet50V2-based CNN has the highest Recall with 99.47%±0.2% average for the Drowsy class.
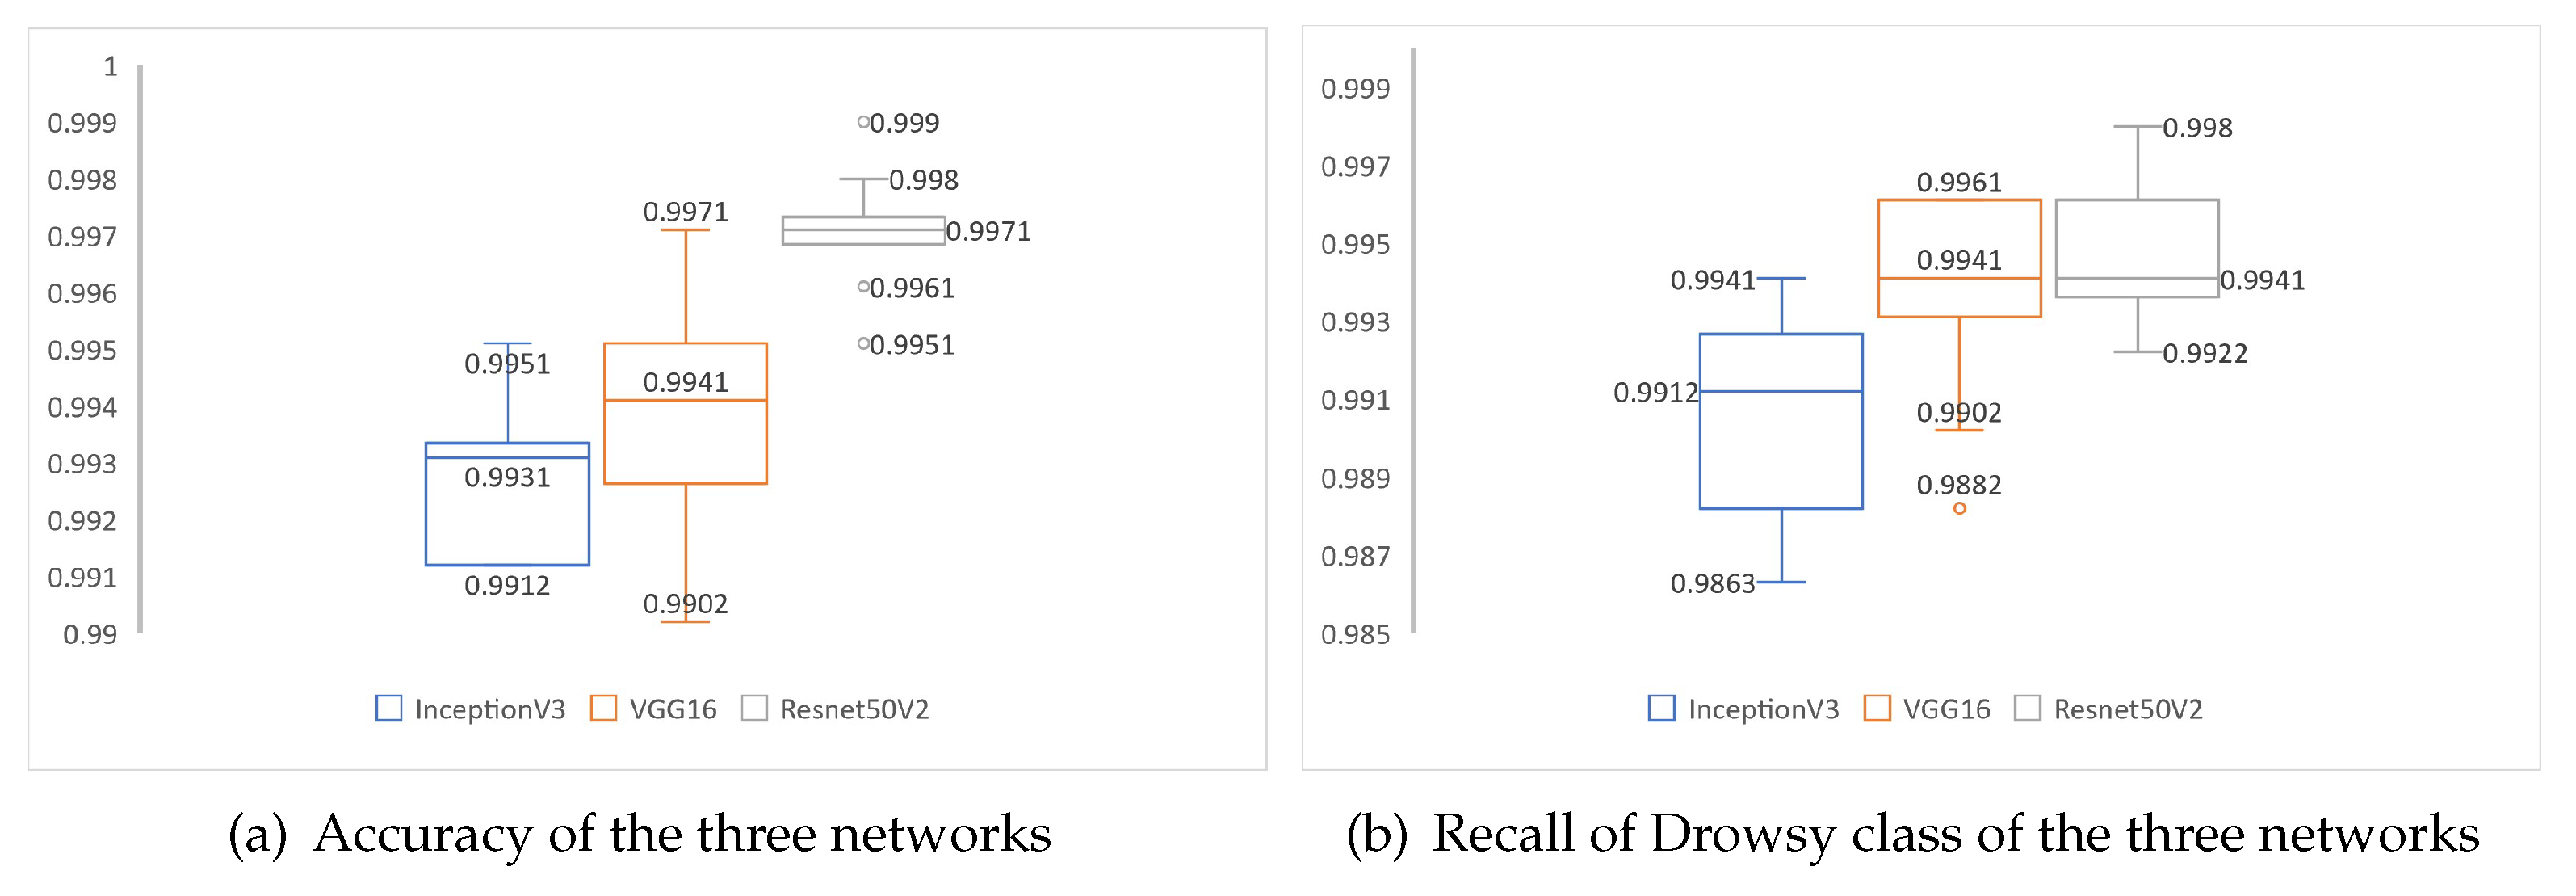
The overall Accuracy and Recall of the Drowsy class of 10 experiments for each of the three networks is presented in
Figure 11. Where, in
Figure 11a, it is observed that the ResNet50V2-based network has the best performance with a median of 99.71% of accuracy. While in
Figure 11b it can be seen that, VGG16 based network and ResNet50V2 based network have the same value in median with a
99.41% of
recall in class
Drowsy. It can also be observed that, the network based on VGG16 presents an optimal performance compared to the training results presented in
Figure 9
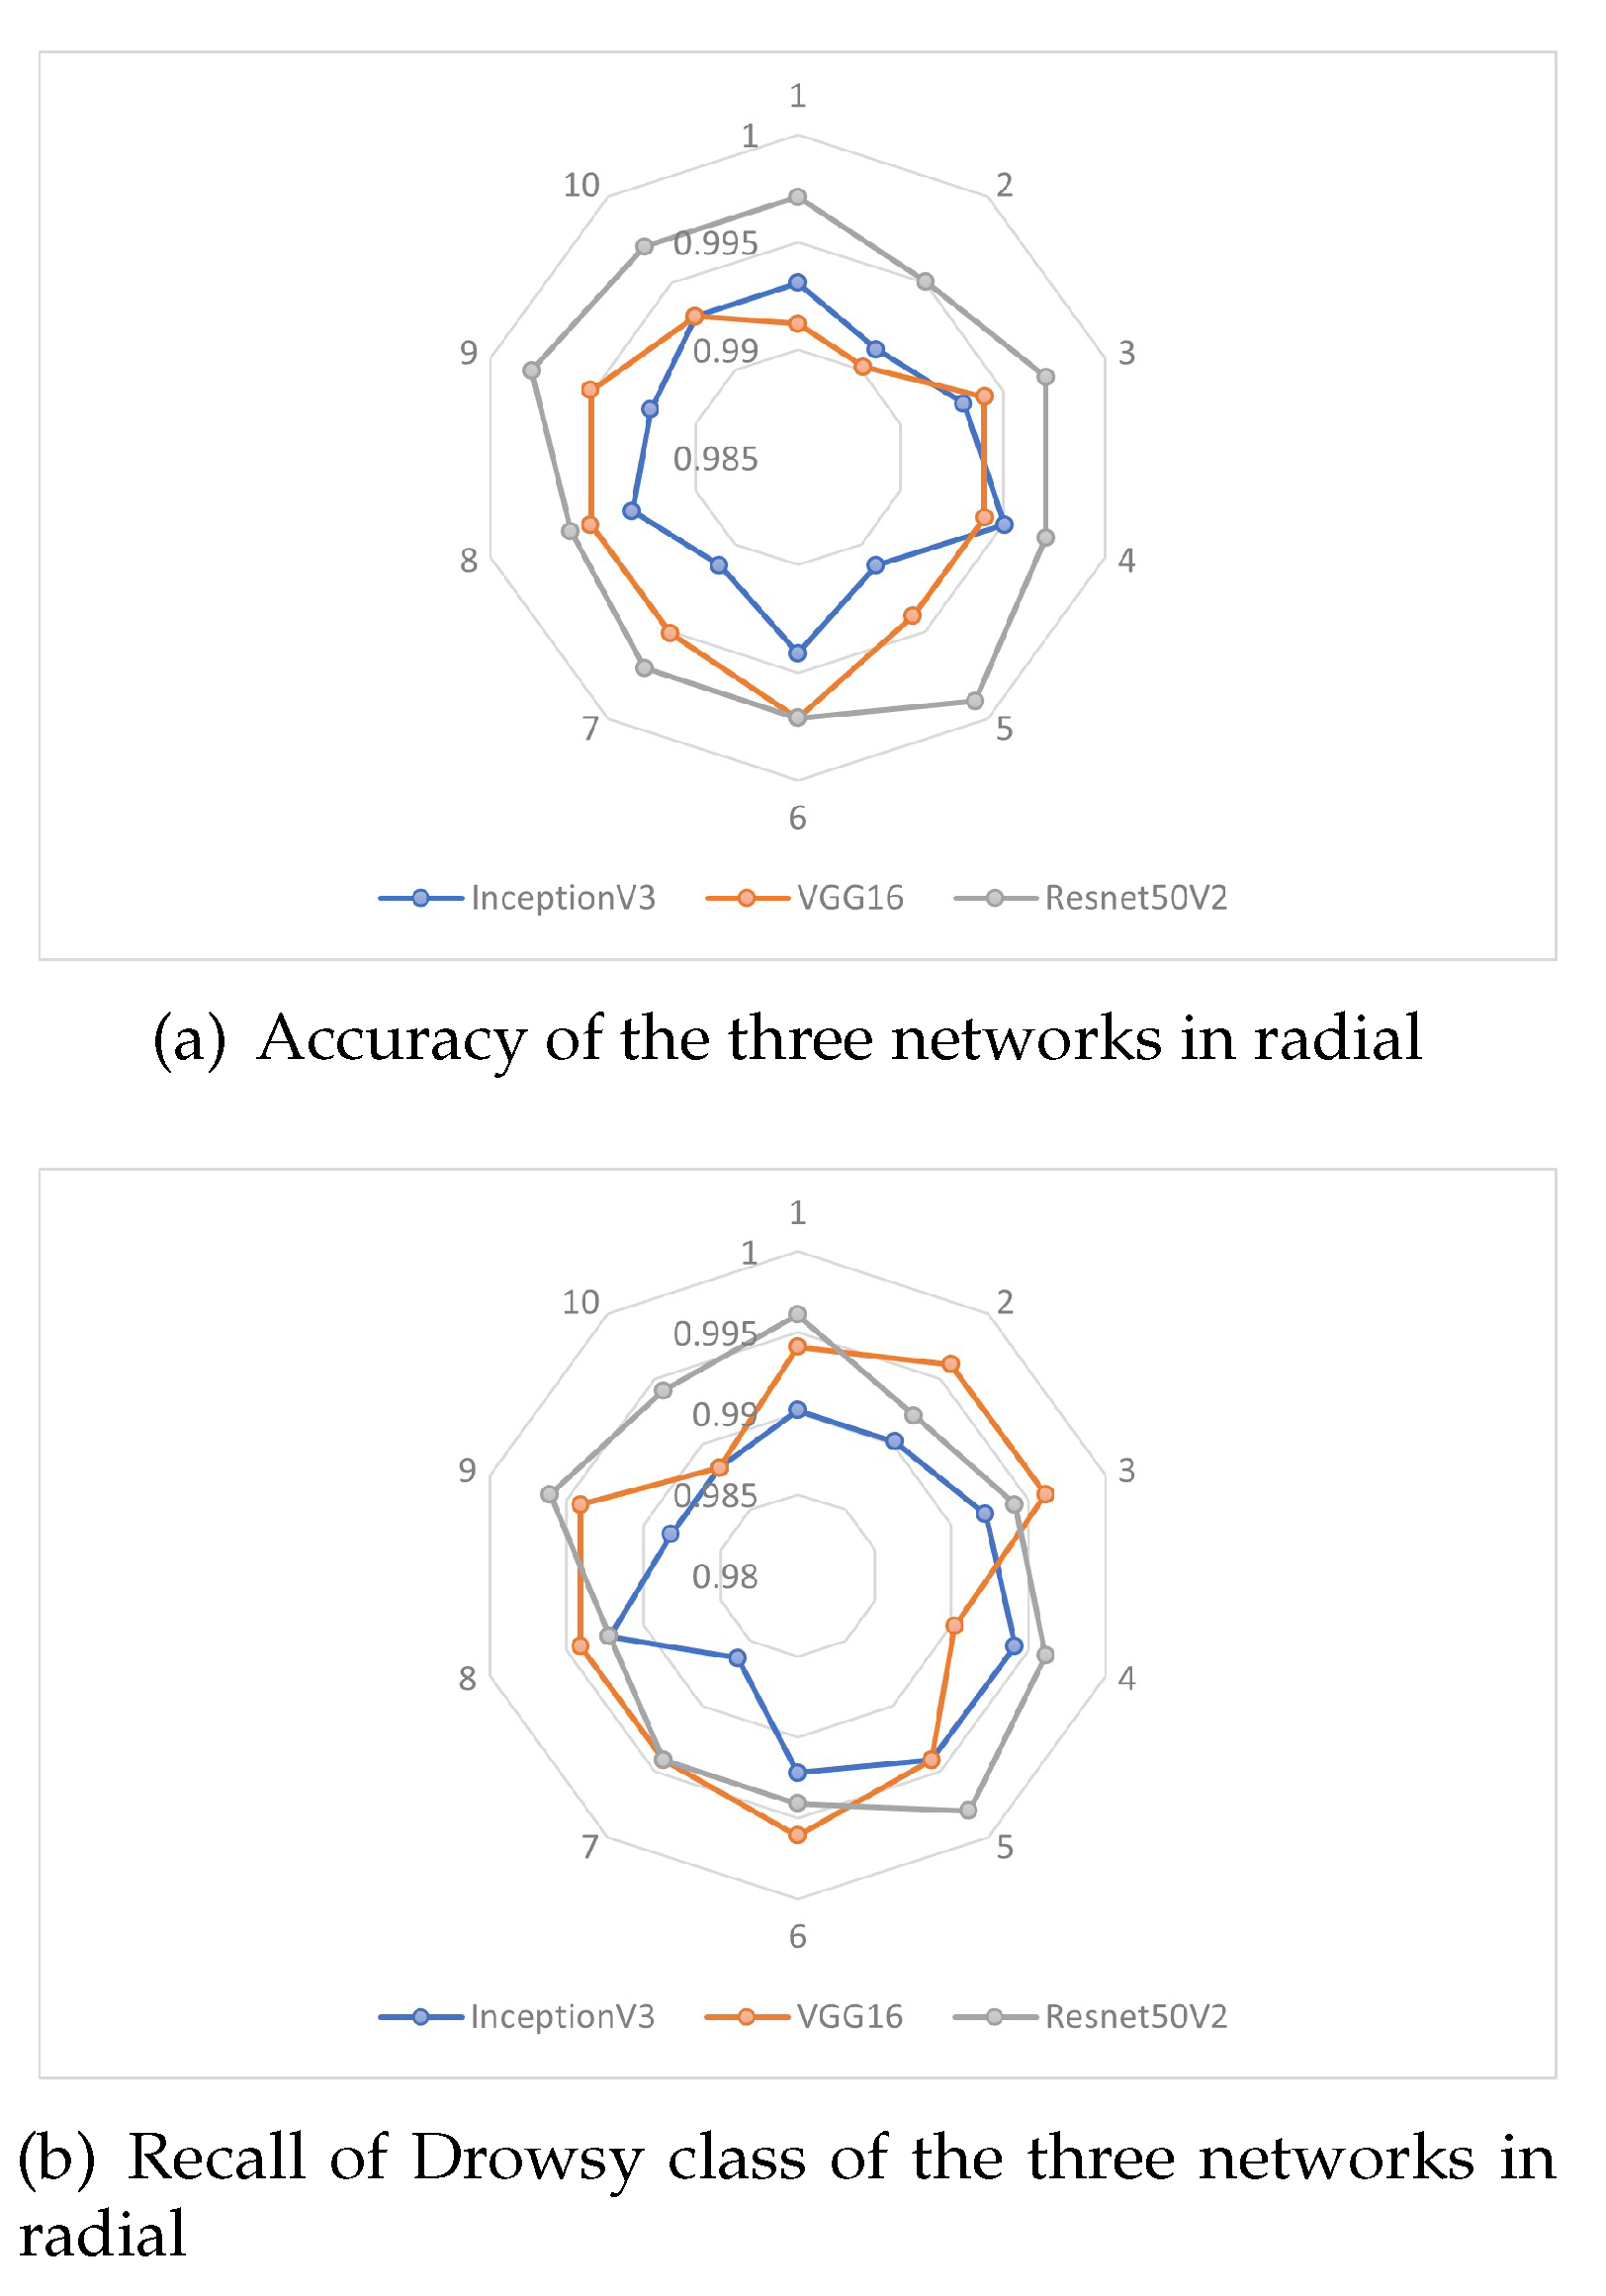
The radial behavior of the 10 test experiments are shown in
Figure 12, showing the two evaluation metrics of overall accuracy and recall of the Drowsy class. Where, in
Figure 12a, it is observed that the ResNet50V2 based network performs better than the other two networks, whereas, in
Figure 12b it is observed that the ResNet50V2 and VGG16 based networks perform almost similar in the results of the 10 experiments. Thus, the performance of the VGG16-based network is significantly improved compared to the training results presented in
Figure 10.
4.3. CNN Visual Result
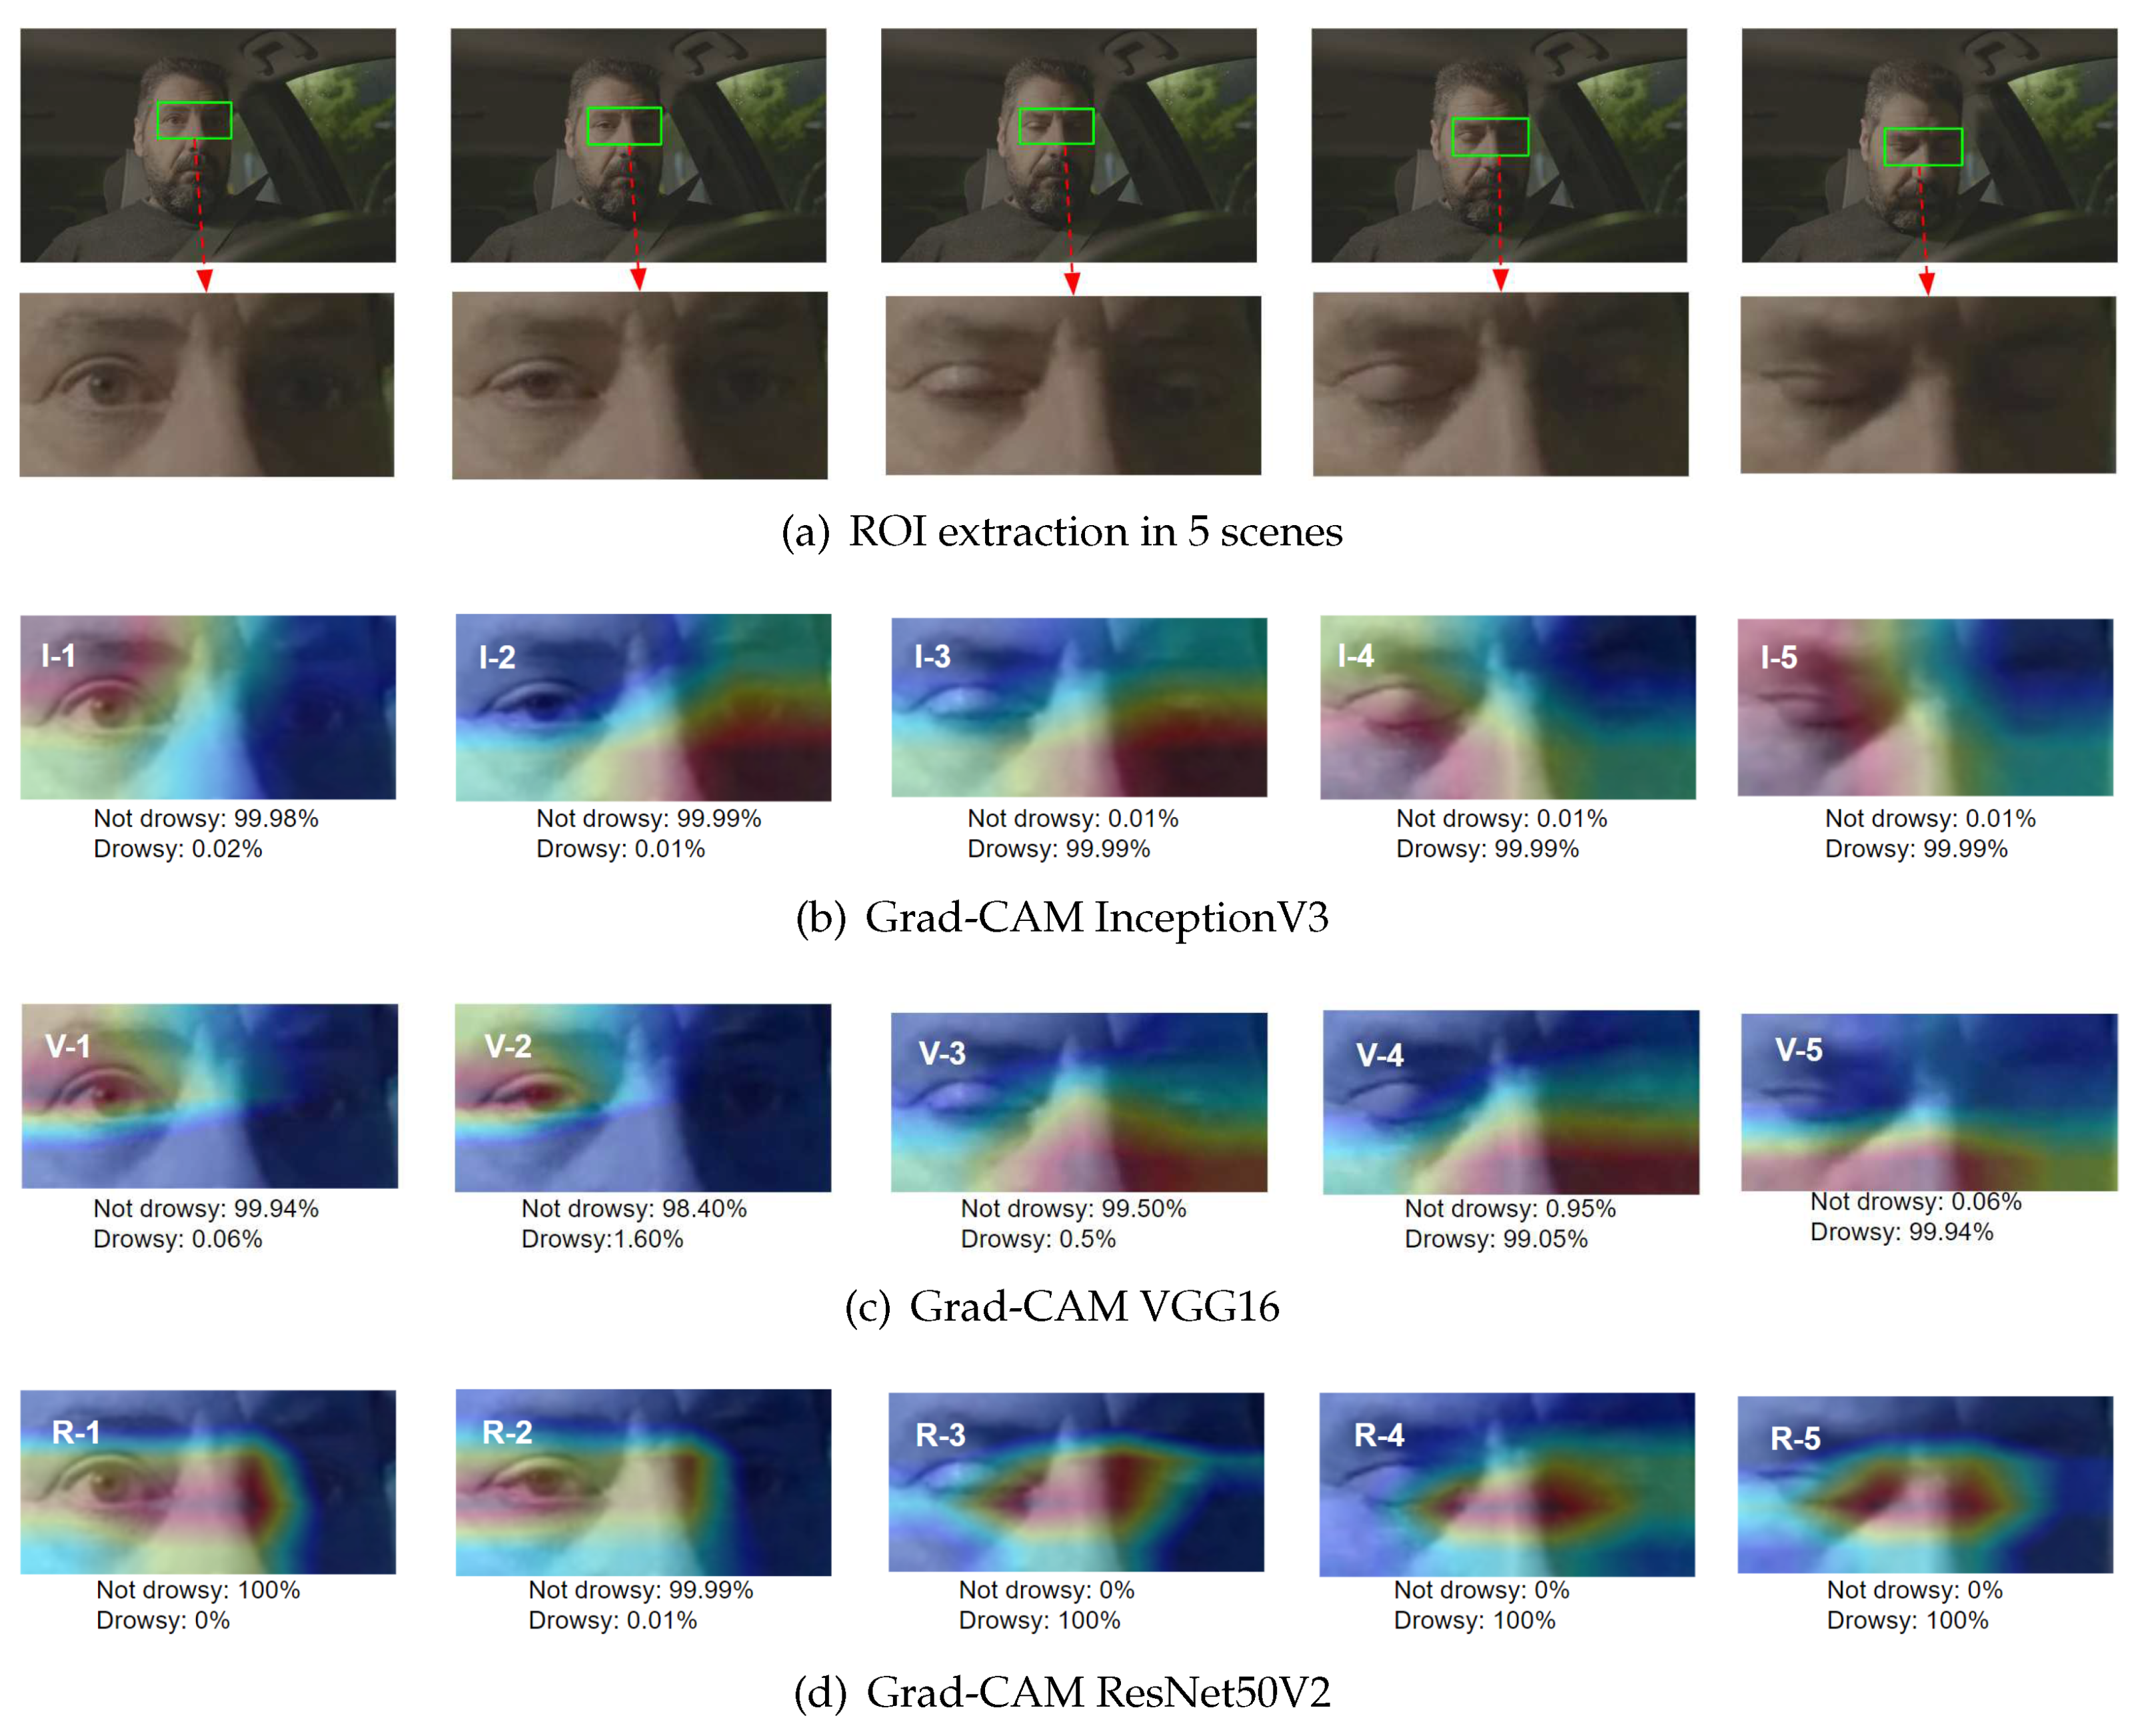
To compare the behavior of the CNN architectures in the drowsiness detection and classification process, the best test results for each of the CNNs were considered, taking into account the highest Accuracy and highest Recall of the Drowsy class. Based on
Figure 12, for the InceptionV3-based CNN the fourth experiment with 99.51% accuracy and 99.41% recall is considered; for the VGG16-based CNN the sixth experiment with 99.71% accuracy and 99.61% recall is considered and for the ResNet50V2-based CNN the fifth experiment with 99.9% accuracy and 99.8% recall is considered.
For a better understanding of the behavior, the Gradient-weighted Class Activation Mapping (Grad-CAM) [
25,
26] method is used. Using Grad-CAM it is possible to visualize the regions that are important for detection, this method seeks to identify parts of the image that guide the CNN to make the final decision for class determination. The method involves generating a heat map representing the ROI regions with the highest relevance for classification of the received input image.
Figure 13 shows five examples of different scenarios for visualization of the heat maps with Grad-CAM, in scenarios 1 and 2 the driver is in a normal state, i.e. no drowsiness, in scenario 3 the driver is in a wakeful state which is the transition to drowsiness and in scenarios 4 and 5 the driver is drowsy. In each heat map the red color represents the regions of highest importance for the prediction of each of the three trained CNNs and the blue color represents the regions of lowest importance. The five examples were tested for each CNN, generating ROIs I-1 to I-5 corresponding to the outputs of the InceptionV3-based CNN, V-1 to V-5 corresponding to the VGG16-based CNN and R-1 to R-5 corresponding to the ResNet50V2-based CNN. In ROIs I-1 to I-5, it is observed that the heat maps focus on the right eye (I-1), lower left eye and nose (I-2 and I-3), lower right eye (I-4) and the whole right eye (I-5). While the heat maps of ROIs V-1 to V-5 have a focus on, V-1 and V-2 on the right eye, V-3 and V-4 on the left nose and cheek and V-5 on the right nose and cheek. In ROIs R-1 to R-5, it is observed that in R-1 and R-2 the heat map is on the right eye and part of the nose, in R-3, R-4 and R-5 it is focused between both eyes. Below each ROI Grad-CAM display is shown its respective percentage prediction for drowsiness and non-drowsiness. Considering the example scenarios and the respective classification, it can be stated that the ResNet50V2-based CNN presents a higher focus on the eyes for better drowsiness detection.
4.4. CNN Processing Results
Other results of the training of the CNNs used are the file size, the total number of parameters of each network and the training time, where the first two are constant, while the last one can vary in each training performed (10 experiments) for each of the three networks. While for testing the behavior of the CNNs, the response time of each architecture is obtained in the 10 experiments performed. These results can be seen in
Table 5.
4.5. Driver Drowsiness Detection Results
Considering from the results, the CNN based on ResNet50V2 is the most optimal in this research, therefore, it is appropriate to perform the driver drowsiness detection. In
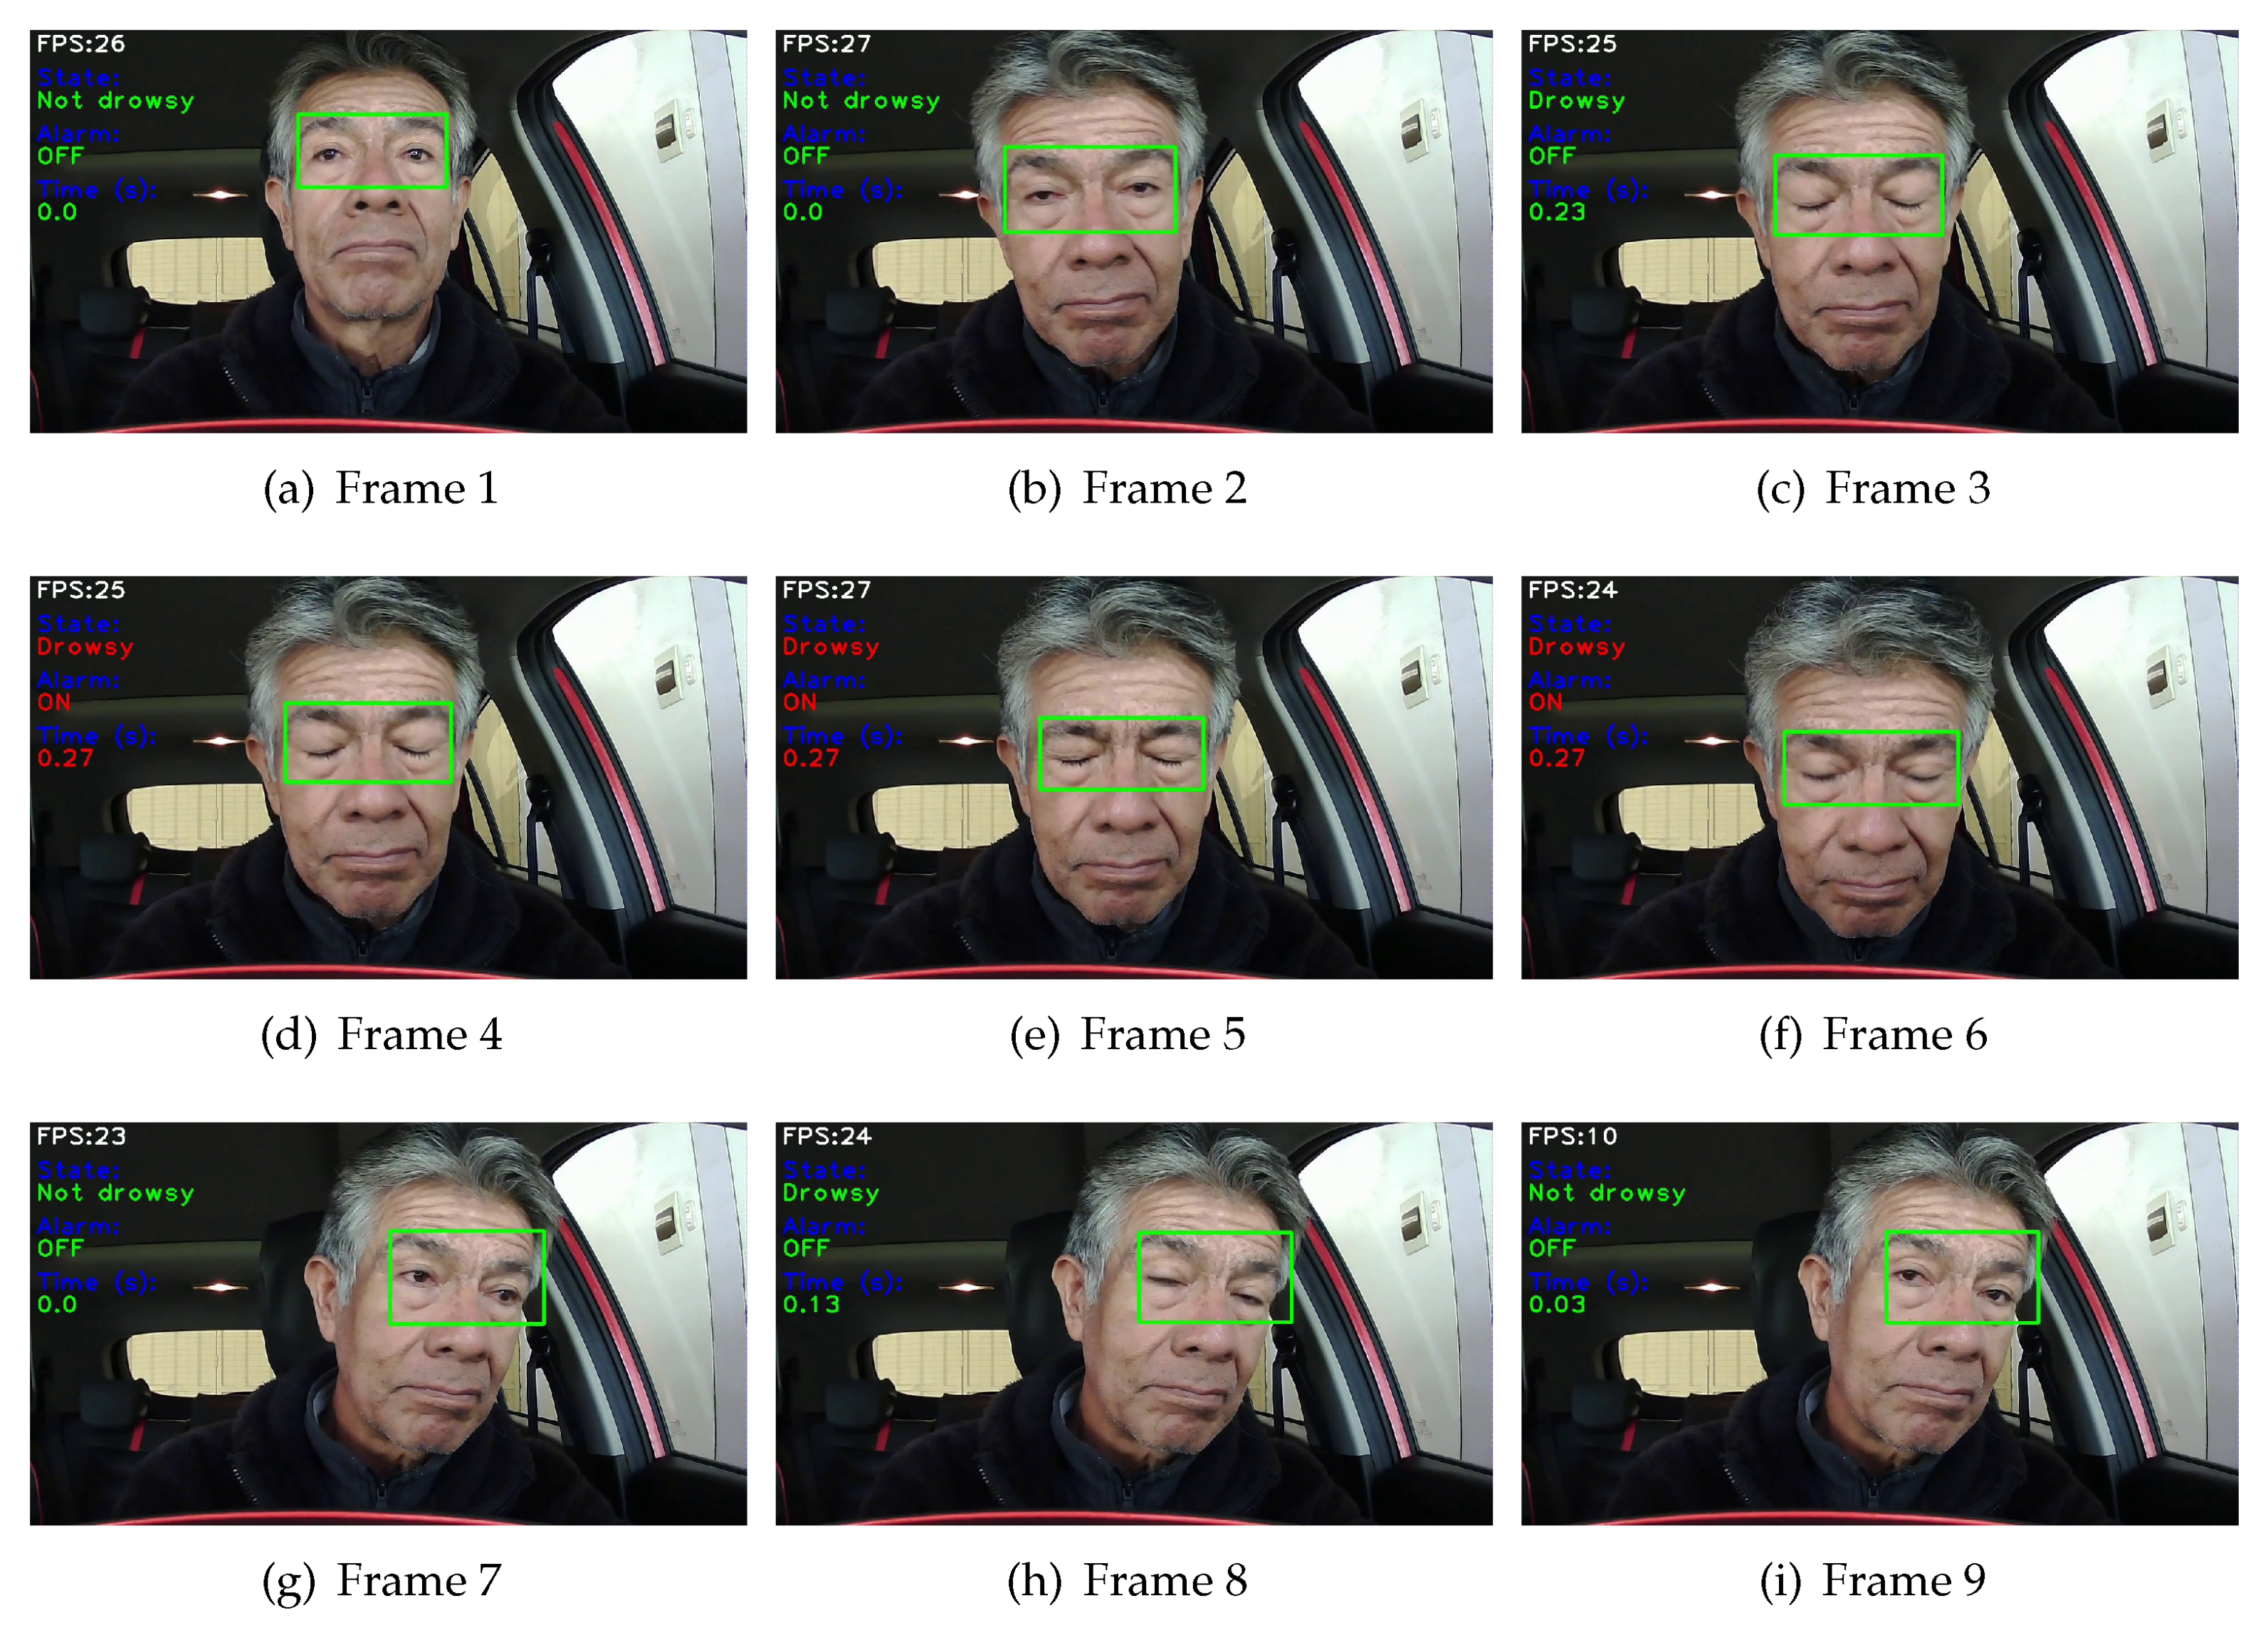
Figure 14 nine consecutives scenes analyses are shown, being a sequence of the process with drowsiness. In the examples it is observed that, the driver starts in a normal state (
Figure 14a), then goes into a state of wakefulness (
Figure 14b), closing his eyes with a time of approximately 230ms (
Figure 14c), then the driver goes to the drowsy state which time is longer than 300ms, activating the alarm as can be observed (
Figure 14d–f). This is followed by a normal blink (
Figure 14g–i). Specifically in
Figure 14h, it can be seen that the system detects the closed eyes with the Drowsy class, but the time is approximately 130ms, which does not detect it as drowsiness.
4.6. Results Comparison
For comparison purposes, the
Table 6 presents results achieved and results by other authors. The dataset used, the facial landmark method, the ROI used, the response time or delay and the overall accuracy of the tested CNNs are described. It is observed that the three modified architectures achieve a higher accuracy compared to the results of other authors. Being the ResNet50V2-based CNN the one that obtained a better performance.
5. Conclusion and Future Works
This study presents an approach for drowsiness detection, where an enhancement method is proposed in the area surrounding the eyes to perform region of interest (ROI) extraction. Likewise, three CNNs are used as a basis: InceptionV3, VGG16 and ResNet50V2 and a modification in the architecture of the fully connected network used in the classification process is proposed.
For the experiments, a database was created from NITYMED videos. The results are obtained from 10 experiments performed and show an exceptionally high accuracy in drowsiness detection using the architectures based on the three CNNs mentioned above, with values of 99.31%, 99.41% and 99.71%, respectively. The responses times used for drowsiness detection by each CNNs were shown to be relatively equivalent, with the VGG16-based CNN showing a small advantage.
In addition, the Grad-CAM visual technique was used to analyze the behavior of each CNN, where the ResNet50V2-based CNN predominantly focuses on the eye region achieving better performance in drowsiness detection. These results suggest that the proposed approach may be a good alternative to be considered for the implementation of the drowsiness detection system. Among the CNNs used, the ResNet50V2-based CNN presented the best performance, and considering the results of the examples in different scenarios (
Figure 13), this architecture also presents higher robustness. When comparing the execution time for detection of this CNN with the other two CNNs (
Table 5), it can be considered acceptable. Also, when compared to other CNNs from related literature it presents a relative performance advantage as seen in
Table 6.
When implemented, the system based on this proposal can be considered a valuable tool for the prevention of automobile accidents caused by driver drowsiness. This study is important because it addresses a critical need in road safety and human health that can jeopardize the safety of drivers and other road users. Therefore, early detection of drowsiness may be essential to avoid accidents.
When the system based on this proposal is implemented, it can be considered a valuable tool for the prevention of automobile accidents caused by driver drowsiness. This study is important because it addresses a critical need in road safety and human health that can jeopardize the safety of drivers and other road users. Therefore, early detection of drowsiness may be essential to avoid accidents.
As future work, it is intended to make use of near infrared (NIR) imaging to better focus on the eye region when there are illumination limitations. As a complement to this work, yawning detection can also be performed for preventive identification of drowsiness. And finally, the authors intend to implement it in an embedded system adapted to vehicular units.
Supplementary Materials
The following supporting information can be downloaded at the website of this paper posted on Preprints.org, Video S1: prueba-1.mp4. Video S2: prueba-2.avi.
Author Contributions
Conceptualization, methodology and software, R.F. and F.P.; validation and formal analysis, R.F., F.P., T.H. and A.A.; resources, F.P., R.C. and J.H.; data curation, R.F.; writing—original draft preparation, R.F. and F.P.; writing—review and editing, T.P. and A.A.; supervision, A.A. and F.P.; project administration, F.P.; funding acquisition, F.P., R.C. and J.H. All authors have read and agreed to the published version of the manuscript.
Funding
This research received no external funding.
Acknowledgments
The research was supported by the Institutional laboratory for research, entrepreneurship and innovation in automatic control systems, automation and robotics (LIECAR) of the University of San Antonio Abad del Cusco UNSAAC.
Conflicts of Interest
The authors declare no conflict of interest.
References
- PAHO. Road safety. 2022. Available online: https://www.paho.org/en/topics/road-safety (accessed on 9 February 2023).
- Gestión. Some 265 people died each month of 2022 in traffic accidents in Peru (Spanish). 2022. Available online: https://gestion.pe/peru/unas-265-personas-murieron-cada-mes-del-2022-en-accidentes-de-transito-en-peru-noticia/ (accessed on 9 February 2023).
- ONSV. Road accident report and actions to promote road safety (Spanish). 2022. Available online: https://www.onsv.gob.pe/post/informe-de-siniestralidad-vial-y-las-acciones-para-promover-la-seguridad-vial/ (accessed on 9 February 2023).
- Albadawi, Y.; Takruri, M.; Awad, M. A Review of Recent Developments in Driver Drowsiness Detection Systems. Sensors 2022, 22. [Google Scholar] [CrossRef] [PubMed]
- Szegedy, C.; Vanhoucke, V.; Ioffe, S.; Shlens, J.; Wojna, Z. Rethinking the inception architecture for computer vision. In Proceedings of the IEEE conference on computer vision and pattern recognition; 2016; pp. 2818–2826. [Google Scholar]
- Simonyan, K.; Zisserman, A. Very deep convolutional networks for large-scale image recognition. arXiv 2014, arXiv:1409.1556. [Google Scholar]
- He, K.; Zhang, X.; Ren, S.; Sun, J. Identity mappings in deep residual networks. In Computer Vision–ECCV 2016: 14th European Conference, Amsterdam, The Netherlands, October 11–14, 2016, Proceedings, Part IV 14; Springer, 11 October 2016; pp. 630–645. [Google Scholar]
- Torrey, L.; Shavlik, J. Transfer learning. In Handbook of research on machine learning applications and trends: algorithms, methods, and techniques; IGI global, 2010; pp. 242–264. [Google Scholar]
- Lugaresi, C.; Tang, J.; Nash, H.; McClanahan, C.; Uboweja, E.; Hays, M.; Zhang, F.; Chang, C.L.; Yong, M.G.; Lee, J. ; others. Mediapipe: A framework for building perception pipelines. arXiv 2019, arXiv:1906.08172. [Google Scholar]
- Kwon, K.A.; Shipley, R.J.; Edirisinghe, M.; Ezra, D.G.; Rose, G.; Best, S.M.; Cameron, R.E. High-speed camera characterization of voluntary eye blinking kinematics. Journal of the Royal Society Interface 2013, 10, 20130227. [Google Scholar] [CrossRef] [PubMed]
- Park, S.; Pan, F.; Kang, S.; Yoo, C.D. Driver drowsiness detection system based on feature representation learning using various deep networks. In Computer Vision–ACCV 2016 Workshops: ACCV 2016 International Workshops, Taipei, Taiwan, November 20-24, 2016, Revised Selected Papers, Part III; Springer, 20 November 2017; pp. 154–164. [Google Scholar]
- Chirra, V.R.R.; Uyyala, S.R.; Kolli, V.K.K. Deep CNN: A Machine Learning Approach for Driver Drowsiness Detection Based on Eye State. Rev. d’Intelligence Artif. 2019, 33, 461–466. [Google Scholar] [CrossRef]
- Zhao, Z.; Zhou, N.; Zhang, L.; Yan, H.; Xu, Y.; Zhang, Z. Driver fatigue detection based on convolutional neural networks using EM-CNN. Computational intelligence and neuroscience 2020, 2020. [Google Scholar] [CrossRef] [PubMed]
- Phan, A.C.; Nguyen, N.H.Q.; Trieu, T.N.; Phan, T.C. An Efficient Approach for Detecting Driver Drowsiness Based on Deep Learning. Applied Sciences 2021, 11. [Google Scholar] [CrossRef]
- Rajkar, A.; Kulkarni, N.; Raut, A. Driver drowsiness detection using deep learning. In Applied Information Processing Systems: Proceedings of ICCET 2021; Springer, 2022; pp. 73–82. [Google Scholar]
- Hashemi, M.; Mirrashid, A.; Beheshti Shirazi, A. Driver safety development: Real-time driver drowsiness detection system based on convolutional neural network. SN Computer Science 2020, 1, 1–10. [Google Scholar] [CrossRef]
- Tibrewal, M.; Srivastava, A.; Kayalvizhi, R. A deep learning approach to detect driver drowsiness. Int. J. Eng. Res. Technol 2021, 10, 183–189. [Google Scholar]
- Petrellis, N.; Zogas, S.; Christakos, P.; Mousouliotis, P.; Keramidas, G.; Voros, N.; Antonopoulos, C. Software Acceleration of the Deformable Shape Tracking Application: How to eliminate the Eigen Library Overhead. 2021 2nd European Symposium on Software Engineering; 2021; pp. 51–57. [Google Scholar]
- Grishchenko, I.; Ablavatski, A.; Kartynnik, Y.; Raveendran, K.; Grundmann, M. Attention mesh: High-fidelity face mesh prediction in real-time. arXiv 2020, arXiv:2006.10962. [Google Scholar]
- Liu, P.; Guo, J.M.; Tseng, S.H.; Wong, K.; Lee, J.D.; Yao, C.C.; Zhu, D. Ocular Recognition for Blinking Eyes. IEEE Transactions on Image Processing 2017, 26, 5070–5081. [Google Scholar] [CrossRef] [PubMed]
- Kumari, P.; KR, S. An optimal feature enriched region of interest (ROI) extraction for periocular biometric system. Multimedia Tools and Applications 2021, 80, 1–19. [Google Scholar] [CrossRef]
- Pandey, N.; Muppalaneni, N. A novel drowsiness detection model using composite features of head, eye, and facial expression. Neural Computing and Applications 2022, 34. [Google Scholar] [CrossRef]
- Ahmed, M.; Laskar, R. Eye center localization using gradient and intensity information under uncontrolled environment. Multimedia Tools and Applications 2022, 81, 1–24. [Google Scholar] [CrossRef]
- Caelen, O. A Bayesian interpretation of the confusion matrix. Annals of Mathematics and Artificial Intelligence 2017, 81, 429–450. [Google Scholar] [CrossRef]
- Selvaraju, R.R.; Das, A.; Vedantam, R.; Cogswell, M.; Parikh, D.; Batra, D. Grad-CAM: Why did you say that? arXiv 2016, arXiv:1611.07450. [Google Scholar]
- Selvaraju, R.R.; Cogswell, M.; Das, A.; Vedantam, R.; Parikh, D.; Batra, D. Grad-cam: Visual explanations from deep networks via gradient-based localization. In Proceedings of the IEEE international conference on computer vision; 2017; pp. 618–626. [Google Scholar]
Figure 1.
Methodology for the detection of driver drowsiness.
Figure 1.
Methodology for the detection of driver drowsiness.
Figure 2.
ROI correction.
Figure 2.
ROI correction.
Figure 3.
ROI correction in 4 different positions of the driver’s head.
Figure 3.
ROI correction in 4 different positions of the driver’s head.
Figure 4.
ROI extraction.
Figure 4.
ROI extraction.
Figure 5.
Arquitecture proposed.
Figure 5.
Arquitecture proposed.
Figure 6.
Graphs resulting from the CNNs.
Figure 6.
Graphs resulting from the CNNs.
Figure 7.
Confusion matrix in CNN Test.
Figure 7.
Confusion matrix in CNN Test.
Figure 8.
Drowsiness detection process flowchart.
Figure 8.
Drowsiness detection process flowchart.
Figure 9.
Boxplot of two evaluation metrics for validation. Boxplots show median (solid line), minimum, maximum values with outliers shown as points.
Figure 9.
Boxplot of two evaluation metrics for validation. Boxplots show median (solid line), minimum, maximum values with outliers shown as points.
Figure 10.
Radial behavior of two training metrics.
Figure 10.
Radial behavior of two training metrics.
Figure 11.
Boxplot of two evaluation metrics in test.
Figure 11.
Boxplot of two evaluation metrics in test.
Figure 12.
Radial behavior of two test metrics.
Figure 12.
Radial behavior of two test metrics.
Figure 13.
Visualized with Grad-CAM.
Figure 13.
Visualized with Grad-CAM.
Figure 14.
Driver drowsiness detection in a real environment: (a) Driver is in a normal state. (b) Driver is in a wakeful state. (c) Driver is with closed eyes, with a time of approximately 230ms. (d) (e) (f) Driver goes to the drowsy state seen, which time is longer than 300ms, activating the alarm. (g) (h) (i) Driver with normal eye blink.
Table 1.
Dataset distribution.
Table 1.
Dataset distribution.
| |
Classes |
| Data set |
Drowsy |
Not drowsy |
| training set |
2380 |
2380 |
| validation set |
510 |
510 |
| test set |
510 |
510 |
Table 2.
Training parameters.
Table 2.
Training parameters.
| Hyper-Parameters |
Value |
| Optimizer |
ADAM |
|
0.001 |
|
0.9 |
| Learning rate |
0.999 |
| Epochs |
30 |
| Batch size |
32 |
| Number of experiments |
10 for each CNN |
Table 3.
Metrics in Training (Validation).
Table 3.
Metrics in Training (Validation).
| CNN based on |
Class Name |
Precision |
Recall |
F1-score |
Accuracy |
| InceptionV3 |
Not drowsy |
0.9945±0.002 |
0.9967±0.001 |
0.9956±0.001 |
0.9956±0.001 |
| Drowsy |
0.9967±0.001 |
0.9945±0.002 |
0.9956±0.001 |
| VGG16 |
Not drowsy |
0.9928±0.002 |
0.9951±0.003 |
0.9934±0.001 |
0.9934±0.001 |
| Drowsy |
0.9951±0.003 |
0.9928±0.002 |
0.9934±0.001 |
| ResNet50V2 |
Not drowsy |
0.9982±0.002 |
0.9996±0.001 |
0.9989±0.001 |
0.9989±0.001 |
| Drowsy |
0.9996±0.001 |
0.9982±0.002 |
0.9989±0.001 |
Table 4.
Metrics in Testing (Test).
Table 4.
Metrics in Testing (Test).
| CNN based on |
Class Name |
Precision |
Recall |
F1-score |
Accuracy |
| InceptionV3 |
Not drowsy |
0.9908±0.003 |
0.9957±0.002 |
0.9928±0.001 |
0.9927±0.001 |
| Drowsy |
0.9957±0.002 |
0.9908±0.003 |
0.9927±0.001 |
| VGG16 |
Not drowsy |
0.9937±0.003 |
0.9941±0.005 |
0.9939±0.002 |
0.9939±0.002 |
| Drowsy |
0.9941±0.005 |
0.9937±0.003 |
0.9939±0.002 |
| ResNet50V2 |
Not drowsy |
0.9948±0.002 |
0.9994±0.001 |
0.9971±0.001 |
0.9971±0.001 |
| Drowsy |
0.9994±0.001 |
0.9947±0.002 |
0.9971±0.001 |
Table 5.
CNN processing results.
Table 5.
CNN processing results.
| |
Results in training: |
Results in test: |
| |
Training Time |
File Size (KB) |
Total Params |
Response Time |
| InceptionV3 |
6.2min±3s |
182,072 |
29,997,786 |
137.8ms |
| VGG16 |
6.1min±12s |
111,603 |
19,325,690 |
71.3ms |
| ResNet50V2 |
6.2min±5s |
476,612 |
56,335,802 |
106.5ms |
Table 6.
Comparison of Drowsiness Detection Methods.
Table 6.
Comparison of Drowsiness Detection Methods.
| Autor |
Dataset |
Facial Method |
ROI |
Delay |
Accuracy |
| Park et al. [11] |
NTHU-DDD |
VGG-FaceNet |
Face |
- |
73.06% |
| Chirra et al. [12] |
Own/collected |
Haar Cascade |
Eyes |
- |
96.42% |
| Zhao et al. [13] |
Company Biteda |
MTCNN |
Face |
- |
93.623% |
| Phan et al. [14] |
Own/collected |
Dlib |
Face |
- |
97% |
| Rajkar et al. [15] |
YawDD/CEITW |
Haar Cascade |
Eyes |
- |
96.82% |
| Hashemi et al. [16] |
ZJU Eyeblink |
Haar Cascade/Dlib |
Eyes |
1.4ms |
98.15% |
| Tibrewal et al. [17] |
MRL Eye |
Dlib |
Eyes |
95ms |
94% |
| Based on InceptionV3 |
NITYMED |
MediaPipe |
Eyes |
137.8ms |
99.31% |
| Based on VGG16 |
71.3ms |
99.41% |
| Based on ResNet50V2 |
106.5ms |
99.71% |
|
Disclaimer/Publisher’s Note: The statements, opinions and data contained in all publications are solely those of the individual author(s) and contributor(s) and not of MDPI and/or the editor(s). MDPI and/or the editor(s) disclaim responsibility for any injury to people or property resulting from any ideas, methods, instructions or products referred to in the content. |
© 2023 by the authors. Licensee MDPI, Basel, Switzerland. This article is an open access article distributed under the terms and conditions of the Creative Commons Attribution (CC BY) license (http://creativecommons.org/licenses/by/4.0/).

