
Submitted:
03 June 2023
Posted:
05 June 2023
You are already at the latest version
Preprints on COVID-19 and SARS-CoV-2
Abstract
Background and Objectives: Coagulation disorders during COVID-19 infection are associated with poor prognosis and disease severity, because two processes that interfere each other are thrombosis and inflammation. Very important issue for clinicians is timely and adequate hemostasis and inflammation monitoring in order to prevent and treat potentially lethal consequences. Materials and Methods: The study was approved by the Ethics Committee of the Clinical center Nis, Serbia. One hundered fourty two patients presented with COVID-19 ARDS were admitted to the ICU in Clinic for anesthesiology Clinical Center Nis, from 14th April 2020 to 25 th May 2020. On admission blood was collected for biochemical and coagulation testing. The data obtained was analyzed using Statistical Package for Social Sciences (SPSS v. 25, Chicago, IL, USA). Results: Among all parameters assessed, mortality was associated with higher age (p<0.05), higher factor I (p<0.05), INR (p<0.001), D-Dimer (p<0.001), ADP (p<0.001), ASPI (p<0.001), TRAP (p<0.001), PSEP (p<0.001), A5 extest (p<0.01), A10 ex test (p<0.01), A5 fib (p<0.001), A10fib (p<0.001) and MCF fib (p<0.001) values, but lower CT extest values (p<0.05). Mortality was associated with extreme values of D-Dimer above 1000 (p<0.001), ADP above 590 (p<0.001), ASPI above 800 (p<0.001), TRAP above 1500 (p<0.001) and PSEP above 1000 (p<0.05). Conclusions: The key to success in the treatment of COVID 19 infection is timely and adequate therapy and patient monitoring, which is impossible without early risk stratification and mortality prediction. Sophisticated hemostasis parameters can contribute to early risk assessment, which was initially performed only on the basis of the patient's clinical status.
Keywords:
COVID 19
; coagulation
; viscoelastic tests
; thrombosis
; mortality
1. Introduction
The pandemic of COVID-19 was challenge for healthcare systems around the world, with a development of acute respiratory distress syndrome (ARDS) and the need for admission to an intensive care unit (ICU) or death. A lot of different symptoms are present but the most important are severe lung dysfunction, a need for ventilation, shock and multiple organ failure [1].
Coagulation disorders during COVID-19 infection are associated with poor prognosis and disease severity, because two processes that interfere each other are thrombosis and inflammation [2]. Due to viral infection, pathogens initiate complex systemic inflammatory responses as part of innate immunity. Activation of host immune systems results in activation of coagulation and thrombin generation and that process is called immunothrombosis [3].
Inflammation is present in patients with SARS-CoV-2 infection, levels of IL-6 are elevated, C reactive protein and procalcitonin, and also fibrinogen [4]. Endothelial cell activation and damage results in disruption of the natural antithrombotic state [5]. This inflammation and activation of coagulation is the cause for the elevated D-dimer levels, as increased levels have been associated with thromboembolism[6]. Some patients have systemic inflammatory response syndrome (SIRS) or cytokine storm, which may explain more dramatic changes in coagulation tests, including significantly elevated D-dimer and changes in other hemostasis tests, especially as the disease progresses[7,8].
The receptor for virus to adhere is an angiotensin-converting enzyme 2 receptor on endothelial cells and viral replication causes inflammatory cell infiltration, endothelial cells death, and microvascular thrombosis [9]. As a result, microcirculatory dysfunction contributes to the clinical symptoms in patients with COVID-19.
Very important issue for clinicians is timely and adequate hemostasis and inflammation monitoring in order to prevent and treat potentially letal consequences.
2. Materials and Methods
The study was conducted in accordance with the Declaration of Helsinki and informed consent was obtained from all subjects involved in the study . One hundered fourty two patients presented with COVID-19 ARDS were admitted to the ICU in Clinic for anesthesiology Clinical Center Nis, from 14th April 2020 to 25 th May 2020. All patients, aged from 36 to 84 years, female and male, were under tracheal intubation and mechanical ventilation and they were all in rolled in study. On admission blood was collected for biochemical and coagulation testing.
Blood samples were taken from the antecubital vein and stored in serum vacutainer tubes without additives for c reactive protein (CRP), using the immunoturbidimetry method on a Beckman Coulter AU 680 analyzer (Beckman Coulter Inc., Brea, CA, USA).
Presepsin (pg/mL) levels were measured from the whole blood specimens using chemiluminescence enzyme immunoassay technology and Magtration® technology on a PATHFAST Immunoanalyzer (Mitsubishi Chemical Europe GmbH, Düsseldorf, Germany).
For coagulation profile samples testing (D-dimer, prothrombin time-PT, international normalized ratio-INR, activated partial thromboplastin time-aPTT, fibrinogen concentration-factor I and anti-Xa values) we used 4 ml whole blood citrated tubes, and tests were performed on ACL TOP 350 coagulometer (Instrumentation Laboratory, USA).
Viscoelastic test (Clot Pro, Enicor, Germany) was also performed from 4 ml citrated whole blood. The output of the instrument consists, among all of: 1. coagulation time (CT, seconds) 2. clot amplitude after 5 and 10 minuts (A5, A10, mm) 3.maximum clot firmness (MCF, mm) 4. clot formation time (CFT, seconds), both in EX-test (extrinsic screening test) and FIB-test (functional fibrinogen test).
For impedance aggregometry-platelet function testing (Multiplate, Roch, Germany) we took blood in lithium-heparinised 4ml tubes, and we used different platelet agonists in three separate tests to measure platelet aggregation 1. adenosine diphosphate in ADP test (aggregation units per minute-AU/min), 2.arachidonic acid in ASPI test (aggregation units per minute-AU/min) and 3.thrombin in TRAP test (aggregation units per minute-AU/min).
For whole blood count measure we used Horiba ABX 200 (Horiba Medical, France) counter and blood was drown in 4ml tubes with ethylene di-amine tetra-acetic acid (EDTA).
The data obtained was analyzed using Statistical Package for Social Sciences (SPSS v. 25, Chicago, IL, USA). According to the normality of distribution, continuous variables were presented as means with standard deviation, or as median with interquartile range. Categorical variables were presented as absolute and relative numbers. The differences between two tested groups were tested by parametric Student’s t-test, or non-parametric Mann-Whitney U-test and Fischer’s exact test. The correlation between continuous variables was assessed according to Pearson’s correlation coefficient. Univariate and multivariate binary logistic regression was performed to determine statistically significant predictors of dependent variables. We evaluated the discriminatory power of various laboratory parameters and determined the optimal cut-off values by the receiver operating characteristic (ROC) curve analyses. ROC curves for multiple variables were constructed based on probabilities obtained by binary logistic regression modeling and compared with DeLong test using MedCalc (v. 19.0; MedCalc Software Ltd, Ostend, Belgium). A p-value less than 0.05 was a measure of statistical significance.
3. Results
3.1. Inflammation and coagulation parameters and mortality
Among all parameters assessed, mortality was associated with higher age (p<0.05), higher factor I (fibrinogen) (p<0.05), INR value (p<0.001), D-Dimer (p<0.001), ADP test (p<0.001), ASPI test (p<0.001), TRAP test (p<0.001), PSEP (p<0.001), A5 ex-test (p<0.01), A10 ex-test (p<0.01), A5 fib-test (p<0.001), A10 fib-test (p<0.001) and MCF fib-test (p<0.001), but lower CT ex-test (p<0.05).(Table 1.)
When we analyzed all these parameters in the view of their normal ranges, mortality was associated with normal range factor I, rather than values above it (p<0.05). Values below normal range were associated with survival in cases of ADP (p<0.001), ASPI (p<0.001) and TRAP test (p<0.001). On the contrary, death occurrence was more frequent in patients with D-Dimer (0<0.05), PSEP (p<0.001), A10 fib-test (p<0.001) and MCF fib-test above normal range (p<0.01). Good clinical outcome, in terms of survival, was associated with higher ranges (normal or above normal) of CT ex-test (p<0.05), but lower ranges (normal or below normal) of A10 ex-test (p<0.05). As for CFT ex-test, death outcome was the most common in patients in normal range values, while the survivers had this parameter above or below normal range (p<0.05).
Mortality was associated with extreme values of D-Dimer above 1000 ng/ml (p<0.001), ADP test above 590 AU/min (p<0.001), ASPI test above 800 AU/min (p<0.001), TRAP test above 1500 AU/min (p<0.001) and PSEP above 1000 pg/ml (p<0.05).
3.2. Cut-off values of tests which discriminate patients mortality
Using ROC analysis, we identified optimal cut-off values for a number of inflammation and coagulation parameters, with the highest sensitivity and specificity in discriminating patients with later exitus (Graph 1.).
Graph 1.
ROC analysis, sensitivity and specificity of inflammation and coagulation parameters.
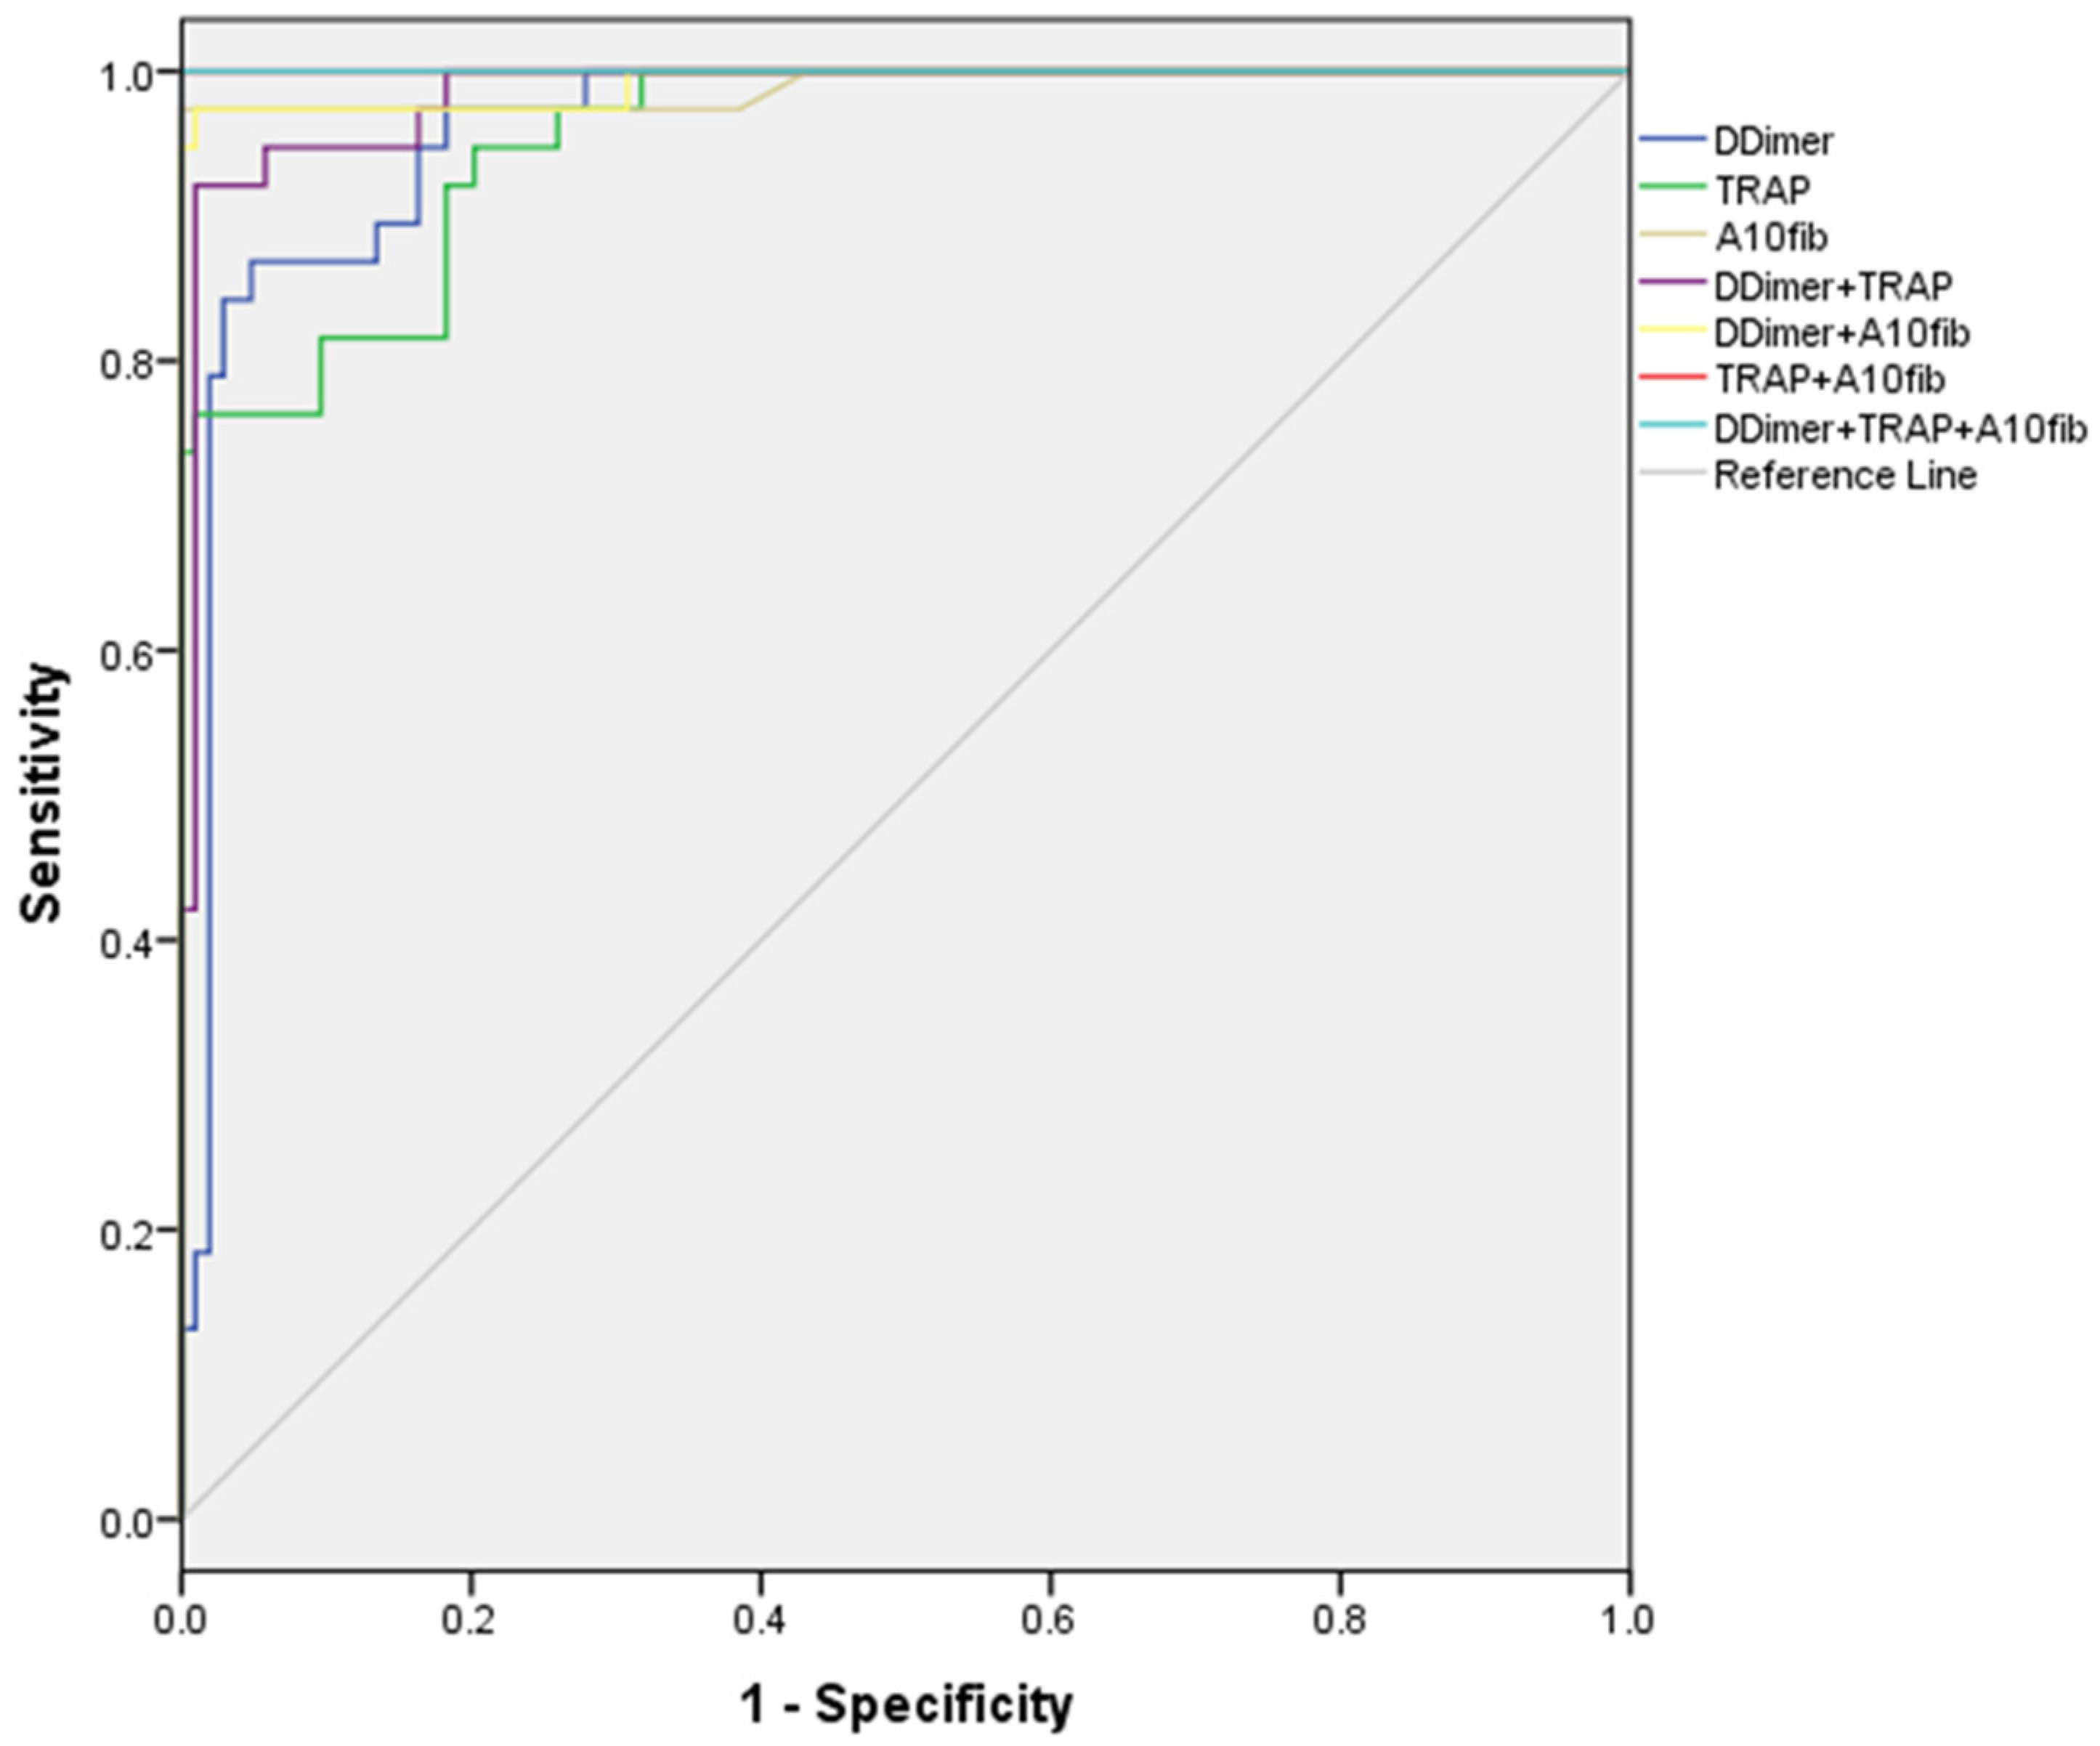
Good discriminatory ability (AUC>0.7) was shown for the following parameters: Factor I (≥9.14 g/L), INR (≥1.38), PSEP (≥335 ng/ml), A5 fib-test (≥28 mm) and MCF fib-test (≥36 mm). Cut-off values for ADP test (≥591 AU/min) and ASPI test (≥728 AU/min) were excellent in discriminating patients with exitus. The best discriminators, with AUC>0.9, were D-Dimer (≥860 ng/ml), TRAP (≥1180 AU/min) and A10 fib-test (≥30 mm), all significantly better than the other parameters, but without statistically significant difference among them.
After making combinations of 2 or 3 of these last parameters, we have found that both D-Dimer and TRAP test were worse than the combination of other 2 parameters (p<0.05), but not A10 fib-test, which was equally good as all the 2 or 3-parameter combinations tested.(Table 2.).
3.3. Correlation between analysed parameters
We have found various degree of correlation between analyzed variables (Table 3.). There was a strong positive correlation among ADP, ASPI and TRAP test (p<0.001), as well as among A5 ex-test, A10 ex-test and MCF ex-test (p<0.001), and between A5 fib-test and MCF fib-test (p<0.001). Strong negative correlation existed between CFT ex-test and A5 ex-test (p<0.001), A10 ex-test (p<0.001) and MCF ex-test (p<0.001). Presepsin concentration was in weak positive correlation with A10 fib-test (p<0.001). Factor I moderately directly correlatied with A5 fib-test (p<0.001) and MCF fib-test (p<0.001), besides, its weak positive correlation was noted with A5 ex-test (p<0.001), A10 ex-test (p<0.001), MCF ex-test (p<0.001) and CT fib-test (p<0.001).
3.4. Predictors of mortality
After performing univariate binary logistic regression (Table 4.), in order to find predictors of mortality, a number of parameters stood out. In cases where the same parameter has been found significant in various forms (countinous variable, according to normal range, or according to previously found cut-off value), the variable with the highest predictive value was chosen to be included in the multivariate model. The following variables cut-off values, previously determined, were more valuable than absolute values or standard cut-offs: age, Factor I, INR, D-Dimer, ASPI test, PSEP, A5 ex-test, A10 ex-test and A5 fib-test.
Interestingly, TRAP test and A10 fib-test cut-off values, previously shown to have high discriminatory ability, were less valuable in the logistic regression modelling of mortality. Due to the total patients number and high co-linearity between some variable, the number of predictors in the multivariate model had to be reduced. The most fitted multivariate model (χ2=141.007, p<0.001) explains 63.0-91.6% in the death occurrence variance. All three variables included in the model were found to be independent predictors of mortality. D-Dimer above 860 ng/ml increases the risk of death 24 times (p<0.01). TRAP test values (binned according to normal value range), with each higher value bin, the risk is 22 times higher (p<0.01). A10 fib-test values above normal range brings 290 times greater risk of death (p<0.05).
4. Discussion
Extensive activation of the coagulation cascade leading to disseminated intravascular coagulation and thrombosis and inevitable progression of COVID-19 and mortality. In the background of these two extremes are hypercoagulability and aberrant fibrinolysis when extreme values of PT, aPTT, platelet count, fibrinogen and fibrin can be expected and associated with COVID-19 mortality [10]. Our idea was to find some parameters that would be markers of the mentioned pathophysiological mechanisms and find predictive cut-off values for them that would enable sufficiently early detection and stratification of the most at-risk COVID-19 patients.
Endothelial injury and consequently tissue factor genesis, and inhibited fibrinolysis due to changes in concentrations of urokinase-type plasminogen activator and plasminogen activator inhibitor-1 are main pathophysiologic mechanisms of focal or disseminated intravascular coagulation [11] . Severe endothelial injury followed with vascular thrombosis and angiogenesis are three principal morphological findings in Covid-19 related acute respiratory distress syndrome [12].
Vascular injury reflects extensive D-dimer elevations [13]. Therefore, this marker is recognized by the International Society of Thrombosis and Haemostasis (ISTH) as the most important among the data we receive from routine initial analysis in patient risk stratification [14].
Concordance (C) statistic with value of area under the ROC (Receiver Operating Characteristic) curve (AUC) is a gold standard for outcome prediction for different predictive models [15]. Generally accepted value of it for excellent predictive ability of some diagnostic test is 0.8 [16].
In our study three variables resulted with extraordinary discriminating capacity with AUC˃0.9, those calculated cut-of values of D-dimer, thrombin activating peptide receptor (TRAP) test and A10 in FIBTEM. These parameters were the basis for creating predictive models for estimating mortality in the most severe Covid-19 patients. Due to the hypofibrinolytic profile in thromboelasatometry, there was concern about the predictive ability of the D-dimer [17]. Cut-off value of D-dimer, which is roughly four times larger than normal, reflects hypercoagulability over hypofibrinolysis in critical ill Covid-19 patients. Predictive ability of D-dimer grows over the time. This fact should be kept in mind when analyzing the results, since our research includes patients with already developed ARDS [17].
Although the characteristic hypercoagulable profile, decreased CFT and increased MCF, was thromboelastometrically confirmed, there are no data on the correlation between thromboelastometric parameters and clinical outcomes [18]. In our study, A10 FIB-test stood out as the best predictive marker for mortality outcome among the data obtained by thromboelastometry. Not only does it correlate with the MCF value of the same test, A10 FIB-test has proven to be more useful in predicting different clinical outcomes. It belongs to the group of markers that depict the strength of the clot and showed the strongest predictive potential among other FIB-test elements that are generally elevated in hypercoagulable states such as COVID-19 infection. The clinical advantage of this marker would be its rapid detection, both in relation to MCF and in relation to conventional laboratory tests. Given these advantages, A10 Fib-test could be a useful parameter when admitting patients to the ICU [19,20].
An elevated level of TRAP test has a great predictive potential for intrahospital mortality in COVID-19. This result can be very useful in daily clinical practice, considering that the TRAP test represents baseline platet aggregation and is independent of the influence of acetylsalicylic acid derivatives and P2Y12 inhibitors. High TRAP test levels we interpret as overactivated phenotype of platelets which may be associated with a hypercoagulable state, disease progression and mortality.
Presepsin is a biomarker that has been studied in relation to sepsis, a potentially life-threatening condition that occurs when the body’s response to infection causes damage to its own tissues and organs. There is some research that suggests that presepsin levels may be elevated in individuals with severe COVID-19, particularly those who develop sepsis as a complication of the disease.
Bacteremic co-infection is a leading cause of ICU admission, mechanical ventilation and mortality in individuals with COVID-19, and studies have shown that patients with severe COVID-19 who develop sepsis have a higher risk of death compared to those who do not. Due to the similar immunological and pathophysiological background of sepsis and covid 19, and frequent bacterial co-infection, it was logical to test the predictive ability of presepsin. High values of it may be a useful tool in predicting which individuals with COVID-19 are at higher risk of developing sepsis and potentially dying from the disease [21]. However, the cut-off value of presepsin that we obtained is slightly above the upper limit and is significantly lower compared to other studies [22].
Relationship between presepsin and COVID-19 mortality is still being studied, and more research is needed to fully understand the extent of this connection. Other factors, such as age, underlying health conditions, and access to medical care, may also play a role in determining an individual risk of mortality from COVID-19 [23].
5. Conclusions
The key to success in the treatment of COVID-19 infection is timely and adequate therapy and patient monitoring, which is impossible without early risk stratification and mortality prediction.
Sophisticated hemostasis parameters can contribute to early risk assessment, which was initially performed only on the basis of the patient’s clinical picture. Hypercoagulability is the main hemocoagulation disorder in COVID-19 infection.
Of all the tested point of care parameters, D-dimer, A10 FIB-test and TRAP test stood out and their combinations are characterized by an outstanding predictive potential for the detection of in-hospital mortality of COVID-19 infection. These parameters are easy to interpret, easily available, are elements of different hemostasis tests and are markers of different effects on hypercoagulability.
Author Contributions
Conceptualization, Milan Lazarević. and Natalija Vuković.; methodology, Dragan Milić.; software, Dragana Stokanović.; validation, Velimir Perić.; formal analysis, Mlađan Golubović; investigation, Marija Stošić.; resources, Vladimir Stojilkvić.; data curation, Aleksandar Kamenov; writing—original draft preparation, Dimitrije Spasić. All authors have read and agreed to the published version of the manuscript.
Data Availability Statement
Data is unavailable due to privacy and they are present in hospital protocols in Clinical Center Nis Serbia.
Conflicts of Interest
The authors declare no conflict of interest.
References
- Yang X, Yu Y, Xu J, et al. Clinical course and outcomes of critically ill patients with SARS-CoV-2 pneumonia in Wuhan, China: a single-centered, retrospective, observational study. Lancet Respir Med. 2020 Feb 24. [CrossRef]
- Yau JW, Teoh H, Verma S. Endothelial cell control of thrombosis. BMC Cardiovasc Disord 2015;15:130.
- Huertas A, Montani D, Savale L, et al. Endothelial cell dysfunction: a major player in SARS-CoV-2 infection (COVID-19)? Eur Respir J 2020;56:2001634.
- Ji, P.; Zhu, J.; Zhong, Z.; Li, H.; Pang, J.; Li, B.; Zhang, J. Association of elevated inflammatory markers and severe COVID-19: A meta-analysis. Medicine 2020, 99, e23315. [Google Scholar] [CrossRef] [PubMed]
- Tay MZ, Poh CM, Rénia L, et al. The trinity of COVID-19: immunity, inflammation and intervention. Nat Rev Immunol 2020;20:363–74.
- Semararo F, Ammollo CT, Caironi P, et al. D-dimer corrected for thrombin and plasmin generation is a strong predictor of mortality in patients with sepsis. Blood Transfus 2019; [CrossRef]
- Wang J, Jiang M, Chen X, et al. Cytokine storm and leukocyte changes in mild versus severe SARS-CoV-2 infection: review of 3939 COVID-19 patients in China and emerging pathogenesis and therapy concepts. J Leukoc Biol 2020;108:17–41.
- Han, Huan, Yang, Lan, Liu, Rui, Liu, Fang, Wu, Kai-lang, Li, Jie, Liu, Xing-hui and Zhu, Cheng-liang. "Prominent changes in blood coagulation of patients with SARS-CoV-2 infection" Clinical Chemistry and Laboratory Medicine (CCLM), vol. 58, no. 7, 2020, pp. 1116-1120.
- Hoffmann M, Kleine-Weber H, Schroeder S, et al. SARS-CoV-2 cell entry depends on ACE2 and TMPRSS2 and is blocked by a clinically proven protease inhibitor. Cell 2020;181:271–80.
- Semiz, Sabina. COVID19 biomarkers: What did we learn from systematic reviews? Frontiers in Cellular and Infection Microbiology, 2022;12: 1844.
- Gralinski, Lisa E., et al. Mechanisms of severe acute respiratory syndrome coronavirus-induced acute lung injury. MBio, 2013; 4.4: e00271-13.
- Ackermann M, Maximilian, et al. Pulmonary vascular endothelialitis, thrombosis, and angiogenesis in Covid-19. New England Journal of Medicine, 2020; 383.2: 120-128.
- Zhang Y, Xiao M, Zhang S et al Coagulopathy and antiphospholipid antibodies in patients with Covid-19. N Engl J Med, 2020.
- Thachil, J. Tang, N. Gando, S. et al. ISTH interim guidance on recognition and management of coagulopathy in COVID-19. J. Thromb. Haemost. 2020; 18: 1023–1026.
- Kelly H. Zou, PhD; A. James O’Malley, PhD; Laura Mauri, MD, MSc. Receiver-Operating Characteristic Analysis for Evaluating Diagnostic Tests and Predictive Models. Circulation. 2007;115:654-657.
- Perić VS, Golubović MD, Lazarević MV, Kostić TL, Stokanović DS, Đorđević MN, Marjanović VG, Stošić MD, Milić DJ. Predictive potential of biomarkers and risk scores for major adverse cardiac events in elderly patients undergoing major elective vascular surgery. Rev Cardiovasc Med. 2021; 22(3): 1053-1062.
- Almskog, Lou M., et al. Rotational thromboelastometry predicts care level in Covid-19. MedRxiv, 2012; 2020.06. 11.20128710.
- Ibañez, C.; Perdomo, J.; Calvo, A.; Ferrando, C.; Reverter, J.C.; Tassies, D.; Blasi, A. High D dimers and low global fibrinolysis coexist in COVID19 patients: What is going on in there? J. Thromb. Thrombolysis 2020, 15, 1–5. [Google Scholar] [CrossRef] [PubMed]
- Reed MJ, Nimmo AF, McGee D, et al. Rotational thrombolelas-tometry produces potentially clinical useful results within10 min in bleeding Emergency Department patients: theDEUCE study. European Journal of Emergency Medicine 2013;20: 160–6.
- Kelly, J. M., et al. Using rotational thromboelastometry clot firmness at 5 minutes (ROTEM® EXTEM A5) to predict massive transfusion and in-hospital mortality in trauma: a retrospective analysis of 1146 patients. Anaesthesia, 2018, 73.9: 1103-1109.
- Guarino, M., Perna, B., Maritati, M. et al. Presepsin levels and COVID-19 severity: a systematic review and meta-analysis. Clin Exp Med (2022).
- Assal HH, Hebatallah Hany, et al. Presepsin as a Novel Biomarker in predicting In-hospital Mortality in Patients With COVID-19 Pneumonia. International Journal of Infectious Diseases, 2022, 118: 155-163.
- Zhang, Jj., Dong, X., Liu, Gh. et al. Risk and Protective Factors for COVID-19 Morbidity, Severity, and Mortality. Clinic Rev Allerg Immunol, 2023, 64: 90–107.

Table 1.
Inflammation and coagulation parameters according to mortality.
| No mortality (N=104) | Mortality (N=38) | t* or Z** or χ2*** (p) | ||
|---|---|---|---|---|
| Age (years) | 62.67±12.10 | 66.71±8.44 | 2.229 (0.028)* | |
| Factor I (g/L) | 7.62±1.54 | 8.56±2.29 | 2.344 (0.023)* | |
| Factor I (>4 g/L) | 103 (99.0%) | 34 (89.5%) | 4.944 (0.018)*** | |
| Anti-Xa | 0.38±0.14 | 0.37±0.15 | 0.323 (0.747)* | |
| INR | 1.26±0.16 | 1.48±0.23 | 5.500 (0.000)* | |
| INR (>1) | 102 (98.1%) | 38 (100.0%) | 0.003 (1.000)*** | |
| D-Dimer (ng/ml) | 444.0 (407.0-737.5) | 1285.0 (970.0-1542.0) | 8.393 (0.000)** | |
| D-Dimer (>230 ng/ml) | 89 (85.6%) | 38 (100.0%) | 4.697 (0.011)*** | |
| D-Dimer (>1000 ng/ml) | 2 (1.9%) | 27 (71.1%) | 77.640 (0.000)*** | |
| aPTT (s) | 37.53±8.92 | 36.38±7.14 | 0.712 (0.478)* | |
| aPTT (s) | <34 | 45 (43.3%) | 20 (52.6%) | 1.348 (0.510)*** |
| 34-38 | 14 (13.5%) | 3 (7.9%) | ||
| >38 | 45 (43.3%) | 15 (39.5%) | ||
| ADP test (AU/min) | 365.14±150.88 | 670.21±224.77 | 7.753 (0.000)* | |
| ADP test (AU/min) | <406 | 61 (58.7%) | 3 (7.9%) | 37.248 (0.000)*** |
| 406-992 | 43 (41.3%) | 30 (78.9%) | ||
| >992 | 0 (0.0%) | 5 (13.2%) | ||
| ADP test (AU/min) (>590) | 5 (4.8%) | 24 (63.2%) | 54.771 (0.000)*** | |
| ASPI test (AU/min) | 486.61±229.59 | 843.84±217.04 | 8.326 (0.000)* | |
| ASPI test (<790 AU/min) | 103 (99.0%) | 15 (39.5%) | 66.129 (0.000)*** | |
| ASPI test (>800 AU/min) | 0 (0.0%) | 22 (57.9%) | 66.896 (0.000)*** | |
| TRAP test (AU/min) | 548.25±293.04 | 1375.90±367.61 | 13.884 (0.000)* | |
| TRAP test (AU/min) | <923 | 94 (90.4%) | 7 (18.4%) | 78.997 (0.000)*** |
| 923-1509 | 10 (9.6%) | 14 (36.8%) | ||
| >1509 | 0 (0.0%) | 17 (44.7%) | ||
| TRAP test (>1500 AU/min) | 0 (0.0%) | 20 (52.6%) | 59.435 (0.000)*** | |
| PSEP (pg/ml) | 293.0 (239.0-395.5) | 593.0 (446.2-743.8) | 5.074 (0.000)** | |
| PSEP (>337 pg/ml) | 27 (26.0%) | 33 (86.8%) | 39.818 (0.000)*** | |
| PSEP (>1000 pg/ml) | 0 (0.0%) | 3 (7.9%) | 5.005 (0.018)*** | |
| CT ex-test (s) | 65.38±16.38 | 57.58±15.77 | 2.535 (0.012)* | |
| CT ex-test (s) | <38 | 1 (1.0%) | 3 (7.9%) | 8.958 (0.011)*** |
| 38-65 | 47 (45.2%) | 23 (60.5%) | ||
| >65 | 56 (53.8%) | 12 (31.6%) | ||
| A5 ex-test (mm) | 53.0 (47.0-56.0) | 56.5 (51.0-60.0) | 2.628 (0.009)** | |
| A5 ex-test (<38 mm) | 7 (6.7%) | 0 (0.0%) | 1.446 (0.190)*** | |
| A10 ex-test (mm) | 59.5 (55.0-63.0) | 63.5 (58.5-66.0) | 3.174 (0.002)** | |
| A10 ex-test (mm) | <38 | 10 (9.6%) | 0 (0.0%) | 6.415 (0.040)*** |
| 38-67 | 89 (85.6%) | 33 (86.8%) | ||
| >67 | 5 (4.8%) | 5 (13.2%) | ||
| MCF ex-test (mm) | 61.0 (58.0-64.0) | 63.0 (60.0-67.2) | 2.405 (0.016)** | |
| MCF ex-test (mm) | <38 | 4 (3.8%) | 0 (0.0%) | 2.099 (0.350)*** |
| 38-68 | 89 (85.6%) | 32 (84.2%) | ||
| >68 | 11 (10.6%) | 6 (15.8%) | ||
| CFT ex-test (mm) | 53.0 (41.2-63.0) | 50.5 (44.0-53.2) | 1.005 (0.315)** | |
| CFT ex-test | <38 | 20 (19.2%) | 2 (5.3%) | 6.111 (0.047)*** |
| 38-69 | 63 (60.6%) | 31 (81.6%) | ||
| >69 | 21 (20.2%) | 5 (13.2%) | ||
| CT fib-test (s) | 67.5 (45.2-86.5) | 63.0 (47.8-73.5) | 0.332 (0.740)** | |
| CT fib-test (>70 s) | 46 (44.2%) | 12 (31.6%) | 1.357 (0.185)*** | |
| A5 fib-test (mm) | 22.62±6.43 | 27.45±6.58 | 3.939 (0.000)* | |
| A5 fib-test (>9 mm) | 103 (99.0%) | 38 (100.0%) | 0.000 (1.000)*** | |
| A10 fib-test (mm) | 17.48±4.67 | 36.26±4.46 | 21.472 (0.000)* | |
| A10 fib-test (>23mm) | 13 (12.5%) | 37 (97.4%) | 84.189 (0.000)*** | |
| MCF fib-test (mm) | 24.62±7.63 | 30.90±7.91 | 4.294 (0.000)* | |
| MCF fib-test (>25mm) | 48 (46.2%) | 28 (73.7%) | 7.409 (0.004)*** | |
Table 2.
Optimal cut-off values for a number of inflammation and coagulation parameters, with the highest sensitivity and specificity in discriminating patients with increased mortality.
Table 2.
Optimal cut-off values for a number of inflammation and coagulation parameters, with the highest sensitivity and specificity in discriminating patients with increased mortality.
| AUC (95%CI for AUC) | p | cut-off | sensitivity (%) | specificity (%) | |
|---|---|---|---|---|---|
| Age | 0.637 (0.536-737) | 0.013 | 68 | 71.1 | 64.4 |
| Factor I (g/L) | 0.702 (0.591-0813) | 0.000 | 9.14 | 71.1 | 74.0 |
| Anti-Xa | 0.487 (0.378-0.596) | 0.816 | 0.4 | 55.3 | 47.1 |
| INR | 0.790 (0.696-0.884) | 0.000 | 1.38 | 76.3 | 75.0 |
| D-Dimer (ng/ml) | 0.961 (0.930-0.991) | 0.000 | 860 | 86.8 | 95.2 |
| aPTT (s) | 0.474 (0.373-0.575) | 0.637 | 31.2 | 73.7 | 37.5 |
| ADP (AU/min) | 0.878 (0.816-0.940) | 0.000 | 591 | 63.2 | 95.2 |
| ASPI (AU/min) | 0.848 (0.772-0.924) | 0.000 | 728 | 65.8 | 97.1 |
| TRAP (AU/min) | 0.955 (0.923-0.987) | 0.000 | 1180 | 76.3 | 99.0 |
| PSEP (ng/ml) | 0.779 (0.701-0.856) | 0.000 | 335 | 89.5 | 74.0 |
| CT ex-test (s) | 0.364 (0.261-0.468) | 0.013 | 37 | 100.0 | 1.0 |
| A5 ex-test (mm) | 0.644 (0.544-0.744) | 0.009 | 57 | 50.0 | 77.9 |
| A10 ex-test (mm) | 0.674 (0.574-0.774) | 0.002 | 64 | 50.0 | 82.7 |
| MCF ex-test (mm) | 0.632 (0.533-0.730) | 0.016 | 59 | 97.4 | 27.9 |
| CFT ex-test (mm) | 0.445 (0.349-0.540) | 0.315 | 41 | 92.1 | 25.0 |
| CT fib-test (s) | 0.482 (0.381-0.583) | 0.740 | 43 | 97.4 | 22.1 |
| A5 fib-test (mm) | 0.704 (0.597-0.810) | 0.000 | 28 | 68.4 | 78.8 |
| A10 fib-test (mm) | 0.989 (0.968-1.000) | 0.000 | 30 | 97.4 | 100.0 |
| MCF fib-test (mm) | 0.703 (0.607-0.798) | 0.000 | 36 | 42.1 | 94.2 |
Table 3.
Correlation between various coagulation and inflammation parameters.
| FI | AntiXa | INR | DD | aPTT | ADP | ASPI | TRAP | PSEP | CTex | A5ex | A10ex | MCFex | CFTex | CTf | A5fib | A10fib | MCFfib | |
| Age | -0.058 0.497 |
0.226 0.007 |
0.284 0.001 |
0.176 0.036 |
0.274 0.001 |
-0.010 0.910 |
-0.104 0.219 |
0.092 0.276 |
0.114 0.175 |
0.273 0.001 |
0.066 0.438 |
0.098 0.244 |
0.117 0.165 |
-0.029 0.731 |
0.390 0.000 |
0.208 0.013 |
0.338 0.000 |
0.152 0.071 |
| FI(g/L) | 0.046 0.584 |
0.011 0.899 |
0.261 0.002 |
0.296 0.000 |
0.078 0.354 |
0.156 0.064 |
0.181 0.031 |
0.073 0.391 |
-0.274 0.001 |
0.432 0.000 |
0.405 0.000 |
0.396 0.000 |
-0.177 0.035 |
-0.390 0.000 |
0.680 0.000 |
0.110 0.195 |
0.613 0.000 |
|
| AntiXa | 0.042 0.622 |
-0.026 0.757 |
0.290 0.000 |
0.038 0.653 |
-0.043 0.612 |
-0.006 0.940 |
-0.033 0.696 |
0.062 0.467 |
0.006 0.942 |
0.011 0.897 |
-0.018 0.834 |
0.042 0.621 |
0.076 0.366 |
0.143 0.089 |
0.029 0.731 |
0.089 0.290 |
||
| INR |
0.351 0.000 |
0.093 0.272 |
0.249 0.003 |
0.192 0.022 |
0.218 0.009 |
0.144 0.088 |
-0.158 0.061 |
0.184 0.029 |
0.145 0.086 |
0.090 0.288 |
-0.167 0.047 |
-0.107 0.207 |
0.305 0.000 |
0.500 0.000 |
0.334 0.000 |
|||
| D-Dimer | 0.146 0.083 |
0.487 0.000 |
0.513 0.000 |
0.555 0.000 |
0.196 0.019 |
0.037 0.660 |
0.341 0.000 |
0.362 0.000 |
0.319 0.000 |
-0.150 0.075 |
-0.007 0.933 |
0.357 0.000 |
0.572 0.000 |
0.371 0.000 |
||||
| aPTT(s) | -0.031 0.711 |
0.087 0.305 |
-0.012 0.883 |
-0.090 0.288 |
0.283 0.001 |
0.157 0.062 |
0.160 0.057 |
0.227 0.006 |
-0.090 0.286 |
0.069 0.411 |
0.421 0.000 |
-0.048 0.572 |
0.461 0.000 |
|||||
| ADP(AU/min) |
0.838 0.000 |
0.768 0.000 |
0.175 0.038 |
-0.135 0.106-9 |
0.392 0.000 |
0.444 0.000 |
0.346 0.000 |
-0.291 0.000 |
-0.178 0.034 |
0.147 0.081 |
0.532 0.000 |
0.312 0.000 |
||||||
| ASPI(AU/min) |
0.794 0.000 |
0.159 0.058 |
-0.266 0.001 |
0.490 0.000 |
0.574 0.000 |
0.490 0.000 |
-0.359 0.000 |
-0.362 0.000 |
0.306 0.000 |
0.424 0.000 |
0.414 0.000 |
|||||||
| TRAP(AU/min) |
0.184 0.029 |
-0.247 0.003 |
0.426 0.000 |
0.422 0.000 |
0.440 0.000 |
-0.286 0.001 |
0.206 0.014 |
0.259 0.002 |
0.627 0.000 |
0.313 0.000 |
||||||||
| PSEP(pg/ml) | -0.080 0.344 |
-0.022 0.793 |
-0.001 0.992 |
-0.021 0.801 |
0.024 0.778 |
0.069 0.415 |
0.042 0.620 |
0.351 0.000 |
0.034 0.690 |
|||||||||
| CTex test(s) |
-0.399 0.000 |
-0.355 0.000 |
-0.277 0.001 |
0.315 0.000 |
0.722 0.000 |
-0.351 0.000 |
-0.127 0.131 |
-0.319 0.000 |
||||||||||
| A5ex test(mm) |
0.907 0.000 |
0.933 0.000 |
-0.770 0.000 |
-0.562 0.000 |
0.663 0.000 |
0.265 0.001 |
0.703 0.000 |
|||||||||||
| A10ex test(mm) |
0.883 0.000 |
-0.728 0.000 |
-0.558 0.000 |
0.624 0.000 |
0.269 0.000 |
0.691 0.000 |
||||||||||||
| MCFex test(mm) |
-0.772 0.000 |
-0.463 0.000 |
0.633 0.000 |
0.279 0.001 |
0.665 0.000 |
|||||||||||||
| CFTex test(mm) |
0.484 0.000 |
-0.433 0.000 |
-0.213 0.011 |
-0.464 0.000 |
||||||||||||||
| CTfib test(s) |
-0.429 0.000 |
0.089 0.294 |
-0.421 0.142 |
|||||||||||||||
| A5fib test(mm) |
0.294 0.000 |
0.917 0.000 |
||||||||||||||||
| A10fib test(mm) |
-0.329 0.000 |
Table 4.
Binary logistic regression of mortality predictors.
| Univariate | Multivariate | |||
| OR (95%CI for OR) | p | OR (95%CI for OR) | p | |
| Age (≥68) | 4.445 (1.981-9.970) | 0.000 | ||
| Factor I (g/L) | 1.392 (1.093-1.773) | 0.007 | ||
| Factor I (>4 g/L) | 0.083 (0.009-0.764) | 0.028 | ||
| Factor I (≥9.14 g/L) | 7.000 (3.062-16.003) | 0.000 | ||
| INR | 486.244 (41.870-5646.800) | 0.000 | ||
| INR (≥1.38) | 9.667 (4.051-23.065) | 0.000 | ||
| D-Dimer (ng/ml) | 1.006 (1.004-1.008) | 0.000 | ||
| D-Dimer (>1000 ng/ml) | 125.182 (26.168-598.831) | 0.000 | ||
| D-Dimer (≥860 ng/ml) | 130.680 (35.590-479.835) | 0.000 | 23.735 (2.824-199.461) | 0.004 |
| ADP test (AU/min) | 1.011 (1.007-1.016) | 0.000 | ||
| ADP test (<normal range>) | 17.007 (5.085-56.873) | 0.000 | ||
| ADP test (>590 AU/min) | 33.943 (11.139-103.433) | 0.000 | ||
| ASPI test (AU/min) | 1.011 (1.007-1.016) | 0.000 | ||
| ASPI test(<normal range>) | 157.933 (19.847-1256.730) | 0.000 | ||
| ASPI (≥728 AU/min) | 64.744 (17.131-244.686) | 0.000 | ||
| TRAP test (AU/min) | 1.006 (1.004-1.009) | 0.000 | ||
| TRAP test (<normal range>) | 23.421 (8.669-63.278) | 0.000 | 21.983 (2.365-204.311) | 0.001 |
| TRAP test (≥1180 AU/min) | 331.889 (40.372-2728.392) | 0.000 | ||
| PSEP (pg/ml) | 1.003 (1.001-1.004) | 0.000 | ||
| PSEP (>337 pg/ml) | 18.822 (6.668-53.131) | 0.000 | ||
| PSEP (≥335 pg/ml) | 24.241 (7.870-74.663) | 0.000 | ||
| CT ex-test (s) | 0.970 (0.947-0.994) | 0.014 | ||
| CTex-test (<normal range>) | 0.376 (0.186-0.763) | 0.007 | ||
| A5 ex-test (mm) | 1.100 (1.032-1.173) | 0.003 | ||
| A5ex-test (≥57 mm) | 3.522 (1.604-7.734) | 0.002 | ||
| A10 ex-test (mm) | 1.121 (1.035-1.215) | 0.005 | ||
| A10 ex-test (<normal range>) | 3.985 (1.300-12.211) | 0.016 | ||
| A10 ex-test (≥64 mm) | 4.778 (2.117-10.782) | 0.000 | ||
| MCFex-test (mm) | 1.107 (1.026-1.195) | 0.009 | ||
| MCFex-test (≥59 mm) | 14.307 (1.875-109.149) | 0.010 | ||
| A5 fib-test (mm) | 1.128 (1.056-1.204) | 0.000 | ||
| A5 fib-test (≥28 mm) | 8.076 (3.521-18.525) | 0.000 | ||
| A10 fib-test (mm) | 1.895 (1.410-2.546) | 0.000 | ||
| A10 fib-test (>23 mm) | 259.000 (32.697-2051.584) | 0.000 | 289.509 (3.438-24378.575) | 0.012 |
| MCF fib-test (mm) | 1.111 (1.053-1.172) | 0.000 | ||
| MCF fib-test (>25 mm) | 3.267 (1.441-7.406) | 0.005 | ||
| MCF fib-test (≥36 mm) | 11.879 (4.173-33.810) | 0.000 | ||
Disclaimer/Publisher’s Note: The statements, opinions and data contained in all publications are solely those of the individual author(s) and contributor(s) and not of MDPI and/or the editor(s). MDPI and/or the editor(s) disclaim responsibility for any injury to people or property resulting from any ideas, methods, instructions or products referred to in the content. |
© 2023 by the authors. Licensee MDPI, Basel, Switzerland. This article is an open access article distributed under the terms and conditions of the Creative Commons Attribution (CC BY) license (http://creativecommons.org/licenses/by/4.0/).
Copyright: This open access article is published under a Creative Commons CC BY 4.0 license, which permit the free download, distribution, and reuse, provided that the author and preprint are cited in any reuse.


