Submitted:
01 June 2023
Posted:
02 June 2023
You are already at the latest version
Abstract
Phytochromes are biological photoswitches that translate light into a physiological function. Spec-troscopic techniques are essential tools in molecular research on these photoreceptors. This review is directed to summarize how resonance Raman and IR spectroscopy contributed to the under-standing of structure, dynamics, and reaction mechanism of phytochromes, outlining the substan-tial experimental and theoretical challenges and describing the strategies to master them. It is shown that the potential of the various vibrational spectroscopic techniques can be most efficient-ly exploited in integral approaches by combination with theoretical methods as well as other ex-perimental techniques.
Keywords:
Raman
; IR
; spectroscopy
; phytochrome
; tetrapyrrole
; photoswitch
1. Introduction
Phytochromes constitute a class of sensory photoreceptors that utilize light as a source of information to trigger a physiological response [1,2,3,4]. They harbor a linear methine-bridged tetrapyrrole as the chromophoric unit, which upon light absorption undergoes a double bond isomerization around the methine bridge between rings C and D (Figure 1) [2,3]. The primary photoprocess is followed by thermal relaxations that eventually lead to functionally relevant structural changes of the protein for conversion between the parent states. These states are the red-absorbing Pr and far-red absorbing Pfr state, which represent the physiologically inactive and active forms.
While phytochromes were initially thought to exist exclusively in plant, representatives of this photoreceptor family were later also found in bacteria and fungi [3]. Regardless of the origin, all phytochromes display the same general photoinduced reaction pattern but differ with respect to the domain composition and the type of tetrapyrrole and its binding site. Phytochromes include a tetrapyrrole-binding photosensor module composed of a PAS (Period/ARNT/Single-minded), GAF (cGMP phosphodiesterase/adenylate cyclase/FhlA), and PHY (phytochrome-specific) domain, and an output module with an enzymatic domain, frequently a histidine kinase. Plant and cyanobacterial phytochromes carry a phytochromobilin (PΦB) or phycocyanobilin (PCB), respectively, both with the Cys binding site in the GAF domain. Bacterial and fungal phytochromes harbor biliverdin (BV), attached to a Cys in the PAS domain (Figure 1) [3]. In most of the phytochromes (prototypical phytochromes), Pr is the thermodynamically stable parent state, which is also thermally recovered (dark reversion) after photoconversion to Pfr. Only in some bacterial phytochromes, the relative thermodynamic stabilities of the parent states are reversed and Pfr is the stable dark state (bathy phytochromes) [5].
Related to phytochromes are a class of cyanobacterial photoreceptors lacking the PHY domain [6,7]. These cyanobacteriochromes (CBCR) carry a PCB chromophore, covalently attached to a Cys in the GAF domain, and also represent photoswitches between two parent states. However, these states can show absorption maxima in the entire visible spectral range from the red to the violet region [8].
Since the discovery of phytochromes seventy years ago [1], researchers from different disciplines strived for understanding the functioning of this photoreceptor. However, in contrast to the phenomenological description of phytochrome-dependent photomorphogenesis in plants, progress in elucidating the underlying molecular processes was relative slow in the first decades. A substantial breakthrough was achieved in the late nineties with the discovery of phytochromes in prokaryotes and the development of efficient expression systems [10,11]. These achievements were essential for applying demanding spectroscopic techniques such as NMR spectroscopy [12], and eventually for the successful structure determination by X-ray crystallography [13,14,15,16,17]. Among the spectroscopic techniques which were employed, infrared (IR) and resonance Raman (RR) spectroscopic techniques played a crucial role in deciphering the molecular processes in phytochromes, despite the enormous difficulties that had to overcome in carrying out the experiments and interpreting the spectra [18,19]. With the development of hardware and novel approaches and the progress in the theoretical analysis, vibrational spectroscopic methods became indispensable tools, in parallel to the impressive advancement of structural biology techniques [20].
This review summarizes the various approaches of vibrational spectroscopy used in studying phytochromes, their limitations and achievements as well as their future potential. Instead of being a comprehensive historical survey, emphasis will be laid on key questions of the molecular processes in phytochromes that were addressed by vibrational spectroscopies. These are specifically the photoinduced reaction mechanism and the properties of the intermediates involved (Section 3), and the coupling of chromophore and protein structural changes (Section 4). Following the canonical phytochromes, Section 5 summarizes the vibrational spectroscopic studies on CBCRs that adopt a different domain structures. CBCRs deserve special attention also in view of their potential application in optogenetics, an aspect that eventually leads to the last section (Section 6), which is dedicated to the contribution of vibrational spectroscopy to support the use of phytochromes in biomedicine. At first, however, the RR and IR spectroscopic techniques will be briefly introduced in Section 2. For a more detailed description of experimental and theoretical background the reader is referred to the literature [19,21].
2. Vibrational spectroscopic approaches in phytochrome research
The first vibrational spectroscopic experiments on phytochromes were published in the late eighties, although dedicated Raman and IR spectroscopic approaches were successfully applied to other photoreceptors much earlier [22,23,24,25]. One of the obstacles that made vibrational spectroscopy of phytochromes an enormous challenge was the tedious isolation and purification of the protein from plants, which was, until the late nineties, the only source for the relatively large amounts of sample needed for the experiments. Furthermore, the purified phytochrome was by far not that stable as the classical benchmark photoreceptor bacteriorhodopsin (BR) [26], and thus specifically adapted vibrational spectroscopic approaches were required.
2.1. IR spectroscopic techniques
IR absorption spectroscopy provides information about the secondary structure of proteins [20], which in view of its large size was not a particularly instructive method for phytochromes [27]. Thus, IR spectroscopy is mainly carried out as a reaction-induced difference spectroscopy comparing the spectra measured after irradiation with the reference spectra obtained in the dark [28,29,30]. Such difference spectra exclusively display those vibrational bands of both the chromophore and the protein that undergo changes upon the reaction. Whereas the difference spectra between the parent states are obtained at ambient temperature, spectral changes associated with intermediate states are measured at temperatures at which the desired state is trapped [30].
Time-resolved IR spectroscopy like rapid-scan and step-scan spectroscopy requires long signal accumulation times and large amounts of sample [31,32,33]. These techniques were developed on the basis of experiments with BR which undergoes a photocycle within less than 100 ms [31,32]. Thus, within less than a second, in BR the original photoreceptor state is recovered as a prerequisite for repetitive probing (fresh sample condition). In phytochromes, thermal recovery (dark reversion) takes much longer [3], which would lead to unacceptable long measuring times. Hence, the only solution is a the photoinduced recovery of the initial state implying a demanding three-beam pump-probe-pump set-up [34]. Such experiments have been successfully carried out with phytochromes covering a time range from the short microsecond to second regime [34,35]. Probing faster events requires a different approach based on transient absorption techniques, which allow monitoring evolution of the IR-active vibrational bands from femtoseconds on and can cover a wide dynamic range [36,37,38,39,40,41,42]. The experiments are based on narrow IR probe pulses, and their wavelength may be tuned to over a spectral region of several hundreds of wavenumbers. In case of monitoring localized modes such as the C=O stretchings of the chromophore, polarization-dependent measurements may even provide information about time-dependent orientational changes of the group [41,43]. For all time-resolved IR spectroscopic techniques, a good-signal-to-noise ratio is a prerequisite for a reliable spectra interpretation. In this respect, noise-reduction approaches are of particular importance as shown, for instance, by Kübel et al. [44], developed on the basis of time-resolved spectra of phytochromes, but applicable to other systems as well.
Recently, two-dimensional IR spectroscopy was applied to phytochromes [45]. This technique is capable to identify coupling between different spectral changes and thus add additional type of information to the analysis of the structural and reaction dynamics of the photoreceptor.
2.2. Raman spectroscopic techniques
Raman spectroscopy is an important tool to selectively probe the vibrational spectrum of a chromophore upon excitation in resonance with its electronic transition (RR spectroscopy) [21,46]. In case of phytochromes, RR spectroscopy faces the problem of fluorescence, which can obscure the RR signals, as well as uncontrolled photoconversions. Fodor et al. were the first to present a solution by using excitation lines in the near-infrared (NIR) at 792 or 752 nm, which are shifted from the fluorescence maximum but yet sufficiently close to the first electronic transition of the tetrapyrrole chromophore (670 – 750 nm) to achieve a good resonance enhancement [47,48]. Using a classical Raman spectrometer, these experiments suffered a bit from the low signal detection sensitivity in this spectral region. An alternative, which meanwhile has been widely applied to phytochromes, is the Fourier-transform (FT) Raman spectroscopic technique, which offers the advantages of a high optical throughput and an excellent frequency stability [49,50,51,52]. It is restricted to 1064-nm excitation, which due to the pre-resonance enhancement, however, still provides an efficient discrimination of the protein Raman bands compared to those of the chromophore [50].
An interesting approach to eliminate fluorescence is the shifted-excitation Raman difference spectroscopy (SERDS), in which two spectra were measured with slightly different excitation lines that are in resonance with the electronic transition of the chromophore [53]. The resultant difference spectrum cancels the fluorescence but yields a rather noisy spectrum with positive and negative Raman difference bands. These signals were simulated assuming Lorentzian band profiles and thus allow calculating the absolute RR spectrum. The comparison with spectra obtained under pre-resonance conditions demonstrated not only the reliability of SERDS but also the close similarity of the RR spectra with rigorous and pre-resonance enhancement [50,53].
The various RR spectroscopic approaches described above exploited the resonance enhancement associated with the lowest electronic transition in the red spectral region. Only few studies used excitation lines in resonance with the second transition at ca. 360 – 400 nm although the fluorescence quantum yield is distinctly lower.[54,55,56] However, the high excitation energy might favor undesired side reactions.
Further techniques that circumvent fluorescence are coherent anti-Stokes (resonance) Raman spectroscopy (CARS) and surface enhanced resonance Raman spectroscopy (SERRS). CARS probes the vibrational spectrum at the higher energy (anti-Stokes) side of the excitation line and thus does not interfere with fluorescence but it is technically quite demanding [57]. SERRS can be applied when the target molecules is immobilized on nanostructured plasmonic metals like Ag or Au [58,59]. Thus, the RR scattering is enhanced by several orders of magnitude due to the coupling of the surface plasmons with the radiation field, and due to a manifold of decay channels for the excitation energy in the metal fluorescence is efficiently quenched. Serious drawbacks, however, are possible adsorption-induced and photoinduced degradations of the immobilized proteins. In fact, the first results by CARS and SERRS were not very promising, [60,61,62] such that both approaches were not employed anymore in further studies.
In contrast, femtosecond (fs) stimulated Raman scattering (FSRS), which requires like CARS a highly complex experimental set-up, is a technique with a strong future potential [63,64,65]. In FSRS, a picosecond (ps) probe pulse that controls the spectral resolution is combined with a spectrally broad fs pump pulse governing the time resolution to generate a stimulated Raman spectrum. For studying a protein-bound chromophore, the probe pulse is tuned in resonance with its electronic transition. Then, FSRS selectively probes the chromophore and, due to the coherent character of the stimulated Raman scattering, interference by fluorescence can easily be avoided. As the most intriguing advantage, however, the transform limit can be overcome. Thus, it is possible to probe ultrafast processes upon temporal correlation of the FSRS pulses with an additional fs photolysis pulse that initiates the reaction of interest [63].
The RR techniques described to far were designed to establish resonance conditions with an electronic transition of the tetrapyrrole chromophore. Qualitatively different information can be obtained when the excitation line is shifted to the UV spectral region in resonance with the electronic transitions of the aromatic amino acid residues of the protein [66]. UV-RR spectroscopy probes the intramolecular interactions of Trp and Tyr but its application of phytochrome suffers from the large number of these amino acids which makes the interpretation of possible changes very difficult [67,68].
In contrast to IR spectroscopy, which is restricted to (frozen) solutions of phytochrome, RR spectroscopy can also be applied to phytochrome crystals. Such experiments were carried out with low-energy NIR excitation (1064 nm) to avoid photodestruction [69,70,71]. Thus, it was possible to obtain vibrational spectra from the state of the phytochrome sample for which a crystallographic analysis has yielded a three-dimensional (3D) structural model. This is particularly advantageous when Raman spectra of the chromophore are evaluated by quantum-mechanical/molecular mechanics (QM/MM) calculations that are based on the crystal structure (vide infra) [70].
2.3. Spectra interpretation
In addition to experimental obstacles, interpretation of the vibrational spectra represents an enormous challenge. IR difference spectra are typically dominated by signals of the amide I and II modes of the protein and the localized C=O stretching modes of the tetrapyrrole substituents. In some cases, the distinction between protein and chromophore bands was not unambiguous a priori, but could be clarified by isotopic labelling [72,73,74]. 13C-labelling of the apoprotein of the bathy phytochrome Agp2 from Agrobacterium fabrum and reconstitution with unlabeled BV chromophore allowed identification of an unusual protonated propionic C=O stretching by ruling out the alternative assignment to a carboxyl amino acid side chain [74]. Agp2 – like other bathy phytochromes – also allowed for sequential H/D exchange of the pyrrole N-H groups [74]. Thus, the C=O stretching modes of rings A and D could be distinguished due to the coupling with the N-H coordinates of the same rings, [74] thereby confirming earlier assignments based on selective 18O-labelling of the ring A C=O group [72].
The greatest problem, however, was initially the vibrational assignment of the RR spectra. Until the first crystal structure determination of a phytochrome, [13] information about the chromophore structure were rather vague. Extraction experiments suggested a ZZZ and ZZE configuration for chromophore in Pr and Pfr, respectively [75]. No direct evidences for the methine bridge conformation were available such that the starting point of normal mode analysis, i.e., the molecular geometry, was poorly defined. Thus, one could not build upon the successful empirical normal mode analyses of cyclic tetrapyrroles, i.e., porphyrins [76,77,78].
Instead, emphasis was laid on the spectral comparison with model compounds (e.g., biliverdin dimethyl ester and related tetrapyrrole derivatives) or tetrapyrrole-binding proteins of known structure, and isotopically labelled tetrapyrroles (PCB and derivatives) assembled with apo-phytochromes [51,70,77,78,79,80,81,82,83,84,85,86,87,88,89,90,91,92,93]. However, due to the high conformational flexibility of linear methine-bridged tetrapyrroles, model compounds could hardly mimic the specific structures of the chromophores in phytochromes stabilized by interactions with surrounding amino acids. Thus, the main benefit of studying model compound was their use as test and training molecules for developing theoretical approaches to calculate vibrational spectra, from semi-empirical to quantum chemical methods [48,50,80,82,83,84,85,91,95,96,97,98].
Among them, density functional theory (DFT) calculations were the best compromise between computational costs and accuracy. Applying appropriate scaling procedures, the frequency error could be reduced to less than ±15 cm−1 [18,95]. Nevertheless, the inevitable drawbacks were the specific van-der-Waals and electrostatic interactions with the protein which affect the structural and electronic properties of the chromophore in a way that could not be mimicked by calculation of the molecule in vacuo. This problem was eventually solved with the development of QM/MM techniques, specifically when combined with molecular dynamics (MD) simulations [99,100,101]. Here the segment of interest, i.e., the chromophore and possibly nearby amino acids, are treated quantum-mechanically whereas for the remainder of the protein an empirical force field is used. QM/MM requires a reliable 3D structure as the starting point and was successfully applied to tetrapyrrole-binding proteins and eventually to phytochromes by the Mroginski group [70,102,103,104].
A good reproduction of the RR spectra by the QM/MM calculations can serve as a criterion for the quality of the 3D structure model, not only as far as the chromophore itself is concerned but also with respect to the protonation pattern of the amino acids adjacent to the chromophore, [105] which is not accessible by protein crystallography. The spectroscopic-theoretical characterization of a reference state, typically one of the parent states, may then constitute the starting point for the analyses of those states for which, due to the lack of experimentally determined structures, only tentative 3D models are suggested. Here the comparison between calculated and experimental RR spectra then guides the refinement of the model. In addition, with an increasing data set, for instance derived from snapshots of a MD simulation, structure-spectra relationships can be obtained that allow for estimating geometrical parameters of the tetrapyrrole even without extensive calculations [104,106].
3. Photoinduced reaction mechanism and chromophore structural changes
The reaction sequence of the photoconversions of phytochromes has been first determined on the basis of transient or low-temperature UV-vis absorption spectroscopy [107,108]. The various species are thus distinguished according to differences in the electronic transitions of the chromophore. The resultant scheme seems to be valid for all prokaryotic and eukaryotic phytochromes (Figure 1E).
3.1. Parent states
Due to the difficulties described in Section 2.3., determination of the chromophore structure in the parent states based on the RR spectra yielded only partially correct results. Fodor et al. suggest a Z configuration and syn conformation (Zs) for the C-D methine bridge in Pr which was assumed to be converted to E and anti (Ea) in Pfr.[48] Extending the QCFF/π calculations to the Lumi-R spectrum these authors concluded that the C-D undergoes a Z→E photoisomerization in Pr, followed by thermal syn→anti isomerization in the subsequent relaxation to Pfr [53]. Based on DFT calculations, Hildebrandt and Mroginski suggested instead a ZZZasa configuration for Pr, and a ZZEasa and ZZEssa configuration for Lumi-R and Pfr, respectively [50,96,98]. The first crystal structures then demonstrated that chromophore of Pfr was correctly predicted (ZZEssa),[14,16] in contrast to Pr for which a ZZZssa configuration was found, [13] differing by the conformation of a methine bridge single bond proposed in the spectroscopic studies [48,50].
Representative spectra of the parent states of prototypical and bathy phytochromes are shown in Figure 2.
They include several marker bands that are characteristic of specific structural parameters. Of particular interest is the protonation state. In this respect, there was a general agreement already in early RR spectroscopic studies that Pr and Pfr include a chromophore with all pyrrole nitrogens carrying a proton (cationic chromophore) [47,48,50]. The cationic protonation state is reflected by a band between 1580 and 1545 cm−1 that originates from a largely pure N-H in-plane bending (NH ip) mode of the rings B and C [50]. Its frequency seems to increase with increasing hydrogen-bond strength [70]. Further marker bands refer to the chromophore torsion. Mathies et al. pointed out that the bands in the region between 780 and 840 cm−1, which are mainly due to hydrogen-out-of-plane (HOOP) modes of the methine bridges, gain RR intensity in case of torsions around the respective double bonds. Correspondingly, the Pfr chromophore with an extraordinarily intense HOOP mode at ca. 820 cm−1 was concluded to exhibit a highly distorted C-D methine bridge [48].
In addition, a later combined experimental-theoretical study of Pfr demonstrated that the frequency of the C-D HOOP mode is inversely correlated with the torsional angle of the methine double bond whereas the C=C stretching frequency of the C-D methine bridge (CD) increases with the torsional angle of the C-D single bond [104]. Similar correlations were derived from the analysis of the Pr spectra [106].
The parent states of a large number of eukaryotic and prokaryotic phytochromes were systematically studied by RR spectroscopy. Notable differences were only noted when comparing prototypical and bathy phytochromes. In Pfr of prototypical phytochromes, the chromophore displays a temperature-dependent conformational equilibrium with two conformers differing with respect to the structures of the C-D and the A-B methine bridges. This is reflected by two band components of the C-D HOOP and the A-B stretching modes (Figure 2) [87,104]. In contrast, such a structural heterogeneity does not exist in the Pfr state of Agp2, which appears to be a common property of all bathy phytochromes and may reflect the high thermal stability of this state [74,104,110]. A second unique feature, only observed in the Pfr state of bathy but not of prototypical phytochromes, is the sequential H/D exchange of the pyrrole N-H groups which occurs instantaneously for the rings A, B, and C, but requires many hours for ring D, presumably due to the tight salt bridge with the side chain of the highly conserved Asp196 [71]. Accordingly, an immediate H/D exchange also at ring D only takes place after photoisomerization of the chromophore which destroys the salt bridge [74,110]. The third characteristic property of bathy phytochromes is the propionic side chain of ring C which in Pfr remains protonated even up to a pH of 11. Interestingly, the C=O stretching of the protonated side chain is even detectable in the RR spectrum. This suggests that the underlying C=O bond length varies slightly in the electronically excited state of the chromophore [43] .These three structural properties that are readily identified by RR spectroscopy do not hold for the bathy-like phytochrome XccBphP from Xanthomonas campestris pv. Campestris, in which the Pfr state prevails at ambient temperature [111]. Here, only the sequential H/D exchange is observed in the Pfr state whereas the chromophore exhibits a heterogeneous structure and its propionic side chain is deprotonated [109].
The Pr state of bathy phytochromes has been characterized by RR spectroscopy only in the case of Agp2. Here, the chromophore was shown to form a keto-enol equilibrium which upon protonation of the nearby His278 in the last step of the Pfr → Pr photoconversion generates a “reactive” enol tautomer for the thermal back isomerization [74]. The RR spectrum of the enol tautomer can easily be confused with a deprotonated tetrapyrrole [112]. The unambiguous identification requires the additional IR spectroscopic analysis to confirm the disappearance of the ring D carbonyl function [74].
In most prototypical phytochromes, Pr is not a structurally homogeneous state, in analogy to Pfr. The analysis of the Pr state of Cph1Δ2 by RR spectroscopy indicated that the red absorption band and its shoulder are due to a vibronic transition of a single species [113]. However, the ground state heterogeneity of Pr, also in case of Cph1Δ2, is due to more subtle structural differences that do not affect the electronic transitions to a detectable extent. Such differences include, as in Pfr, the C-D and specifically the A-B methine bridge as reflected by the pairwise appearance of the same mode (e.g., A-B stretching, Figure 2) [105,109,114]. In addition, a recent 2D IR study on DrBphP (Deinococcus radiodurans) reveals a heterogeneity in the hydrogen bonding environment of the ring C=O group [115].
In the Pr state of Cph1Δ2, heterogeneity is associated with different protonation states of the nearby His residues (His260, His290) [116]. The transition between these states, which exhibit different RR signatures, occurs between pH 7 and 8. Thus, in most studies two conformers are present. Interestingly, Pr crystals of Cph1Δ2, used for the X-ray structure analysis, [17] were generated from a protein solution buffered below pH 6 and thus include only one conformer, as demonstrated by the RR spectroscopic comparison of Cph1Δ2 crystals and solution [70]. Nevertheless, phytochromes may also display a structural heterogeneity in the crystalline state. A RR spectroscopy study on DrBphP and Agp1 revealed that slightly different conformers of the chromophore may coexist in crystals of the respective Pr states [69].
In terms of the chromophore structure, the parent states are largely robust towards amino acid substitutions in the chromophore binding pocket [52,74,104,114,117,118,119,120,121,122]. In general, frequency shifts compared to the respective wild-type (WT) spectra are less than 3 cm−1. This is also true for the variants in which the substitution impairs the complete photoconversion between the parent states.
The consequences of the domain composition for the RR spectra cannot be generalized except for the comparison between the photosensor module and the full-length protein. In these cases, no spectral differences have been detected for plant and bacterial phytochromes [50,74,123]. Truncation of the photosensor module (PAS-GAF-PHY – PGP) to the PAS-GAF (PG) construct in prototypical bacteriophytochromes, which usually abolishes photoconversion to Pfr, has similarly small effects on the RR spectra of Pr as single-point substitutions, typically restricted to torsional, deformation, and HOOP modes (vide supra) [69,114,118]. In plant phytochromes, however, the spectral differences between PGP and PG are larger and include the vibrational modes in the entire spectral range. This is also true for the Pfr or Pfr-like states which are formed by irradiation of Pr [124]. Somewhat less spectral changes in Pr but a similar perturbed photostate were observed for the tryptic 39-kDa fragment of phyA which lacks the PHY domain and the N-terminal extension (NTE) [125]. Solely cutting the NTE of the photosensor module of phyB (PGP) mainly perturbs the conformational equilibrium in Pfr as reflected by the altered intensity distribution between the conjugate HOOP modes [124,126].
Vibrational spectroscopy has also been extended to plant and cyanobacterial phytochrome adducts with non-native tetrapyrrole chromophores [11,82,86,87,104,106,127]. It was shown that PCB and PΦB could readily be exchanged without significant perturbations of the chromophore structures [3]. In bacterial phytochromes, the chromophore binding site is located in the PAS domain where only BV can be bound [128]. Upon appropriate amino acid substitutions, however, chromophore binding site can be shifted to the GAF domain as in plant phytochromes and now only PCB or PΦB is covalently attached [129]. The respective RR spectra of the parent states are very similar as the corresponding adducts of plant phytochromes indicating the interactions in the new chromophore binding pocket do not impose strongly modified electrostatic or steric constraints on the tetrapyrrole conformation [87]. Conversely, covalent attachment does not appear to be critical to stabilize a specific chromophore structure, at least in case of BV at the natural binding site of bacterial phytochromes in the PAS domain. When the binding Cys20 is exchanged against an Ala, the resultant RR spectra of Pfr only show a slight shift of the equilibrium of the conformational sub-states as reflected by an altered intensity distribution of the A-B stretching modes [104].
Whereas PCB and PΦB are expected to interact in a similar way with the surrounding amino acids in the chromophore binding pocket, the chromophore-protein interactions are qualitatively different when the propionic side chains are esterified [130]. Incorporation of BV derivatives carrying a free and an esterified (methyl) propionic side chain have a different effect on the parent state structures in prototypical Agp1 and bathy Agp2. In Agp1, the RR spectra display a similar vibrational band pattern as the wild-type (WT) protein with minor differences in frequencies and relative intensities. Only a few bands due to tetrapyrrole torsion and N-H in-plane modes show frequency shifts of nearly 10 cm−1. In Agp2, this observation also holds for Pfr whereas for Pr the main effect is the complete shift of the tautomeric equilibrium towards the enolic form.
Altogether, the large body of experimental data indicate that the chromophore structures in the parent states of eukaryotic and prokaryotic phytochromes are very similar as judged from the RR spectra. Considering the intrinsic spectral differences due to the different type of tetrapyrroles (PΦB, PCB, or BV), frequencies differences between the same states rarely exceed 15 cm−1 and 15% in relative intensities, regardless of the origin of the phytochrome, single or multiple amino acid substitutions, or domain compositions. As an instructive example we refer to the highly homologous bacterial phytochromes Agp1 and DrBphP [104,131]. The differences in the HOOP and C-D stretching mode frequencies in the RR spectra of the Pfr state are 15 and 9 cm−1, respectively. In contrast, the fungal phytochrome FphAN753 from Aspergillus nidulans displays a RR spectrum that is nearly identical to that of Agp1 with only subtle frequency shifts of 1 – 2 cm−1 for the HOOP and C-D stretching modes.
In this context it is instructive to illustrate the sensitivity of the RR spectra towards structural changes. For instance, a frequency shift of the C-D stretching mode of 10 cm−1, which in RR spectroscopy is considered to be a large spectral change, corresponds to an increase or decrease of the C-D methine bridge tilt angle by only ca. 6o. Such a geometrical change of the chromophore is typically beyond the detection limit even of well-resolved X-ray structures [106]. However, it should be noted that those structure-frequency correlations discussed in this section only exist for a small number of modes which are, in general, highly localized in a specific internal coordinate.
3.2. First events of the photoconversion
Photoexcitation of Pr or Pfr leads to the double bond isomerization at the C-D methine bridge [132]. Early transient absorption and fluorescence studies of Pr indicated that the first ground state intermediate, Lumi-R, is formed between 30 and 60 ps [108,133,134]. This intermediate of plant phytochrome phyA was cryogenically trapped and characterized by SERDS spectroscopy demonstrating that a thermal activation is required for its formation [53]. The results were later confirmed by cryogenic RR spectroscopy, [50] thereby correcting an earlier RR spectroscopic analysis by the same group [135]. RR spectroscopy was further extended to the Lumi-R photoproducts in other phytochromes, revealing remarkable differences between the various species [136].
The most detailed vibrational spectroscopic studies have been carried out with Cph1Δ2 using FSRS and ultrafast transient IR absorption spectroscopy. These techniques allow monitoring the early events after photoexcitation up to the formation of the Lumi states. The Mathies group employed FSRS to focus on the photoinduced processes of the Pr states [64,65]. After 100 fs the spectrum shows the signature of the electronically excited state of Pr (Franck Condon state) (Figure 3) with the HOOP, NH ip, and the methine bridge C=C stretching modes downshifted with respect to the ground state of Pr. This state decays with 200 fs but the development of the vibrational signature is partially obscured by the signals of a nonlinear effect RINE (Raman induced by nonlinear emission). At ca. 600 fs an excited state intermediate I* is formed in which the HOOP mode is still very intense but significantly upshifted compared to the Franck-Condon state. This intermediate decays to the electronic ground state either returning to Pr (85%) or to Lumi-R (15%) within 40 ps. The spectrum of the latter is similar albeit not identical to the first intermediate that could be trapped in cryogenic RR spectroscopy (200 K) [136].
This state decays with 200 fs but the development of the vibrational signature is partially obscured by the signals of a nonlinear effect RINE (Raman induced by nonlinear emission). At ca. 600 fs an excited state intermediate I* is formed in which the HOOP mode is still very intense but significantly upshifted compared to the Franck-Condon state. This intermediate decays to the electronic ground state either returning to Pr (85%) or to Lumi-R (15%) within 40 ps. The spectrum of the latter is similar albeit not identical to the first intermediate that could be trapped in cryogenic RR spectroscopy (200 K) [136].
Experiments by the Heyne group provided complementary information by transient IR spectroscopy monitoring the C=O stretching modes including their polarization-resolved spectral changes [41]. Rotation of the C-D methine takes place in the electronically excited Pr state which then decays to Lumi-R with a time constant of ca. 30 ps, thus similar to that derived from FSRS [64]. An excited state intermediate I* was not detected [41].
Additional evidence for this intermediate, however, was obtained from multi-pulse transient IR spectroscopic experiments in which, in addition to the visible pump and IR probe pulses, also an extra visible dump pulse was applied to recover excited states [38,137]. In this study, the IR probe pulse covered a wide spectral range from the C=O to the C=C stretching region. The data were then treated by a global analysis on the basis of different reaction models. The most plausible interpretation was an extension of the scheme derived from the FSRS experiments, [64] as the unproductive excited state decay via I* leads first to the ground state of this intermediate which then relaxes to Pr [137].
Further time-resolved IR spectroscopic measurements were carried out with bacterial phytochromes Agp1, RpBphP2 and RpBphP3 from Rhodopseudomonas palustris. SaBphP1 from Stigmatella aurantiaca, and DrBphP, including engineered variants [39,40,138,139]. Schuhmann et al. analysed the photoinduced temporal evolution of the IR absorption of the C=O modes in the Pr state of Agp1 from 300 fs to 100 ps [39]. The authors proposed a scheme similar to described above for Cph1Δ2 (vide supra). A related approach but also including polarization-resolved experiments was applied to Agp1 carrying the natural BV chromophore and a locked BV derivative that could not undergo a photoisomerization [138]. The comparative analysis of the photoactive and photoinactive adducts helped sorting out excited state processes in Pr and the photochemical reaction to Lumi-R. In a study on the photoprocesses of Pr of two related bacteriophytochromes it was found that in RpBphP2 the excited state of BV decayed within ca. 60 ps whereas for RpBphP3 a much slower decay of ca. 360 ps was observed [40]. This difference was attributed to a stronger hydrogen bond of ring D in the Pr ground state of RpBphP3, raising the energy barrier for the rotation of the C-D double bond. A similar conclusion, i.e the control of the photochemical conversion efficiency by different strength of hydrogen bonding interactions, was drawn from a comparative study of SaBphP1 and DrBphP variants [139]. Kübel et al. analysed the changes of the C=O stretching modes during the Pr→Pfr transformation in DrBphP in terms of two Lumi-R intermediates [42]. In their time-resolved IR spectroscopic study, the authors concluded that Tyr263 plays a critical role in controlling the transition from the early to the late Lumi-R.
Ultrafast vibrational spectroscopy was employed to study the photoreactions of Pfr of Cph1Δ2, Agp1, and Agp2 [43,52,140,141,142,143]. In general, it was found that the formation of the first ground state product Lumi-F occurred much faster than the corresponding reaction of Pr (vide supra), with 1.6 ps in Agp1 and 0.7 ps in Cph1Δ2. In the latter case, both ultrafast IR and FRSR were combined to achieve a comprehensive description of the reaction dynamics up to the formation of Lumi-F. Agp2 is a special case since here a transient proton transfer upon electronic excitation was detected [43]. While this step, which is ascribed to the deprotonation of ring C or D and the formation of a nearby protonated water cluster, is reversed with the decay of the excited state, a reorganization the hydrogen bonding network in the vicinity of the isomerization site develops upon further proceeding along the reaction coordinate.
As the main advantage over other optical techniques, ultrafast FSRS and transient IR absorption spectroscopy provide information about the reaction and structural dynamics after photoexcitation. However, extraction of this information relies upon a sound assignment of the vibrational modes which – as discussed in Section 2.3. – is difficult even for the stable states and certainly a major challenge for states of the chromophore that is not even in a (local) energetic minimum along the reaction coordinate. A few signals in both the FSRS and the transient IR spectra, however, correspond to highly localized modes such that the Raman band at ca. 800 cm−1 and the IR bands between 1690 and 1740 cm−1, attributable to the HOOP mode of the C-D methine bridges and the C=O stretching modes of rings A and D, respectively. In combination with the polarization changes of the C=O stretching modes, the series of time-resolved Raman and IR spectra can then be plausibly interpreted in terms of a rotation of C-D methine bridge and ring D, accompanied by an exchange of the hydrogen bonding partner of the ring D C=O substituent [40,64,137,141,142].
Spectral changes in the C=C stretching region are more difficult to interpret since the normal mode composition is likely to be altered upon photoexcitation compared to the stable reference state. Thus, the wealth of difference signals in this region and their temporal evolution, as for instance shown in the multipulse-IR spectra of van Wilderen et al., [137] yet requires a reliable approach for the translation into structural data.
Finally, it is interesting to compare the ultrafast time-resolved data with those obtained by cryogenic IR and RR spectroscopy [28,30,50,53,74,121,127,136,144]. A detailed RR spectroscopic study on various phytochromes revealed two Lumi-R states, Lumi-R1 and Lumi-R2, that are presumably formed sequentially. This conclusion is in line the time-resolved IR spectroscopic experiments by Kübel et al. [42]. The two Lumi-R states appear to be a common mechanistic property of all phytochromes, but could not be trapped for each species in a pure form [136]. In general, compared to Pr, the frequency of the C-D HOOP mode is upshifted in Lumi-R1 but this shift is reversed in Lumi-R2. The C-D stretching mode shows the opposite tendency since it displays a distinct downshift in Lumi-R1 which is reversed albeit only partially in Lumi-R2. The A-B stretching remains largely unchanged. These spectral changes reflect the structural relaxation of the C-D methine bridge whereas the remainder of the chromophore is only slightly affected. According to these general tendencies, one may attribute the state measured by FSRS of Cph1Δ2 at 40 ps to Lumi-R1, which could not be enriched at temperatures typically used for trapping Lumi-R1 in other phytochromes (i.e., ca. 100 – 130 K). In Cph1Δ2 the first photoproduct that be by cryotrapped required higher temperatures (200 K) and was identified as Lumi-R2 state. The failure to trap a Lumi-R1 species at lower temperatures in Cph1Δ2, also reported in the IR study by Förstendorf et al. [28], point to a low energy barrier for the transition from Lumi-R1 to Lumi-R2 [136]. Conversely, in phyA Lumi-R1 is readily trapped at ca. 130 K [136], and the corresponding IR spectra show a distinct upshift of the ring D C=O stretching [30,127], in line with the results by time-resolved IR spectroscopy of Cph1Δ2 at 50 ps [41]. Altogether, there seems to be a good correspondence between the time-resolved IR and FSRS spectra measured up to delays of tenths of ps and the cryogenic IR and RR spectra on the basis of early and late photoproducts Lumi-R1 and Lumi-R2.
An early and a late Lumi-F could not be directly distinguished in the photoconversion of Pfr. However, on the basis of selective H/D exchange effects on the RR spectra, it was shown that only at elevated temperatures but prior to the thermal decay to Meta-F, Lumi-F of bathy phytochromes undergoes a photochemical backreaction to a Pfr-like state (Pfr`) that eventually decays to Pfr [74,136]. This branching was not observed at lower temperatures which suggests either a thermally activated photochemical reaction sequence back to Pfr or two Lumi-F states with different photochemical reactivities.
3.3. Late events of the photoconversion
Whereas the conformational relaxations in the Lumi states are restricted to the chromophore and the directly interacting amino acids, the subsequent thermal reaction steps include the protein on different levels of the structural hierarchy. Here, there are also notable differences in the reaction mechanism between Pr → Pfr and Pfr → Pr photoconversions as well as between prototypical and bathy phytochromes. The sequence of the cryo-trapped intermediates following Lumi-R are Meta-Ra, Meta-Rc, and Pfr for the Pr → Pfr photoconversion of both prototypical and bathy phytochromes. The RR spectroscopic characterization of Meta-Ra in all phytochromes studied so far revealed a protonated chromophore and low HOOP activities, corresponding a sterically relaxed methine bridges [50,109,121,136]. The frequency of the C-D stretching mode is upshifted compared to the Lumi-R states and is again close or even higher than that of Pr. The subsequent intermediate is Meta-Rc in which either ring B or ring C is deprotonated. Chromophore deprotonation has originally been proposed on the basis of RR spectra excited in resonance with the second electronic transition [55,56]. This conclusion was initially questioned by the Hildebrandt group [50], but later confirmed for plant as well as bacterial phytochromes [51,69,109,117,118,136]. The release of the proton from chromophore is linked to the transfer of a proton to the solution phase as shown for Agp1 and Cph1Δ2 [51,116,117]. This proton translocation is reversible and the chromophore is reprotonated with the formation of Pfr. However, the postulated intermediate with a reprotonated chromophore preceding Pfr has been trapped and RR spectroscopically characterized only in one case of a plant phytochrome variant [124].
Protonation state changes of the chromophore are more difficult to identify in the IR difference spectra since the characteristic bands of the NH ip bending modes are expected in spectrally rather cogent regions including difference signals from the protein [28,72,73,127,144]. Although distinguishing between protein and chromophore bands was facilitated by using isotopically labelled chromophores [73,127], an unambiguous assignment of the protonation marker bands in the IR difference spectra was not possible. However, in all studies it was consistently observed that the main protein structural changes occur in the last step of the photoconversion [28,30,127,144]. After the photoinduced changes of the protein´s secondary structure were identified by X-ray crystallography [145], the signals in the amide I band region of the IR differences spectra could readily be assigned to the tongue segment of the PHY domain [52,74,130,146].
On the basis of the vibrational assignments, time-resolved IR spectroscopy provides an excellent tool to elucidate structural and reaction dynamics of phytochomes [35,42,44,139,147]. Using the step-scan technique, Kottke and colleagues probed the spectral changes of the Pr→Pfr photoconversion in DrBphP PGP monomers [147]. Representative spectra in Figure 4 show the characteristic features of Lumi-R, Meta-Ra, and Pfr at 77 μs, 1.46 ms, > 5 ms, respectively. The temporal evolution of the corresponding species-associated difference spectra agrees very well with the data obtained from flash-photolysis experiment in the visible range.
3.4. Thermal back reactions
The parent states Pr and Pfr are linked via both photochemical and thermal reaction pathways. Little is known about the thermal route since the first steps must be associated with high energy barriers, i.e., the double bond isomerization and the secondary structure transition of the tongue. Thus, the subsequent reaction steps are likely to be much faster which can explain why the identification of intermediates failed. A key requirement for the thermal isomerisation, as postulated by Lagarias and Rapoport [148], is the transient formation of an enolic structure of the chromophore, which may lead to an alternation of the double and single bonds at the C-D methine bridge. In fact, such a structure has IR and RR spectroscopically only been identified for the Pr state of the bathy phytochrome Agp2 [74]. In that protein, the enolic structure requires specific interactions with the protonated His278 as originally proposed by Velasquez et al. [74] and further refined by Lopez et al. [109]. Up to now, no enolic tautomer was detected in any other phytochrome state. This may be due to the low RR scattering cross section upon excitation in resonance with the first electronic transition and the low steady state concentration of a reactive tautomer.
Recently, time-resolved RR and IR spectroscopy revealed that the Meta-F and Meta-Rc states of Agp2 and Agp1 are also capable to undergo a thermal back reaction [149,150]. This branching mechanism appears to a general property of all phytochromes and represents a shortcut for the photoconversion, corresponding to the recovery of the parent state without inducing the functionally important structure transition of the tongue. In Agp2, the ratio between the unproductive (Meta-F→Pfr) and productive (Meta-F→Pr→Pfr) branch is ca. 1:1.
4. Coupling of chromophore and protein structural changes
Protein structural changes follow the photoinduced chromophore structural changes sequentially on different levels of hierarchy. First, during the life time of the Lumi states (vide supra), there are low-amplitude re-reorientations of the amino acid side chains and water molecules at isomerization site. These events are followed by the conformational relaxation of the chromophore and the concomitant structural adaptation of the chromophore binding pocket in the Meta states, exemplarily illustrated in a combined crystallographic and spectroscopic study on an Agp2 variant [71]. The Meta states represent crucial intermediates since they are the starting points for the cascade of major structural changes of the protein that transmit the light signal to the output module far away from the chromophore. The first step is the secondary structure transition of the tongue in the PHY domain.
4.1. Proton transfer and tongue restructuring
A systematic RR and IR spectroscopic study was carried out on Agp2 to identify the parameters that control the transition of the tongue from α-helix to β-sheet during the reaction step from Meta-F to the final product Pr [52]. It was shown that this process requires the deprotonation of the propC side chain. In WT Agp2, this proton transfer occurs from propC to His278, but this residue can also be replaced by another proton acceptor [74]. The results obtained from various variants indicate a distinct relationship between the amplitude of the amide I signals, reflecting the extent of secondary structure changes, and the degree of deprotonation of propC, which in turn is related to its pKa (Figure 5) [52]. Whereas the α-helix to β-sheet conversion in Agp2 and other bathy phytochromes evidently requires a proton translocation inside the chromophore binding pocket [52,109], the reverse reaction from Pr to Pfr including β-sheet to α-helix conversion is coupled to the reversible deprotonation of the pyrrole ring B or C and leads to the transport of a proton to the solution phase [51,116,151]. This process starts with the formation of the Meta-Rc intermediate and reprotonation occurs with the Meta-Rc decay. The reversible deprotonation of the pyrrole rings was observed in both prototypical and bathy phytochromes [109]. A proton translocation was not yet identified in the rarely studied Pfr-to-Pr conversion of prototypical phytochromes.
Nevertheless, these finding described above suggest that coupling of the photoinduced chromophore structural changes with the secondary structure conversion of the tongue is mediated by a proton transfer either within the chromophore binding pocket or between the chromophore and the solution. Generally, proton transfer processes correspond to an alteration of the internal charge distribution and thus to changes of the electrostatics, which hence was suggested to be the driving force for the secondary structure transition [52]. In fact, this hypothesis is consistent with theoretical calculations on model peptides demonstrating that electric field strengths of 108 – 109 V/m, which may locally exist in proteins [152], can readily cause the transformation from a β-sheet to an α-helix structure [153].
4.2. Electric field effects
A well-established approach to determine electric fields in protein is based on the vibrational Stark effect (VSE), pioneered in theory and practice by the Boxer group [152]. The VSE refers to the effect of a strong electric field on a vibrational transition, resulting in a shift of the frequency compared to the absence of the electric field. The VSE is particularly large for localized modes such as the stretchings of C=O and C≡N groups and can be probed by IR spectroscopy. The nitrile group offers the additional advantage that its stretching mode appears in spectral range free of any other bands of the protein such that it is an ideal VSE reporter group to be inserted into proteins [154]. A drawback, however, is the sensitivity of its stretching frequency to hydrogen bonding interactions which counteracts the VSE and thus makes the interpretation of the experimental data rather difficult [152,155,156]. Nitrile groups can be site-specifically incorporated into proteins either by chemical modifications of cysteine side chains [157], or by introducing non-natural amino acids with a nitrile function via re-programming of the genetic code [158,159].
Kraskov et al. employed the latter approach in Agp2 to substitute Tyr165 and Phe192 by para-cyano-phenylalanine (pCNF) [122]. Both amino acids are close to the chromophore and not far from (Phe192) or even directly involved in the proton transfer pathway (Tyr165). The RR, IR, and UV-vis absorption spectroscopic characterization of the two variants revealed far-reaching similarities with the WT protein, including deprotonation of propC and secondary structure conversion of the tongue in the final step of the Pfr→Pr conversion. Thus, it was concluded that the VSE reporter group was not invasive and did not perturb the chromophore and protein structure in F192pCNF and Y165pCNF. As demonstatred by modelling the structures, the two variants represent two limiting cases of a nitrile group in a completely hydrophobic environment (F192pCNF) and involved in strong hydrogen-bonding interactions (Y165pCNF), which is reflected by characteristic frequencies below and above ca. 2235 cm−1, respectively [155].
IR spectra in the nitrile stretching region were measured for Lumi-F, Meta-F, and Pr and thus at different temperatures (Figure 6) [122]. To account for the inherent temperature dependence of the nitrile stretching frequency, in each case, the dark spectrum was measured as well at the same temperature as a reference. For the non-hydrogen-bonded nitrile in F192pCNF, the largest change in frequency (compared to Pfr) was observed in Pr, thus after the proton transfer and restructuring of the tongue. This is also true Y165pCNF although in that case there is also a quite remarkable frequency shift in Lumi-F.
Assuming the theoretical value for the Stark tuning rate that relates the frequency shift with the electric field [152], one may estimate the change of the local electric field in Pr with respect to Pfr experienced by the nitrile probe. For F192pCNF one obtains a value of ca. 6 (), and a similar value (ca. 7 ) is estimated for Y165pCNF assuming that the hydrogen bonding interactions of the nitrile group are the same in Pr and Pfr. This in fact the order of magnitude predicted to be capable of inducing secondary structure transitions of peptide segments. However, it should be considered that these data refer to the local electric field at the reporter groups and do not allow estimating the relevant electric field changes along the α-helical axis of the tongue [153]. Nevertheless, the reported results are important since they show that such large changes of the electric field may occur in the protein.
In this context it is interesting to refer to the time-resolved IR spectroscopic study by Kurttila et al. who introduced para-azidophenylalanine at different positions in DrBphP [160]. The frequencies of the azide stretching modes cannot be directly related to the electric fields but may be considered as qualitative measures for the polarity of the surrounding [154,161]. Nevertheless, the downshifts of the azide stretching modes, which were found for DrBphP, point to an increased polarity [160]. These shifts were observed in the last step of the Pr → Pfr photoconversion and also noted for azide groups at amino acid positions analogous to Phe192 and Tyr165 in Agp2 as well as for a position in the tongue region, and thus corroborating the findings and hypothesis by Kraskov et al. [122].
Furthermore, the importance of intramolecular electrostatic fields for the protein structural changes was also demonstrated by RR and IR spectroscopic studies of Agp1 and Agp2 harboring a BV monomethylester [130]. In these experiments it was shown that both Agp1 and Agp2 require a free propC side chain to undergo photoconversion. However, whereas in Agp2 deprotonation of propC takes place as in the WT protein (vide supra), the tongue remains in its α-helical structure despite the proton transfer. Evidently, proton transfer alone is not sufficient to trigger the secondary structure changes of the tongue, but it requires an appropriate overall electrostatics, which in this case was severely disturbed by esterification of propB [130]. Conversely, the charge neutralization at propB does not impair the β-sheet to α-helix conversion in Pfr of Agp1, but the thermal recovery of Pr is even accelerated. These findings suggest different mechanisms of the photoinduced protein structural changes in the Pfr→Pr and Pr→Pfr conversion of bathy and prototypical phytochromes, respectively. Possibly, in the latter case, the secondary structure changes of the tongue is stabilized by dipole-dipole interactions between the ring D C=O and the α-helical tongue conformation as shown by a recent 2D-IR spectroscopic study on Agp1 [45].
Altogether, the investigation of electrostatic effects on the coupling between chromophore and protein structural changes requires further comprehensive experimental and theoretical investigations. Despite the importance of such effects, it is most likely an oversimplification to consider electric field changes as the only basis of structural communication within the protein [109].
4.3. Protein-protein interactions
Phytochromes form dimers and one may intuitively think that upon photoexcitation both monomers act in parallel leading to a symmetric activated state. However, it has been recently argued that Idiomarina sp. A28L bacteriophytochrome (IsPadC), including a diguanylyl cyclase output module, is physiologically active in an asymmetric structural quaternary structure [162]. In a study combining crystallography, mass spectrometry, and RR spectroscopy it was in fact shown upon light absorption an equilibrium between a Pfr and Pfr-like state is formed [163]. The Pfr-like state combines features of the Pfr and Meta-R states as revealed by RR spectroscopy. This state is stabilized by a specific rearrangement of the N-terminal segment. In this way, the PHY-tongue conformation of IsPadC is partially uncoupled from the initial changes in the N-terminal segment and this uncoupling allows signal transduction to the covalently linked output module.
5. Cyanobacteriochromes
Like canonical phytochromes, CBCRs are composed of a photosensor and an enzymatic output module. These phytochrome-like photoreceptors frequently catalyze the production or degradation of cyclic dinucleotides [6]. CBCRs are mainly found in cyanobacteria and carry phycoviolobilin (PVB) or, in most cases, PCB as the chromophore, attached to a Cys in the GAF domain of the photosensor module. This module lacks the PHY and PAS domain but may include one or several GAF domains. The chromophores in the parental states of the photoswitch are usually in the ZZZssa and ZZEssa configuration.
Among the simplest CBCR are SyA-Cph1 and SyB-Cph1 from Synechocystis PCC 6803 (PAS-GAF) which undergo the classical Pr/Pfr photoconversion as shown by UV-vis absorption and RR spectroscopy [164]. Nevertheless, the chromophore geometries are slightly different compared to the related Cph1Δ2 (PAS-GAF-PHY; also denoted Syn-Cph1 in that work) as indicated by the shifts in the C-D stretching region of the RR spectrum. Also the photosensory module of Cph2 (SynCph2), including two GAF domains, shows similarly large spectral differences compared to Cph1Δ2 with frequency differences of up to 7 cm−1 in frequency in the C=C stretching and HOOP region [165]. These differences compared to Cph1 may partly be ascribed to a shift of the conformational equilibrium and to structural alterations of the individual conformers.
The most remarkable property of CBCRs, however, is the broad spectral range of absorption maxima of the two parent states, spanning from the near IR to the near UV [166,167]. One example is AnPixJ from Anabaena sp. PCC 7120 [168]. It is a multi-GAF domain CBCR with the second GAF domain carrying the PCB chromophore (AnPixJg2). This CBCR switches from a red-absorbing Pr (648 nm) to a green absorbing Pg (543 nm) [169]. The RR spectroscopic investigation revealed far-reaching similarities of the Pr state with those of canonical phytochromes [169], consistent with the crystal structure data.[168] This is also true for the mechanistic pattern of the photoinduced Pr→Pg reaction pathways. The first two intermediates, Lumi-R and Meta-R1, were found to carry a protonated chromophore whereas the final intermediate Meta-R2, i.e., the precursor of Pg, has a deprotonated chromophore. A very similar scheme was identified for the photoinduced back reaction, implying that the photoinduced conversions in both directions involve a transient chromophore deprotonation, unlike canonical phytochromes [109]. The RR spectra of the Pg state reveals a protonated chromophore [169], which however, was found to be in conflict with MAS-NMR spectroscopy indicating a deprotonated PCB [170]. This contradiction could be resolved in a joint study of the Hildebrandt and Matysik groups who then showed that the in-vitro assembly of the protein, required for producing the isotopically labelled NMR sample, yielded a deprotonated chromophore in the Pg state in contrast to the in-vivo assembly [170], which was used in RR spectroscopic experiments [169], and also in the crystallographic study [168]. Most surprisingly, the chromophore of the in-vitro assembled Pg remained deprotonated in a wide pH range but became protonated when the pH was raised above(!) pH 10 [170]. The most likely explanation is a protein misfolding in the chromophore binding pocket that alters the local electrostatics and thus the pKa of an amino acid side chain close to the chromophore. Upon raising the pH above 10, misfolding was repaired and the chromophore protonated. Regardless of this assembly artefact, the origin of the green absorption was discussed [170]. In comparison with the Pfr state of canonical phytochromes that exhibit the same ZZEssa configuration, the RR spectrum of the Pg state of AnPixJg2 displays a distinctly upshifted C-D stretching frequency which was initially attributed to a change of the polarity of the chromophore´s surrounding,[169] in analogy to the well-known inverse relationship between stretching frequency (in cm−1) and absorption maximum (in nm) established retinal chromophores [171]. However, the high C-D stretching frequency may also reflect an increased torsional angle at this methine bridge which in turn reduces the effective length of the conjugated π-electron system [170]. This explanation seems to be more likely also in view of the findings of Lagarias and coworkers on related CBCRs [172,173].
The same color tuning mechanism seems to hold for Slr1393, a CBCR including three GAF domains isolated from Synechocystis sp. PCC6803 [174]. Slr1393 is a red-green CBCR similar to AnPixJ and also the RR spectra of the Pr states of both CBCRs are closely related (Figure 7) [175]. More differences were observed for the Pg state which exhibits a relatively broad band envelope in the C=C stretching region. On the basis of the crystal structure data [174], QM/MM calculations were carried using 12 snapshots that were taken from different points of a MD production run [175]. The resultant Raman spectra were averaged and provide a good description of the experimental Raman spectra of Pr and Pg (Figure 7, black traces). This is also true for the intermediate state O600 for which the crystal structure analysis revealed a ZZZssa chromophore configuration as Pr, albeit with larger torsions at the A-B and C-D methine bridges [174].
In addition, an β-facial attachment to the protein was suggested. However, a good reproduction of the Raman spectrum could be only achieved with an α-facial attachment (as in Pr) but besides essentially the same chromophore geometry as in the experimental structure (Figure 7) [175]. Temperature-dependent RR and UV-vis absorption spectroscopy revealed a conformational equilibrium between O600 and Pr with the latter prevailing an ambient temperature. Accordingly, the authors described Slr1393 as a light- and temperature-sensitive sensor, although the range with notable temperature-induced color changes (i.e., shift of the Pr/O600 equilibrium) is below 00 C and thus possibly not physiologically relevant. Color tuning in Slr1393 can readily be understood on the basis the length of the conjugated π-electron system which is controlled by the torsion of the methine bridges, specifically the C-D methine bridge. This conclusion, which was derived from the analysis of the electronic transitions [174], was found to be consistent with the RR spectra.
Insight into the dynamics of the photoconversion was obtained by time-resolved IR spectroscopy. Buhrke et al. analysed the photoconversions in both directions and could identify ground state intermediates for the Pr-to-Pg transformation and four species on the reverse photoconversion route [176].
These authors also studied another red-green CBCR Am1-c0023g2 from the cyanobacterium Acarychloris marina by 2D-IR spectroscopy. Using isotopically labelled protein they succeeded to analyse the band shapes of C=O stretching modes of the PCB chromophore which allows for conclusions about changes of the environmental interactions.
In contrast to Slr1393 and AnpixJ, the CBCR TePixJ from Thermosynechococcus elongatus employs another mechanism to shift the electronic transitions to higher energies. TePixJ represents a green-blue photoswitch with absorption maxima at 534 (Pg) and 430 nm (Pb) [177]. Experimental studies using NMR and vibrational spectroscopies demonstrated a PVB chromophore attached via an additional Cys to the protein, thereby reducing the conjugated π-electron system, although the assignment of the A-B methine bridge as the binding site for second Cys was not correct [177]. Instead binding occurs at the B-C methine bridge in the blue-absorbing state Pb (ZZZssa) but this bond is disrupted after photoisomerization in the Pg state (ZZEssa) [168,178]. Scrutton´s group studied the photocycles of TePixJ and a related CBCR (Tlr0924) by time-resolved IR and UV-vis absorption spectroscopy from picoseconds to seconds [36,37]. Tlr0924 is a particular challenge for spectroscopists since it contains both a PCB and a PVB chromophore which run through parallel photocycles, including the reversible binding of a second Cys to the B-C methine bridge [36]. The authors employed an elegant approach to separate the photocycles and the contributions to the transient UV-vis and IR spectra (Figure 8). Both PCB and PVB form a blue-absorbing “double-Cys” adduct in the ZZZssa configuration. Light absorption causes photoisomerization to a ZZEssa configuration and the loss of the Cys attachment to the B-C methine bridge. As a consequence, the PCB photocycle leads to a red absorbing and the PVB photocycle to a green absorbing species which can be selectively pumped back to the originally dark state by red (PCB) and green light (PVB). In this way, it is possible to probe either the PCB or the PVB photocycle.
Another interesting CBCR representative is Oscil6304_2705 from the cyanobacterium Oscillatoria acuminata PCC 6304, which is a photoswitch between the blue-absorbing Pb (ZZZssa) and the orange-absorbing Po state (ZZEssa). Unno´s group employed UV-vis absorption and RR spectroscopy, demonstrating the loss of Cys ligation to the B-C methine bridge upon photoconversion of Pb [179]. Based on pH-dependent measurements it was shown that above pH 10 the chromophore of the Po state deprotonates and thermally isomerizes to a green-absorbing species (Pg, ZZZssa). It was proposed that Pg is an intermediate on the photoconversion route from Po to Pb. The same group extended the RR studies to RcaE from Fremyella diplosiphon which switches between a red- and green absorbing state, corresponding to a Z-to-E photoisomerization at the C-D methine bridge [180,181]. Supported by QM/MM calculations the authors concluded that the chromophore in Pg is deprotonated [179]. Furthermore, the RR spectra of the Pr state were found to be consistent with the unusual syn conformation of the C-D methine bridge, in contrast to the typical anti conformation in other CBBRs and canonical phytochromes [180].
6. Fluorescing phytochromes
The vivid development of optical microscopic techniques spurred the search for fluorescing proteins, which could be co-expressed in target cells for in vivo imaging. An important requirement was the emission in the red or NIR region to ensure high penetration depth. Phytochrome chromophores have been identified as promising candidates [182], although the fluorescence quantum yield in their native protein environment is very low. Thus, attempts were made to engineer bacterial BV containing phytochromes towards an increased fluorescence, using a combination of selected site-specific and random mutagenesis [183]. In many studies the PG domain construct of the bacteriophytochrome RpBphP2 from Rhodopseudomas palustris served as a starting point. Thus, this protein and its fluorescence-optimized variants were studied by RR spectroscopy in an attempt to elucidate the molecular basis for the increased fluorescence, ultimately as a step towards the rational design of high efficient fluorophores [114,119,120]. The first fluorescing phytochrome that was analysed in this way was generated from the D202H variant of RpBphP2(PG) by random mutagenesis, leading to 13 substitutions compared to the wild-type PG construct, including five in the chromophore binding pocket [114]. Supported by MD simulations, the authors identified two factors contributing to the enhanced fluorescence: an increased rigidity of the chromophore embedment in the protein and a higher degree of ring D tilting that reduced the hydrogen-bonding interactions with surrounding amino acids. In a subsequent work, the authors analysed the role of individual amino acid substitutions in a related variant [119]. Two groups of mutations have qualitatively different effects on the chromophore, which exists in a fluorescent (state II) and a non-fluorescent conformer (state I). Three substitutions in the vicinity of the chromophore increased the intrinsic fluorescence quantum yield of state II due to small structural changes of the bound BV, whereas multiple substitutions more remote from the chromophore cause a major shift of the conformational equilibrium towards the fluorescing state.
In another variant derived from RpBphP2(PG) an additional Cys was introduced to provide two thioether bonds to ring A, thereby eliminating all endo- and exocyclic double bonds of this ring. In a RR spectroscopic study, Buhrke et al. demonstrated that the particularly high fluorescence quantum yield (ca. 16 %) originates from the double attachment of BV. The consequences of each Cys binding on the chromophore structure were found to be additive, each of them decreasing the flexibility of the chromophore in the protein as reflected by the effect on the characteristic RR marker bands [120].
7. Conclusions
The present review described the contributions of vibrational spectroscopy to the understanding of structure, dynamics, and function of phytochromes. The impact of the Raman and IR spectroscopic approaches has increased over the past forty years not only with the technical development the methods but also with the progress made in other methodologies ranging from protein engineering, structural biology to theory. RR and IR difference spectroscopy are selective and thus focus on specific structural aspects such as hydrogen bonding interactions or conformational details of the chromophore. Accordingly, these techniques are ideal to complement crystallographic methods which provide an overall 3D picture but generally lack the resolution for the fine structure. Moreover, despite the recent advancement in time-resolved and cryotrap crystallography, characterization of photoconversion mainly upon RR and IR spectroscopy. Nevertheless, full exploitation of the potential of vibrational spectroscopies is only possible if they are applied in combination with other experimental and theoretical approaches.
Funding
This research was funded by the Deutsche Forschungsgemeinschaft (DFG) via CRC1078 “Protonation Dynamics in Protein Function”, project number 221545957, subproject B06, and the DFG under Germany’s Excellence Strategy - EXC 311 2008/1 (UniSysCat) – 390540038.
Institutional Review Board Statement
Not applicable.
Informed Consent Statement
Not applicable.
Data Availability Statement
No new data were created or analyzed in this study. Data sharing is not applicable to this article.
Acknowledgments
I like to thank my team members and collaborators for the fruitful and pleasant joint work in the past thirty years.
Conflicts of Interest
The authors declare no conflict of interest.
References
- Borthwick, H.A. Phytochrome Action and Its Time Displays. Am. Nat. 1964, 98, 347–355. [Google Scholar] [CrossRef]
- Briggs, W.R.; Rice, H. V. Phytochrome: Chemical and Physical Properties and Mechanism of Action. Annu. Rev. Plant Physiol. 1972, 23, 293–334. [Google Scholar] [CrossRef]
- Rockwell, N.C.; Su, Y.-S.; Lagarias, J.C. Phytochrome Structure and Signaling Mechanisms. Annu. Rev. Plant Biol. 2006, 57, 837–858. [Google Scholar] [CrossRef]
- Wang, H. Phytochrome Signaling: Time to Tighten up the Loose Ends. Mol. Plant 2015, 8, 540–551. [Google Scholar] [CrossRef] [PubMed]
- Karniol, B.; Vierstra, R.D. The Pair of Bacteriophytochromes from Agrobacterium Tumefaciens Are Histidine Kinases with Opposing Photobiological Properties. Proc. Natl. Acad. Sci. USA 2003, 100, 2807–2812. [Google Scholar] [CrossRef]
- Ikeuchi, M.; Ishizuka, T. Cyanobacteriochromes: A New Superfamily of Tetrapyrrole-Binding Photoreceptors in Cyanobacteria. Photochem. Photobiol. Sci. 2008, 7, 1159–1167. [Google Scholar] [CrossRef] [PubMed]
- Rockwell, N.C.; Moreno, M. V.; Martin, S.S.; Lagarias, J.C. Protein–Chromophore Interactions Controlling Photoisomerization in Red/Green Cyanobacteriochromes. Photochem. Photobiol. Sci. 2022, 21, 471–491. [Google Scholar] [CrossRef] [PubMed]
- Fushimi, K.; Narikawa, R. Cyanobacteriochromes: Photoreceptors Covering the Entire UV-to-Visible Spectrum. Curr. Opin. Struct. Biol. 2019, 57, 39–46. [Google Scholar] [CrossRef]
- Nagano, S.; Scheerer, P.; Zubow, K.; Michael, N.; Inomata, K.; Lamparter, T.; Krauß, N. The Crystal Structures of the N-Terminal Photosensory Core Module of Agrobacterium Phytochrome Agp1 as Parallel and Anti-Parallel Dimers. J. Biol. Chem. 2016, 291, 20674–20691. [Google Scholar] [CrossRef]
- Hughes, J.; Lamparter, T.; Mittmann, F.; Hartmann, E.; Gärtner, W.; Wilde, A.; Börner, T. A Prokaryotic Phytochrome. Nature 1997, 386, 663. [Google Scholar] [CrossRef]
- Kneip, C.; Mozley, D.; Hildebrandt, P.; Gärtner, W.; Braslavsky, S.E.; Schaffner, K. Effect of Chromophore Exchange on the Resonance Raman Spectra of Recombinant Phytochromes. FEBS Lett. 1997, 414, 23–26. [Google Scholar] [CrossRef] [PubMed]
- Matysik, J.; Lang, C.; Gartner, W.; Rohmer, T.; Essen, L.-O.; Hughes, J. Light-Induced Chromophore Activity and Signal Transduction in Phytochromes Observed by 13C and 15N Magic-Angle Spinning NMR. Proc. Natl. Acad. Sci. 2008, 105, 15229–15234. [Google Scholar] [CrossRef]
- Wagner, J.R.; Brunzelle, J.S.; Forest, K.T.; Vierstra, R.D. A Light-Sensing Knot Revealed by the Structure of the Chromophore-Binding Domain of Phytochrome. Nature 2005, 438, 325–331. [Google Scholar] [CrossRef]
- Yang, X.; Stojkovic, E.A.; Kuk, J.; Moffat, K. Crystal Structure of the Chromophore Binding Domain of an Unusual Bacteriophytochrome, RpBphP3, Reveals Residues That Modulate Photoconversion. Proc. Natl. Acad. Sci. 2007, 104, 12571–12576. [Google Scholar] [CrossRef] [PubMed]
- Wagner, J.R.; Zhang, J.; Brunzelle, J.S.; Vierstra, R.D.; Forest, K.T. High Resolution Structure of Deinococcus Bacteriophytochrome Yields New Insights into Phytochrome Architecture and Evolution. J. Biol. Chem. 2007, 282, 12298–12309. [Google Scholar] [CrossRef] [PubMed]
- Yang, X.; Kuk, J.; Moffat, K. Crystal Structure of Pseudomonas Aeruginosa Bacteriophytochrome: Photoconversion and Signal Transduction. Proc. Natl. Acad. Sci. 2008, 105, 14715–14720. [Google Scholar] [CrossRef]
- Essen, L.-O.; Mailliet, J.; Hughes, J. The Structure of a Complete Phytochrome Sensory Module in the Pr Ground State. Proc. Natl. Acad. Sci. U. S. A. 2008, 105, 14709–14714. [Google Scholar] [CrossRef]
- Mroginski, M.A.; von Stetten, D.; Kaminski, S.; Escobar, F. V.; Michael, N.; Daminelli-Widany, G.; Hildebrandt, P. Elucidating Photoinduced Structural Changes in Phytochromes by the Combined Application of Resonance Raman Spectroscopy and Theoretical Methods. J. Mol. Struct. 2011, 99, 15–25. [Google Scholar] [CrossRef]
- Siebert, F.; Hildebrandt, P. Vibrational Spectroscopy in Life Science; Wiley-VCH: Weinheim, 2007. [Google Scholar]
- Edlung, P.; Takala, H.; Claesson, E.; Henry, L.; Dods, R.; Jehtivuori, H.; Panman, M.; Pande, K.; White, T.; Nakane, T.; et al. The Room Temperature Crystal Structure of a Bacterial Phytochrome Determined by Serial Femtosecond Crystallography. Sci. Rep. 2016, 6, 1–9. [Google Scholar] [CrossRef]
- Buhrke, D.; Hildebrandt, P. Probing Structure and Reaction Dynamics of Proteins Using Time-Resolved Resonance Raman Spectroscopy. Chem. Rev. 2020, 120, 3577–3630. [Google Scholar] [CrossRef]
- Stockburger, M.; Klusmann, W.; Gattermann, H.; Massig, G.; Peters, R. Photochemical Cycle of Bacteriorhodopsin Studied by Resonance Raman Spectroscopy. Biochemistry 1979, 18, 4886–4900. [Google Scholar] [CrossRef] [PubMed]
- Braiman, M.; Mathies, R. Resonance Raman Evidence for an All-Trans to 13-Cis Isomerization in the Proton-Pumping Cycle of Bacteriorhodopsin. Biochemistry 1980, 19, 5421–5428. [Google Scholar] [CrossRef] [PubMed]
- Siebert, F.; Mäntele, W.; Kreutz, W. Evidence for the Protonation of Two Internal Carboxylic Groups during the Photocycle of Bacteriorhodopsin. Investigation of Kinetic Infrared Spectroscopy. FEBS Lett. 1982, 141, 82–87. [Google Scholar] [CrossRef]
- Bagley, K.; Dollinger, G.; Eisenstein, L.; Singh, A.K.; Zimányi, L. Fourier Transform Infrared Difference Spectroscopy of Bacteriorhodopsin and Its Photoproducts. Proc. Natl. Acad. Sci. U. S. A. 1982, 79, 4972–4976. [Google Scholar] [CrossRef]
- Oesterhelt, D.; Stoeckenius, W. Rhodopsin-like Protein from the Purple Membrane of Halobacterium Halobium. Nat. New Biol. 1971, 233, 149–152. [Google Scholar] [CrossRef]
- Sühnel, J.; Hermann, G.; Dornberger, U.; Fritzsche, H. Computer Analysis of Phytochrome Sequences and Reevaluation of the Phytochrome Secondary Structure by Fourier Transform Infrared Spectroscopy. Biochim. Biophys. Acta - Protein Struct. Mol. Enzymol. 1997, 1340, 253–267. [Google Scholar] [CrossRef] [PubMed]
- Foerstendorf, H.; Lamparter, T.; Hughes, J.; Gärtner, W.; Siebert, F. The Photoreactions of Recombinant Phytochrome from the Cyanobacterium Synechocystis: A Low-Temperature UV–Vis and FT-IR Spectroscopic Study. Photochem. Photobiol. 2000, 71, 655–661. [Google Scholar] [CrossRef]
- Sakai, J.; Morita, E.H.; Hayashi, H.; Furuya, M.; Tasumi, M. Infrared Studies of the Phototransformation of Phytochrome. Chem. Lett. 1990, 1925–1926. [Google Scholar] [CrossRef]
- Foerstendorf, H.; Mummert, E.; Schäfer, E.; Scheer, H.; Siebert, F. Fourier-Transform Infrared Spectroscopy of Phytochrome: Difference Spectra of the Intermediates of the Photoreactions. Biochemistry 1996, 35, 10793–10799. [Google Scholar] [CrossRef]
- Uhmann, W.; Becker, A.; Taran, C.; Siebert, F. Time-Resolved FT-IR Absorption Spectroscopy Using a Step-Scan Interferometer. Appl. Spectrosc. 1991, 45, 390–397. [Google Scholar] [CrossRef]
- Gerwert, K. Molecular Reaction Mechanisms of Proteins as Monitored by Time-Resolved FTIR Spectroscopy. Curr. Opin. Struct. Biol. 1993, 3, 769–773. [Google Scholar] [CrossRef]
- Ritter, E.; Puskar, L.; Bartl, F.J.; Aziz, E.F.; Hegemann, P.; Schade, U. Time-Resolved Infrared Spectroscopic Techniques as Applied to Channelrhodopsin. Front. Mol. Biosci. 2015, 2, 1–7. [Google Scholar] [CrossRef]
- Piwowarski, P.; Ritter, E.; Hofmann, K.-P.; Hildebrandt, P.; von Stetten, D.; Scheerer, P.; Michael, N.; Lamparter, T.; Bartl, F. Light-Induced Activation of Bacterial Phytochrome Agp1 Monitored by Static and Time-Resolved FTIR Spectroscopy. ChemPhysChem 2010, 11, 1207–1214. [Google Scholar] [CrossRef] [PubMed]
- Kottke, T.; Xie, A.; Larsen, D.S.; Hoff, W.D. Photoreceptors Take Charge: Emerging Principles for Light Sensing. Annu. Rev. Biophys. 2018, 47, 291–313. [Google Scholar] [CrossRef] [PubMed]
- Hauck, A.F.E.; Hardman, S.J.O.; Kutta, R.J.; Greetham, G.M.; Heyes, D.J.; Scrutton, N.S. The Photoinitiated Reaction Pathway of Full-Length Cyanobacteriochrome Tlr0924 Monitored over 12 Orders of Magnitude. J. Biol. Chem. 2014, 289, 17747–17757. [Google Scholar] [CrossRef]
- Hardman, S.J.O.; Heyes, D.J.; Sazanovich, I. V.; Scrutton, N.S. Photocycle of Cyanobacteriochrome TePixJ. Biochemistry 2020, 59, 2909–2915. [Google Scholar] [CrossRef]
- Van Thor, J.J.; Ronayne, K.L.; Towrie, M. Formation of the Early Photoproduct Lumi-R of Cyanobacterial Phytochrome Cph1 Observed by Ultrafast Mid-Infrared Spectroscopy. J. Am. Chem. Soc. 2007, 129, 126–132. [Google Scholar] [CrossRef]
- Schumann, C.; Groß, R.; Michael, N.; Lamparter, T.; Diller, R. Sub-Picosecond Mid-Infrared Spectroscopy of Phytochrome Agp1 from Agrobacterium Tumefaciens. ChemPhysChem 2007, 8, 1657–1663. [Google Scholar] [CrossRef]
- Toh, K.C.; Stojković, E.A.; Rupenyan, A.B.; Van Stokkum, I.H.M.; Salumbides, M.; Groot, M.L.; Moffat, K.; Kennis, J.T.M. Primary Reactions of Bacteriophytochrome Observed with Ultrafast Mid-Infrared Spectroscopy. J. Phys. Chem. A 2011, 115, 3778–3786. [Google Scholar] [CrossRef]
- Yang, Y.; Linke, M.; Von Haimberger, T.; Hahn, J.; Matute, R.; González, L.; Schmieder, P.; Heyne, K. Real-Time Tracking of Phytochrome’s Orientational Changes during Pr Photoisomerization. J. Am. Chem. Soc. 2012, 134, 1408–1411. [Google Scholar] [CrossRef]
- Kübel, J.; Chenchiliyan, M.; Ooi, S.A.; Gustavsson, E.; Isaksson, L.; Kuznetsova, V.; Ihalainen, J.A.; Westenhoff, S.; Maj, M. Transient IR Spectroscopy Identifies Key Interactions and Unravels New Intermediates in the Photocycle of a Bacterial Phytochrome. Phys. Chem. Chem. Phys. 2020, 22, 9195–9203. [Google Scholar] [CrossRef] [PubMed]
- Yang, Y.; Stensitzki, T.; Sauthof, L.; Schmidt, A.; Piwowarski, P.; Velazquez Escobar, F.; Michael, N.; Nguyen, A.D.; Szczepek, M.; Brünig, F.N.; et al. Ultrafast Proton-Coupled Isomerization in the Phototransformation of Phytochrome. Nat. Chem. 2022, 14, 823–830. [Google Scholar] [CrossRef] [PubMed]
- Kübel, J.; Westenhoff, S.; Maj, M. Giving Voice to the Weak: Application of Active Noise Reduction in Transient Infrared Spectroscopy. Chem. Phys. Lett. 2021, 783, 139059. [Google Scholar] [CrossRef]
- Buhrke, D.; Michael, N.; Hamm, P. Vibrational Couplings between Protein and Cofactor in Bacterial Phytochrome Agp1 Revealed by 2D-IR Spectroscopy. Proc. Natl. Acad. Sci. U. S. A. 2022, 119, 1–6. [Google Scholar] [CrossRef] [PubMed]
- Strekas, T.C.; Spiro, T.G. Hemoglobin: Resonance Raman Spectra. Biochim. Biophys. Acta 1972, 263, 830–833. [Google Scholar] [CrossRef]
- Fodor, S.P.A.; Lagarias, J.C.; Mathies, R.A. Resonance Raman Spectra of the Pr-Form of Phytochrome. Photochem. Photobiol. 1988, 48, 129–136. [Google Scholar] [CrossRef] [PubMed]
- Fodor, S.P.A.; Lagarias, J.C.; Mathies, R.A. Resonance Raman Analysis of the Pr and Pfr Forms of Phytochrome. Biochemistry 1990, 29, 11141–11146. [Google Scholar] [CrossRef]
- Hildebrandt, P.; Lindemann, P.; Heibel, G.; Braslavsky, S.E.; Schaffner, K.; Hoffmann, A.; Schrader, B. Fourier Transform Resonance Raman Spectroscopy of Phytochrome. Biochemistry 1992, 31, 7957–7962. [Google Scholar] [CrossRef]
- Kneip, C.; Hildebrandt, P.; Schlamann, W.; Braslavsky, S.E.; Mark, F.; Schaffner, K. Protonation State and Structural Changes of the Tetrapyrrole Chromophore during the Pr → Pfr Phototransformation of Phytochrome: A Resonance Raman Spectroscopic Study. Biochemistry 1999, 38, 15185–15192. [Google Scholar] [CrossRef]
- Borucki, B.; von Stetten, D.; Seibeck, S.; Lamparter, T.; Michael, N.; Mroginski, M.A.; Otto, H.; Murgida, D.H.; Heyn, M.P.; Hildebrandt, P. Light-Induced Proton Release of Phytochrome Is Coupled to the Transient Deprotonation of the Tetrapyrrole Chromophore. J. Biol. Chem. 2005, 280, 34358–34364. [Google Scholar] [CrossRef]
- Kraskov, A.; Nguyen, A.D.; Goerling, J.; Buhrke, D.; Velazquez Escobar, F.; Fernandez Lopez, M.; Michael, N.; Sauthof, L.; Schmidt, A.; Piwowarski, P.; et al. Intramolecular Proton Transfer Controls Protein Structural Changes in Phytochrome. Biochemistry 2020, 59, 1023–1037. [Google Scholar] [CrossRef]
- Andel, F.; Lagarias, J.C.; Mathias, R.A. Resonance Raman Analysis of Chromophore Structure in the Lumi-R Photoproduct of Phytochrome. Biochemistry 1996, 35, 15997–16008. [Google Scholar] [CrossRef] [PubMed]
- Tokutomi, S.; Mizutani, Y.; Anni, H.; Kitagawa, T. Resonance Raman Spectra of Large Pea Phytochrome at Ambient Temperature. Difference in Chromophore Protonation between Red- and Far Red-Absorbing Forms. FEBS Lett. 1990, 269, 341–344. [Google Scholar] [CrossRef]
- Mizutani, Y.; Kitagawa, T.; Tokutomi, S.; Aoyagi, K.; Horitsu, K. Resonance Raman Study on Intact Pea Phytochrome and Its Model Compounds: Evidence for Proton Migration during the Phototransformation. Biochemistry 1991, 30, 10693–10700. [Google Scholar] [CrossRef] [PubMed]
- Mizutani, Y.; Tokutomi, S.; Kitagawa, T. Resonance Raman Spectra of the Intermediates in Phototransformation of Large Phytochrome: Deprotonation of the Chromophore in the Bleached Intermediate. Biochemistry 1994, 33, 153–158. [Google Scholar] [CrossRef]
- Schneider, S.; Jäger, W.; Prenzel, C.J.; Brehm, G.; Sai, P.S.M.; Scheer, H.; Lottspeich, F. Photophysics of Phycoerythrocyanins from the Cyanobacterium Westiellopsis Prolifica Studied by Time-Resolved Fluorescence and Coherent Anti-Stokes Raman Scattering Spectroscopy. J. Photochem. Photobiol. B Biol. 1994, 26, 75–85. [Google Scholar] [CrossRef]
- Cotton, T.M.; Kim, J.; Chumanov, G.D. Application of Surface-Enhanced Raman Spectroscopy to Biological Systems. J. Raman Spectrosc. 1991, 22, 729–742. [Google Scholar] [CrossRef]
- Murgida, D.H.; Hildebrandt, P. Disentangling Interfacial Redox Processes of Proteins by SERR Spectroscopy. Chem. Soc. Rev. 2008, 37, 937–945. [Google Scholar] [CrossRef]
- Hermann, G.; Müller, E.; Werncke, W.; Pfeiffer, M.; Kim, M.-B.; Lau, A. A Resonance CARS Study of Phytochrome in Its Red Absorbing Form. Biochem. und Physiol. der Pflanz. 1990, 186, 135–143. [Google Scholar] [CrossRef]
- Farrens, D.L.; Holt, R.E.; Rospendowski, B.N.; Song, P.S.; Cotton, T.M. Surface-Enhanced Resonance Raman Scattering Spectroscopy Applied to Phytochrome and Its Model Compounds. 2. Phytochrome and Phycocyanin Chromophores. J. Am. Chem. Soc. 1989, 111, 9162–9169. [Google Scholar] [CrossRef]
- Rospendowski, B.N.; Farrens, D.L.; Cotton, T.M.; Song, P.S. Surface Enhanced Resonance Raman Scattering (SERRS) as a Probe of the Structural Differences between the Pr and Pfr Forms of Phytochrome. FEBS Lett. 1989, 258, 1–4. [Google Scholar] [CrossRef]
- Frontiera, R.R.; Mathies, R.A. Femtosecond Stimulated Raman Spectroscopy. Laser Photon. Rev. 2010, 5, 102–113. [Google Scholar] [CrossRef]
- Dasgupta, J.; Frontiera, R.R.; Taylor, K.C.; Lagarias, J.C.; Mathies, R.A. Ultrafast Excited-State Isomerization in Phytochrome Revealed by Femtosecond Stimulated Raman Spectroscopy. Proc. Natl. Acad. Sci. U. S. A. 2009, 106, 1784–1789. [Google Scholar] [CrossRef] [PubMed]
- Spillane, K.M.; Dasgupta, J.; Mathies, R.A. Conformational Homogeneity and Excited-State Isomerization Dynamics of the Bilin Chromophore in Phytochrome Cph1 from Resonance Raman Intensities. Biophys. J. 2012, 102, 709–717. [Google Scholar] [CrossRef]
- Kitagawa, T. Investigation of Higher Order Structures of Proteins by Ultraviolet Resonance Raman Spectroscopy. Progr. Biophys. Molec. Biol. 1992, 58, 1–18. [Google Scholar] [CrossRef] [PubMed]
- Toyama, A.; Nakazawa, M.; Manabe, K.; Takeuchi, H.; Harada, I. Ultraviolet Resonance Raman Spectra of Phytochrome : A Comparison of the Environments of Tryptophan Side Chains between Red Light-Absorbing and Far-Red Light-Absorbing Forms. Photochem. Photobiol. 1993, 57, 391–395. [Google Scholar] [CrossRef]
- Mizutani, Y.; Kaminaka, S.; Kitagawa, T.; Tokutomi, S. Ultraviolet Resonance Raman Spectra of Pea Intact, Large, and Small Phytochromes: Differences in Molecular Topography of the Red- and Far-Red-Absorbing Forms. Biochemistry 1993, 32, 6916–6922. [Google Scholar] [CrossRef]
- von Stetten, D.; Günther, M.; Scheerer, P.; Murgida, D.H.; Mroginski, M.A.; Krauß, N.; Lamparter, T.; Zhang, J.; Anstrom, D.M.; Vierstra, R.D.; et al. Chromophore Heterogeneity and Photoconversion in Phytochrome Crystals and Solution Studied by Resonance Raman Spectroscopy. Angew. Chemie Int. Ed. 2008, 47, 4753–4755. [Google Scholar] [CrossRef]
- Mroginski, M.A.; von Stetten, D.; Velazquez Escobar, F.; Strauss, H.M.; Kaminski, S.; Scheerer, P.; Günther, M.; Murgida, D.H.; Schmieder, P.; Bongards, C.; et al. Chromophore Structure of Cyanobacterial Phytochrome Cph1 in the Pr State: Reconciling Structural and Spectroscopic Data by QM/MM Calculations. Biophys. J. 2009, 96, 4153–4163. [Google Scholar] [CrossRef]
- Schmidt, A.; Sauthof, L.; Szczepek, M.; Lopez, M.F.; Velazquez Escobar, F.; Qureshi, B.M.; Michael, N.; Buhrke, D.; Stevens, T.; Kwiatkowski, D.; et al. Structural Snapshot of a Bacterial Phytochrome in Its Functional Intermediate State. Nat. Commun. 2018, 9, 1–13. [Google Scholar] [CrossRef] [PubMed]
- Foerstendorf, H.; Benda, C.; Gärtner, W.; Storf, M.; Scheer, H.; Siebert, F. FTIR Studies of Phytochrome Photoreactions Reveal the C=O Bands of the Chromophore: Consequences for Its Protonation States, Conformation, and Protein Interaction. Biochemistry 2001, 40, 14952–14959. [Google Scholar] [CrossRef] [PubMed]
- Van Thor, J.J.; Fisher, N.; Rich, P.R. Assignments of the Pfr - Pr FTIR Difference Spectrum of Cyanobacterial Phytochrome Cph1 Using15N And13C Isotopically Labeled Phycocyanobilin Chromophore. J. Phys. Chem. B 2005, 109, 20597–20604. [Google Scholar] [CrossRef] [PubMed]
- Velazquez Escobar, F.; Piwowarski, P.; Salewski, J.; Michael, N.; Fernandez Lopez, M.; Rupp, A.; Qureshi, M.B.; Scheerer, P.; Bartl, F.; Frankenberg-Dinkel, N.; et al. A Protonation-Coupled Feedback Mechanism Controls the Signalling Process in Bathy Phytochromes. Nat. Chem. 2015, 7, 423–430. [Google Scholar] [CrossRef] [PubMed]
- Rüdiger, W.; Thümmler, F.; Cmiel, E.; Schneider, S. Chromophore Structure of the Physiologically Active Form (Pfr) of Phytochrome. Proc. Natl. Acad. Sci. 1983, 80, 6244–6248. [Google Scholar] [CrossRef] [PubMed]
- Kitagawa, T.; Ozaki, Y. Infrared and Raman Spectra of Metalloporphyrins. Met. Complexes with Tetrapyrrole Ligands I 2006, 71–114. [Google Scholar] [CrossRef]
- Li, X.Y.; Czernuszewicz, R.S.; Kincaid, J.R.; Su, Y.O.; Spiro, T.G. Consistent Porphyrin Force Field. 1. Normal-Mode Analysis for Nickel Porphine and Nickel Tetraphenylporphine from Resonance Raman and Infrared Spectra and Isotope Shifts. J. Phys. Chem. 1990, 94, 31–47. [Google Scholar] [CrossRef]
- Li, X.-Y.; Czernuszewicz, R.S.; Kincaid, J.R.; Stein, P.; Spiro, T.G. Consistent Porphyrin Force Field. 2. Nickel Octaethylporphyrin Skeletal and Substituent Mode Assignments from 15N, Meso-D4, and Methylene-D16 Raman and Infrared Isotope Shifts. J. Phys. Chem. 1990, 94, 47–61. [Google Scholar] [CrossRef]
- Margulies, L.; Stockburger, M. Spectroscopic Studies on Model Compounds of the Phytochrome Chromophore. Protonation and Deprotonation of Biliverdin Dimethyl Ester. J. Am. Chem. Soc. 1979, 101, 743–744. [Google Scholar] [CrossRef]
- Mroginski, M.A.; Németh, K.; Magdé, I.; Müller, M.; Robben, U.; Della Védova, C.; Hildebrandt, P.; Mark, F. Calculation of the Vibrational Spectra of Linear Tetrapyrroles. 2. Resonance Raman Spectra of Hexamethylpyrromethene Monomers. J. Phys. Chem. B 2000, 104, 10885–10899. [Google Scholar] [CrossRef]
- Kneip, C.; Parbel, A.; Foerstendorf, H.; Scheer, H.; Siebert, F.; Hildebrandt, P. Fourier Transform Near-Infrared Resonance Raman Spectroscopic Study of the Alpha-Subunit of Phycoerythrocyanin and Phycocyanin from the Cyanobacterium Mastigocladus Laminosus. J. Raman Spectrosc. 1998, 29, 939–944. [Google Scholar] [CrossRef]
- Andel, F.; Murphy, J.T.; Haas, J.A.; McDowell, M.T.; Van Der Hoef, I.; Lugtenburg, J.; Lagarias, J.C.; Mathies, R.A. Probing the Photoreaction Mechanism of Phytochrome through Analysis of Resonance Raman Vibrational Spectra of Recombinant Analogues. Biochemistry 2000, 39, 2667–2676. [Google Scholar] [CrossRef]
- Mroginski, M.A.; Kneip, C.; Hildebrandt, P.; Mark, F. Excited State Geometry Calculations and the Resonance Raman Spectrum of Hexamethylpyrromethene. J. Mol. Struct. 2003, 661–662, 611–624. [Google Scholar] [CrossRef]
- Mroginski, M.A.; Németh, K.; Bauschlicher, T.; Klotzbücher, W.; Goddard, R.; Heinemann, O.; Hildebrandt, P.; Mark, F. Calculation of Vibrational Spectra of Linear Tetrapyrroles. 3. Hydrogen-Bonded Hexamethylpyrromethene Dimers. J. Phys. Chem. A 2005, 109, 2139–2150. [Google Scholar] [CrossRef] [PubMed]
- Mroginski, M.A.; Murgida, D.H.; Hildebrandt, P. Calculation of Vibrational Spectra of Linear Tetrapyrroles. 4. Methine Bridge C-H Out-of-Plane Modes. J. Phys. Chem. A 2006, 110, 10564–10574. [Google Scholar] [CrossRef] [PubMed]
- Hildebrandt, P.; Siebert, F.; Schwinté, P.; Gärtner, W.; Murgida, D.H.; Mroginski, M.A.; Sharda, S.; von Stetten, D. The Chromophore Structures of the Pr States in Plant and Bacterial Phytochromes. Biophys. J. 2007, 93, 2410–2417. [Google Scholar] [CrossRef]
- Velazquez Escobar, F.; von Stetten, D.; Günther-Lütkens, M.; Keidel, A.; Michael, N.; Lamparter, T.; Essen, L.-O.; Hughes, J.; Gärtner, W.; von Stetten, D.; et al. Conformational Heterogeneity of the Pfr Chromophore in Plant and Cyanobacterial Phytochromes. Front. Mol. Biosci. 2015, 2, 1–13. [Google Scholar] [CrossRef]
- Margulies, L.; Toporowicz, M. Resonance Raman Study of Model Compounds of the Phytochrome Chromophore. 2. Biliverdin Dimethyl Ester. J. Am. Chem. Soc. 1984, 106, 7331–7336. [Google Scholar] [CrossRef]
- Holt, R.E.; Farrens, D.L.; Song, P.S.; Cotton, T.M. Surface-Enhanced Resonance Raman Scattering Spectroscopy Applied to Phytochrome and Its Model Compounds. 2. Phytochrome and Phycocyanin Chromophorest. J. Am. Chem. Soc. 1989, 111, 9156–9162. [Google Scholar] [CrossRef]
- Sawatzki, J.; Fischer, R.; Scheer, H.; Siebert, F. Fourier-Transform Raman Spectroscopy Applied to Photobiological Systems. Proc. Natl. Acad. Sci. USA 1990, 87, 5903–5906. [Google Scholar] [CrossRef]
- Smit, K.; Matysik, J.; Hildebrandt, P.; Mark, F. Vibrational Analysis of Biliverdin Dimethyl Ester. J. Phys. Chem. 1993, 97, 11887–11900. [Google Scholar] [CrossRef]
- Matysik, J.; Hildebrandt, P.; Smit, K.; Korkin, A.; Mark, F.; Gärtner, W.; Braslavsky, S.E.; Schaffner, K.; Schrader, B. Vibrational Analysis of Biliverdin IXα Dimethyl Ester Conformers. J. Mol. Struct. 1995, 348, 225–228. [Google Scholar] [CrossRef]
- Matysik, J.; Hildebrandt, P.; Smit, K.; Mark, F.; Gärtner, W.; Braslavsky, S.E.; Schaffner, K.; Schrader, B. Raman Spectroscopic Analysis of Isomers of Biliverdin Dimethyl Ester. J. Pharm. Biomed. Anal. 1997, 15, 1319–1324. [Google Scholar] [CrossRef] [PubMed]
- Knipp, B.; Kneip, K.; Matysik, J.; Gärtner, W.; Hildebrandt, P.; Braslavsky, S.E.; Schaffner, K. Regioselective Deuteration and Resonance Raman Spectroscopic Characterization of Biliverdin and Phycocyanobilin. Chem. - A Eur. J. 1997, 3, 363–367. [Google Scholar] [CrossRef]
- Magdó, I.; Németh, K.; Mark, F.; Hildebrandt, P.; Schaffner, K. Calculation of Vibrational Spectra of Linear Tetrapyrroles. 1. Global Sets of Scaling Factors for Force Fields Derived by Ab Initio and Density Functional Theory Methods. J. Phys. Chem. A 1999, 103, 289–303. [Google Scholar] [CrossRef]
- Mroginski, M.A.; Murgida, D.H.; Von Stetten, D.; Kneip, C.; Mark, F.; Hildebrandt, P. Determination of the Chromophore Structures in the Photoinduced Reaction Cycle of Phytochrome. J. Am. Chem. Soc. 2004, 126, 16734–16735. [Google Scholar] [CrossRef]
- Mroginski, M.A.; Murgida, D.H.; Hildebrandt, P. The Chromophore Structural Changes during the Photocycle of Phytochrome: A Combined Resonance Raman and Quantum Chemical Approach. Acc. Chem. Res. 2007, 40, 258–266. [Google Scholar] [CrossRef] [PubMed]
- Kneip, C.; Hildebrandt, P.; Németh, K.; Mark, F.; Schaffner, K. Interpretation of the Resonance Raman Spectra of Linear Tetrapyrroles Based on DFT Calculations. Chem. Phys. Lett. 1999, 311, 479–484. [Google Scholar] [CrossRef]
- Eichinger, M.; Tavan, P.; Hutter, J.; Parrinello, M. A Hybrid Method for Solutes in Complex Solvents: Density Functional Theory Combined with Empirical Force Fields. J. Chem. Phys. 1999, 110, 10452–10467. [Google Scholar] [CrossRef]
- Cui, Q.; Karplus, M. Molecular Properties from Combined QM/MM Methods. I. Analytical Second Derivative and Vibrational Calculations. J. Chem. Phys. 2000, 112, 1133–1149. [Google Scholar] [CrossRef]
- Senn, H.M.; Thiel, W. QM/MM Methods for Biological Systems. Top. Curr. Chem. 2007, 268, 173–290. [Google Scholar] [CrossRef]
- Mroginski, M.A.; Mark, F.; Thiel, W.; Hildebrandt, P. Quantum Mechanics/Molecular Mechanics Calculation of the Raman Spectra of the Phycocyanobilin Chromophore in α-C-Phycocyanin. Biophys. J. 2007, 93, 1885–1894. [Google Scholar] [CrossRef] [PubMed]
- Mroginski, M.A.; Kaminski, S.; Hildebrandt, P. Raman Spectra of the Phycoviolobilin Cofactor in Phycoerythrocyanin Calculated by QM/MM Methods. ChemPhysChem 2010, 11, 1265–1274. [Google Scholar] [CrossRef] [PubMed]
- Salewski, J.; Escobar, F.V.; Kaminski, S.; Von Stetten, D.; Keidel, A.; Rippers, Y.; Michael, N.; Scheerer, P.; Piwowarski, P.; Bartl, F.; et al. Structure of the Biliverdin Cofactor in the Pfr State of Bathy and Prototypical Phytochromes. J. Biol. Chem. 2013, 288, 16800–16814. [Google Scholar] [CrossRef] [PubMed]
- Takiden, A.; Velazquez-Escobar, F.; Dragelj, J.; Woelke, A.L.; Knapp, E.-W.; Piwowarski, P.; Bartl, F.; Hildebrandt, P.; Mroginski, M.A. Structural and Vibrational Characterization of the Chromophore Binding Site of Bacterial Phytochrome Agp1. Photochem. Photobiol. 2017, 93, 713–723. [Google Scholar] [CrossRef] [PubMed]
- Mroginski, M.A.; Kaminski, S.; Von Stetten, D.; Ringsdorf, S.; Gärtner, W.; Essen, L.O.; Hildebrandt, P. Structure of the Chromophore Binding Pocket in the Pr State of Plant Phytochrome PhyA. J. Phys. Chem. B 2011, 115, 1220–1231. [Google Scholar] [CrossRef] [PubMed]
- Eilfeld, P.; Rüdiger, W. Absorption Spectra of Phytochrome Intermediates. Zeitschrift fur Naturforsch. - Sect. C J. Biosci. 1985, 40, 109–114. [Google Scholar] [CrossRef]
- Holzwarth, A.R.; Wendler, J.; Ruzsicska, B.P.; Braslavsky, S.E.; Schaffner, K. Picosecond Time-Resolved and Stationary Fluorescence of Oat Phytochrome Highly Enriched in the Native 124 KDa Protein. Biochim. Biophys. Acta - Protein Struct. Mol. Enzymol. 1984, 791, 265–273. [Google Scholar] [CrossRef]
- López, M.F.; Dahl, M.; Escobar, F.V.; Bonomi, H.R.; Kraskov, A.; Michael, N.; Mroginski, M.A.; Scheerer, P.; Hildebrandt, P. Photoinduced Reaction Mechanisms in Prototypical and Bathy Phytochromes. Phys. Chem. Chem. Phys. 2022, 24, 11967–11978. [Google Scholar] [CrossRef]
- Velázquez Escobar, F.; Buhrke, D.; Michael, N.; Sauthof, L.; Wilkening, S.; Tavraz, N.N.; Salewski, J.; Frankenberg-Dinkel, N.; Mroginski, M.A.; Scheerer, P.; et al. Common Structural Elements in the Chromophore Binding Pocket of the Pfr State of Bathy Phytochromes. Photochem. Photobiol. 2017, 93, 724–732. [Google Scholar] [CrossRef]
- Otero, L.H.; Goldbaum, F.A.; Fernández López, M.; Rinaldi, J.; Velázquez-Escobar, F.; Bonomi, H.R.; Klinke, S.; Hildebrandt, P.; Mroginski, M.A.; Vojnov, A.A.; et al. Structure of the Full-Length Bacteriophytochrome from the Plant Pathogen Xanthomonas Campestris Provides Clues to Its Long-Range Signaling Mechanism. J. Mol. Biol. 2016, 428, 3702–3720. [Google Scholar] [CrossRef]
- Zienicke, B.; Molina, I.; Glenz, R.; Singer, P.; Ehmer, D.; Escobar, F.V.; Hildebrandt, P.; Diller, R.; Lamparter, T. Unusual Spectral Properties of Bacteriophytochrome Agp2 Result from a Deprotonation of the Chromophore in the Red-Absorbing Form Pr. J. Biol. Chem. 2013, 288, 31738–31751. [Google Scholar] [CrossRef] [PubMed]
- Spillane, K.M.; Dasgupta, J.; Lagarias, J.C.; Mathies, R.A. Homogeneity of Phytochrome Cph1 Vibronic Absorption Revealed by Resonance Raman Intensity Analysis. J. Am. Chem. Soc. 2009, 131, 13946–13948. [Google Scholar] [CrossRef] [PubMed]
- Velazquez Escobar, F.; Hildebrandt, T.; Utesch, T.; Schmitt, F.J.; Seuffert, I.; Michael, N.; Schulz, C.; Mroginski, M.A.; Friedrich, T.; Hildebrandt, P. Structural Parameters Controlling the Fluorescence Properties of Phytochromes. Biochemistry 2013, 53, 20–29. [Google Scholar] [CrossRef]
- Chenchiliyan, M.; Kübel, J.; Ooi, S.A.; Salvadori, G.; Mennucci, B.; Westenhoff, S.; Maj, M. Ground-State Heterogeneity and Vibrational Energy Redistribution in Bacterial Phytochrome Observed with Femtosecond 2D IR Spectroscopy. J. Chem. Phys. 2023, 158, 085103. [Google Scholar] [CrossRef] [PubMed]
- Velazquez Escobar, F.; Lang, C.; Takiden, A.; Schneider, C.; Balke, J.; Hughes, J.; Alexiev, U.; Hildebrandt, P.; Mroginski, M.A. Protonation-Dependent Structural Heterogeneity in the Chromophore Binding Site of Cyanobacterial Phytochrome Cph1. J. Phys. Chem. B 2017, 121, 47–57. [Google Scholar] [CrossRef]
- Von Stetten, D.; Seibeck, S.; Michael, N.; Scheerer, P.; Mroginski, M.A.; Murgida, D.H.; Krauss, N.; Heyn, M.P.; Hildebrandt, P.; Borucki, B.; et al. Highly Conserved Residues Asp-197 and His-250 in Agp1 Phytochrome Control the Proton Affinity of the Chromophore and Pfr Formation. J. Biol. Chem. 2007, 282, 2116–2123. [Google Scholar] [CrossRef]
- Wagner, J.R.; Zhang, J.; von Stetten, D.; Günther, M.; Murgida, D.H.; Mroginski, M.A.; Walker, J.M.; Forest, K.T.; Hildebrandt, P.; Vierstra, R.D. Mutational Analysis of Deinococcus Radiodurans Bacteriophytochrome Reveals Key Amino Acids Necessary for the Photochromicity and Proton Exchange Cycle of Phytochromes. J. Biol. Chem. 2008, 283, 12212–12226. [Google Scholar] [CrossRef]
- Buhrke, D.; Velazquez Escobar, F.; Sauthof, L.; Wilkening, S.; Herder, N.; Tavraz, N.N.; Willoweit, M.; Keidel, A.; Utesch, T.; Mroginski, M.A.; et al. The Role of Local and Remote Amino Acid Substitutions for Optimizing Fluorescence in Bacteriophytochromes: A Case Study on IRFP. Sci. Rep. 2016, 6, 1–12. [Google Scholar] [CrossRef]
- Buhrke, D.; Tavraz, N.N.; Shcherbakova, D.M.; Sauthof, L.; Moldenhauer, M.; Vélazquez Escobar, F.; Verkhusha, V. V.; Hildebrandt, P.; Friedrich, T. Chromophore Binding to Two Cysteines Increases Quantum Yield of Near-Infrared Fluorescent Proteins. Sci. Rep. 2019, 9, 1866. [Google Scholar] [CrossRef]
- Kraskov, A.; Buhrke, D.; Scheerer, P.; Shaef, I.; Sanchez, J.C.; Carrillo, M.; Noda, M.; Feliz, D.; Stojković, E.A.; Hildebrandt, P. On the Role of the Conserved Histidine at the Chromophore Isomerization Site in Phytochromes. J. Phys. Chem. B 2021, 125, 13696–13709. [Google Scholar] [CrossRef]
- Kraskov, A.; Von Sass, J.; Nguyen, A.D.; Hoang, T.O.; Buhrke, D.; Katz, S.; Michael, N.; Kozuch, J.; Zebger, I.; Siebert, F.; et al. Local Electric Field Changes during the Photoconversion of the Bathy Phytochrome Agp2. Biochemistry 2021, 60, 2967–2977. [Google Scholar] [CrossRef] [PubMed]
- Remberg, A.; Lindner, I.; Lamparter, T.; Hughes, J.; Kneip, C.; Hildebrandt, P.; Braslavsky, S.E.; Gärtner, W.; Schaffner, K. Raman Spectroscopic and Light-Induced Kinetic Characterization of a Recombinant Phytochrome of the Cyanobacterium Synechocystis. Biochemistry 1997, 36, 13389–13395. [Google Scholar] [CrossRef] [PubMed]
- Nagano, S.; Guan, K.; Shenkutie, S.; Feiler, C.; Weiss, M.; Kraskov, A.; Buhrke, D.; Hildebrandt, P.; Hughes, J. Structural Insights into Photoactivation and Signalling in Plant Phytochromes. Nat. Plants 2020, 6, 581–588. [Google Scholar] [CrossRef]
- Schlamann, W.; Kneip, C.; Schaffner, K.; Braslavsky, S. .; Hildebrandt, P. Resonance Raman Spectroscopic Study of the Tryptic 39-KDa Fragment of Phytochrome. FEBS Lett. 2002, 482, 252–256. [Google Scholar] [CrossRef]
- Velázquez Escobar, F.; Buhrke, D.; Fernandez Lopez, M.; Shenkutie, S.M.; von Horsten, S.; Essen, L.O.; Hughes, J.; Hildebrandt, P. Structural Communication between the Chromophore-Binding Pocket and the N-Terminal Extension in Plant Phytochrome PhyB. FEBS Lett. 2017, 591, 1258–1265. [Google Scholar] [CrossRef] [PubMed]
- Schwinté, P.; Foerstendorf, H.; Hussain, Z.; Gärtner, W.; Mroginski, M.A.; Hildebrandt, P.; Siebert, F. FTIR Study of the Photoinduced Processes of Plant Phytochrome Phya Using Isotope-Labeled Bilins and Density Functional Theory Calculations. Biophys. J. 2008, 95, 1256–1267. [Google Scholar] [CrossRef]
- Lamparter, T.; Krauß, N.; Scheerer, P. Phytochromes from Agrobacterium Fabrum. Photochem. Photobiol. 2017, 93, 642–655. [Google Scholar] [CrossRef]
- Borucki, B.; Seibeck, S.; Heyn, M.P.; Lamparter, T. Characterization of the Covalent and Noncovalent Adducts of Agp1 Phytochrome Assembled with Biliverdin and Phycocyanobilin by Circular Dichroism and Flash Photolysis. Biochemistry 2009, 48, 6305–6317. [Google Scholar] [CrossRef]
- Fernandez Lopez, M.; Nguyen, A.D.; Velazquez Escobar, F.; González, R.; Michael, N.; Nogacz, Ż.; Piwowarski, P.; Bartl, F.; Siebert, F.; Heise, I.; et al. Role of the Propionic Side Chains for the Photoconversion of Bacterial Phytochromes. Biochemistry 2019, 58, 3504–3519. [Google Scholar] [CrossRef]
- von Stetten, D.; Günther, M.; Frankenberg-Dinkel, N.; Brandt, S.; Hildebrandt, P. The Fungal Phytochrome FphA from Aspergillus Nidulans. J. Biol. Chem. 2008, 283, 34605–34614. [Google Scholar] [CrossRef]
- Sineshchekov, V.A. Photobiophysics and Photobiochemistry of the Heterogeneous Phytochrome System. Biochim. Biophys. Acta 1995, 1228, 125–164. [Google Scholar] [CrossRef]
- Savikhin, S.; Struve, W.S.; Wells, T.; Song, P.S. Ultrafast Pump-Probe Spectroscopy of Native Etiolated Oat Phytochrome. Biochemistry 1993, 32, 7512–7518. [Google Scholar] [CrossRef] [PubMed]
- Kandori, H.; Yoshihara, K.; Tokutomi, S. Primary Process of Phytochrome: Initial Step of Photomorphogenesis in Green Plants. J. Am. Chem. Soc. 1992, 114, 10958–10959. [Google Scholar] [CrossRef]
- Matysik, J.; Hildebrandt, P.; Schlamann, W.; Braslavsky, S.E.; Schaffner, K. Fourier-Transform Resonance Raman Spectroscopy of Intermediates of the Phytochrome Photocycle. Biochemistry 1995, 34, 10497–10507. [Google Scholar] [CrossRef] [PubMed]
- Velazquez Escobar, F.; Kneip, C.; Michael, N.; Hildebrandt, T.; Tavraz, N.; Gärtner, W.; Hughes, J.; Friedrich, T.; Scheerer, P.; Mroginski, M.A.; et al. The Lumi-R Intermediates of Prototypical Phytochromes. J. Phys. Chem. B 2020, 124, 4044–4055. [Google Scholar] [CrossRef] [PubMed]
- Van Wilderen, L.J.G.W.; Clark, I.P.; Towrie, M.; Van Thor, J.J. Mid-Infrared Picosecond Pump-Dump-Probe and Pump-Repump-Probe Experiments to Resolve a Ground-State Intermediate in Cyanobacterial Phytochrome Cph1. J. Phys. Chem. B 2009, 113, 16354–16364. [Google Scholar] [CrossRef]
- Linke, M.; Yang, Y.; Zienicke, B.; Hammam, M.A.S.; Von Haimberger, T.; Zacarias, A.; Inomata, K.; Lamparter, T.; Heyne, K. Electronic Transitions and Heterogeneity of the Bacteriophytochrome Pr Absorption Band: An Angle Balanced Polarization Resolved Femtosecond VIS Pump-IR Probe Study. Biophys. J. 2013, 105, 1756–1766. [Google Scholar] [CrossRef] [PubMed]
- Lenngren, N.; Edlund, P.; Takala, H.; Stucki-Buchli, B.; Rumfeldt, J.; Peshev, I.; Häkkänen, H.; Westenhoff, S.; Ihalainen, J.A. Coordination of the Biliverdin D-Ring in Bacteriophytochromes. Phys. Chem. Chem. Phys. 2018, 20, 18216–18225. [Google Scholar] [CrossRef]
- Schumann, C.; Groß, R.; Wolf, M.M.N.; Diller, R.; Michael, N.; Lamparter, T. Subpicosecond Midinfrared Spectroscopy of the Pfr Reaction of Phytochrome Agp1 from Agrobacterium Tumefaciens. Biophys. J. 2008, 94, 3189–3197. [Google Scholar] [CrossRef]
- Yang, Y.; Stensitzki, T.; Lang, C.; Hughes, J.; Mroginski, M.A.; Heyne, K. Ultrafast Protein Response in the Pfr State of Cph1 Phytochrome. Photochem. Photobiol. Sci. 2023. [Google Scholar] [CrossRef]
- Yang, Y.; Heyne, K.; Mathies, R.A.; Dasgupta, J. Non-Bonded Interactions Drive the Sub-Picosecond Bilin Photoisomerization in the Pfr State of Phytochrome Cph1. ChemPhysChem 2016, 17, 369–374. [Google Scholar] [CrossRef]
- Stensitzki, T.; Yang, Y.; Wölke, A.L.; Knapp, E.W.; Hughes, J.; Mroginski, M.A.; Heyne, K. Influence of Heterogeneity on the Ultrafast Photoisomerization Dynamics of Pfr in Cph1 Phytochrome. Photochem. Photobiol. 2017, 93, 703–712. [Google Scholar] [CrossRef] [PubMed]
- Schwinté, P.; Mroginski, M.-A.; Siebert, F.; Hildebrandt, P.; Sharda, S.; Gärtner, W. The Photoreactions of Recombinant Phytochrome CphA from the Cyanobacterium Calothrix PCC7601: A Low-Temperature UV-Vis and FTIR Study. Photochem. Photobiol. 2008, 85, 239–249. [Google Scholar] [CrossRef] [PubMed]
- Takala, H.; Björling, A.; Berntsson, O.; Lehtivuori, H.; Niebling, S.; Hoernke, M.; Kosheleva, I.; Henning, R.; Menzel, A.; Ihalainen, J.A.; et al. Signal Amplification and Transduction in Phytochrome Photosensors. Nature 2014, 509, 245–248. [Google Scholar] [CrossRef] [PubMed]
- Stojković, E.A.; Toh, K.C.; Alexandre, M.T.A.; Baclayon, M.; Moffat, K.; Kennis, J.T.M. FTIR Spectroscopy Revealing Light-Dependent Refolding of the Conserved Tongue Region of Bacteriophytochrome. J. Phys. Chem. Lett. 2014, 5, 2512–2515. [Google Scholar] [CrossRef]
- Ihalainen, J.A.; Gustavsson, E.; Schroeder, L.; Donnini, S.; Lehtivuori, H.; Isaksson, L.; Thöing, C.; Modi, V.; Berntsson, O.; Stucki-Buchli, B.; et al. Chromophore-Protein Interplay during the Phytochrome Photocycle Revealed by Step-Scan FTIR Spectroscopy. J. Am. Chem. Soc. 2018, 140, 12396–12404. [Google Scholar] [CrossRef]
- Lagarias, J.C.; Rapoport, H. Chromopeptides from Phytochrome. The Structure and Linkage of the PR Form of the Phytochrome Chromophore. J. Am. Chem. Soc. 1980, 102, 4821–4828. [Google Scholar] [CrossRef]
- Buhrke, D.; Kuhlmann, U.; Michael, N.; Hildebrandt, P. The Photoconversion of Phytochrome Includes an Unproductive Shunt Reaction Pathway. ChemPhysChem 2018, 19, 566–570. [Google Scholar] [CrossRef]
- Merga, G.; Lopez, M.F.; Fischer, P.; Piwowarski, P.; Nogacz, Ż.; Kraskov, A.; Buhrke, D.; Escobar, F.V.; Michael, N.; Siebert, F.; et al. Light-and Temperature-Dependent Dynamics of Chromophore and Protein Structural Changes in Bathy Phytochrome Agp2. Phys. Chem. Chem. Phys. 2021, 23, 18197–18205. [Google Scholar] [CrossRef]
- Thor, J.J. Van; Borucki, B.; Crielaard, W.; Otto, H.; Lamparter, T.; Hughes, J.; Hellingwerf, K.J.; Heyn, M.P. Light-Induced Proton Release and Proton Uptake Reactions in the Cyanobacterial Phytochrome Cph1. 2001, 11460–11471. [CrossRef]
- Fried, S.D.; Boxer, S.G. Measuring Electric Fields and Noncovalent Interactions Using the Vibrational Stark Effect. Acc. Chem. Res. 2015, 48, 998–1006. [Google Scholar] [CrossRef]
- Ojeda-May, P.; Garcia, M.E. Electric Field-Driven Disruption of a Native β-Sheet Protein Conformation and Generation of a Helix-Structure. Biophys. J. 2010, 99, 595–599. [Google Scholar] [CrossRef] [PubMed]
- Suydam, I.T.; Boxer, S.G. Vibrational Stark Effects Calibrate the Sensitivity of Vibrational Probes for Electric Fields in Proteins. Biochemistry 2003, 42, 12050–12055. [Google Scholar] [CrossRef]
- Fried, S.D.; Bagchi, S.; Boxer, S.G. Measuring Electrostatic Fields in Both Hydrogen-Bonding and Non-Hydrogen-Bonding Environments Using Carbonyl Vibrational Probes. J. Am. Chem. Soc. 2013, 135, 11181–11192. [Google Scholar] [CrossRef] [PubMed]
- Farfarman, A.T.; Sigala, P.A.; Herschlag, D.; Boxer, S.G. Decomposition of Vibrational Shifts of Nitriles into Electrostatic and Hydrogen Bonding Effects. J. Am. Chem. Soc. 2010, 132, 12811–12813. [Google Scholar] [CrossRef] [PubMed]
- Fafarman, A.T.; Webb, L.J.; Chuang, J.I.; Boxer, S.G. Site-Specific Conversion of Cysteine Thiols into Thiocyanate Creates an IR Probe for Electric Fields in Proteins. J. Am. Chem. Soc. 2006, 128, 13356–13357. [Google Scholar] [CrossRef]
- Young, D.D.; Young, T.S.; Jahnz, M.; Ahmad, I.; Spraggon, G.; Schultz, P.G. An Evolved Aminoacyl-TRNA Synthetase with Atypical Polysubstrate Specificity. Biochemistry 2011, 50, 1894–1900. [Google Scholar] [CrossRef]
- Biava, H.; Schreiber, T.; Katz, S.; Völler, J.S.; Stolarski, M.; Schulz, C.; Michael, N.; Budisa, N.; Kozuch, J.; Utesch, T.; et al. Long-Range Modulations of Electric Fields in Proteins. J. Phys. Chem. B 2018, 122, 8330–8342. [Google Scholar] [CrossRef]
- Kurttila, M.; Stucki-Buchli, B.; Rumfeldt, J.; Schroeder, L.; Häkkänen, H.; Liukkonen, A.; Takala, H.; Kottke, T.; Ihalainen, J.A. Site-by-Site Tracking of Signal Transduction in an Azidophenylalanine-Labeled Bacteriophytochrome with Step-Scan FTIR Spectroscopy. Phys. Chem. Chem. Phys. 2021, 23, 5615–5628. [Google Scholar] [CrossRef]
- Silverman, L.N.; Pitzer, M.E.; Ankomah, P.O.; Boxer, S.G.; Fenlon, E.E. Vibrational Stark Effect Probes for Nucleic Acids. J. Phys. Chem. B 2007, 111, 11611–11613. [Google Scholar] [CrossRef]
- Gourinchas, G.; Heintz, U.; Winkler, A. Asymmetric Activation Mechanism of a Homodimeric Red Light-Regulated Photoreceptor. Elife 2018, 7, e34815. [Google Scholar] [CrossRef]
- Buhrke, D.; Gourinchas, G.; Müller, M.; Michael, N.; Hildebrandt, P.; Winkler, A. Distinct Chromophore–Protein Environments Enable Asymmetric Activation of a Bacteriophytochrome-Activated Diguanylate Cyclase. J. Biol. Chem. 2020, 295, 539–551. [Google Scholar] [CrossRef] [PubMed]
- Ulijasz, A.T.; Cornilescu, G.; von Stetten, D.; Kaminski, S.; Mroginski, M.A.; Zhang, J.; Bhaya, D.; Hildebrandt, P.; Vierstra, R.D. Characterization of Two Thermostable Cyanobacterial Phytochromes Reveals Global Movements in the Chromophore-Binding Domain during Photoconversion. J. Biol. Chem. 2008, 283, 21251–21266. [Google Scholar] [CrossRef]
- Kiontke, S.; Anders, K.; Hildebrandt, P.; Mailliet, J.; Sineshchekov, V.A.; Essen, L.-O.; Hughes, J.; von Stetten, D. Spectroscopic and Photochemical Characterization of the Red-Light Sensitive Photosensory Module of Cph2 from Synechocystis PCC 6803. Photochem. Photobiol. 2010, 87, 160–173. [Google Scholar] [CrossRef]
- Blain-Hartung, M.; Rockwell, N.C.; Lagarias, J.C. Natural Diversity Provides a Broad Spectrum of Cyanobacteriochrome-Based Diguanylate Cyclases. Plant Physiol. 2021, 187, 632–645. [Google Scholar] [CrossRef]
- Rockwell, N.C.; Martin, S.S.; Lagarias, J.C. Red/Green Cyanobacteriochromes: Sensors of Color and Power. Biochemistry 2012, 51, 9667–9677. [Google Scholar] [CrossRef] [PubMed]
- Narikawa, R.; Ishizuka, T.; Muraki, N.; Shiba, T.; Kurisu, G.; Ikeuchi, M. Structures of Cyanobacteriochromes from Phototaxis Regulators AnPixJ and TePixJ Reveal General and Specific Photoconversion Mechanism. Proc. Natl. Acad. Sci. U. S. A. 2013, 110, 918–923. [Google Scholar] [CrossRef] [PubMed]
- Velazquez Escobar, F.; Utesch, T.; Narikawa, R.; Ikeuchi, M.; Mroginski, M.A.; Gärtner, W.; Hildebrandt, P. Photoconversion Mechanism of the Second GAF Domain of Cyanobacteriochrome AnPixJ and the Cofactor Structure of Its Green-Absorbing State. Biochemistry 2013, 52, 4871–4880. [Google Scholar] [CrossRef]
- Song, C.; Velazquez Escobar, F.; Xu, X.L.; Narikawa, R.; Ikeuchi, M.; Siebert, F.; Gärtner, W.; Matysik, J.; Hildebrandt, P. A Red/Green Cyanobacteriochrome Sustains Its Color Despite a Change in the Bilin Chromophorés Protonation State. Biochemistry 2015, 54, 5839–5848. [Google Scholar] [CrossRef]
- Nielsen, M.B. Model Systems for Understanding Absorption Tuning by Opsin Proteins. Chem. Soc. Rev. 2009, 38, 913–924. [Google Scholar] [CrossRef]
- Rockwell, N.C.; Martin, S.S.; Gulevich, A.G.; Lagarias, J.C. Conserved Phenylalanine Residues Are Required for Blue-Shifting of Cyanobacteriochrome Photoproducts. Biochemistry 2014, 53, 3118–3130. [Google Scholar] [CrossRef]
- Rockwell, N.C.; Martin, S.S.; Lim, S.; Lagarias, J.C.; Ames, J.B. Characterization of Red/Green Cyanobacteriochrome NpR6012g4 by Solution Nuclear Magnetic Resonance Spectroscopy: A Protonated Bilin Ring System in Both Photostates. Biochemistry 2015, 54, 2581–2600. [Google Scholar] [CrossRef] [PubMed]
- Xu, X.; Port, A.; Wiebeler, C.; Zhao, K.H.; Schapiro, I.; Gärtner, W. Structural Elements Regulating the Photochromicity in a Cyanobacteriochrome. Proc. Natl. Acad. Sci. U. S. A. 2020, 117, 2432–2440. [Google Scholar] [CrossRef] [PubMed]
- Buhrke, D.; Battocchio, G.; Wilkening, S.; Blain-Hartung, M.; Baumann, T.; Schmitt, F.J.; Friedrich, T.; Mroginski, M.A.; Hildebrandt, P. Red, Orange, Green: Light- And Temperature-Dependent Color Tuning in a Cyanobacteriochrome. Biochemistry 2020, 59, 509–519. [Google Scholar] [CrossRef] [PubMed]
- Buhrke, D.; Oppelt, K.T.; Heckmeier, P.J.; Fernández-Terán, R.; Hamm, P. Nanosecond Protein Dynamics in a Red/Green Cyanobacteriochrome Revealed by Transient IR Spectroscopy. J. Chem. Phys. 2020, 153, 245101. [Google Scholar] [CrossRef]
- Ulijasz, A.T.; Cornilescu, G.; von Stetten, D.; Cornilescu, C.; Escobar, F.V.; Zhang, J.; Stankey, R.J.; Rivera, M.; Hildebrandt, P.; Vierstra, R.D. Cyanochromes Are Blue/Green Light Photoreversible Photoreceptors Defined by a Stable Double Cysteine Linkage to a Phycoviolobilin-Type Chromophore. J. Biol. Chem. 2009, 284, 29757–29772. [Google Scholar] [CrossRef]
- Burgie, E.S.; Walker, J.M.; Phillips, G.N.; Vierstra, R.D. A Photo-Labile Thioether Linkage to Phycoviolobilin Provides the Foundation for the Blue/Green Photocycles in DXCF-Cyanobacteriochromes. Structure 2013, 21, 88–97. [Google Scholar] [CrossRef]
- Sato, T.; Kikukawa, T.; Miyoshi, R.; Kajimoto, K.; Yonekawa, C.; Fujisawa, T.; Unno, M.; Eki, T.; Hirose, Y. Protochromic Absorption Changes in the Two-Cysteine Photocycle of a Blue/Orange Cyanobacteriochrome. J. Biol. Chem. 2019, 294, 18909–18922. [Google Scholar] [CrossRef]
- Osoegawa, S.; Miyoshi, R.; Watanabe, K.; Hirose, Y.; Fujisawa, T.; Ikeuchi, M.; Unno, M. Identification of the Deprotonated Pyrrole Nitrogen of the Bilin-Based Photoreceptor by Raman Spectroscopy with an Advanced Computational Analysis. J. Phys. Chem. B 2019, 123, 3242–3247. [Google Scholar] [CrossRef]
- Okuda, Y.; Miyoshi, R.; Kamo, T.; Fujisawa, T.; Nagae, T.; Mishima, M.; Eki, T.; Hirose, Y.; Unno, M. Raman Spectroscopy of an Atypical C15- E, Syn Bilin Chromophore in Cyanobacteriochrome RcaE. J. Phys. Chem. B 2022, 126, 813–821. [Google Scholar] [CrossRef]
- Shu, X.; Royant, A.; Lin, M.Z.; Aguilera, T.A.; Lev-Ram, V.; Steinbach, P.A.; Tsien, R.Y. Mammalian Expression of Infrared Fluorescent Proteins Engineered from a Bacterial Phytochrome. Science (80-. ). 2009, 324, 804–807. [Google Scholar] [CrossRef]
- Filonov, G.S.; Piatkevich, K.D.; Ting, L.M.; Zhang, J.; Kim, K.; Verkhusha, V. V. Bright and Stable Near-Infrared Fluorescent Protein for in Vivo Imaging. Nat. Biotechnol. 2011, 29, 757–761. [Google Scholar] [CrossRef] [PubMed]
Figure 1.
Structures and reaction scheme of phytochromes. A, Structure of the photosensor core module (PCM) of the Pr state of a Agp1 variant with substitutions on the surface according to [9]. The BV chromophore and its attachment site Cys-20 are shown as balls and sticks, and carbon atoms are colored in yellow. PAS, GAF, and PHY domains are depicted in green, purple, and blue, respectively. B, rotated close-up view (same color code as in A) of a section of the chromophore binding pocket showing the potential hydrogen bond network that links BV to the protein environment, including mediating water molecules. The four pyrrole rings of BV are labeled A to D, and the propionate side chains of rings B and C are labeled propB and propC, respectively (A and B were reprinted from Nagano et al. [9]). C, Structural formula of BV in the ZZZssa configuration of Pr with an endo- and exo-cyclic attachment. D, Structural formula of phycocyanobilin (PCB; R = ethyl) and phytochromobilin (PΦB; R = vinyl) in the ZZZssa configuration of Pr. E, Reaction scheme of the photoinduced conversion between the parent states Pr and Pfr. Red arrows indicate photoreactions; black solid and black dashed refer to thermal relaxations and thermal isomerization reactions. The states highlighted in orange and violet include chromophores in the ZZZssa and ZZEssa configuration, respectively.
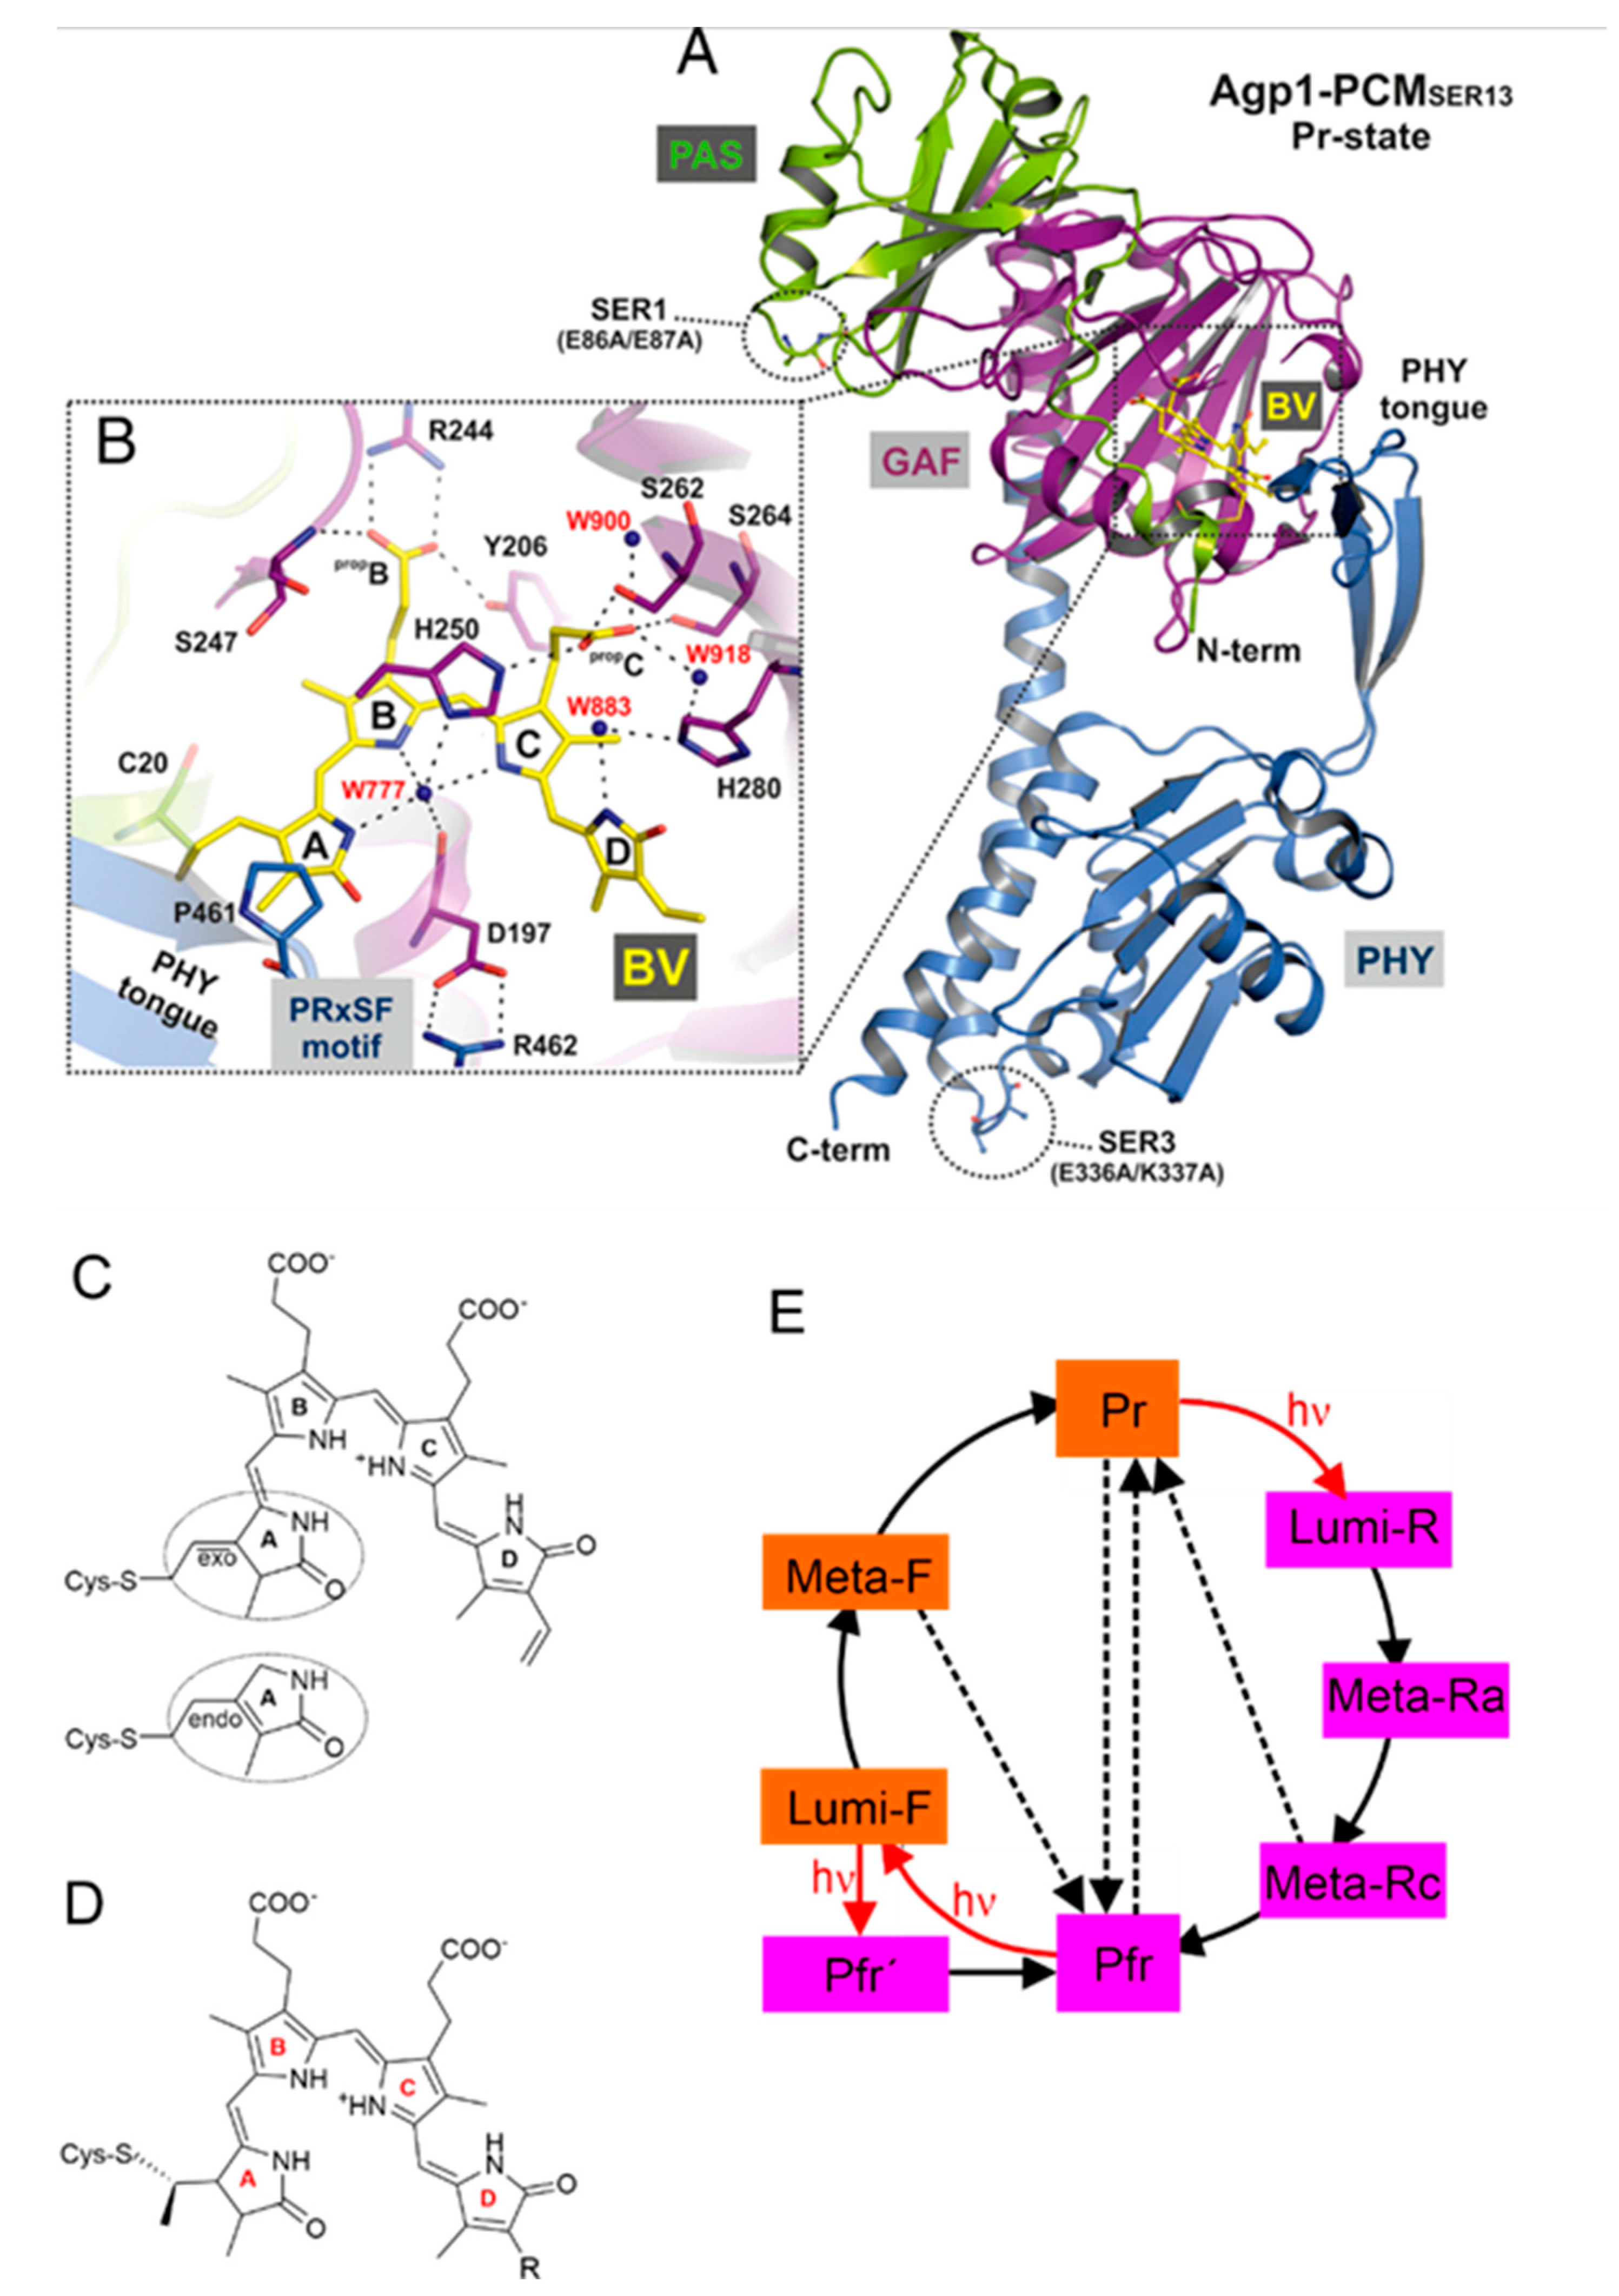
Figure 2.
RR spectra of the parent states Pr and Pfr of the prototypical phytochrome Agp1 and bathy phytochrome Agp2 from A. fabrum. The spectra were measured with 1064 nm at 80 K in H2O (black) and D2O buffers (red). Left panel: overview of the spectral region which is of primary interest for the RR spectroscopic characterization of the chromophore. The main character of the modes in specific regions is described by torsional (tors), deformation (def), in-plane bending (ip), single-bond and double bond stretching (C-C/C-N, C=C) coordinates. The peak labels refer to the frequencies in H2O (black) with the corresponding shifts in D2O (red). Only for the largely pure N-H ip modes of ring B and C the absolute frequencies are given in both H2O (NH ip) and D2O (ND ip). Right panel: Expanded view of the region of the C=C stretching modes of the methine bridges between the rings A and B (AB), B and C (BC), and C and D (CD). Note that except for Pfr of Agp2, all spectra show two band components originating from the A-B stretching and thus reflecting a structural heterogeneity of the chromophore. Similar effects are detectable for HOOP of the C-D methine bridge. This region also includes the NH ip modes of the rings B and C. Further details and a comprehensive spectra interpretation are given in refs. [74,104,105,109].
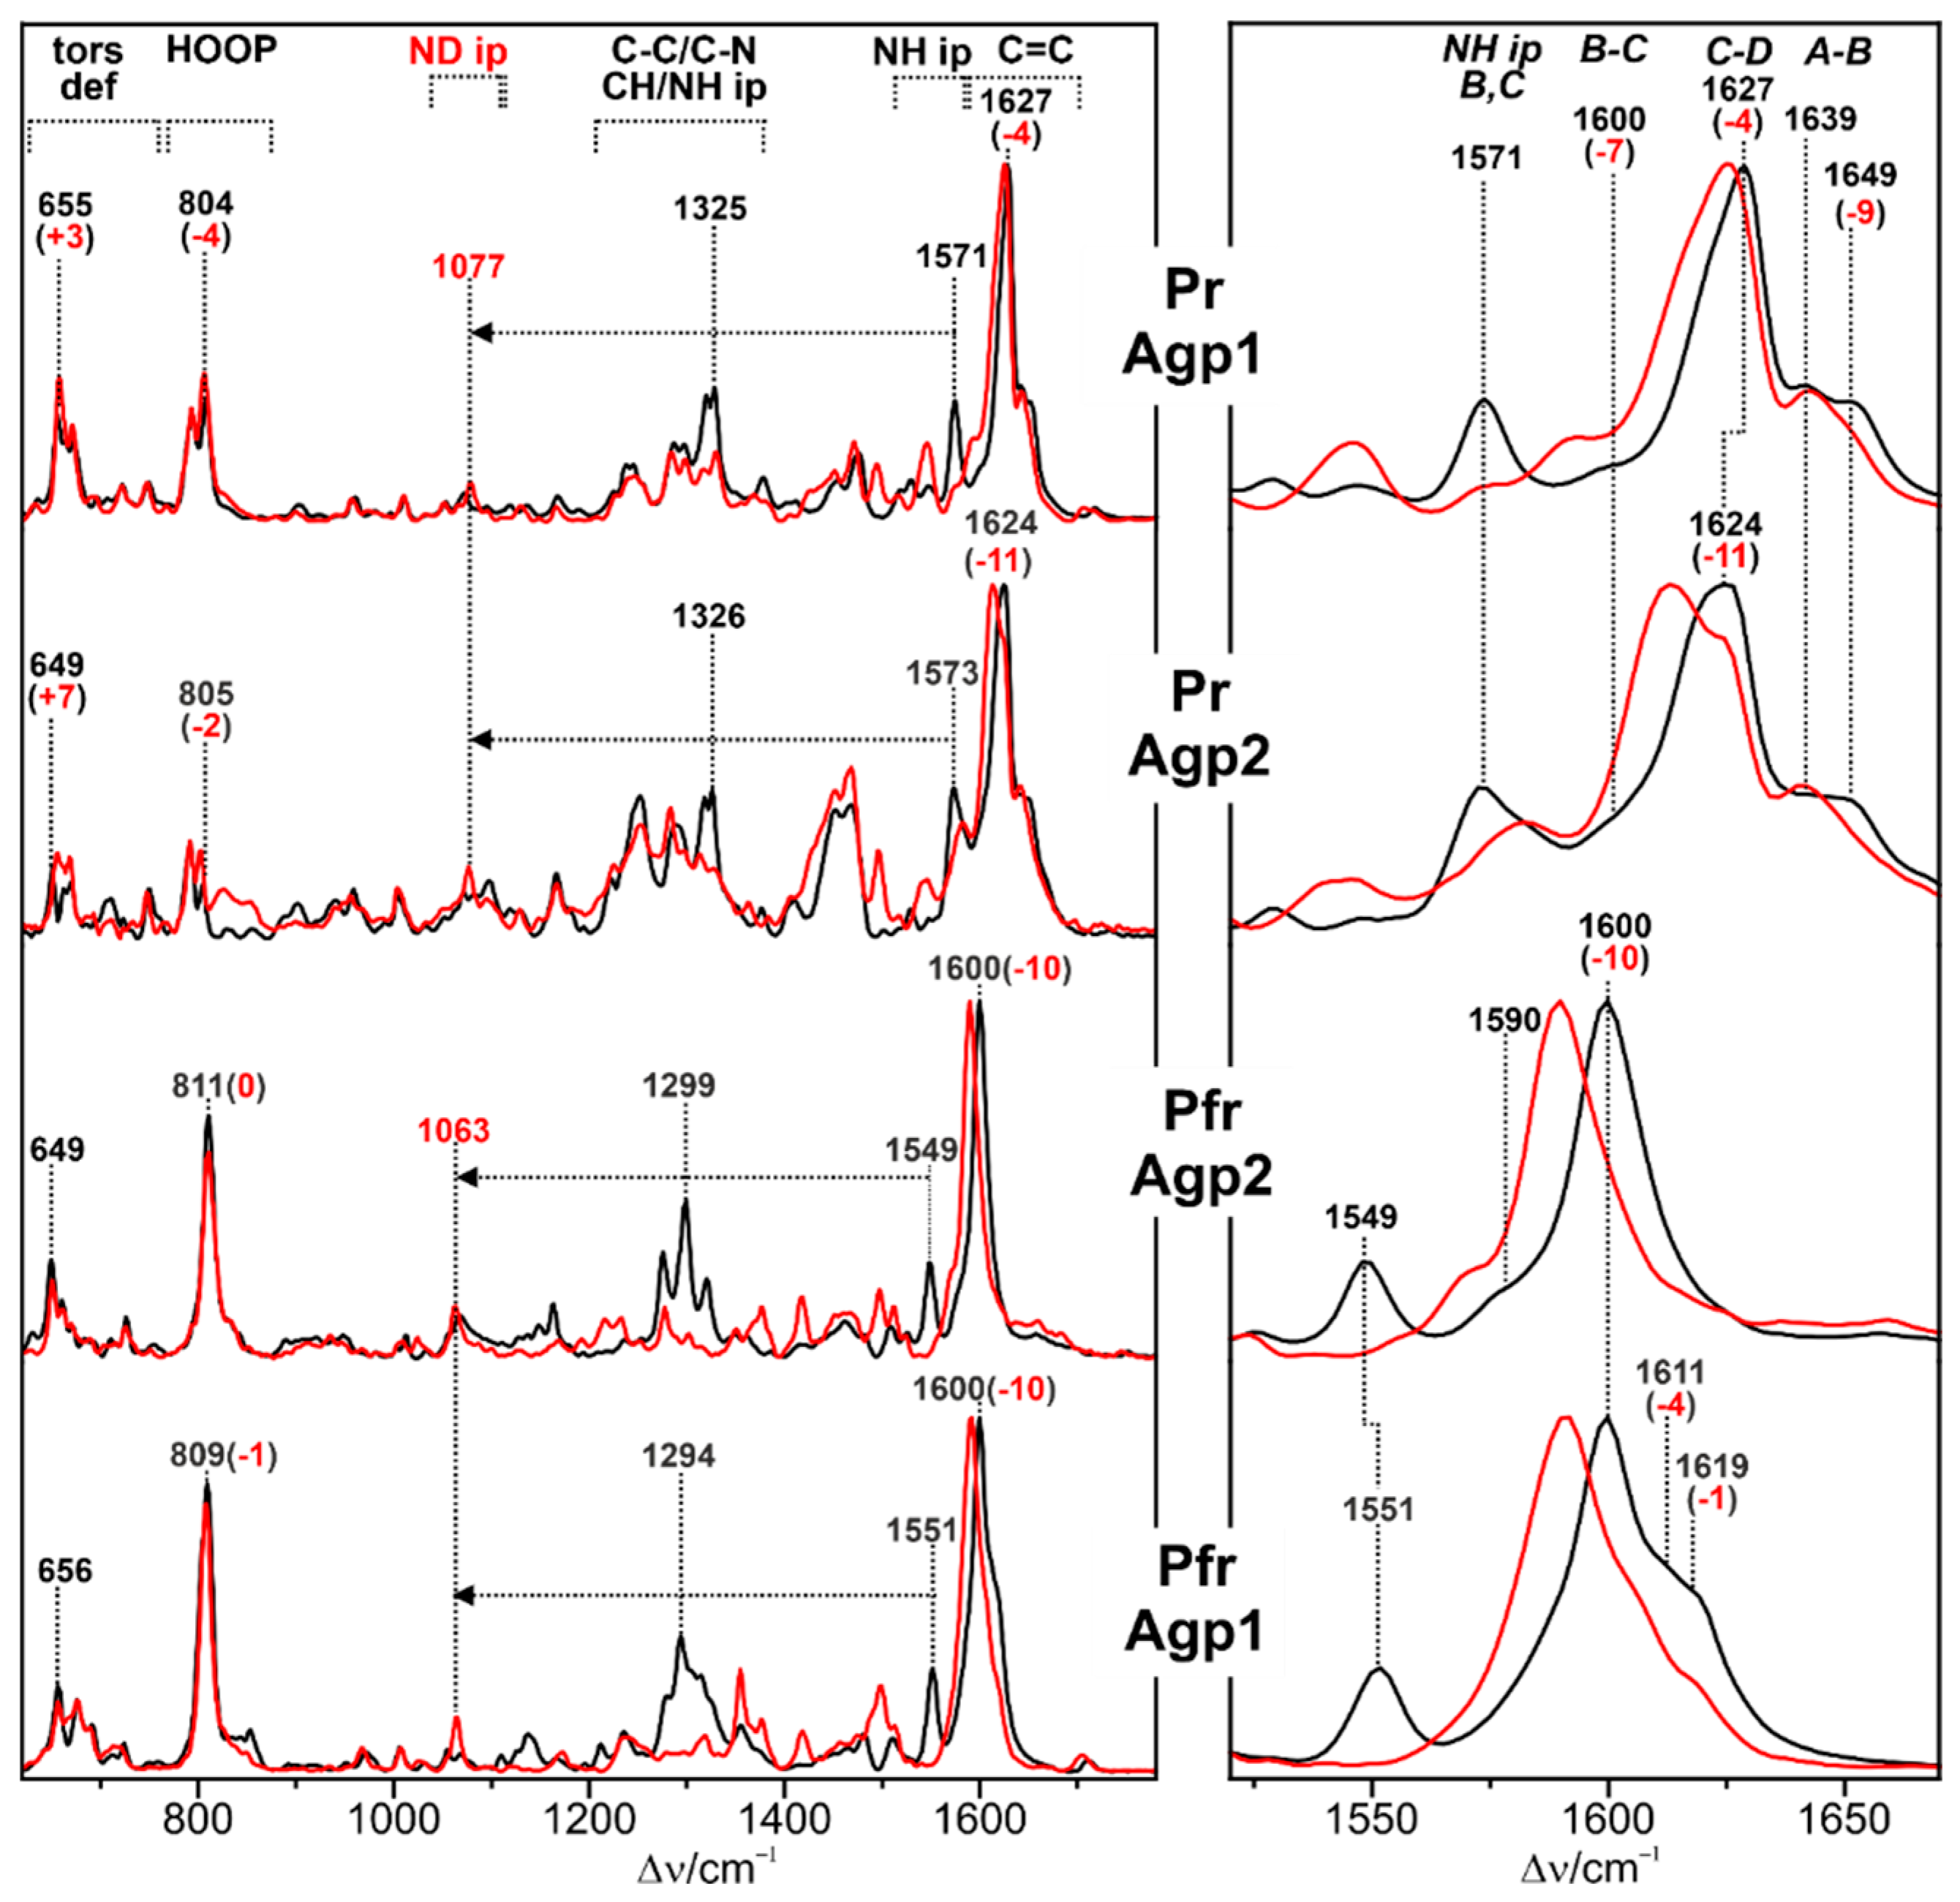
Figure 3.
Time-resolved FSRS spectra of Cph1Δ2 measured by using a 792-nm Raman pump pulse after photoexcitation of Pr at 635 nm. Dispersive peaks from 200 to 350 fs are attributed to hot luminescence features whose correspondence to the main ground-state peaks is indicated by the solid vertical lines at 794, 1312, and 1629 cm−1. The electronic echo artifact is marked by an asterisk. The Pr ground-state Raman spectrum is scaled by 0.2 (left panel) and 0.1 (right panel). The 40-ps (Lumi-R) spectrum is blown up by 1.5. Reprinted from Dasgupta et al. [64].
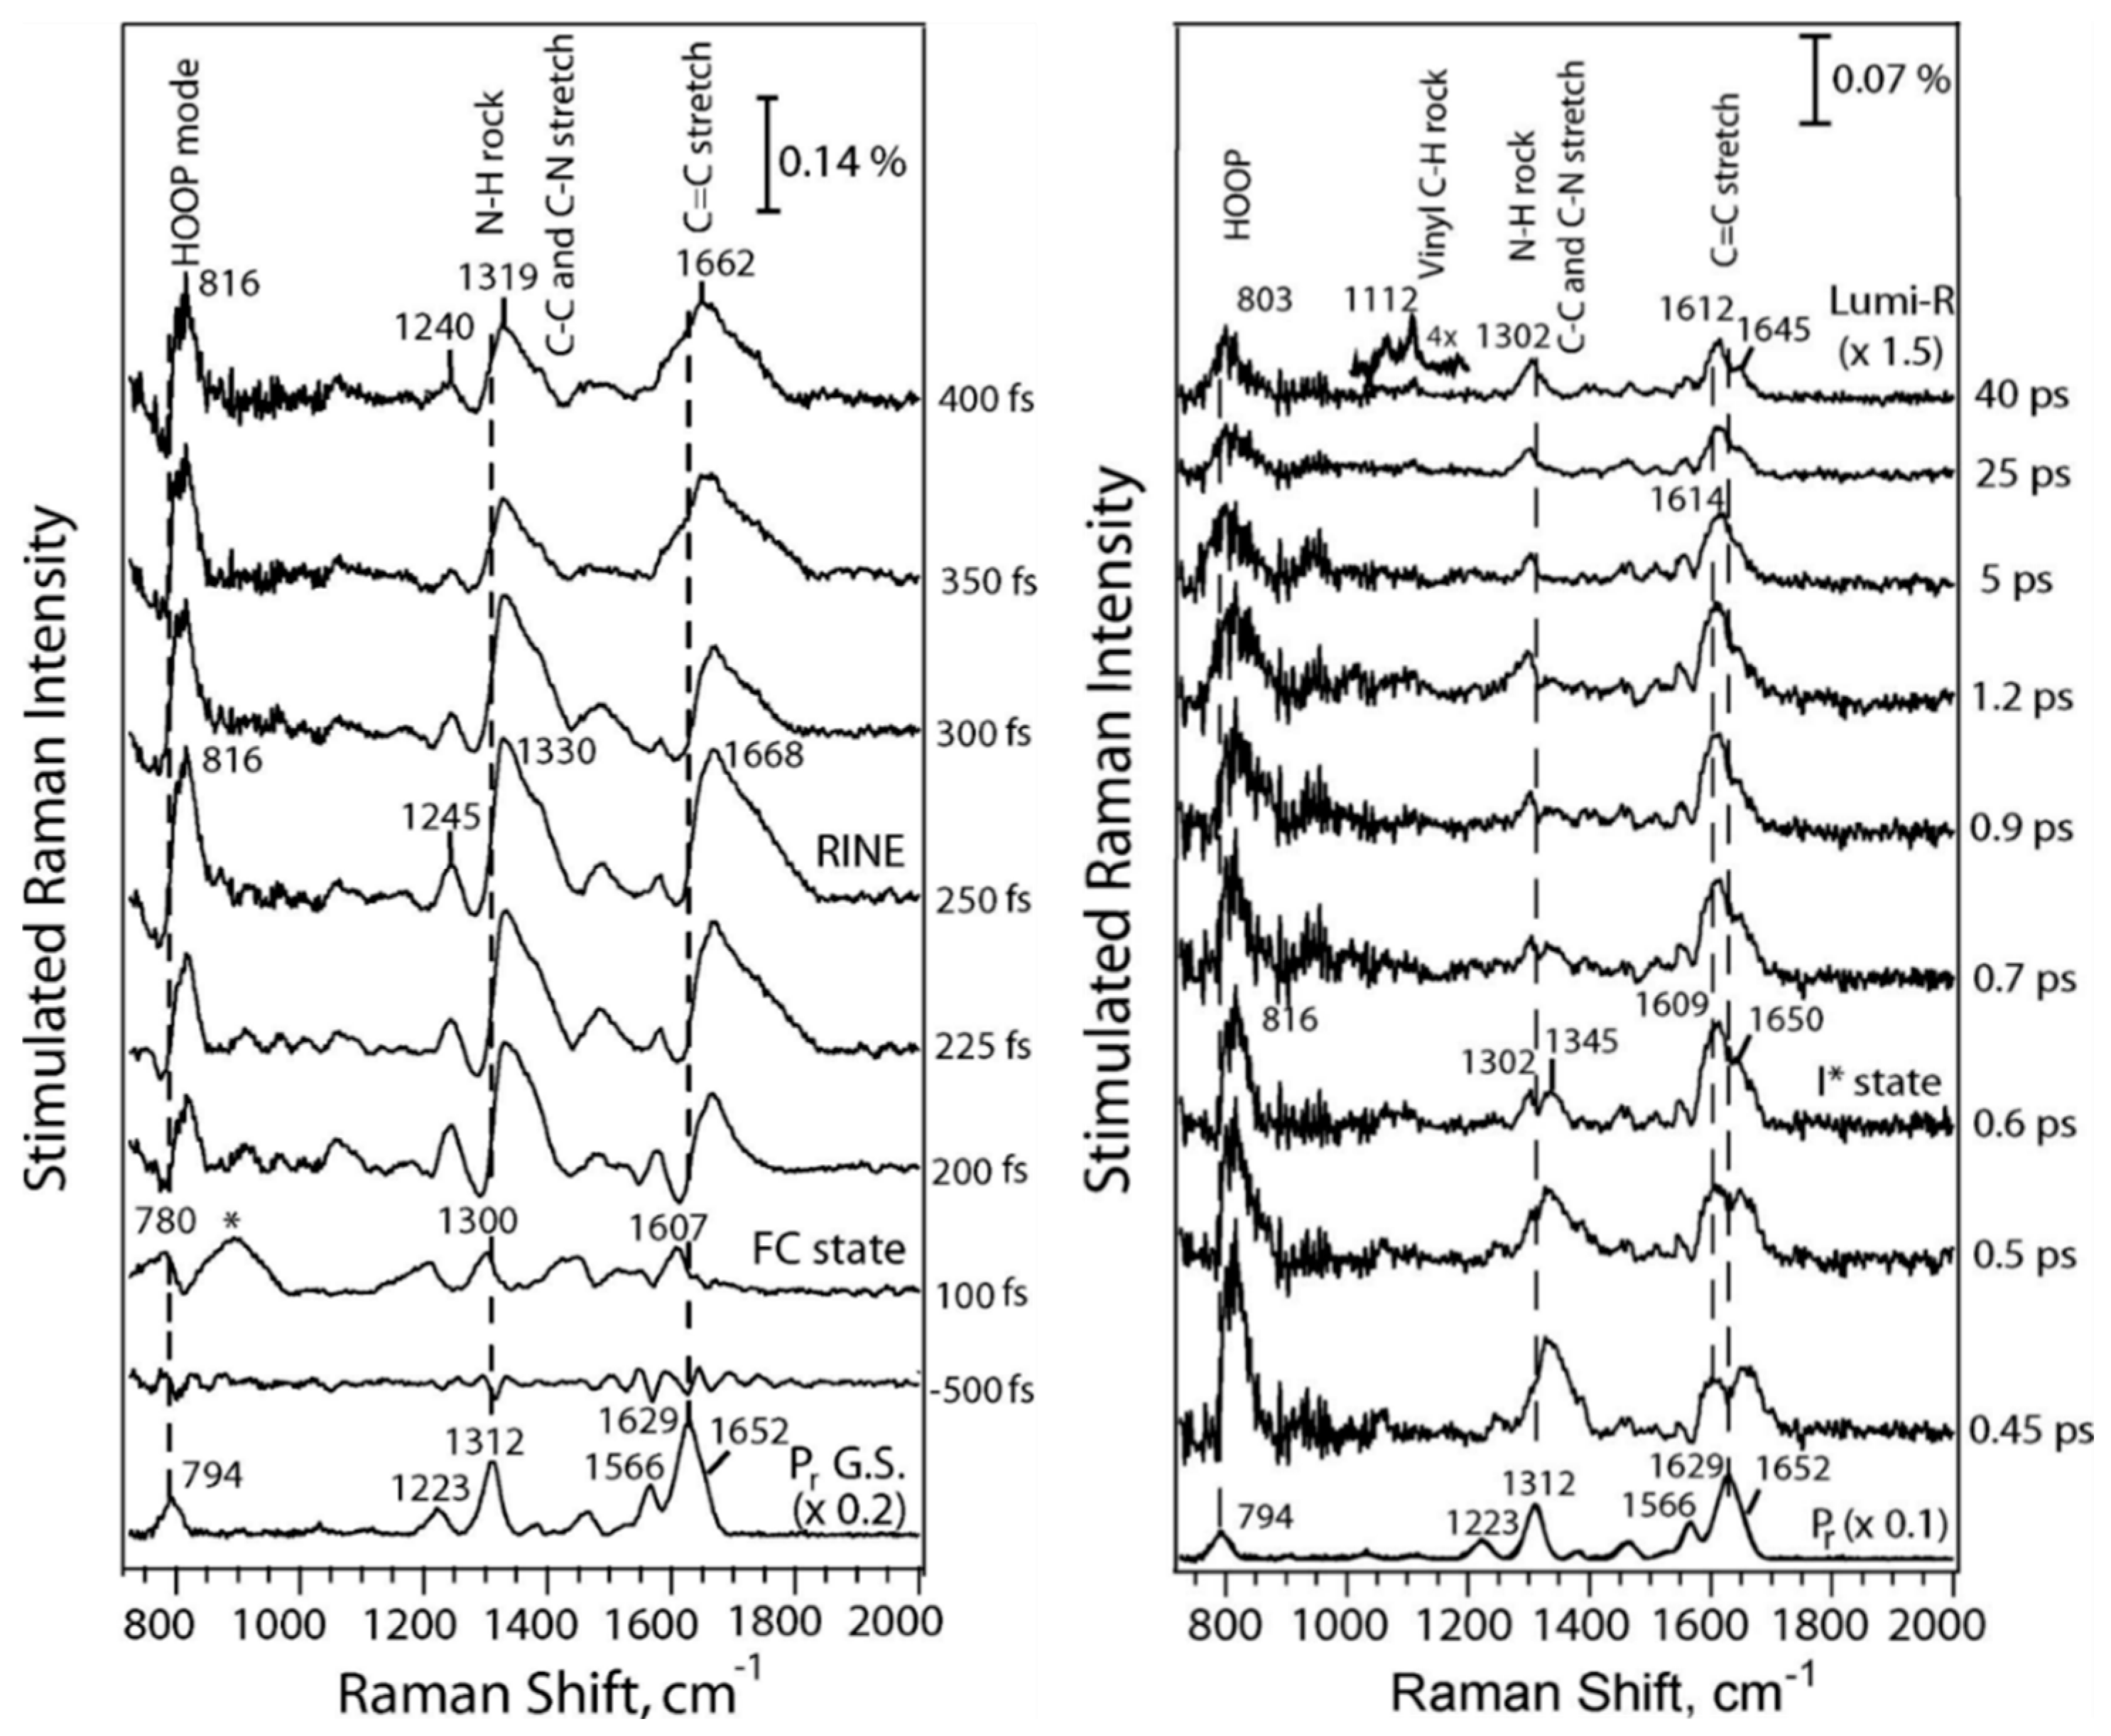
Figure 4.
Time-resolved IR spectra of the photoinduced processes of monomeric DrBphP (PGP). (a) The global analysis of step-scan IR spectroscopic data of DrBphP yields species-associated difference spectra (SADS) for three components. The steady-state IR difference spectra of Pfr minus Pr are included at the bottom (green). The positive and negative signals are due to the intermediate/product and the initial Pr state, respectively. The spectral resolution of the steady-state spectra is higher (2 cm−1) than those from step-scan (8 cm−1). (b) The concentration fraction of each species was derived as a function of time from the global fit of the IR data. (c) Global analysis of flash photolysis data of dimeric PGP yields the evolution of the three species in the visible spectral range for comparison. Reprinted from Ihalainen et al. [147].
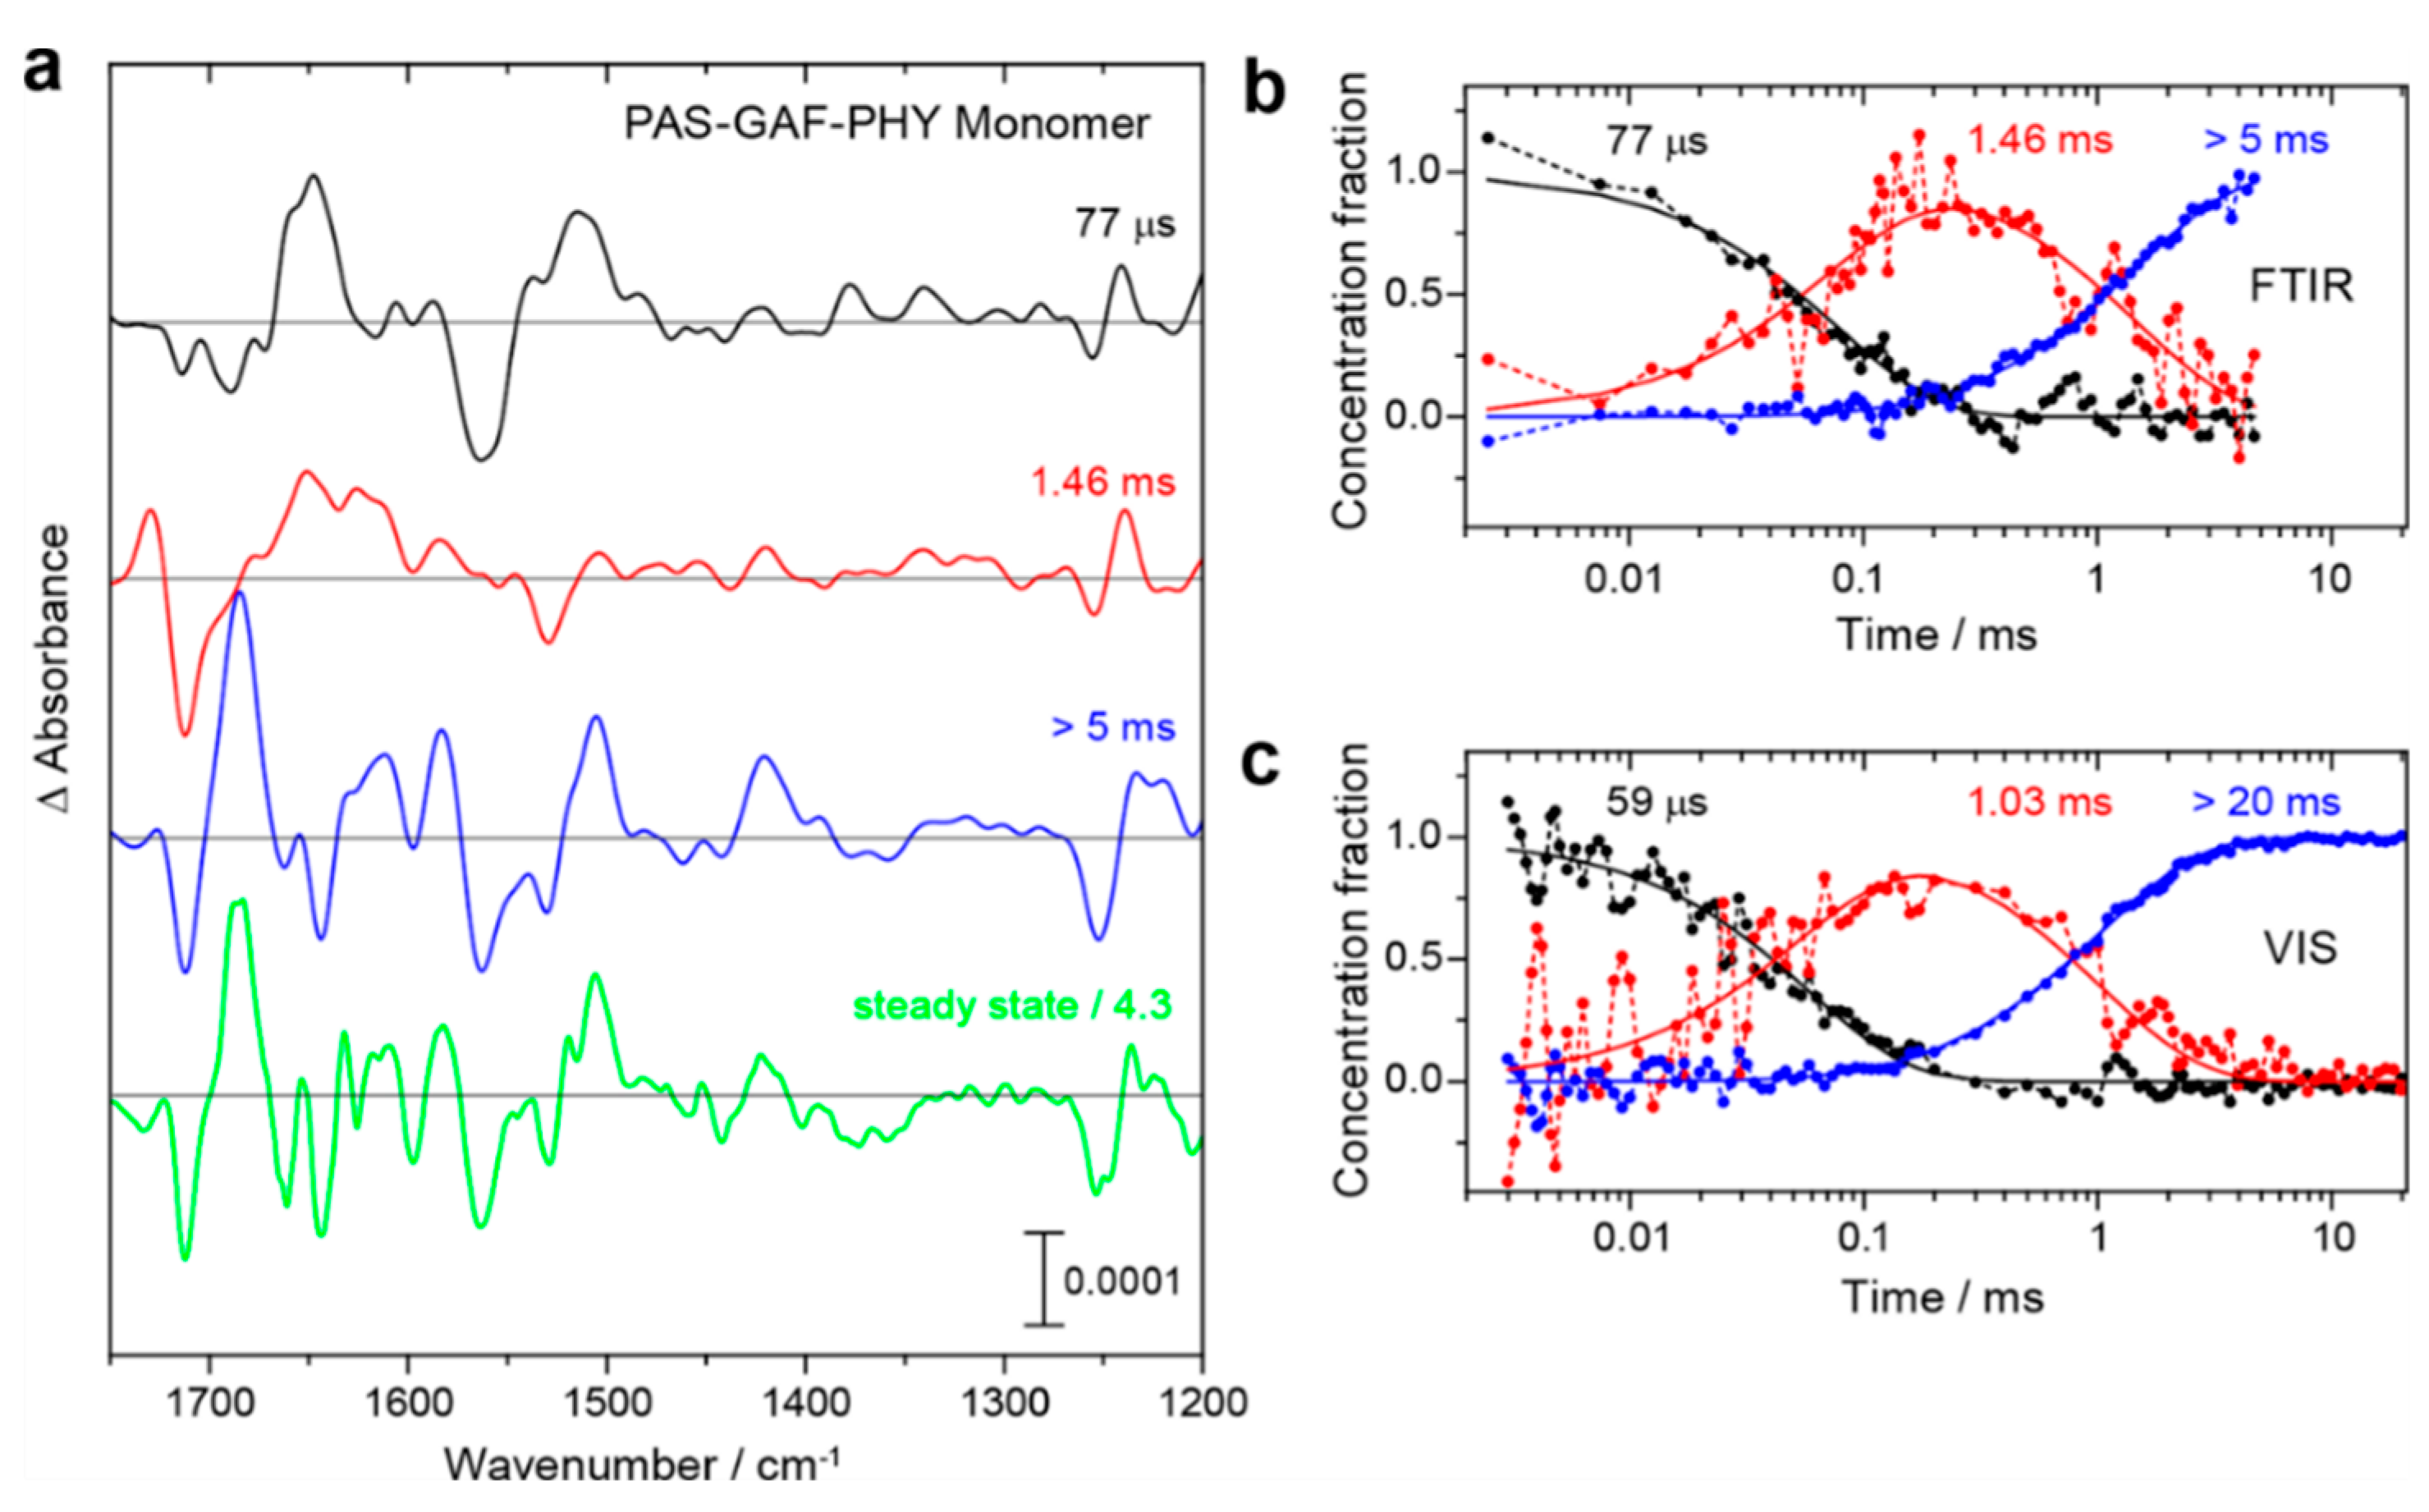
Figure 5.
Left panel: IR difference spectra of the final photoproducts (positive signals/black labels) of Pfr (negative signals/white labels on black areas) of various Agp2 variants, measured at ambient temperature (H2O, pH 7.8). The photoproduct spectra were recorded under continuous 785 nm irradiation (> 120 s). “FL” and “PCM” refer to the full-length and photosensor core module, respectively. All spectra were normalized with respect to the negative signal at 1749 (1750) cm−1. Right panel: Plot of the amide I difference signal (β-hairpin + α-helix) against the intensity of the protonated propC of the photoproducts determined from the IR difference spectra. The intensities were normalized with respect to that of the protonated propC of Pfr. The straight red line serves to guide the eye but does not implicate a linear relationship. Figure was redrawn from data shown in Kraskov et al. [52].
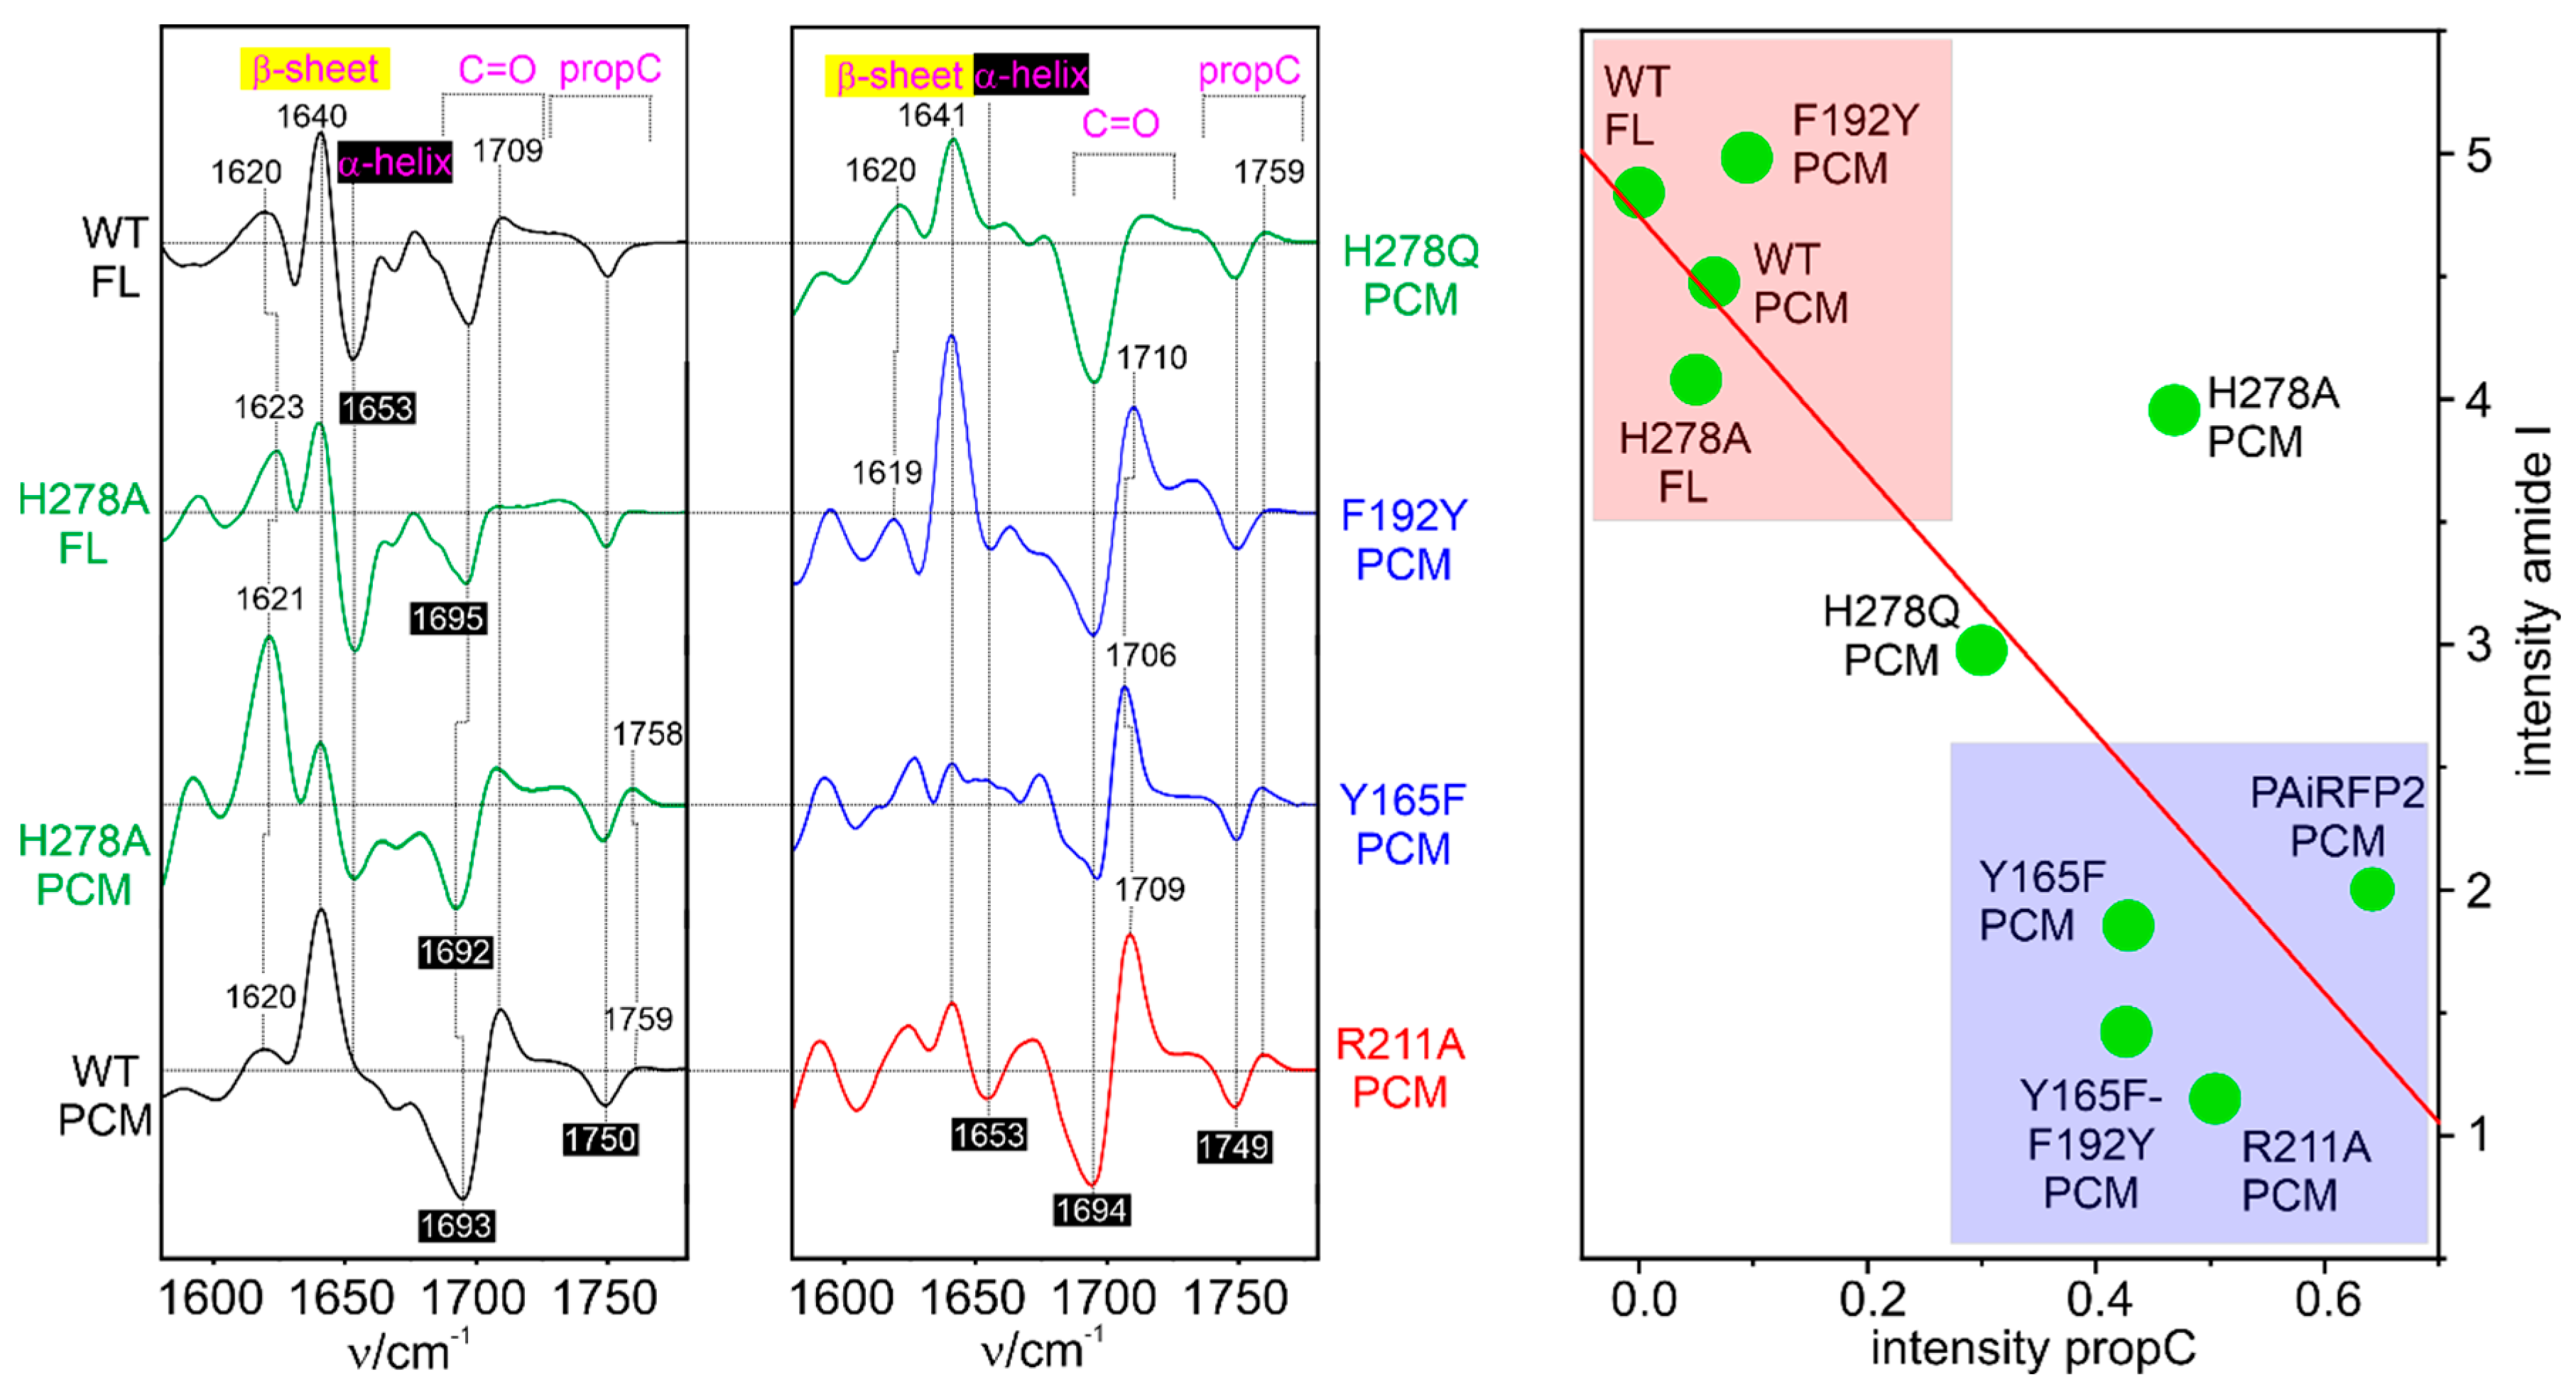
Figure 6.
IR spectra of the nitrile stretching modes of F192pCNF (left) and Y165pCNF (right) for the different states (blue, green, and red traces) of the Pfr→Pr photoconversion, measured at different temperatures. In each case, the spectrum of the Pfr state (black trace) is shown as a reference. To obtain the pure spectrum of Pr spectrum of F192pCNF (red trace), a residual contribution (ca. 25%) of Pfr was subtracted from the spectrum measured at ambient temperature (magenta trace). Band positions were determined from fits of Gaussian bandshapes to the spectra. Reprinted from Kraskov et al. [122].
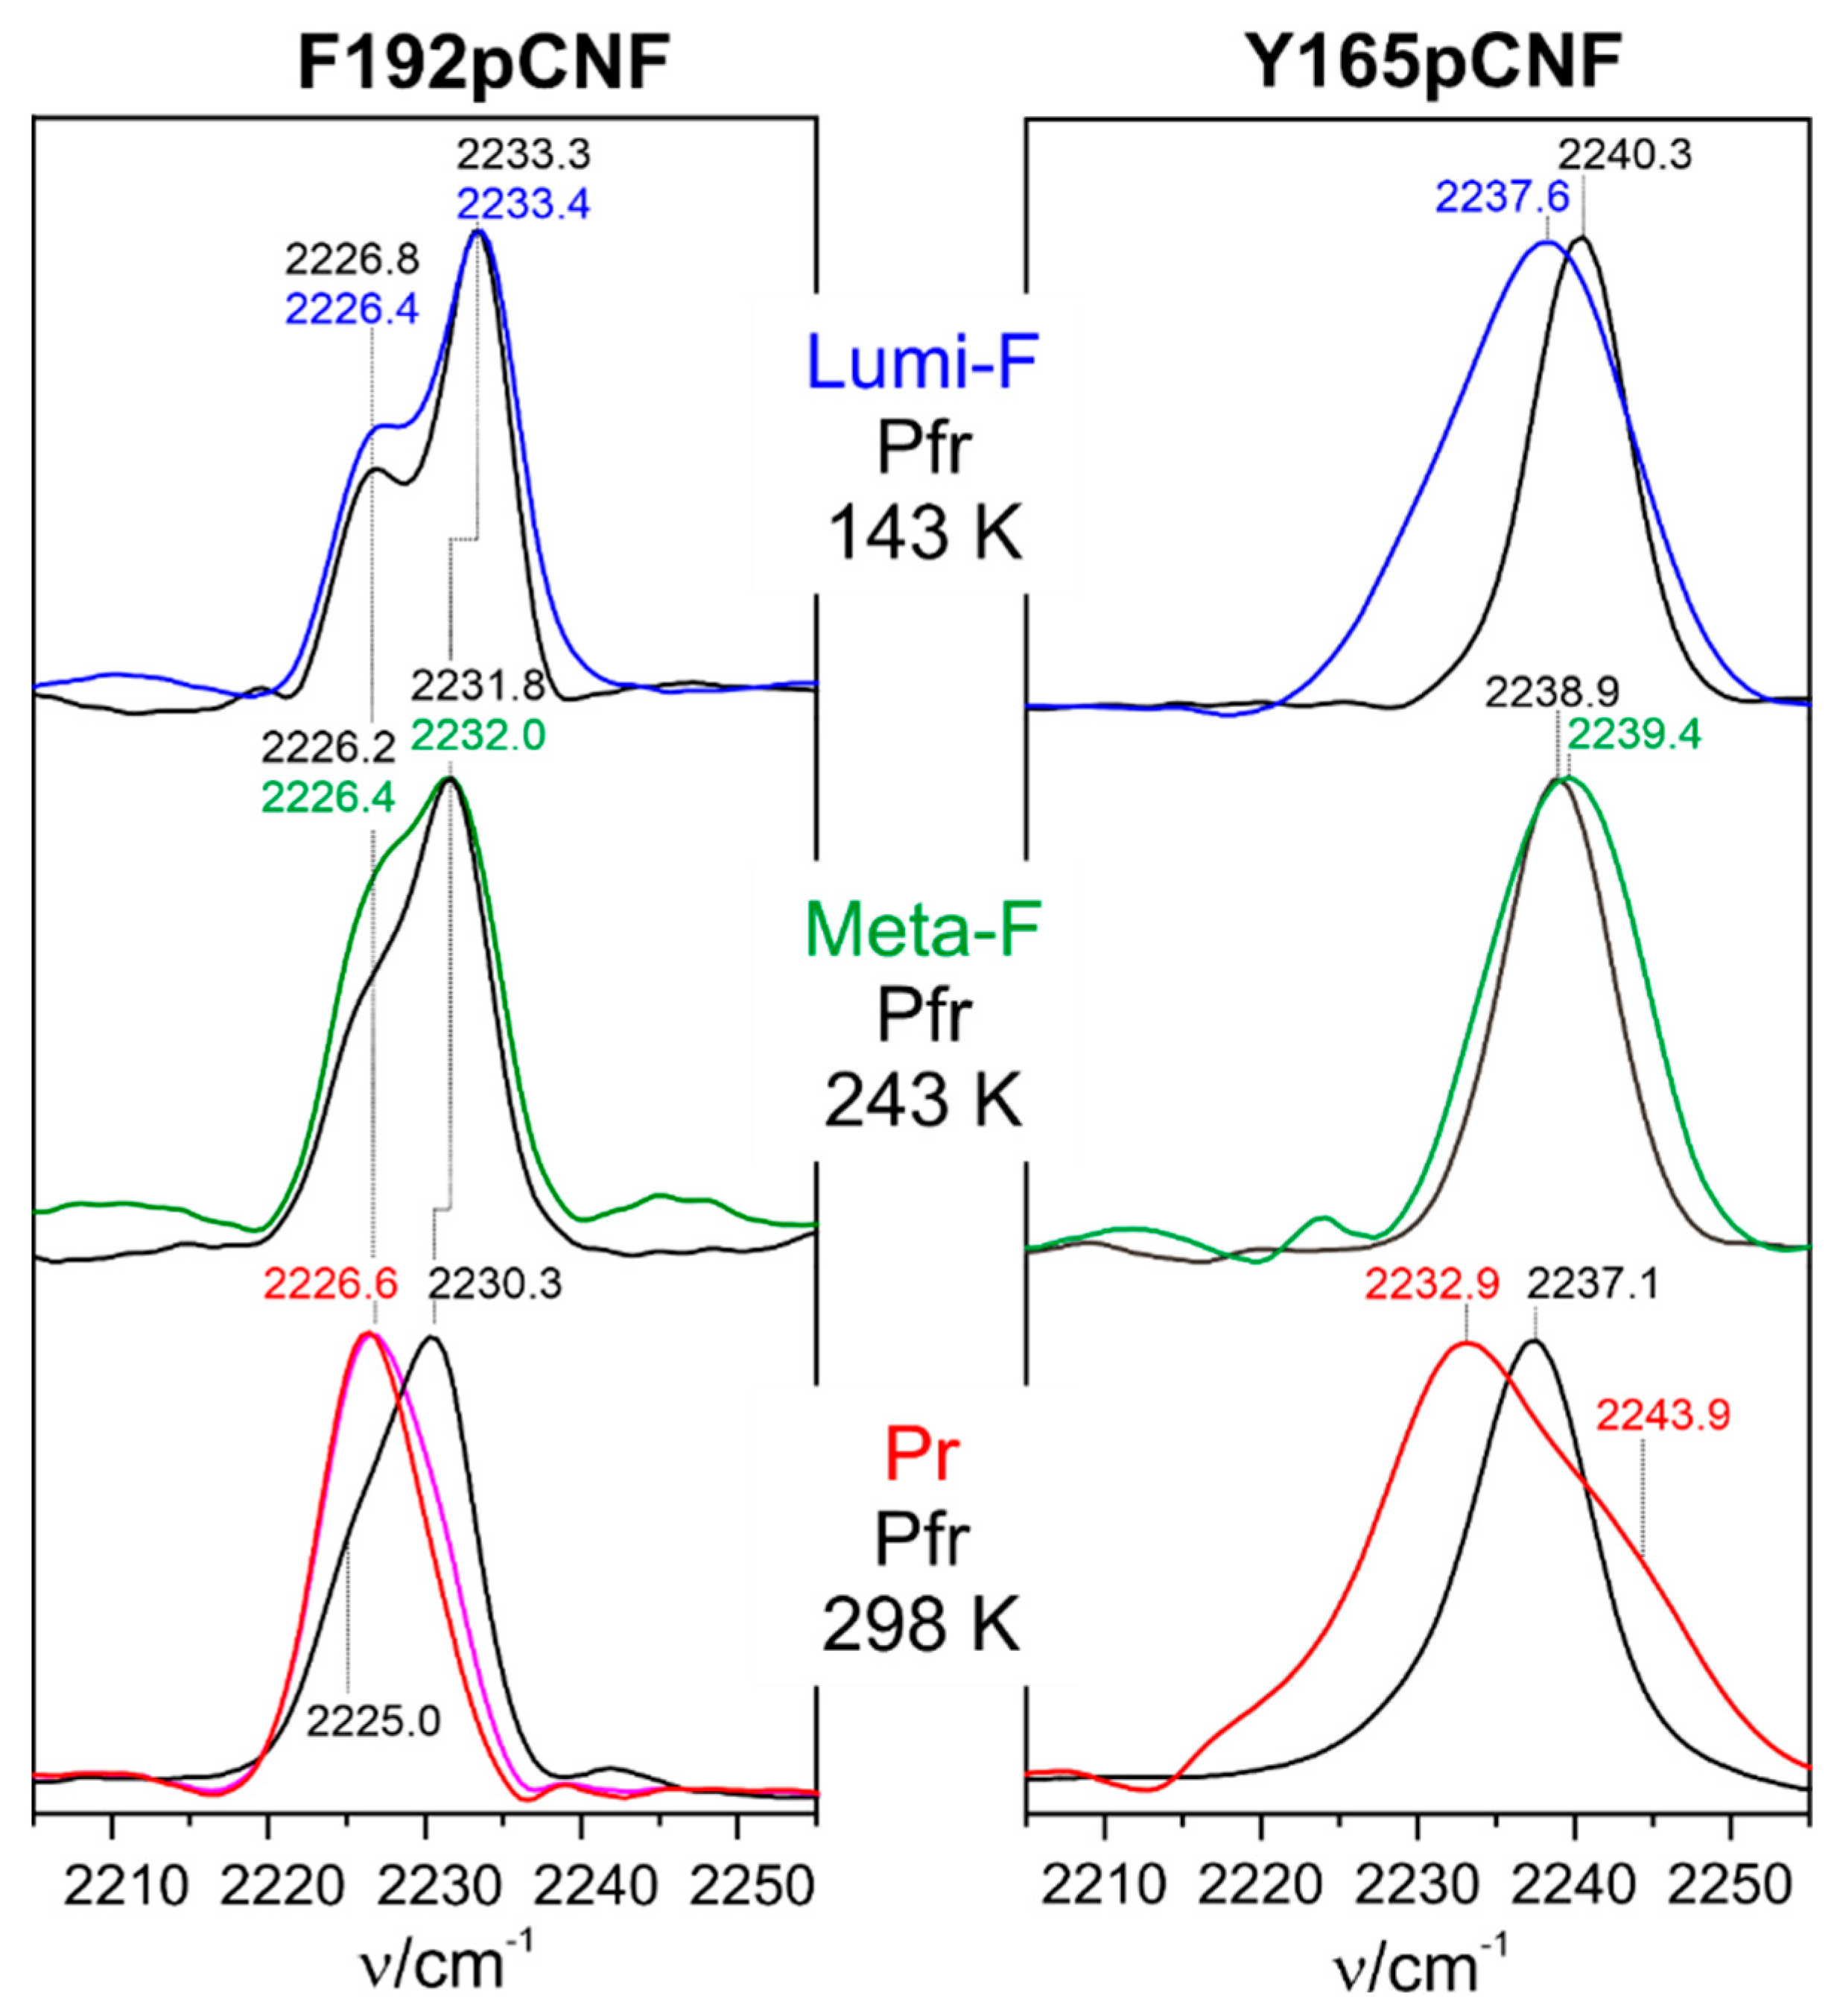
Figure 7.
RR spectra obtained 1064 nm excitation of (A) Pr (red line), (B) the O600 intermediate (orange line), and (C) Pg (green line). The black traces refer to the calculated spectra obtained by QM/MM calculations. Further details are given in [175].
Figure 7.
RR spectra obtained 1064 nm excitation of (A) Pr (red line), (B) the O600 intermediate (orange line), and (C) Pg (green line). The black traces refer to the calculated spectra obtained by QM/MM calculations. Further details are given in [175].
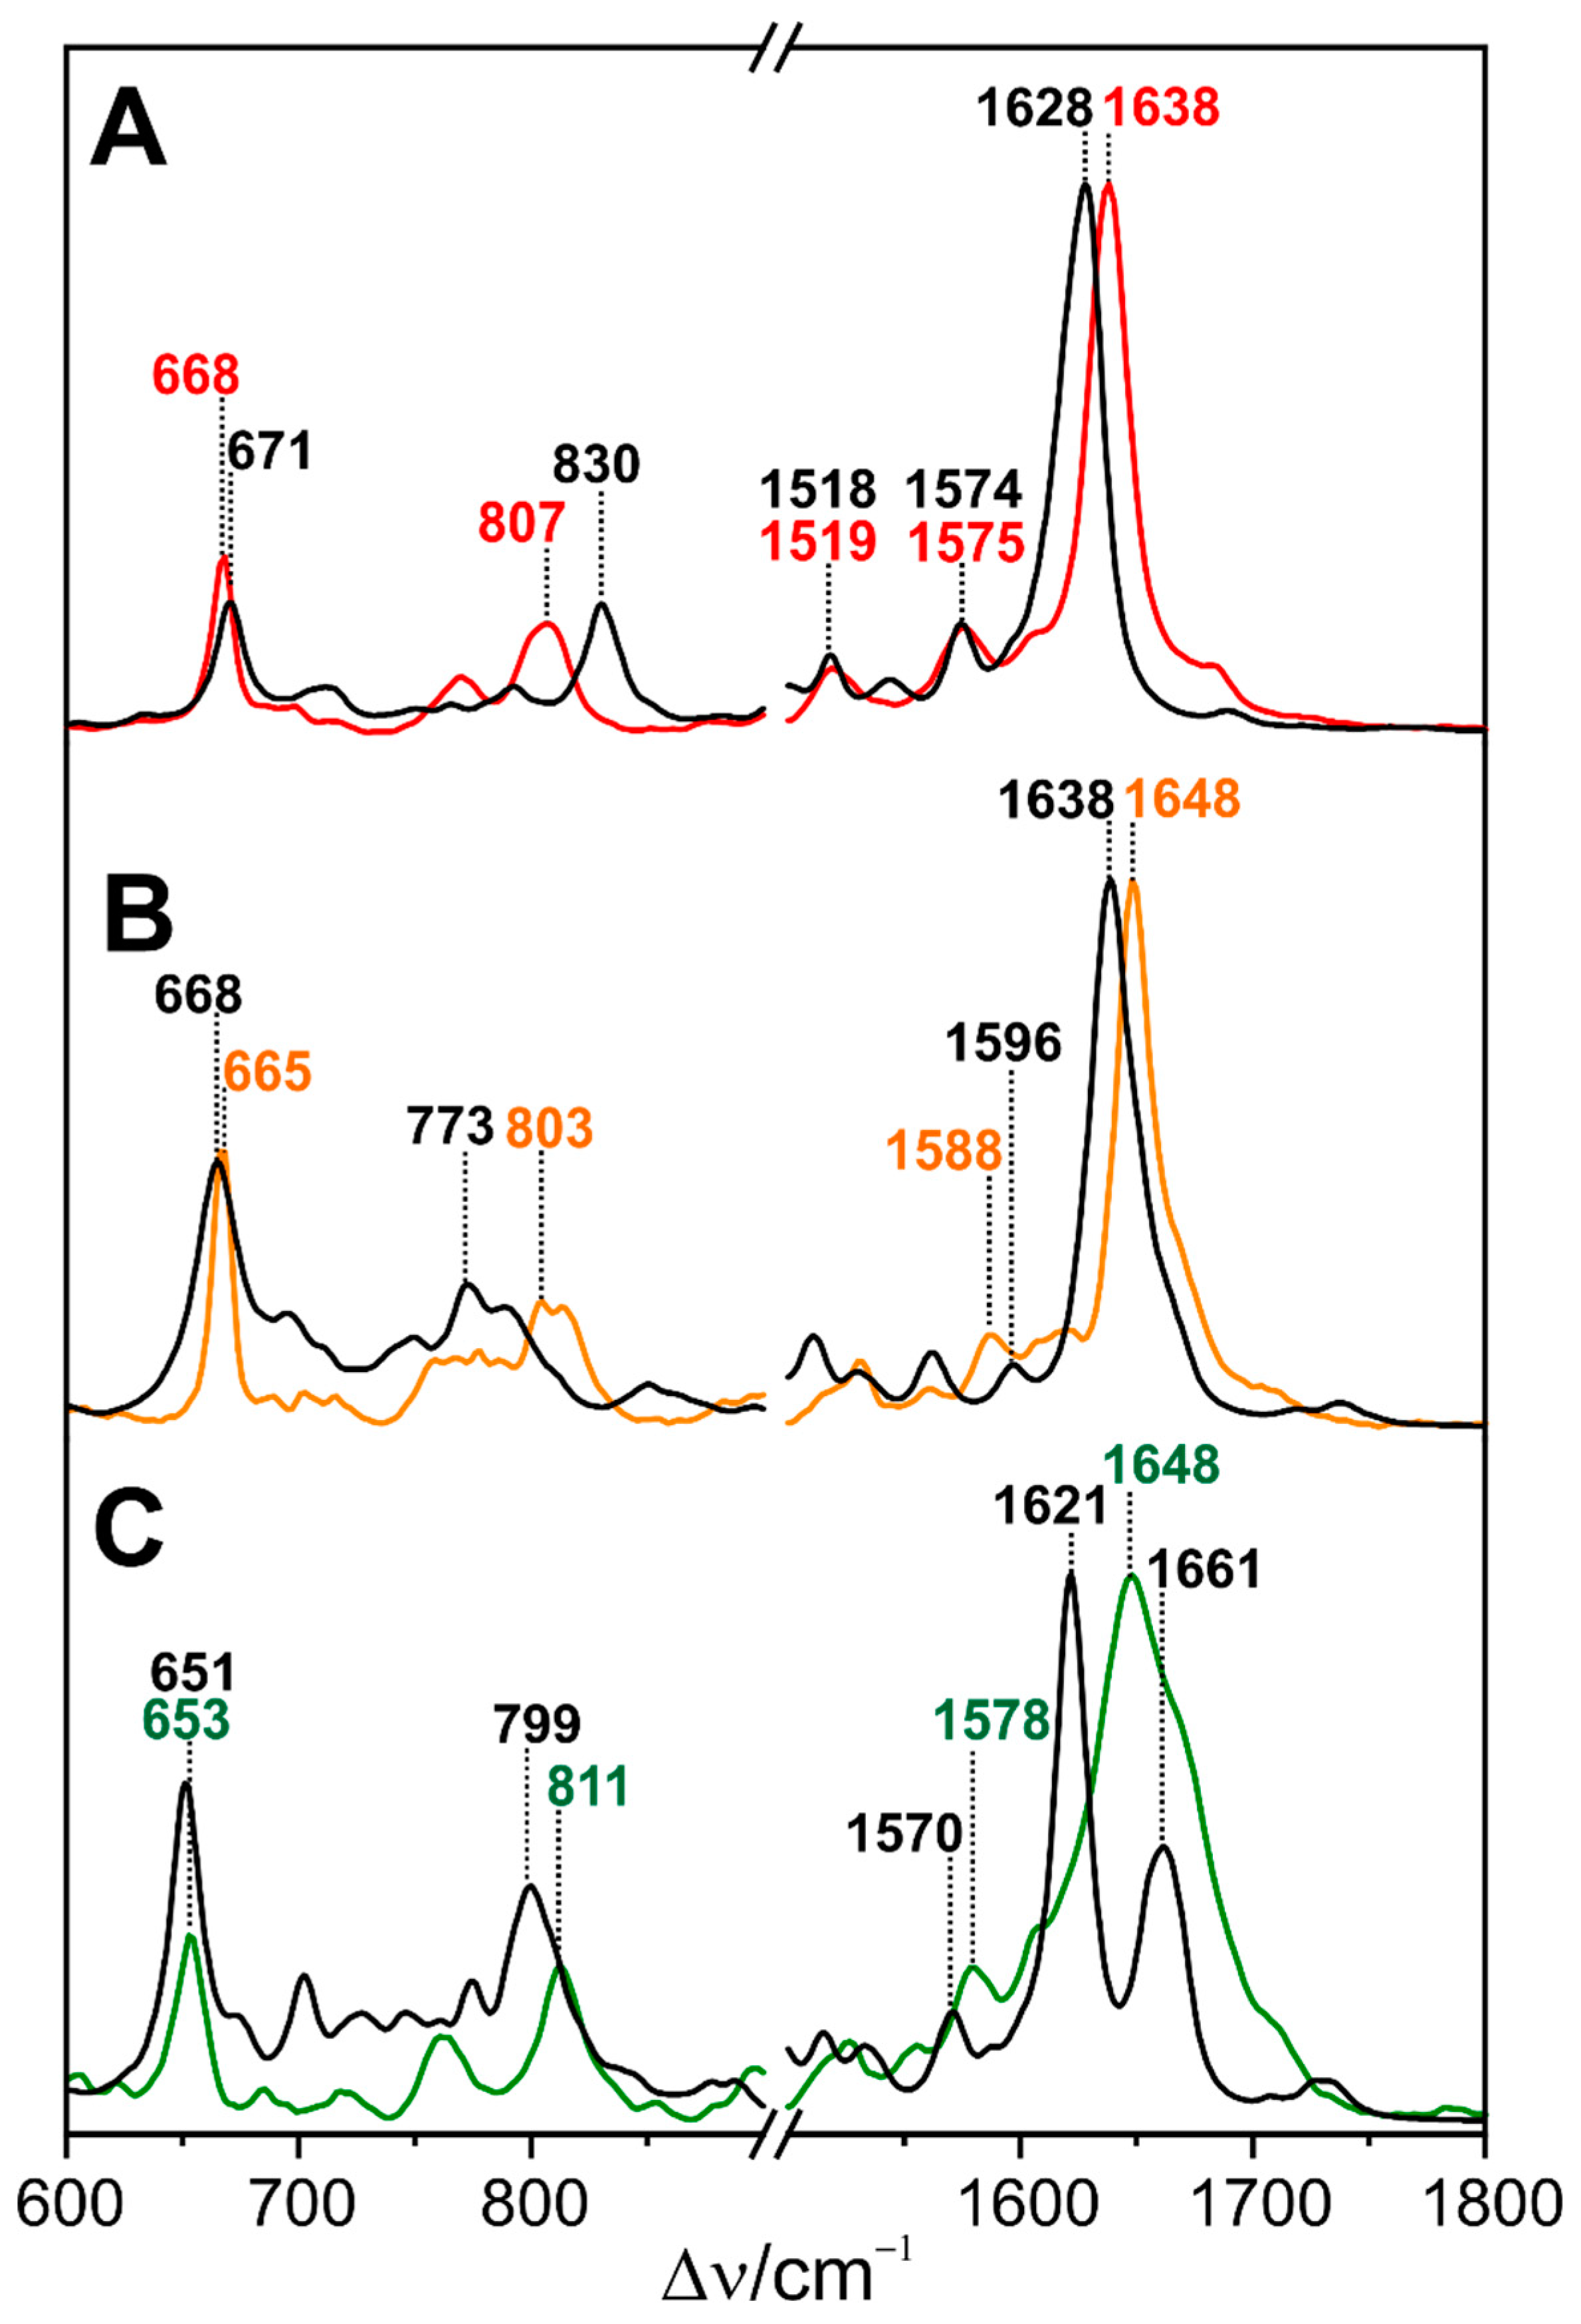
Figure 8.
A, transient IR absorption spectra, collected after excitation at 435 nm, at selected time points for “PVB” samples, where Pb states were constantly regenerated with green light; B, the same for “PCB” samples, where the Pb states were constantly regenerated with red light. The global analyses of the transient absorption data for the “PVB” samples (C) and “PCB” samples (D) which yielded three EADS that sequentially interconvert. Figure was reproduced from Hauck et al. [36].
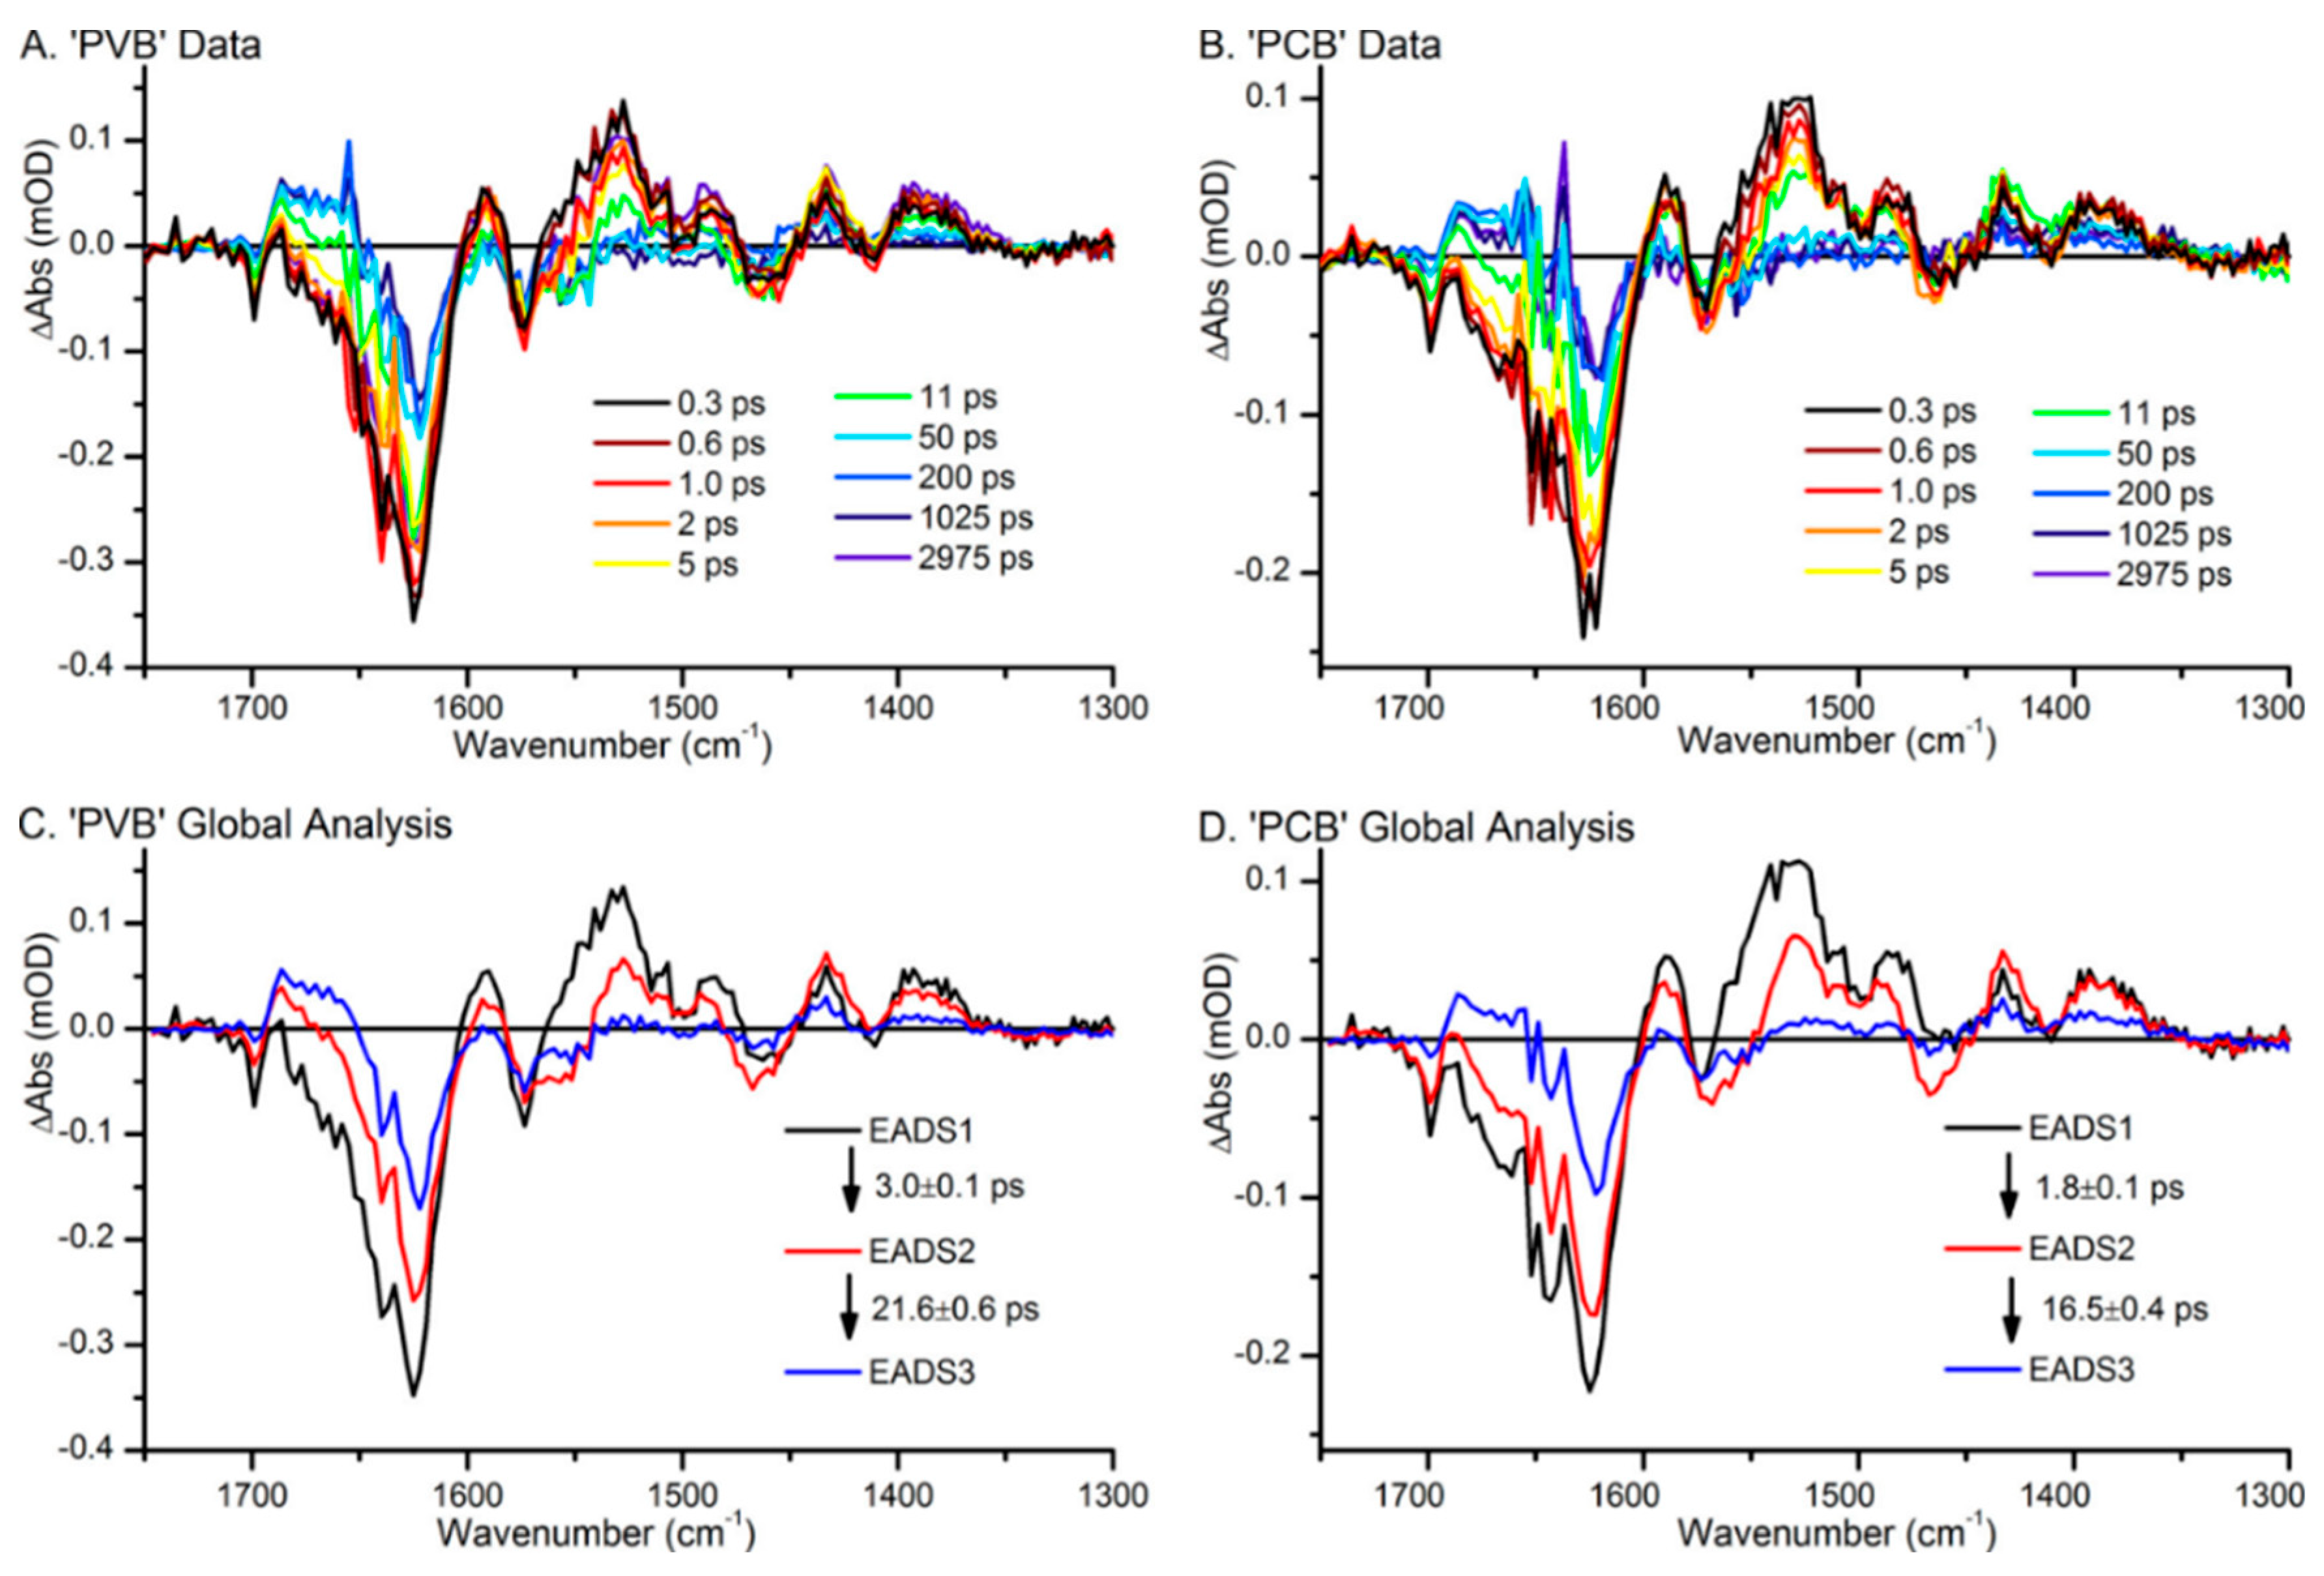
Disclaimer/Publisher’s Note: The statements, opinions and data contained in all publications are solely those of the individual author(s) and contributor(s) and not of MDPI and/or the editor(s). MDPI and/or the editor(s) disclaim responsibility for any injury to people or property resulting from any ideas, methods, instructions or products referred to in the content. |
© 2024 by the author. Licensee MDPI, Basel, Switzerland. This article is an open access article distributed under the terms and conditions of the Creative Commons Attribution (CC BY) license (https://creativecommons.org/licenses/by/4.0/).
Copyright: This open access article is published under a Creative Commons CC BY 4.0 license, which permit the free download, distribution, and reuse, provided that the author and preprint are cited in any reuse.


