
Submitted:
29 May 2023
Posted:
31 May 2023
You are already at the latest version
Abstract
Statistical based reconstruction methods and signal processing tooling techniques are implemented and used to detect delaminations or debondings within composite items. From literature it appears that, although a single procedure for the estimation of the structural health is a fast solution, a multiple analysis based on different reconstruction methods or different damage parameters could provide more detailed information about the location and the severity of possible failures. This work discusses the advantage of using cross-correlation analysis in a data-driven approach based on ultrasonic guided waves (GW) tomographic technique and piezoelectrics (PWAS) in pitch-catch configuration. In this sense, this work evidences an improvement in damage detection when the cross-correlation is included as part of the GW-based system for damage assessment approach. The specimens used as test structures to demonstrate the validity of the methodology derive from an aircraft wing test article where damages are specified as skin delamination produced by low energy impact.
Keywords:
Composite structures
; Structural health monitoring
; Cross-correlation analysis
; Guided waves
; Piezoelectric sensors
1. Introduction: industrial scenario
Requirements for structural health monitoring, in the last decades, have rapidly increased, and these requirements have stimulated many new developments in various sensing technologies. Having passed the stage of scientific or technical curiosity, SHM is now entering its adulthood and systems need to clearly demonstrate their economic benefits as well. Owners and engineers are no longer satisfied with the general benefits of SHM such as “reducing risk”, “improving knowledge” and “verifying hypotheses”, and need to provide justification from an economic point of view, clearly defining the cost-effectiveness of a SHM system. As with any commercial market, the relationship between the cost of a product and the perceived benefit for the buyers, is a central concept for the SHM industry as well. There are several scientific studies [1-4] showing how the correct implementation of SHM can have a positive impact on the live-cycle-cost of a structure, and therefore presents a positive cost/benefit ratio. Commercial experiences and l perspectives proposing SHM systems have allowed to identify several scenarios, where immediate, near-term and long-term cost savings exceed the SHM system cost confirming the benefits of its implementation. The designing and implementing of a cost-effective SHM System constitute a process that must be carried out following a logical sequence of analysis steps and decisions. Below the main steps that have proven, over the years, how to achieve an integrated structural health monitoring systems that respond to the needs of all industry parties involved in the design, construction and operation of structures of all kinds.
Step 1: Identify structures needing monitoring
This step might seem trivial, but is indeed a very important first step. Before considering a structural health monitoring system, it is important to consider if a specific structure will really benefit from it.
Step 2: Risk / Uncertainty / Opportunity analysis
The SHM system designer, the design engineers or the engineers in charge of the structural assessment and the owner, must jointly identify the risks, uncertainties and opportunities associated with the specific structure and their probability. The risk analysis will lead to a list of possible events and degradations that can possibly affect the structure. The result of this step is a list of risks that must be addressed by the SHM system.
Step 3: Responses
For each of the retained risk, uncertainty and opportunity, it is fundamental to associate one or several responses that can be observed directly or indirectly. For example, corrosion produces a chemical change, but also a section loss. The inaccuracy of the Finite Element Model produces a difference in the response between the structure and the model. At this stage, it is also useful to roughly quantify the expected responses. This is very important to select sensors with the appropriate specifications.
Step 4: Design SHM system and select appropriate sensors
The goal is now to select the sensors that have the appropriate specifications to sense the expected responses and are appropriate for installation in the specific environmental conditions and under the technical constraints found in the structure [5]. Often makes sense to include sensors based on different technologies, to increase the system redundancy and complementarily. On the other hand, having too many data acquisition systems will increase the system cost and complexity, so a good balance is required.
Step 5: Installation and Calibration
Installation of all systems must adhere to the supplier’s specifications. The result of this step is an as-built plan of the SHM system, a system manual and a calibration report.
Step 6: Data Acquisition and Management
This is the operational part of the process. The data is acquired and stored in a database, with appropriate backup and access authorizations. Documentation of all interventions on the structure and on the system is also important in this phase. The result of this step is a database of measurements and a log of events.
Step 7: Data Assessment
By analyzing the responses of the structure, the engineer will be able to identify if any of the foreseen risks and degradations have materialized. At this step the owner will also establish procedures to respond to the detection of any degradation. The analysis of the data might prompt further investigation, including inspection, testing or installation of additional sensors. The output of this step is a series of alerts, warnings and periodic reports.
All structural components of a commercial aircraft are inspected at regular intervals using different evaluation techniques that are expensive, complicated, and costly. Currently, the service intervals are obtained statistically by considering the probability of failure. These methods are called predictive maintenance since repairs and overhauls are preprogrammed. If continuous structure monitoring tools were available, predictive methods could be changed to the methods based on the assessment of real condition of the structure and the revisions could be made when and where they are necessary.
Continuous monitoring of the location of the damage and the level of its severity enables implementing this strategy, which would save both direct maintenance costs and time spent on each revision. Moreover, the criteria used to minimize the weight of aircraft result in an increased use of composite materials. Many flaw types, such as, barely visible delaminations BVID, detachment between layers, fiber breakage, or porosity may result in a serious loss of strength. All these defects could be monitored with structural health monitoring (SHM) techniques and systems, which would additionally permit for increasing the use of composite materials and using all their advantages. One of the main advantages would be significant savings in fuel and the corresponding decrease in CO2 and NOX emissions. Therefore, the development of systems that simplify and reduce the currently used techniques and the cost of them has to be considered [6].
1.1. Scope of this work
The success of a damage identification strategy is dependent on the actual structure and on the damage scenario that is considered. The selection of the most suitable approach is, therefore, far from straightforward and is finally a matter of compromise. This gives rise to the development of a dedicated tool that can be used to design a damage identification strategy depending on the type of structure and on the potential threats.
This work is dedicated to the identification of impact in composite structures. A primary failure mode for these structures is delamination damage of skin and debonding at the connection between skin and stiffener. Impacts near these connections can lead to local skin-stringer separation. This is a safety-critical failure mode, because it can significantly affect the structural performance of the component while remaining invisible from the outer surface. The structural ultrasonic, guided wave based, health monitoring approaches are considered in the present work. The identification of barely visible impact damage (BVID) sets the lower bound for the capabilities of the approach.
In short, impact damage assessment using integrated ultrasonic sensors is performed by signal analysis, so a common understanding of the actuation signal, of the main signal parameters (features) and of the possible feature extraction methods (decomposition algorithm) is required. The GW-based piezodiagnostic methodology assessment for BVID impact detection [6, 7] is herein compared and evaluated through the combination of another signal processing tool based on cross-correlation analysis in terms of time and cost effectiveness improving.
2. Material and Model building
SHM technology objective is to demonstrate the possibility to carry out robust monitoring devices, based on ultrasonic sensors, able to detect in service damages. For these purposes, full scale ground test, 4,5 m span, outer wing demonstrators has been tested. to validate the Structural Monitoring System (SHM) integration and functionality. SHM implementation and testing have been performed by Federico II University of Naples (Unina) as leader of the SHM scenario within the EU funded SARISTU Project, in collaboration with all the partners [7-9] . The tested wing box demonstrator consisted of a main box realized as a composite pristine parts in terms of Panels, Stringers, Ribs, Rear & Front Spar (Figure 1).
Before wing box demonstrator assembly, the wing box lower panel (LWP) material, has been modelled and sensorized for SHM system implementation. The sensors distribution, for bay, was defined taking into consideration the potential impact locations, settled in the project phase, (Figure 2).
The material inhomogeneity, anisotropy and the multi-layered construction of composite materials lead to significant dependence of wave modes on laminate layup configurations, direction of propagation, frequency, and interface conditions. Numerical 2D and 3D simulations have been carried out, by the LS-DYNA explicit Finite Element (FE) code, with the aim to evaluate the models capability to determinate group velocities at different frequencies and directions, to identify Lamb ways and frequencies most suitable for damage detection, understand the stiffener effect on wave propagation.
The finite element method (FEM) is a versatile tool to analyze this class of problems. Comprehensive numerical (finite element) approach [10, 11], including experimental results assessment, have been used to determine the interaction of ultrasonic guided waves with a crack-like defect in the composite plate corresponding to section D used as reference for materials and model building.
A preliminary tapered test panel has been built in order to test the three different lay-ups of composite plates characterizing the wing panel; the panel was divided into three bays (6, 8 and 10 mm thick) and the activities presented within this work have been carried out on one of the three (the 6 mm one – Figure 3) in order to validate the numerical and experimental methodologies and technologies before upscaling them to the full wing panel.
The panel is composed of 12 laminae of three different kind of prepreg oriented along several directions. The characteristics of the plies are summarized in Table 1.
The lamination sequence can be written as:
[5H(0°/90°);B(+45°/- 45°); U(0°/90°); U(0°/90°);B(+45°/- 45°);B(0°/90°)]s
where 5H stands for 5harness, B for Biaxial and U for Uniaxial. PWAS were applied on the structure, following the geometry in Figure 3 and acquisition of Lamb waves signals on the pristine panel was performed.
Damaged area corresponding approximately to a 26x25 mm ellipse, positioned as in Figure 3. Again, PWAS sensors were used to propagate and detect Lamb wave on the panel. The goal is to develop a numerical wave-propagation equivalent of the damage due to such an impact on that panel. Of course, the first step in defining a numerical model that can simulate the behaviour of a damaged composite laminate, is finding the way for doing the same on a pristine one. As a first attempt, the exact same properties as the ones described before were used: the sensors are placed as in the already shown configuration (Figure 3), and the sensor placed at the centre was used as actuator. The mesh is entirely made of solid elements, in particular 1mmx1mmx0.5mm brick (Figure 4).
The results obtained were close to the experimental ones, but still with some difference in propagation speed, as shown in Figure 5a,b. In particular, it is possible to notice that the simulated propagation is very accurate along the y axis, but late along the x axis. It is important to remark that the amplitude of the signals has not been considered, since it is considered linearly proportional with the amplitude of the excitation applied.
Therefore, subsequent slight modifications in the materials properties were performed. In particular the configuration with 20GPa less on the E1 module of the Uniaxial plies and 40GPa more on the E1 module of the 5Harness ones responded with a good compromise. At this step the damage has been introduced also in the material definition. The considered damaged area has been set to be a rectangle, avoiding deformed elements in the mesh. Three possible ways were considered to introduce degradation:
- Degradation of mechanical properties.
- Detachments of plies in the damaged zones.
- Both material degradation and ply detachments.
After several iterations, a good correlation was found with the third strategy considered, in particular reducing E and G modules to 60% of their pristine values, and detaching the nodes along 3 planes on the central plies of the damages zone, similarly as it would be in a delamination. The Table 2 summarizes the mechanical properties of the materials considered.
The results obtained were close to the experimental ones, but still with some difference in propagation speed, as shown in Figure 6a,b.
3. Signal Acquisition
Changes in the measured dynamic response of the structure are analyzed to reveal the presence of damages. The numerical model is used to verify assumptions and best selection for signal generation parameters to be used in the experimental campaign.
An impact delamination causes Lamb waves to propagate in a different thickness condition thus this has an effect in wave propagation velocity. A shift in the arrival time can be observed on the raw signal (Figure 7a). To check the influence of a defect, the main effect seen will be an attenuation or an absorption of a wave energy (Figure 7b). To quantify this effect and maybe correlate it with the size of the delamination, the amplitude must be precisely determined. The changes in the amplitude of wave packages can be used to detect damage [11].
In the experimental tests, elastic waves with predefined properties are launched by broadband transducers located on the surface of the structure. In this regard, the PWAS sensor (Piezoelectric Wafer Active Sensors) satisfy most of these characteristics and are the most widely used sensor for actuator or sensor applications. Also DuraAct P-876.SP1 sensor, (Figure 8 b) having dimensions 16 × 13 × 0.6 mm, active area of 0.64 cm2 and a mass of 0.5 g have been tested. DuraAct patch transducers (commercial rectangular or customized circular shape) are based on a thin piezoceramic foil between two conductive films, all embedded in a ductile composite-polymer structure [12, 13]. In this way, the brittle piezoceramic is mechanically pre-stressed and electrically insulated, which makes the transducers more robust and therefore applicable on curved surfaces (Figure 8).
Thirteen PWAS sensors, have been permanently bonded on the structure employing a vacuum based secondary bonding procedures of common use by aircraft industries. The radial sensors pattern is adopted for an optimal monitoring of the enclosed surface of the plate. A fourteenth PWAS disk is installed at the circle centre to perform a propagation velocity analysis. The overall configuration of the instrumented panel is shown in Figure 9b.
The dynamic response induced by the source is acquired by sensors conveniently located on the surface of the structural component.
Systematically, each sensor has been actuated and the signals at the other PZT locations are acquired using the classic pitch-catch method. So, the baseline signals corresponding to 156 different actuator and sensor paths, for each panel bay, were recorded at a known intact condition of the plate. The measurements were repeated ten times with the same methodology to characterize the collected populations with the above mentioned approach.
The source signal, generated by an arbitrary waveform generator (Figure 10b) (HP/Agilent 33120A), consists in a 4.5 sine cycles signal, 60 kHz central frequency, with 10V peak-to-peak tension Hanning windowed. An amplifier (Figure 10a) has been used to burst the PZT sensors with up to 80V peak to peak signal in the experiments. The ultrasonic signal has been digitized and recorded directly in a four channel digital oscilloscope (Figure 10c) with 100MHz sampling rate (Agilent InfiniiVision DSO7104A). The digital ultrasonic signals are then downloaded to a personal computer and post processed. Then the panel is subjected to low velocity impact (85 J) damage tests. A calibrated pre-loaded spring gun impact machine have been used with a 1-inch striker (Figure 9a).
A damaged/undamaged paths recognition mechanism is used to approximately locate the damage using the correlations obtained between Damage Index (DI), wave propagation velocities or Time of Flight (TOF) and energy levels damaged/undamaged differences.
4. Signal Analysis for Damage Detection: GW-based and the Cross-correlation methods
Two damage detection techniques, GW-based and the Cross-correlation methods, are detailed in this section. Both methodologies are introduced for SHM analysis on the tapered composite LWP under BVID impact. Then it is possible to verify procedure assessment by associating to each path one or more DI formulation and its relative statistic parameter to select the most perturbed path and their intersections.
4.1. GW-based DI formualtion
When GW-based mathematical elaborations are carried out a Damage Index (DI_GW) is calculated as:
where f are the frequencies where the spectra are evaluated, FI and FD the magnitudes of the frequency response functions for the undamaged and damaged structures respectively, and fs the sample rate.
All the acquired signals, both before (pristine status) and after the impact (current status), have been treated with a STFT based script that, for each of them, calculates the ToF and the Group velocity (Figure 11).
Code steps can be easily summarized as:
- signals matrix reading by csv file. This matrix was provided directly by the acquisition system (oscilloscope or National Instrument NI 6366 USB board) and consists of n columns of which the first is the time vector, the second the source vector and all the other the receivers vectors;
- Short Time Fourier Transform and the Fourier Transform calculation of the source signal and receivers signals;
- determination of source and receivers maximum point;
- Time of Flight (TOF) and group velocities determination.
The parameters that affect the code operations and that are required in the input, before analysis performing, are:
- source frequency;
- signal length (time history length);
- size of STFT window;
- actuator/receiver distance.
After signals processing, the script generates a set of diagrams representative of source/receivers time histories, Fourier Transform and STFT spectrogram. In the Matlab Command window, a table with ToF and Group Velocities, calculated for each source-receiver sensors couple, is displayed and it is possible to save the elaboration results in a xls file.
Then, on the base of the saved features (ToF and Group Velocities) signal energy levels and damage indices in the pristine and damaged status are compared with each other (Figure 12).
Finally, to locate the damage, a multiple propagation paths approaches adopted [14]. Once a sensor configuration has been established (12 of the outer sensors equally spaced in Figure 9b), a network of propagation path can be built considering all the possible combinations actuator-sensor by associating to each path a specific damage index formulation. Each pair of intersecting paths defines a node inside the space enclosed by the ultrasonic sensors, which contains the structural condition of its surrounding area. In this way it is possible to identify several points forming a grid of nodes affected by the damage occurrence (Figure 13).
4.2. Cross-correlation based DI formulation
When Cross-correlation based mathematical elaborations are carried out Damage Index (DI_CC) is calculated as [15–18]:
The cross-correlation function is the core of this process as it represents the measure of similarity of two signals, in this case applied as a function of a time shift of each single sensor pair, being voltage V signature the input signal. If the voltage signal at the current sensor position (Vi) is not affected by any variation with respect to time shift () of the coupled sensor (Vj+1), the value of the function is maximized and corresponds to the auto-correlation (max energy density). As the goal is to seek for a change in the signal response, the autocorrelation function can be used as the reference signal for strain energy and used to evaluate the DI_CC as reported in Eq. (2).
All the acquired signals, both before (pristine status) and after the impact (current status), have been treated with a Cross-correlation script that, for each of them, calculates the DI_CC.
Code steps can be easily summarized as:
- signals matrix reading by txt file consisting in columns of which the first is the time vector, the second the source vector and all the other the receivers’ vectors (as for the GW-based approach);
- Cross-correlation calculation of the receivers’ signals pairs;
- Pick track time lag estimation.
The parameters that affect the code operations and that are required in the input, before analysis performing, are:
• sample rate ();
• indexing of receivers couples;
On the base of the input signal and damage indices, the pristine and damaged status are compared with each other (Figure 14).
The identification of the location of the damage and of its extension was performed by means of a method alternative to the tomography. The Figure 15 depicts a schematic of the detected area. The vertices of the polygon represent the location of the 12 outer transducers. The paths of the signal generated by them separately and detected by all the others are represented by grey lines. If a line does not cross any damage, all the intersections with other lines are represented by black, neutral, dots. On the contrary if two lines passing through the damaged area cross each other, the intersections are highlighted by red circles. In a pictorial representation, these points could be light bulbs switched on a bill board.
The method here used, called “expanding bubbles” consists in:
- generating for growing values of the radius circular domains centred on the light bulbs;
- counting the ratio of light bulbs over total dots falling in the current circular region; this value is unitary for small radii, since the centre of the circles is constituted by light bulbs; on the contrary, the farther one is away from the centre, the higher the probability is of finding neutral dots and, thus, the ratio tends to diminish; this trend is represented by the plot on the top of Figure 16;
- averaging the ratios computed at the previous step to find a unique function; the least square polynomial of this curve is then computed (see black line in the plot on the top of Figure 16). Similarly, to the single curves of the dot ratio, also this line is characterized by a peak very close to the null value of the area; then, after a fall the asymptotic region starts;
- Estimating the 1st derivative (slope) of the curve and its curvature (see the plots on the middle and on the bottom of Figure 16). The minimum of the slope and of the curvature closest to the origin identify the first part of the fall and consequently the boundary of the damaged area in which there is an higher concentration of light bulbs;
- Determining of the position of the centre of the damage; to this scope the barycentre of the light bulbs is computed;
- Determining the approximate shape of the damaged area. This operation is performed considering the boundary of region built by Delaunay triangulation of the light bulbs. This region is represented by the blue lines in Figure 17b. The boundary is computed by the homonymous MATLAB function, also handling concave hulls. The perimeter of the boundary is computed and scaled down up to achieve regions of the same shape but with the areas equal to the ones previously identified at the middle and bottom plots of Figure 16. These two regions, that is to say, the damage area at minimum curvature and slope and their mean value are represented in Figure 17b by the pink, the green and the cyan patches.
5. Results
Considering the damage grids of the panel, impact locations fall exactly inside the correspondent grid. To confine the damage, a surface is fitted on the scattered data using a triangulation-based cubic interpolation. A color mapped 2D image is obtained and considered as a damage report.
The exterior surface of the plate was then inspected with C-scans around the impact locations. The performed C-scan images, reported in Figure 19b, clearly show the appearance of delamination.
6. Conclusions
As a conclusion of the results achieved by this work, it is important to summarize the objectives achieved.
An easy and computationally efficient way of simulating through a FEM model the vibrational behavior of a real damaged composite panel has been found.
From the comparison of the results obtained applying a numerical damage, already developed by the University Federico II of Naples , the numerical model has been proven to work efficiently, corroborating the quality of the adopted flaw-simulating strategy .
A structural health monitoring system based on the ultrasonic guided waves (GW) tomographic technique has been presented confirming the effectiveness of the methodology in the assessment of the structures health condition.
However, several features and parameters, that appear to be effective for damage detection, can be extracted from wavefield signals and can affect SHM procedures in terms of flaw monitoring and assessment.
So, the combination of cross-correlation analysis in a data-driven approach based on ultrasonic guided waves (GW) tomographic methodology could be a quick and simple tool to assess the levels of tomographic efficiency and effectiveness in the structural conditions assessment.
From this point of view, the cross correlation method, applied as a function of a time shift of each single sensor pair, has been proven to work efficiently in seeking changes in the signal response while the autocorrelation function has been effective for signal strain energy evaluation and Damage Indices definition. The provided results, indeed, have been found fully comparable with those obtained using the tomographic technique, confirming the goodness of the latter.
Altogether, it can be stated that satisfying steps forward has been performed in the direction of most accurate SHM methodology. It is hopeful that a further investigation will lead to more advanced operative algorithms, aiming at the implementation on commercial aircraft and allowing relevant reduction of manufacturing, maintenance and operative costs.
Author Contributions
Conceptualization, MC and NDB; methodology, All; software, NDB, MC and SA; validation, MC and NDB; formal analysis, EM, NDB; investigation, All; data curation, EM, NDB; writing—original draft preparation, All; writing—review and editing, All. All authors have read and agreed to the published version of the manuscript.
Funding
Part of the experimental results used within this work have been obtained within research funded from the European Union’s Seventh Framework Programme for research, technological development and demonstration under grant agreement no 284562 (SARISTU Project).
Institutional Review Board Statement
Not applicable.
Informed Consent Statement
Not applicable.
Data Availability Statement
An open database for benchmarking guided waves structural health monitoring algorithms on a composite full-scale outer wing demonstrator can be found in: Structural Health Monitoring, 19(5), 1524-1541.
Acknowledgments
In this section, you can acknowledge any support given which is not covered by the author contribution or funding sections. This may include administrative and technical support, or donations in kind (e.g., materials used for experiments).
Conflicts of Interest
The authors declare no conflict of interest.
References
- Smart Intelligent Aircraft Structures (SARISTU), Proceedings of the Final Project Conference - Piet Christof Wölcken • Michael Papadopoulos Editors.
- 2. R Zhu, G L Huang and F G Yuan, Fast damage imaging using the time-reversal technique in the frequency–wavenumber domain, SMART MATERIALS AND STRUCTURES 22 (2013) 075028 (11pp). [CrossRef]
- N. D. Boffa, L. Lecce, E. Monaco, F. Ricci, Application of the beam-forming technique for damage detection in composite plate - American Society of Mechanical Engineers, Noise Control and Acoustics Division (Publication) NCAD - pp. 489-495 - August 2012.
- Radojicic, A., Bailey, S. and Brühwiler, E. (1999) Consideration of the serviceability limit state in a time dependant probabilistic cost model, Application of Statistics and Probability, Balkema, Rotterdam, Netherlands, Vol.2, 605–612.
- Glisic, B. and Inaudi, D. (2003) Components of structural monitoring process and selection of monitoring system, PT 6th International Symposium on Field Measurements in GeoMechanics (FMGM 2003), Oslo, Norway, 755–761. R. Do, C. Haynes, M. Todd, W. Gregory, C. Key, Efficient Detection Methods on a Composite Plate with Interior Embedded Fiber Optic Sensors via Impact Test, Proc. International Workshop on Structural Health Monitoring, 2013, Stanford University. [CrossRef]
- Monaco E, Boffa N D, Memmolo V, Ricci F, Testoni N, Marchi L D, Marzani A, Hettler J, Tabatabaeipour M, Delrue S and Koen V D A 2016 Methodologies for guided wave-based SHM system implementation on composite wing panels: Results and perspectives from SARISTU Scenario 5 in Smart Intelligent Aircraft Structures (SARISTU) (Springer International Publishing) 495–527.
- Marzani, A., Testoni, N., De Marchi, L., Monaco, E., Sharif Khodaei, Z., Aliabadi, M. H., & Viana, J. (2016). Implementation of a Structural Health Monitoring system for a Composite Wing Box skin. In Smart Intelligent Aircraft Structures (SARISTU) Proceedings of the Final Project Conference (pp. 883-908). Springer International Publishing. [CrossRef]
- Marzani, A., Testoni, N., De Marchi, L., Messina, M., Monaco, E., & Apicella, A. (2020). An open database for benchmarking guided waves structural health monitoring algorithms on a composite full-scale outer wing demonstrator. Structural Health Monitoring, 19(5), 1524-1541. [CrossRef]
- Guo N and Cawley P. The interaction of Lamb waves with delaminations in composite laminates. J Acoust Soc Am 1993; 94(4): 2240–2246. [CrossRef]
- Su Z and Ye L. Identification of damage using Lamb waves (Lecture notes in applied and computational mechanics). London: Springer, 2009. [CrossRef]
- Ricci, F., Mal, A. K., Monaco, E., Maio, L., Boffa, N. D., Di Palma, M., Lecce L., "Guided waves in layered plate with delaminations, EWSHM 7th European workshop on structural health monitoring, Nantes, France, July 8-11, 2014.
- P.D. Wilcox, M.J.S. Lowe, P. Cawley, Mode and Transducer Selection for Long Range Lamb Wave Inspection, Journal of Intelligent Material Systems and Structures. 12, 8; 2001, 553–565. [CrossRef]
- V. Giurgiutiu, J. Bao, W. Zhao, Piezoelectric wafer active sensor embedded ultrasonics in beams and plates, Experimental Mechanics. 43, 4; 2003, 428–449. [CrossRef]
- Fabrizio Ricci, E. Monaco, N.D. Boffa, L. Maio, V. Memmolo, Guided waves for structural health monitoring in composites: A review and implementation strategies, February 2022 Progress in Aerospace Sciences 129(1–2):100790. [CrossRef]
- M. Ciminello; B. Galasso; A. Concilio; L. Pellone; U. Mercurio; G. Apuleo; A. Cozzolino; S. Shoham; D. Bardenstein; I. Kressel. Cross-Correlation Based Algorithm for SHM De-bonding Analysis of Typical Aeronautical Structures via OFDR. EWSHM 2022 Conference. [CrossRef]
- M. Ciminello, Distributed Fiber Optic for Structural Health Monitoring System Based on Auto-Correlation of the First-Order Derivative of Strain, IEEE Sensors Journal (Volume:19 , Issue:14, July 15, 2019). [CrossRef]
- Ciminello M., Concilio A., Pellone L., Mercurio U., Apuleo G., Cozzolino A., Shoham S., Bardenstein D., Kressel I.: Cross-Correlation Based Algorithm for SHM De-bonding Analysis of Typical Aeronautical Structures via OFDR. In book: European Workshop on Structural Health Monitoring (pp.254-263). [CrossRef]
- Ciminello M., Ameduri S., Romano F., Concilio A.: Impact area and debonding line detection assessment by cross-correlation analysis and distributed sensing. In: Optical Fiber Technology. 58. 102245. [CrossRef]
Figure 1.
Full scale wing box ground demonstrator main components exploded view.
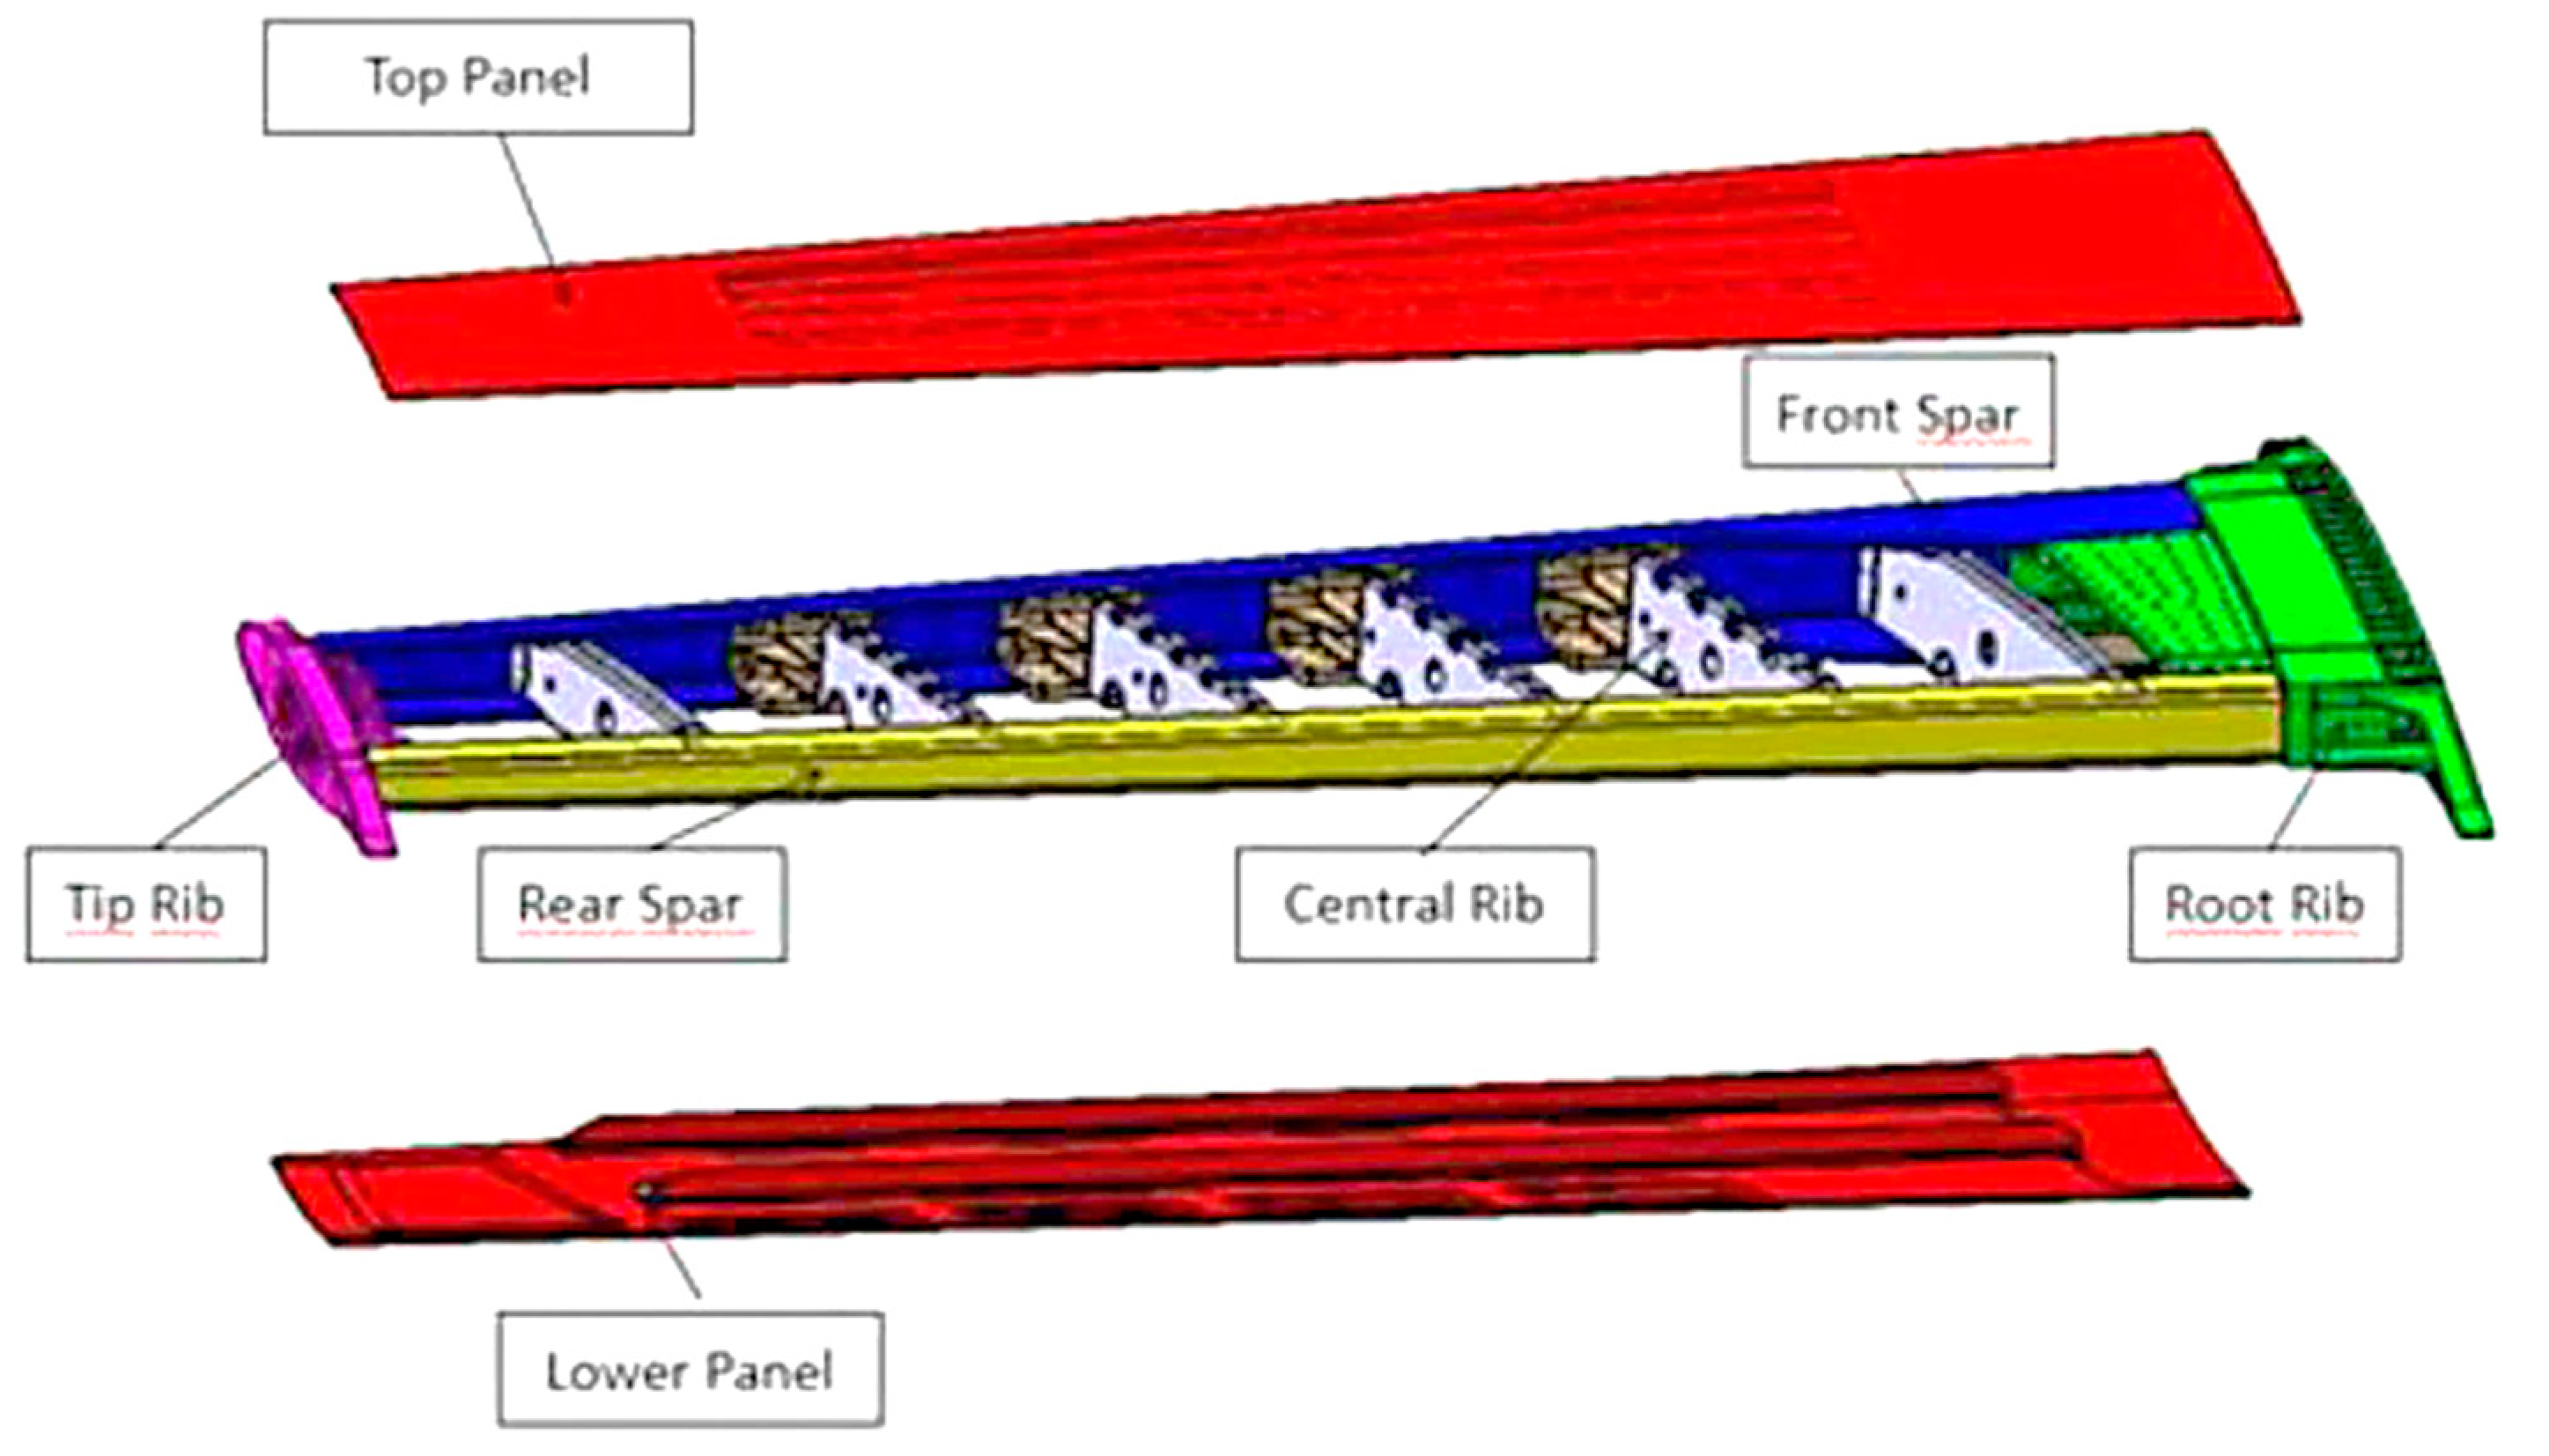
Figure 2.
LWP sensor tags.
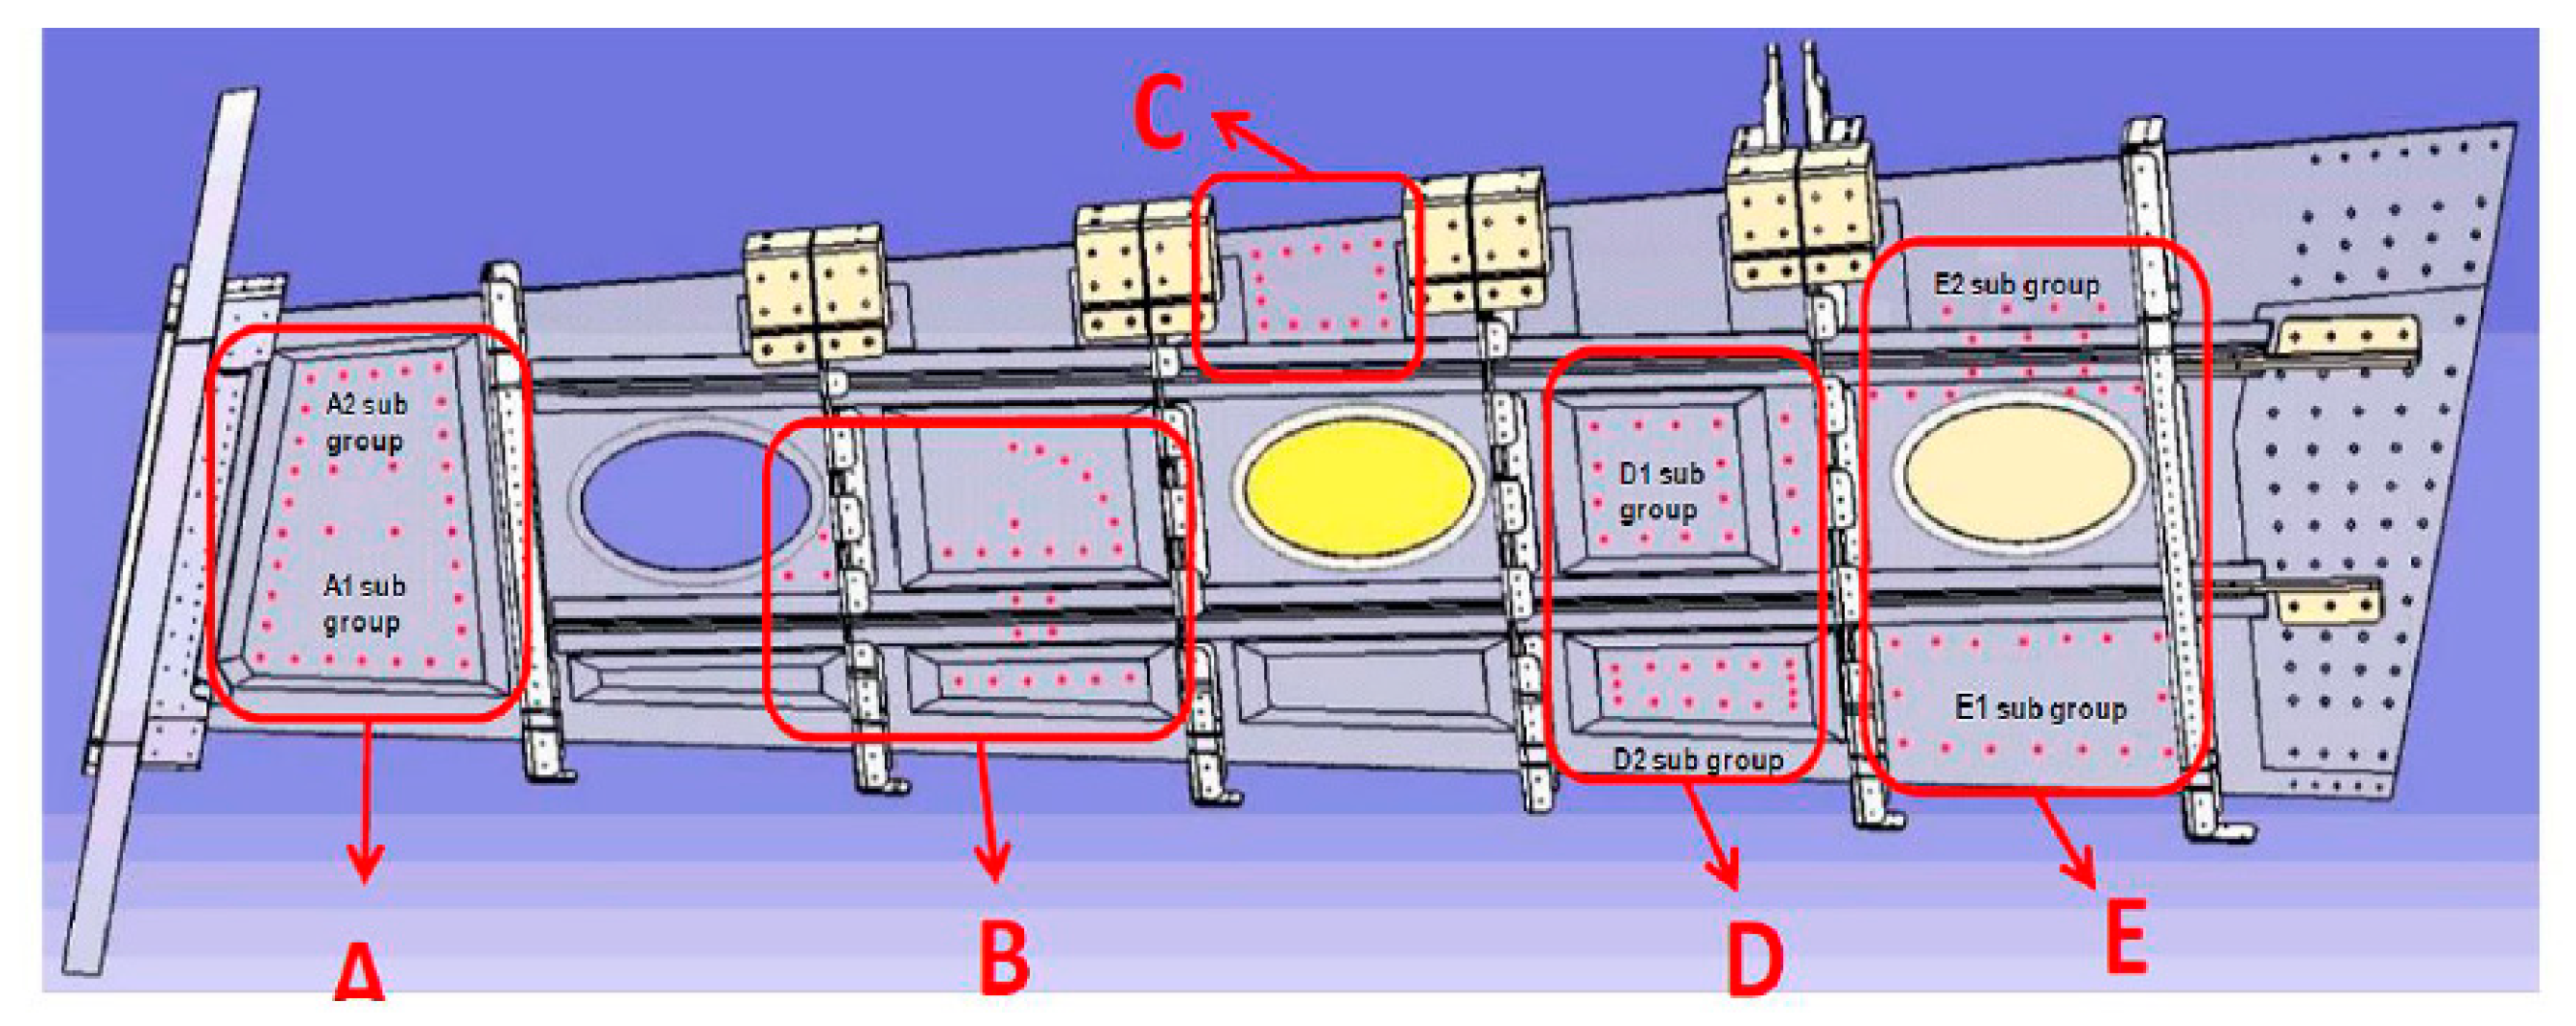
Figure 3.
Geometry of the panel and the damaged area position.
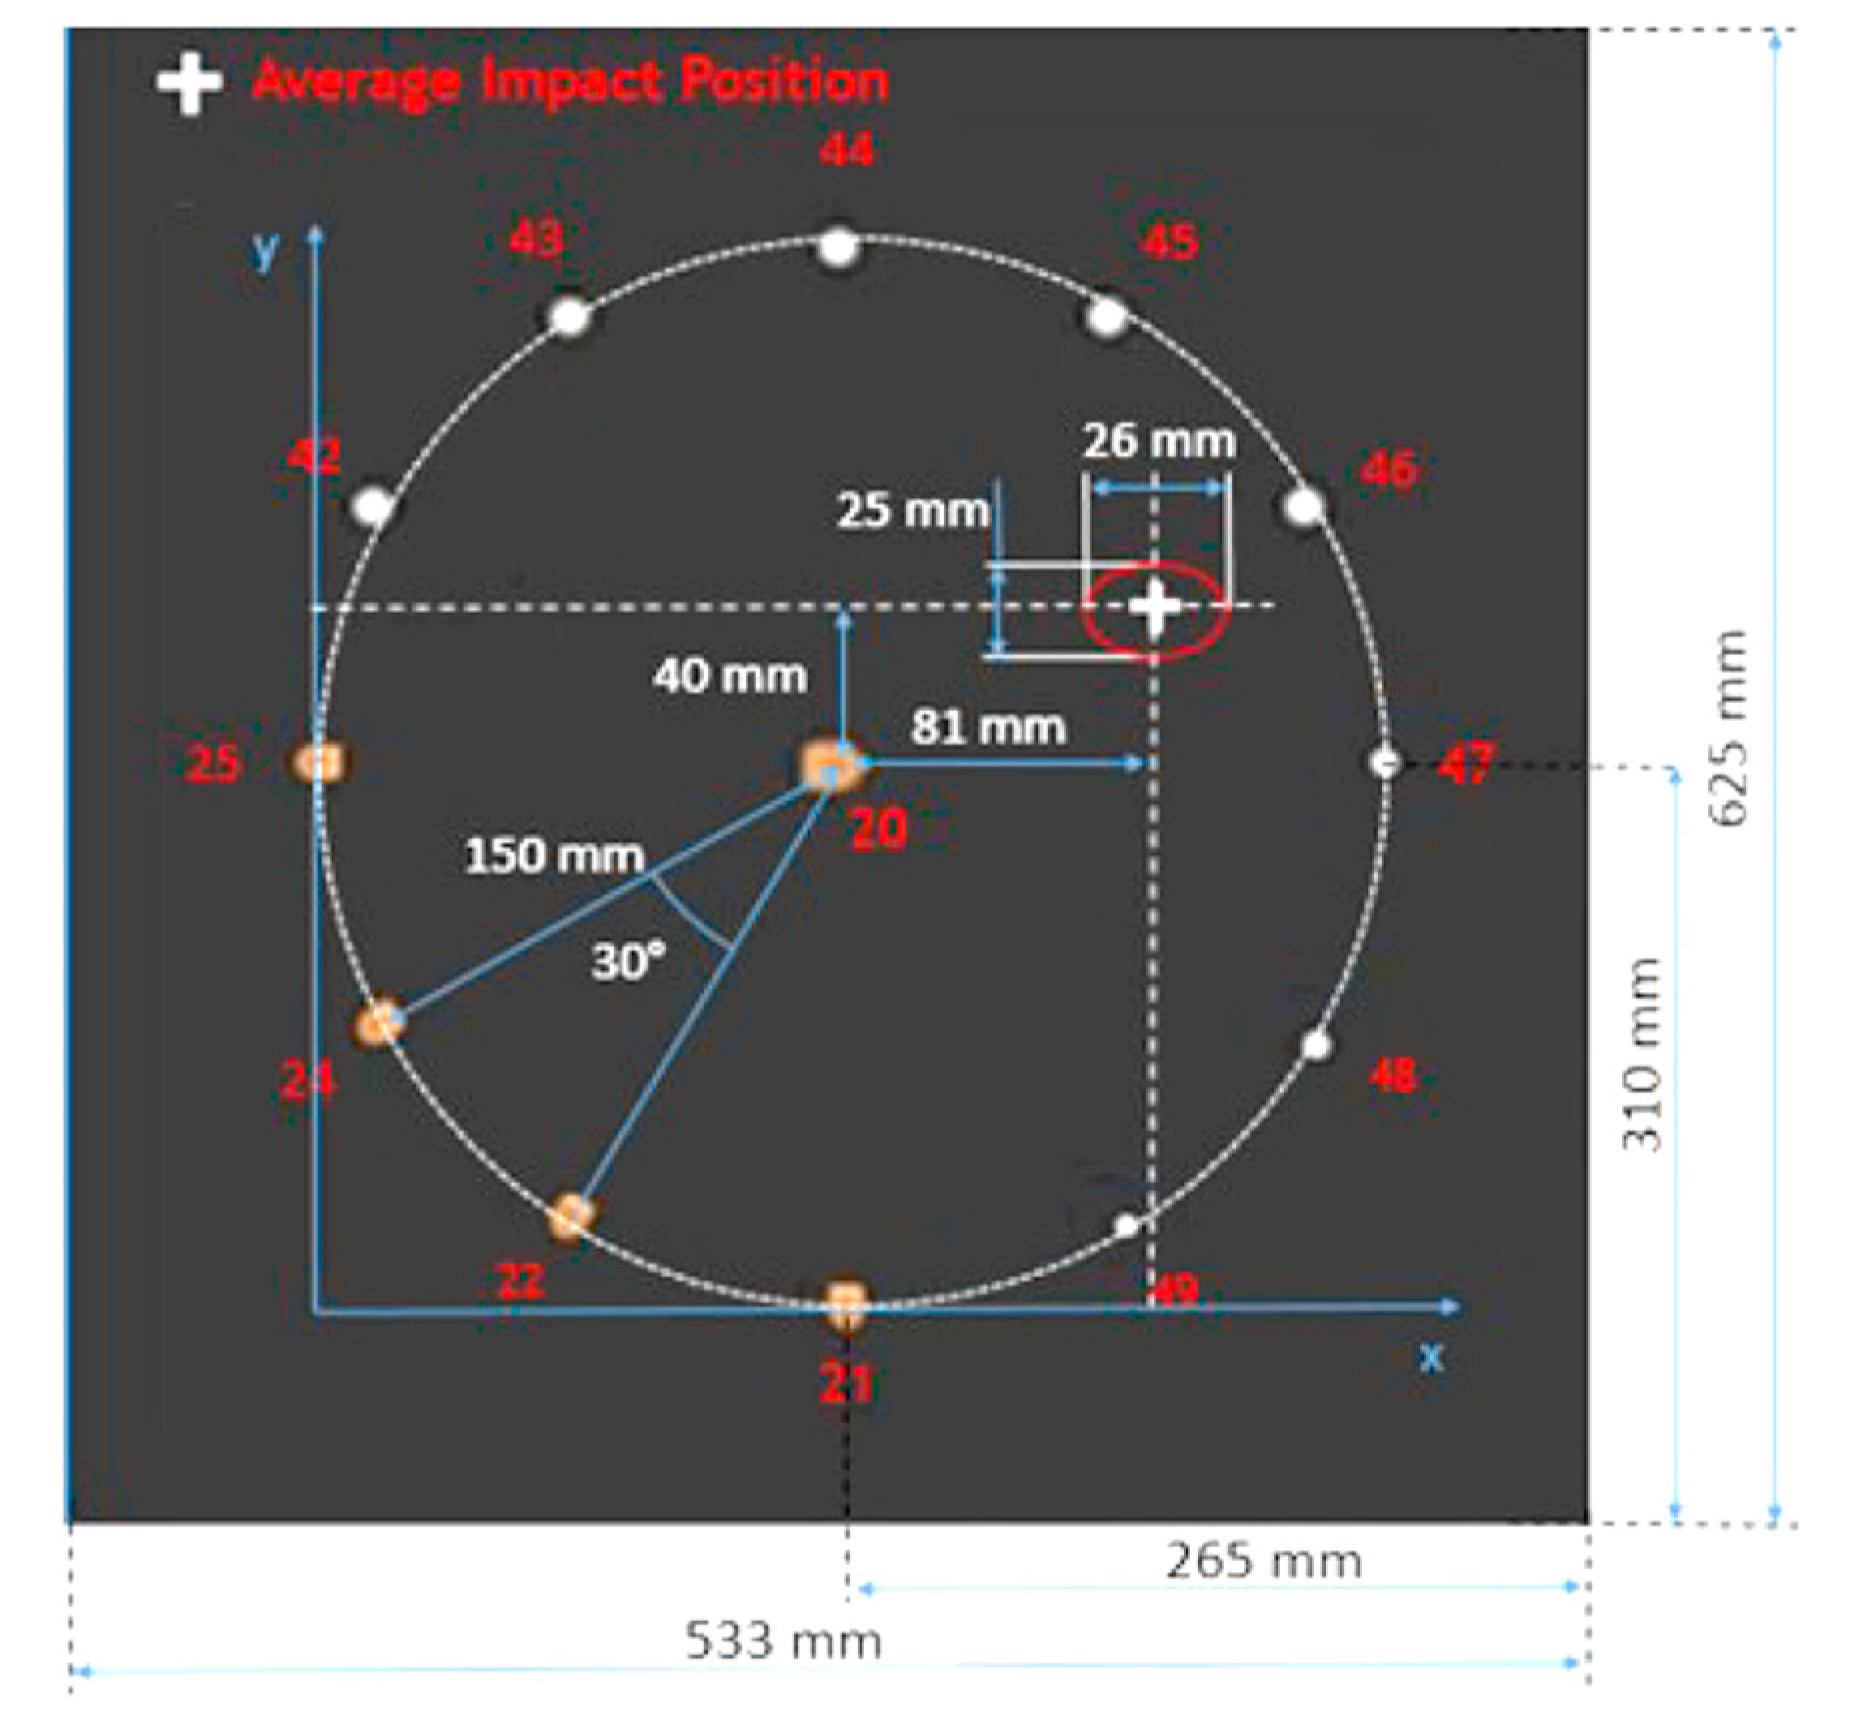
Figure 4.
View of the implemented mesh.
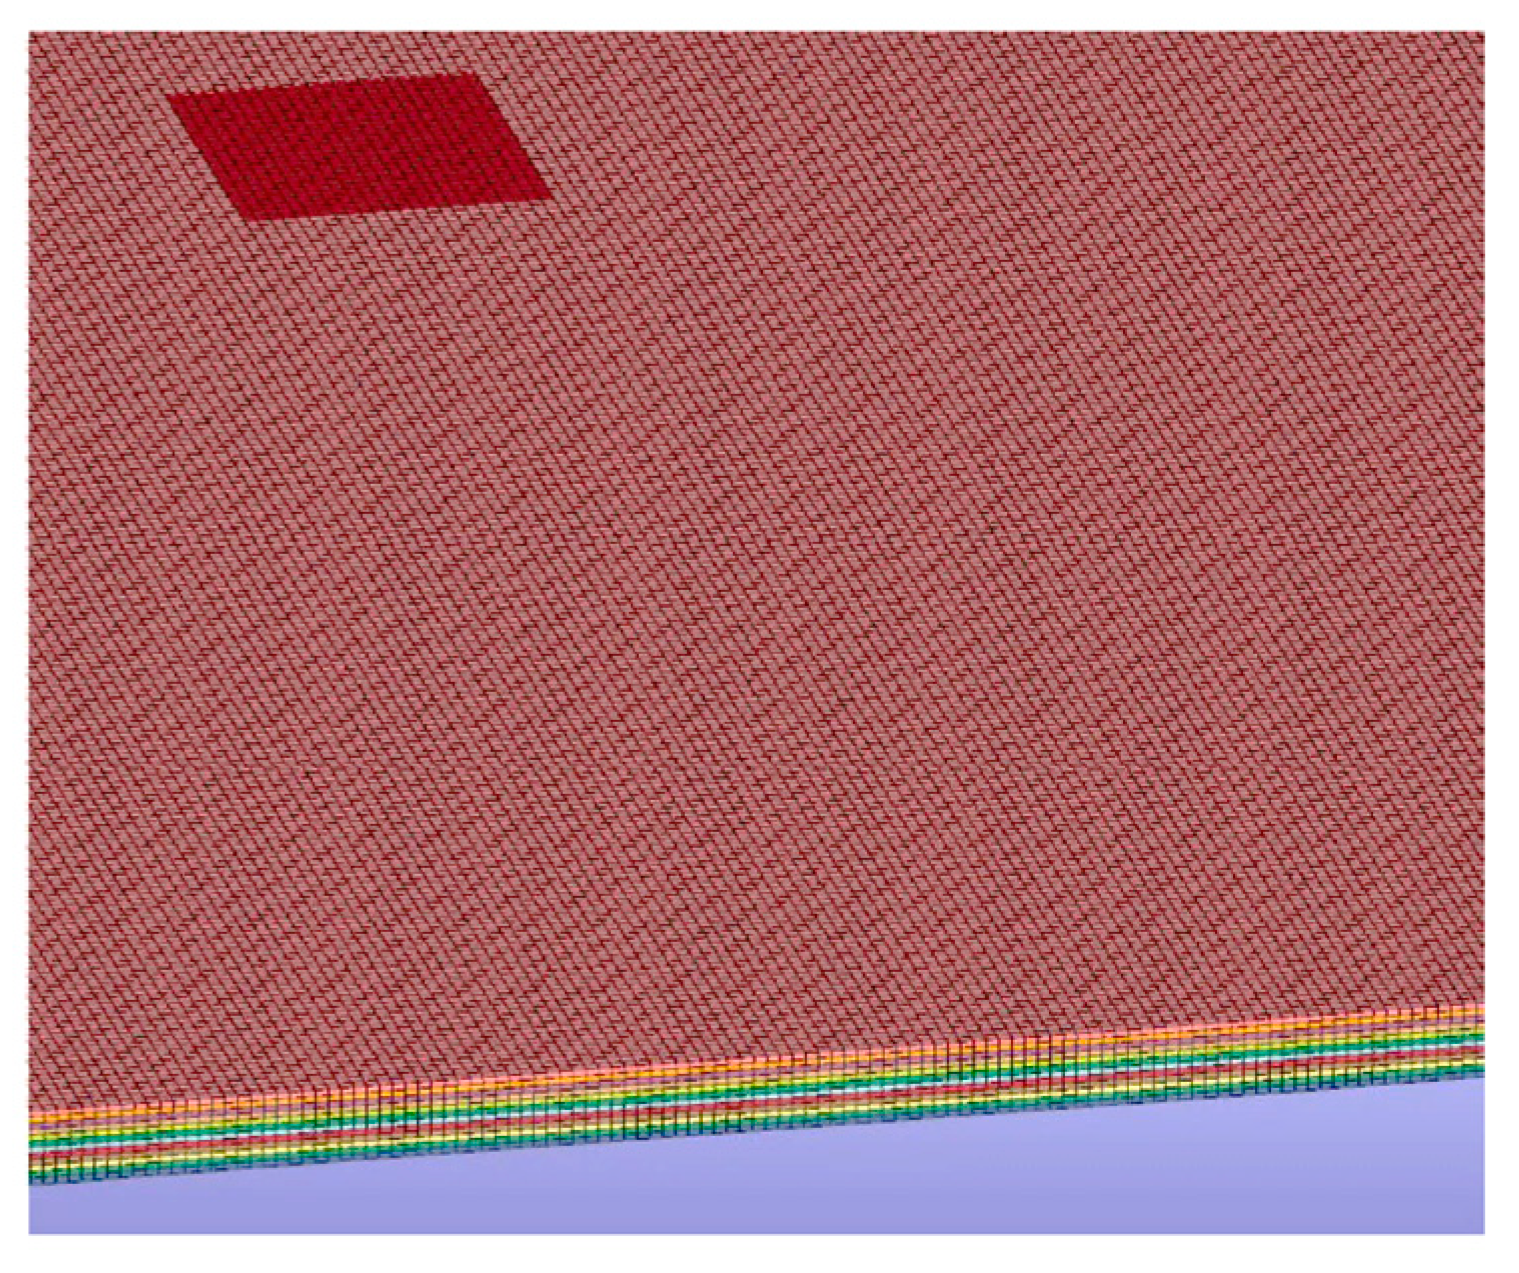
Figure 5.
Model simulation: (a) Numerical and experimental wave propagation along the x axis (sensors 20 to 25 in Figure 3) of the initial model; (b) numerical and experimental wave propagation along the y axis (sensors 20 to 21 in Figure 3) of the initial model.
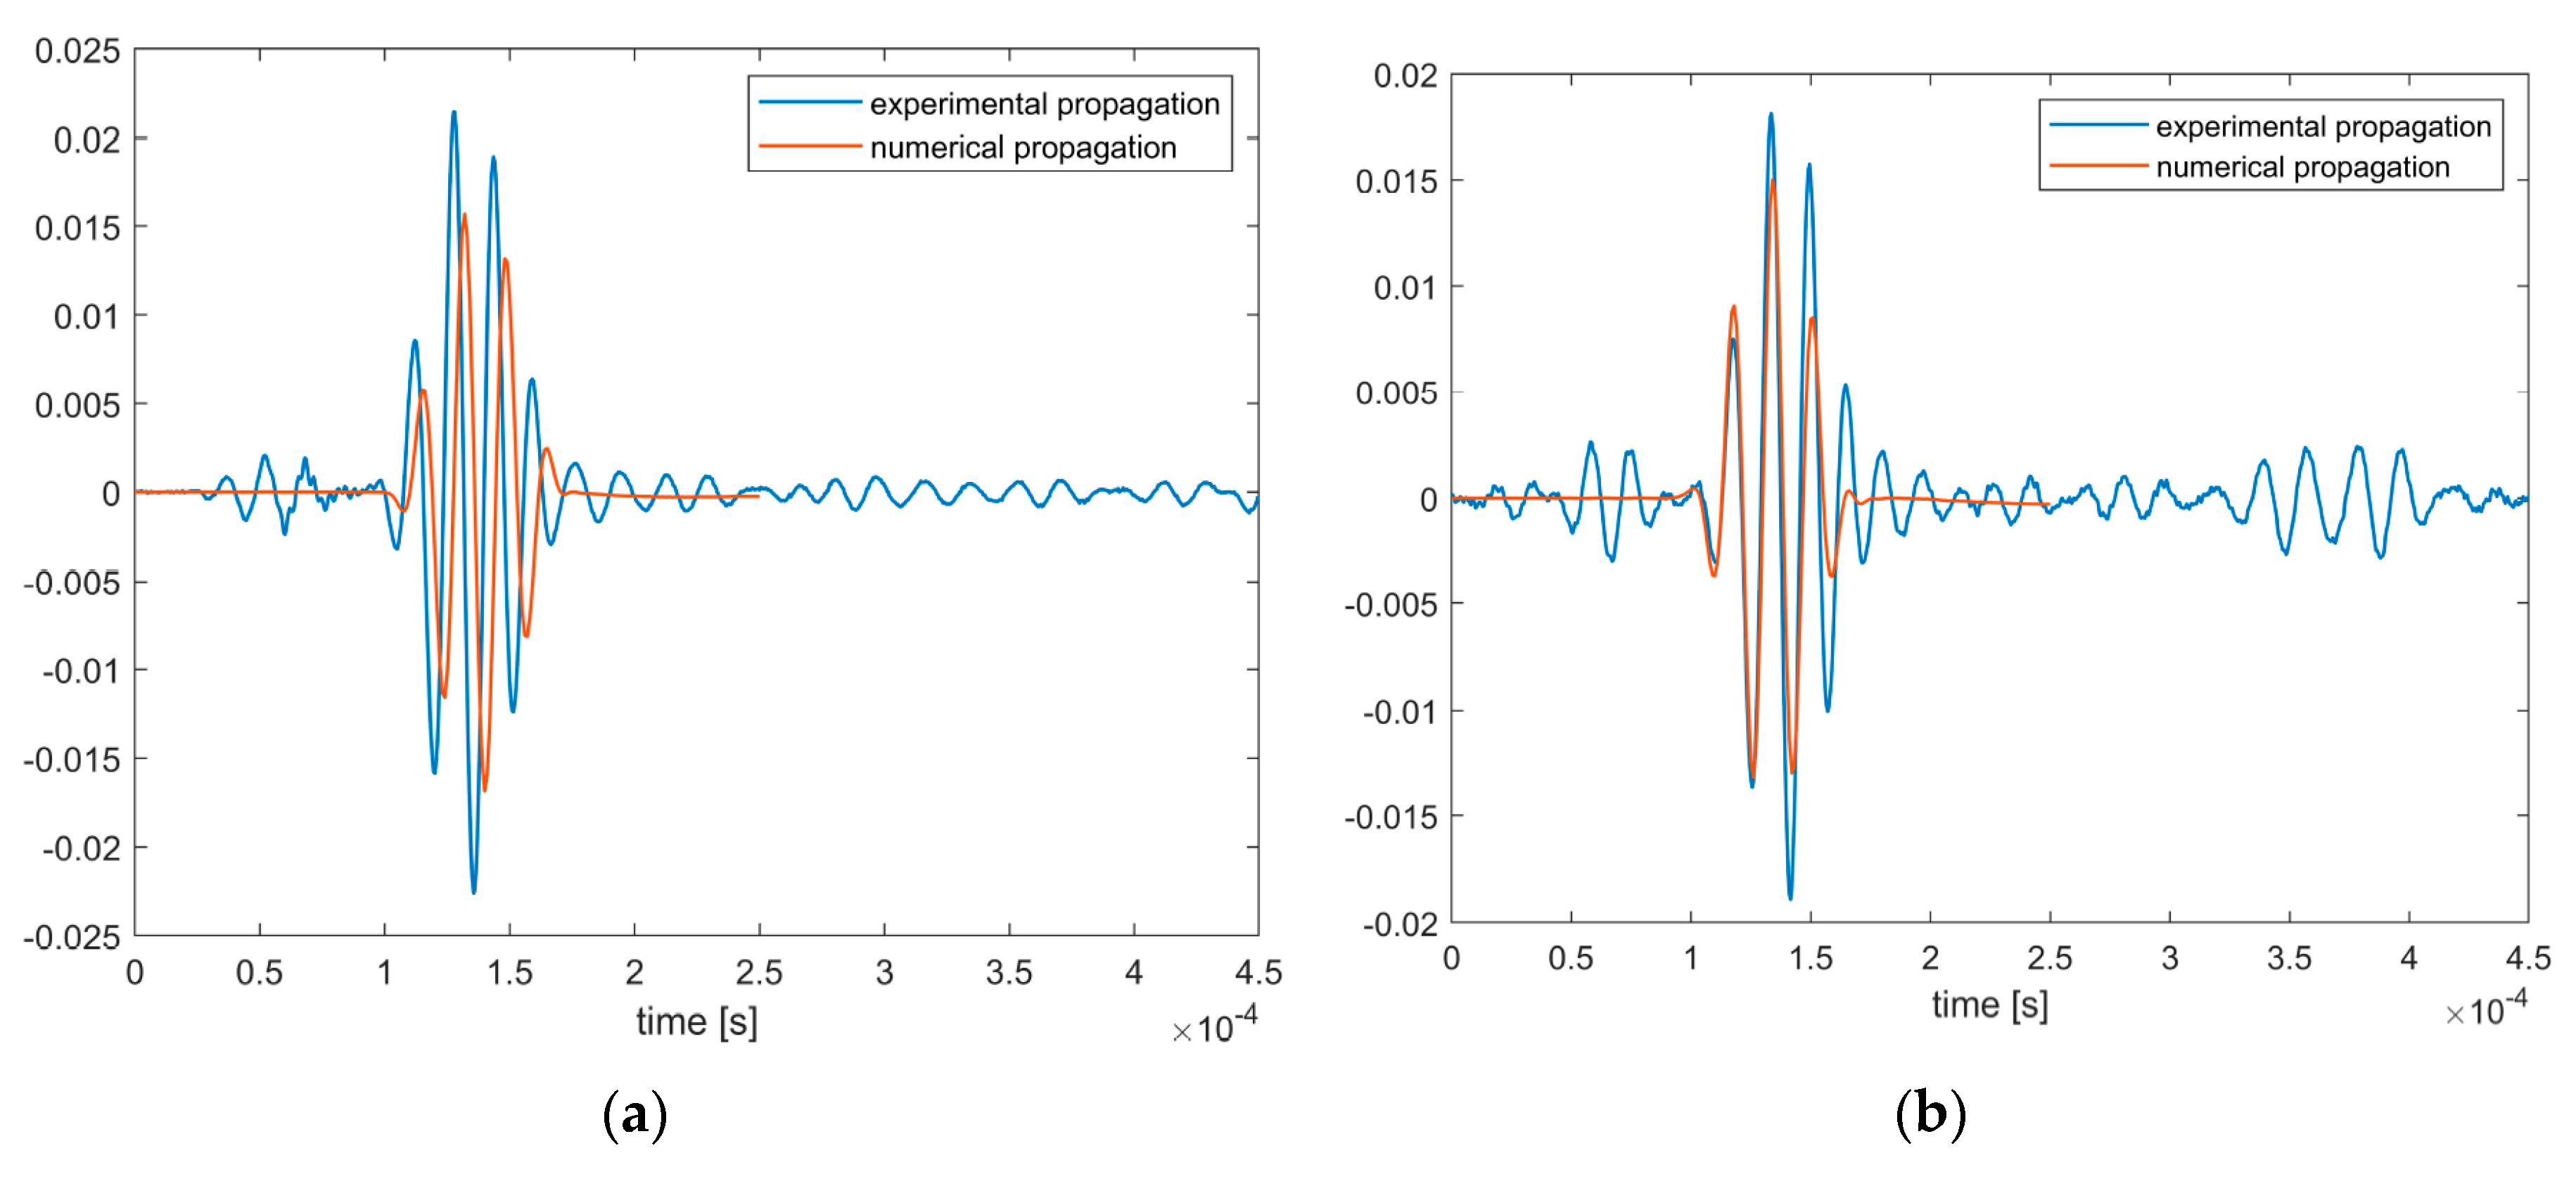
Figure 6.
Model simulation: (a) Numerical wave propagation from sensor 20 to 46 (Figure 3 sensor configuration) of the chosen pristine and damaged models; (b) eexperimental wave propagation from sensor 20 to 46 (Figure 3 sensor configuration) of the chosen pristine and damaged panels.
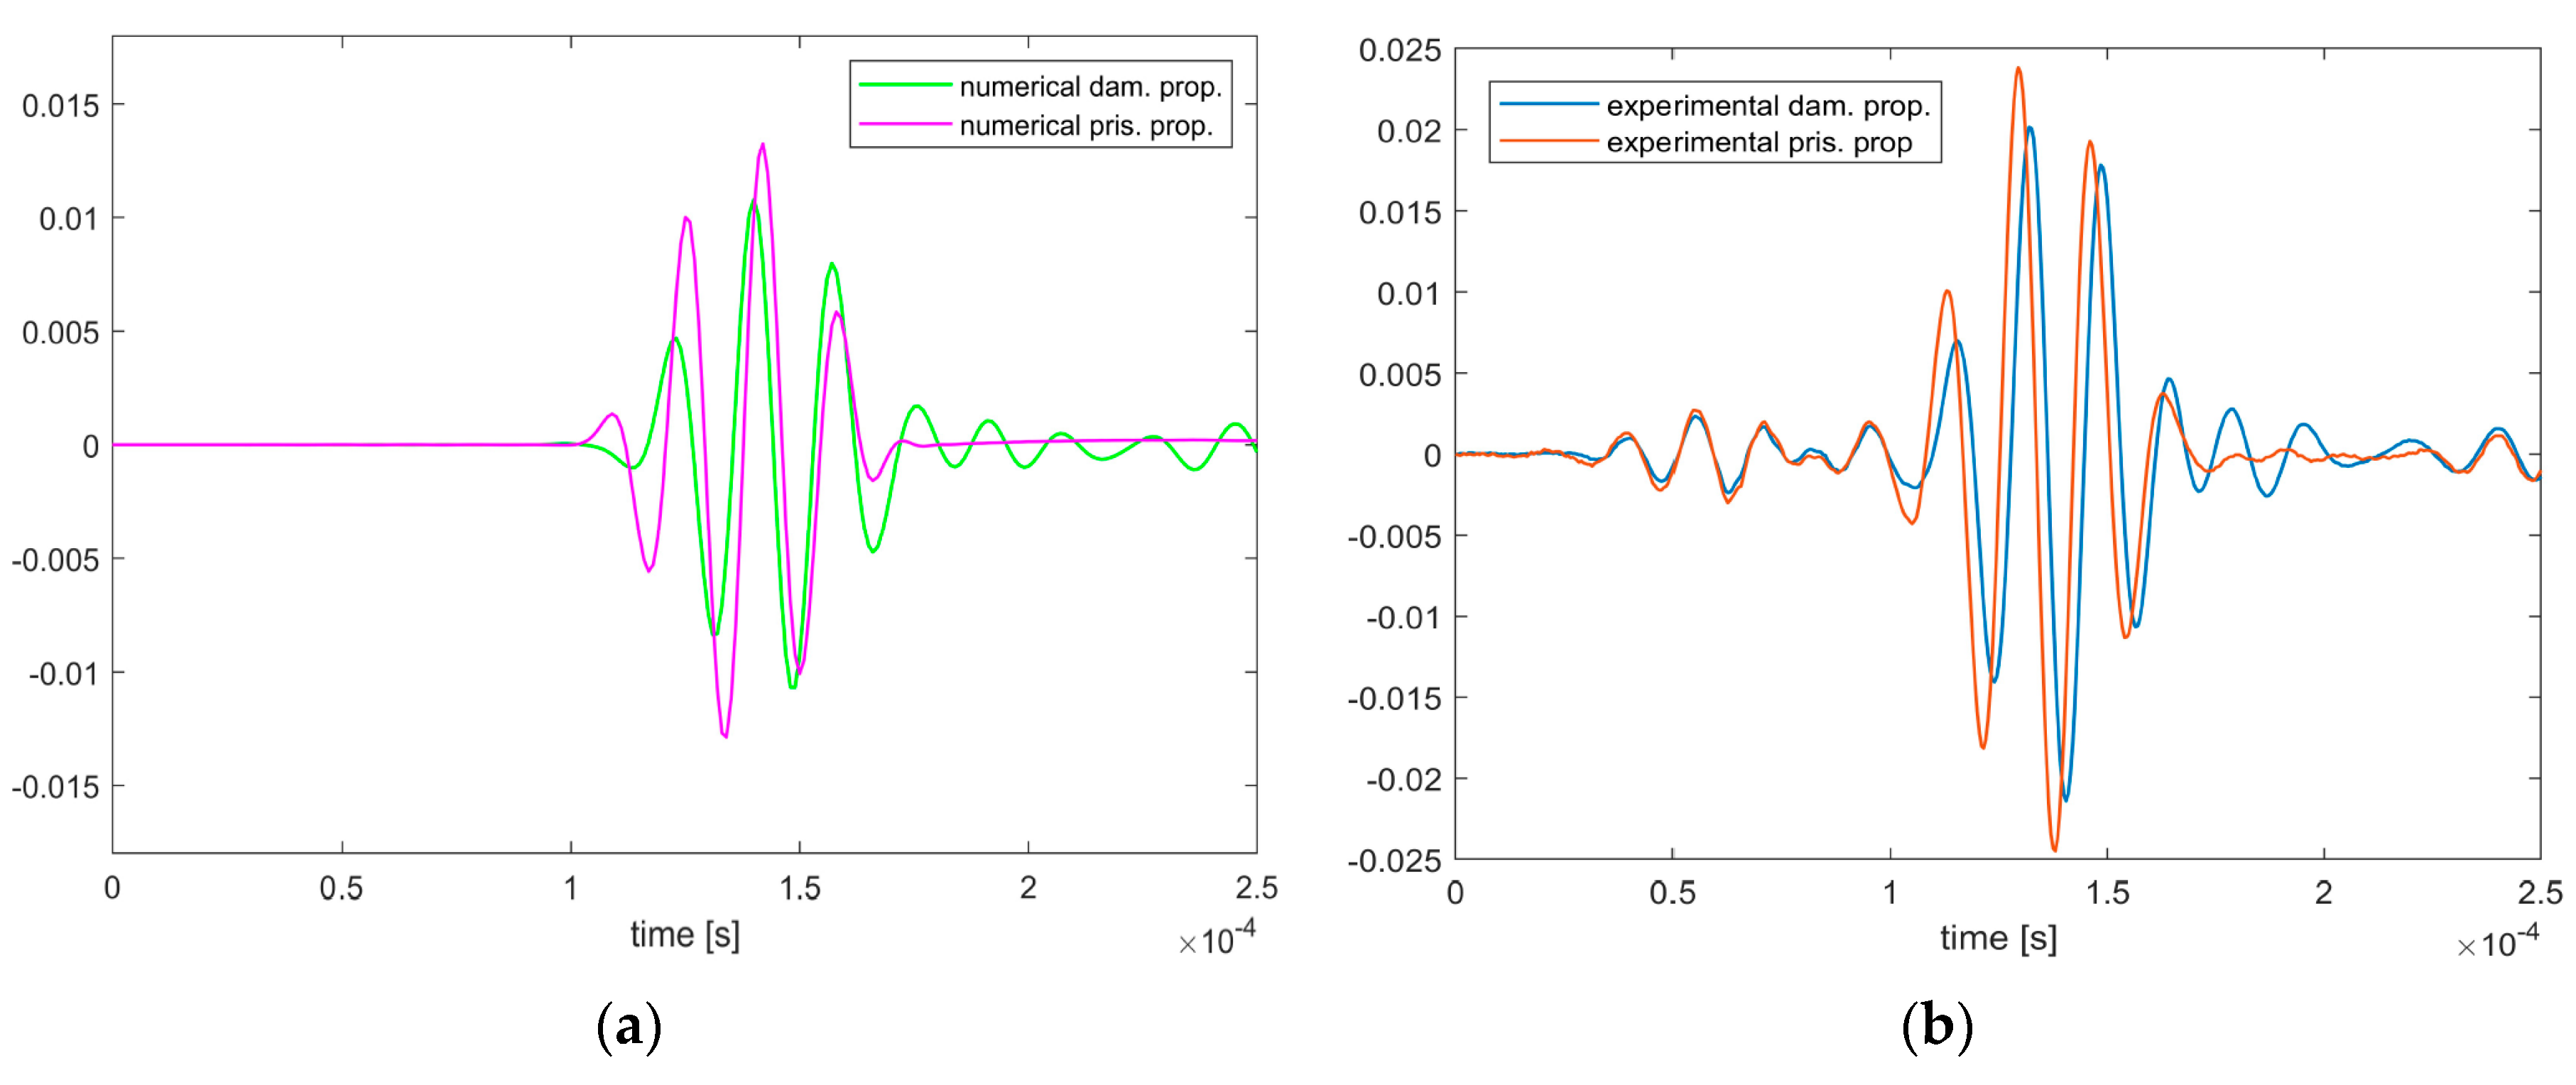
Figure 7.
Numerical simulation of waves propagation across an impact delamination: (a) time shift between pristine (red) and after delamination (blue) signals; (b) amplitude variation between pristine (red) and after delamination (blue) signals .
Figure 7.
Numerical simulation of waves propagation across an impact delamination: (a) time shift between pristine (red) and after delamination (blue) signals; (b) amplitude variation between pristine (red) and after delamination (blue) signals .
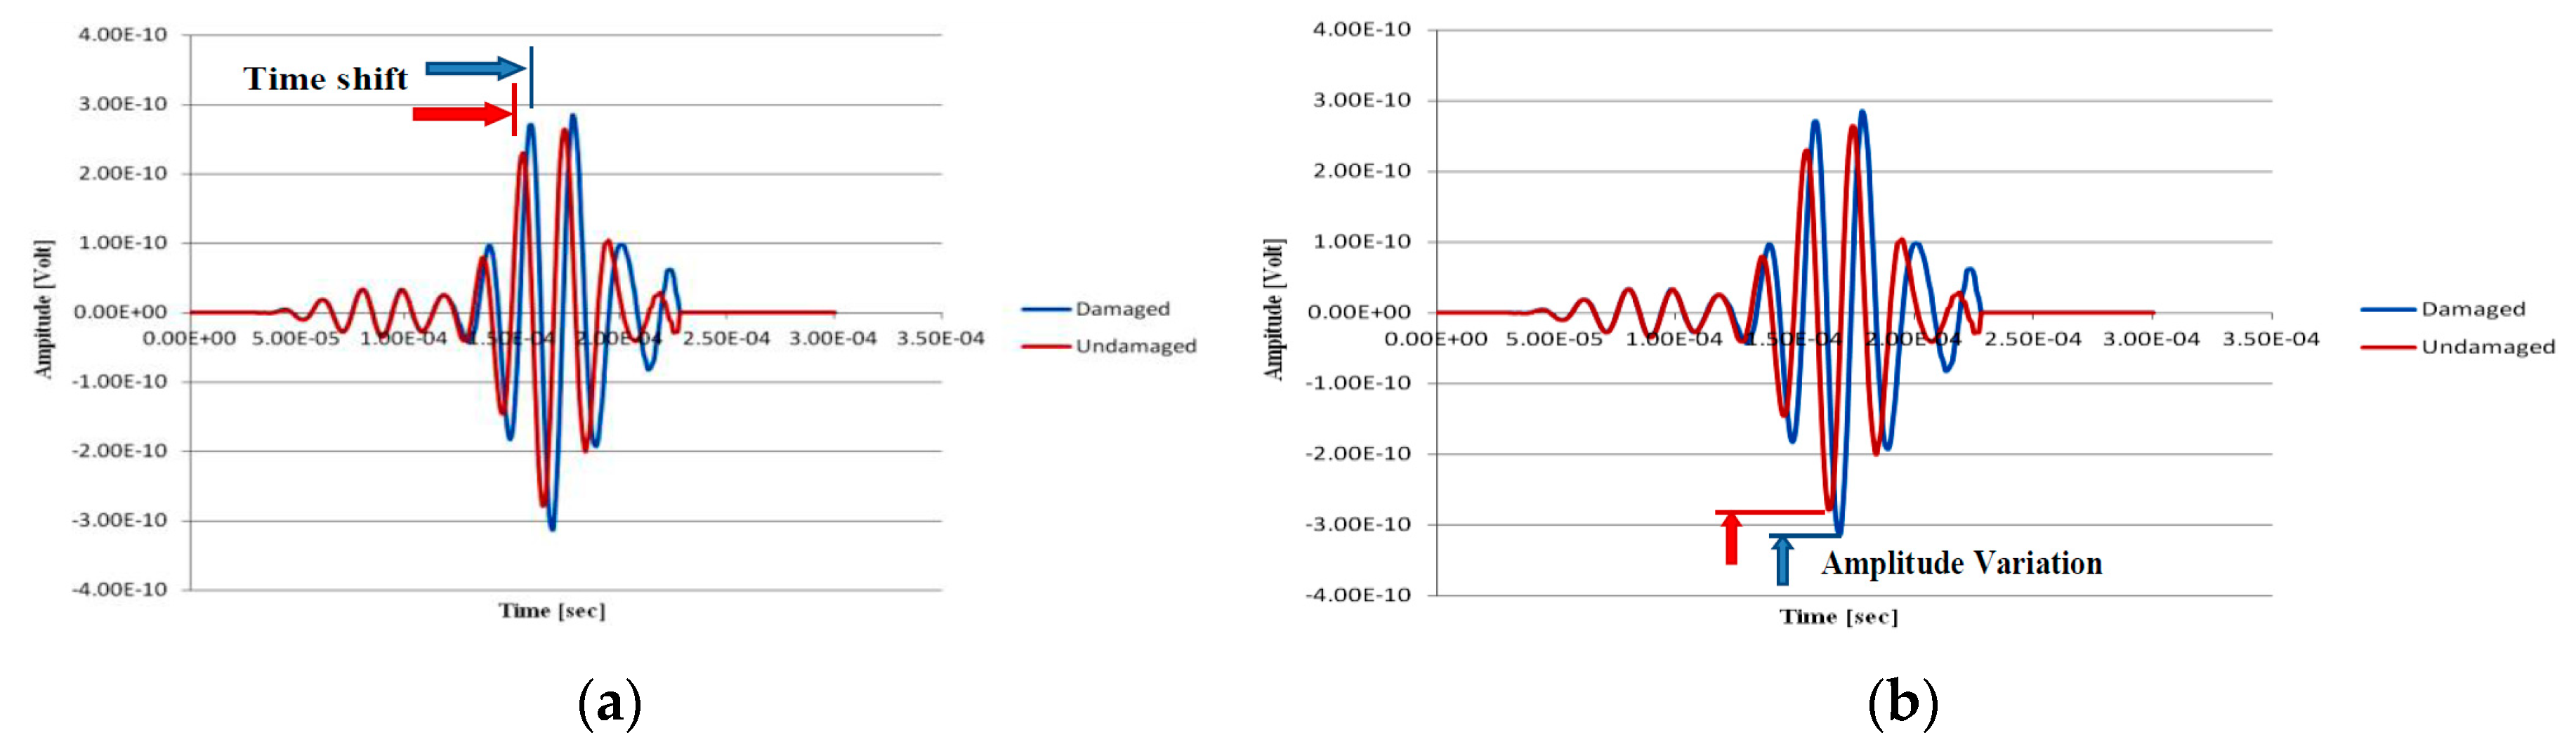
Figure 8.
(a) ceramic PWAS sensor PIC255; (b) DuraAct P-876.SP1 sensor
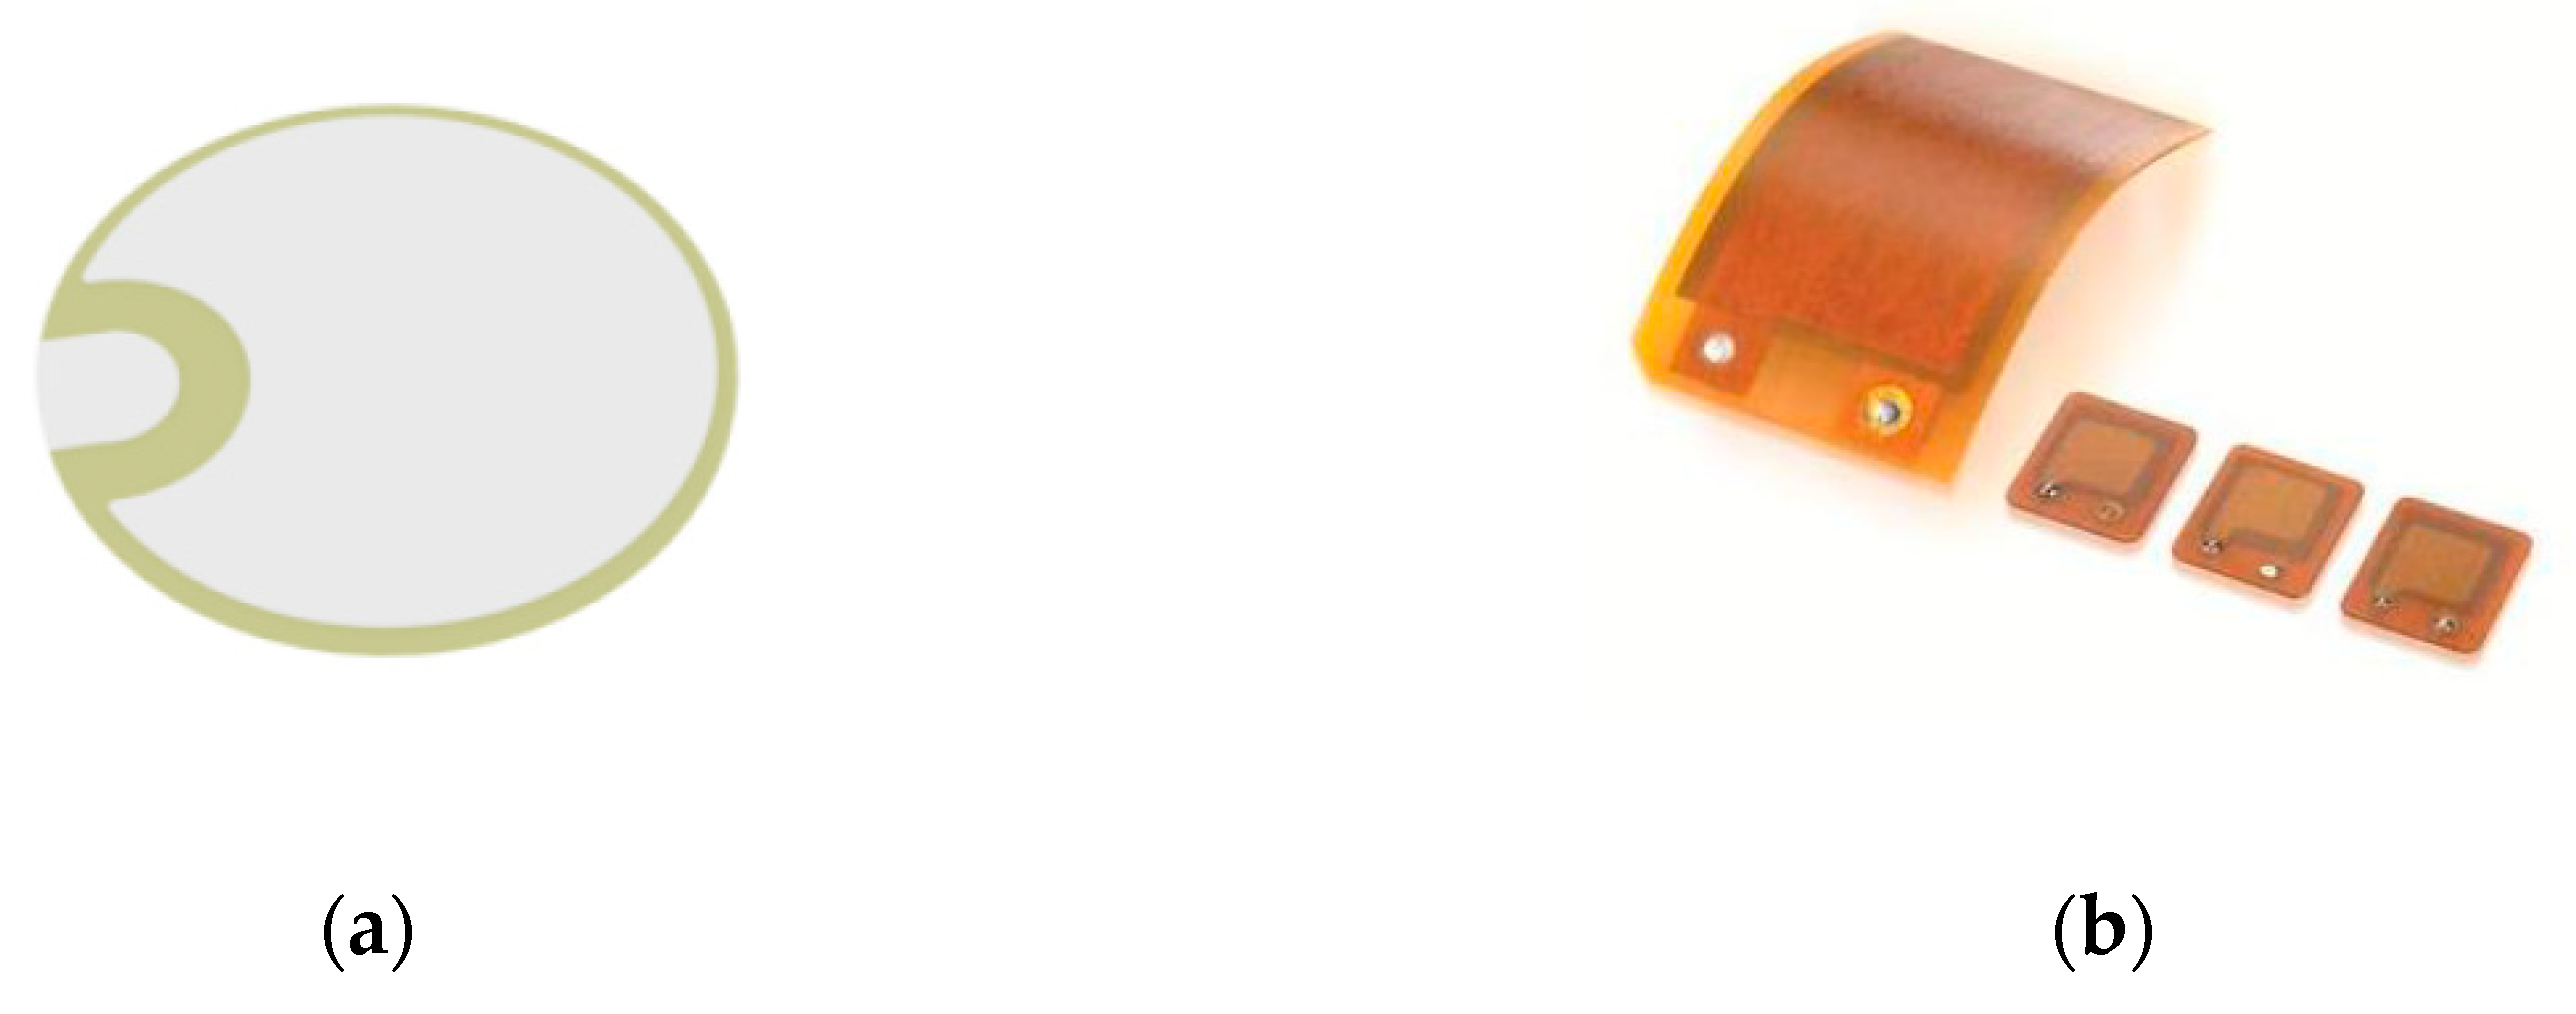
Figure 9.
a) impact test setup; b) sensors configuration on the 6 mm thick bay of the preliminary tapered test panel; c) overall sensors configuration on the preliminary tapered test panel.
Figure 9.
a) impact test setup; b) sensors configuration on the 6 mm thick bay of the preliminary tapered test panel; c) overall sensors configuration on the preliminary tapered test panel.
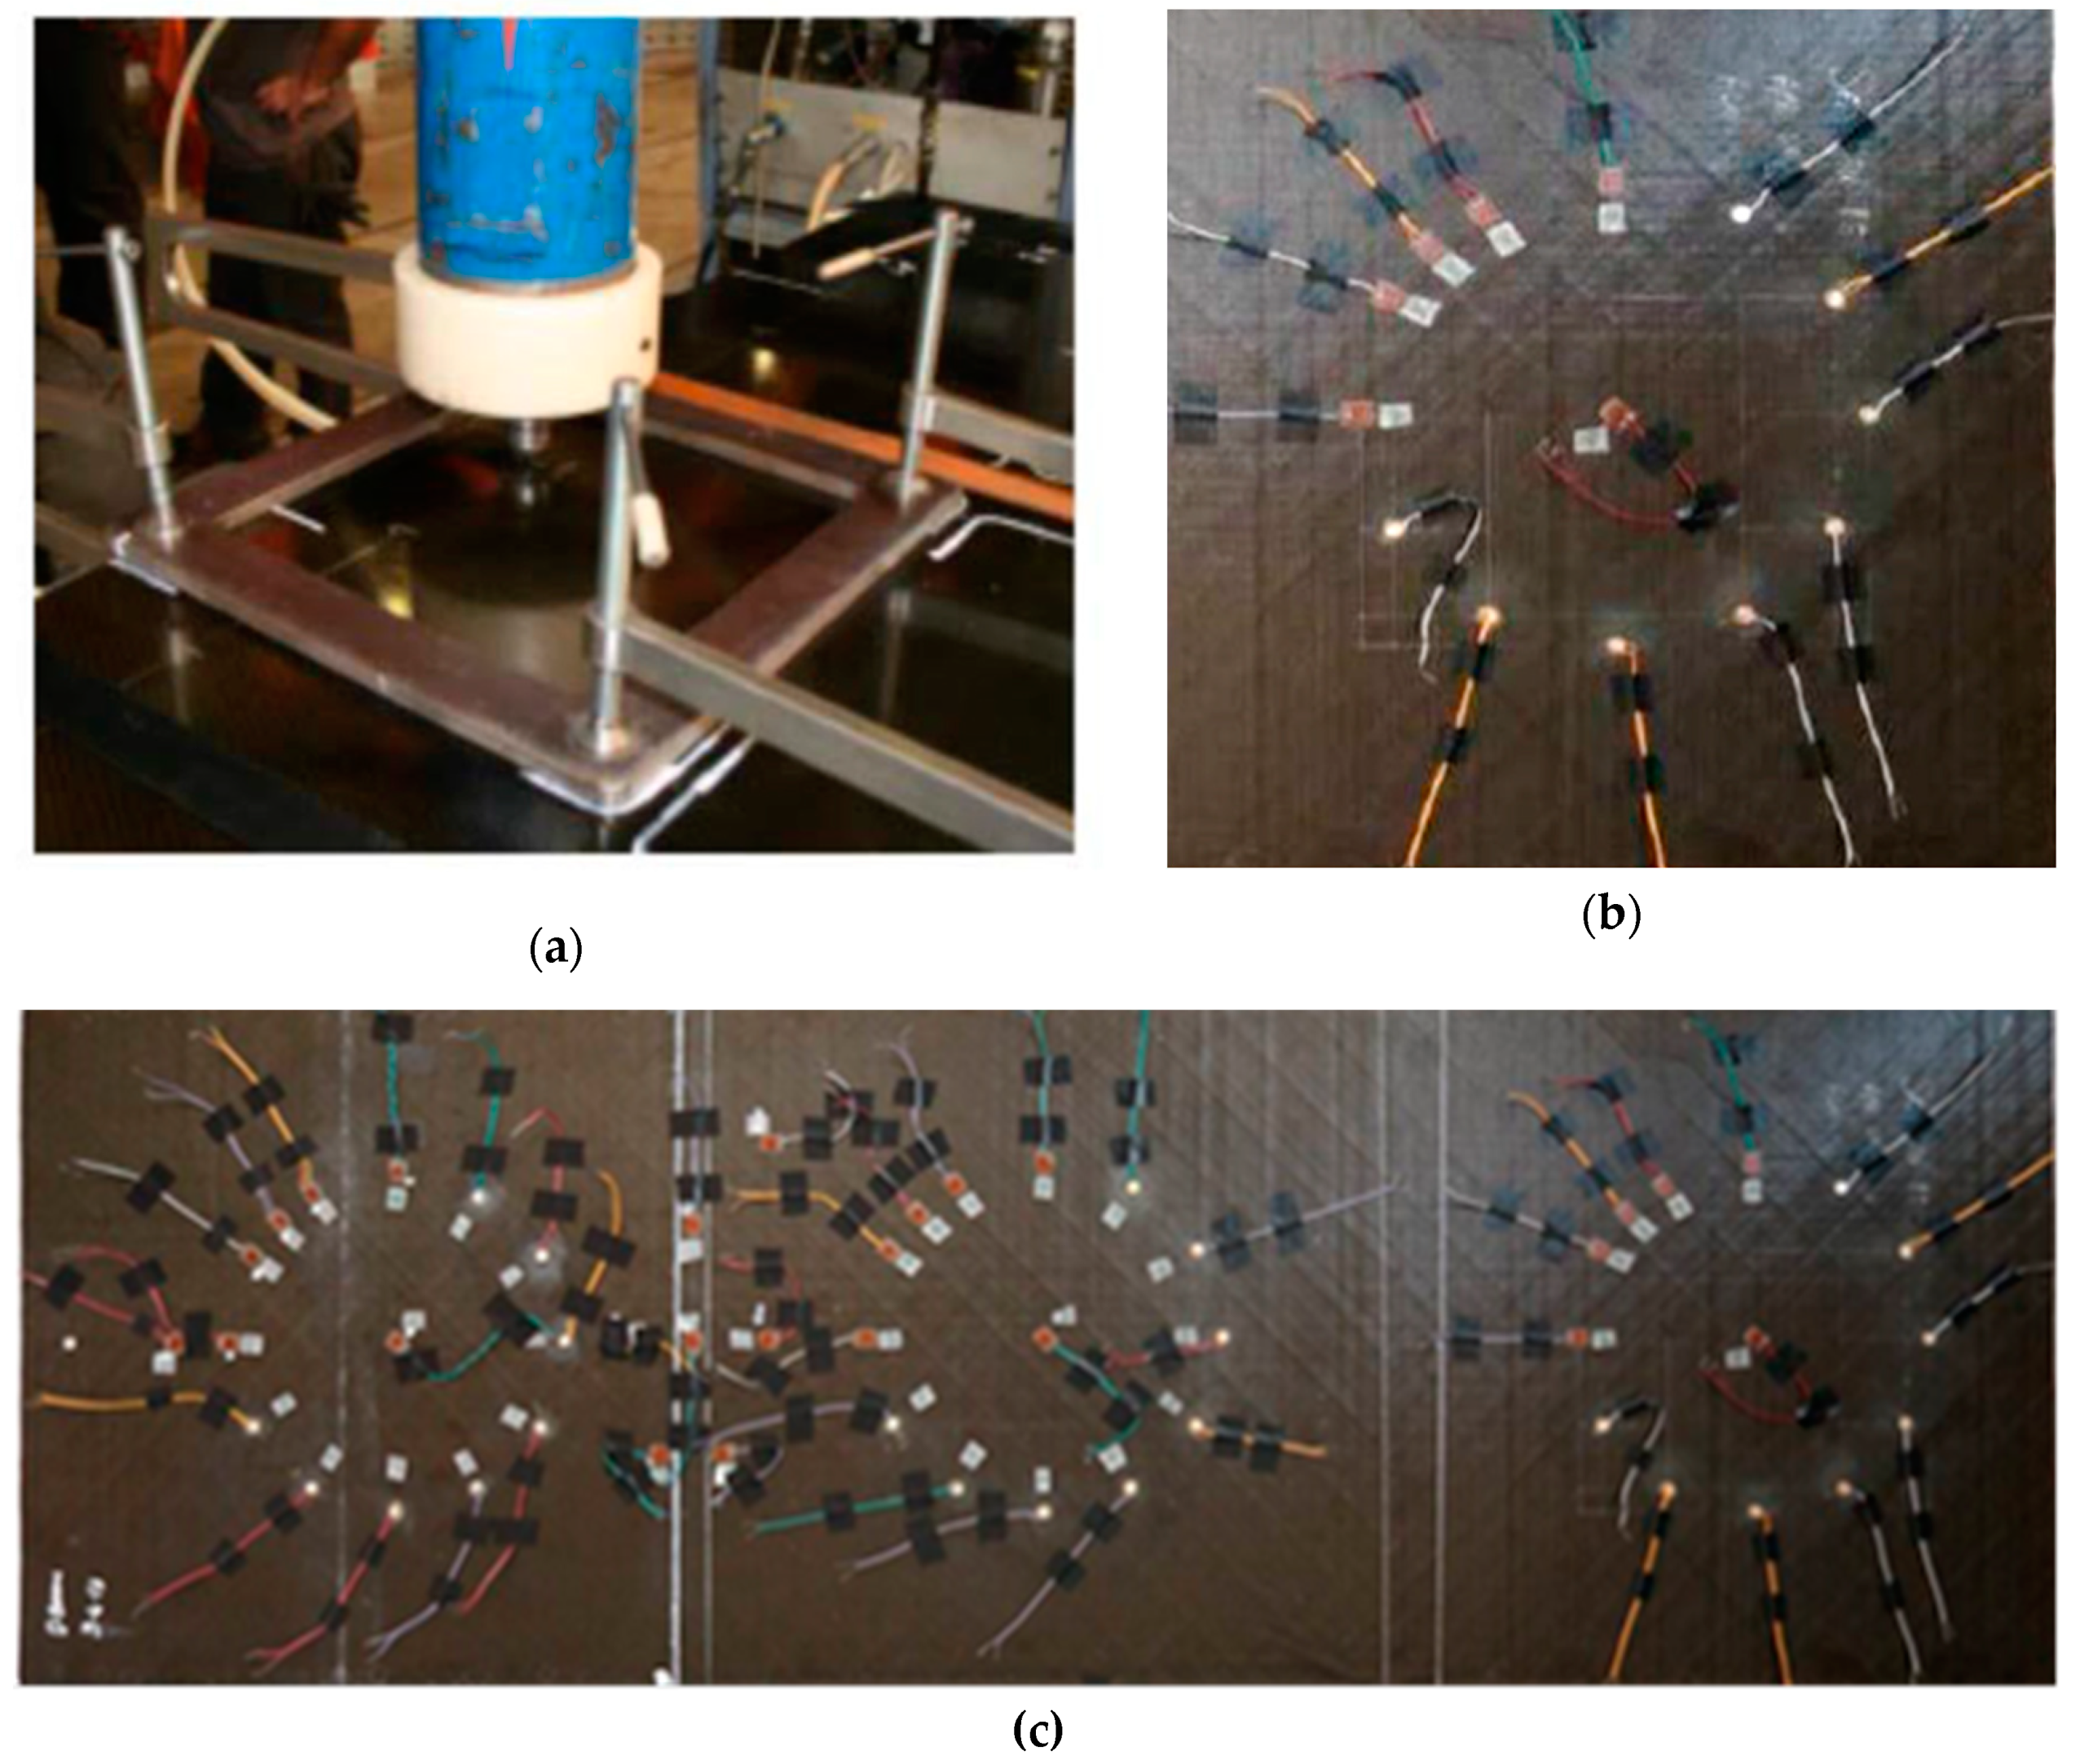
Figure 10.
Model instrumentation: (a) vltage amplifier; (b) arbitrary waveform signal generator HP/Agilent 33120A; (c) Agilent Oscilloscope InfiniiVision DSO7014A.
Figure 10.
Model instrumentation: (a) vltage amplifier; (b) arbitrary waveform signal generator HP/Agilent 33120A; (c) Agilent Oscilloscope InfiniiVision DSO7014A.
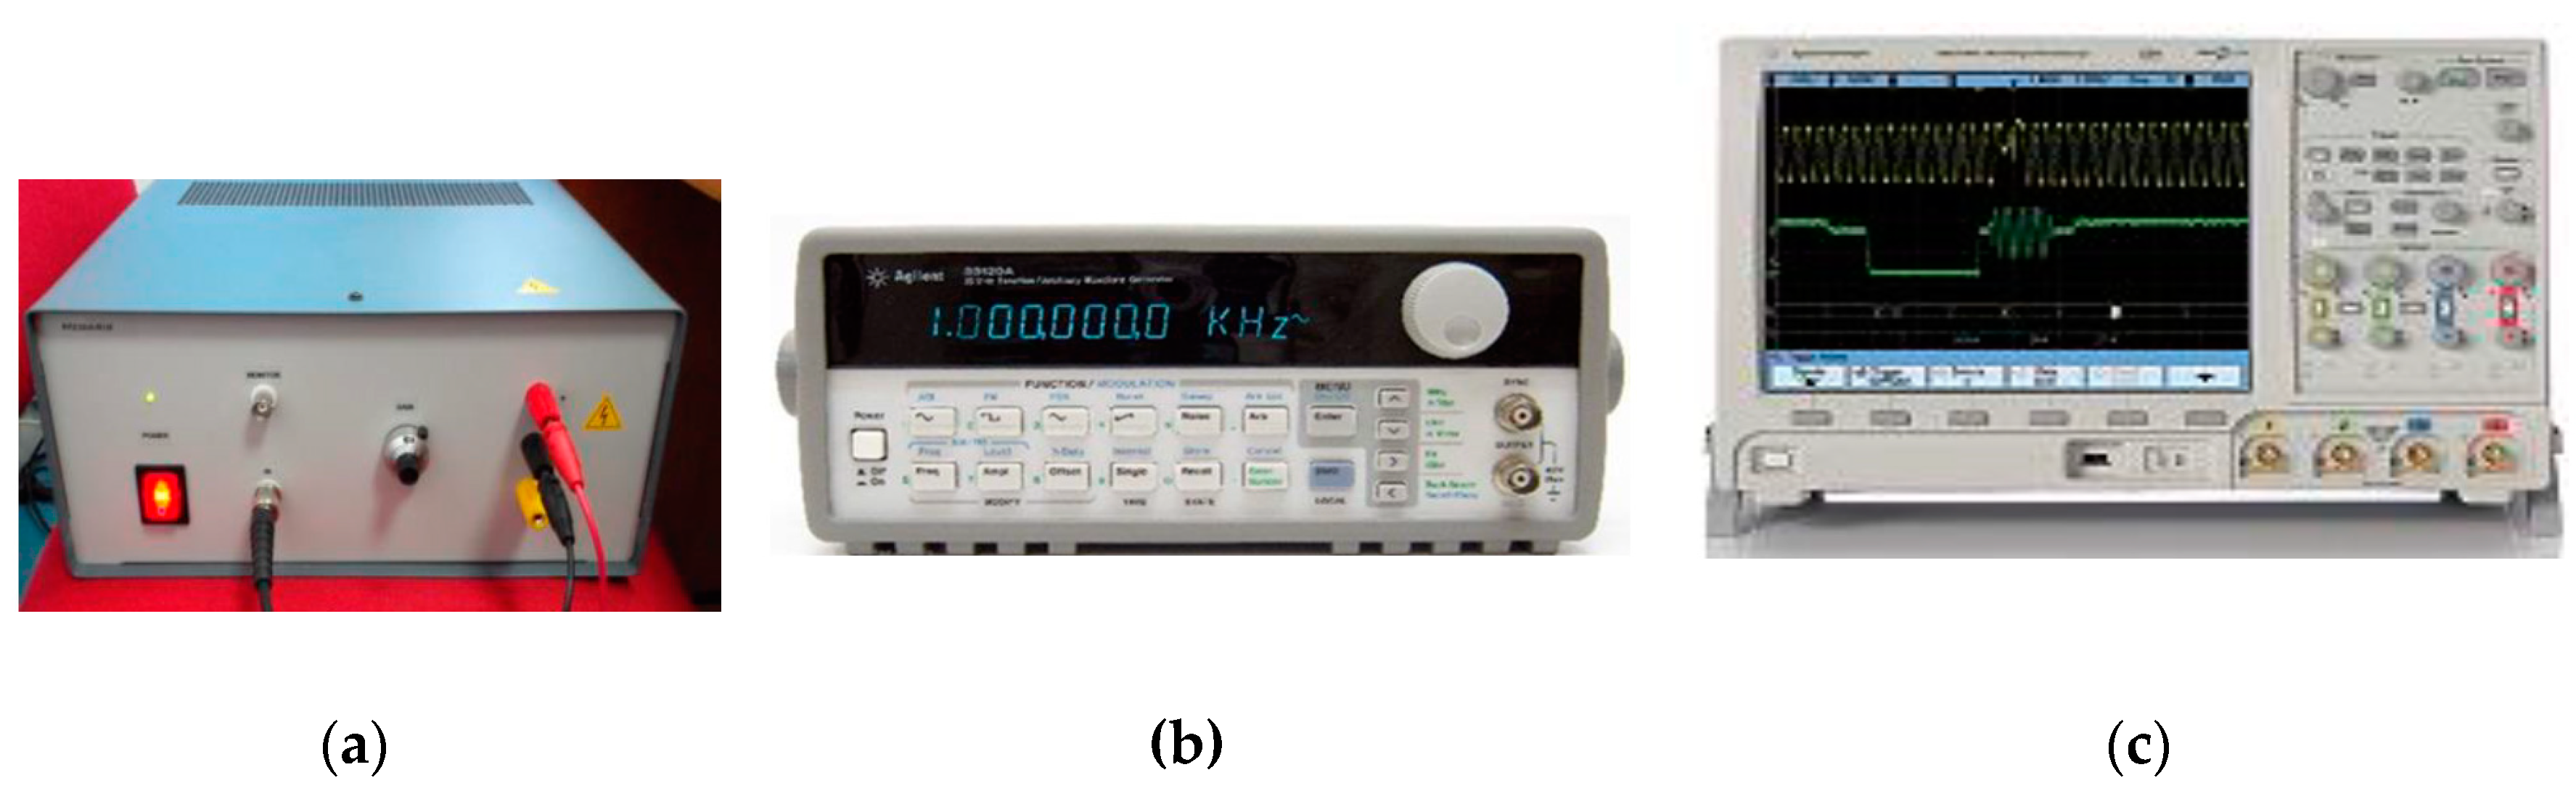
Figure 11.
Matlab signal analysis code logical flow chart.
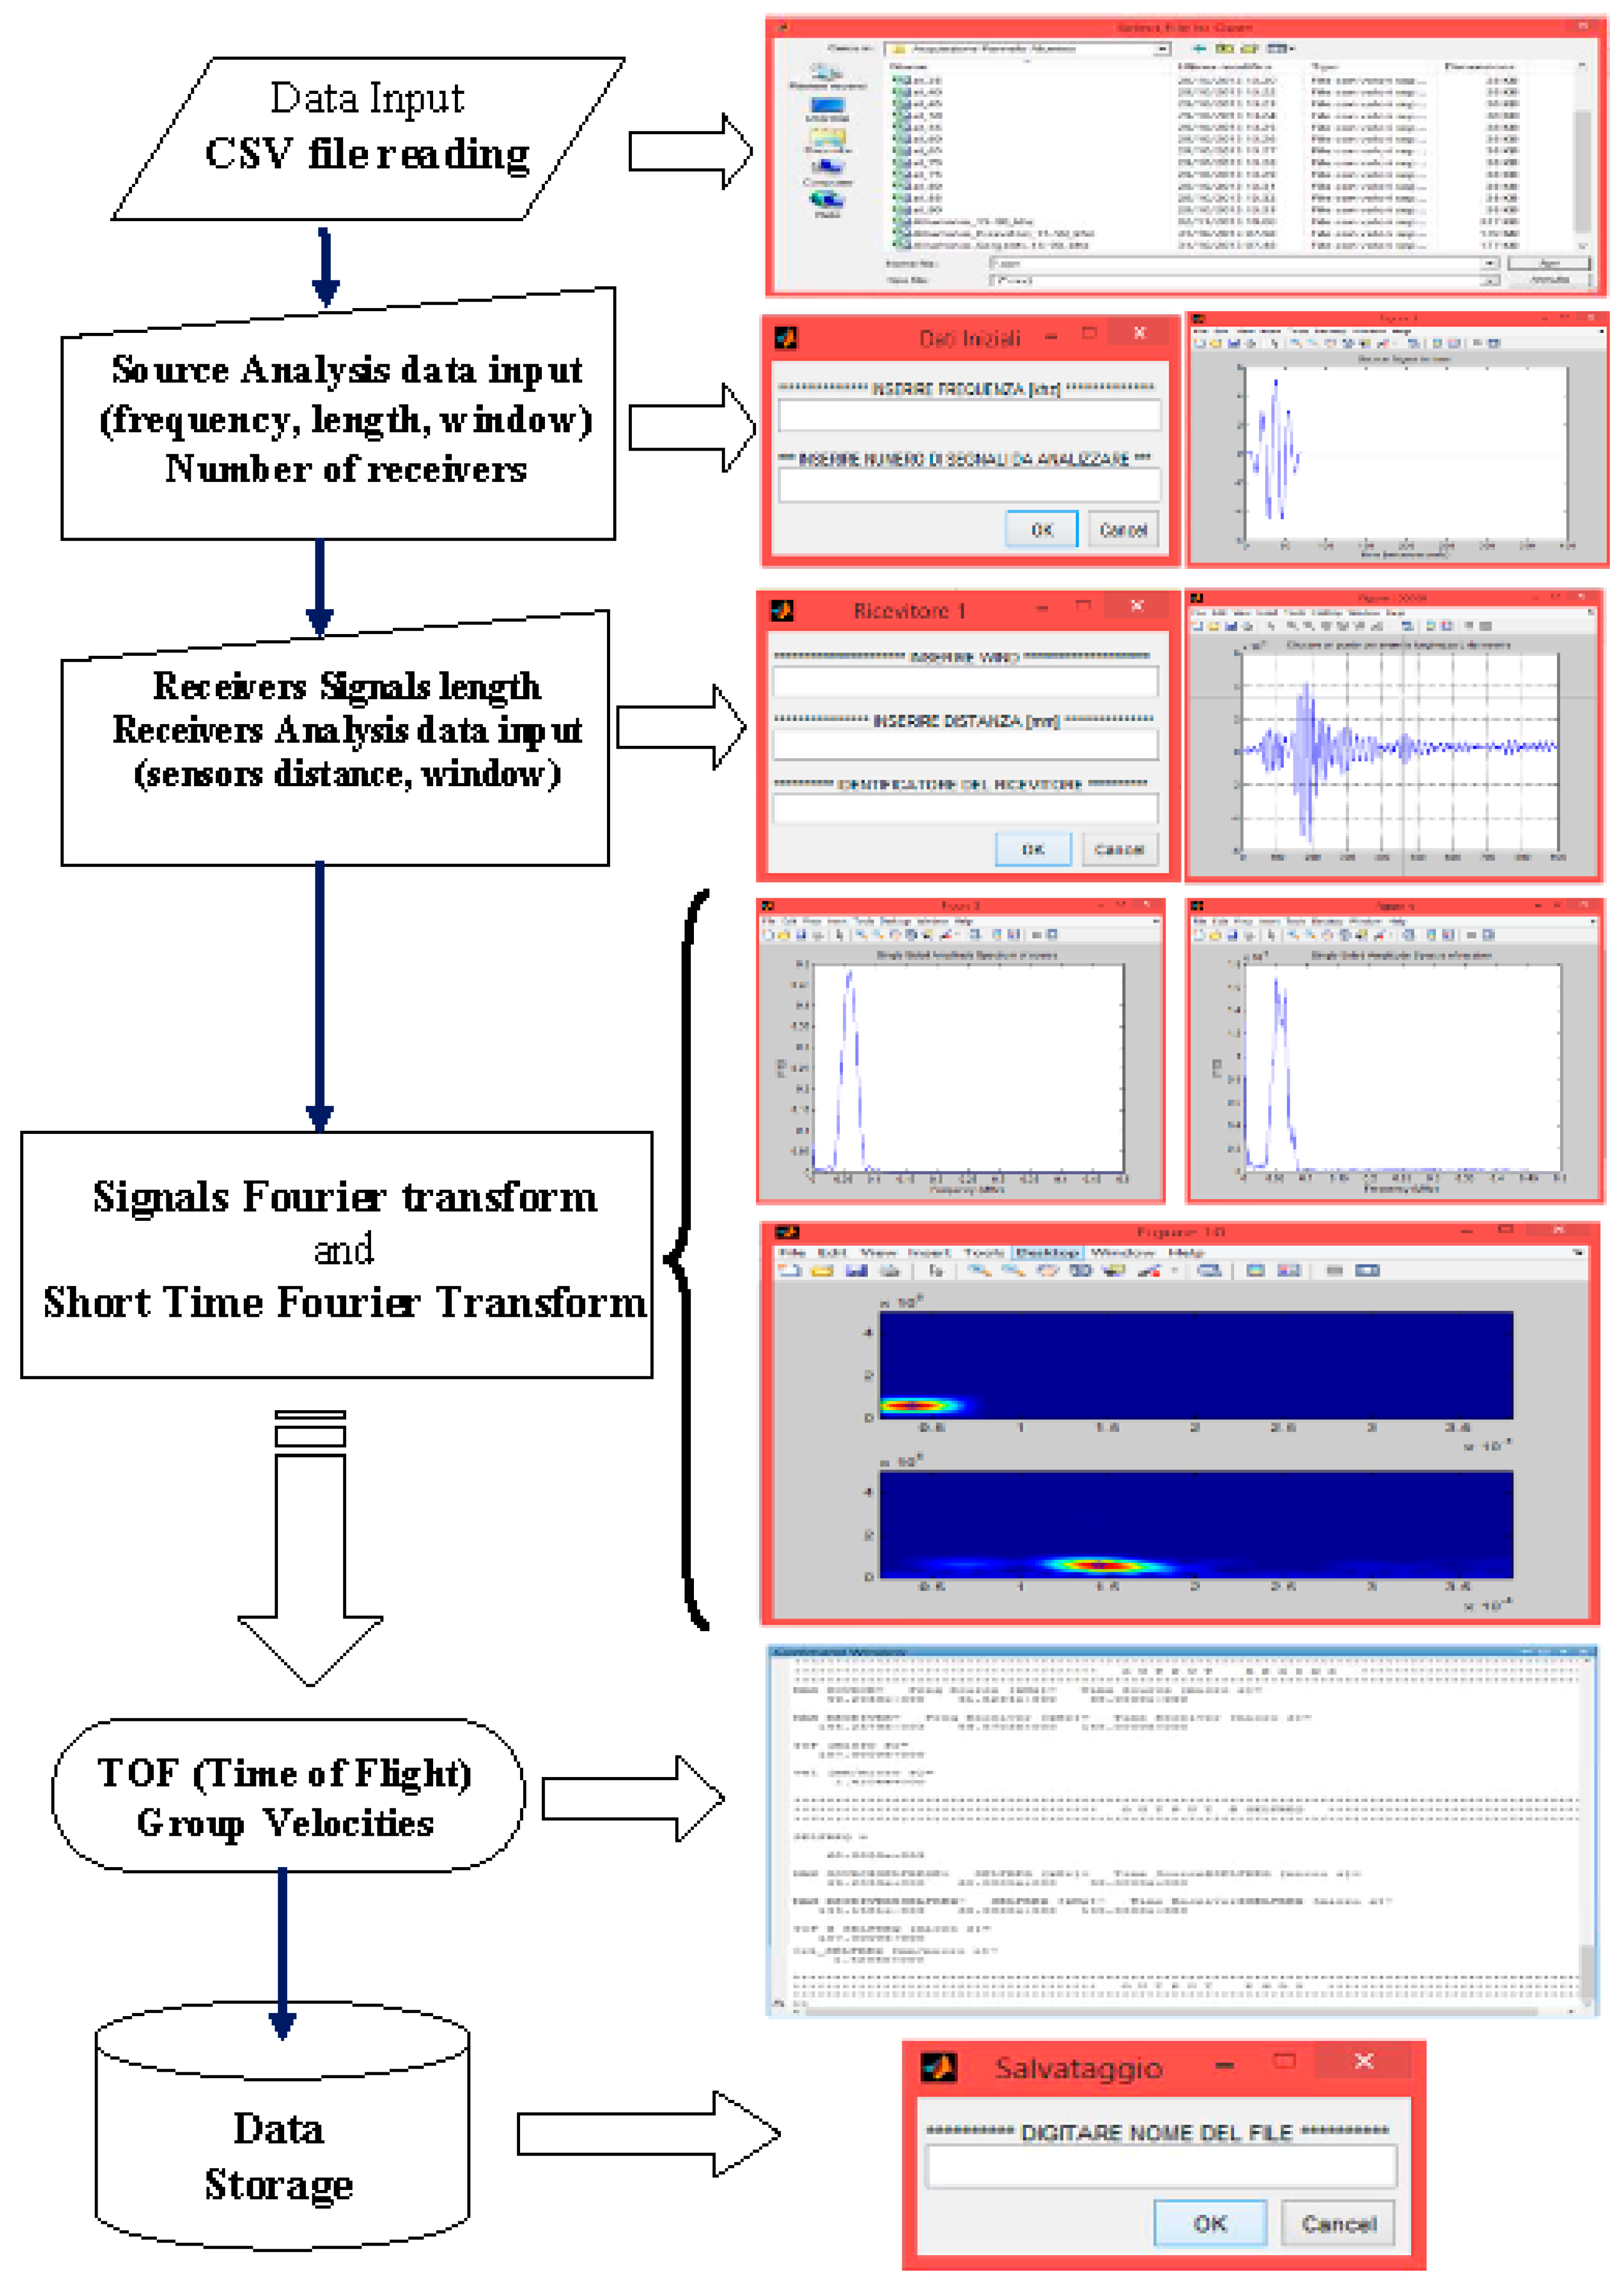
Figure 12.
Signal levels and damage index comparison example
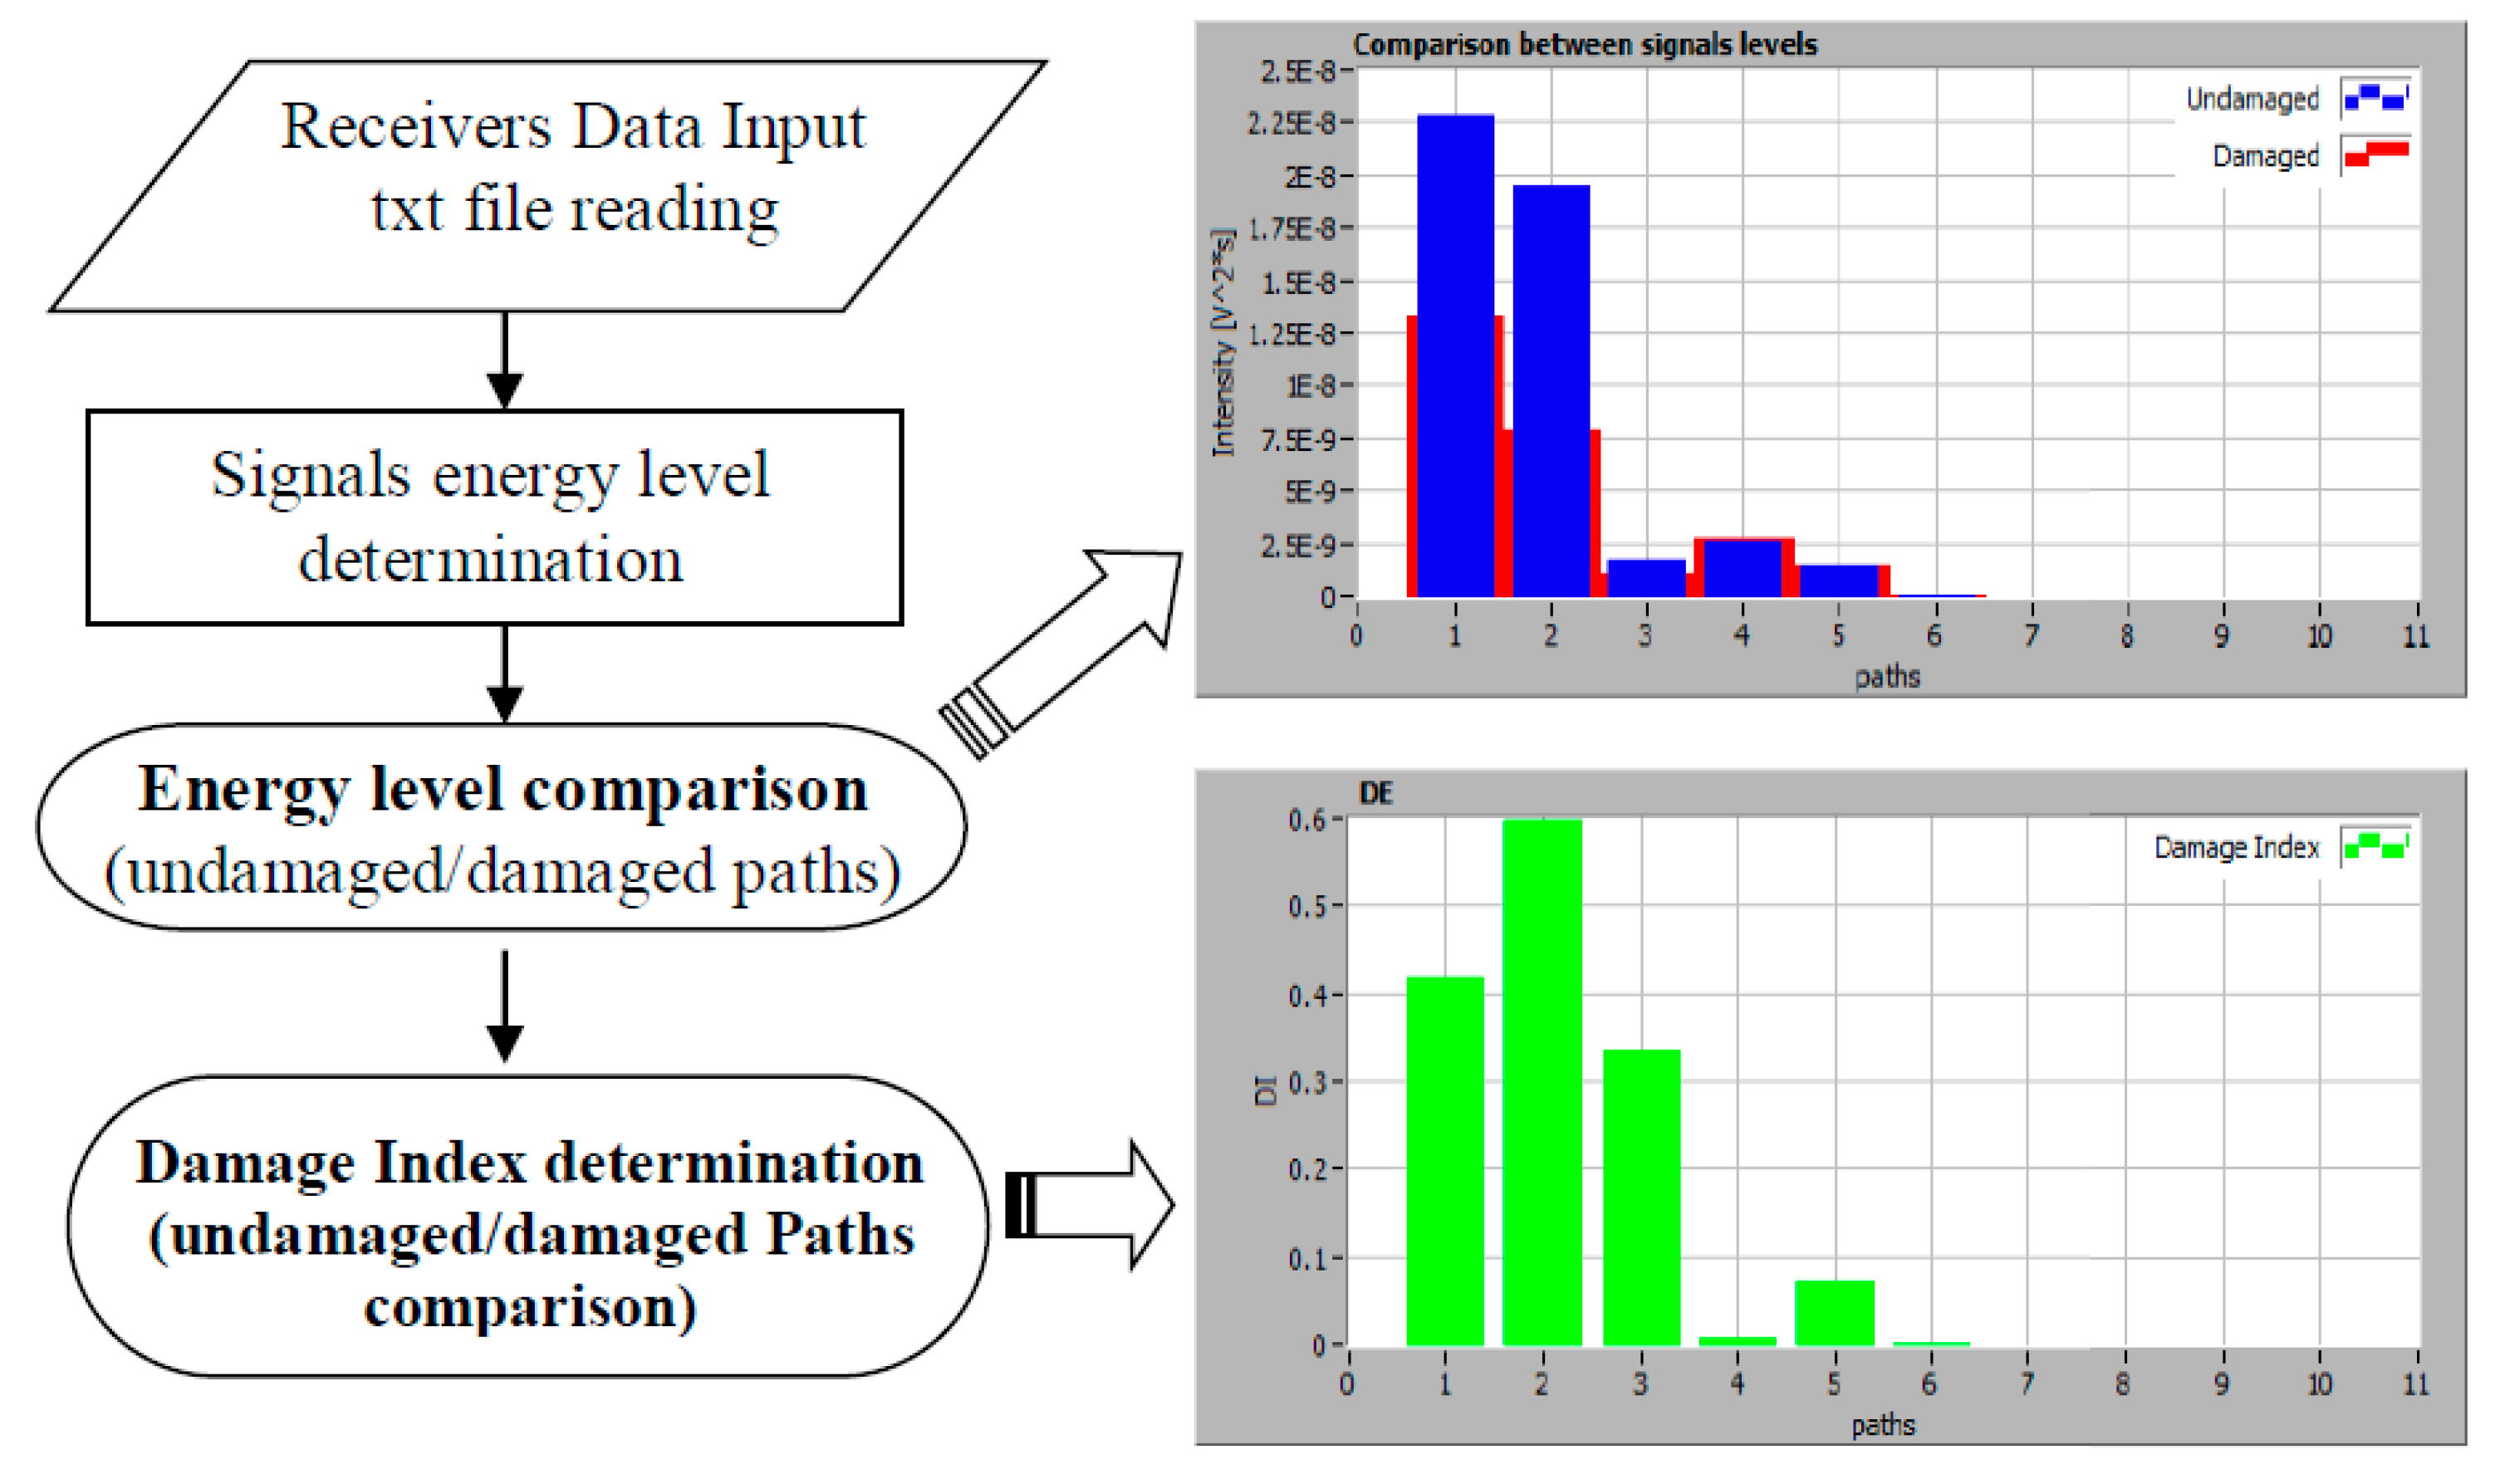
Figure 13.
Network of the propagation paths for a circular array of piezo and selected paths obtained with GW-based DI_GW approach.
Figure 13.
Network of the propagation paths for a circular array of piezo and selected paths obtained with GW-based DI_GW approach.
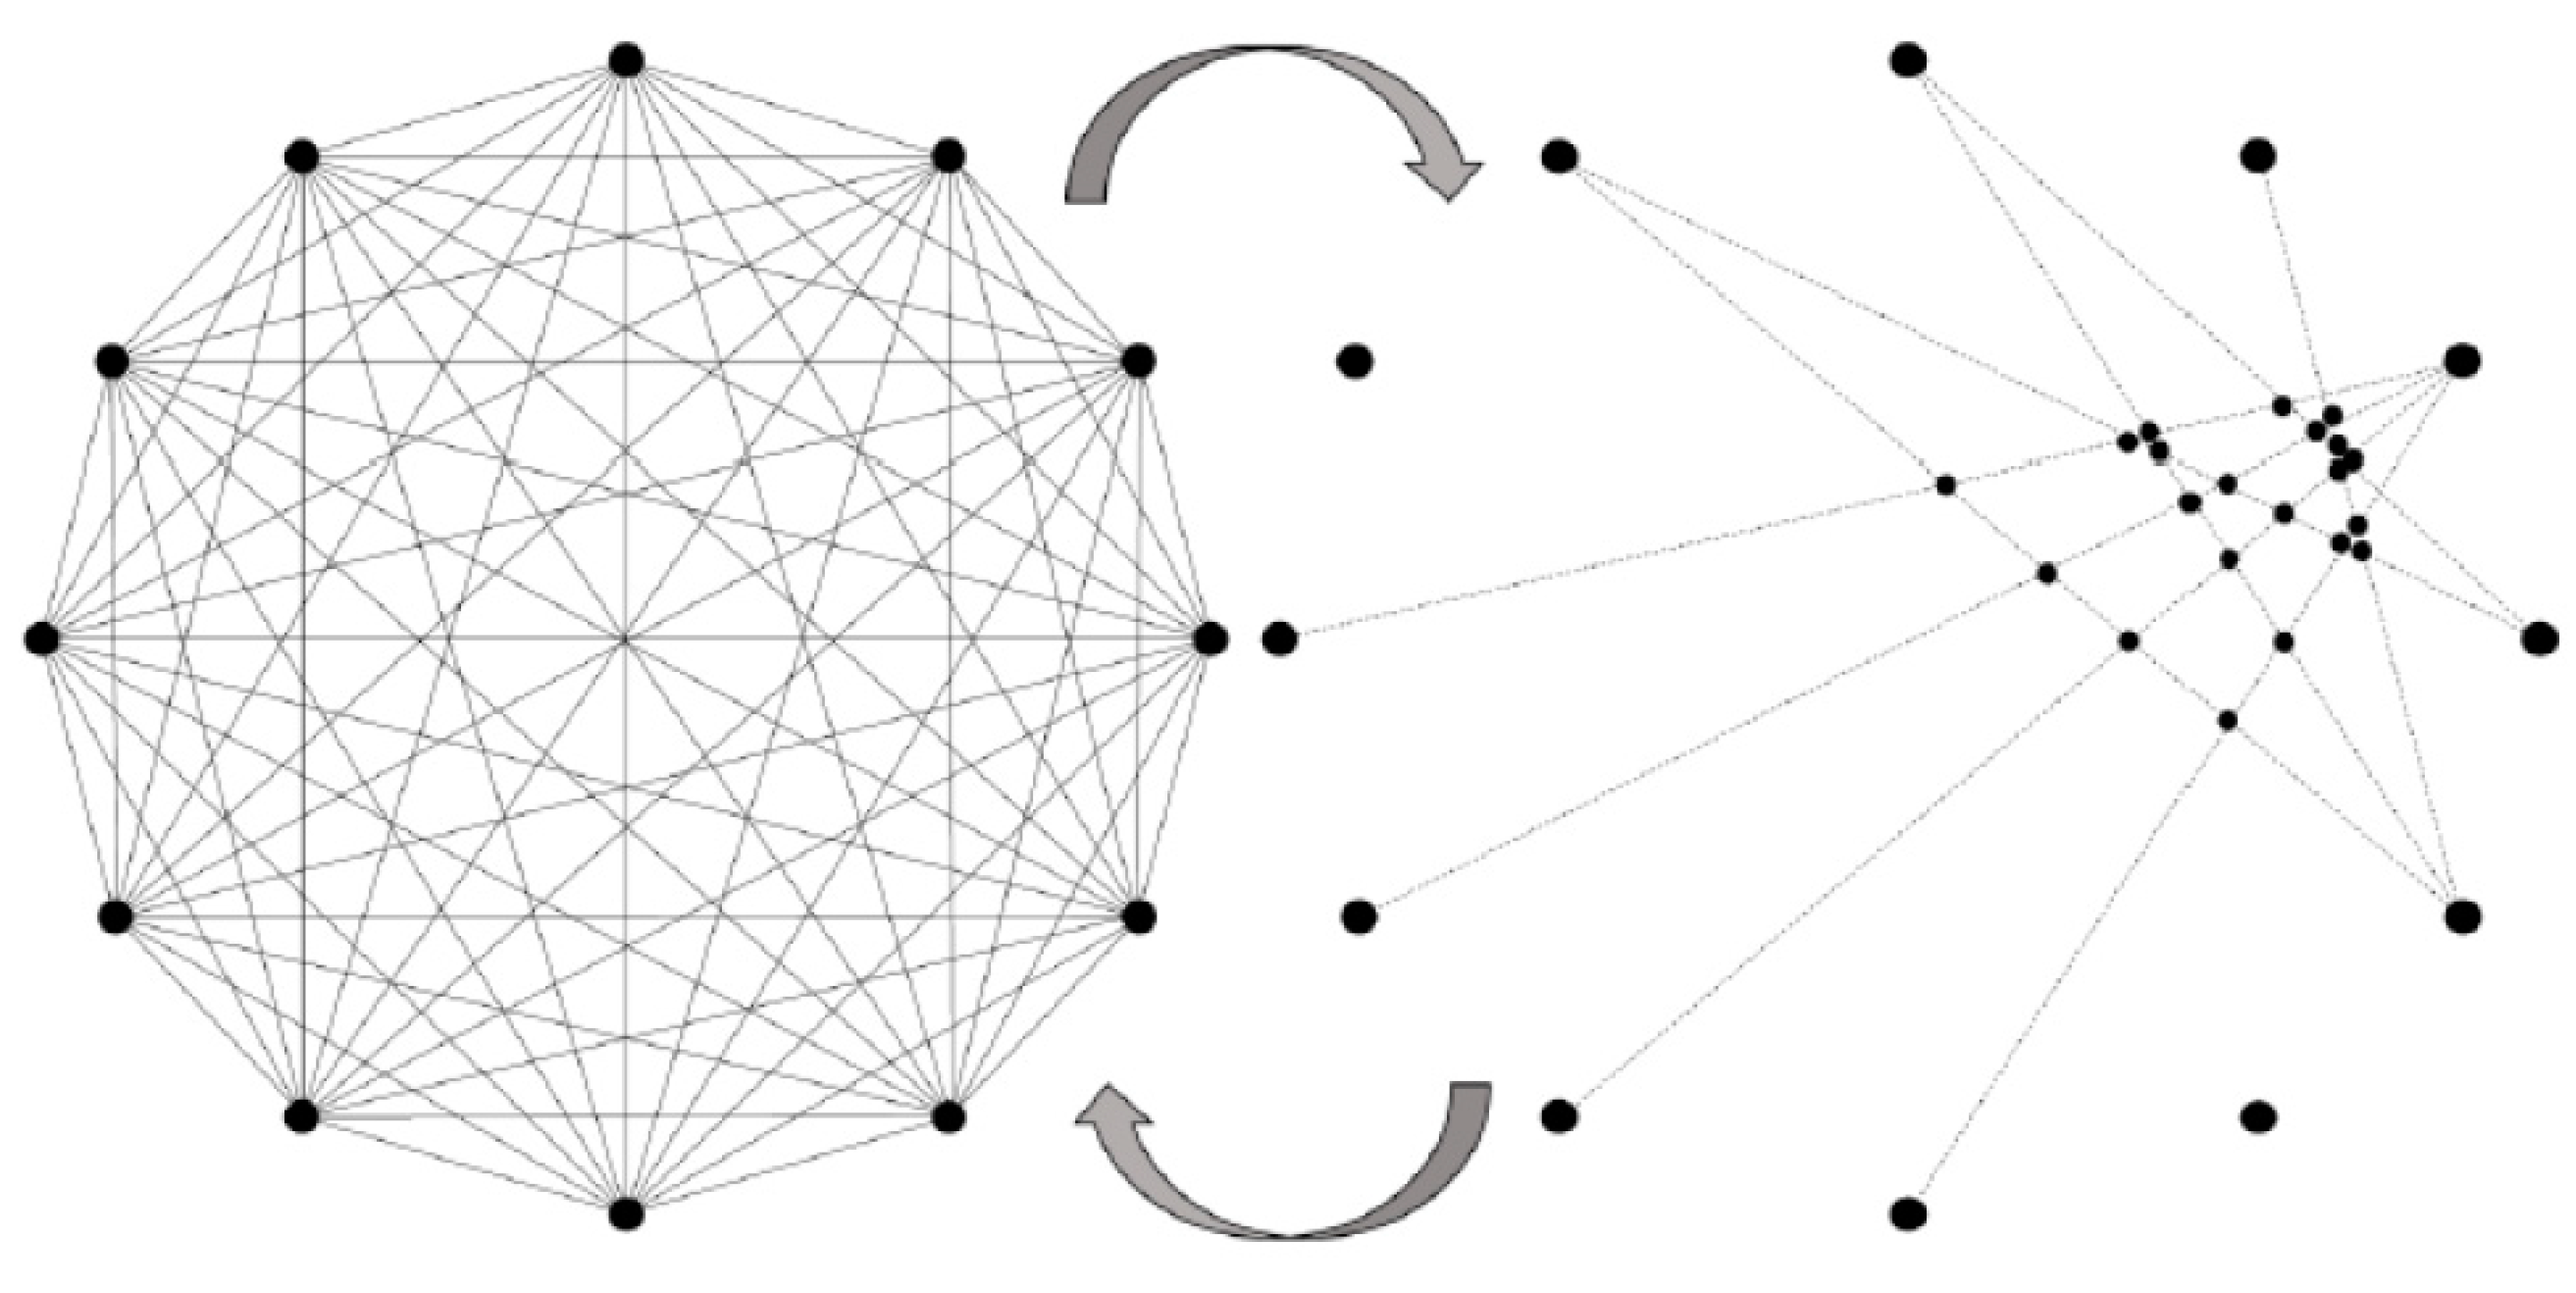
Figure 14.
Signal levels and damage index comparison example.
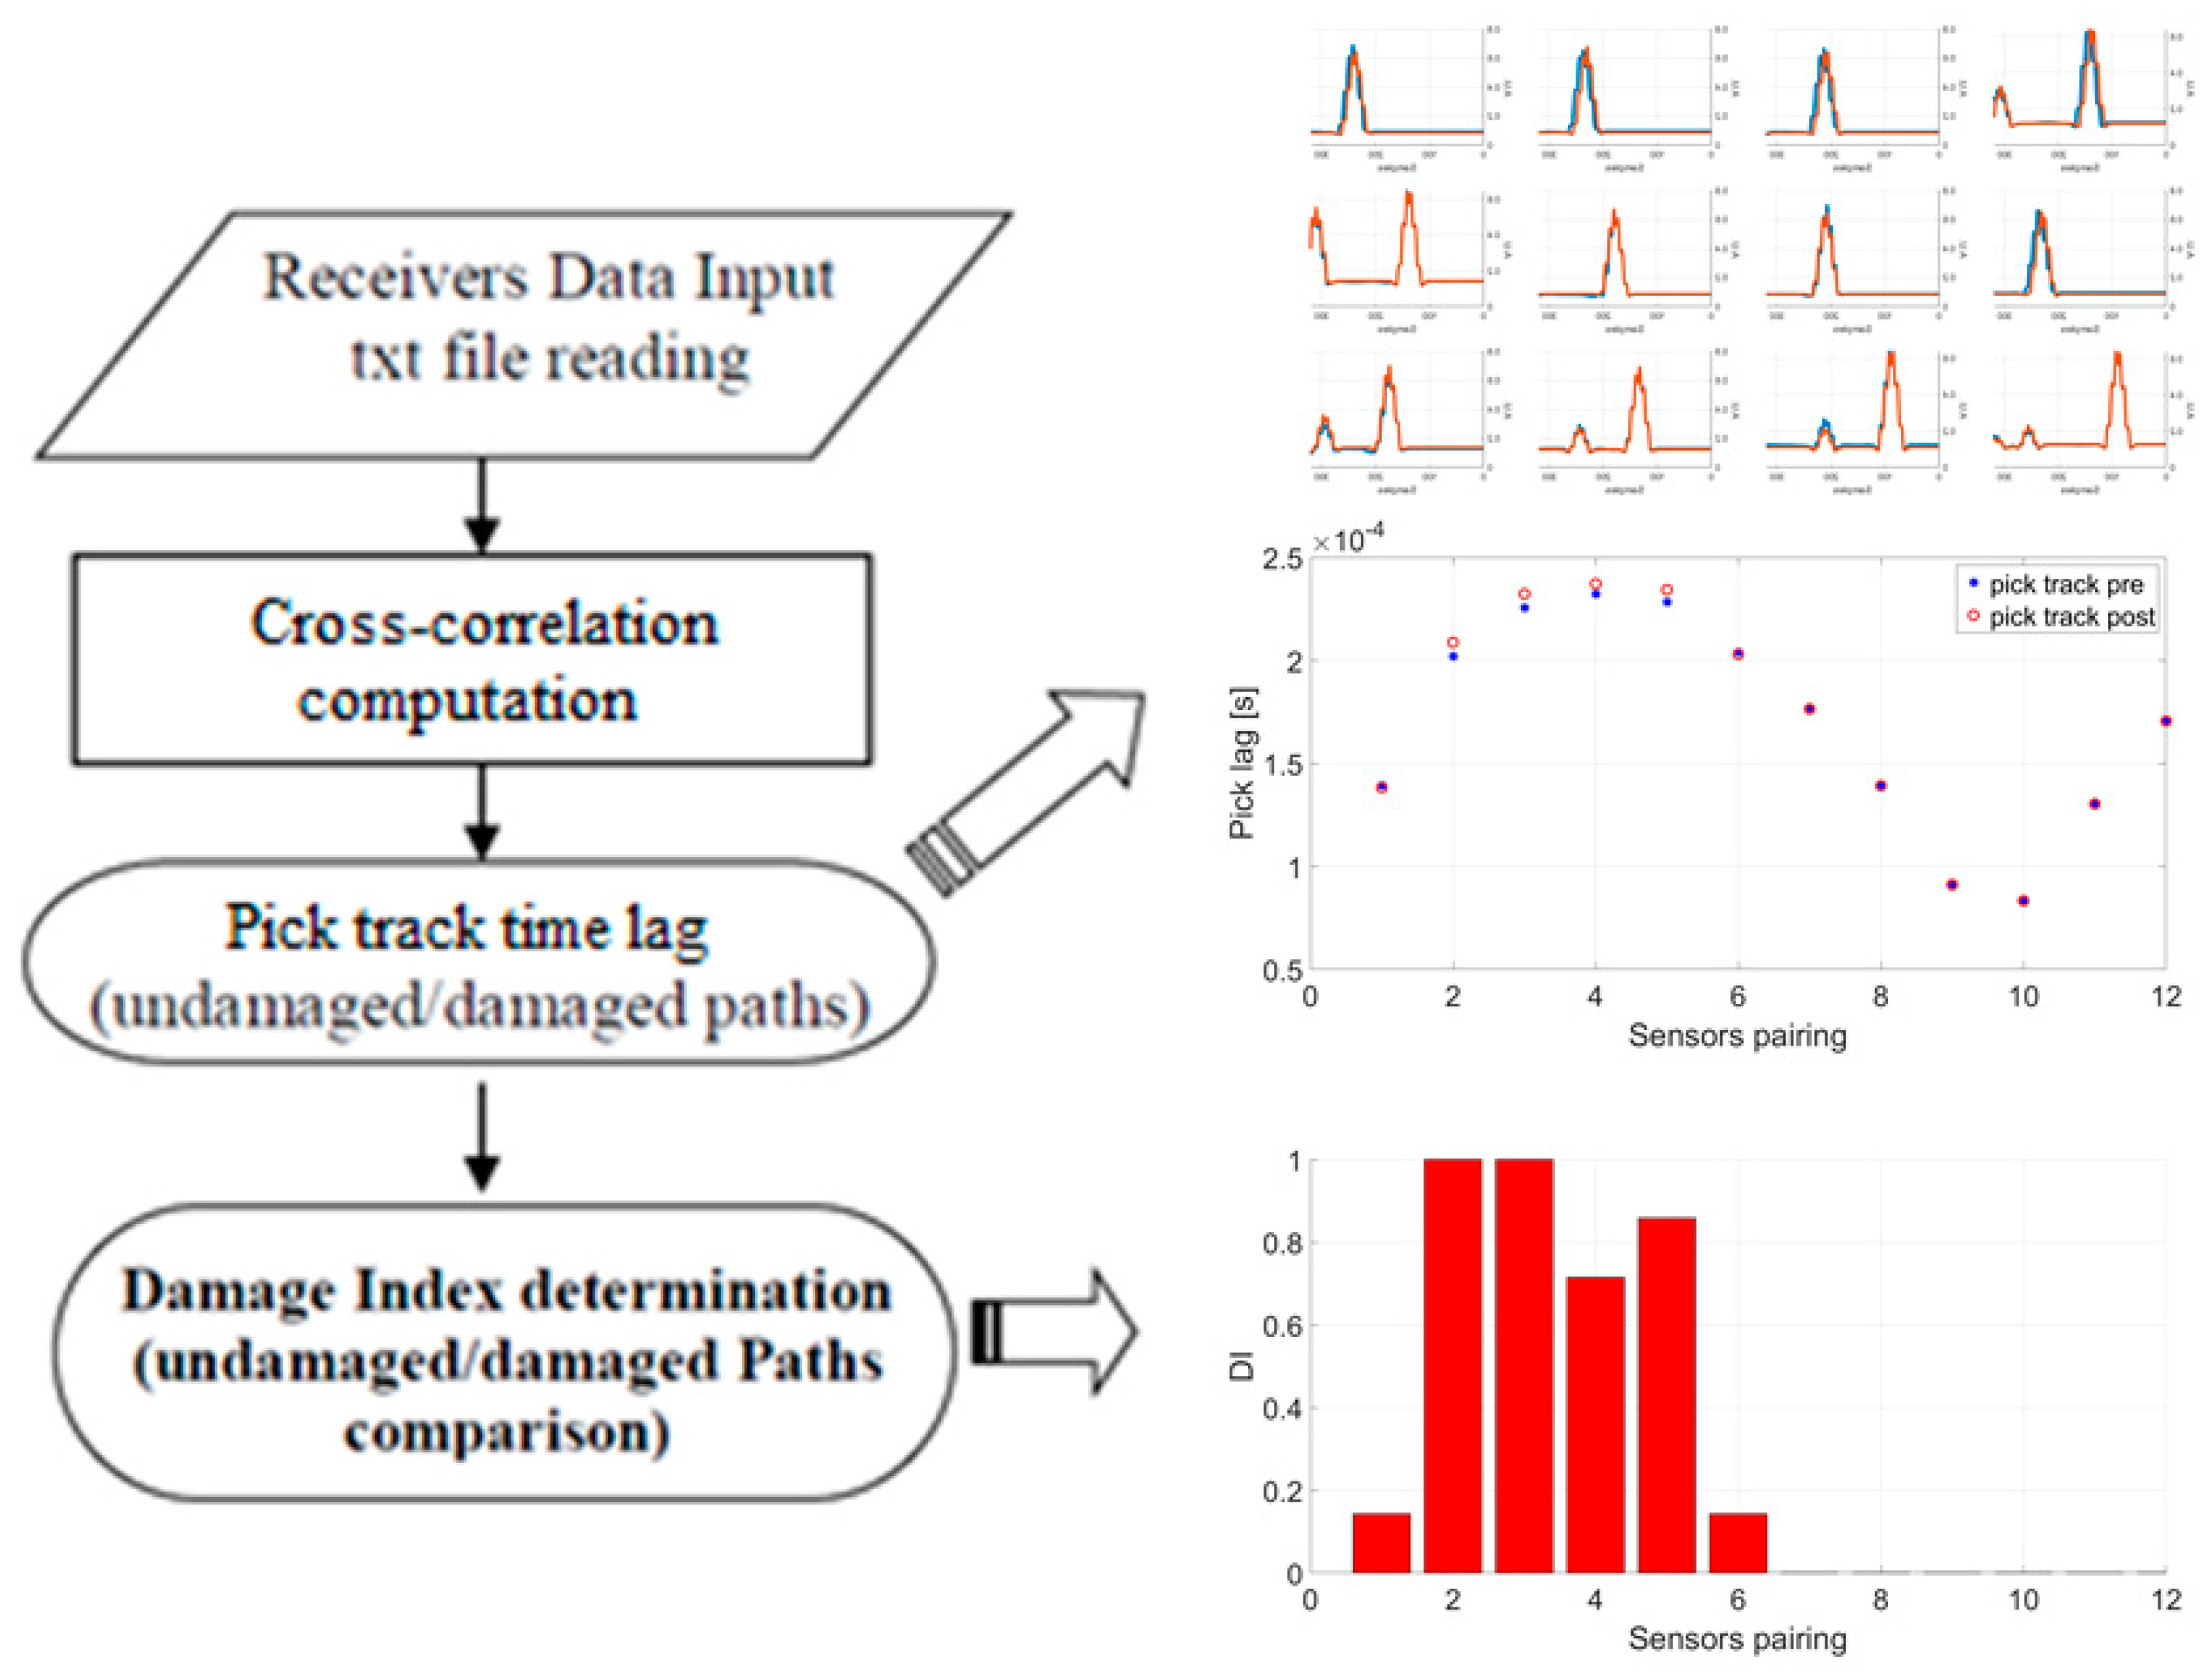
Figure 15.
Scheme of the detected area: paths of the Lamb wave signal (gray lines); intersections of paths (bold dots); intersections of the paths on which anomaly was detected (red circles).
Figure 15.
Scheme of the detected area: paths of the Lamb wave signal (gray lines); intersections of paths (bold dots); intersections of the paths on which anomaly was detected (red circles).
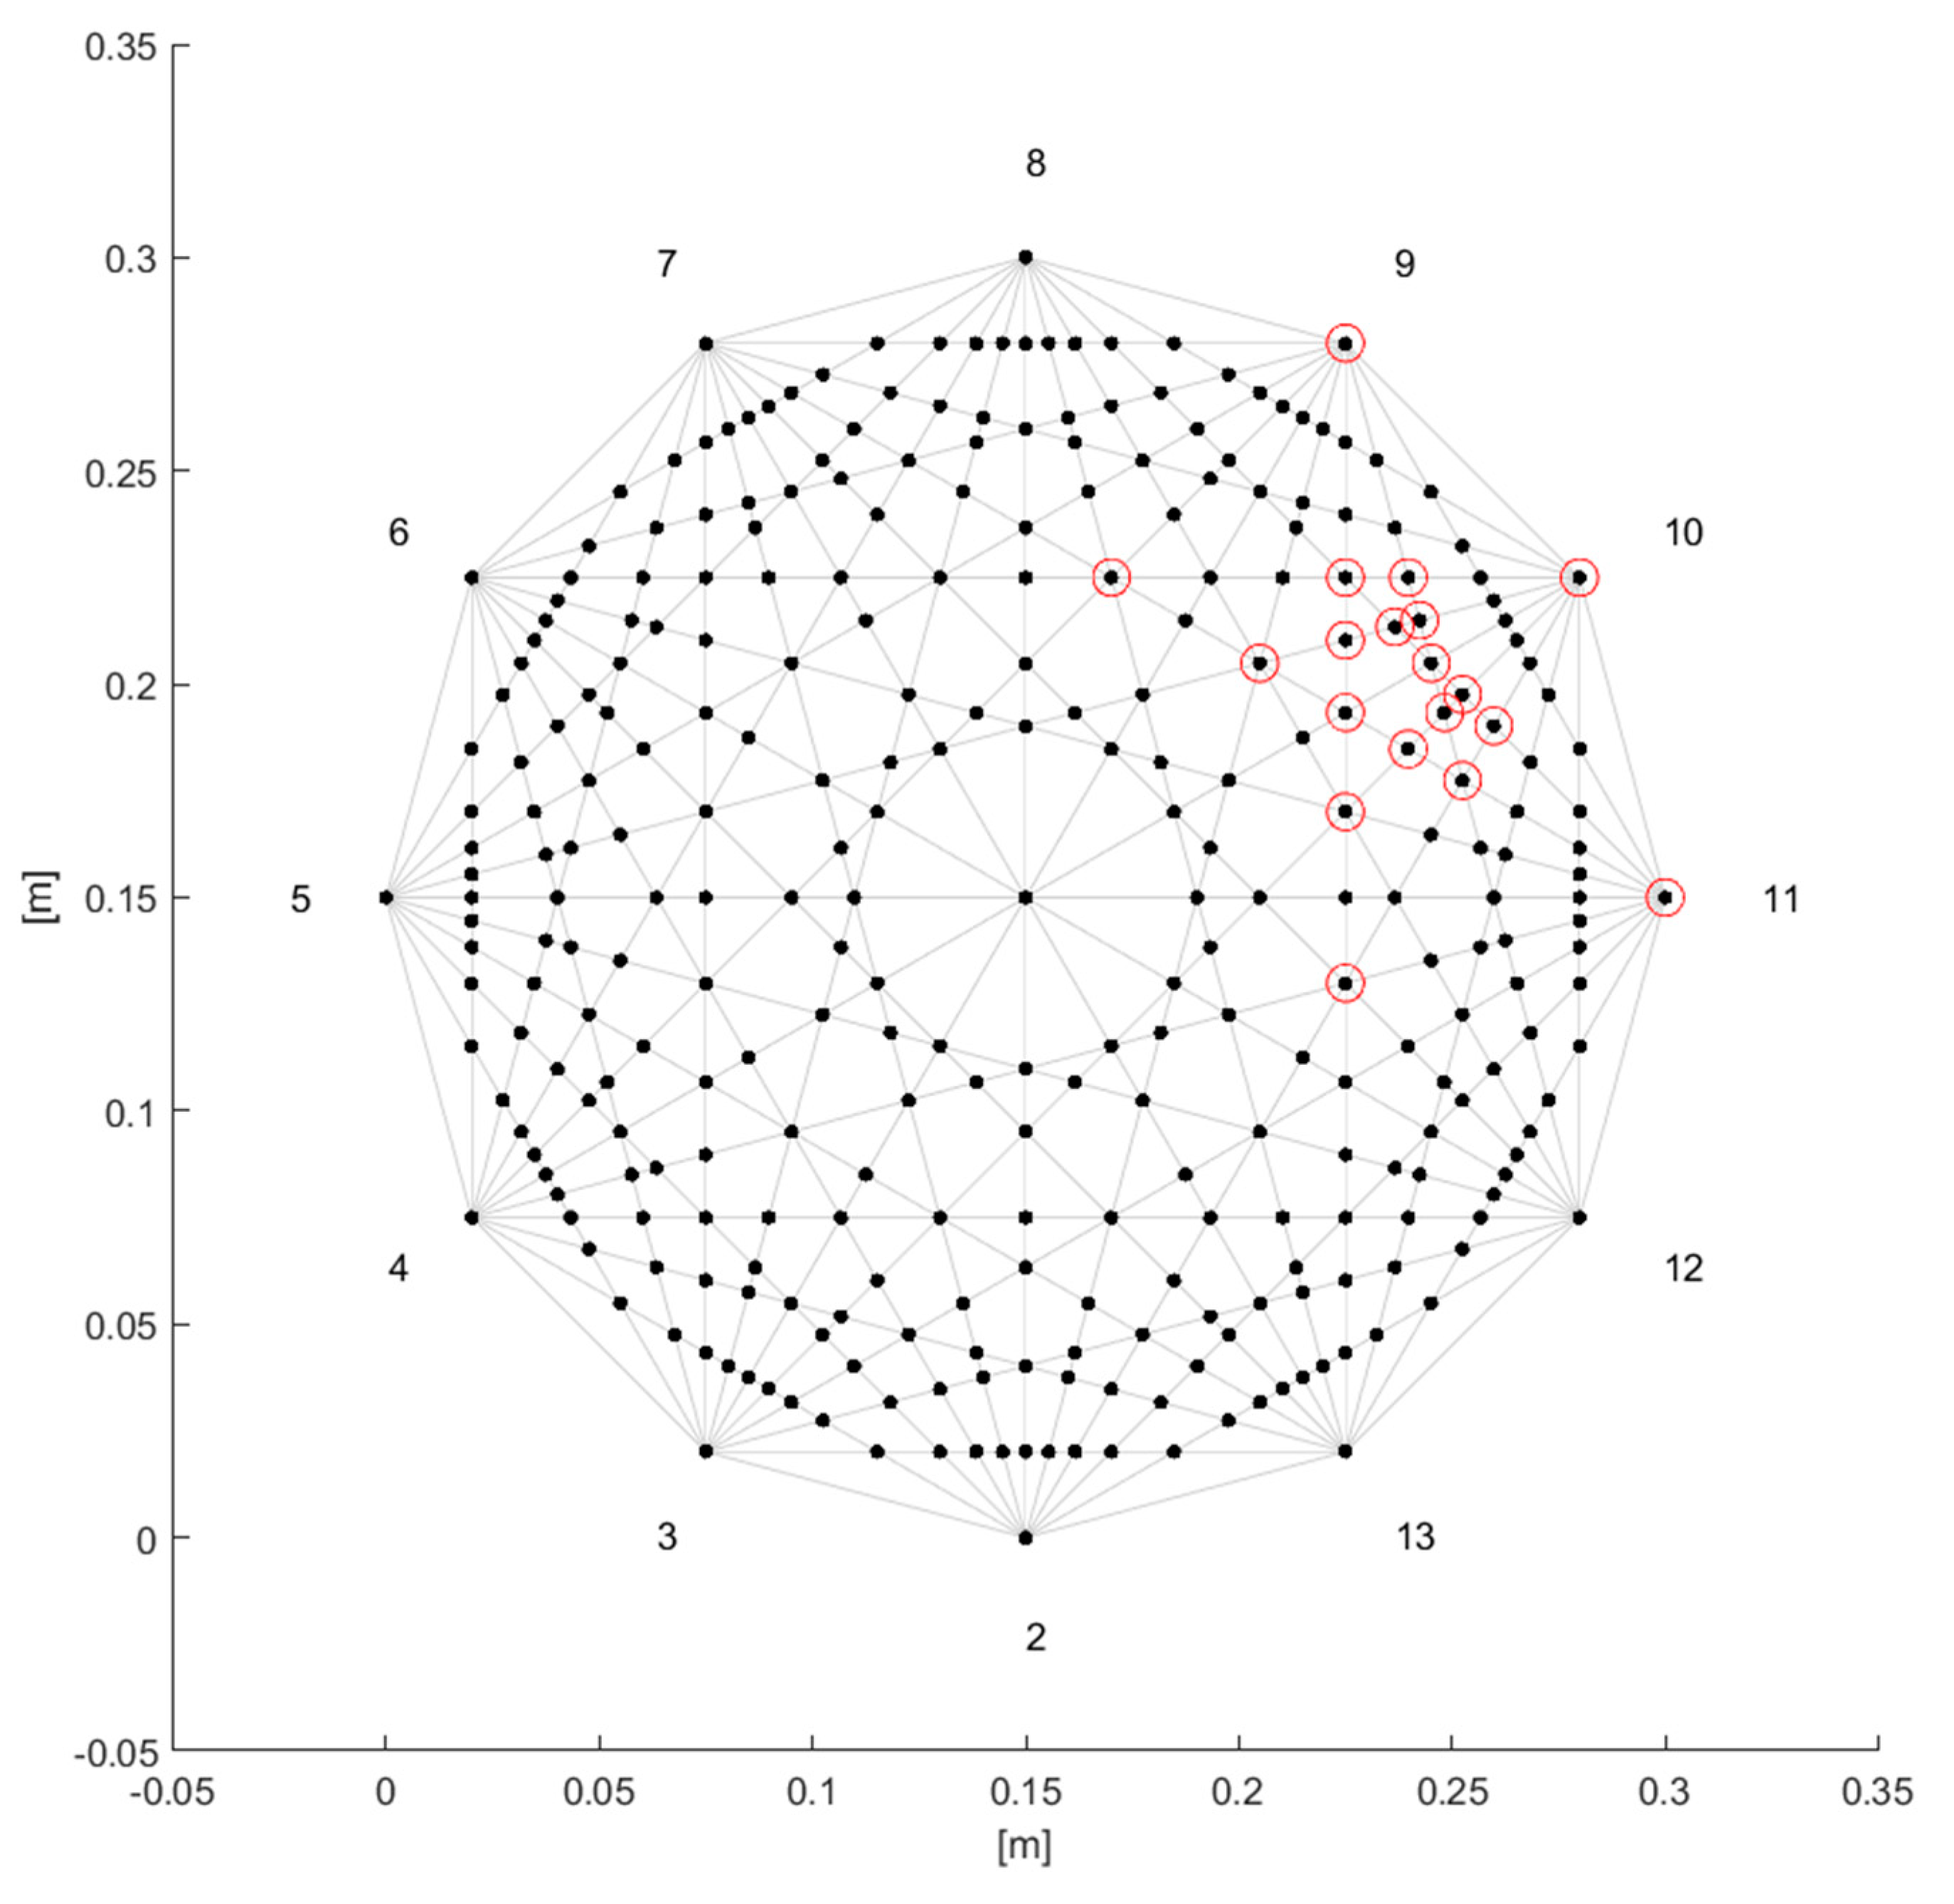
Figure 16.
top plot: light bulbs ratios (coloured lines) and least square polynomial of the mean ratio (black bold line); middle plot: 1st derivative (slope) of the polynomial; bottom plot: curvature of the polynomial.
Figure 16.
top plot: light bulbs ratios (coloured lines) and least square polynomial of the mean ratio (black bold line); middle plot: 1st derivative (slope) of the polynomial; bottom plot: curvature of the polynomial.
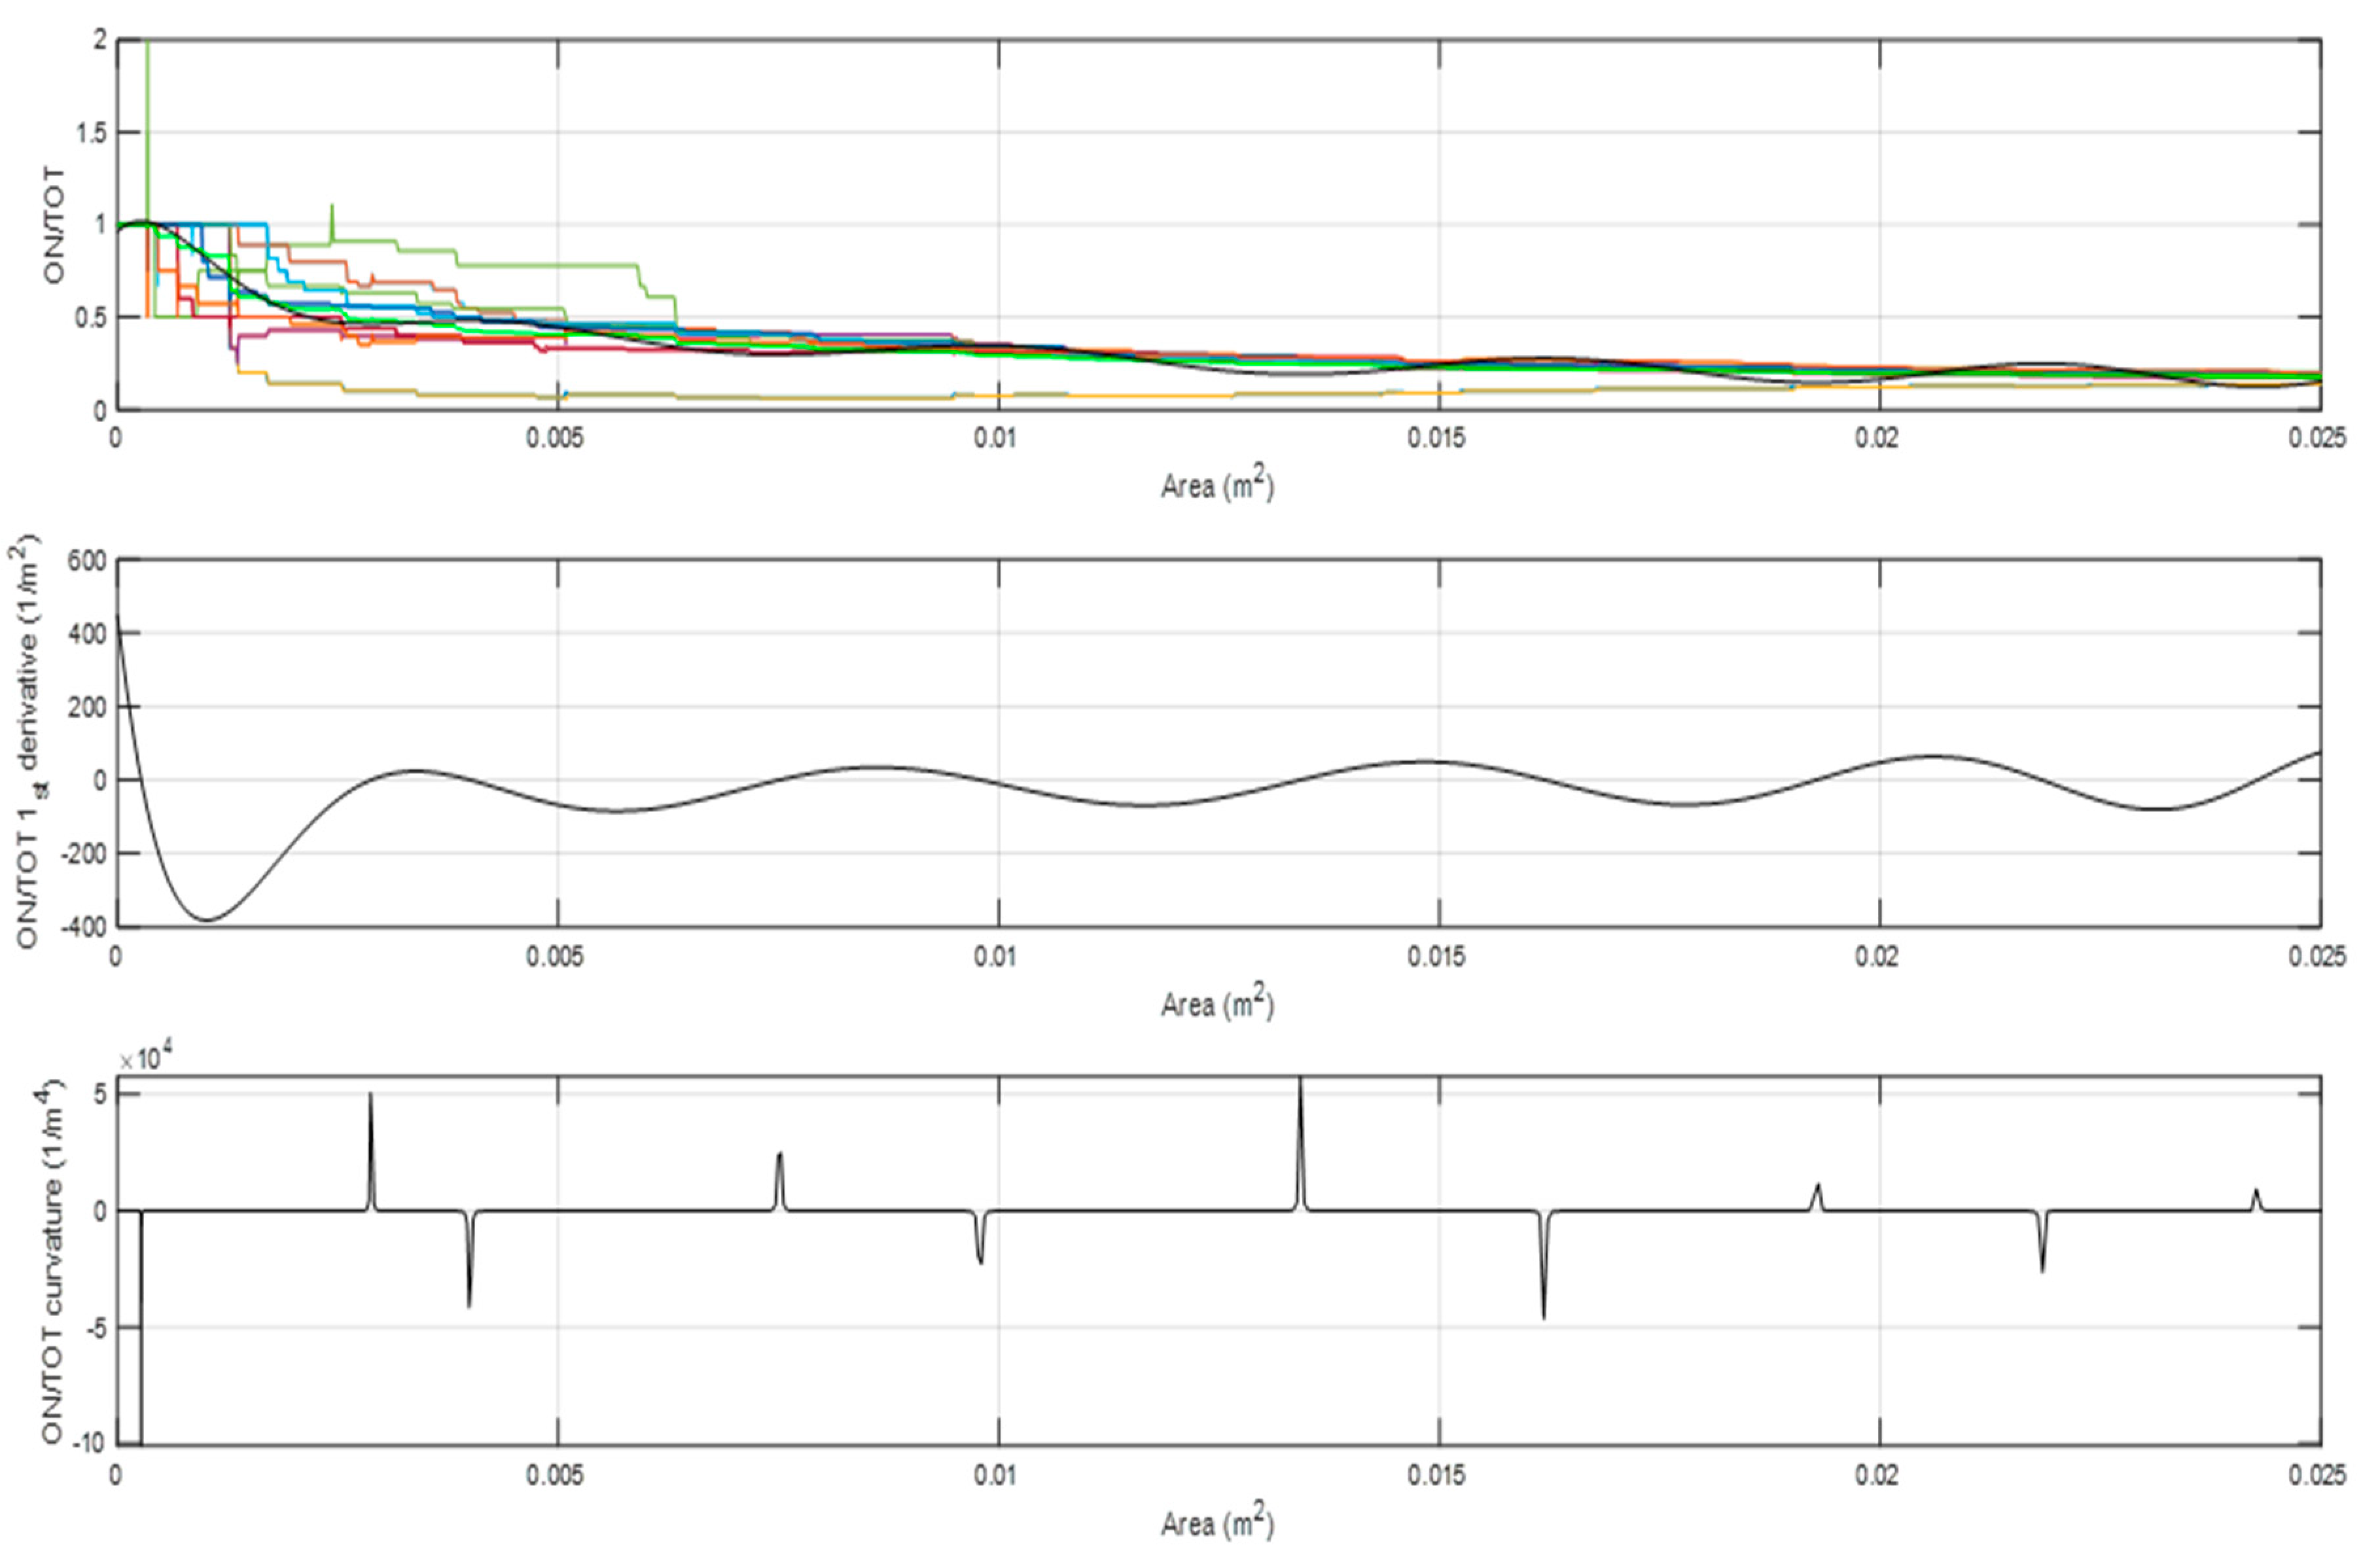
Figure 17.
a) Arrow basic GUI_CC representation of damaged paths; b) approximate shape of the damaged area.
Figure 17.
a) Arrow basic GUI_CC representation of damaged paths; b) approximate shape of the damaged area.
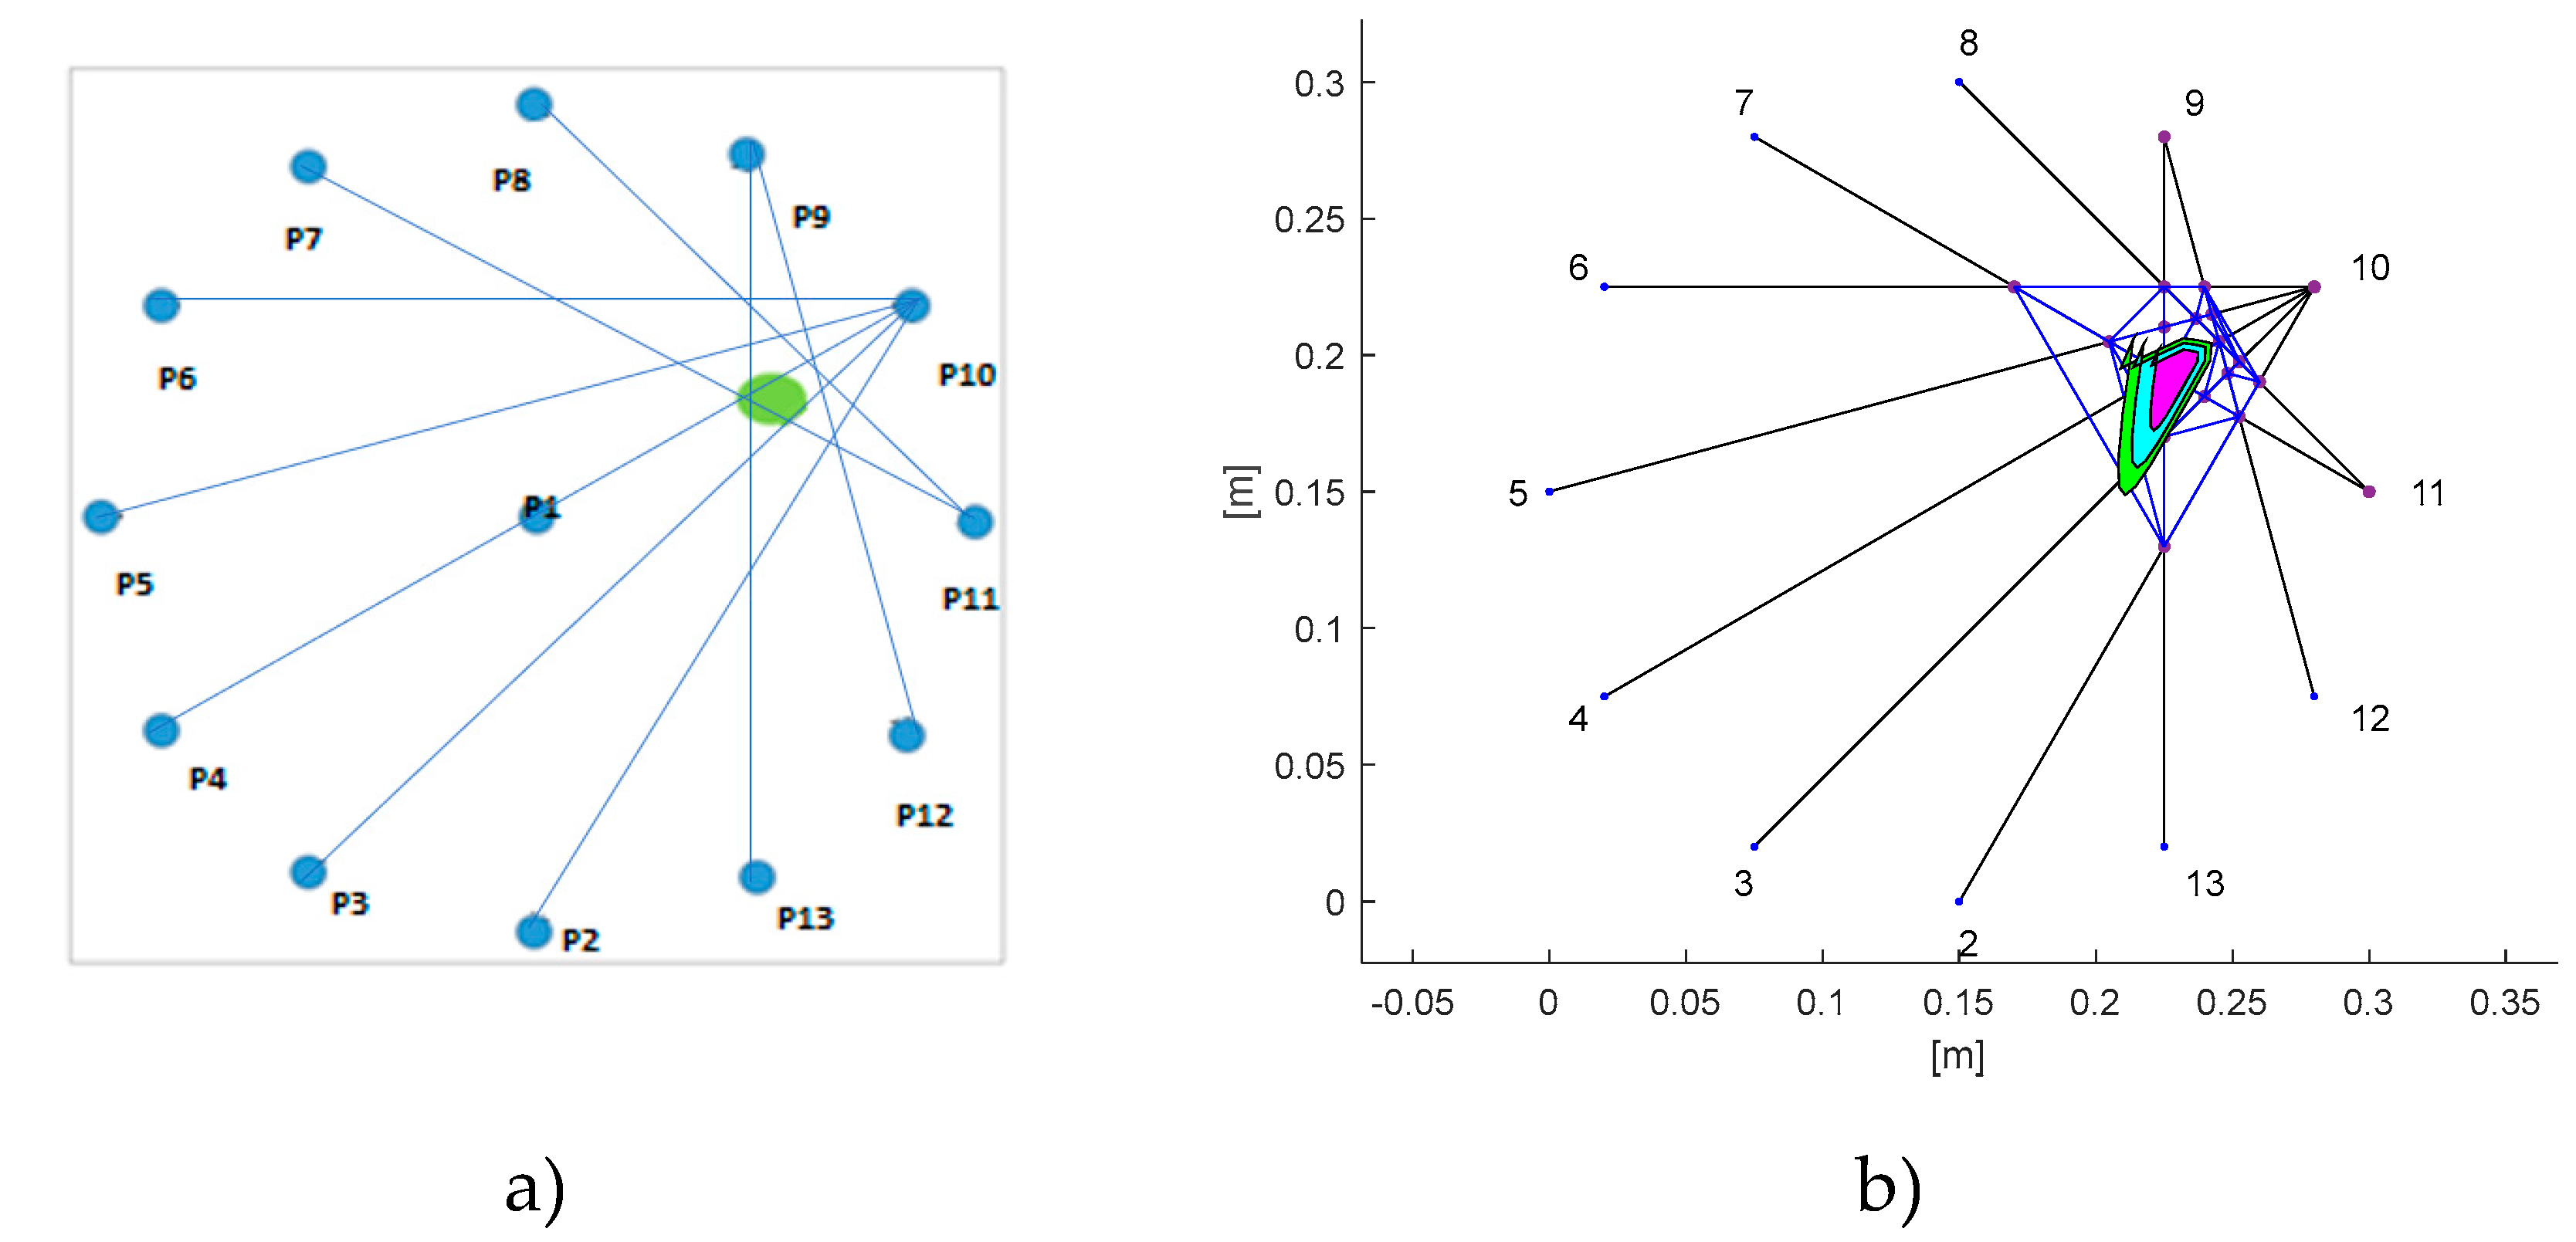
Figure 18.
a) Arrow basic GUI_GW representation of damage path; b) approximate shape of the damaged area.
Figure 18.
a) Arrow basic GUI_GW representation of damage path; b) approximate shape of the damaged area.
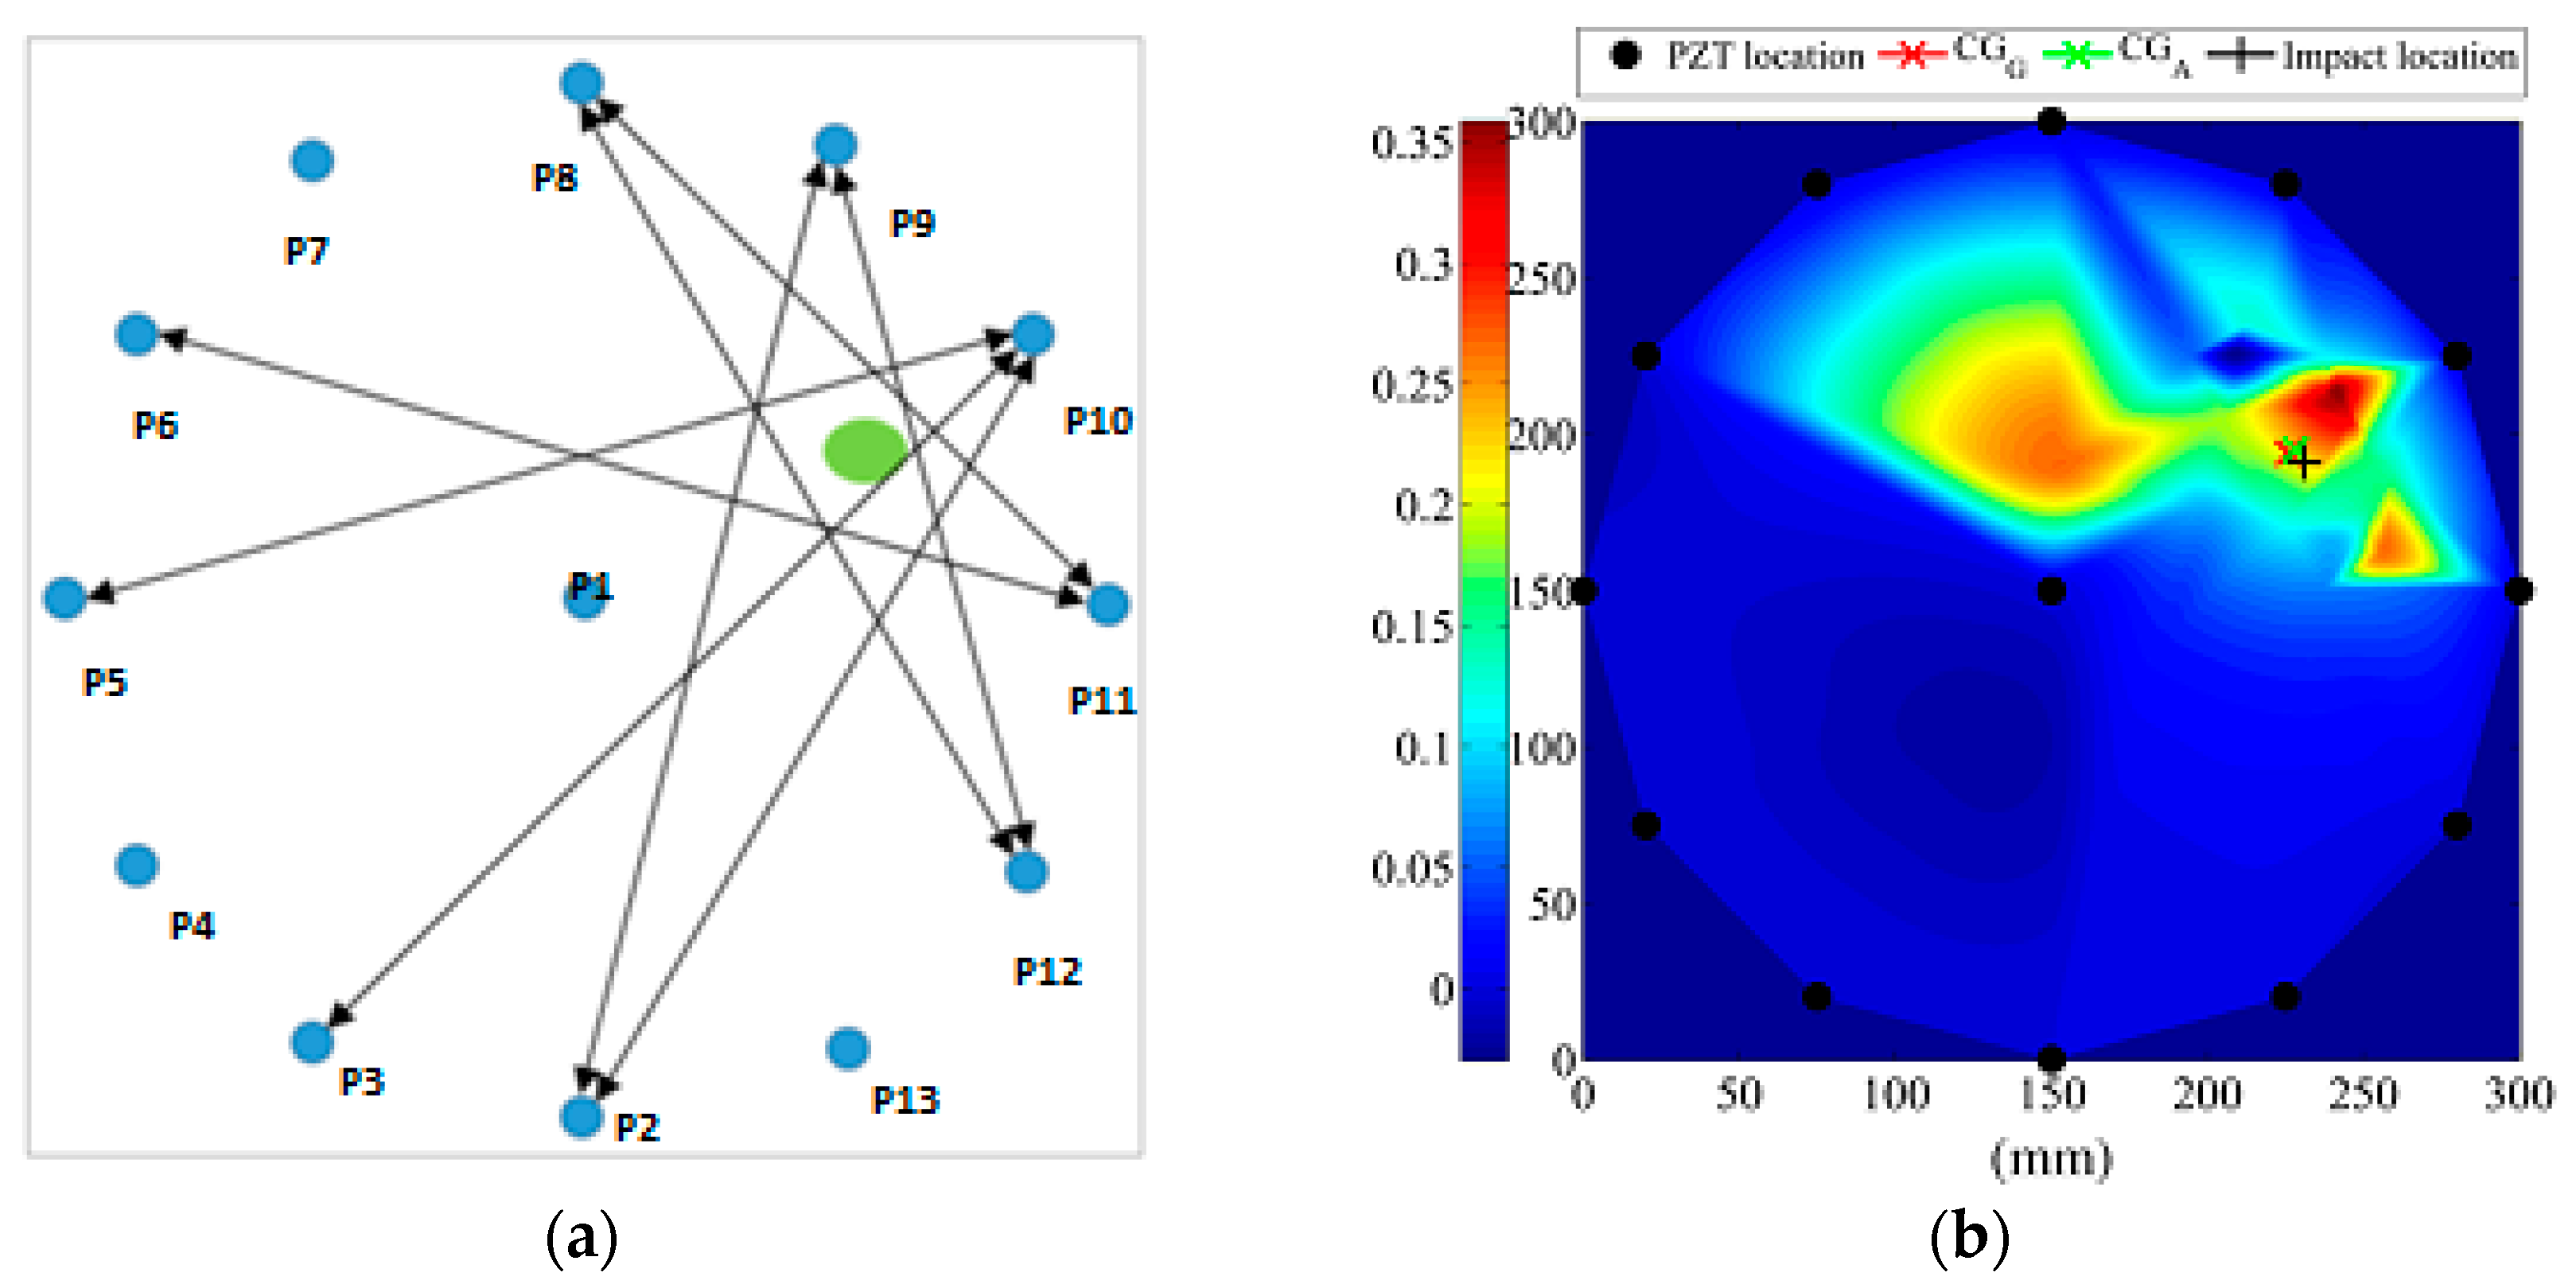
Figure 19.
Calibrated impact longitudinal C_scan: a) PAUT scan direction; b) 6 mm thick bay 85 J impact scan.
Figure 19.
Calibrated impact longitudinal C_scan: a) PAUT scan direction; b) 6 mm thick bay 85 J impact scan.
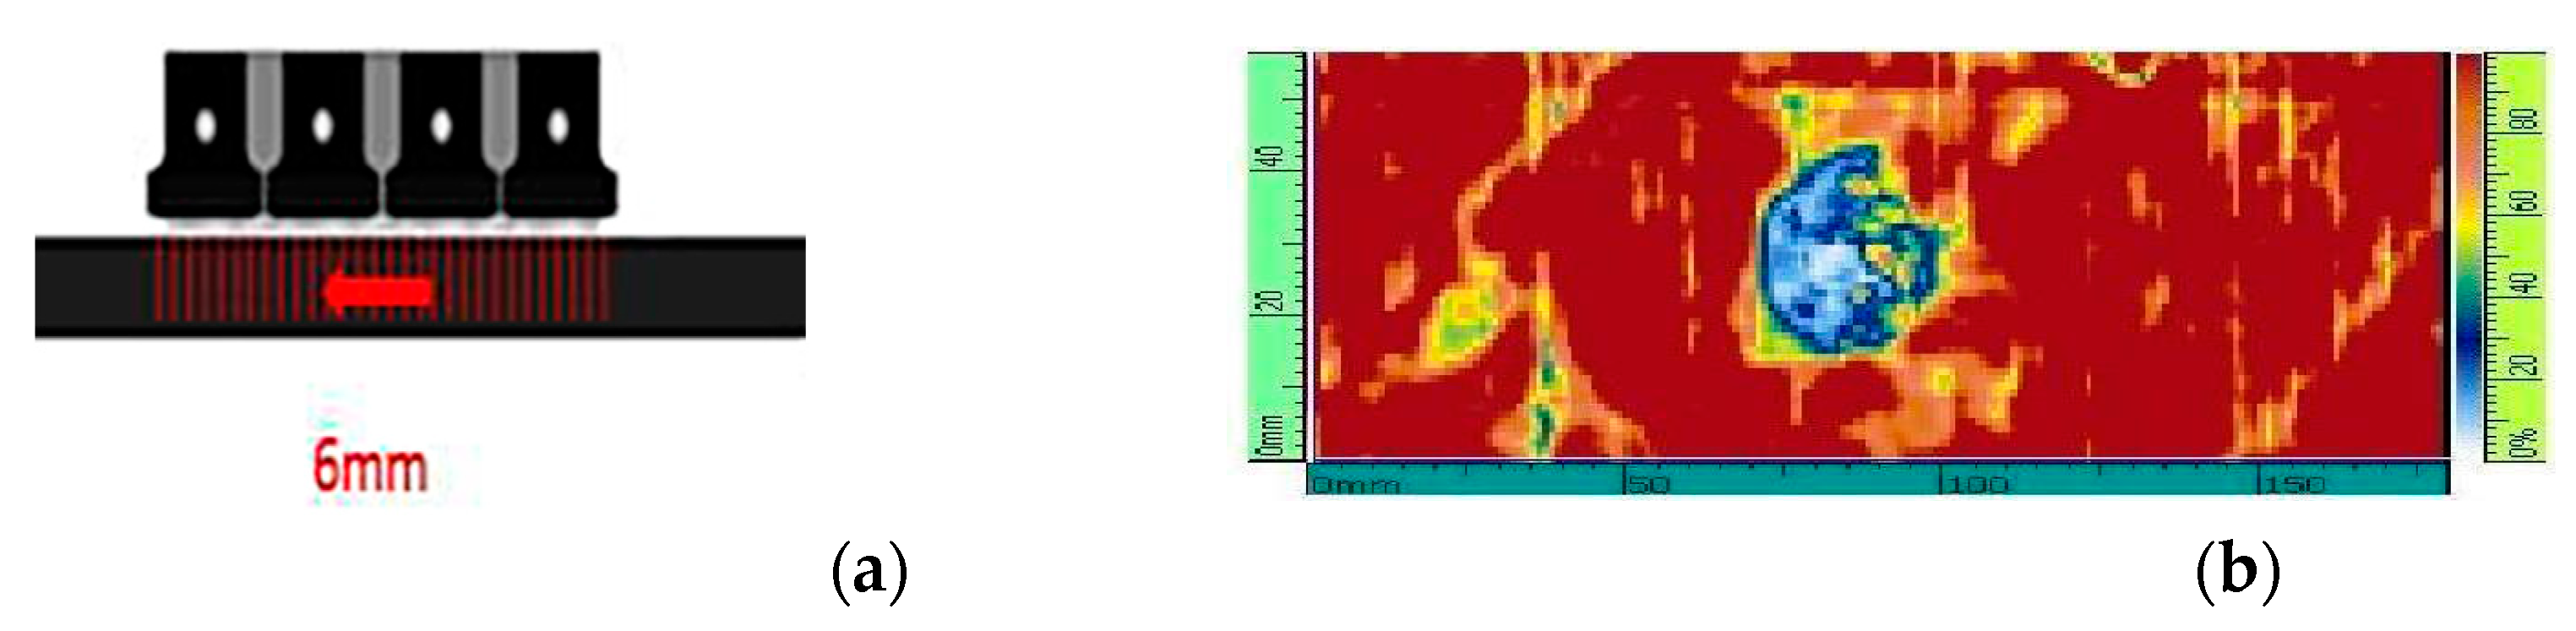

Table 1.
Initial characteristics of the materials.
| Material | Density | E1 | E2 | G12 = G23 = G31 |
|---|---|---|---|---|
| 5harness | 1.77 g cm3 | 65 000MPa | 65 000MPa | 3600MPa |
| Biaxial | 1.79 g cm3 | 81 000MPa | 81 000MPa | 4100MPa |
| Uniaxial | 1.79 g cm3 | 152 000MPa | 8800MPa | 4100MPa |
Table 2.
Characteristics of the pristine and damaged materials considered in the final model.
| Material | Density | E1 | E2 | G12 = G23 = G31 |
|---|---|---|---|---|
| 5harness | 1.77 g cm3 | 105 000MPa | 65 000MPa | 3600MPa |
| Biaxial | 1.79 g cm3 | 81 000MPa | 81 000MPa | 4100MPa |
| Uniaxial | 1.79 g cm3 | 132 000MPa | 8800MPa | 4100MPa |
| 5harness damaged | 1.77 g cm3 | 63 000MPa | 39 000MPa | 2160MPa |
| Biaxial damaged | 1.79 g cm3 | 48 600MPa | 48 600MPa | 2460MPa |
| Uniaxial damaged | 1.79 g cm3 | 79 200MPa | 5280MPa | 2460MPa |
Table 3.
Damage barycenter position.
| Damagebarycentre | XG; YG [mm] | ErrorXG; YG % |
|---|---|---|
| Real position | 231; 190 | ------- |
| DI_GW | 227; 195 | -1,7; 2,6 |
| DI_CC | 219.6; 190.2 | -4.9; 0.1 |
Disclaimer/Publisher’s Note: The statements, opinions and data contained in all publications are solely those of the individual author(s) and contributor(s) and not of MDPI and/or the editor(s). MDPI and/or the editor(s) disclaim responsibility for any injury to people or property resulting from any ideas, methods, instructions or products referred to in the content. |
© 2023 by the authors. Licensee MDPI, Basel, Switzerland. This article is an open access article distributed under the terms and conditions of the Creative Commons Attribution (CC BY) license (http://creativecommons.org/licenses/by/4.0/).
Copyright: This open access article is published under a Creative Commons CC BY 4.0 license, which permit the free download, distribution, and reuse, provided that the author and preprint are cited in any reuse.


