
Submitted:
30 May 2023
Posted:
30 May 2023
You are already at the latest version
Abstract
With the advancement of the economy and society, policymakers acknowledge the significance of improving rural households' well-being as a crucial factor in promoting sustainable economic and social development. Based on the matching data of China Household Finance Survey and Digital Rural County Index, this study empirically examines the effect and mechanisms of digital village construction on subjective well-being of rural households. The results revealed that digital village construction has a significant improvement in their subjective well-being. The impact of digital village construction is particularly significant in rural areas located in the western regions of China, as well as among households possessing higher levels of human capital. The process through which digital village construction enhances the subjective well-being of rural households involves the augmentation of household income, the promotion of non-farm employment opportunities, and the enhancement of rural governance. This study provides robust micro-empirical evidence highlighting the positive welfare effects of digital rural construction. This study provides insights into the digital village construction within the happiness economy framework, offering a new perspective. The imperative to strengthen rural digital infrastructure and improve farmers' proficiency in modern information skills is a strategic policy aimed at enhancing well-being of rural households.
Keywords:
digital village
; rural households
; subjective well-being
; digital transformation
; rural digital economy
1. Introduction
In recent years, China's economy has undergone a significant transformation, shifting from a phase of rapid growth to one emphasizing high-quality development. However, the corresponding improvement in the well-being of its residents has not necessarily kept pace with this progress. The "World Happiness Report 2022", published by the United Nations, reveals that over the past decade, residents of mainland China have experienced a significant 40-place increase in their happiness rankings. Despite this progress, China's ranking of 72 out of 146 countries and regions included in the survey underscores the fact that residents' overall subjective well-being remains below what one might expect from the country's level of economic development. Moreover, unbalanced and insufficient development remains a salient issue in China. This is reflected in the weak agricultural foundation, inadequate rural infrastructure, and substantial disparities in regional development and income distribution between urban and rural areas. Rural households lag behind their urban counterparts in terms of livelihood and overall quality of life, adversely affecting their subjective well-being. The ultimate goal of sustainable development is to improve people's livelihood and well-being, with a paramount focus on continuously enhancing their sense of gain, happiness, and security. This is an inevitable requirement that centers on the people and their needs. Against this backdrop, policymakers have come to acknowledge the critical significance of sustainable and balanced development and are striving to improve the well-being of rural households, which represents an integral facet of the ongoing rural revitalization strategy.
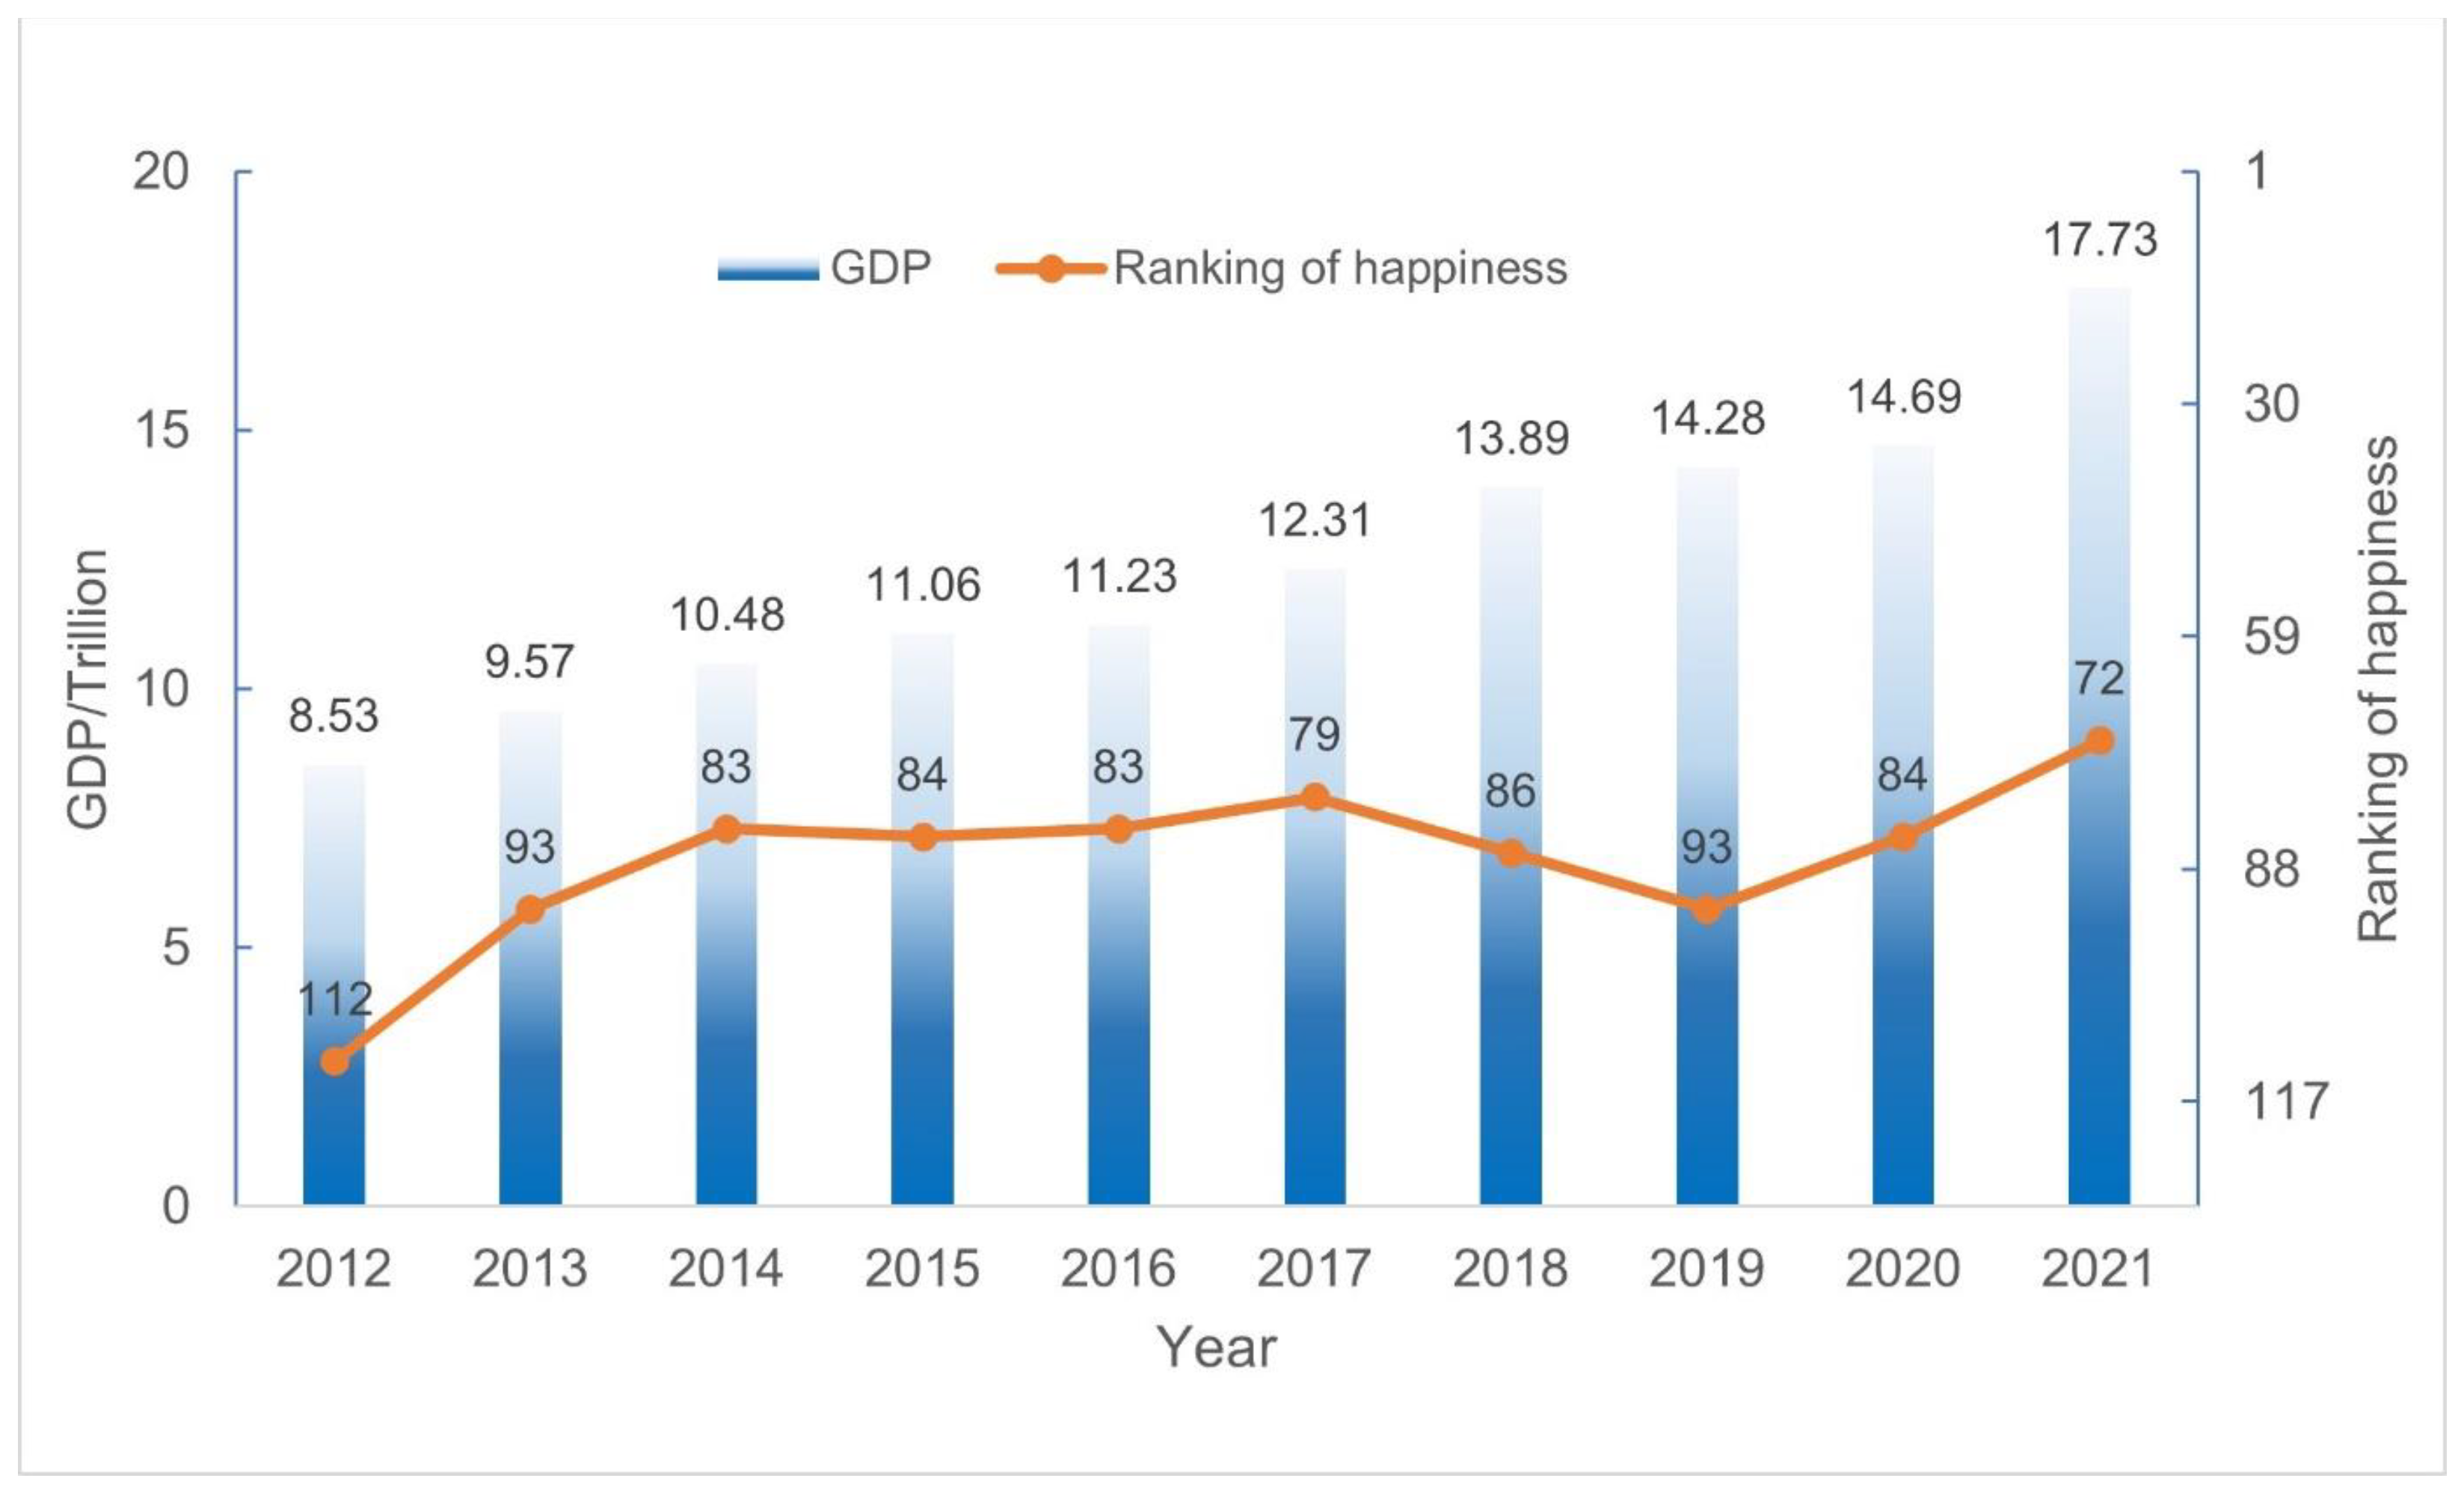
Figure 1.
China's GDP and ranking of happiness from 2012 to 2021. Source: China’s GDP are taken from the World Bank (https://data.worldbank.org/), and China’s rankings of happiness are from World Happiness Report(https://worldhappiness.report/)
Figure 1.
China's GDP and ranking of happiness from 2012 to 2021. Source: China’s GDP are taken from the World Bank (https://data.worldbank.org/), and China’s rankings of happiness are from World Happiness Report(https://worldhappiness.report/)
Efforts are underway to address this purpose and foster inclusive growth. China has been actively pursuing a digital village construction that aims to improve the accessibility and connectivity of digital infrastructure in rural areas. The "Digital Village Development Strategy Outline" released by China clearly defines the concept of a digital village as "the application of network, informatization, and digitization in the economic and social development of agriculture and rural areas, as well as the improvement of farmers' modern information skills. This is an important aspect of endogenous agricultural and rural modernization development and transformation process". In 2015, approximately 50,000 administrative villages in China lacked access to broadband, while 150,000 administrative villages had broadband access capacity below 4 Mbps. This created a noticeable "digital divide" between urban and rural areas. However, significant progress has been made through the construction of digital village, as of the end of 2021, every administrative village in China has successfully achieved broadband connectivity. The construction of digital village serves to augment the accessibility of digital technologies and services specifically tailored to the domains of "agriculture, rural areas, and farmers", thereby effectively bridging the digital divide between urban and rural regions. In the era of the digital economy, the digital village construction is fundamentally transforming traditional behavior patterns, working arrangements, and social relationships among rural households, leading to far-reaching impacts on their income sources, employment opportunities, and participation in rural governance. However, does the digital village construction truly make rural households happier and more satisfied with their daily work and life? And if so, what are the specific mechanisms involved?
Following the proposal of Easterlin's paradox [1], the determinants of individual subjective well-being have been at the core of happiness economics research. A significant portion of the literature focused on economic factors, such as income, consumption, and employment. Knight and Gunatilaka analyzed household-level micro-data and discovered that wealthy urban households had lower subjective well-being compared to rural households [2]. Sacks et al. argued that over time, income growth will lead to an increase in happiness, while the per capita level of happiness in affluent countries is relatively higher, suggesting that absolute income plays a decisive role in happiness [3]. Gandelman and Porzecanski found that happiness increases when individual income rises relative to the past (adaptive expectations) or compared to others (social comparison) [4]. However, the income gap between countries tends to be stable, and as a result, happiness is also relatively stable, showing insensitivity to income growth [5,6,7]. Furthermore, other factors such as consumption, employment, and their interrelationships with income also have a significant impact on well-being, as highlighted in previous research [8,9,10]. Another stream of literature focuses on non-economic factors, such as individual and family characteristics, which include age, gender, time preference, education level, health status, marital status, and family upbringing [11,12,13,14,15]. Additionally, social and natural environmental factors such as public policy, welfare systems, religion, social relations, social capital, climate, and pollution also impact well-being [16,17,18,19,20,21]. Scholars studying China's rural situations have discovered that farmers reside in an "acquaintance society" and adapt to the unique "different order pattern" prevalent in rural areas, where social relations and status have a greater impact on their subjective well-being compared to material wealth satisfaction [22]. Farmers with a higher social class position tend to exhibit higher levels of subjective well-being [23]. Moreover, income inequality arising from differences in social capital exerts a negative influence on farmers' happiness.
With the increasing availability and advancement of information technology, the digital economy has flourished in rural areas of China, resulting in significant transformations in production and living environments. These developments have inevitably impacted the subjective well-being of rural households themselves. First, the construction of digital villages is seen as a significant step towards promoting rural digital economy. Its primary objective is to accelerate the construction of rural digital infrastructure and facilitate the digital transformation of agriculture and rural areas. Digital technology plays a crucial role in improving the quality of agricultural information services, facilitating the integration of digital economy and characteristic agriculture, and fostering new rural business forms. Furthermore, rural e-commerce has the potential to revolutionize the rural circulation service system, mitigate information asymmetry in the agricultural market, and boost the agricultural economic cycle [24]. Second, digital village construction can deepen rural services for the benefit of the people. The application of digital technology can facilitate the comprehensive coverage of rural social security, settle medical insurance for rural residents in different places, and enable online transfer and continuation of social security. "Internet plus" empowering rural public services can improve the quality of rural education and medical services, promote the connection between urban high-quality public resources and rural areas, and promote the integrated development of urban and rural informatization [25]. Digital village construction can help the coordinated sustainable development of rural economy and society, and promote the equalization of urban and rural public services. It serves as the intersection between China's rural revitalization strategy and the development of the digital economy, presenting a historic opportunity to enhance the well-being and improve the quality of life for rural households. Previous research has given little attention to the relation between digital village construction and rural households' subjective well-being, and there is also a shortage of empirical analysis based on concrete evidence. In light of this, this paper aims to test empirically the impact of digital village construction on rural households' subjective well-being by using micro-survey data, and to investigate its mechanism as well as the heterogeneity of its effect. Our results are of interest to those involved in research about the well-being of low-income groups, the dynamics of the rural digital economy, and the happiness economics.
The construction of digital village represents a strategic direction for rural development and a critical component in the development of the digital economy. Compared with the existing research, we integrate the emerging field of digital village within the framework of happiness economics, and the main contributions of this paper are as follows. First, it provides a new perspective by investigating the impact of digital village construction on rural households' subjective well-being, which enriches the existing literature on the happiness economics. Second, by using survey data reflecting the characteristics of households and the assessment of the overall status of county-level digital village construction, it addresses a gap in the literature and offers micro-level evidence on the welfare effects of digital village construction. Third, this paper holds significant policy implications concerning the digital transformation of rural areas and the improvement of subjective well-being among rural households, and it provides theoretical and empirical support for the sustainable development of rural areas within the digital economy.
There are five sections in this paper. The methods and database used in this paper are described in Section 2. The main results are detailed in Section 3, along with heterogeneity analysis. The results of mechanism test are discussed in Section 4. As a final section, the conclusion is provided, along with policy implications.
2. Methodology
2.1. Analysis Framework and Hypothesis
In theory, Amartya Sen's capabilities approach offers a new perspective for examining the well-being of farmers. Sen argues that development ought to be understood as an effort to enhance the real freedoms that individuals possess, rather than simply focusing on metrics like GDP or income-per-capita. Sen outlines five specific types of freedoms: political freedoms, economic facilities, social opportunities, transparency guarantees, and protective security [26]. Based on a review of relevant literature [27,28], this paper uses Sen's theory of capabilities approach as a theoretical framework to explore the essence of well-being and aims to analyze it from the impact of digital village construction. Consequently, this paper defines the well-being of rural households as a condition wherein households, attain freedom, achieve accomplishments, and possess the capability to engage in diverse activities encompassing economic circumstances, working conditions, and political rights.
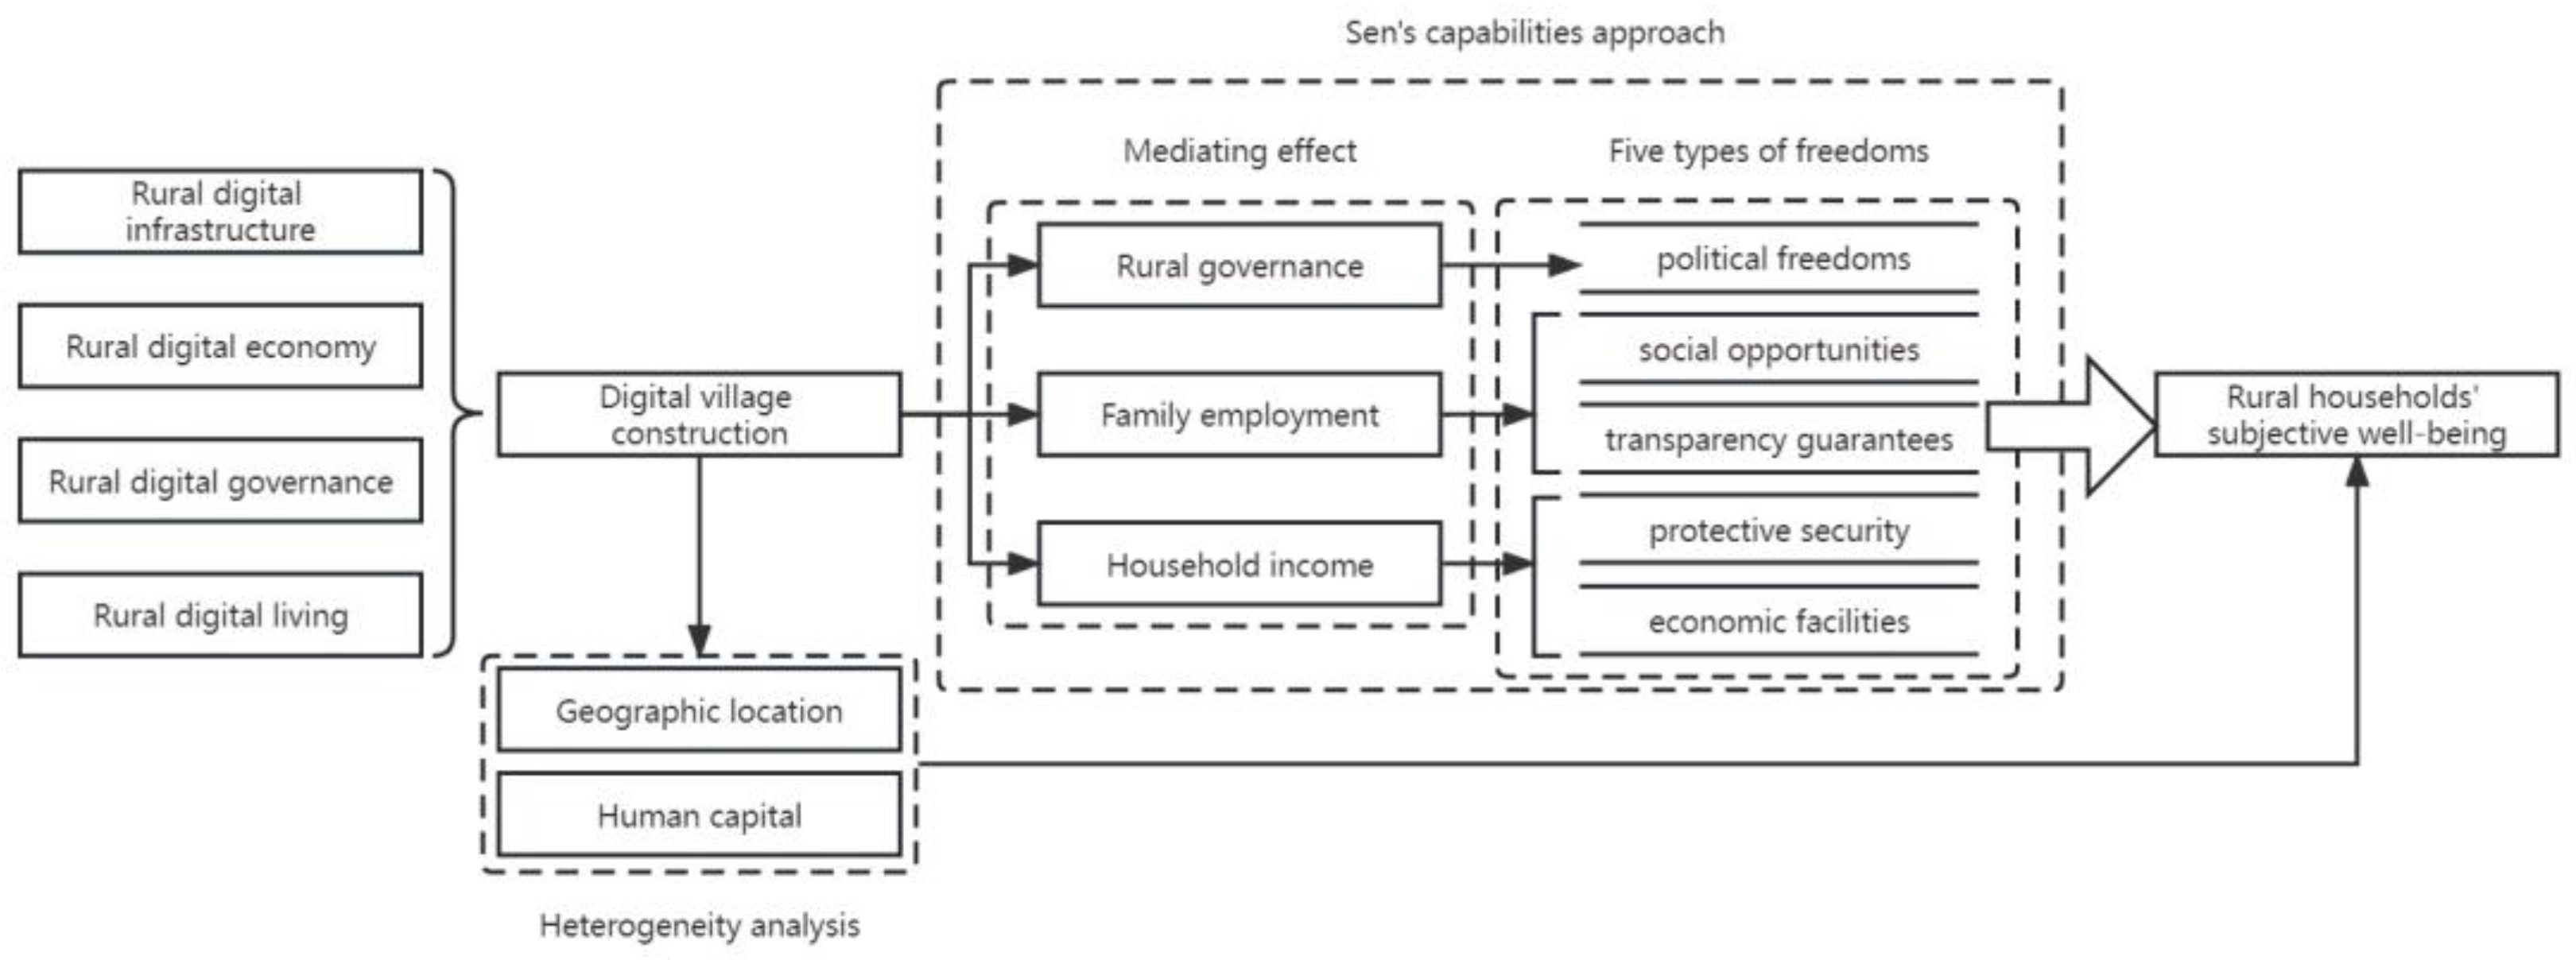
Figure 2.
Analysis framework.
2.1.1. Household Income
Digital village construction can improve the digital infrastructure of rural areas and promote the widespread use of information technologies, such as the Internet and big data, in agriculture and rural areas. This can help rural households obtain information and knowledge, expand their income sources, and increase their income, thereby improving their production and quality of life [29]. Additionally, digital empowerment in agriculture production can improve data collection and analysis, promote agricultural technology advancements, and increase rural households' income. The digital development of agriculture and rural areas can also improve the efficiency of information generation, dissemination, and utilization [30]. By expanding the spillover effect of knowledge, it can promote the comprehensive and deep integration of agriculture with other industries. This can lead to the development of multiple rural values, new rural business forms, and an increase in farmers' income. Furthermore, digital finance can ease the credit constraints of rural households, allowing them to expand investments in agricultural production and significantly increase their income [31]. E-commerce can break down the information barriers of the agricultural product market, integrate and optimize the supply chain of agricultural products, reduce the cost of production factors and transaction costs of products, and promote the production and consumption of agricultural products, thereby increasing farmers' income.
2.1.2. Family Employment
Digital village construction can enhance rural e-commerce networks, logistics, and distribution, thereby promoting the rapid development of rural e-commerce. According to research conducted by Ali Research Institute, the number of "Taobao villages" in China has increased from 2,118 in 2017 to 7,780 in 2022, with a distribution range extending from the initial coastal areas of Jiangsu and Zhejiang to 28 provinces across the country . Rural e-commerce can foster entrepreneurship among farmers and provide a large number of job opportunities, effectively absorbing surplus rural labor and exhibiting a robust employment-driven effect [32]. The emergence of new business forms associated with the development of the rural digital economy has transformed traditional production divisions and employment relationships in rural areas, leading to the creation of numerous non-farm employment opportunities. Simultaneously, digital economy growth has lowered farmers' employment search costs, eased financing constraints on entrepreneurship, and stimulated farmers' enthusiasm for employment participation [33]. Therefore, digital village construction is conducive to promoting non-farm employment for rural households, enabling them to earn higher wages, and ultimately enhancing their subjective well-being.
2.1.3. Rural Governance
Rural governance serves as the foundation of social governance and plays a crucial role in the revitalization of rural areas. Digital village construction can improve the efficiency of township governments in handling public affairs and enhance the quality of rural public services. With the aid of digital technology, rural government services and information can be provided online, enabling farmers to access social insurance, agriculture-related subsidies, and other services without having to leave their homes. Digital village construction not only enhances the digital level of rural governance but also promotes social equity. The application of digital technology safeguards farmers' right to vote and right to know, reduces the cost of public affairs decision-making and supervision, enhances the legality and transparency of rural governance, stimulates farmers' enthusiasm for participating in rural governance, and safeguards migrant workers' right to know and decision-making power concerning collective affairs [34]. Overall, digital village construction empowers rural governance with digital technology, facilitates and benefits the people, and ensures and promotes social equity while improving the subjective well-being of rural households.
Based on the preceding analysis, this paper proposes these hypotheses:
Hypothesis 1.
Digital village construction can enhance the subjective well-being of rural households.
Hypothesis 2.
Digital village construction can improve the subjective well-being of rural households by increasing farmers' income, promoting non-farm employment, and enhancing rural governance.
2.2. Model Specification
To examine the impact of digital village construction on the subjective well-being of rural households, this paper establishes the baseline model as follows:
In the equation (1), the dependent variable represents the subjective well-being of rural households; the core explanatory variable represents the level of digital village construction in the county where the rural household is located; is a set of control variables that influence the subjective well-being of rural household at the individual, family, and regional levels; the constant term is denoted by , while the coefficients to be estimated are and , the random error term is denoted by .
The parameter of interest in this paper is the estimated coefficient in equation (1), which represents the overall impact of the level of digital village construction on rural households' subjective well-being. To investigate its specific mechanisms, it is necessary to analyze the mediating effects. As identified in the preceding analysis, digital village construction primarily affects the subjective well-being of rural households through mechanisms such as increasing farmers' income, promoting non-farm employment, and enhancing rural governance. Therefore, this paper employs a mediation analysis to empirically examine these mechanisms. The mediation model is specified as follows:
In the equation (2), (3), the variable represents the intermediary variable, which includes household per capita income, family employment choice, and rural governance level. The coefficients 、、 are to be estimated, with and representing the mediation effects that this paper focuses on.
2.3. Data Sources
This paper uses data mainly from the "Index of Digital Rural County" database of Peking University New Rural Development Research Institute and Ali Research Institute, as well as the China Household Finance Survey (CHFS) database released by China Southwestern University of Finance and Economics. The CHFS data is collected every two years and covers information on family characteristics, economic conditions, employment, and living conditions of 34,643 households in 345 districts and counties across 29 provinces (autonomous regions and municipalities) in China. The samples of the Index of Digital Rural County (2018) cover 1,880 county-level administrative units (excluding municipal districts) in China and include four first-level indicators, such as the overall digital rural county index, rural digital infrastructure index, rural economy digitalization index, and rural governance digitalization index, as well as 12 second-level indicators and 29 specific indicators. To ensure data accuracy and completeness, the CHFS (2019) database was selected as the research object, and matched with the digital village construction data from the Index of Digital Rural County (2018) and the sample region characteristic data mainly from "China County Statistical Yearbook", "China Urban Statistical Yearbook", "China Regional Economic Statistical Yearbook", etc. The data were matched according to the sample's region and year, and a total of 8,205 sample data were obtained.
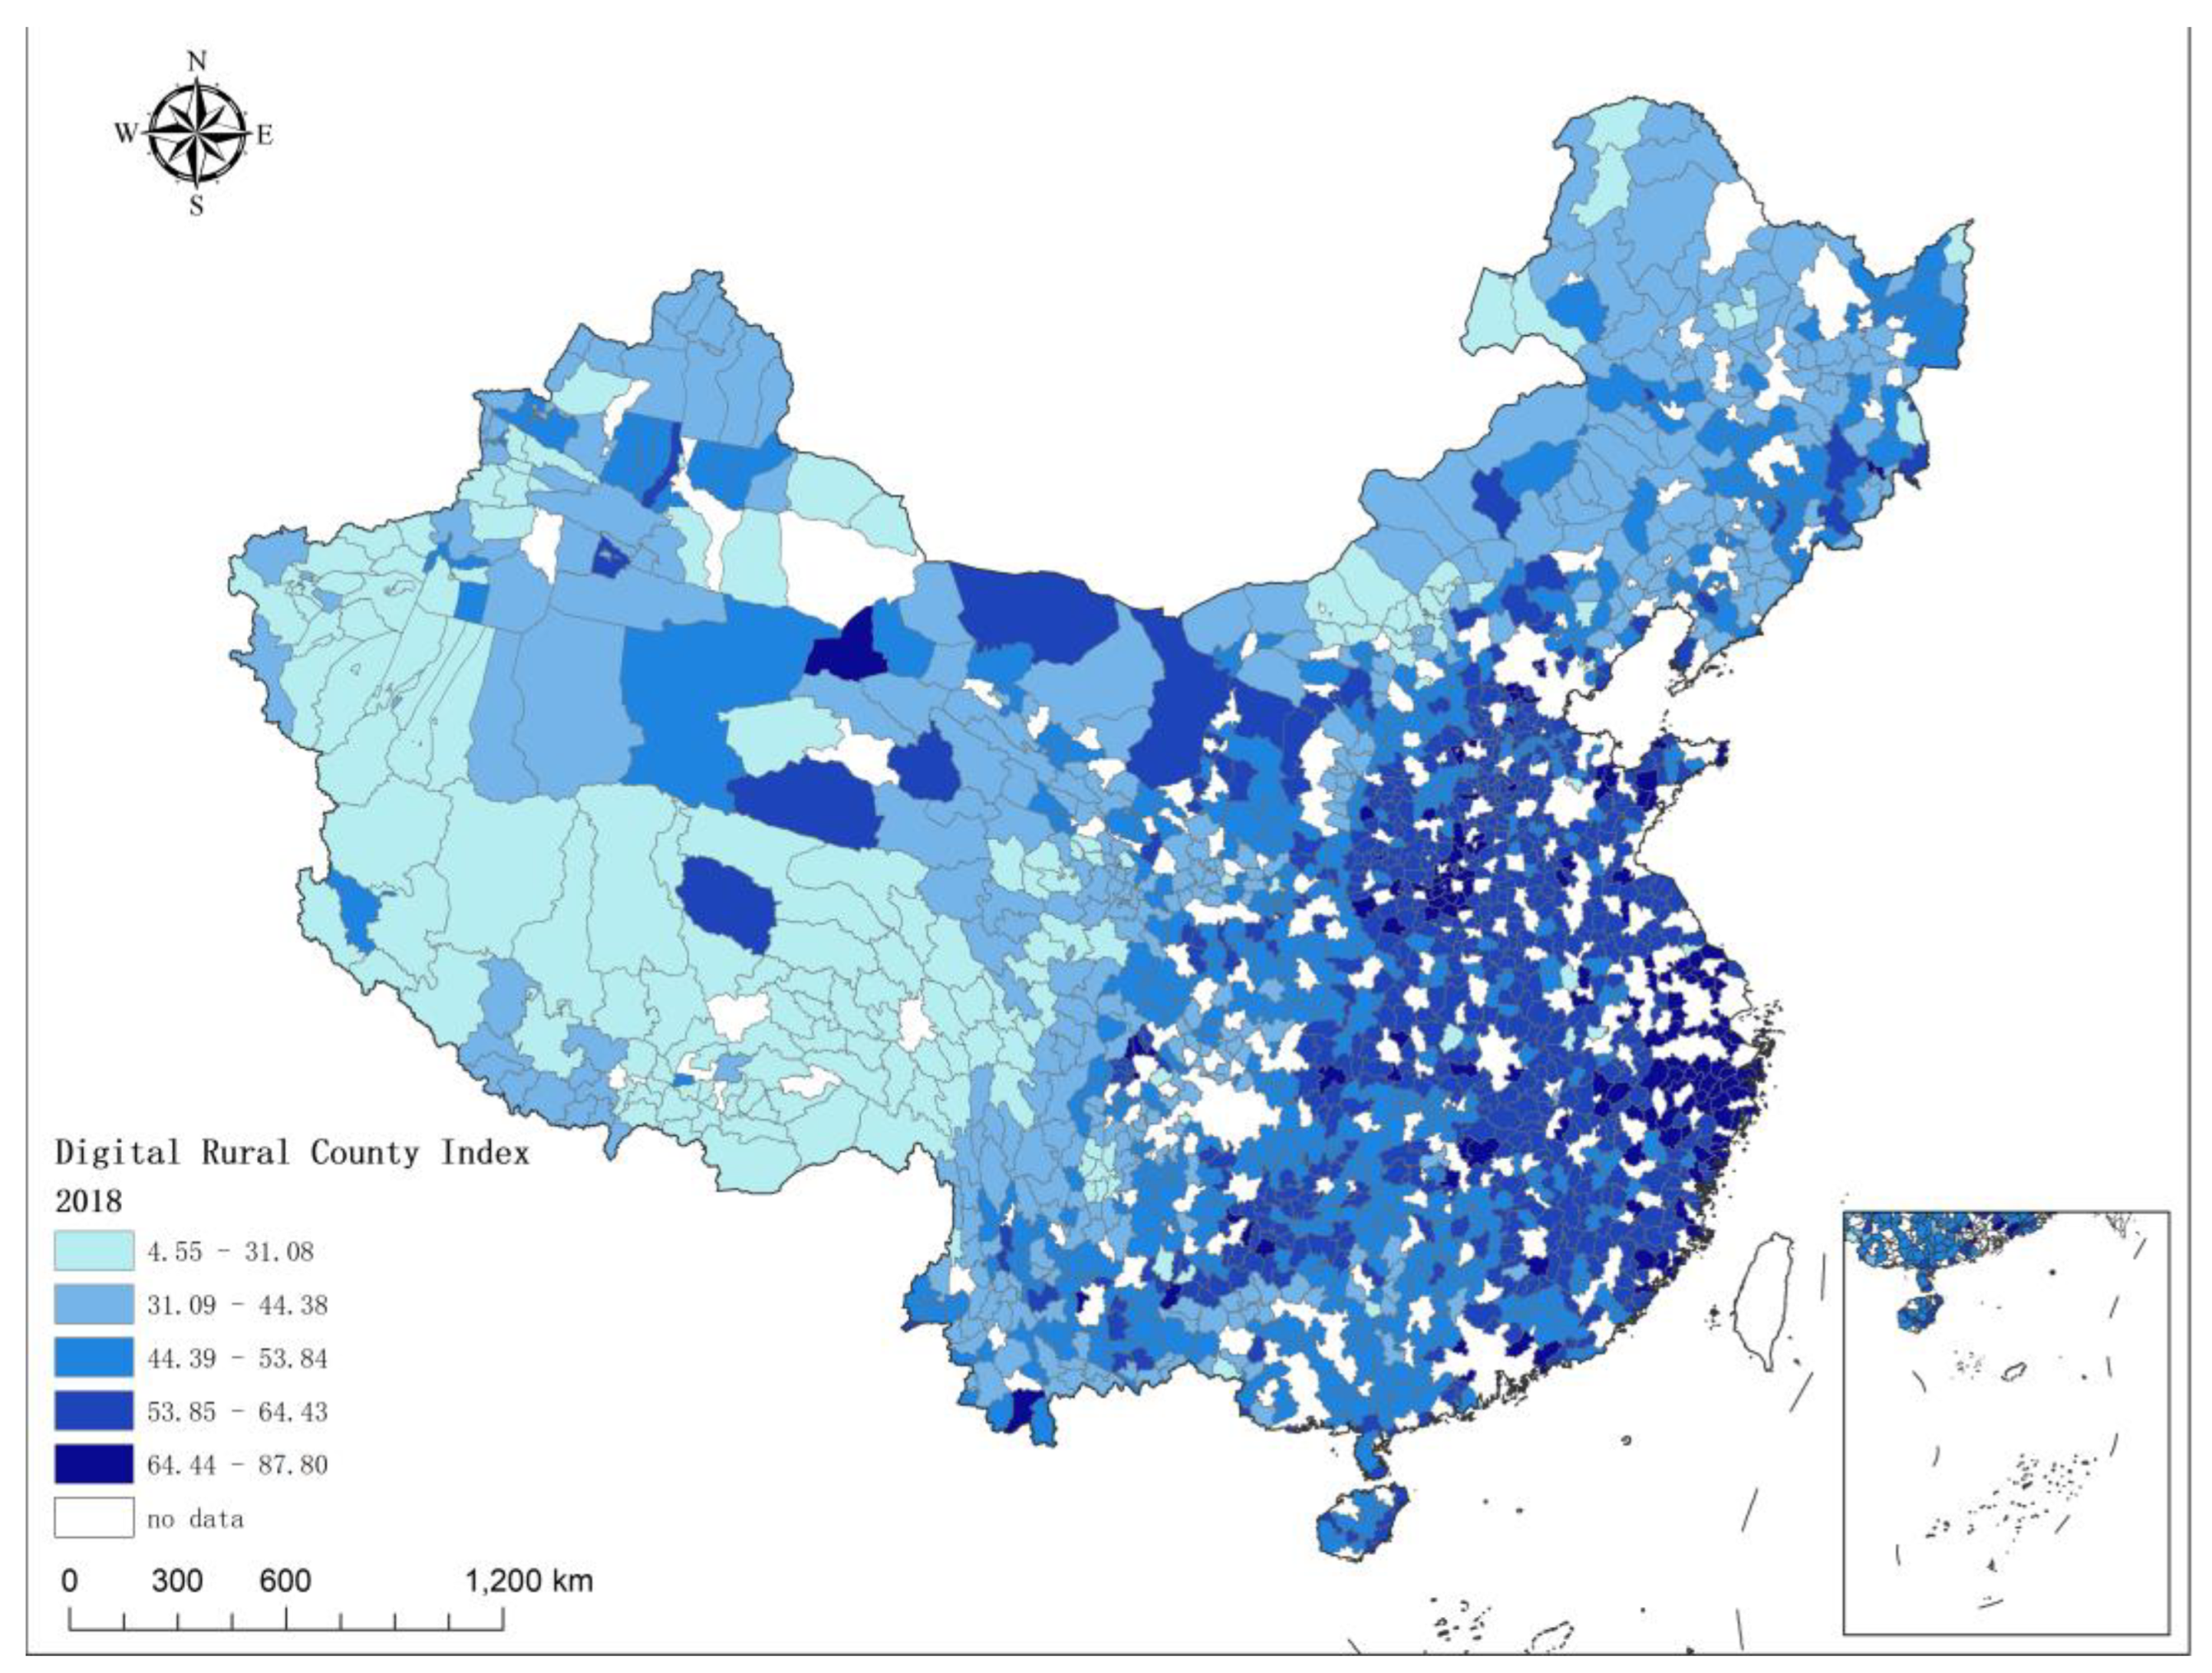
Figure 3.
Index of Digital Rural County (2018). Source: The files used to create the map are licensed under GS (2019) 1822 available at: http://www.gov.cn. The data on the Index of Digital Rural County are taken from Peking University New Rural Development Research Institute and Ali Research Institute (https://www.saas.pku.edu.cn/docs/2020-09/20200929171934282586.pdf).
Figure 3.
Index of Digital Rural County (2018). Source: The files used to create the map are licensed under GS (2019) 1822 available at: http://www.gov.cn. The data on the Index of Digital Rural County are taken from Peking University New Rural Development Research Institute and Ali Research Institute (https://www.saas.pku.edu.cn/docs/2020-09/20200929171934282586.pdf).
2.4. Variables
2.4.1. Rural Households’ Subjective Well-being
The CHFS (2019) questionnaire includes a question "In general, do you feel happy now?" with five response options: "very happy", "happy", "average", "unhappy", and "very unhappy". In this paper, the responses are assigned values from 1 to 5, with a higher value indicating a greater level of overall family happiness. However, this survey method may be subject to measurement errors due to the respondents' subjective mood swings, leading to potentially unreliable evaluations of subjective well-being. To further examine the impact of digital village construction on rural households’ subjective well-being, this paper also includes a binary variable for family happiness. Responses of "very happy", "happy", and "average" are defined as "happy family" and assigned a value of 1, while responses of "unhappy" and "very unhappy" are defined as "unhappy family" and assigned a value of 0.
2.4.2. Digital Village Construction
This paper employs the Index of Digital Rural County, which is a proxy variable released by Peking University New Rural Development Research Institute and Ali Research Institute, to examine the impact of digital village construction level on rural households’ subjective well-being. The index is based on various sources of information, such as macro statistical data, Alibaba business platform data, and summary data from related websites, to provide a comprehensive assessment of the overall status of county-level digital village construction.
2.4.3. Control Variables
This paper controls for various factors that may affect rural households’ subjective well-being at the individual, family, and regional levels. At the individual level, control variables include the age, gender, marital status, education level, health status, insurance participation, and political affiliation of the household head. At the family level, control variables include family size, family support status, debt level, housing situation, and social connections. Control variables at the regional level include regional economic indicators, environmental pollution conditions, and medical resource levels. To mitigate the impact of outliers on the research findings, this paper trims the tails of continuous variables reflecting regional characteristics at the 1% level. The definitions and descriptive statistics of variables are presented in Table 1.
3. Results
3.1. Analysis of the Baseline Regression
As rural households’ subjective well-being is an ordered discrete variable, an ordered probit model is appropriate for regression analysis. Table 2 presents the baseline model regression results regarding the impact of digital village construction on the subjective well-being of rural households. The first three columns present the regression results for the full, urban, and rural samples, respectively. The results in column (1) indicate that digital village construction has a positive impact on family happiness. The findings in column (3) suggest that an increase of 100 units in the digital rural index can lead to a 0.64 increase in the happiness of rural households, holding other factors constant. However, the results in column (2) show that the coefficient of core explanatory variable is not significant, indicating that digital village construction has failed to enhance the happiness of urban families. A comparison of the results in column (2) and column (3) reveals that the digital rural index is effective in capturing the current impact of digital village construction on rural households, and that rural households are more likely to benefit from digital village construction in terms of subjective well-being improvement.
3.2. Endogeneity Discussion
To minimize the possibility of omitting important variables, this paper introduces control variables at the individual, family, and regional levels in the baseline model. However, there may still be endogeneity problems in the estimated results. First, there could be measurement errors in the Index of Digital Rural County, and the micro-survey data may not capture all the characteristics of households and household heads, leading to a correlation between indicators reflecting the level of digital village construction and unobservable factors that affect rural households’ subjective well-being, thereby affecting the estimation results of the baseline model. Second, the effect of digital village construction may be influenced by the level of infrastructure construction and human capital investment. Families with higher subjective well-being usually have stronger economic strength, live in areas with a higher level of digital economy development, and possess more human capital, resulting in reverse causality. Therefore, this paper attempts to address potential endogeneity problems using the instrumental variable method. This paper selects "the Internet penetration rate in 2008" and "the average value of third-party payment accounts held by other households in the village" as instrumental variables for the level of digital village construction. The popularity of the Internet has a direct impact on the effect of digital village construction, which is consistent with the correlation of instrumental variables. Meanwhile, the Internet penetration rate in 2008 reflects past Internet adoption, which has no direct impact on rural households’ subjective well-being during the sample period, thereby satisfying the exogeneity of instrumental variables. The average holdings of third-party payment accounts can reflect the development level of the digital economy in the village. The more developed the digital economy, the weaker the effect of digital village construction on improving subjective well-being may be. However, the mean value of holding a third-party payment account among other households has nothing to do with the subjective well-being of a single household at the micro level, thus meeting the two conditions for an effective instrumental variable. The discussion of endogeneity reveals that the weak instrumental variable test indicates a Cragg-Donald Wald F statistic of 915.412, significantly exceeding the critical value of the weak instrumental variable test at the 5% bias level. Moreover, the F statistic of the first stage is 13.37, surpassing the critical value of the empirical rule of 10, indicating that instrumental variables have a strong explanatory power on endogenous variables.
In this paper, instrumental variable regression is performed using two-stage least squares (2SLS) and IV probit models. When using IV probit model, family happiness has been transformed into a binary variable, despite the endogenous variables not being binary. The regression results of both models in the first stage are similar. Columns (1) and (2) in Table 3 demonstrate the estimated results of the 2SLS model, while columns (3) and (4) show the estimated results of the IV probit model. The first-stage regression results in columns (1) and (3) are consistent with expectations, indicating that the marginal impact of digital village construction on rural households' marginal utility is greater in areas with higher Internet penetration rates and relatively low levels of digital economy development. Columns (2) and (4) present the estimated results using instrumental variable regression. After controlling for relevant characteristic variables, the coefficients of the core explanatory variables remain significantly positive, consistent with the baseline regression results. This suggests that the potential endogeneity issue has been taken into account, and the estimated results of the baseline regression remain robust.
3.3. Robustness Checks
To ensure the robustness of the baseline model regression results, this paper conducted the following three tests: replacing the regression model, replacing the dependent variables, and changing the sample size. The specific results of the robustness tests are reported in Table 4.
First, a regression analysis was conducted using the ordinary least squares (OLS) model. However, the estimated results and the significance of the OLS model and the ordered probit model differed slightly. For ease of interpretation, the OLS model is used for regression estimation [35]. To account for potential impact of unobserved variables such as social development and regional policy differences on rural households’ subjective well-being, this paper employs cluster robust standard errors at the county level for OLS regression analysis. The results in column (1) of Table 4 indicate that the coefficient of the core explanatory variable is significantly positive at the 1% level, which is consistent with the regression result of the ordered probit model, and the original conclusion of baseline model regression remains unchanged.
Second, the sorted discrete variable for baseline model regression is replaced by the binary variable of family happiness. As previously mentioned, this paper divides the 5 options in CHFS into "family happiness" and "family unhappiness", and assigns them values of 1 and 0, respectively. Column (2) in Table 4 presents the regression results using the probit model. The coefficient of the core explanatory variable remains significantly positive at the 1% level, consistent with the regression results of baseline model, and the original conclusion remains unchanged.
Third, the baseline model regression analysis was conducted after excluding county-level city samples. Considering the significant differences in the development level among counties in China, county-level cities have a higher level of economic and social development compared to ordinary counties. To prevent sample bias from affecting the baseline model regression results, this paper retests the impact of digital village construction on rural households’ subjective well-being by excluding county-level city samples. The estimation results in column (3) of Table 4 demonstrate that the coefficient of the core explanatory variable is 1.799, which is greater than the baseline model regression and still significant at the 1% level, indicating that the estimation results of the baseline model regression are robust and emphasize the promoting effect of digital village construction on rural households’ subjective well-being.
3.4. Heterogeneity Analysis
3.4.1. Geographic location
This paper examines whether the effect of digital village construction on improving the subjective well-being of rural households differs significantly across regions. The development of urban and rural areas not only exhibits a dual structure but also shows imbalanced rural development among regions. To address this issue, the sample provinces are divided into eastern, central, and western groups based on their geographic location, and a regression analysis is performed using the baseline model for each group. The results of the heterogeneity test based on geographic location are presented in the first three columns of Table 5. Column (1) reports a significantly positive coefficient of the core explanatory variable at the 10% level, while the coefficient in column (2) is not significant. The estimated results of column (3) show that the coefficient of the digital village construction level is 2.595, which is much larger than the coefficient in the baseline model regression and is significant at the 1% level, indicating that digital village construction can better improve the subjective well-being of rural households in the western region. A possible explanation for this result is that the development level of the digital economy in the eastern region is relatively high, and the impact of digital village construction on the rural economy and rural households' lives is relatively small. In contrast, compared with the eastern and central regions, the western region has a larger "digital gap," and digital village construction can improve the construction of rural digital infrastructure, greatly enhancing the level of rural digitalization in the western region and contributing positively to the improvement of the subjective well-being of rural households.
3.4.2. Human capital
In existing literature, human capital is identified as a crucial factor influencing both households’ subjective well-being and the "application gap" of digital technology between urban and rural areas. To investigate the impact of human capital, we divide the rural household samples into two groups based on the education level of the household heads: high human capital (junior high school and above) and low human capital (primary school and below). We conduct separate regression analyses using the baseline model for each group. The results of the heterogeneity test based on human capital are reported in the last two columns of Table 5. Columns (4) and (5) show that the coefficients of the core explanatory variables are significantly positive at the 1% level for both groups. However, the coefficient value in column (4) is larger, indicating that rural households with higher human capital gain more subjective well-being from digital village construction. This suggests that the development of the rural digital economy requires high human capital investment, and highly skilled and educated individuals can contribute to the digital transformation of agriculture and rural areas. As a result, rural households with higher human capital can benefit more from digital village construction, which enhances their subjective well-being.
4. Discussion
Since the baseline model regression employs an ordered probit model, certain variables, such as household per capita income, urban-rural income gap, and non-farm employment ratio, are not discrete in nature. Therefore, this paper employs the OLS model to investigate the impact mechanism of digital village construction on rural households’ subjective well-being. The aforementioned robustness test suggests that the OLS model has issues with heteroscedasticity and predicted values that may be difficult to interpret. However, this does not affect the consistency and unbiasedness of the estimate. Building upon the previous theoretical framework, this paper conducts a stepwise regression analysis based on formulas (2) and (3), and examines the mechanisms through which household per capita income, family employment choice, and rural governance level affect rural households’ subjective well-being.
4.1. Household Income
This paper examines the relationship between digital village construction and rural households’ subjective well-being through the intermediary variable of per capita income of rural household. Specifically, the logarithm of per capita income of rural household is selected as an intermediary variable. First, we use equation (2) to test the impact of digital village construction on the per capita income of rural household. The estimated results in column (1) of Table 6 indicate that the coefficient of digital village construction is significantly positive at the 1% level, suggesting that digital village construction can increase the per capita income of rural household. Second, we introduce the variable of rural household per capita income into the regression analysis using equation (3). The estimated results in column (2) of Table 6 reveal that both digital village construction and rural household per capita income have a positive impact on households’ subjective well-being, and the coefficients are statistically significant at the 1% level. This indicates that digital village construction can improve rural household income levels and ultimately improve rural households’ subjective well-being.
As the digital economy develops, the income gap between urban and rural areas may widen further. However, digital village construction, which is based on rural areas, aims to bridge the "digital divide" between urban and rural areas and narrow the urban-rural gap. Based on existing literature on the relationship between income and well-being, this paper selects the ratio of per capita disposable income between urban and rural areas as an intermediary variable to investigate whether digital village construction can suppress the expansion of the urban-rural income gap and improve the subjective well-being of rural households. First, using formula (2), we test the impact of digital village construction on the income gap between urban and rural areas. The estimation results in column (3) of Table 6 show that the coefficient of digital village construction is significantly negative at the 1% level, indicating that digital village construction can narrow the income gap between urban and rural areas. Second, using formula (3), we introduce the variable of income gap between urban and rural areas for regression. The estimated results in column (4) of Table 6 show that digital village construction still has a significant positive impact on the subjective well-being of rural households, but the coefficient of the urban-rural income gap is significantly positive at the 10% level, indicating that the urban-rural income gap does not play an expected mediating role in the relationship between digital village construction and rural households’ subjective well-being. One possible explanation for this is that the urban-rural income gap is only one aspect of the urban-rural divide. Differences in the Household Registration system, social security, and medical resources between urban and rural areas also affect the subjective well-being of rural households, but the urban-rural income gap is not the key factor.
4.2. Family Employment
This paper employs the proportion of non-farm employment of rural households in the total number of households as an intermediary variable to examine whether digital village construction can enhance rural households’ subjective well-being by promoting non-farm employment. First, using formula (2), we examine the impact of digital village construction on rural households' non-farm employment. The results in column (1) of Table 7 demonstrate that the coefficient of digital village construction is significantly positive at the 1% level, indicating that digital village construction can help promote non-farm employment. Second, by introducing the variable of non-farm employment proportion of rural households for regression using formula (3), the estimated results in column (2) of Table 7 indicate that both digital village construction and non-farm employment of rural households have a significant positive impact on the subjective well-being of households, supporting that digital village construction can enhance rural households’ subjective well-being by promoting non-farm employment.
In recent years, the rapid development of rural e-commerce has attracted a large number of talents to return to their hometowns to start businesses. This paper investigates whether digital village construction can improve the subjective well-being by promoting rural household entrepreneurship, using whether rural households start entrepreneurship as an intermediary variable. First, the impact of digital village construction on rural household entrepreneurship is tested using formula (2). The estimated results in column (3) of Table 7 show that the coefficient of digital village construction is significantly positive at the 1% level, indicating that digital village construction helps rural households start their own businesses. Second, rural household entrepreneurship variables are introduced for regression using formula (3). The estimated results in column (4) of Table 7 show that digital village construction still has a significant positive impact on the subjective well-being of rural households. However, the coefficient of whether to start a business is significantly negative at the 10% level, suggesting that while digital village construction promotes rural household entrepreneurship, it reduces their subjective well-being. A possible explanation for this is that starting a business requires a substantial investment of resources and manpower, and rural households may feel unhappy due to the financial burden associated with it. Additionally, starting a business does not guarantee its success, and the hardships and uncertainties of starting a business may reduce the subjective well-being of rural households.
4.3. Rural Governance
This paper employs the evaluation of public service work in rural villages as an intermediary variable to investigate whether digital village construction can enhance rural households’ subjective well-being by improving rural governance. First, formula (2) is used to examine the effect of digital village construction on rural governance. The results in column (1) of Table 8 reveal that the coefficient of the digital village construction is significantly positive at the 5% level, suggesting that digital village construction can help enhance rural households' satisfaction with public services and thus improve the level of rural governance. Second, formula (3) is used to introduce the public service evaluation variables for regression analysis. The results in column (2) of Table 8 indicate that the improvement in rural governance, as reflected by digital village construction and public service evaluation, has a significant positive impact on the subjective well-being of rural households. This suggests that digital village construction can enhance rural households’ subjective well-being by improving rural governance.
Additionally, the Index of Digital Rural County includes specific indicators, such as the degree of digitalization of rural governance. The degree of digitization of rural governance is mainly reflected in the measures of rural governance, including the utilization of third-party payment accounts to carry out government affairs and provide public services. This paper selects the degree of digitalization of rural governance as the core explanatory variable to examine the impact of the digitalization of rural governance on the subjective well-being of rural households. The results in column (3) of Table 8 indicate that the coefficient of the core explanatory variable is significantly positive at the 1% level, implying that enhancing the digitalization of rural governance can contribute to the improvement of the subjective well-being of rural households. This suggests that digital village construction can raise the level of rural governance by enhancing the measures of rural governance, thereby enhancing rural households’ subjective well-being. Therefore, all above results provide support for Hypothesis 2 of this paper.
5. Conclusions
Digital village construction is an important strategy for promoting the development and modernization of agriculture and rural areas. It aims to strengthen the construction of rural digital infrastructure, develop the rural digital economy, deepen information services for rural households, and improve rural digital governance to promote overall rural revitalization and urban-rural integration, and ultimately enhance the subjective well-being of rural households. This paper examines the impact and mechanisms of digital village construction on rural households’ subjective well-being, and concludes the following: First, digital village construction improves rural digital infrastructure and promotes the digital development and transformation of the rural livelihoods, governance, and economy, thereby enhancing the subjective well-being of rural households. Second, the benefits of digital village construction are mainly enjoyed by the western region, with a greater increase in rural households’ subjective well-being in that region, while the increase in the eastern and central regions is not significant. Third, rural households with higher levels of human capital benefit more from digital village construction, with their subjective well-being showing a greater increase. Fourth, digital village construction implies increasing individual income, promoting family non-farm employment, and improving rural governance, which can effectively improve the subjective well-being of rural households. Overall, the practical effect of digital village construction is consistent with the original intention of the rural revitalization strategy, which aims to improve the subjective well-being of rural households.
The findings of this paper hold significant implications for the promotion and improvement of digital village construction. First, it is crucial to strengthen the construction of digital infrastructure to bridge the urban-rural divide. Digital village construction can be an important driving force to modernize agriculture and rural areas, with relatively underdeveloped regions benefiting the most from the construction of digital villages. Thus, digital village construction should be leveraged to reduce regional development disparities, promote the rural digital economy, and enhance the subjective well-being of rural households. Second, efforts should be made to improve farmers' modern information skills to promote the revitalization of rural talents. In the digital economy era, farmers' income and employment opportunities require knowledge reserves and information skills. Digital village construction aims to enhance the "hardware" foundation of rural development. However, for the rural areas to enjoy the dividends of digital economic development, it is vital to have skilled and educated talents to provide "software" support. Through the construction of digital villages, deep integration of digital technology applications and industries should be promoted, farmers' information skills should be improved, and talents should be attracted to return to their hometowns to start businesses. Third, the coordinated development of digital villages should be promoted to improve the subjective well-being of rural households. The positive role of digital village construction can be harnessed to increase rural household income, promote non-farm employment, and improve rural governance. Coordinated efforts should be made to promote farmers' employment, increase farmers' income, and develop rural digital infrastructure. Moreover, combining the strategy of rural revitalization and prosperity, the ultimate goal of improving rural households' subjective well-being should be prioritized by focusing on resolving the problems of their livelihood and employment, and leverage the potential of digital village construction in elevating the standard of living and overall well-being.
Author Contributions
Y.X. (Yuan-qi Xie) generated the conceptualization, methodology, software, and validation; carried out formal analysis, investigation, resources, and data curation; and wrote the original draft, including preparation, review, visualization, supervision, and editing. H.L. (Hui Liu) provided statistical assistance and read, revised, and shaped the manuscript to the present form. Y.X. (Yuan-qi Xie) and H.L. (Hui Liu) co-provided project administration and funding acquisition. All authors have read and agreed to the published version of the manuscript.
Funding
This research was funded by the Key Science Fund Project of Hunan Provincial Department of Education, grant number 18A085; and Hunan Provincial Philosophy and Social Science Fund Project, grant number 21YBA079.
Institutional Review Board Statement
Not applicable.
Informed Consent Statement
Not applicable.
Data Availability Statement
The authors confirm that the data supporting the findings of this study are available within the article and raw data were generated by the sources cited.
Conflicts of Interest
The authors declare no conflict of interest.
References
- EASTERLIN, R.A. Does Economic Growth Improve the Human Lot? Some Empirical Evidence. Nations and Households in Economic Growth; Elsevier, 1974; pp 89–125, ISBN 9780122050503.
- Knight, J.; Gunatilaka, R. The Rural–Urban Divide in China: Income but Not Happiness? Journal of Development Studies 2010, 46, 506–534. [Google Scholar] [CrossRef]
- Sacks, D.W.; Stevenson, B.; Wolfers, J. The New Stylized Facts About Income and Subjective Well-Being. SSRN Journal 2013. [Google Scholar] [CrossRef]
- Gandelman, N.; Porzecanski, R. Happiness Inequality: How Much is Reasonable? Soc Indic Res 2013, 110, 257–269. [Google Scholar] [CrossRef]
- Sarracino, F. Determinants of subjective well-being in high and low income countries: Do happiness equations differ across countries? The Journal of Socio-Economics 2013, 42, 51–66. [Google Scholar] [CrossRef]
- Zagorski, K.; Evans, M.D.R.; Kelley, J.; Piotrowska, K. Does National Income Inequality Affect Individuals’ Quality of Life in Europe? Inequality, Happiness, Finances, and Health. Soc Indic Res 2014, 117, 1089–1110. [Google Scholar] [CrossRef]
- Khalil, E.L. Solving the income-happiness paradox. Int Rev Econ 2022, 69, 433–463. [Google Scholar] [CrossRef]
- Mahadea, D.; Ramroop, S. Influences on happiness and subjective well-being of entrepreneurs and labour: Kwazulu-Natal case study. SAJEMS 2015, 18, 245–259. [Google Scholar] [CrossRef]
- Blanchflower, D.G. Is happiness U-shaped everywhere? Age and subjective well-being in 145 countries. J. Popul. Econ. 2021, 34, 575–624. [Google Scholar] [CrossRef]
- EASTERLIN, R.A.; Angelescu, L.; Switek, M.; Sawangfa, O.; Zweig, J. The Happiness-Income Paradox Revisited. SSRN Journal 2011. [Google Scholar] [CrossRef]
- Chapman, B.; Guven, C. Revisiting the Relationship Between Marriage and Wellbeing: Does Marriage Quality Matter? J Happiness Stud 2016, 17, 533–551. [Google Scholar] [CrossRef]
- Cuñado, J.; Gracia, F.P. de. Does Education Affect Happiness? Evidence for Spain. Soc Indic Res 2012, 108, 185–196. [Google Scholar] [CrossRef]
- Ifcher, J.; Zarghamee, H. Happiness and Time Preference: The Effect of Positive Affect in a Random-Assignment Experiment. American Economic Review 2011, 101, 3109–3129. [Google Scholar] [CrossRef]
- Layard, R. Happiness and Public Policy: A Challenge to the Profession. The Economic Journal 2006, 116, C24–C33. [Google Scholar] [CrossRef]
- Veenhoven, R. Healthy happiness: effects of happiness on physical health and the consequences for preventive health care. J Happiness Stud 2008, 9, 449–469. [Google Scholar] [CrossRef]
- Leung, A.; Kier, C.; Fung, T.; Fung, L.; Sproule, R. Searching for Happiness: The Importance of Social Capital. In The Exploration of Happiness; Delle Fave, A., Ed.; Springer Netherlands: Dordrecht, 2013; ISBN 978-94-007-5701-1. [Google Scholar]
- Welsch, H. Environment and happiness: Valuation of air pollution using life satisfaction data. Ecological Economics 2006, 58, 801–813. [Google Scholar] [CrossRef]
- Lelkes, O. Tasting Freedom: Happiness, Religion and Economic Transition. SSRN Journal 2002. [Google Scholar] [CrossRef]
- Pacek, A.; Radcliff, B. Assessing the Welfare State: The Politics of Happiness. Perspect. polit. 2008, 6, 267–277. [Google Scholar] [CrossRef]
- Shier, M.L.; Graham, J.R. Subjective well-being, social work, and the environment: The impact of the socio-political context of practice on social worker happiness. Journal of Social Work 2015, 15, 3–23. [Google Scholar] [CrossRef]
- Chávez Villegas, C. Happiness and Economic Growth: Lessons from Developing Countries. Journal of Human Development and Capabilities 2016, 17, 296–298. [Google Scholar] [CrossRef]
- Qiu, T.; He, Q.; Luo, B. Does land renting-out increase farmers’ subjective well-being? Evidence from rural China. Applied Economics 2021, 53, 2080–2092. [Google Scholar] [CrossRef]
- Li, J. Why Economic Growth did not Translate into Increased Happiness: Preliminary Results of a Multilevel Modeling of Happiness in China. Soc Indic Res 2016, 128, 241–263. [Google Scholar] [CrossRef]
- Phelps, N.; Wang, C.; Miao, J.T.; Zhang, J. E-commerce: A platform for local economic development? Evidence from Taobao Villages in Zhejiang Province, China. Transactions in Planning and Urban Research 2022, 1, 251–268. [Google Scholar] [CrossRef]
- Velsberg, O.; Westergren, U.H.; Jonsson, K. Exploring smartness in public sector innovation - creating smart public services with the Internet of Things. European Journal of Information Systems 2020, 29, 350–368. [Google Scholar] [CrossRef]
- Sen, A. Development as freedom; Oxford University Press: Oxford, 1999; ISBN 0198297580. [Google Scholar]
- Sehnbruch, K.; González, P.; Apablaza, M.; Méndez, R.; Arriagada, V. The Quality of Employment (QoE) in nine Latin American countries: A multidimensional perspective. World Development 2020, 127, 104738. [Google Scholar] [CrossRef]
- Frey, B.S.; Stutzer, A. What Can Economists Learn from Happiness Research? Journal of Economic Literature 2002, 40, 402–435. [Google Scholar] [CrossRef]
- Demir, A.; Pesqué-Cela, V.; Altunbas, Y.; Murinde, V. Fintech, financial inclusion and income inequality: a quantile regression approach. The European Journal of Finance 2022, 28, 86–107. [Google Scholar] [CrossRef]
- Hollman, A.K.; Obermier, T.R.; Burger, P.R. Rural Measures: A Quantitative Study of The Rural Digital Divide. Journal of Information Policy 2021, 11, 176–201. [Google Scholar] [CrossRef]
- He, C.; Du, H. Urbanization, inclusive finance and urban-rural income gap. Applied Economics Letters 2022, 29, 755–759. [Google Scholar] [CrossRef]
- Li, L.; Zeng, Y.; Ye, Z.; Guo, H. E-commerce development and urban-rural income gap: Evidence from Zhejiang Province, China. Pap Reg Sci 2021, 100, 475–494. [Google Scholar] [CrossRef]
- Liu, T.; He, G.; Turvey, C.G. Inclusive Finance, Farm Households Entrepreneurship, and Inclusive Rural Transformation in Rural Poverty-stricken Areas in China. Emerging Markets Finance and Trade 2021, 57, 1929–1958. [Google Scholar] [CrossRef]
- Shen, M.; Shen, J. Evaluating the cooperative and family farm programs in China: A rural governance perspective. Land Use Policy 2018, 79, 240–250. [Google Scholar] [CrossRef]
- Ferrer-i-Carbonell, A.; Frijters, P. How Important is Methodology for the Estimates of the Determinants of Happiness? The Economic Journal 2004, 114, 641–659. [Google Scholar] [CrossRef]

Table 1.
Definitions and descriptive statistics of variables.
| Variables | Definitions | Mean | SD |
|---|---|---|---|
| Subjective well-being | Extremely happy=5, Happy=4, Average=3, Unhappy=2, Extremely unhappy=1 | 2.05 | 0.898 |
| Digital village construction | The Index of Digital Rural County /100 | 0.53 | 0.101 |
| Age | The age of the household head (years) | 57.87 | 11.764 |
| Gender | The gender of the household head: Male=1, Female=0 | 0.85 | 0.360 |
| Marital status | The marital status of the household head: Married=1, Other=0 | 0.86 | 0.351 |
| Education | The educational attainment of the household head (years) | 7.02 | 3.459 |
| Health | Extremely good=5, Good=4, Average=3, Poor=2, Extremely poor=1 | 2.96 | 1.044 |
| Insurance | Whether the household head has pension insurance: Yes=1, No=0 | 0.80 | 0.402 |
| Political affiliation | Whether the household head is a party member: Yes=1, No=0 | 0.12 | 0.328 |
| Family size | The total number of individuals in the household (persons) | 3.62 | 1.842 |
| Family support | The ratio of unemployed individuals in the household to the total household size | 0.42 | 0.326 |
| Debt | The ratio of the household's debt to its assets | 0.17 | 0.604 |
| Housing | The type of housing in which the household resides: Self-owned=1, Other=0. | 0.93 | 0.252 |
| Social connection | Whether the household has personal relationship expenses: Yes=1, No=0 | 0.54 | 0.499 |
| Economic development | The natural logarithm of the per capita gross domestic product within the region | 10.77 | 0.469 |
| Economic growth rate | The regional gross domestic product growth rate | 0.07 | 0.019 |
| Environmental pollution | The annual average concentration of inhalable particulate matter in the region (micrograms per cubic meter) | 36.17 | 13.530 |
| Medical Resource | The natural logarithm of the number of hospital beds in medical and health institutions within the region. | 9.99 | 0.814 |
* Note: Data compiled by the authors.
Table 2.
Baseline regression results.
| Variables | (1) | (2) | (3) | (4) | (5) | (6) |
|---|---|---|---|---|---|---|
| Digital village construction | 0.349*** (0.080) |
-0.053*** (0.115) |
0.644*** (0.111) |
1.071*** (0.116) |
1.090*** (0.117) |
1.335*** (0.143) |
| Age | -0.018*** (0.001) |
-0.018*** (0.001) |
-0.017*** (0.001) |
|||
| Gender | -0.054 (0.037) |
-0.052 (0.037) |
-0.070* (0.037) |
|||
| Marital status | -0.133*** (0.039) |
-0.102*** (0.040) |
-0.090** (0.040) |
|||
| Education | 0.005 (0.004) |
0.006 (0.004) |
0.007* (0.004) |
|||
| Health | 0.205*** (0.013) |
0.193*** (0.013) |
0.190*** (0.013) |
|||
| Insurance | -0.091*** (0.030) |
-0.076** (0.030) |
-0.059* (0.030) |
|||
| Political affiliation | -0.164*** (0.037) |
-0.166*** (0.037) |
-0.171*** (0.037) |
|||
| Family size | -0.013 (0.008) |
-0.015* (0.008) |
||||
| Family support | 0.083** (0.040) |
0.063 (0.040) |
||||
| Debt | 0.139*** (0.023) |
0.138*** (0.023) |
||||
| Housing | 0.027 (0.051) |
0.028 (0.051) |
||||
| Social connection | -0.011 (0.025) |
-0.016 (0.025) |
||||
| Economic development | -0.001 (0.032) |
|||||
| Economic growth rate | 0.483 (0.696) |
|||||
| Environmental pollution | -0.007*** (0.001) |
|||||
| Medical Resource | -0.050*** (0.017) |
|||||
| Observations | 15621 | 7416 | 8205 | 8205 | 8205 | 8205 |
| Pseudo-R2 | 0.001 | 0.000 | 0.001 | 0.029 | 0.031 | 0.035 |
* Note: The standard errors in parentheses below the estimated coefficients represent robust standard errors. *, **, and *** indicate significance at the 10%, 5%, and 1% levels, respectively. The same convention applies throughout.
Table 3.
Instrumental variable regression results.
| Variables | (1) | (2) | (3) | (4) |
|---|---|---|---|---|
| Digital village construction | Subjective well-being | Digital village construction | Subjective well-being | |
| Digital village construction | 1.232*** (0.261) |
1.370*** (0.424) |
||
| Internet penetration rate | 0.265*** (0.011) |
0.265*** (0.011) |
||
| third-party payment account status | -0.219*** (0.008) |
-0.219*** (0.007) |
||
| Controls | YES | YES | YES | YES |
| Observations | 8205 | 8205 | 8205 | 8205 |
Table 4.
Robustness checks results.
| Variables | (1) | (2) | (3) |
|---|---|---|---|
| Digital village construction | 1.038*** (0.224) |
1.161*** (0.179) |
1.799*** (0.200) |
| Controls | YES | YES | YES |
| Observations | 8205 | 8205 | 6166 |
| R2 / Pseudo-R2 | 0.084 | 0.050 | 0.037 |
Table 5.
Heterogeneity test results.
| Variables | (1) | (2) | (3) | (4) | (5) |
|---|---|---|---|---|---|
| Eastern region | Central region | Western region | High human capital | Low human capital | |
| Digital village construction | 0.440* (0.254) |
0.412 (0.408) |
2.595*** (0.286) |
1.742*** (0.187) |
0.669*** (0.226) |
| Controls | YES | YES | YES | YES | YES |
| Observations | 2658 | 2863 | 2684 | 3864 | 4341 |
| Pseudo-R2 | 0.043 | 0.035 | 0.048 | 0.042 | 0.032 |
Table 6.
Mechanism test results based on household income.
| Variables | (1) | (2) | (3) | (4) |
|---|---|---|---|---|
| Per capita income | Subjective well-being | Urban-rural income gap | Subjective well-being | |
| Digital village construction | 0.614*** (0.152) |
1.006*** (0.101) |
-0.965*** (0.031) |
1.098*** (0.119) |
| Per capita income | 0.080*** (0.013) |
|||
| Urban-rural income gap | 0.062* (0.038) |
|||
| Observations | 8205 | 8205 | 8205 | 8205 |
| R2 | 0.155 | 0.086 | 0.405 | 0.084 |
Table 7.
Mechanism test results based on family employment choices.
| Variables | (1) | (2) | (3) | (4) |
|---|---|---|---|---|
| Non-farm employment rate | Subjective well-being | Start businesses | Subjective well-being | |
| Digital village construction | 0.319*** (0.032) |
1.011*** (0.113) |
1.076*** (0.241) |
1.179*** (0.179) |
| Non-farm employment rate | 0.083** (0.041) |
|||
| Start businesses | -0.077* (0.046) |
|||
| Observations | 8205 | 8205 | 8205 | 8205 |
| R2 / Pseudo-R2 | 0.175 | 0.085 | 0.076 | 0.050 |
Table 8.
Mechanism test results based on rural governance.
| Variables | (1) | (2) | (3) |
|---|---|---|---|
| Evaluation of public service | Subjective well-being | Subjective well-being | |
| Digital village construction | 0.832** (0.274) |
0.921*** (0.149) |
|
| Evaluation of public service | 0.036*** (0.005) |
||
| Degree of digitalization of rural governance | 0.307*** (0.049) |
||
| Observations | 4716 | 4716 | 8205 |
| R2 / Pseudo-R2 | 0.003 | 0.043 | 0.079 |
Disclaimer/Publisher’s Note: The statements, opinions and data contained in all publications are solely those of the individual author(s) and contributor(s) and not of MDPI and/or the editor(s). MDPI and/or the editor(s) disclaim responsibility for any injury to people or property resulting from any ideas, methods, instructions or products referred to in the content. |
© 2023 by the authors. Licensee MDPI, Basel, Switzerland. This article is an open access article distributed under the terms and conditions of the Creative Commons Attribution (CC BY) license (http://creativecommons.org/licenses/by/4.0/).
Copyright: This open access article is published under a Creative Commons CC BY 4.0 license, which permit the free download, distribution, and reuse, provided that the author and preprint are cited in any reuse.