Submitted:
26 May 2023
Posted:
30 May 2023
You are already at the latest version
Abstract
(1) Background: There are links between tension-type headache and/or migraine with dysfunctions of the cervical and masticatory muscles and with psychosocial factors. The study aims to highlight the connections between primary headaches, bruxism and psychosocial issues, the effectiveness of a multidisciplinary approach in decreasing the intensity and frequency of the headache episodes and bruxism. (2) Methods: 67 patients with primary headache and bruxism were divided into two equal groups. The subjects attended manual therapy sessions twice a week and a weekly counselling session for three months. (3) Results: an overall comparison before and after three months show a significant decrease of the qualitative variables (tension-type headache, migraine, awake bruxism, limited jaw opening, anxiety and stress) after 3 months. Comparing the efficiency of the procedures after 3 months between the two groups, awake bruxism and perceived stress are significantly different. (4) Conclusions: Although the differences are not radical when comparing MT with MT+C at three months, the patients who received either manual therapy or this treatment combination showed an improvement in pain relief, in the frequency and complexity of their symptoms, a reduction in functional disability and an overall improvement of the quality of their lives after three months of treatment.
Keywords:
tension-type headache
; migraine
; bruxism
; manual therapy
; counselling
1. Introduction
Humans experience headaches more frequently than any other type of pain; it has been described, classified and treated since Antiquity, but never fully known and clarified. Among the forms of primary headache, in order of prevalence in the general population, the most common are tension-type headache (TTH) and migraine. Although all forms affect the quality of daily life, migraine has the strongest impact: it is the second most debilitating cause in the general population and the first in the young adult population (under the age of 50) [1,2]. The etiology of the primary headache is diverse and often multifactorial, including family history, gender and age characteristics, the general state of the body, lifestyle, but also causes related to the cervical and facial area.
The most significant symptom of the TTH is increased interictal pericranial sensitivity (recorded by manual palpation) typically exacerbated during the crisis. A local sensitivity is observed for the frontal, temporal, masseter, pterygoid, sternocleidomastoid, splenius and trapezius muscles. The precise mechanism is not fully known, but peripheral and central pain mechanisms are considered. Connections with emotional state cannot be neglected: in TTH in patients with depression or anxiety, the pain is perceived as much more intense and disabling than in the general population [3].
Unlike TTH, migraine occurs only on one side of the head (hemicranium, usually felt behind the eye), has a pulsating character and gradually worsens. The most frequently incriminated origin is genetic [4].
The literature suggests links between the high prevalence of TTH and migraine with dysfunctions of certain muscle groups - especially the cervical and masticatory muscles [5] and with psychosocial factors - stress, anxiety and depression, through one of their behavioural expressions: bruxism [6,7].
Bruxism is considered a behaviour of the masticatory muscles [8] and is a generic term that encompasses two distinct entities: sleep and awake bruxism. Sleep bruxism (SB) is the rhythmic and episodic motor activity of the masticatory muscles (teeth grinding and/or jaws clenching) during phases of shallow sleep and occurs in an estimated 13% of the population. The awake bruxism (AB) is a state of permanent dental contact (clenching) and/or contraction of the masticatory muscles, its prevalence among the general population being estimated at 22.1-31% [9], higher among women [10]. Although it is considered a parafunction (usually viciously repetitive), bruxism also has positive consequences (repeated mandibular movements favour the flow of the airways and stimulate the production of saliva), thus delimitating a "normo-bruxism" versus a "patho-bruxism" [11], the latter with negative consequences (tooth wear, temporo-mandibular disorders, muscle pain). The diagnosis of both types is based on self-observation, electromyography and polysomnography. The etiology is most likely multifactorial. The idea of occlusal origin has been abandoned in recent years, as correlations between bruxism and anatomical-structural factors could not be established [12]. The literature claims that SB has central, physiopathological (level of brain activation, level of neurotransmitters, genetic factors, smoking, alcohol or drug consumption, mineral deficiencies, allergies) and psychosocial origins (stress, anxiety, personality type, low social support), the latter also being at the origin of the AB [13].
The association between bruxism and primary headache has been intensely debated and the consensus is towards a significant association between TTH, respectively migraine and sleep bruxism [14,15].
This study helps to a better understanding of the links between primary headaches, bruxism and psychosocial issues in order to improve the patients` rehabilitation through a multidisciplinary approach. The rehabilitation plan includes manual therapy performed by a physical therapist, counselling sessions performed by a counsellor as well as daily exercises and relaxation techniques at home.
The main objective of the study was to determine the effectiveness of the combined approach – manual therapy and exercises only versus added counselling and relaxation techniques – to decrease the intensity and frequency of the headache episodes as well as the self-reported bruxism.
2. Materials and Methods
The study took place throughout the year 2021 in two private practice offices: a physiotherapy – manual therapy and a psychology-counselling office. A total of 67 patients were included in the study, 9 men and 58 women, aged between 12 to 64 years, diagnosed with primary headache (TTH, migraine or both), bruxism (AB, SB or both) and high levels of anxiety and perceived stress. All participants provided their written informed consent before being included in the study. The subjects were divided into two groups with almost the same number of subjects (33 versus 34 subjects), taking into account the patient’s motivation to receive not only manual therapy and in-home exercises, but also psychological counselling and in-home relaxation techniques.
The inclusion criteria in the study comprised subjects with a history of primary headache and who agreed to participate.
The exclusion criteria used were refusal to participate, subjects attending other forms of rehabilitation procedures or psychotherapy, as well as chronic prescribed medication intake (analgesic or psychiatric drugs).
The subjects attended manual therapy sessions twice a week and a weekly counselling session during the first three months. After the three-month period, they were reassessed, then continued manual therapy and counselling sessions once a week each.
Most of the subjects had a medical diagnosis established by a physician, usually a neurologist. However, it is necessary for the physiotherapist to carry out his own complex anamnesis, based on observation, patient reports, questionnaires and specific tests, all related to The International Classification of Headache Disorders 3rd edition (ICHD3) [16]. The anamnesis questions refer to the location and the characteristics of the pain, the frequency, periodicity, duration and evolution of the headache episodes, the triggers of the headache episodes, known factors that alleviate or worsen the pain, other symptoms that occur before, during and after a headache episode.
The Visual Analogue Scale was used to assess the intensity of the pain. The patients were asked to mark their pain level on the line between the two endpoints, “no pain at all” and “pain as bad as it could be”.
The limited jaw movements were assessed using The Jaw Functional Limitation Scale (JFLS) [17], which comprises 20 items assessing mastication (items 1-6), vertical jaw mobility (items 7-10) and verbal and emotional expression (items 11-20). Reliability of the JFLS is .87 (Cronbach’s alpha) and .87 (temporal stability) and validity is excellent. A response scale used 0 to 10 signifying the degree of limitation: 0 means no limitation, 10 is severe limitation; an option for “not applicable” is also available, and was scored as “missing.” The subscales are computed as the mean response for all items in the subscale; 2 items are not scored as part of these 3 subscales. The total score is also computed from the 3 subscales when all 3 component scores are available. It is ideal for both research and patient evaluation with a range of functional limitations of the jaw movements [18]. The higher the score, the greater the impairment.
The assessment of the bruxism was based on the report of regular or frequent SB and the presence of an abnormal tooth wear or incidents of transient morning jaw muscle pain or fatigue [19]. The BruxApp®, a dedicated smartphone application for reporting awake bruxism, was used to assess the AB. It records real time report on five specific oral conditions (relaxed jaw muscles, tooth contact, teeth clenching, teeth grinding, mandible bracing) that are related with the spectrum of AB activities [20]. Data were recorded over a 7-day period, 4 times a day, the first week after the assessment, then after 3 months, when the subjects were reassessed.
We used the Depression, Anxiety, Stress Scale (DASS-21R) [21], a 21-item questionnaire that assesses negative emotional states associated with depression, anxiety and stress, to evaluate the emotional status of the subjects. Anxiety symptoms and changes in sleep patterns have been correlated with the presence of headaches.
The statistical analysis was carried out with the Statistical Package for the Social Sciences, Version 24 (IBM Corp., Armonk, NY, USA).
3. Results
67 subjects (58 women and 9 men) were involved in the present study, aged between 12 and 64 years, as follows: women between 12 and 64, mean age 34.31; men between 29 and 63, mean age 37.66. Out of the total population, 9 (13.5%) are of masculine sex and 58 (86.5%) feminine, with an average age of 34 years and a mean deviation from the average age of 10.83 years. Women are most susceptible to suffer from headache; according to World Health Organisation, TTH affects three women to two men, while migraine ratio is two women to one man (because of the hormonal influences).
Two types of variables were analysed: the SB as a quantitative variable and the qualitative variables awake bruxism (AB), TTH pain score (TTH-ps), migraine pain score (M-ps), limited jaw opening (LJO), anxiety (ANX) and perceived stress (PS). In order to test the differences before and after any therapy applied, the paired Student’s T test was used for the quantitative variables (Table 1) and the McNemar’s test for the qualitative ones. We also assessed the differences among the procedures after the three months interval, manual therapy (MT) and manual therapy and counselling (MT+C), using the Student’s T test for independent samples for quantitative variables and the Chi Square for the qualitative ones. A significance level of 0.05 was considered, otherwise mentioned.
As seen in Table 1, 58 (86.5%) out of the total population confirmed the sleep bruxism at the initial time, with an improvement to 51 (76.1%) after the 3 months’ timeframe. The improvement in the number of patients confirming the sleep bruxism is not statistically significant.
The descriptive statistics for the qualitative variables before and after the three months’ interval are presented in Table 2.
All qualitative variables had decreased significantly after 3 months, as seen in Figure 1. The mean score of AB improved from an average of 106.9512 (±16.05296) to 81.0488 (±17.27998). the mean score for TTH-ps improved significantly from 7.9077 (±0.91384) to 4 (±1.0155). The mean pain score for migraine decreased from 8.59 (±0.888) to 4.6667 (±1.07417). Limited jaw opening mean score improved from 99.6 (±25.06658) to 45.04 (±17.84302). In average, anxiety level decreased from 16.5075 (±5.96295) to 13.0448 (±4.34299) and the mean perceived stress level improved from 24.9403 (±6.88626) to 18.7761(±4.92311).
In the three months’ timeframe, the subjects underwent rehabilitative procedures: one group only manual therapy and another group manual therapy and counselling. Table 3 presents the descriptive statistics (sex and sleep bruxism) for the two groups of patients, MT compared to MT+C, at the time of assessment.
Out of the total of 67 patients, 33 (49.25%) are woman and 34 (50.75%) are men, from which 29 women and 5 men have received the MT procedure and 29 men and 4 women the MT+C. From the total of 51 (76.1%) patients, 26 (76.5%) have gone through MT procedure and 25 (75.7%) under MT+C. There are no significant differences in sex and sleep bruxism distribution under the two types of procedures.
The Student’s T test was used to analyse the differences in the qualitative variables between the two groups, at the time of assessment, are presented in Table 4.
The only variables that are significantly different are AB and PS. AB has an average of 85.67 (±18.11) on the MT group and 74.53(±14.067) in the MT+C group. PS has an average of 19.9412 (±5.29117) in the MT group and 17.5758(±4.2649) in the MT+C group.
The average age in the MT group is 35,3824 (±13.01052) while in the MT+C group is 33.303(±8.19102).
The TTH-ps presents significant differences, if a level of significance of 0.1 is considered.
The statistics for SB after 3 months are presented in Table 5, comparing the two groups.
51 (76.1%) patients have confirmed sleep bruxism, out of which 26 underwent only MT and 25 MT+C. There are no significant differences in the sleep bruxism distribution related to the type of treatment.
Table 6 shows the differences in the effects of the procedures at 3 months’ timeframe.
The only variables that are significantly different are AB and PS. AB has an average of 85.67 (±18.11) on the MT group and 74.53(±14.067) in the MT+C group. PS has an average of19.9412 (±5.29117) in the MT group and 17.5758(±4.2649) in the MT+C group.
The average age in the MT group is 35,3824 (±13.01052) while in the MT+C group is 33.303(±8.19102).
The comparison between the two moments (the assessment and after 3 months) for the SB variable in the MT group is presented in Table 7.
There is no significant difference between the distributions of the SB at the time of assessment and after 3 months in the group of subjects treated only with manual therapy. 30 (88.23%) patients reported sleep bruxism at initial times; after 3 months, only 26 (76.47%) still report the presence of it.
As regarding the qualitative variables, the results are shown in Table 8.
All the qualitative variables differ significantly after 3 months of manual therapy.
As for the MT+C group, Table 9 presents the descriptive statistics for SB at the assessment and after the 3 months’ timeframe.
There is no significant difference in the distribution of the SB between the moment of assessment (28 patients, 84.84%) and after the 3 months’ period (25 patients, 75.75%).
The differences between the qualitative variables measured before and after the MT+C are presented in Table 10.
The differences between the two moments (initial assessment and after 3 months) are significant in all variables.
4. Discussion
Hands-on manual therapy is used to pinpoint tight or stiff muscles and trigger points and create a release, which leads to pain release as well. Elongations, mild activation or deep friction of some specific muscles, suboccipital soft tissue inhibition, together with myofascial trigger point therapy [22] allow the soft and connection tissues to relax and eventually realign in order to release pain. They work best in the cases of tension-type headache [23]. On the other hand, manual therapy helps with migraines that worsen because of associated stiff muscles and joints, but they are mostly compensatory measures, relieving the muscular adaptations that increase pain. Even so, it is a risk-free approach and worth trying, as the migraine is a highly disabling condition with few evidence-based treatment options.
There are different MT and pain reduction methods involving biomechanical, neurophysiological and psychological components, either individually or in any combination. The philosophy behind these methods is that MT may activate the descending inhibitory pathways via different levels of the spinal cord and so it may have utility in the management of CM [22].
Other approaches used were mobilizations, cranio-cervical muscle exercises, occiput-atlas-axis mobilizations and posture correction exercises, some of them also in-home. At each session, the manual therapist decided, depending on the patient’s condition and outcomes, which type of techniques and exercises were applied. The manual therapy interventions used were based on the assumption that the mobilization, the stabilization of the cervical spine and the correction of the posture leading to the improvement of the cranio-cervical musculoskeletal function would have a positive effect on the inhibitory systems at different levels in the spinal cord and modulate pain perception, decreasing sensitization, as described in other study [24].
The data show that there is a strong association between bruxism (either awake or sleep bruxism) and tension-type headache. Only 8 out of the 67 subjects report the absence of any type of bruxism, while all the others report the SB. There are 17 subjects that state the absence of AB. Literature shows a direct relationship between the frequency of sleep bruxism and the frequency of morning headaches; adults with sleep bruxism seem to be more susceptible to headaches [25]. Inadequate sleep can lead to headaches and patients with sleep bruxism report three times as many headaches as non-bruxing patients [26]. And when associated with temporo-mandibular joint disorders, the risks of having chronic or episodic migraine or episodic tension-type headache are significantly increased [14].
AB seems to have a significant relationship with tension-type headache and migraine. An explanation would be that the persistent diurnal clenching maintains the tension of the masticatory muscles at a high level, so that, over time, there is an increased sensitization of the nociceptors of the peripheral muscles and a change in the stimulus-response function [27].
AB is usually seen as a jaw clenching habit that appears in response to stress and anxiety states [28], while sleep bruxism represents a sleep related rhythmic masticatory activity generally associated with arousals (from sleep) [29].
The association of sleep bruxism and migraine is still unclear, although there are some studies showing correlations [30].
Currently, no specific treatment exists that can stop sleep bruxism. But treatments based on behavior modification such as a habit awareness, habit reversal therapy and relaxation techniques, together with sleep hygiene, may eliminate awake bruxism [31]. Sleep hygiene techniques (e.g., relaxation or avoiding large meals, alcohol or caffeine before sleeping) are recommended to control sleep bruxism, although their efficacity on muscular activity control is debatable [32].
There is a slight difference, without statistical significance, between the two groups regarding the improvement of the SB occurrence. Since both groups benefit of MT, we can assume that the difference is due either to the time the condition manifested before any treatment (a longer period harden the symptoms) or some psychological conditions not investigated in the present study (depression, for instance) or personality traits.
At the moment of assessment, there are no differences in any of the variables between the two groups. After the three months’ period and the procedures, all the variables have decreased mean values. Even if the difference is not statistically significant, we notice better outcomes in the MT+C group, especially for the AB, PS and LJO. The greater improvement in jaw opening may be due to the motivational-affective and cognitive-evaluative nature of pain – several unpleasant emotional experiences lead to fear of pain, certainty of future pain and consequently avoidance behaviours, reinforcing the movement limitation. All of our patients reporting LJO also report SB and AB. There are studies confirming a linear association between mean anxiety scores and morning headaches [25]. Thus, we recommend to take into account the impact of at least stress and anxiety when dealing with a headache patient.
The anamnesis after the three months shows that manual therapy, itself or in combination with counselling and stress management techniques, is effective in reducing the intensity, the frequency and the overall life quality in patients with TTH and migraine.
Although timid, the results obtained by us are encouraging, especially since headaches are so widespread and there are population categories for which the option of drug therapy is excluded or presents risks – children, pregnant women, people with certain pathological conditions or comorbidities. The MT and MT+C sessions resulted in changes in different parameters related to the disability caused by TTH and in the everyday life quality improvement.
5. Conclusions
The current study aimed to prove the benefits of MT and its combination with counselling and stress relief techniques and strategies. On our patients, when comparing with the scores at the time of the initial assessment, the results after the three months’ timeframe show the efficiency of manual therapy, the pain scores decreasing significantly. Although the differences shown in our study are not radical when comparing MT with MT+C at three months, the patients who received manual therapy combined with psychological counselling, sleep hygiene counselling and relaxation techniques showed an improvement in pain relief, in the frequency and complexity of their symptoms, a reduction in functional disability, an increased vitality and an overall improvement of the quality of their lives after three months of treatment. In terms of potential as an adjunctive treatment, MT has been shown to reduce pain and have a direct effect on the biomechanics of the cervical spine by releasing the muscular tension, thus achieving a functional improvement. It also reduces the local pain threshold. Consequently, MT may reduce cutaneous allodynia and improve the efficacy of current approaches to treating CM.
The substantial economic burden associated with the direct and indirect costs of tension-type headache (lower performances, several sick leaves) demands a cost-effective treatment. The manual therapy intervention offers a promising intervention to be tested in future cost-effectiveness studies. The limits of our study consist of the moderate sample size and the short timeframe, but the results encourage us to extend both of them. Replications of this study using larger sample sizes may confirm the promising and beneficial results of the combined, manual therapy and counselling, approach and explore the potential of using it on various population.
Author Contributions
Conceptualization, J.M. and D.D.; methodology, J.M., D.D. and O.A.M.; software, O.A.M.; validation, J.M., D.D. and O.A.M.; formal analysis, J.M., D.D. and O.A.M.; investigation, J.M. and D.D.; resources, J.M. and D.D.; data curation, O.A.M.; writing—original draft preparation, J.M., D.D. and O.A.M.; writing—review and editing, J.M., D.D. and O.A.M.; visualization, J.M. and D.D.; supervision, J.M.; project administration, J.M. All authors have read and agreed to the published version of the manuscript. All authors have equal contribution to this article.
Funding
This research received no external funding.
Informed Consent Statement
Informed consent was obtained from all subjects involved in the study.
Data Availability Statement
The datasets either used, analysed, or both, during the current study are available from the corresponding authors on reasonable requests.
Conflicts of Interest
The authors declare no conflict of interest.
References
- Stovner, L.J.; Nichols, E.; Steiner, T.J.; Vos, T. Headache in the Global Burden of Disease (GBD) Studies. In: Societal Impact of Headache. Headache; Steiner, T.; Stovner, L., Eds.; Springer, Cham Switzerland, 2019; pp.105-125. [CrossRef]
- Woldeamanuel, Y.W.; Cowan, R.P. Migraine affects 1 in 10 people worldwide featuring recent rise: A systematic review and meta-analysis of community-based studies involving 6 million participants. J Neurol Sci. 2017, 372, pp.307-315. [CrossRef]
- Song, T.J.; Cho, S.J.; Kim, W.J.; Yang, K.I.; Yun, C.H.; Chu, M.K. Anxiety and depression in tension-type headache: a population-based study. PloS one 2016, 11(10), e0165316. [CrossRef]
- de Vries, B.; Anttila, V.; Freilinger, T.; Wessman, M.; Kaunisto, M.A.; Kallela, M.; Artto, V.; Vijfhuizen, L.S.; Göbel, H.; Dichgans, M,; Kubisch, C.; Ferrari, M.D.; Palotie, A.; Terwindt, G.M.; van den Maagdenberg, A.M. International Headache Genetics Consortium. Systematic re-evaluation of genes from candidate gene association studies in migraine using a large genome-wide association data set. Cephalalgia 2016 Jun, 36(7), pp.604-14. [CrossRef]
- Gonçalves, D.A.; Camparis, C.M.; Speciali, J.G.; Franco, A.L.; Castanharo, S.M.; Bigal, M.E. Temporomandibular disorders are differentially associated with headache diagnoses: a controlled study. Clin J Pain 2011 Sep, 27(7), pp.611-615. [CrossRef]
- Lebedeva, E.R.; Kobzeva, N.R.; Gilev, D.V.; Kislyak, N.V.; Olesen, J. Psychosocial factors associated with migraine and tension-type headache in medical students. Cephalalgia 2017 Nov, 37(13), pp.1264-1271. [CrossRef]
- Didier, H.A.; Marchetti, A.; Marchetti, C.; Gianni, A.B.; Tullo, V.; Di Fiore, P.; Peccarisi, C.; D'Amico, D.; Bussone, G. Study of parafunctions in patients with chronic migraine. Neurol Sci. 2014 May, 35 Suppl 1, pp.199-202. [CrossRef]
- Lobbezoo, F.; Ahlberg, J.; Raphael, K.G.; Wetselaar, P.; Glaros, A.G.; Kato, T.; Santiago, V.; Winocur, E.; De Laat, A.; De Leeuw, R.; Koyano, K.; Lavigne, G.J.; Svensson, P.; Manfredini, D. International consensus on the assessment of bruxism: Report of a work in progress. J Oral Rehabil. 2018 Nov, 45(11), pp.837-844. [CrossRef]
- Manfredini, D.; Winocur, E.; Guarda-Nardini, L.; Paesani, D.; Lobbezoo, F. Epidemiology of bruxism in adults: a systematic review of the literature. J Orofac Pain. 2013 Spring, 27(2), pp. 99-110. [CrossRef]
- Yap, A.U.; Chua, A.P. Sleep bruxism: Current knowledge and contemporary management. J Conserv Dent. 2016 Sep-Oct, 19(5), pp.383-389. [CrossRef]
- Svensson, P.; Lavigne, G. Clinical bruxism semantics beyond academic debates: Normo- and patho-bruxism as a new proposal. J Oral Rehabil. 2020 May, 47(5), pp. 547-548. [CrossRef]
- Lobbezoo, F.; Rompré, P.H.; Soucy, J.P.; Iafrancesco, C.; Turkewicz, J.; Montplaisir, J.Y.; Lavigne, G.J. Lack of associations between occlusal and cephalometric measures, side imbalance in striatal D2 receptor binding, and sleep-related oromotor activities. J Orofac Pain. 2001 Winter, 15(1), pp. 64-71. PMID: 11889650.
- Bayar, G.R.; Tutuncu, R.; Acikel, C. Psychopathological profile of patients with different forms of bruxism. Clin Oral Investig. 2012 Feb, 16(1), pp. 305-311. [CrossRef]
- Fernandes, G.; Franco, A.L.; Gonçalves, D.A.; Speciali, J.G.; Bigal, M.E.; Camparis, C.M. Temporomandibular disorders, sleep bruxism, and primary headaches are mutually associated. J Orofac Pain. 2013 Winter, 27(1), pp. 14-20. [CrossRef]
- De Luca Canto, G.; Singh, V.; Bigal, M.E.; Major, P.W.; Flores-Mir, C. Association between tension-type headache and migraine with sleep bruxism: a systematic review. Headache. 2014 Oct, 54(9), pp.1460-1469. [CrossRef]
- Headache Classification Committee of the International Headache Society (IHS). The International Classification of Headache Disorders, 3rd edition (beta version). Cephalalgia. 2013 Jul, 33(9):629-808. [CrossRef]
- Ohrbach, R.; Larsson, P.; List, T. The jaw functional limitation scale: development, reliability, and validity of 8-item and 20-item versions. J Orofac Pain. 2008 Summer, 22(3), pp. 219-30. PMID: 18780535.
- Ohrbach, R.; Fillingim, R.B.; Mulkey, F.; Gonzalez, Y.; Gordon, S.; Gremillion, H.; Lim, P.F.; Ribeiro-Dasilva, M.; Greenspan, J.D.; Knott, C.; Maixner, W.; Slade, G. Clinical findings and pain symptoms as potential risk factors for chronic TMD: descriptive data and empirically identified domains from the OPPERA case-control study. J Pain. 2011 Nov, 12(11), pp. T27-45. [CrossRef]
- Stuginski-Barbosa, J.; Porporatti, A.L.; Costa, Y.M.; Svensson, P.; Conti, P.C. Agreement of the International Classification of Sleep Disorders Criteria with polysomnography for sleep bruxism diagnosis: A preliminary study. J Prosthet Dent. 2017 Jan, 117(1), pp.61-66. [CrossRef]
- Zani, A.; Lobbezoo, F.; Bracci, A.; Ahlberg, J.; Manfredini, D. Ecological Momentary Assessment and Intervention Principles for the Study of Awake Bruxism Behaviors, Part 1: General Principles and Preliminary Data on Healthy Young Italian Adults. Front Neurol. 2019 Mar, 10:169. [CrossRef]
- Lovibond, S.H.; Lovibond, P.F. Manual pentru scalele de depresie, anxietate și stres. Editura ASCR, Cluj Napoca, 2011:7.
- Fernández-de-Las-Peñas, C.; Courtney, C.A. Clinical reasoning for manual therapy management of tension type and cervicogenic headache. J Man Manip Ther. 2014 Feb, 22(1), pp. 44-50. [CrossRef]
- Quinn, C.; Chandler, C.; Moraska, A. Massage therapy and frequency of chronic tension headaches. Am J Public Health. 2002 Oct, 92(10):1657-1661. [CrossRef]
- Castien, R.F.; van der Windt, D.A.; Grooten, A.; Dekker, J. Effectiveness of manual therapy for chronic tension-type headache: a pragmatic, randomised, clinical trial. Cephalalgia, 2011 Jan, 31(2), pp. 133-43. [CrossRef]
- Vieira, K.R.M.; Folchini, C.M.; Heyde, M.D.V.D.; Stuginski-Barbosa, J.; Kowacs, P.A.; Piovesan, E.J. Wake-Up Headache Is Associated With Sleep Bruxism. Headache, 2020 May, 60(5), pp. 974-980. [CrossRef]
- Carra, M.C. Obstructive Sleep Disordered Breathing, Sleep Bruxism and Periodontal Diseases Orthodontie Francaise, 2019, 90, pp.301-310. [CrossRef]
- Réus, J.C.; Polmann, H.; Mendes Souza, B.D.; Flores-Mir, C.; Trevisol Bittencourt, P.C.; Winocur, E.; Okeson, J.; De Luca Canto, G. Association Between Primary Headache and Bruxism: An Updated Systematic Review. J Oral Facial Pain Headache. 2021 Spring, 35(2), pp.129-138. [CrossRef]
- Manfredini, D.; Lobbezoo, F. Role of psychosocial factors in the etiology of bruxism. J Orofac Pain. 2009 Spring, 23(2), pp.153-66. PMID: 19492540.
- Kato, T.; Rompré, P.; Montplaisir, J.Y.; Sessle, B.J.; Lavigne, G.J. Sleep bruxism: an oromotor activity secondary to micro-arousal. J Dent Res. 2001 Oct, 80(10), pp.1940-1944. [CrossRef]
- Muayqil, T.; Al-Jafen, B.N.; Al-Saaran, Z.; Al-Shammari, M.; Alkthiry, A.; Muhammad, W.S.; Murshid, R.; Alanazy, M.H. Migraine and Headache Prevalence and Associated Comorbidities in a Large Saudi Sample. Eur Neurol. 2018, 79(3-4), pp.126-134. [CrossRef]
- Reddy, S.V.; Kumar, M.P.; Sravanthi, D.; Mohsin, A.H.; Anuhya, V. Bruxism: a literature review. J Int Oral Health. 2014 Nov-Dec, 6(6), pp.105-109. PMID: 25628497.
- Valiente López, M.; van Selms, M.K.; van der Zaag, J.; Hamburger, H.L.; Lobbezoo, F. Do sleep hygiene measures and progressive muscle relaxation influence sleep bruxism? Report of a randomised controlled trial. J Oral Rehabil. 2015 Apr, 42(4), pp. 259-265. [CrossRef]
Figure 1.
Mean values comparisons before and after any procedure.
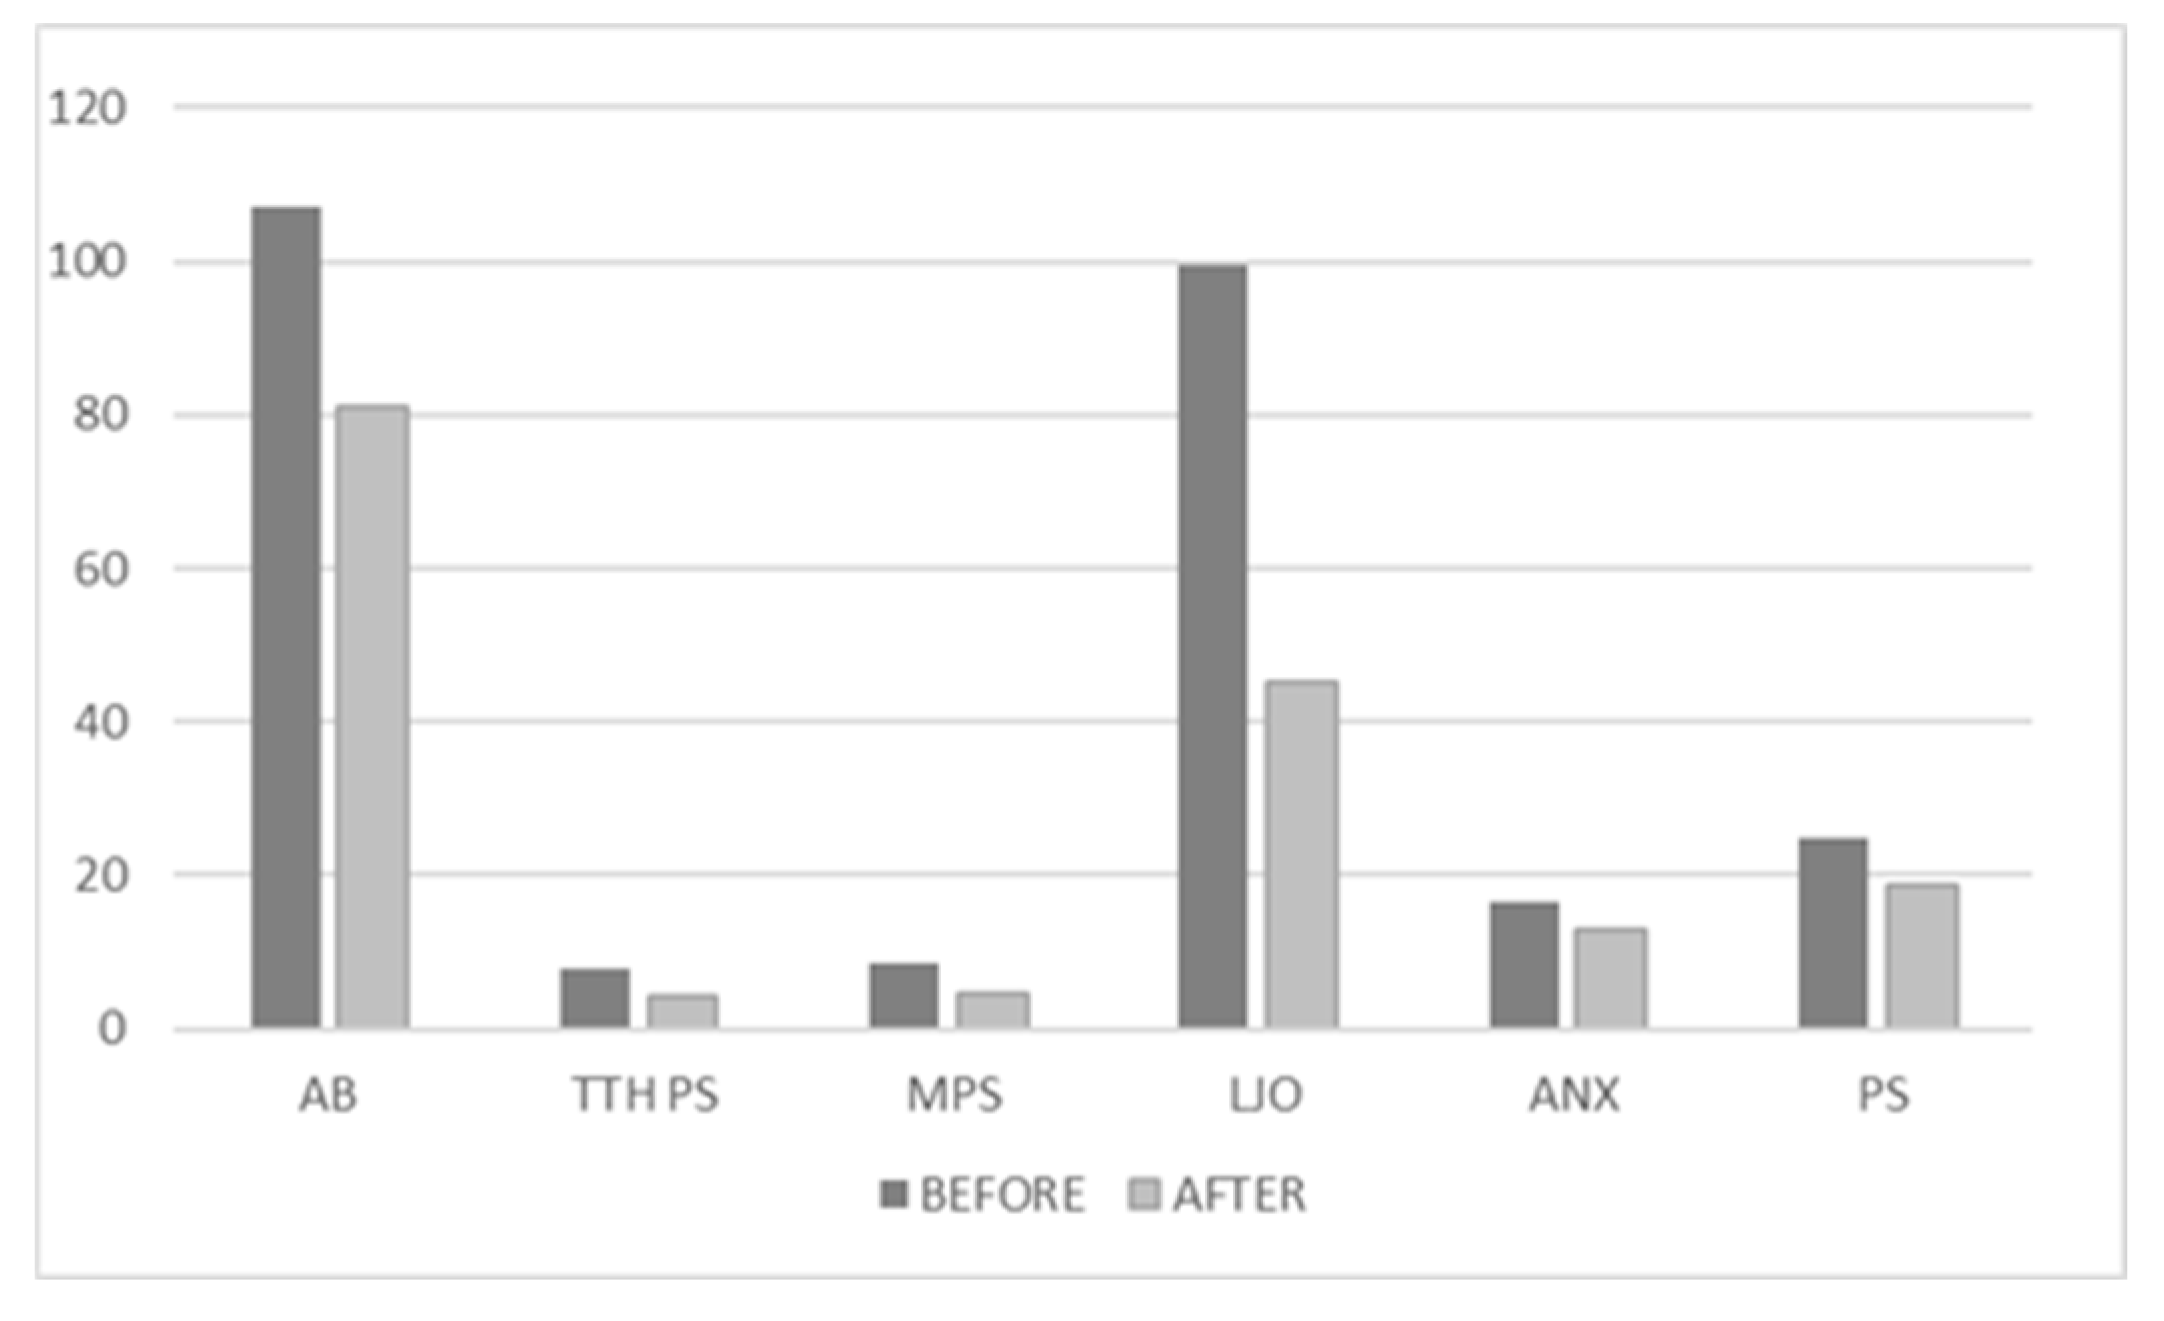

Table 1.
Statistics for SB variable before and after any procedure.
| Variable | Before | After | p-value | |
|---|---|---|---|---|
| n (%) | n (%) | |||
| SB | yes | 58 (86.5%) | 51 (76.1%) | 0.12 |
Table 2.
Descriptive statistics for qualitative variables before and after any procedure.
| Variable | before | after | p-value |
|---|---|---|---|
| mean±std | mean±std | ||
| AB | 106.9512±16.05296 | 81.0488±17.27998 | 0 |
| TTH PS | 7.9077±0.91384 | 4±1.0155 | 0 |
| M PS | 8.59±0.888 | 4.6667±1.07417 | 0 |
| LJO | 99.6±25.06658 | 45.04±17.84302 | 0.001 |
| Anx | 16.5075±5.96295 | 13.0448±4.34299 | 0 |
| PS | 24.9403±6.88626 | 18.7761±4.92311 | 0 |
Table 3.
Statistics for sex and SB variables at the time of assessment.
| Variable | All patients | MT | MT+C | p-value | |
|---|---|---|---|---|---|
| n (%) | n (%) | n (%) | |||
| sex | W | 33 (49.25%) | 29 (85.29%) | 29 (87.87%) | 0.756 |
| M | 34 (50.75%) | 5 (14.71%) | 4 (12.13%) | ||
| SB | yes | 58 (86.56%) | 30 (88.23%) | 28 (84.84%) | 0.684 |
Table 4.
Statistics for the qualitative variables at the time of assessment.
| Variable | MT | MT+C | p-value |
|---|---|---|---|
| mean±std | mean±std | ||
| age | 35.3824±13.01052 | 33.303±8.19102 | 0.436 |
| AB | 104.5±17.438 | 110.41±13.616 | 0.25 |
| TTH PS | 8.0882±0.96508 | 7.7091±0.82436 | 0.096* |
| M PS | 8.64±0.929 | 8.54±0.877 | 0.767 |
| LJO | 98.2857±24.73064 | 101.2727±26.59733 | 0.774 |
| Anx | 16.8235±5.70205 | 16.1818±6.29213 | 0.663 |
| PS | 24.7353±7.11511 | 25.1515±7.11511 | 0.807 |
*significant at 0.1.
Table 5.
Statistics for SB after 3 months.
| Variable | All patients | MT | MT+C | p-value | |
|---|---|---|---|---|---|
| n (%) | n (%) | n (%) | |||
| SB | yes | 51 (76.1%) | 26 (76.5%) | 25 (75.7%) | 0.945 |
Table 6.
Statistics after MT and MT+C procedures at 3 months.
| Variable | MT | MT+C | p-value |
|---|---|---|---|
| mean±std | mean±std | ||
| age | 35.3824±13.01052 | 33.303±8.19102 | 0.436 |
| AB | 85.67±18.11 | 74.53±14.067 | 0.04 |
| TTH PS | 4.0882±0.99598 | 3.9032±1.04419 | 0.468 |
| M PS | 4.79±0.802 | 4.54±1.33 | 0.569 |
| LJO | 48.4286±21.9955 | 40.7273±9.93067 | 0.258 |
| Anx | 13.7647±4.31389 | 12.303±4.31194 | 0.17 |
| PS | 19.9412±5.29117 | 17.5758±4.2649 | 0.048 |
Table 7.
The SB variable in the MT group, before and after manual therapy.
| Variable | Before | After | p-value | |
|---|---|---|---|---|
| n (%) | n (%) | |||
| SB | yes | 30 (88.23%) | 26 (76.47%) | 0.17 |
Table 8.
The qualitative variables in the MT group, before and after the manual therapy.
| Variable | Before | After | p-value |
|---|---|---|---|
| mean±std | mean±std | ||
| AB | 104.5±17.438 | 85.6667±18.10997 | 0 |
| TTH PS | 8.0882±0.96508 | 4.0882±0.99598 | 0 |
| M PS | 8.64±0.929 | 4.7857±0.80178 | 0 |
| LJO | 98.2857±24.73064 | 48.2486±21.9955 | 0 |
| Anx | 16.8235±5.70205 | 13.7647±4.31389 | 0 |
| PS | 24.7353±7.11511 | 19.9412±5.29117 | 0 |
Table 9.
The SB variable in the MT+C group, before and after therapies.
| Variable | Before | After | p-value | |
|---|---|---|---|---|
| n (%) | n (%) | |||
| SB | yes | 28 (84.84%) | 25 (75.75%) | 0.269 |
Table 10.
The qualitative variables in the MT+C group, before and after the therapies.
| Variable | before | after | p-value |
|---|---|---|---|
| mean±std | mean±std | ||
| AB | 110.41±13.616 | 74.5294±14.06733 | 0 |
| TTH PS | 7.7097±0.82436 | 3.9032±1.04419 | 0 |
| M PS | 8.54±0.877 | 4.5385±1.33012 | 0 |
| LJO | 101.2727±26.59733 | 40.7273±9.93067 | 0 |
| Anx | 16.1818±6.29213 | 12.3030±4.31194 | 0 |
| PS | 25.1515±6.74593 | 17.5758±4.2649 | 0 |
Disclaimer/Publisher’s Note: The statements, opinions and data contained in all publications are solely those of the individual author(s) and contributor(s) and not of MDPI and/or the editor(s). MDPI and/or the editor(s) disclaim responsibility for any injury to people or property resulting from any ideas, methods, instructions or products referred to in the content. |
© 2023 by the authors. Licensee MDPI, Basel, Switzerland. This article is an open access article distributed under the terms and conditions of the Creative Commons Attribution (CC BY) license (http://creativecommons.org/licenses/by/4.0/).
Copyright: This open access article is published under a Creative Commons CC BY 4.0 license, which permit the free download, distribution, and reuse, provided that the author and preprint are cited in any reuse.


