Submitted:
25 May 2023
Posted:
26 May 2023
You are already at the latest version
Abstract
Deforestation is an important environmental problem in México and a key promoter of regional climate change through modifying the surface albedo. The objective of this research was to characterize the impact of deforestation and land use changes on surface albedo (α) and climate patterns in the Municipality of Tapalpa, Jalisco, México between the years 2014 and 2021. The main land cover types are coniferous forests (CF), oak and gallery woodlands (OGW), and annual agriculture (AA); which represent more than 88% of the regional territory (1066.03 km2). We used 2014 and 2021 Landsat 8 OLI images with topographic and atmospheric correction, in order to develop an inventory of albedo values for each land cover type in both time scenarios. Albedo images were generated by using the equation proposed by Liang in 2001, which is based on the reflectance of the bands 2, 3, 4, 5, and 7. Differences in albedo values were calculated between the years 2014 and 2021, and those differences were correlated with variations in climate parameters, for which we used climate data derived from the WRF model. In addition, the different land use changes found were classified in terms of triggers for increasing or decreasing surface albedo. Results showed that between 2014 and 2021, at least 38 events of land use change or deforestation occurred, with albedo increments between 1 and 11%, which triggered an average increment of 0.57% of the regional surface albedo in comparison to 2014 scenario. From 2014 to 2021, the albedo for CF, OGW, and AA, increased significantly (p<0.001; Mann-Whitney U Test) by 79, 12, and 9%, respectively. In addition, the regional albedo increment was found to be significant and negatively correlated (p<0.01 Spearman’s coefficient) with relative humidity (RH), maximum temperature (Tmax), minimum temperature (Tmin), and diurnal thermal range (DTR). The decrease in the regional values of relative humidity in 2021, occurred even when in that year the annual precipitation levels were higher than those of 2014, hence, reinforcing the fact of a possible climatic effect of the regional albedo changes. Conversion of CF and OGW into AA, perennial agriculture (PA), or grassland (GR) always yielded an albedo increment, whilst the conversion of AA to irrigation agriculture or PA triggered a decrease in albedo, and finally, the pass from GR or AA to protected agriculture caused albedo increase or decrease, depending on the greenhouse covers materials. Reducing deforestation of CF and OGW, conversion of AA or GR into PA, and selecting adequate greenhouse covers could help to mitigate regional climate change.
Keywords:
Deforestation
; Land-use change
; Surface albedo
; Diurnal thermal range
; Temperate region
; México.
1. Introduction
Forests provide environmental services such as carbon sequestration, fauna refuge, soil generation, and conservation, being part of the trophic chain, and climate regulation, among others [1]. The albedo of forests is low compared to other plant covers, so forests absorb more net radiation [2]; when a deforestation event occurs, the first environmental service affected is that of climate regulation, through an immediate alteration of the surface albedo value, affecting the radiative balance of the ecosystem [3,4]. This begins a chain of climatic effects, including a variation in evapotranspiration rates and environmental humidity levels, thus modifying the water cycle, water catchment, and carbon sequestration [5,6,7,8,9].
By decreasing the amount of atmospheric humidity, the climate regulation capacity of forests is reduced, hence, deforestation also contributes to a greater incidence of extreme temperature events, with new maximum temperature records and more presence of meteorological frosts, alteration in the number of cloudy and rainy days, as well as an increase in the intensity of precipitations and floods [3,6]. In addition, when the forest cover is removed, CO2 and volatile organic compounds are released into the atmosphere, contributing to global climate change [7,8], which culminates in the deterioration of environmental comfort for different living organisms.
In Mexico, 33,618 ha/year of temperate woodlands are lost, and this area is converted to grasslands and croplands [9]. In Jalisco, temperate woodlands are the main ecosystems and constitute the eco-regions more affected by deforestation since 42.38% of this type of land cover has been lost basically in the last 18 years. The municipality of Tapalpa has a wide diversity of flora and fauna and is rich in water availability and forest resources. The principal vegetation types in temperate woodlands are coniferous and pine-oak species; the main economic activities are forestry, agriculture, livestock, and tourism because of the presence of beautiful landscapes [10]. However, deforestation is a phenomenon that is increasing; between 1971 and 2010, 3,751.6 hectares of forest were lost in the Tapalpa micro-watershed, of which 2,358.6 hectares were initially used for agriculture [12]; and later to the establishment of agro-industrialized orchards, preventing the natural recovery of the forest. Deforestation and changes in land use in the municipality of Tapalpa have continued, in such a way that by 2017, 14,192 ha of the forest had already been converted to agriculture and grassland [11,12].
Despite the environmental impacts caused by deforestation and land use changes, few investigations in Mexico have focused on explaining the effects of these practices on the change in surface albedo value and its consequences on local/regional climatology. The antecedent regional research on this subject is very scarce [11]. A study developed for six forested areas of Mexico, one of them located in the municipality of Tapalpa, revealed that deforested areas have higher temperatures than wooded areas (+0.43 to +0.69 °C) and that the type of land cover and forest species influence the diurnal temperature range (DTR) [13].
The objective of this research was to characterize the impact of deforestation and land use changes on the surface albedo and temperature patterns in the Municipality of Tapalpa, Jalisco, México.
2. Materials and Methods
2.1. Study area
The study area was the municipality of Tapalpa, which is located in the southwest of the state of Jalisco, México, between 19°36′49″ and 20°05′54″ north latitude, and between 103°36′20″ and 103°54′00″ west longitude, at an average altitude of 1,950 m, it has a territory of 442.15 km2, including 17,715 ha of temperate woodlands, mainly represented by coniferous and pine-oak forests [10]. The predominant climate type according to the Köppen-García system [14] is Cb(w”2)(i’)g, which is described as a subhumid temperate climate with rainfalls occurring in summer and autumn, a percentage of winter rain between 5 and 10.2%, with little annual thermal oscillation (5 to 7°C). The warmest month is May and the coldest one is January [15]. The annual mean precipitation is 891.2 mm, and the annual mean temperature fluctuates between 8.5 and 23.7°C [15].
2.2. Supplies
Land cover and topographic data sets were used from Landsat 8 remote sensors for the periods 2014 and 2021. Images with little or no cloud cover (<10%) were selected and downloaded from the dataset Landsat Collection 2 on the website USGS Earth Explorer (https://earthexplorer.usgs.gov/). Information from bands 2, 3, 4, 5, and 7 (blue, green, red, near-infrared, and shortwave infrared 2) was used to apply the albedo algorithm of Liang (2001) [1,16], Mexican Elevation Continuum 3.0 (CEM 3.0), Terrain Elevation Model (TEM), Municipal Political Division Vector dataset 2020 [17,18] and SAMOF 2016 land use and land cover type map [19], monthly climatic rasters prepared from the daily data of the Weather Research and Forecasting (WRF) model provided by the National Laboratory of Modeling and Remote Sensing of the National Institute of Forestry, Agriculture and Livestock Research [20]. Prior to the calculation of albedo values, the satellite images were subjected to processes of atmospheric and topographic correction and conversion from narrowband to broadband [16], for which the images were processed and analyzed with the QGIS 3.24, ERDAS Image 2015, and IDRISI 17.0 software.
2.3. Representativeness of land covers in the study area
We made an inventory of the area (hectares) corresponding to each land cover in Tapalpa. For this, the vector data set of the municipal political division and land use, and a map of land cover types from SAMOF [19] were used.
2.4. Preliminary images process
2.4.1. Topographic correction
It eliminates the distortions given by the irregular shape of the terrain, since the shading and lighting effects, respectively, produce lower and higher reflectance [21]. It also includes correcting for geometric distortion, which involves correcting the image according to a given geographic projection system. The methods to carry out the topographic correction depend on the degree of distortion, which is moderate in the case of the satellites of the Landsat series (multi-spectral sensor). There are no standardized models for topographic correction processes [21,22]. In this research the shading effect was corrected with the C method, by using the program ERDAS Imagine 2014; the C method is based on lighting conditions, which is why it uses a terrain elevation model to calculate the angle of incidence of radiation [21,22]. The equation (1, 2) is as follows:
where:
LH = reflectance a horizontal surface
LT = reflectance from an inclined surface
cos Z = cosine of the solar zenith angle
cos i = cosine of incident local angle.
where:
m=linear regression gradient: LT-cos i
b=linear regression interception: LT-cos i.
2.4.2. Atmospheric correction
Eliminates or reduces the distortion associated with the gases and particles of the atmosphere that scatter the solar radiation captured by the satellite sensors. This is achieved through the use of spectral characteristics for each band of the sensor, thus obtaining the reflectance of the Surface. [1,23,24].
2.4.3. Sun angle correction method
It is an atmospheric correction method, which transforms the digital levels (DN) to radiance values, starting from the sensor calibration coefficients and the scale factor of 0.1, the data are proportional to the original radiance captured by the sensor, and they are normalized to be transformed into reflectance values expressed as a percentage [21].
2.4.4. Conversion to TOA radiance
For this purpose, the following equation (3) was executed in the ERDAS Imagine 2014 program:
where:
ρλ’ = Spectral radiance TOA
ML = Band-specific multiplicative re-scaling factor
AL = Band-specific additive rescaling factor
Qcal = Quantified and Calibrated Standard Product Pixel Values (DN)
ML and AL, are the specific calibration data for each band available in the image metadata.
2.4.5. Conversion to TOA reflectance with solar angle
With this method, the precision of the reflectance of the surface is improved, in comparison with other methods [21], the equation (4) of this process is:
where:
ρλ = Reflectance TOA; θSE = Sun elevation angle*
θSZ = Local solar zenital angle; θSZ = 90°- θSE
θSE = Information contained in the image metadata.
* Refers to the sun elevation angle from the center of the scene in degrees.
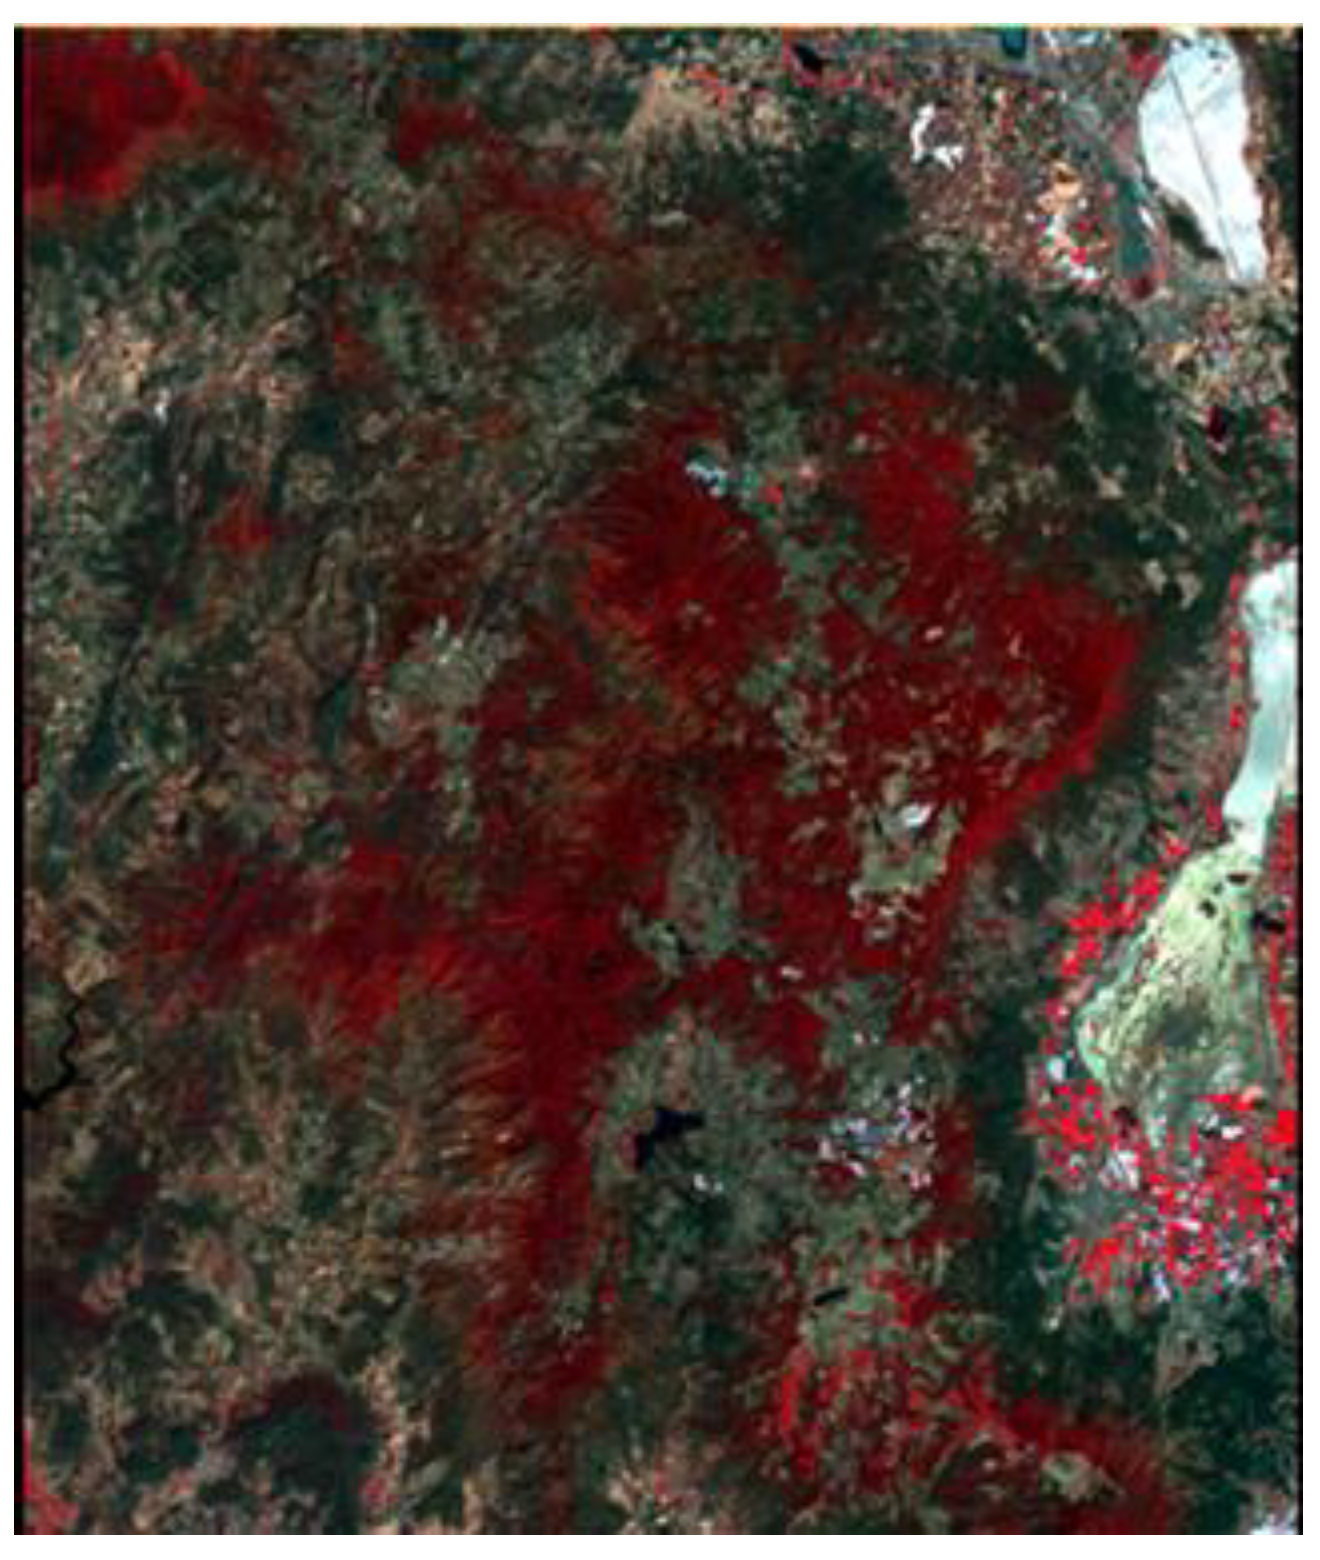
Figure 1.
Image with topographic and atmospheric correction.
2.5. Albedo calculation
Surface albedo values can be calculated based on the corrected surface reflectance from Landsat 8 OLI/TRIS 2014 and 2021 satellite images, using the blue, green, red, near-infrared (NIR), shortwave infrared (SWIR) bands 1 and 2 [1,23,25]. To obtain albedo images in this study, the equation (5) proposed by Liang (2001) was used:
where:
Albedo = 0.356 αBLUE + 0.130 αGREEN + 0.373 αRED + 0.085 αNIR + 0.072 αSWIR2 - 0.0018
αBLUE, αGREEN, αRED, αNIR, y αSWIR2 are the reflectance data corresponding to bands 2, 3, 4, 5, and 7, respectively.
2.6. Evaluation of types of land use changes as triggers for increasing/decreasing albedo
The different land use changes found were classified in terms of triggers for increasing or decreasing surface albedo by calculating the percentage difference between Albedo 2021 and Albedo 2014. Positive differences meant increased albedo whilst negative ones were taken as decreasing albedo. This classification enabled us to evaluate which types of land use changes could eventually contribute to mitigating the regional climate change caused by deforestation or land use change practices.
2.7. Relationship between albedo changes and variation of climatic variables
In order to estimate the impact of the surface albedo changes on the climatic conditions of Tapalpa, we used as indicator variables: relative humidity (RH), maximum temperature (Tmax), minimum temperature (Tmin), and diurnal temperature range (DTR). They were calculated monthly and annually for the years 2014 and 2021 by using daily data derived from the WRF model. The variable DTR is considered an indicator of the climatic regulation capacity of an ecosystem [26,27,28] and is calculated as (equation 6):
DTR=Tmax-Tmin
For RH, Tmax, Tmin, and DTR, we made monthly and annual raster layers throughout processes of interpolation in the software QGIS 3.24 with the method IDW (Inverse Distance Weighting), which estimates the values of the cells by calculating averages of the values of the sample data points in the vicinity of each processing cell [29]. Punctual and georeferenced values of the four climatic variables were extracted from the raster layers generated in order to structure a data matrix in an Excel spreadsheet. Albedo values for 2014 and 2021 were also added to this data matrix to proceed with statistical analysis.
2.8. Statistical analysis
Before proceeding with the statistical analyses, the albedo and climatic data were tested for normality using the Shapiro-Wilk test. The results of this test showed no normality for all data analyzed. This is why we used non-parametric statistics for subsequent statistical analyzes.
Statistical analysis included correlation analysis with Spearman’s statistic; albedo changes 2021-2014 were correlated versus climatic variables changes 2021-2014. Analysis of means comparison was made by using the Mann-Whitney U Test. In this case, albedo values from 2014 and 2021 were analyzed to declare significant or not significant statistical differences. The software used to perform these analyzes was IBM SPSS Statistics 19.
3. Results
3.1. Representativeness of land covers in the study area
Figure 2 shows the soil covers present in the study area, while its representativeness in terms of percentage of the total area of the municipality of Tapalpa, is described in Table 1. As can be seen, the most important types of land cover are coniferous forests (CF) with 42.55% of the territory of Tapalpa, annual agriculture (AA) 26.37%, and oak and gallery forest (OGF) 19.52%. Other types of land cover maintain a low representativeness.
3.2. Albedo values for types of land cover
Table 2 shows the maximum and average albedo values for each land cover of the municipality of Tapalpa in the years 2014 and 2021. A simple comparison can be made by looking at the 2014 and 2021 average albedo values, thus, in 2014 the three land covers with the highest albedo were BG, UA area, and AA with 9.51, 7.99, and 7.82%, respectively; however, in 2021 the three highest values corresponded to CF, UA, and AA with 9.6, 8.61, and 8.52%, respectively. In contrast, the three types of land cover with the lowest albedo value in 2014 were WB, CF, and TL with 4.72, 5.37, and 5.69%, respectively; whereas in 2021 they were WB, CIF, and CGR with 4.69, 5.53, and 5.77%, respectively (Table 2).
Table 2 also shows that all land covers of Tapalpa varied their albedo values during the period 2014 through 2021, which indicates the presence of alterations or changes in land use. Eight positive cases are noted (this is an increase in albedo), and five cases in which the albedo decreased. This resulted in Tapalpa increasing its surface albedo by 0.57% from 2014 to 2021 (p<0.0001; Mann-Whitney U Test).
Figure 3 allows evidence of the surface albedo increment in most of the land cover types of Tapalpa by the year 2021. Out of CEGF and BG, all land covers showed an albedo change statistically significant (p<0.05; Mann-Whitney U Test). It is remarkable that from the eight cases of albedo increment, the highest augment corresponded to CF land cover (+4.23%).
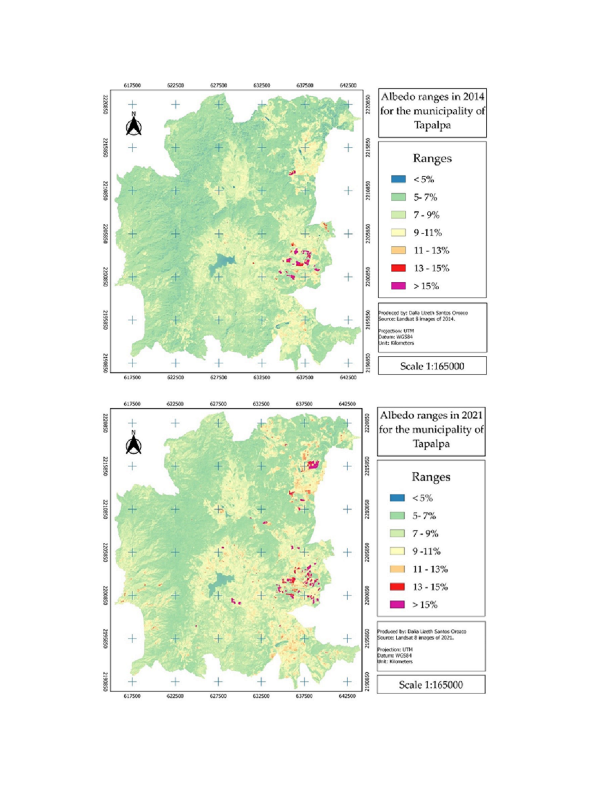
In Figure 4, it can be seen and compared the spatial distribution of several ranges of albedo values for 2014 and 2021 scenarios. The map enables a simple but illustrative comparison of both scenarios and elucidates the extent of deforestation and land-use changes’ effects on the variation of surface albedo.
3.3. Land cover changes between 2014 and 2021 and their impact on albedo value
In order to explain the significant difference between albedo 2014 and albedo 2021 for the municipality of Tapalpa, Table 3 and Figure 5 shows 38 cases of land use changes during the period 2014 through 2021. These cases imply 38 polygons, which totalize 658.07247 ha, which is 1.06% of the municipality’s total area. This amount of hectares is distributed as follows: 219.90857 ha from coniferous forest to perennial agriculture; 164.9045 ha from annual agriculture to sheltered agriculture; 125.35459 from coniferous forest to annual agriculture; 52.83104 ha from annual agriculture to perennial agriculture; 46.54663 ha from perennial agriculture (trees < 1-year-old) to perennial agriculture (trees > 7-year-old); 26.13877 ha from grassland to sheltered agriculture; 17.78499 ha from oak and gallery forest to grassland, 3.43247 ha from coniferous forest to bare soil, and 1.17091 ha from coniferous forest to grassland.
As can be seen, the land cover changes reported in Table 3, occurred from 2015 until 2021, and denote different impacts on albedo value changes, although most of them represent an increase in the albedo value, from +0.72 to +10.36%. Only six of the 38 cases were found to be a decrease in albedo value, in the range of -1.97 to -0.19 (Table 3).
3.4. Relationship between albedo change and climate variables
Albedo changes (α2021-α2014) correlated negatively and significantly (p<0.001) with 2021-2014 deviations in RH, Tmax, Tmin, and DTR (Table 4). Although Spearman’s correlation values ranged from -0.2 to -0.3, which according to LaMorte [30] evidence a weak association between variables. In spite of this weakness, the significance of the correlations indicates that albedo changes are triggering a decrease in RH, as well as in Tmax and Tmin, although this effect is higher in Tmin, giving rise to a DTR increase.
Mann-Whitney U test revealed significant differences (p<0.001) between 2014 and 2021 values for the four climatic variables analyzed. However, it should be considered that in this case, we are comparing weather statistics of two individual years, thus, these differences may be partially due to the inter-annual variability of climate. Nevertheless, it is interesting to note that the regional average relative humidity in 2021 was lower than that of 2014, even though in 2021 the accumulated annual precipitation (984 mm) was 23% higher than that of 2014 (798 mm) (Figure 6).
Table 5 shows that most of the monthly and annual DTR values of 2021 differ statistically (p<0.01; Mann-Whitney U Test) from those of 2014. By 2021 DTR increased in January, May, September, October, November, and December, while a DTR decrease was observed for February, March, April, July, and August. The summary of these monthly effects yielded an annual DTR increment of +0.43°C.
4. Discussion
In the map of the spatial distribution of land cover types, it is observed that, in general, Annual Agriculture has a presence close to Coniferous forest, which indicates that the fragmentation of this kind of forest is mainly due to the expansion of the agricultural frontier. This is a common pattern of land use change, which has been reported by other researchers in different parts of the world [11,12]. This type of land use change is one of the greatest impacts on surface albedo [31] and one of the most common causes of local/regional climate change [32].
The albedo calculation for each land cover in Tapalpa showed a majority trend of increasing albedo for the year 2021. Seven land covers showed a significant (p<0.05) positive albedo difference α2021-α2014, including the three with the largest territorial coverage (88.44% of the Tapalpa area). In contrast, four other land covers also showed a significant (p<0.05) but negative albedo change, this is, a decrease in albedo value; however, the sum in hectares of these four land covers represents only 2.77% of the territory of Tapalpa.
The situation exposed above enables us to explain why on balance the municipality of Tapalpa increased significantly (p<0.05) its surface albedo by the year 2021. The deforestation process that Tapalpa has experienced during the last years can explain this increment in albedo [8,11,12]. In fact, the results from working with high-resolution images in this research, revealed 38 cases of land cover change between 2014 and 2021, affecting a total of 658.07 ha, including 345.25 ha (52.46%) converted from Coniferous forest to agricultural lands, yielding an average albedo increase of +4.23% for the Coniferous forest land cover. It denotes the high impact that this type of land cover change has on radiation/climate variables, as reported previously [3,4,31,32]. Other similar cases of land-use change were the conversion from Oak and Gallery Forest to Grassland, and from Oak and Gallery Forest to Annual Agriculture. The differences resulting in albedo change for these three forest land covers can be explained considering that structure and species conforming to any type of vegetation, determine the albedo value of the natural coverages [33].
Only six of the 38 cases of land cover change resulted in decreasing albedo: one from Annual Agriculture to Perennial Agriculture, one from Annual Agriculture to Irrigation Agriculture, two from Perennial Agriculture (trees < 1 year old) to Perennial Agriculture (trees > 7 years old), and two from Annual Agriculture to Sheltered Agriculture. The cases of decreasing albedo, imply conversion to Perennial Agriculture since the establishment and growth of avocado orchards; the effect of reducing albedo by orchards has been reported previously [34,35,36]. The reduction of albedo when changing from Annual Agriculture to Sheltered Agriculture can be explained by considering that there are materials used in greenhouse structures capable of absorbing large amounts of solar radiation, but in counterpart, increasing the heat island effect [33]. In the case of a change from Annual Agriculture to Irrigation Agriculture, the decrease in albedo is explained by the increase in soil moisture and the constant greening of the cover [37,38].
Conversion of Coniferous Forest and Oak and Gallery Woodlands into Annual Agriculture, Perennial Agriculture, or Grassland, always yielded an albedo increment, whilst the conversion of Annual Agriculture to irrigation agriculture or Perennial Agriculture triggered a decrease in albedo, and finally, the pass from Grassland or Annual Agriculture to Sheltered Agriculture caused albedo increase or decrease, depending on the greenhouse covers materials. Thus, reducing deforestation of Coniferous Forest and Oak and Gallery Woodlands, the conversion of Annual Agriculture or Grasslands into Perennial Agriculture, and the adequate selection of greenhouse covers for new protected agriculture systems could help to mitigate regional climate change.
According to the negative and significant correlation found between albedo changes and the climatic variables variation from 2014 to 2021, it can be deduced that changes in the surface albedo that have occurred during this period, are apparently associated with a decrease in relative humidity and maximum and minimum temperatures. Since the decrease in the minimum temperature is greater than that of the maximum temperature, the DTR has also increased during the period 2014-2021. The possible explanation in this regard lies in the fact that the climatic effects of deforestation and albedo changes depend on the latitude where deforestation occurs, thus, tropical deforestation is generally found to warm the climate, whereas high-latitude deforestation is generally found to cool the climate [1,5,7,39,40]. In the case of Tapalpa, geographically it is considered a tropical region, but because of its altitude, it is taken as a temperate thermal zone (annual mean temperature between 12 and 18°C [14,15,41].
The annual DTR increase observed in Tapalpa, has been reported previously for regions such as México, Bolivia, Patagonia, Madagascar, Indonesia, and central Russia, with more than 2 °C since approximately the 1960s [42,43,44,45]. Conversely, five of the twelve months reported a decrease in DTR, a pattern that has also been reported for different regions, in the American continent [43,45] as well as in other continents [46,47]. The above denotes differentiated effects of the change in surface albedo.
5. Conclusions
The surface albedo of the municipality of Tapalpa increased between 2014 and 2021, as a result of deforestation events and changes in land use that occurred in that period, which mainly affected the forested area of the region. The magnitude of the albedo increase varies according to the type of land cover, but all land covers with the largest territorial extension experienced an albedo increment. Only some land covers with very low territorial representativeness, showed a decrease in albedo.
Among the land use change actions, the deforestation of the Coniferous Forest and the installation of protected agriculture systems are the events that cause a greater increase in surface albedo. Conversely, on previously impacted lands, the establishment of avocado orchards and irrigated crops, represented the type of land use change with the lowest increase, even with a decrease in albedo value.
The albedo increment detected for the 2021 scenario, was found to be associated with a decrease in relative humidity, and an increase in the diurnal temperature range, which seems to indicate a decline in the regional climate regulation capacity.
It is advisable to further analyze climate data for a broader time series to verify the links that are operating between the change in albedo and the change in regional weather patterns.
Reducing deforestation of Coniferous Forest and Oak and Gallery Woodlands, the conversion of Annual Agriculture or Grasslands into Perennial Agriculture, and the adequate selection of greenhouse covers for new protected agriculture systems could help to mitigate regional climate change.
Author Contributions
Conceptualization: J.A.R.C., and D.L.S.O.; Methodology: D.L.S.O., J.A.R.C., and R.F.V.G.; Software: D.L.S.O., and R.F.V.G; Validation: J.A.R.C.; Formal analysis, D.L.S.O., and J.A.R.C.; Investigation, D.L.S.O., J.A.R.C., R.F.V.G., and V.M.R.M.; Resources: R.F.V.G., and V.M.R.M.; Data curation: D.L.S.O., and R.F.V.G.; Writing—original draft preparation: D.L.S.O., J.A.R.C., and R.F.V.G.; writing—review and editing: D.L.S.O., and J.A.R.C.; Visualization: D.L.S.O.; Supervision: J.A.R.C.; Funding acquisition: D.L.S.O. All authors have read and agreed to the published version of the manuscript.
Funding
This work was supported by the University of Guadalajara and Consejo Nacional de Ciencia y Tecnología, México. The funders had no role in study design, data collection, and analysis, decision to publish, or preparation of the manuscript.
Institutional Review Board Statement
Not applicable.
Informed Consent Statement
Not applicable.
Data Availability Statement
Not applicable.
Conflicts of Interest
The authors declare no conflict of interest.
References
- Li, Y.; Liu, Y.; Bohrer, G.; Cai, Y.; Wilson, A.; Hu, T.; Zhao, K. Impacts of forest loss on local climate across the conterminous United States: Evidence from satellite time-series observations. Science of The Total Environment 2022, 802, 149651. [Google Scholar] [CrossRef] [PubMed]
- Vatani, L.; Hosseini, S. M.; Raeini S., M.; Alavi, S. J.; Shamsi, S. S.; Zohd Ghodsi, M. J. Effect of tree species on albedo in Iranian temperate forests: comparing conifers and broadleaf trees in two seasons. Journal of Solar Energy Research 2019, 4(3), 188–199. [Google Scholar] [CrossRef]
- Conte, L.; Renner, M.; Brando, P.; Oliveira dos Santos, C.; Silvério, D.; Kolle, O.; Kleidon, A. Effects of tropical deforestation on surface energy balance partitioning in southeastern Amazonia estimated from maximum convective power. Geophysical Research Letters 2019, 46(8), 4396–4403. [Google Scholar] [CrossRef]
- Gash, J.H.C.; Shuttleworth W.J. Tropical Deforestation: Albedo and the Surface-Energy Balance. In: Myers N. (eds) Tropical Forests and Climate. Springer, 1991, Dordrecht. [CrossRef]
- Davin, E. L.; Noblet-Ducoudré, N. Climatic Impact of Global-Scale Deforestation: Radiative versus Nonradiative Processes. Journal of Climate 2010, 23(1), 97–112. [Google Scholar] [CrossRef]
- Cuxart, J.; Boone, A. Evapotranspiration over Land from a Boundary-Layer Meteorology Perspective. Boundary-Layer Meteorology 2020, 177(2), 427–459. [Google Scholar] [CrossRef]
- Scott, C.E.; Monks, S.A.; Spracklen, D.V. Impact on short-lived climate forcers increases projected warming due to deforestation. Nat Commun 2018, 9, 157. [Google Scholar] [CrossRef]
- Zhang, Q.; Barnes, M.; Benson, M.; Burakowski, E.; Oishi, A. C.; Ouimette, A.; Novick, A. Reforestation and surface cooling in temperate zones: Mechanisms and implications. Global change biology 2020, 26(6), 3384–3401. [Google Scholar] [CrossRef]
- Comisión Nacional Forestal. Sistema Nacional de Monitoreo Forestal. Deforestación bruta en México. s.f. Available online: https://snmf.cnf.gob.mx/deforestacion/ (accessed on November 2021).
- Gobierno dle Estado de Jalisco, Información municipal, Municipio de Tapalpa. Available online: https://www.jalisco.gob.mx/es/jalisco/municipios/tapalpa (accessed on 12 October 2021).
- Macías, A.; Sevilla, Y. Naturaleza vulnerada: Cuatro décadas de agricultura industrializada de frutas y hortalizas en el sur de Jalisco, México (1980–2020). Entre Diversidades 2021, 8(1), 64–91. [Google Scholar] [CrossRef]
- Housni, F.; Cervantes, G.; Lares-Michel, M.; Juárez, H.; Carmona, C.; Nava, M. Land-use Change and Its Impact on Production and Consumption of Strawberry in Tapalpa, Jalisco, Mexico. Journal of Food Security 2017, 5(3), 58–65. [Google Scholar] [CrossRef]
- González, A.; Pérez, R.; Moreno, F.; Ramírez, G.; Rosales, S.; Cano, A.; Torres, M. Variabilidad de la temperatura local en bosques de coníferas por efectos de la deforestación. Revista Mexicana de Ciencias Forestales 2015, 6(31), 22–39. [Google Scholar] [CrossRef]
- Ruiz, C.J.A; Contreras, R.S.H.; García, R.G.E.; Villavicencio, G.R. Climas de Jalisco según el sistema Köppen-García con ajuste por vegetación potencial. Revista Mexicana de Ciencias Agrícolas, 2021, 12(5), 805-821.
- Ruiz, C.J.A.; Flores, L.H.E.; Regalado, R.J.R.; Ramírez, O.G. Estadísticas climáticas normales del estado de Jalisco. Libro Técnico Núm. 2. 2012. INIFAP-CIRPAC-Campo Experimental Centro Altos de Jalisco. Tepatitlán de Morelos, Jalisco. p.350. pp.276-277. Available online: https://www.researchgate.net/profile/Gabriela-Ojeda/publication/363085199_Estadisticas_Climaticas_Normales_del_Estado_de_Jalisco/links/630d813bacd814437fe8ee50/Estadisticas-Climaticas-Normales-del-Estado-de-Jalisco.pdf.
- Traversa, G.; Fugazza, D.; Senese, A.; Frezzotti, M. Landsat 8 OLI Broadband Albedo Validation in Antarctica and Greenland. Remote Sensing, 2021, 13(4), 799. MDPI AG. [CrossRef]
- Instituto Nacional de Estadística y Geográfica. Conjunto de datos vectoriales de la carta topográfica escala 1:250 000 por entidad federativa de Jalisco. Available online: https://www.inegi.org.mx/app/biblioteca/ficha.html?upc=889463770350 (accessed on December 2021).
- Instituto Nacional de Estadística y Geografía. Continuo de elevaciones mexicano (CEM). Available online: https://www.inegi.org.mx/app/geo2/elevacionesmex/ (accessed on December 2021).
- Comisión Nacional Forestal. Sistema de monitoreo satelital forestal (SAMOF). Mapas de cobertura de suelo. https://idefor.cnf.gob.mx/mviewer/samof (accessed on December 2021).
- Laboratorio de Sensores Remotos. Instituto Nacional de Investigaciones Forestales, Agrícolas y Pecuarias (INIFAP). Base de datos del Modelo Weather Research and Forecasting del municipio de Tapalpa, Jalisco. (provided in September 2022).
- Camargo-Roa, E.; Pacheco, C.; López, R. Evaluación de métodos de corrección atmosférica y sombreado topográfico en imagen Landsat 8 OLI sobre un área montañosa semiárida. UD y la geomatica 2021, (16). [Google Scholar] [CrossRef]
- Riaño, D.; Chuvieco, E.; Salas, J.; Aguado, I. Assessment of different topographic corrections in Landsat-TM data for mapping vegetation types. IEEE Transactions on geoscience and remote sensing 2003, 41(5), 1056–1061. [Google Scholar] [CrossRef]
- Oliveria, T.; Rangel, T.; Amori, L.; Carlos, D.; Souza, J. Surface albedo in different land-use and cover types in Amazon forest region. Revista Ambiente & Água. 2018, 13, 1. [Google Scholar] [CrossRef]
- Kim, K.; Lee, K. An Implementation of OTB Extension to Produce TOA and TOC Reflectance of LANDSAT-8 OLI Images and Its Product Verification Using RadCalNet RVUS Data. Korean Journal of Remote Sensing 2021, 37(3), 449–461. [Google Scholar] [CrossRef]
- Liang, S. Narrowband to broadband conversions of land surface albedo I: algorithms. Remote Sens. Environ. 2001, 76, 213–238. [Google Scholar] [CrossRef]
- Stone, D.; Weaver, A. Factors contributing to diurnal temperature range trends in twentieth and twenty-first century simulations of the CCCma coupled model. Climate Dynamics 2003, 20(5), 435–445. [Google Scholar] [CrossRef]
- Davy, R.; Esau, I.; Chernokulsky, A.; Outten, S.; Zilitinkevich, S. Diurnal asymmetry to the observed global warming. International Journal of Climatology 2017, 37(1), 79–93. [Google Scholar] [CrossRef]
- Mendes, H.; Dos Santos, A.; Lopes, S.; Polizel, L.; Silva, F.; Aravena, R. Comportamiento térmico de diferentes superficies urbanas durante un día cálido de verano. Revista Geográfica de Valparaíso 2019, 1(56). [Google Scholar] [CrossRef]
- Sánchez-Quiroga, L. Estimación e imputación de datos faltantes mediante métodos de interpolación espacial para precipitación mensual acumulada en el departamento de Antioquia durante el periodo 2014-2018. Universidad Santo Tomás. 2020, Available online http://hdl.handle.net/11634/22341.
- LaMorte, W. W. Evaluating Association Between Two Continuous Variables. Boston University School of Public Health. 2021, Available online: https://sphweb.bumc.bu.edu/otlt/MPH-Modules/PH717-QuantCore/PH717-Module9-Correlation-Regression/PH717-Module9-Correlation-Regression4.html (accessed on 03 June 2023).
- Hu, Y.; Hou, M.; Zhao, C.; Zhen, X.; Yao, L.; Xu, Y. Human-induced changes of surface albedo in Northern China from 1992-2012. International Journal of Applied Earth Observation and Geoinformation 2019, 79, 184–191. [Google Scholar] [CrossRef]
- Jiao, T.; Williams, A.; Ghimire, B. Global climate forcing from albedo change caused by large-scale deforestation and reforestation: quantification and attribution of geographic variation. Climatic Change. 2017, 142, 463–476. [Google Scholar] [CrossRef]
- Zhao, F.; Lan, X.; Li, W.; Zhu, W.; Li, T. Influence of Land Use Change on the Surface Albedo and Climate Change in the Qinling-Daba Mountains. Sustainability. 2021, 13, 10153. [Google Scholar] [CrossRef]
- Zhang, X.; Jiao, Z.; Zhao, C.; Qu, Y.; Liu, Q.; Zhang, H.; Tong, Y.; Wang, C.; Li, S.; Guo, J. Review of Land Surface Albedo: Variance Characteristics, Climate Effect and Management Strategy. Remote Sens. 2022, 14, 1382. [Google Scholar] [CrossRef]
- Law, B.; Hudiburg, T.; Berner, L.; Kent, J.; Buotte, P.; Harmon, M. Land use strategies to mitigate climate change in carbon dense temperate forests. Proceedings of the National Academy of Sciences 2018, 115(14), 3663–3668. [Google Scholar] [CrossRef] [PubMed]
- Sieber, P.; Ericsson, N.; Hammar, T.; Hansson, A. Albedo impacts of current agricultural land use: Crop-specific albedo from MODIS data and inclusion in LCA of crop production. Science of the Total Environment. 2022, 835, 155455. [Google Scholar] [CrossRef] [PubMed]
- Maina, F. , Kumar, S., Gangodagamage, C. Irrigation and warming drive the decreases in surface albedo over High Mountain Asia. Sci Rep. 2022, 12, 16163. [Google Scholar] [CrossRef] [PubMed]
- Zhang, C.; Ge, Q.; Dong, J.; Zhang, X.; Li, Y.; Han, S. Characterizing spatial, diurnal, and seasonal patterns of agricultural irrigation expansion-induced cooling in Northwest China from 2000 to 2020. Agricultural and Forest Meteorology 2023, 330, 109304. [Google Scholar] [CrossRef]
- Lindvall, J.; Svensson, G. The diurnal temperature range in the CMIP5 models. Climate Dynamics 2014, 44(1-2), 405–421. [Google Scholar] [CrossRef]
- Jackson, L. S.; Forster, P. M. An empirical study of geographic and seasonal variations in the diurnal temperature range. Journal of Climate. 2010, 23(12), 3205–3221. [Google Scholar] [CrossRef]
- Medina, G.G.; Ruiz, C.J.A. , Martínez, P.R. Los climas de México: una estratificación ambiental basada en el componente climático. Libro Técnico Núm. 1. 1998. Instituto Nacional de Investigaciones Forestales, Agrícolas y pecuarias, Centro de Investigaciones Regionales del Pacifico centro. Conexión Gráfica. INIFAP-CIRPAC Guadalajara, Jalisco, México.
- Englehart, J.; Douglas, V. Changing behavior in the diurnal range of surface air temperatures over Mexico. Geophys. Res. Lett. 2005, 32, L01701. [Google Scholar] [CrossRef]
- Jhajharia, D.; Singh, P. Trends in temperature, diurnal temperature range and sunshine duration in Northeast India. Int. J. Climatol. 2011, 31, 1353–1367. [Google Scholar] [CrossRef]
- Wang, G.; Dillon, E. Recent geographic convergence in diurnal and annual temperature cycling flattens global thermal profiles. Nat. Clim. Chang. 2014, 4, 988–992. [Google Scholar] [CrossRef]
- Briga, M.; Verhulst, S. Large diurnal temperature range increases bird sensitivity to climate change. Scientific Reports. 2015, 5, 16600. [Google Scholar] [CrossRef] [PubMed]
- Vose, S.; Easterling, R.; Gleason, B. Maximum and minimum temperature trends for the globe: An update through. Geophys. Res. Lett. 2004, 32(23), 0094–8276. [Google Scholar] [CrossRef]
- Sun, X.; Ren, G.; You, Q.; Ren, Y.; Xu, W.; Xue, X.; Zhan, Y.; Zhang, S.; Zhang, P. Global diurnal temperature range (DTR) changes since 1901. Clim Dyn. 2018, 3343–3356. [Google Scholar] [CrossRef]
Figure 2.
Spatial distribution of land covers for the Municipality of Tapalpa, Jalisco, México.
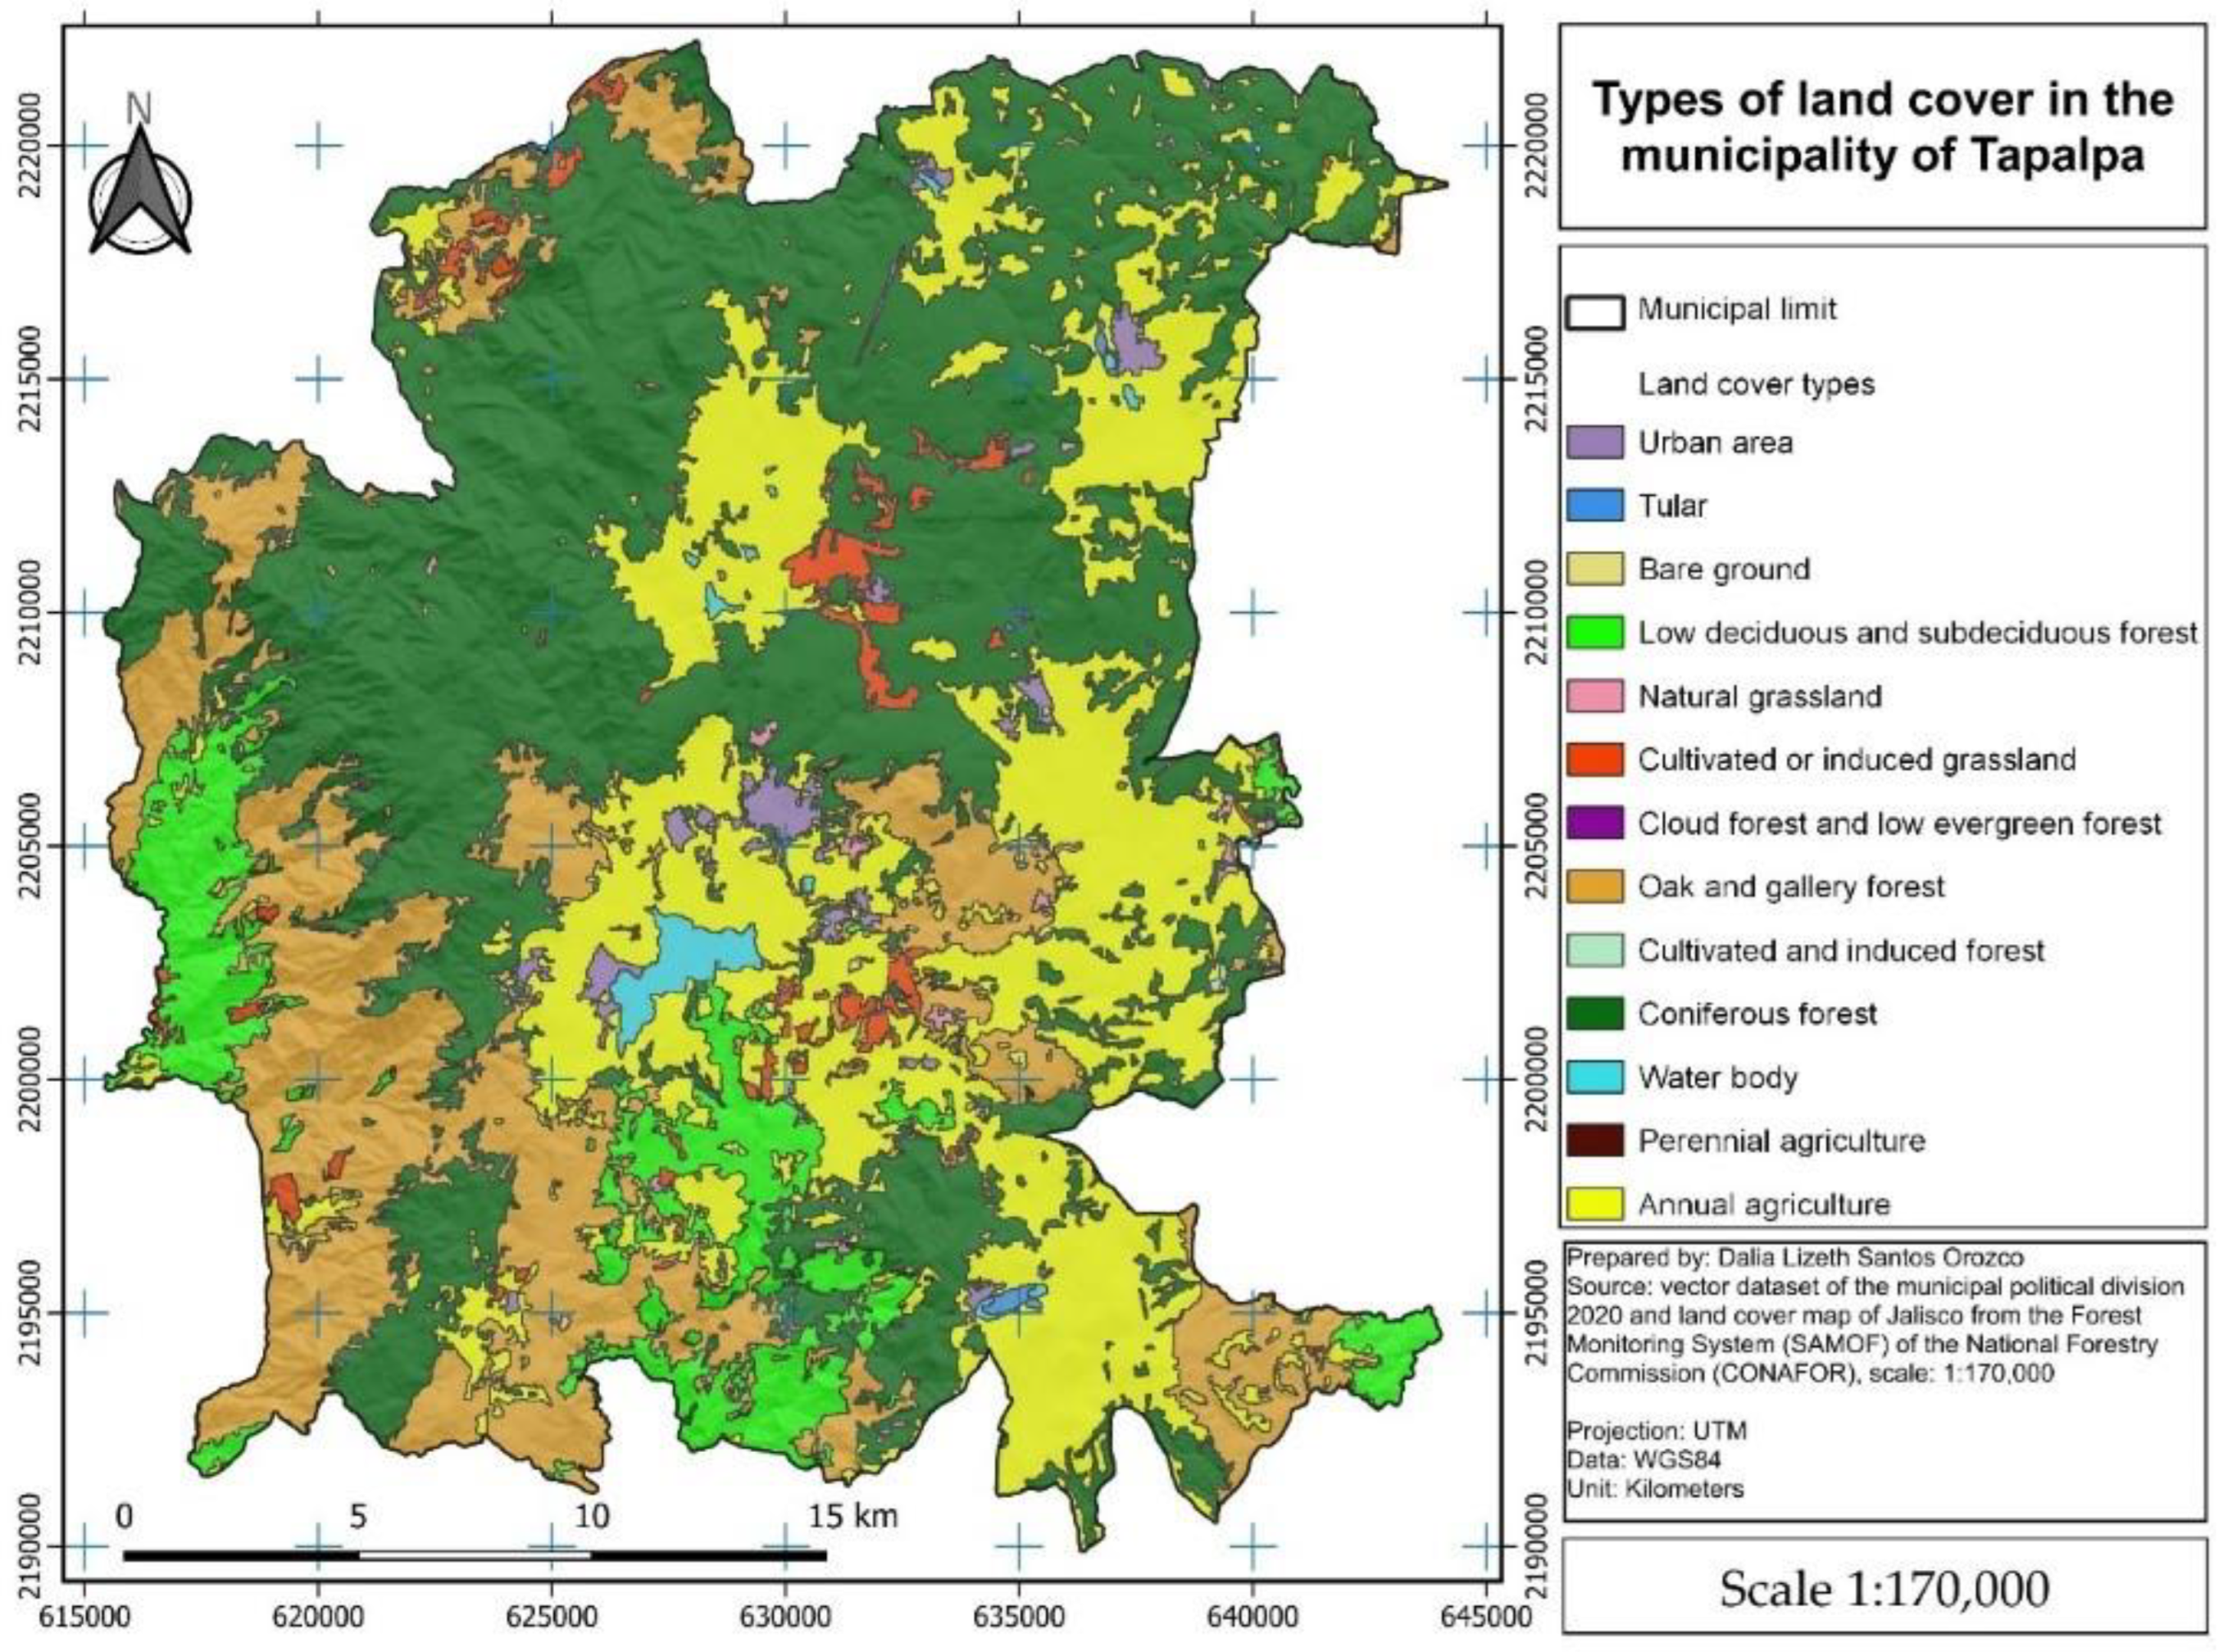
Figure 3.
2014 and 2021 average albedo values for each land cover of Tapalpa, Jalisco, México.
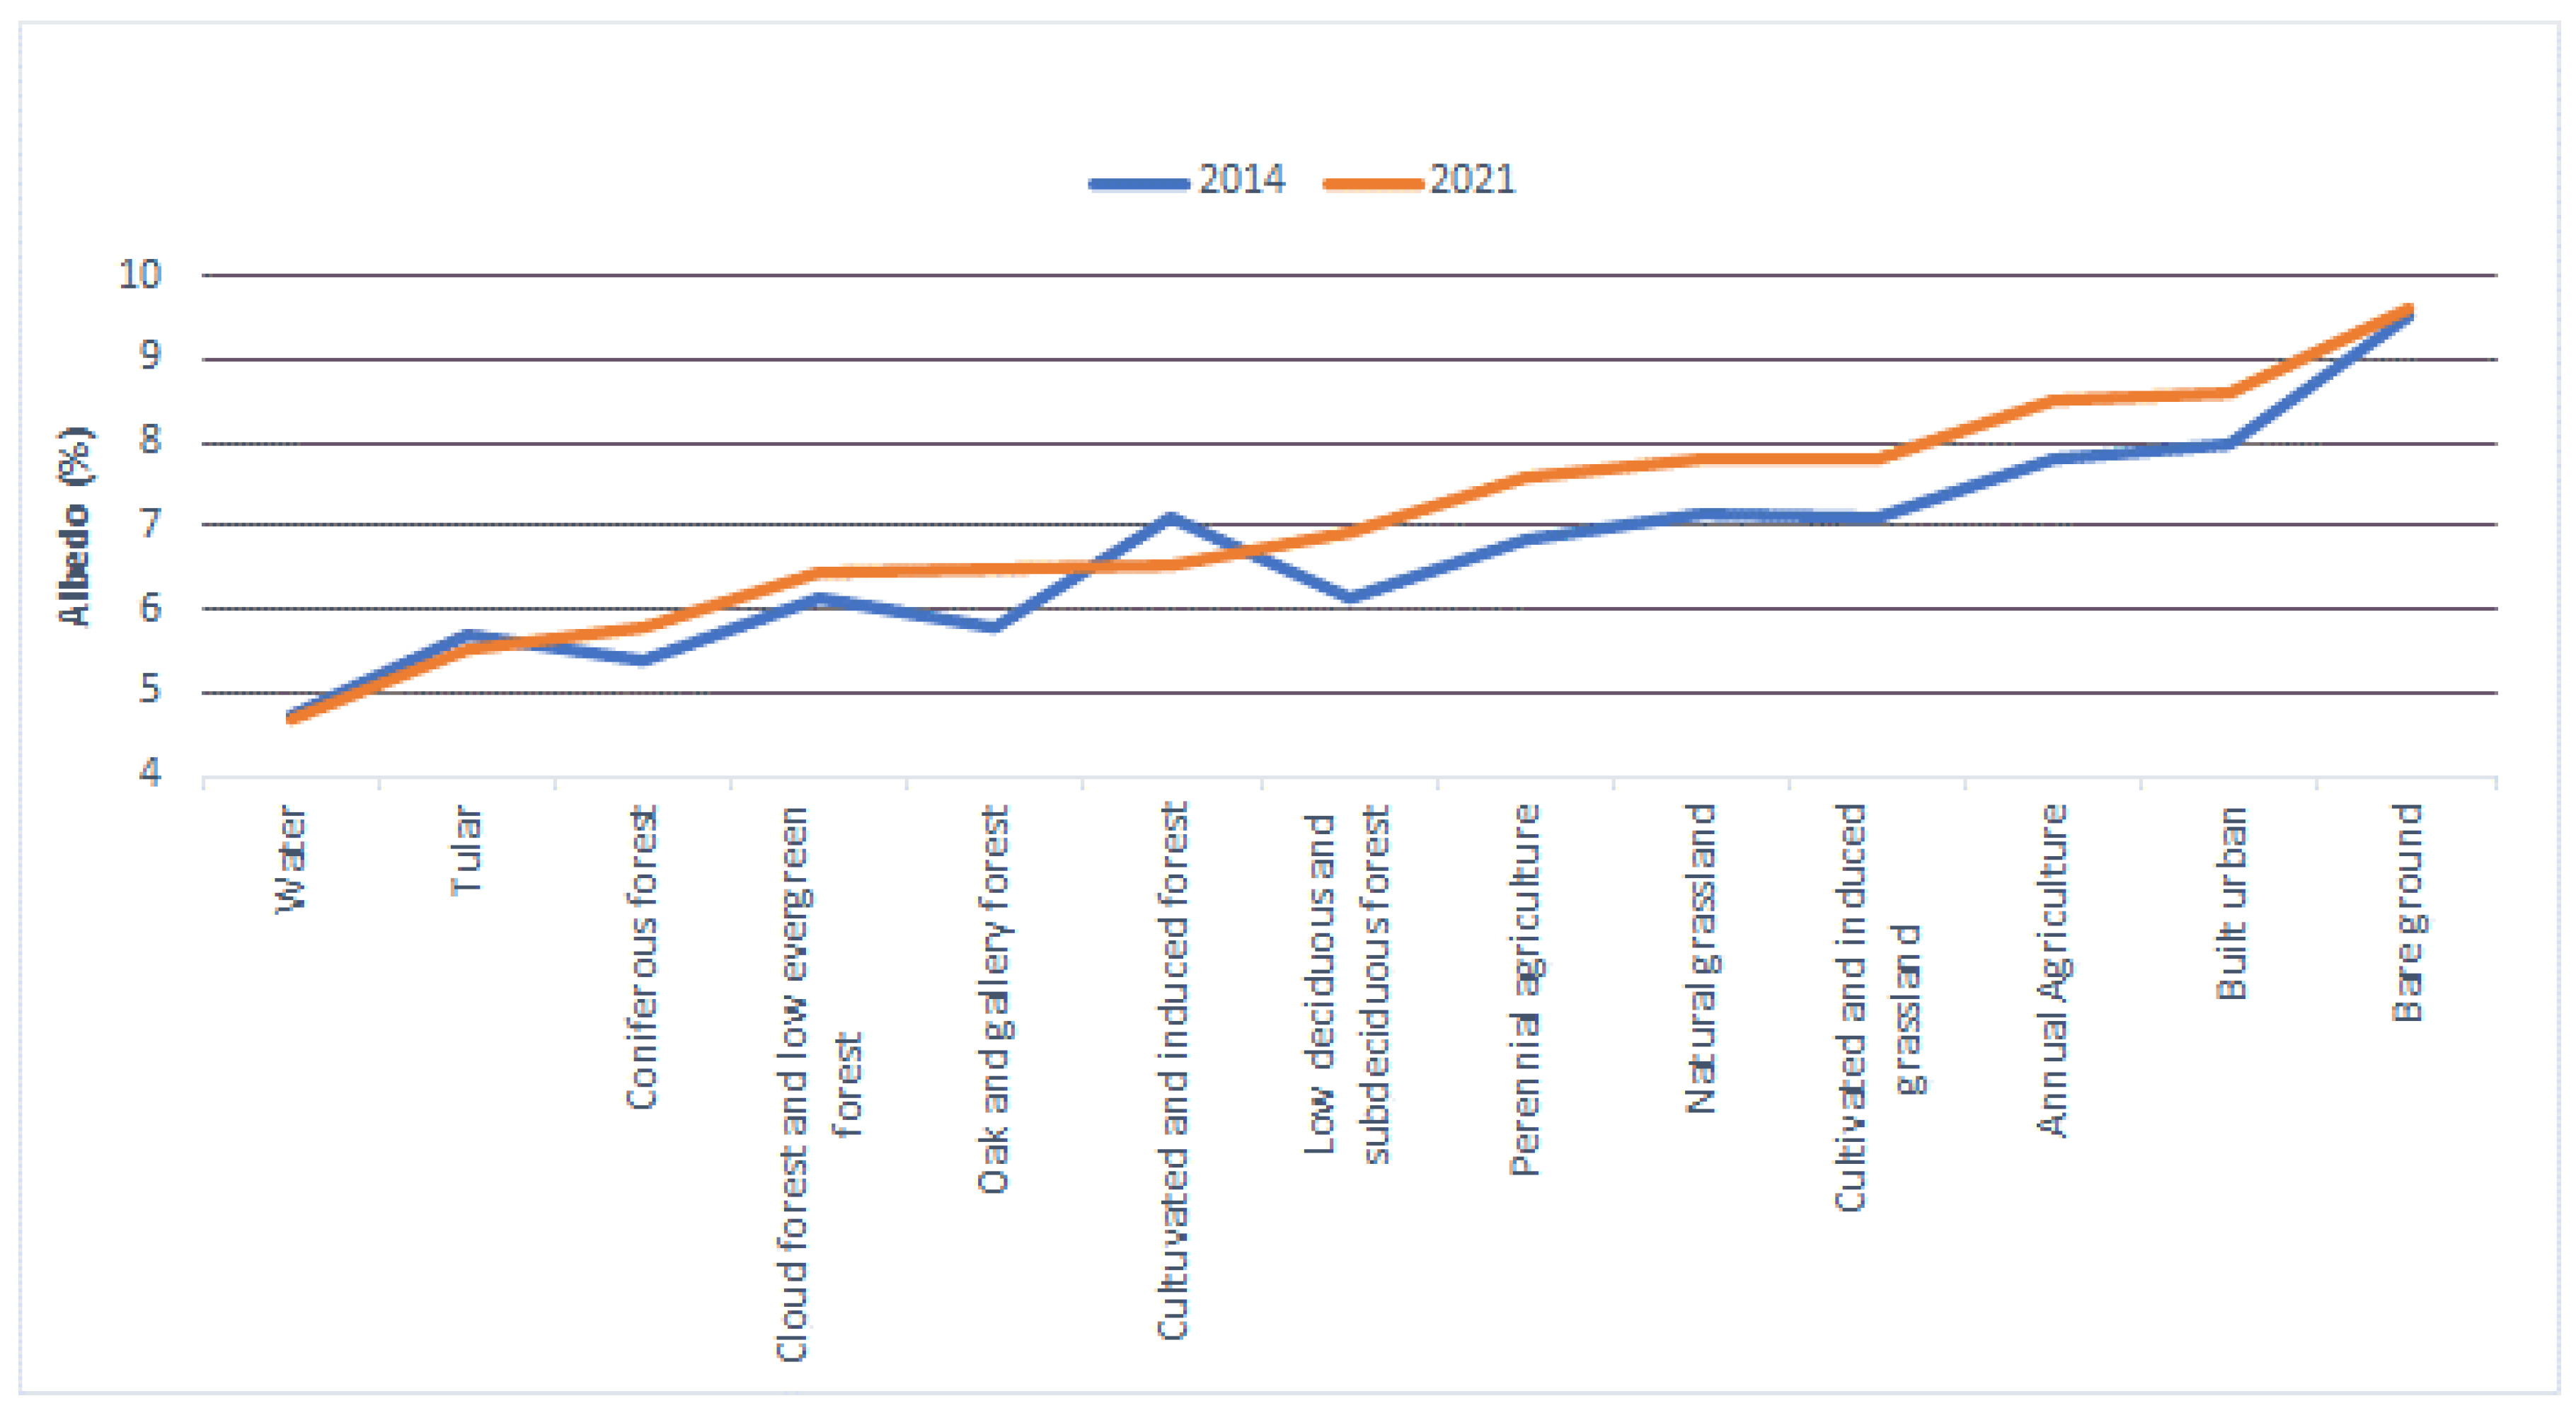
Figure 4.
Spatial distribution of several ranges of albedo values for years 2014 and 2021 in Tapalpa.
Figure 4.
Spatial distribution of several ranges of albedo values for years 2014 and 2021 in Tapalpa.
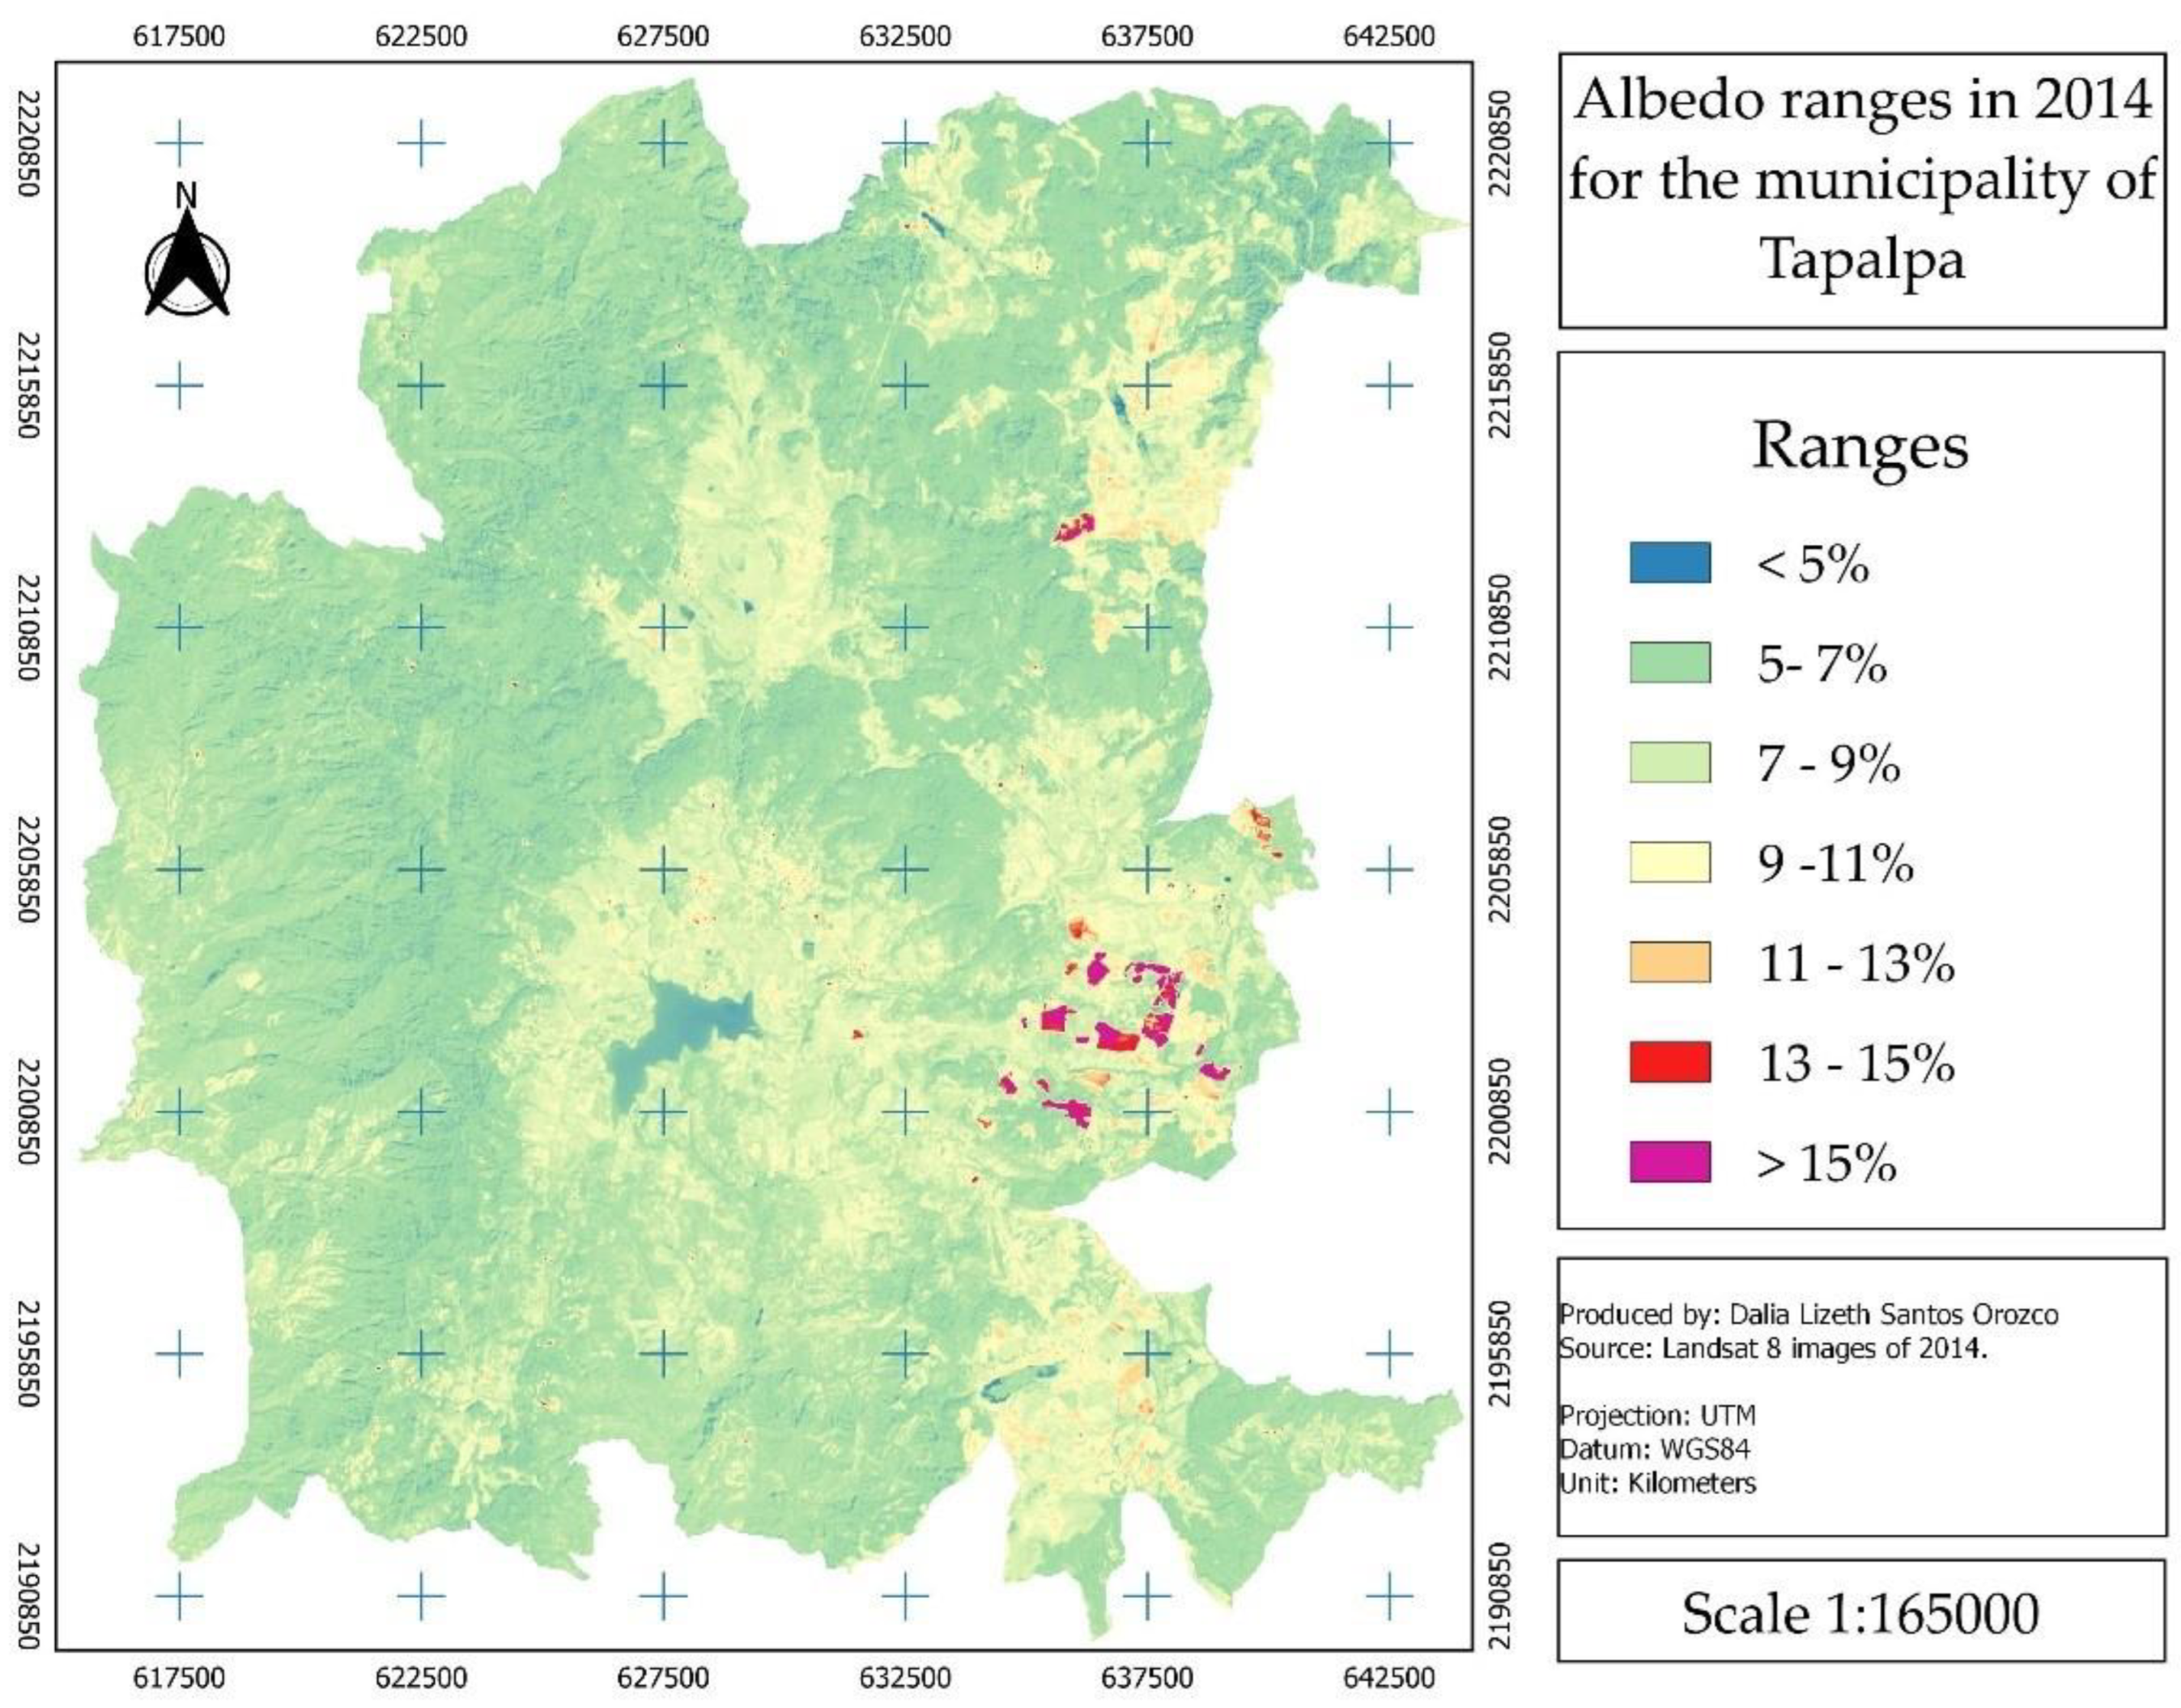
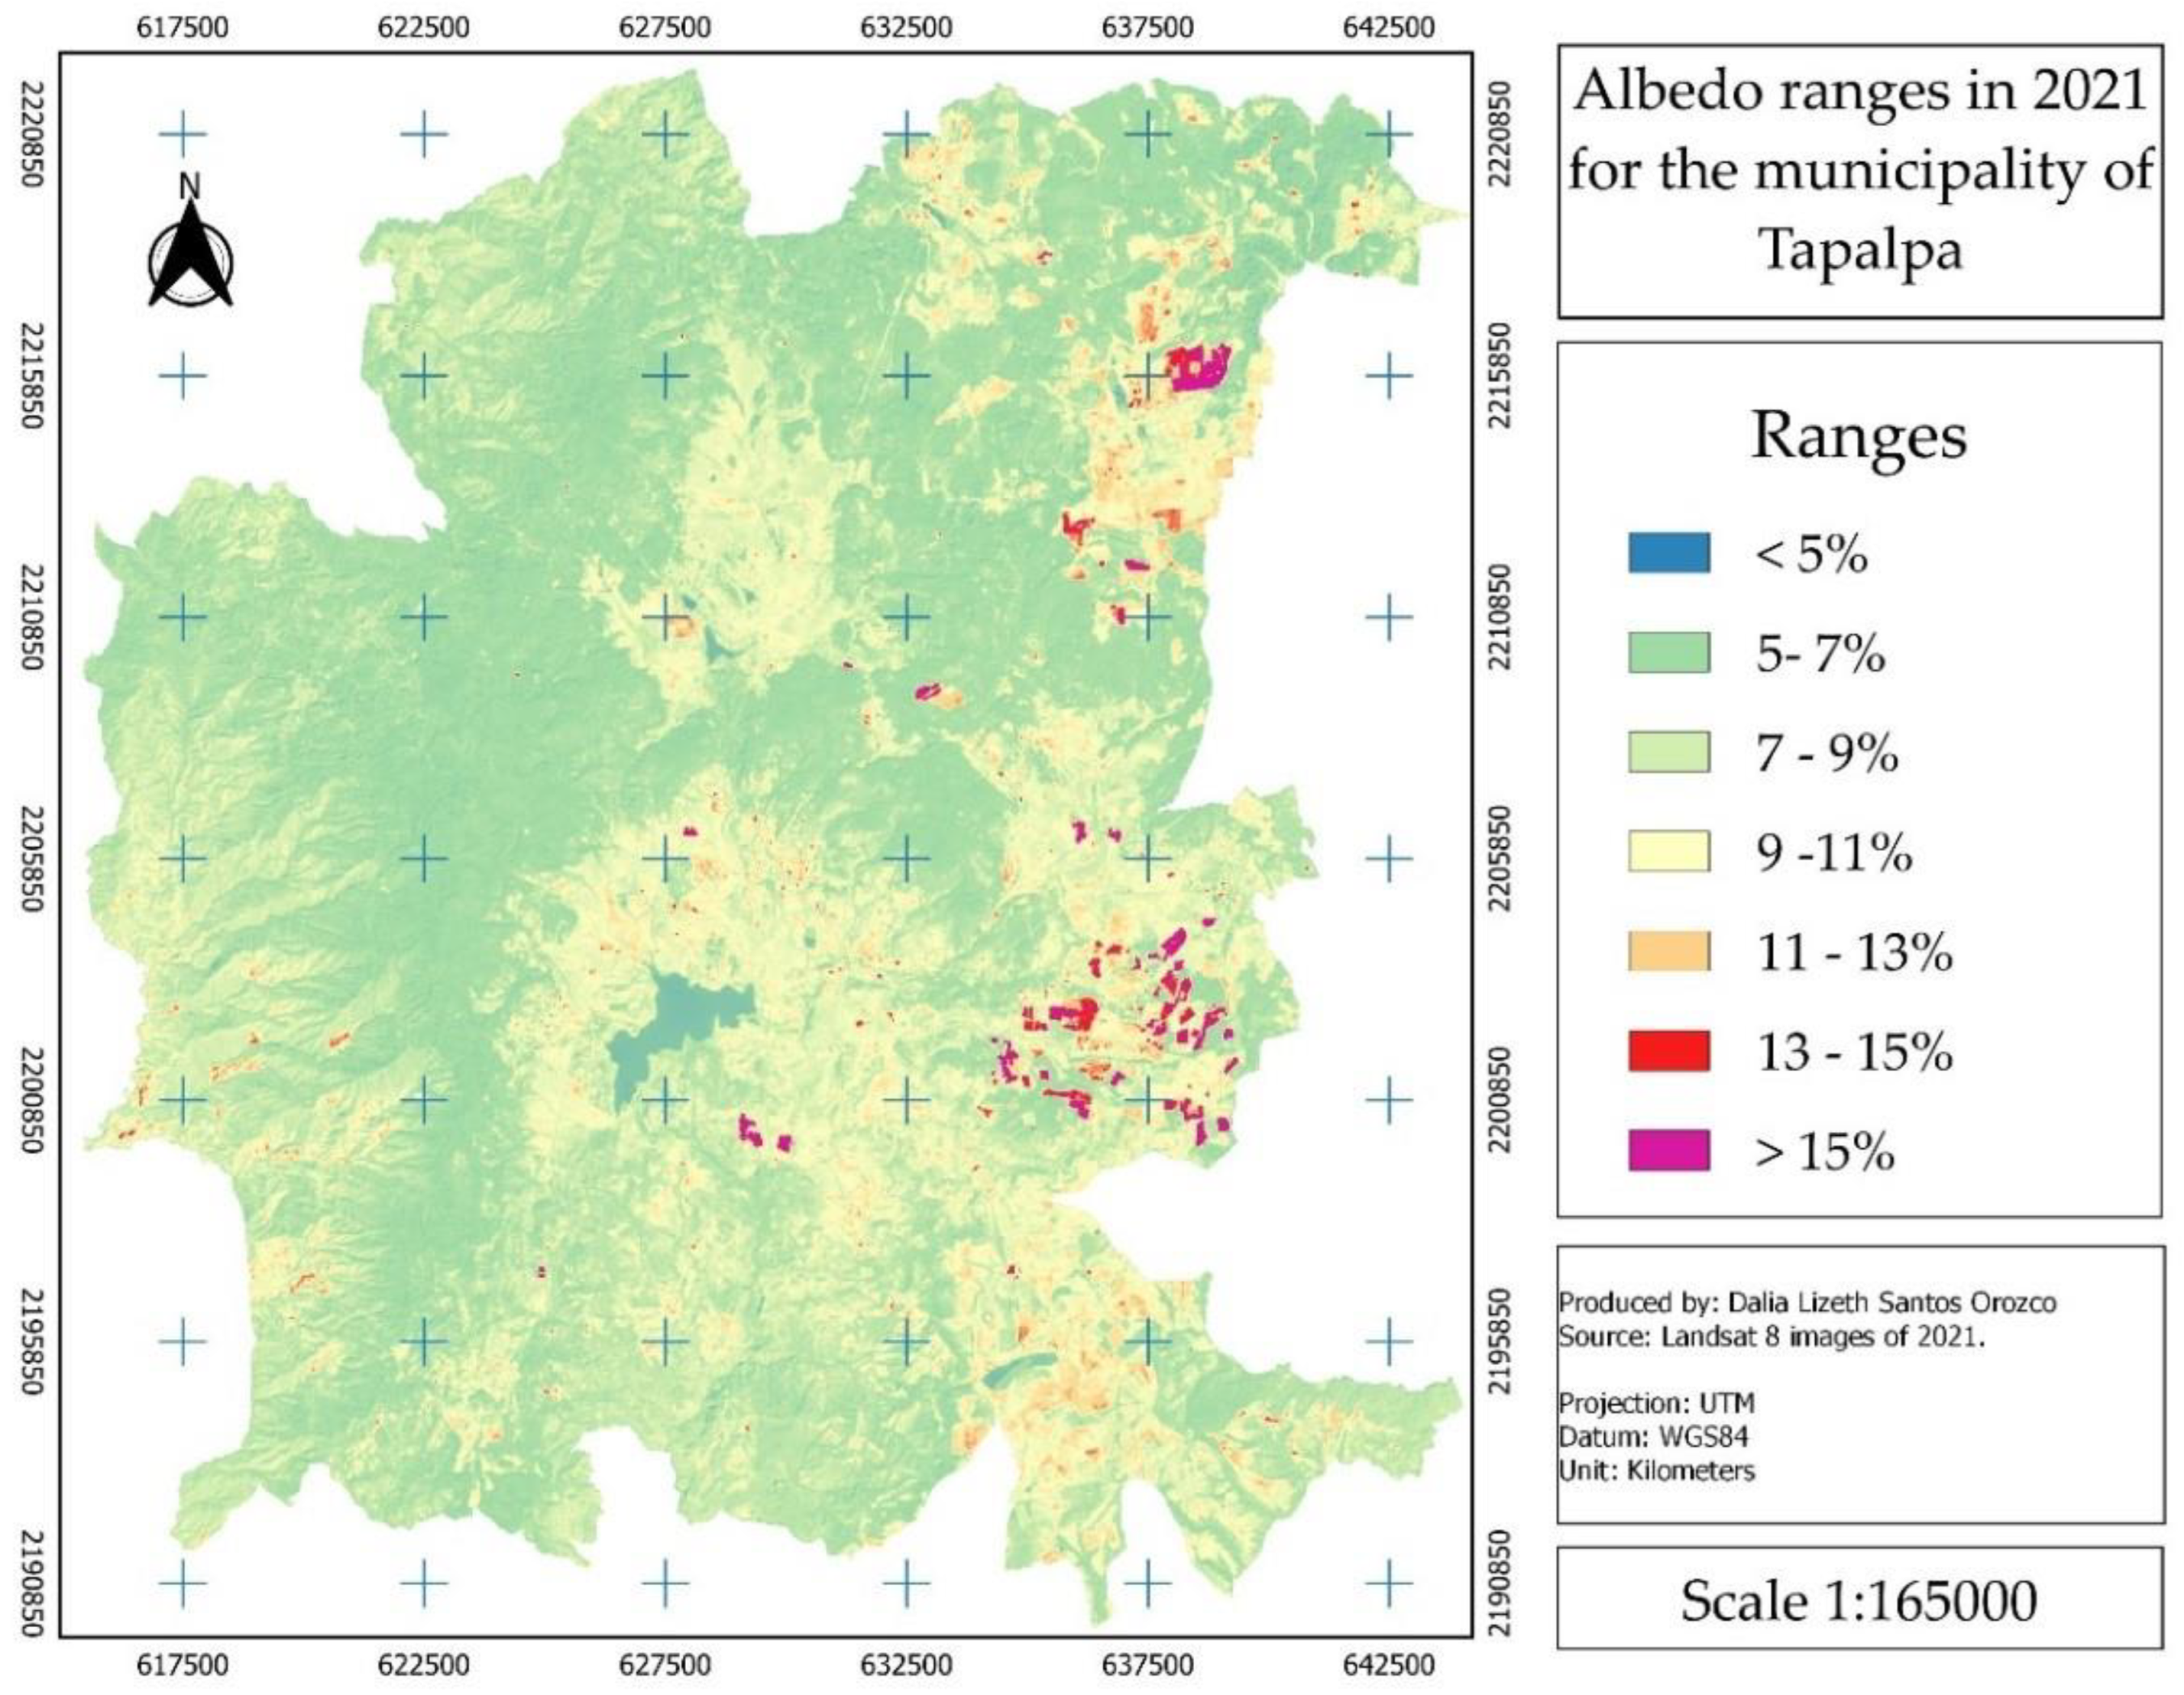
Figure 5.
Sites with changes in land cover from 2014 through 2021 in the municipality of Tapalpa, Jalisco, México: AA=Annual Agriculture, PA=Perennial agriculture, SA=Sheltered agriculture, IA=Irrigation agriculture, CF=Coniferous forest, G=Grassland, BG=Bare ground, OGF=Oak and gallery forest, SV=Secondary vegetation.
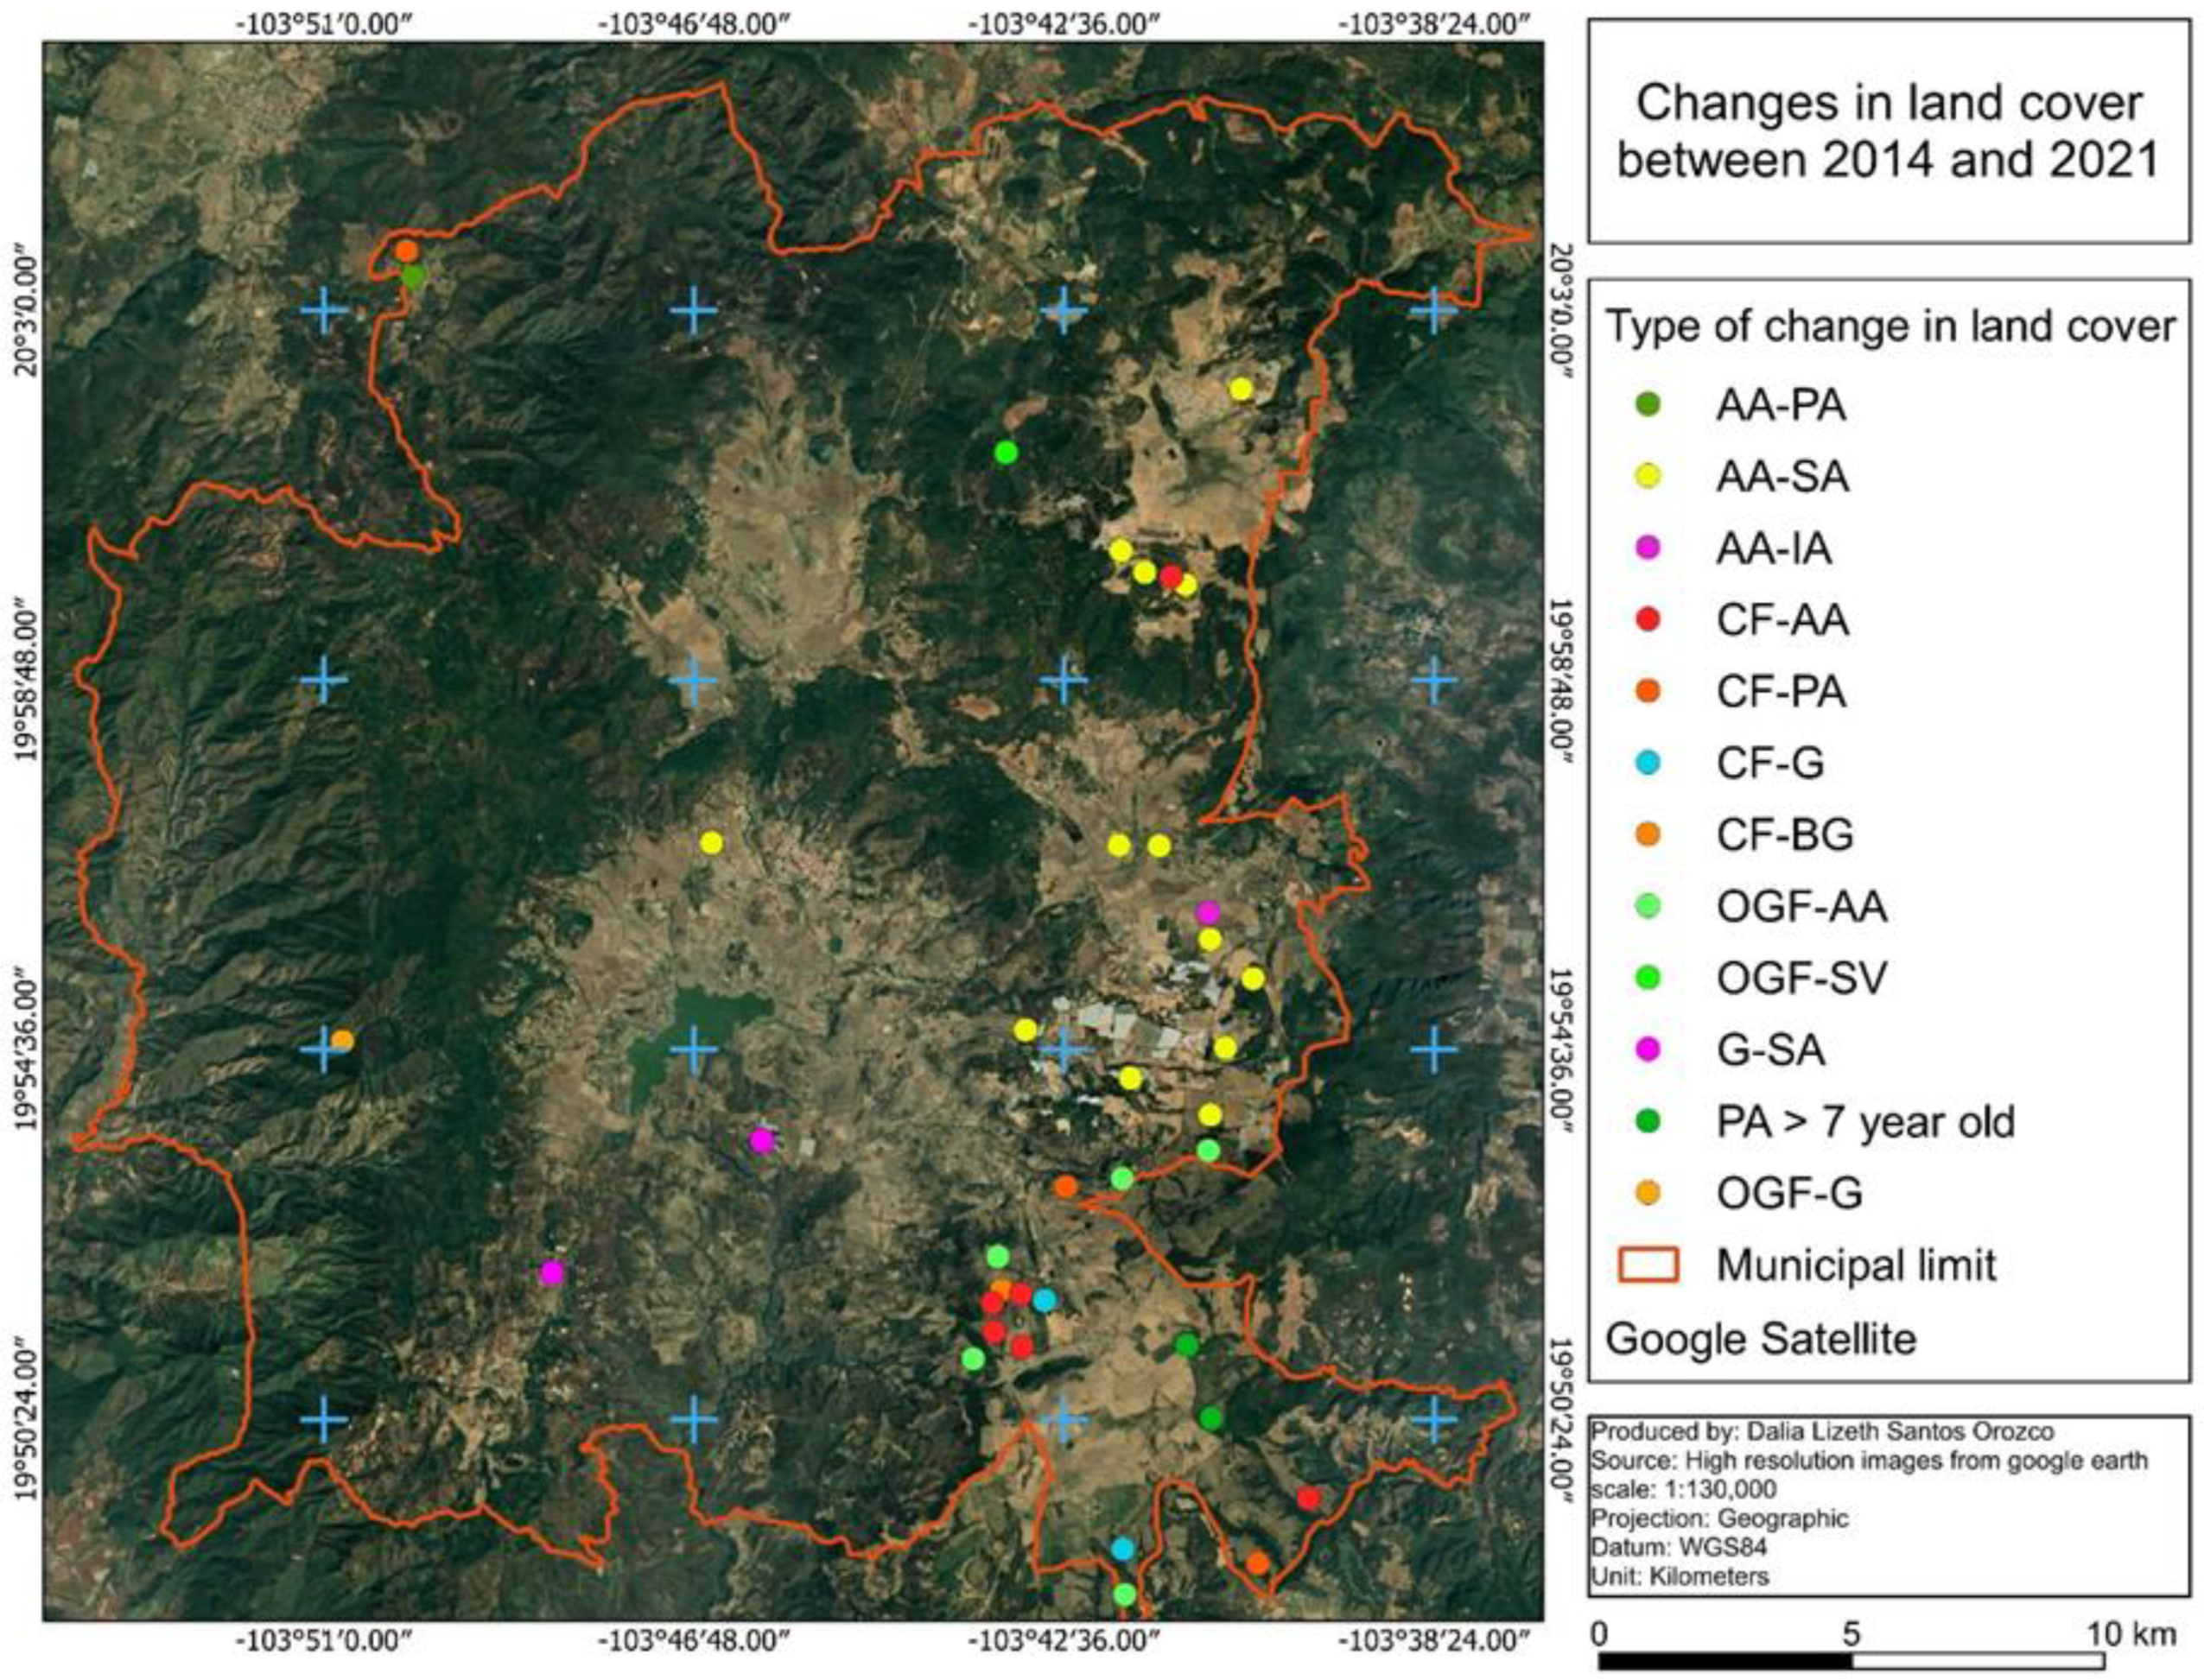
Figure 6.
Annual mean values for thermal variables (above) and hydric variables (bottom) during the years 2014 and 2021 in 633 sites of Tapalpa, Jalisco, México. Data according to WRF Model.
Figure 6.
Annual mean values for thermal variables (above) and hydric variables (bottom) during the years 2014 and 2021 in 633 sites of Tapalpa, Jalisco, México. Data according to WRF Model.
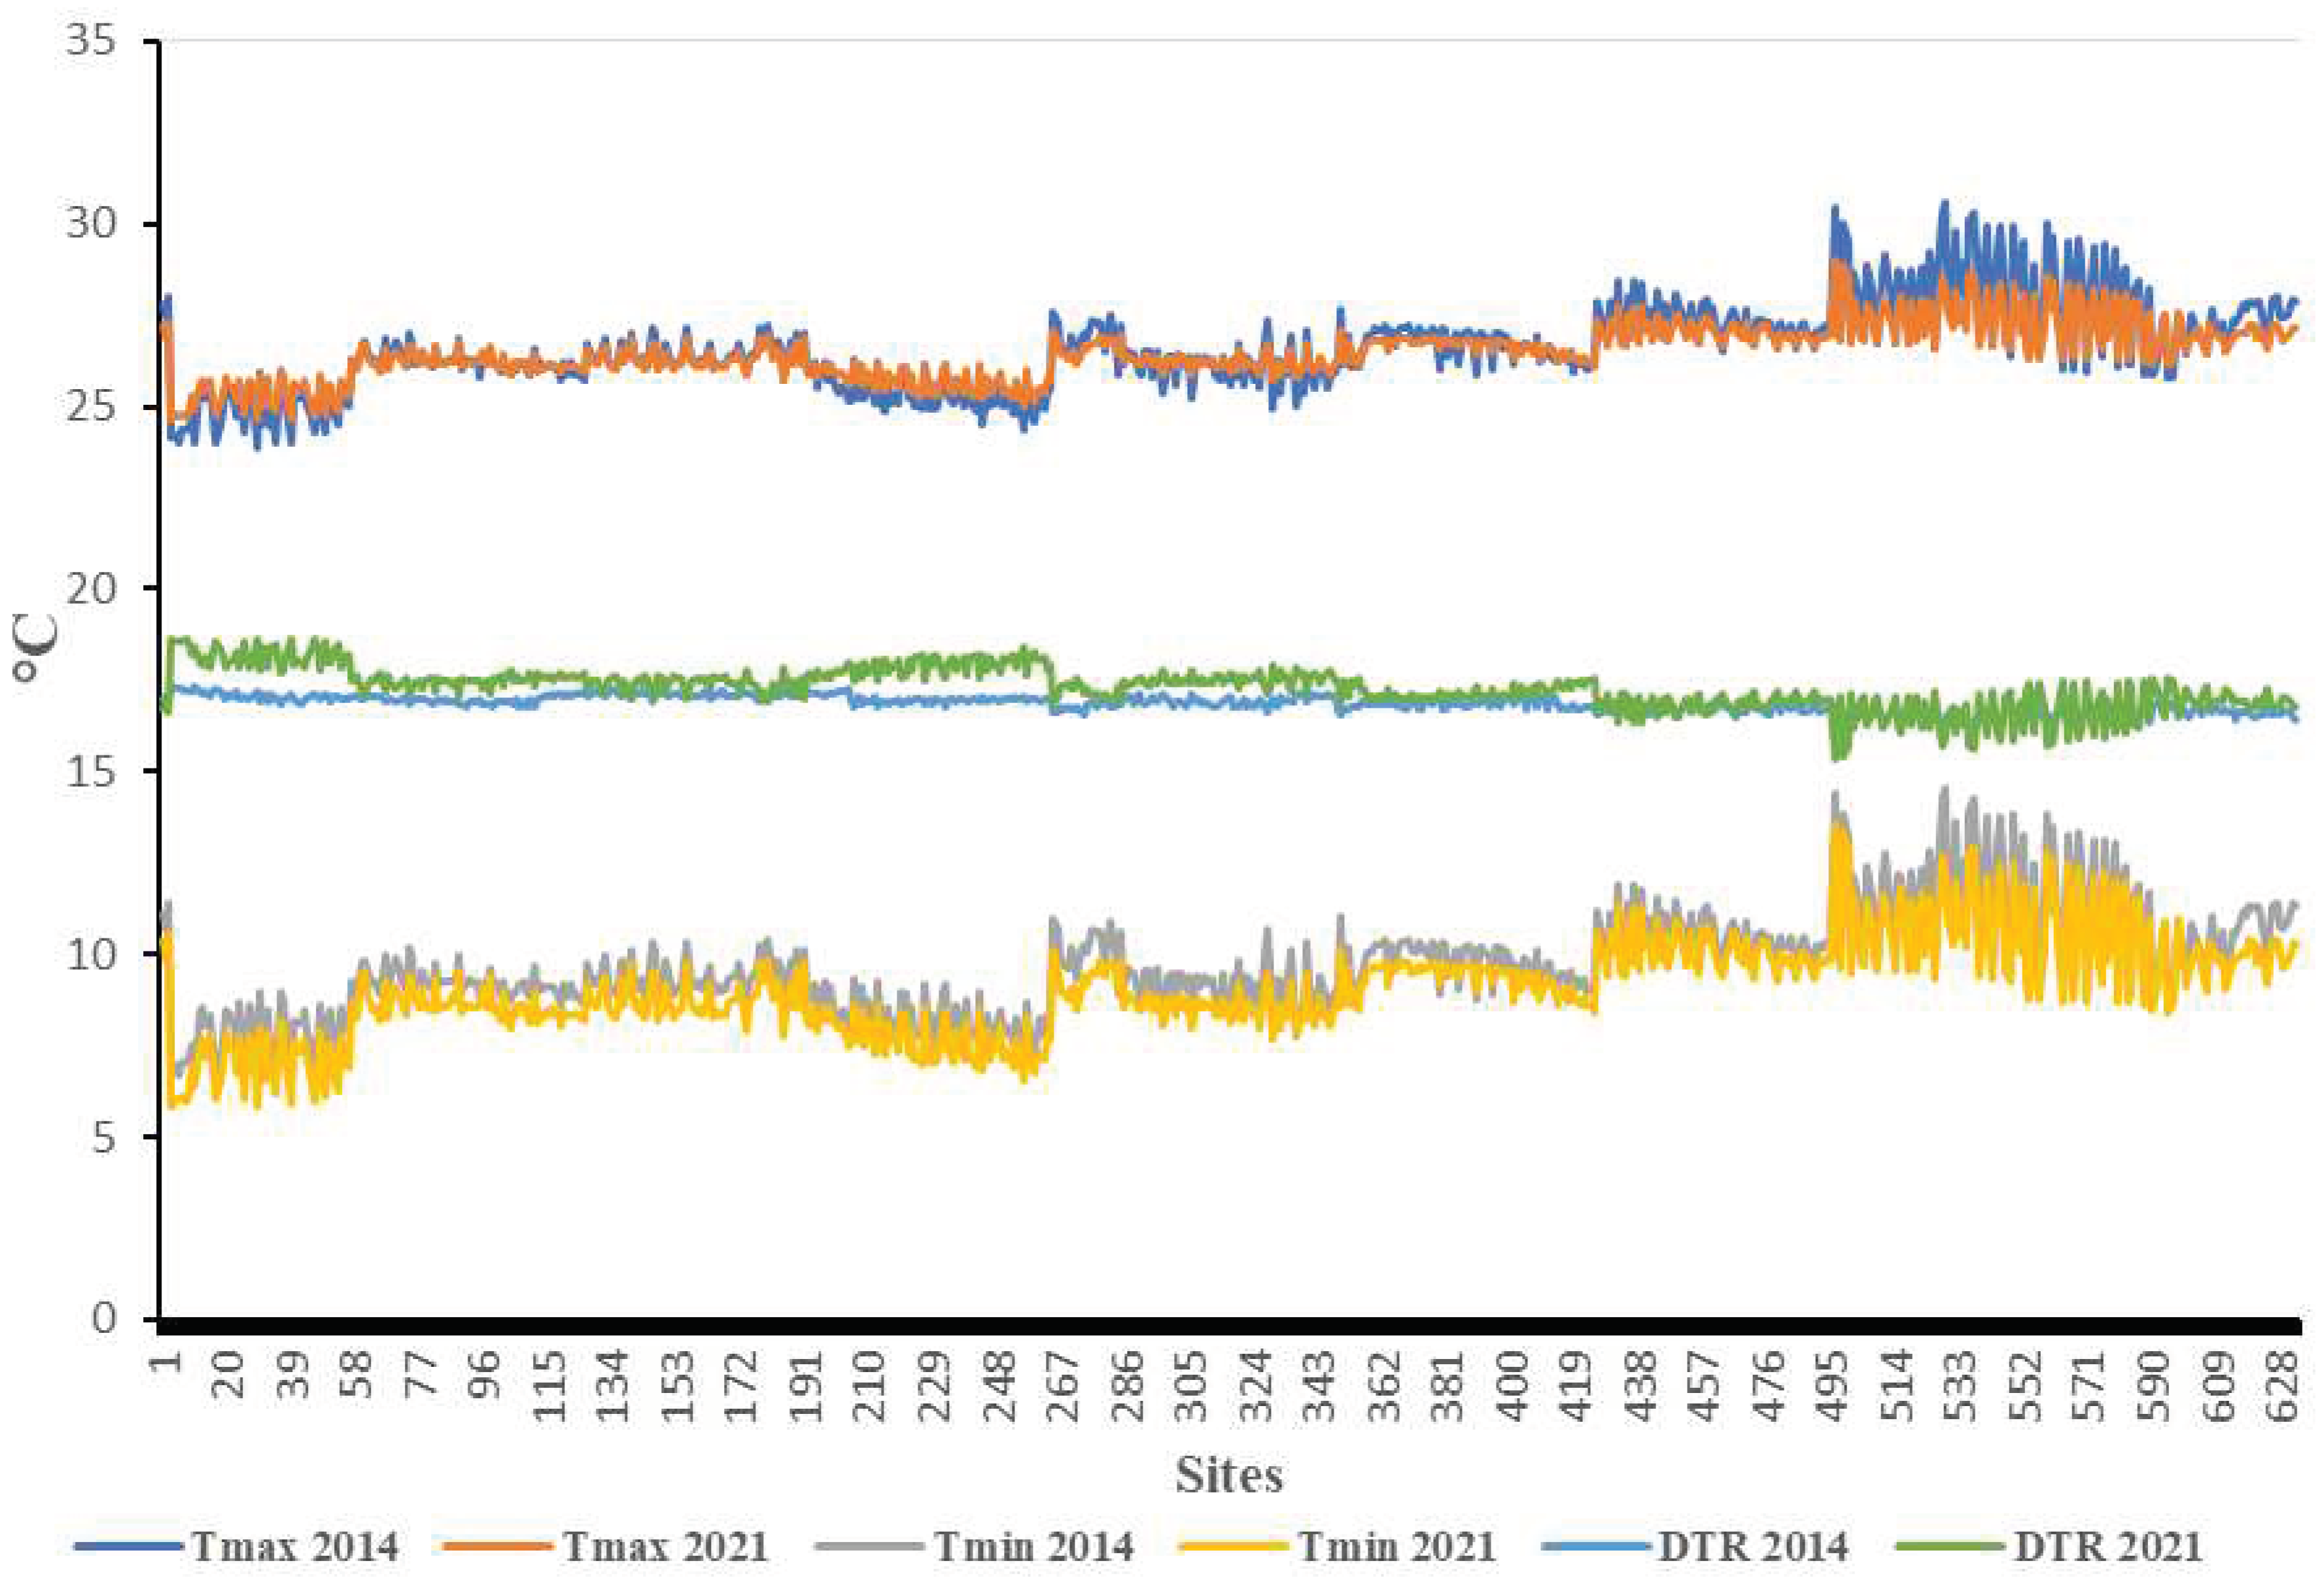
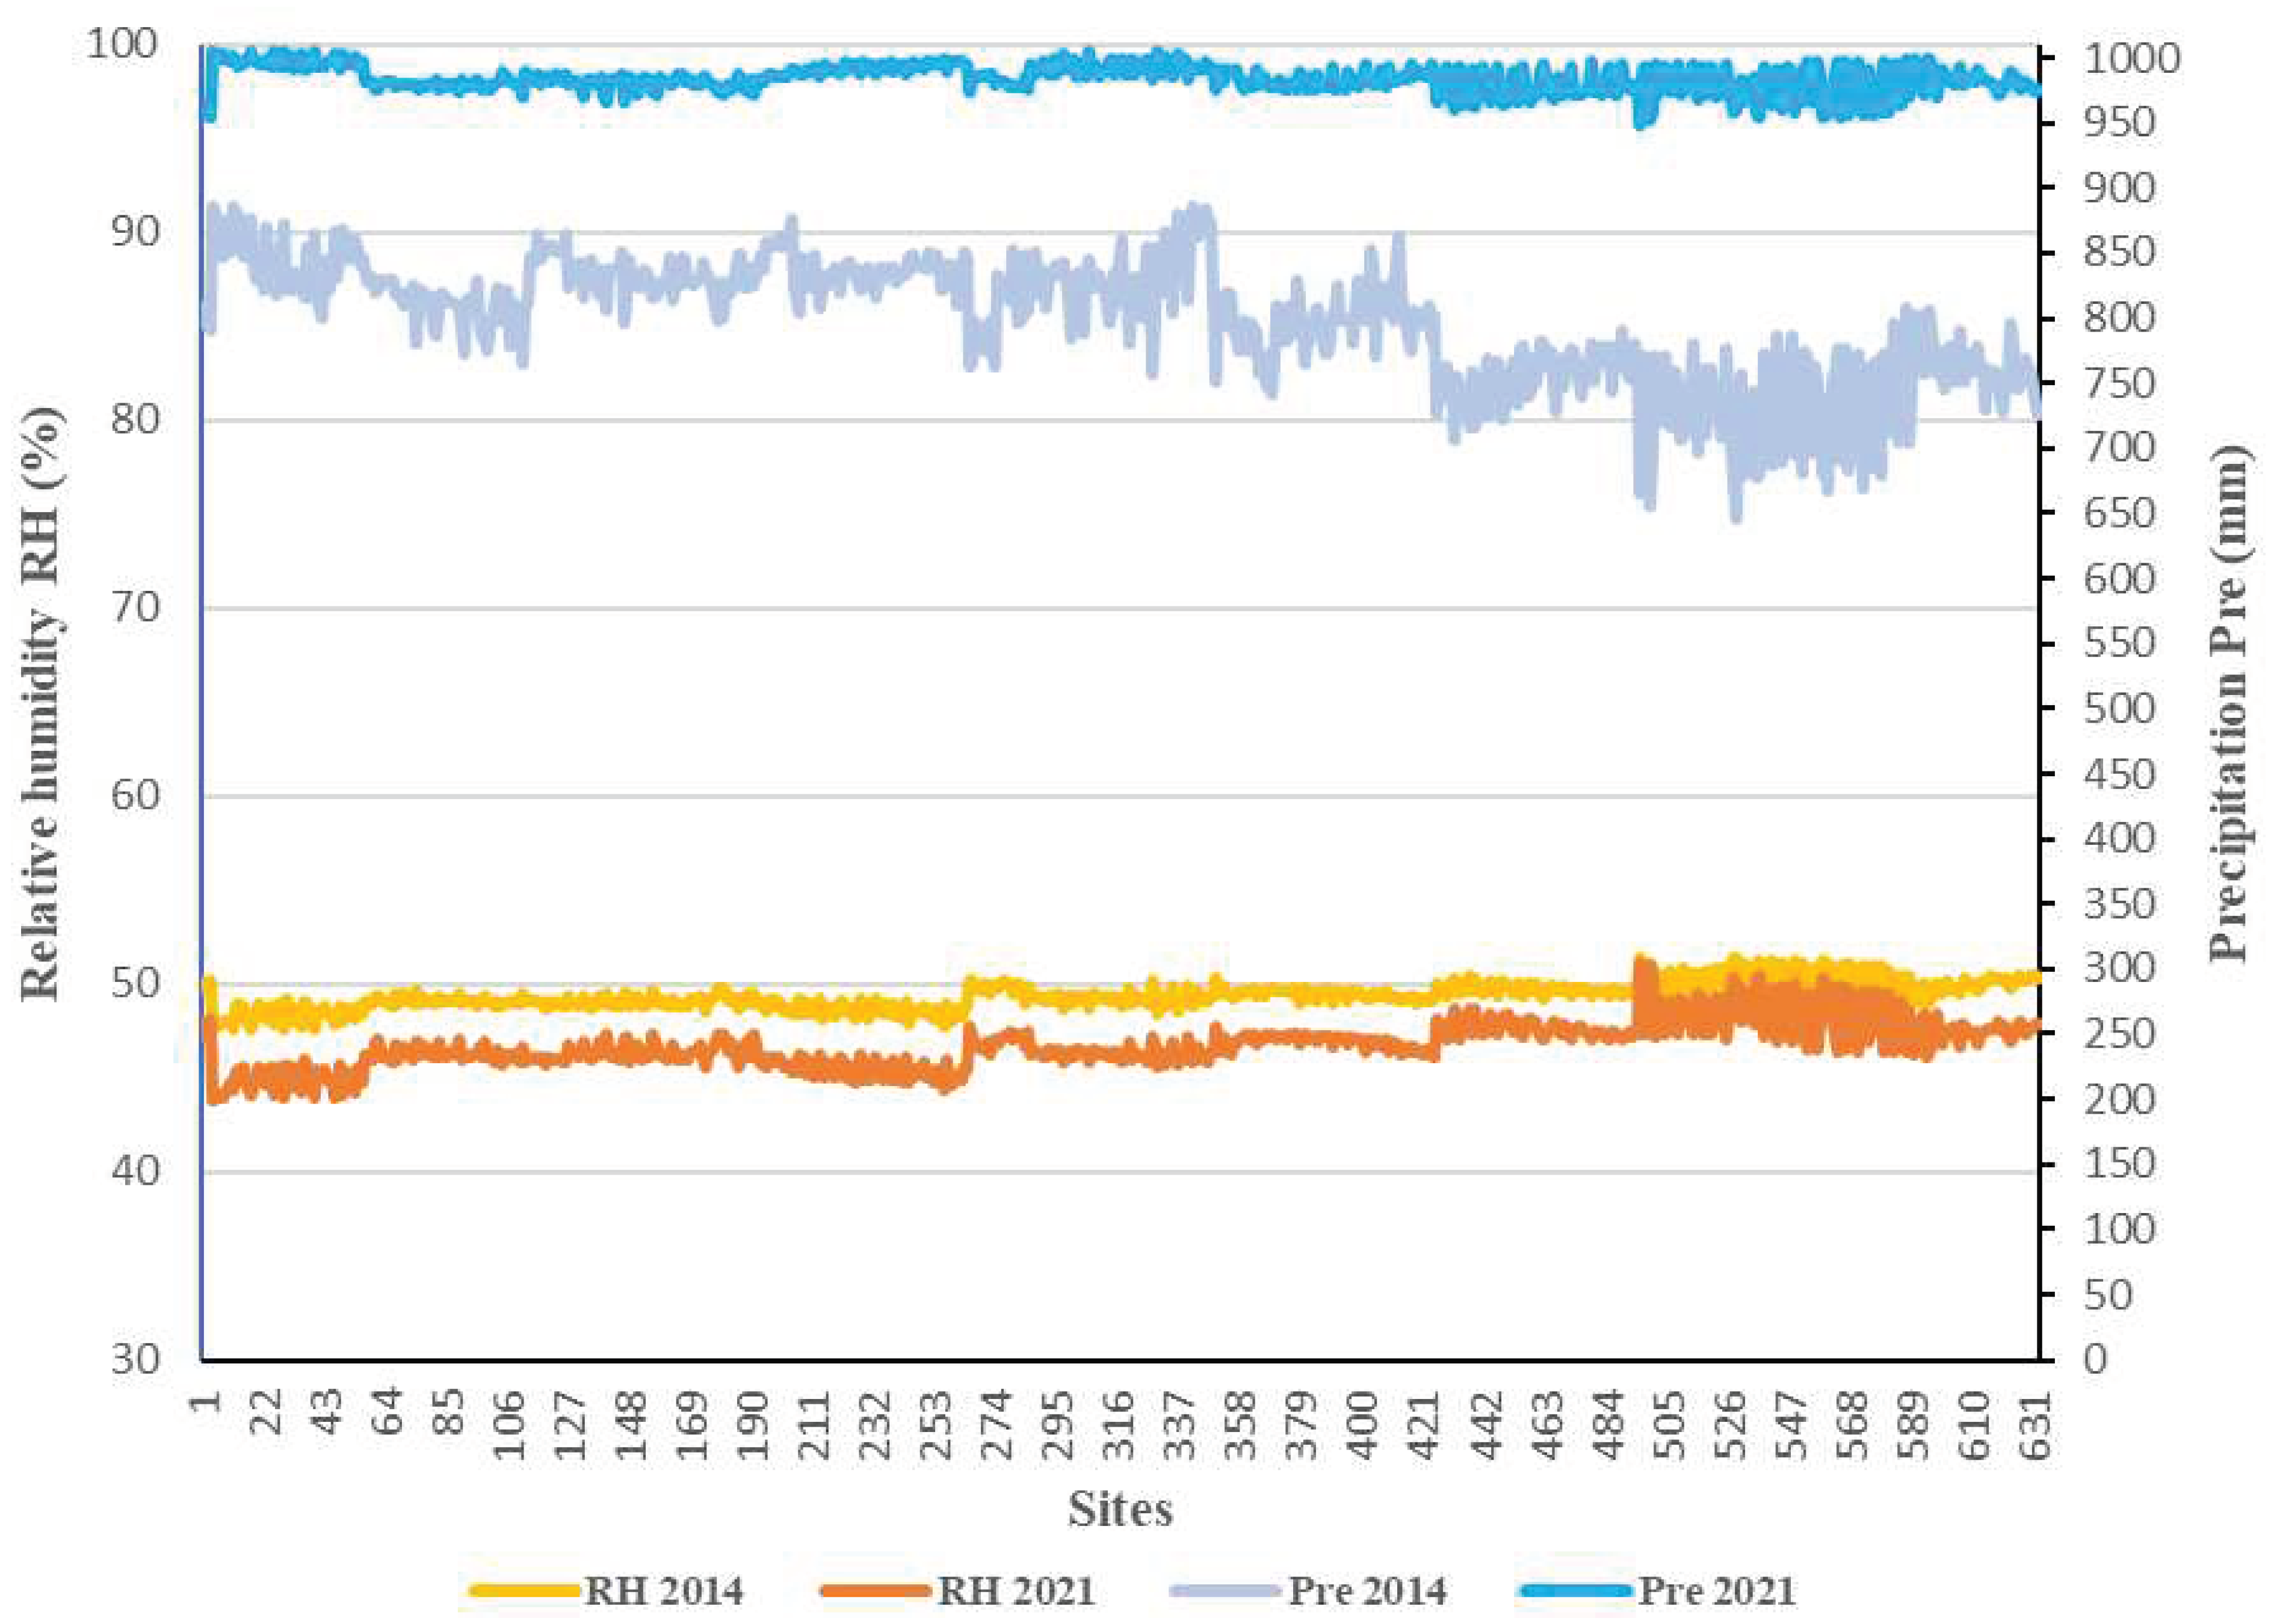

Table 1.
Types of land cover and their representativeness in terms of occupied area in the municipality of Tapalpa, Jalisco, México.
Table 1.
Types of land cover and their representativeness in terms of occupied area in the municipality of Tapalpa, Jalisco, México.
| Area | ||
|---|---|---|
| Land cover types | Hectares | % |
| Urban area (UA) | 773.09000 | 1.24 |
| Tular (TL) | 59.99484 | 0.09 |
| Bare ground (BG) | 32.5345 | 0.052 |
| Natural grassland (NGR) | 197.84891 | 0.31 |
| Low deciduous and sub-deciduous forest (LDF) | 4371.1777 | 7.05 |
| Cultivated or induced grassland (CGR) | 1214.52896 | 1.96 |
| Cloud forest and low evergreen forest (CEGF) | 1.35978 | 0.0021 |
| Oak and gallery forest (OGF) | 12,094.98695 | 19.52 |
| Cultivated and induced forest (CIF) | 11.69106 | 0.018 |
| Coniferous forest (CF) | 26,356.0703 | 42.55 |
| Water bodies (WB) | 483.7009 | 0.78 |
| Perennial agriculture (PA) | 5.98163 | 0.01096 |
| Annual agriculture (AA) | 16,337.47 | 26.37 |
| Total Municipality of Tapalpa | 61,940.44 | 100.00 |
Table 2.
2014 and 2021 Maximum (Max) and Average (Ave) albedo values (%) for types of land cover, and significance p-value for the Mann-Whitney U Test at comparing albedo means for 2014 and 2021.
Table 2.
2014 and 2021 Maximum (Max) and Average (Ave) albedo values (%) for types of land cover, and significance p-value for the Mann-Whitney U Test at comparing albedo means for 2014 and 2021.
| Albedo values | ||||||
|---|---|---|---|---|---|---|
| Difference | ||||||
| 2014 | 2021 | Ave 2021-Ave 2014 | ||||
| Land cover types | Max | Ave | Max | Ave | Diff | p-value |
| Cloud and low evergreen forest | 7.15 | 6.12 | 7.87 | 6.46 | +0.34 | 0.191 |
| Cultivated and induced forest | 7.18 | 6.34 | 8.85 | 5.53 | -0.81 | 0.011 |
| Perennial agriculture | 8.40 | 6.84 | 9.29 | 6.52 | -0.32 | 0.0001 |
| Tular | 8.54 | 5.69 | 8.28 | 7.6 | +1.91 | 0.005 |
| Water bodies | 10.01 | 4.72 | 10.55 | 4.69 | -0.03 | 0.0001 |
| Natural grassland | 10.61 | 7.13 | 12.19 | 7.8 | +0.67 | 0.0001 |
| Low deciduous and sub-deciduous forest | 10.92 | 6.13 | 12.99 | 6.94 | +0.81 | 0.0001 |
| Cultivated and induced grassland | 12.97 | 7.11 | 19.63 | 5.77 | -1.34 | 0.0001 |
| Coniferous forest | 13.39 | 5.37 | 14.89 | 9.6 | +4.23 | 0.0001 |
| Urban area | 15.42 | 7.99 | 17.29 | 8.61 | +0.62 | 0.0001 |
| Bare ground | 16.01 | 9.51 | 16.67 | 7.81 | -1.70 | 0.340 |
| Oak and Gallery forest | 16.27 | 5.77 | 21.20 | 6.47 | +0.70 | 0.0001 |
| Annual Agriculture | 21.46 | 7.82 | 27.01 | 8.52 | +0.70 | 0.0001 |
| Municipality of Tapalpa | 21.46 | 6.22 | 27.01 | 6.79 | +0.57 | 0.0001 |
Table 3.
Polygonal land cover changes between 2014 and 2021 and their impact on albedo value.
| Albedo change in land cover types | |||||
|---|---|---|---|---|---|
| Change year | Land cover type2014 | Land cover type2021 | Albedo 2014 (%) | Albedo 2021 (%) | Difference 2021-2014 (%) |
| 2015 | Annual agriculture | Protected agriculture | 9.10 | 11.38 | +2.27 |
| 2015 | Annual agriculture | Protected agriculture | 8.43 | 7.49 | -0.94 |
| 2016 | Coniferous forest | Perennial agriculture | 4.99 | 9.97 | +4.97 |
| 2016 | Grassland | Protected agriculture | 7.47 | 16.84 | +9.37 |
| 2016 | Coniferous forest | Annual agriculture | 5.61 | 9.77 | +4.15 |
| 2016 | Coniferous forest | Grassland | 5.25 | 9.99 | +4.73 |
| 2016 | Oak forest | Annual agriculture | 5.10 | 10.56 | +5.46 |
| 2016 | Oak forest | Annual agriculture | 6.08 | 8.11 | +2.02 |
| 2016 | Annual agriculture | Protected agriculture | 9.40 | 14.39 | +4.98 |
| 2016 | Annual agriculture | Protected agriculture | 7.91 | 7.91 | 0.00 |
| 2016 | Annual agriculture | Protected agriculture | 10.31 | 10.11 | -0.19 |
| 2016 | Annual agriculture | Protected agriculture | 8.63 | 9.35 | +0.72 |
| 2016 | Annual agriculture | Irrigation agriculture | 10.40 | 8.43 | -1.97 |
| 2016 | Annual agriculture | Protected agriculture | 6.27 | 14.24 | +7.96 |
| 2017 | Annual agriculture | Protected agriculture | 8.73 | 11.05 | +2.32 |
| 2017 | Grassland | Protected agriculture | 7.34 | 10.54 | +3.19 |
| 2017 | Coniferous forest | Perennial agriculture | 5.02 | 6.54 | +1.52 |
| 2017 | Annual agriculture | Perennial agriculture | 6.78 | 6.25 | -0.53 |
| 2017 | Grassland | Annual agriculture | 9.61 | 15.76 | +6.15 |
| 2017 | Annual agriculture | Protected agriculture | 8.52 | 10.05 | +1.53 |
| 2018 | Coniferous forest | Perennial agriculture | 5.75 | 7.86 | +2.10 |
| 2019 | Oak forest | Annual agriculture | 5.85 | 9.65 | +3.79 |
| 2019 | Coniferous forest | Annual agriculture | 5.63 | 8.26 | +2.62 |
| 2019 | Coniferous forest | Annual agriculture | 5.34 | 7.12 | +1.77 |
| 2020 | Coniferous forest | Bare ground | 5.34 | 9.49 | +4.14 |
| 2020 | Oak forest | Annual agriculture | 7.64 | 9.94 | +2.30 |
| 2020 | Coniferous forest | Annual agriculture | 5.39 | 9.91 | +4.52 |
| 2020 | Coniferous forest | Annual agriculture | 5.48 | 7.92 | +2.43 |
| 2020 | Oak forest | Annual agriculture | 5.90 | 9.00 | +3.10 |
| 2020 | Coniferous forest | Grassland | 5.17 | 8.90 | +3.72 |
| 2020 | Oak forest | Grassland | 5.65 | 12.16 | +6.50 |
| 2020 | Oak forest | Secondary vegetation | 5.07 | 7.21 | +2.13 |
| 2020 | Annual agriculture | Protected agriculture | 7.42 | 12.87 | +5.45 |
| 2020 | Annual agriculture | Protected agriculture | 8.65 | 18.68 | +10.03 |
| 2020 | Annual agriculture | Protected agriculture | 7.60 | 17.97 | +10.36 |
| 2020 | Annual agriculture | Protected agriculture | 10.54 | 11.99 | +1.45 |
| 2021 | Perennial agriculture (trees < 1-year-old) | Perennial agriculture (trees > 7-year-old trees | 7.09 | 5.70 | -1.39 |
| 2021 | Perennial agriculture (trees < 1-year-old) | Perennial agriculture (trees > 7-year-old trees | 7.42 | 6.15 | -1.27 |
Table 4.
Spearman’s correlation between albedo changes and climatic variables variations from 2014 through 2021, and climatic variables means comparison for the municipality of Tapalpa.
Table 4.
Spearman’s correlation between albedo changes and climatic variables variations from 2014 through 2021, and climatic variables means comparison for the municipality of Tapalpa.
| Maximum Temperature (°C) |
Minimum temperatura (°C) | Diurnal temperature range (DTR) (°C) | Relative humidity (%) |
|
|---|---|---|---|---|
| Spearman rho | -0.262 | -0.232 | -0.264 | -0.204 |
| p-value | 0.0001 | 0.0001 | 0.0001 | 0.0001 |
| Mann-Whitney U | 509881 | 445826 | 347705 | 17175 |
| p-value | 0.001 | 0.0001 | 0.0001 | 0.0001 |
| 2014 | 26.6 | 9.7 | 16.9 | 49.4 |
| 2021 | 26.5 | 9.1 | 17.3 | 46.7 |
Table 5.
Monthly and annual diurnal temperature range (DTR) for years 2014 and 2021, and the statistical significance of the difference 2021-2014 for Tapalpa, Jalisco, México.
Table 5.
Monthly and annual diurnal temperature range (DTR) for years 2014 and 2021, and the statistical significance of the difference 2021-2014 for Tapalpa, Jalisco, México.
| Monthly/Annually | DTR 2014 (°C) | DTR 2021 (°C) | DTR 2021-DTR 2014 (°C) | Mann-Whitney U Test | p-value |
|---|---|---|---|---|---|
| January | 17.14 | 20.35 | +3.21 | 10975 | 0.0001 |
| February | 20.38 | 19.59 | -0.79 | 57995 | 0.0001 |
| March | 20.67 | 19.59 | -1.07 | 33746 | 0.0001 |
| April | 20.56 | 18.79 | -1.77 | 1848 | 0.0001 |
| May | 16.91 | 19.52 | +2.61 | 2300 | 0.0001 |
| June | 14.29 | 14.29 | 0.00 | 196788 | 0.585 |
| July | 14.22 | 13.84 | -0.39 | 48754 | 0.0001 |
| August | 14.13 | 13.70 | -0.43 | 16655 | 0.0001 |
| September | 12.98 | 13.60 | +0.62 | 19809 | 0.0001 |
| October | 15.14 | 15.55 | +0.40 | 69646 | 0.0001 |
| November | 16.74 | 19.56 | +2.82 | 164 | 0.0001 |
| December | 19.06 | 19.14 | +0.07 | 1777151 | 0.0001 |
| Annual | 16.85 | 17.29 | +0.43 | 104679 | 0.0001 |
Disclaimer/Publisher’s Note: The statements, opinions and data contained in all publications are solely those of the individual author(s) and contributor(s) and not of MDPI and/or the editor(s). MDPI and/or the editor(s) disclaim responsibility for any injury to people or property resulting from any ideas, methods, instructions or products referred to in the content. |
© 2023 by the authors. Licensee MDPI, Basel, Switzerland. This article is an open access article distributed under the terms and conditions of the Creative Commons Attribution (CC BY) license (http://creativecommons.org/licenses/by/4.0/).
Copyright: This open access article is published under a Creative Commons CC BY 4.0 license, which permit the free download, distribution, and reuse, provided that the author and preprint are cited in any reuse.


