Submitted:
25 May 2023
Posted:
26 May 2023
You are already at the latest version
Abstract
Soarinho Alkaline Intrusion, southeastern Brazil, makes part of the Serra do Mar Igneous Province, and it is composed of alkali feldspar syenite, alkali feldspar trachyte, quartz syenite, and mon-zonite. Geochemical and geochronological analysis of the Soarinho were compared with data from its neighbors Rio Bonito and Tanguá. Zircon U-Pb Laser Ablation ages show that Soarinho is youngest than Rio Bonito and Tanguá. Ages obtained from the monzonite (60 ± 2 Ma), alkali feldspar syenite (58 ± 2 Ma), and quartz syenite (58 ± 2 Ma) are indistinguishable within error. Petrographic and geochemical data show a clear contrast among Soarinho, Rio Bonito, Tanguá, and Lu-Hf isotopic data for the three alkaline intrusions (all negative), point to some similarities in their sources. The data suggest an enriched mantle source for Soarinho; however, an older con-tinental crust contribution cannot be discarded.
Keywords:
syenitic magma sourece
; alkali feldpsar syenite
; quartz syenite
; U-Pb dating
; Lu-Hf isotopes
1. Introduction
Nowadays, it is estimated that alkaline magmatism represents about 2% of igneous rocks mapped on the World. Despite rare, this kind of magmatism is well represented on Brazilian territory [1,2,3]. The Serra do Mar Igneous Province (SMIP) (Figure 1), located in Southeastern Brazil, represents a series of alkaline igneous complexes that developed between the Cretaceous and the Eocene [3]. In SMIP, predominate stocks and plugs comprise silica-undersaturated rocks beyond mafic dyke swarms (alkali basalts, basanites, mela nephelinites, and lamprophyres).
The geochronological data (K-Ar, Rb-Sr, and U-Pb) presented to the SMIP give intense discussions about the geodynamical model that explain the emplacement of those alkaline rocks in Southeastern Brazil [4,5,6,7,8,9]. The first model is based on the age decrease of the west to east (Figure 1) and proposes that this decrease elapses in the passage of the lithosphere over a mantle plume [3,10,11]. The second model proposed to SMIP magmatism points to an irregular decrease of ages and suggests a structural control to the emplacement of those igneous bodies [12,13,14]. Finally, the third model points to combinate evolution between a mantle plume and structural control [15].
Works based on Nd and Sr isotopes demonstrate isotopic signatures with mantle affinity for the igneous bodies of SMIP. Despite the mantle signature being present on all igneous bodies of SMIP, the same isotopic data demonstrated heterogeneity between different igneous bodies and individual heterogeneities [2]. Sr isotopic data demonstrated that different potions of the mantle contributed to the SMIP magmatism and different levels of mantle enrichment [3,16,17]. However, lithogeochemical data from previous works demonstrate some level of crustal contribution to the SMIP magmatism, even if it did not play a fundamental role in the genesis of these igneous bodies [17,18,19,20].
After decades of study at SMIP, some igneous complexes are better understood than others, such as the Poços de Caldas and Itatiaia complexes, which have detailed mapping, in addition to geochronological, geochemical, and isotopic data [21,22,23,24,25,26]. On the other hand, some complexes, such as Soarinho (the focus of this work), received less attention. Therefore, the purpose of this work is to present a geochemical, geochronological (U-Pb) and isotopic (Lu-Hf) study for the Soarinho intrusive complex (Rio de Janeiro, Brazil). We present also U-Pb and Lu-Hf data from Tanguá comparing them with Rio Bonito published data [9].
2. Soarinho Intrusive Complex
The Soarinho Complex is intruded on rocks of Oriental domain (Ribeira belt), specifically on Costeiro domain [27] (Figure 2). The country rocks of Soarinho Complex are the sin-sollisional granties (Cassorotiba orthogneiss) and paragneiss of São Fidélis group (Figura 2). Soarinho complex forms an elongated stock in the NNW-SSE direction, with an area of 33 km2 and a maximum elevation of 600m.
The Soarinho Complex is composed of alkali-feldspar syenite, alkali-feldspar trachyte, monzonite, quartz syenite, magmatic breccias and lamprophyres [3]. The lack of nepheline is a striking feature in Soarinho, with some rocks showing modal quartz. In the north segment, there are quartz syenite, monzonite and silica-undersaturated syenite, and in south segment, predominate the same silica-undersaturated syenite [29].
2.1. Tanguá and Rio Bonito Massifs
Rio Bonito and Tanguá are comprised mainly of nepheline syenite and syenite cut by phonolite and trachyte dykes [29]. Both massifs have a concentric zoning characterized by increase of modal nepheline content from the border to its core [29]. Magmatic breccia also occur in Rio Bonito and Tanguá having in the latter NE-SW trend concordant with phonolite and trachyte dykes. Such breccia consist of millimetric to centimetric fragments of trachytes, phonolites and rarely syenites and gneiss. Locally, in the center of the intrusion, Tanguá presents pseudo leucite syenites. Fluorite veins parallel to the phonolite and trachyte dykes have been economically explored in Tanguá for decades [43].
3. Analytical methods
16 samples were collected, which were prepared for the geochemical analyses in Laboratório Geológico de Preparação de Amostras (LGPA) at Rio de Janeiro State University. The procedures for extracting zircons for U-Pb dating were also realized in this laboratory.
The multielementary lithogeochemistry analysis was carried out at Activation Laboratories Ltd. in Canada. The major elements (SiO2, Al2O3, Fe2O3T, MnO, MgO, CaO, Na2O, K2O, TiO2 and P2O5) have their concentrations measured in weight percentage. The mobile trace elements (Ba, Rb, Sr, U e Th), immobile trace elements (Zr, Y, Nb e Hf), rare earth elements (La, Ce, Pr, Nd, Sm, Gd, Eu, Tb, Dy e Ho) in addition to Ni, Cr, V and Co were measured in parts per million. In this analysis were also obtained Loss on Ignition (LOI) information. Geochemical data was handled by GCDKit program [30].
Zircon grains were separated using conventional heavy liquid and magnetic techniques and the grains were handpicked under a binocular microscope. These zircon grains were mounted onto an epoxy resin disc, polished to about half of the zircon modal grain thickness. Zircons were documented with backscatter (BSE) and cathodoluminescence (CL) images obtained to reveal their external and internal structures. BSE and CL imaging was performed at the Multilab from Rio de Janeiro State University.
The U-Pb dating and Lu-Hf isotopes was carried out in MultiLab Laboratory from Rio de Janeiro State University and Isotope Geochemistry Laboratory from Ouro Preto Federal University through the technique of Laser ablation Inductively Coupled Plasma Mass Spectrometer (LA-ICP-MS). The equipment used was Neptune of Thermo Scientific. The laser conditions applied in these analyzes were diameter of the spots between 30 and 85 µm and frequency of 10 Hz. The data treatment parameters were discordance equal or less than 5% and low common lead (maximum of 0.05%). Isoplot software was used for constructing the Tera-Waserburg Concordia diagrams [31,32].
U-Pb data from Soarinho samples were carried out in MultiLab Laboratory from Rio de Janeiro State University. The standard procedure used for the dating begins with analysis of blank, following was used the GJ1 zircon standard and then nine shoots were made on the zircons of the analyzed sample. Following, it was realized analysis of the 91500-zircon standard, another analysis of the GJ1 standard and finally another analysis of the blank. The unknown zircon analyses interleaved with standards of zircons have the purpose to make corrections of isotopic fractionations besides the blank corrections.
The U-Pb analysis of nepheline syenite from Tanguá was carried out in Isotope Geochemistry Laboratory from Ouro Preto Federal University. The equipment is a Photon-Machines Laser Ablation system (G2 excimer laser 193 nm) coupled to a ThermoFisher Scientific Neptune Plus MC-ICP-MS. The analyses are obtained in automated mode via a trigger cable between the laser and the MC-ICP-MS. After the laser triggers the ICP-MS, a 15 second background is measured, followed by a signal + background as the laser beam is activated for 40 seconds. It is applied a standard-sample-standard bracketing technique, analyzing 5 points on primary and 5 points on secondary reference materials, followed by 10 points on unknowns and back to 5 points on each reference material.
All Lu-Hf analyses were made in Isotope Geochemistry Laboratory from Ouro Preto Federal University. Zircon Lu-Hf analyses were made in the same points dated by U-Pb. A Photon-Machines Laser Ablation system (ArF excimer laser 193 nm) coupled to a Neptune MC-ICP-MS was used for measure Lu, Yb and Hf isotopic signature of the zircons. BB (supplementary material A), Gj1 (supplementary material B), and Plesovice (supplementary material C) were the standards used in the Hf analyses.
The following calculations were applied in Lu-Hf analyses. 176Yb/177Hf = (176Yb/173Yb) true x (173Yb/177Hf) meas x (M173(Yb)/M177(Hf))b(Hf), b(Hf) = ln(179Hf/177Hf true/179Hf/177Hf measured)/ln (M179(Hf)/M177(Hf)), M = mass of respective isotope. The 176Lu/177Hf were calculated in a similar way by using the 175Lu/177Hf and b(Yb). Mean Hf signal is in volt. Uncertainties are quadratic additions of the within-run precision and the daily reproducibility of the 40ppb-JMC475 solution. Uncertainties for the JMC475 quoted at 2SD (2 standard deviation).
176Hf/177Hf initial ratios and ƐHf were calculated using the 207Pb/206Pb apparent age determined by LA-SF-ICP-MS. The CHUR parameters are 176Lu/177Hf = 0.0336 and 176Hf/177Hf = 0.282785 [33]. The 176Lu decay constant is 1.867 × 10⁻¹¹ year-1 from [34]. The following constants were used to calculate TDM values: Avg MORB [35], BLIC TDM [36] and NC TDM [37].
4. Soarinho rocks petrography
4.1. Quartz syenite
Syenite quartz has a porphyritic texture, with a fine to the medium-grained matrix and two types of phenocrysts: rounded orthoclase phenocrysts and plagioclase laths (Figure 3). The matrix consists of quartz, biotite, clinopyroxene, amphibole, opaque minerals (mainly magnetite), titanite, apatite and zircon. Orthoclase is the main mineral, has inclusions of quartz, opaque minerals, and zircon, and makes up about 68% of the modal composition. Plagioclase has compositional zoning as its main characteristic and makes up about 11% of the modal. Quartz is xenomorphic and represents approximately 6% of the modal composition. Biotite often occurs in tabular form and corresponds to 6% of the modal composition. Amphibole (5%) and clinopyroxene (1%) occur in anhedral granular form. Magnetite is xenomorphic and often rounded.
4.2. Monzonite
They are medium to coarse-grained rocks composed of plagioclase, orthoclase, quartz, clinopyroxene, biotite, amphibole, apatite, opaque minerals (mainly magnetite), and zircon (Figure 4). Plagioclase is the main mineral of the rock; it comes in the form of laths and makes up about 45% of the modal composition. Orthoclase is granular xenomorphic and corresponds to approximately 35% of the modal composition. The rock’s main mafic mineral is biotite, which is primarily xenomorphic and corresponds to about 12% of the modal composition. Clinopyroxene (augite) is round granular and makes up about 3% of the modal composition. Amphibole (hornblende) is xenomorphic and is present in about 3% of the rock composition. Quartz has a granophyric texture representing only 2% of the modal composition.
4.3. Alkali-feldspar syenite
They are equigranular rocks, medium to coarse-grained and light gray in color (Figure 5). The main mineral is orthoclase, which makes up about 90% of the rock, and has a granular habit and perthitic texture. Amphibole has a granular habit. Opaque minerals are xenomorphic and are associated with amphiboles.
4.4. Alkali-feldspar trachyte
Fine-grained, grey to greenish color (Figure 6) micro porphyritic rocks with phenocrysts of perthitic sanidine occurring as simple twinning laths grains. The matrix presents typically trachytic texture and consists mainly of feldspar. Biotite is sub millimetric xenomorphic or tabular grain also occurring as clusters of micro grains. Amphiboles appear as micro grains or clumps of micro grains. Opaque minerals have cubic to rounded shapes forming sub millimetric grains.
5. Geochemistry
The geochemical data of the Soarinho complex are presented in Table 1 and Table 2. Analysis was carried out for the following lithotypes: alkali-feldspar syenite (4 samples), quartz syenite (4 samples), monzonite (2 samples) and trachyte (6 samples). Table 3 presents the summary measurements for the main oxides, except for the monzonite samples. Figure 7 presents the linear correlation matrices for the main oxides, except for the monzonite samples. The geochemical classification of the samples is shown in Figure 8. The statistical treatment of the data and the database are available at https://github.com/geoloriato/Complexo-Soarinho.
The lithogeochemical data of the Soarinho complex were compared with neighboring intrusions (and of similar ages) (Figure 2). The lithogeochemical data of the Rio Bonito and Tanguá complexes were compiled from previous works [9,19]. The rocks of the Soarinho complex belong to the potassic series (Figure 9A), while the rocks of the complexes present a transitional character between the potassic and ultrapotassic series (Figure 9A).
Regarding the alkalinity index (AI) and the feldspathoid silica-saturation index (FSSI), the rocks of the Soarinho complex are, for the most part, metaluminous to peraluminous with the presence of normative quartz (Figure 9B). Regarding the silica saturation index, the rocks of the Soarinho complex are plotted in the upper field of the diagram, corresponding to the basement of granites and gneisses (Figure 9C).
All rocks of the Soarinho complex show enrichment in LREE about HREE (Figure 10). Alkali-feldspar syenites and alkali-feldspar trachytes show a strong negative Eu anomaly (Figure 10 A and B). Samples of quartz syenite also show negative Eu anomalies; however, they are less pronounced (Figure 10C). The monzonite samples show mild positive Eu anomalies (Figure 10D).
The multielement diagrams, normalized to the primitive mantle, demonstrate an enrichment pattern for mismatched elements (Figure 11). Alkali feldspar syenite and alkali feldspar trachyte samples show similar patterns in the multielement diagrams, showing strong depletions in Ba, Sr, P, and Ti (Figure 11A and B). The quartz syenite samples only show significant P and Ti depletion (Figure 11C). Finally, the monzonite samples show more “constant” patterns without significant anomalies (positive or negative) (Figure 11D).
6. Zircon U-Pb geochronology
Zircon U-Pb ages were obtained for samples SOA-01A (Quartz syenite), SOA-02A (monzonite), and SOA-05 (alkali-feldspar syenite) from Soarinho. We also dated one nepheline syenite sample from Tanguá. The analytical results are presented in Supplementary Material (SM) D. zircon grains generally have a short prismatic habit and well-defined oscillatory zoning. The luminescence cathode images of the analyzed zircon grains are presented in Supplementary Material D.
Five zircon grains were used to calculate the crystallization age of sample SOA-01A, and the age obtained was 58+2 Ma (Figure 12A), with an MSWD of 0.15 and a probability of 68%. In sample SOA-02A, 12 zircon grains were used to calculate the crystallization age, where 60±2 Ma was obtained (Figure 12B), with MSWD = 0 and a probability of 99%. The age of 58±2 Ma was obtained for sample SOA-05 from the analysis of 14 zircon grains (Figure 12C), with MSWD of 0.01 and a probability of 95%. Twelve zircon grains were used to calculate the crystallization age of nepheline syenite, and the age obtained was 65±1 Ma (Figure 12D), with MSWD = 0 and probability of 94%.
7. Zircon Lu-Hf isotopes
Lu-Hf analyses on zircon were performed on the same samples that U-Pb dating was performed (SOA-01A, SOA-02A, SOA-05, and nepheline syenite). The complete analytical results are presented in the SM-E, and the data summary is presented in Table 4. Sample SOA-01A (syenite quartz) shows ƐHf (t) values ranging from -10.32 to -7.01 and model ages (TDM) varying between 1.2 and 1.4 Ga (Figure 13). Sample SOA-02A (monzonite) shows ƐHf(t) values ranging from -10.21 to -6.32 and model ages (TDM) ranging from 1.2 to 1.3 Ga (Figure 13). Sample SOA-05 (alkali-feldspar syenite) shows ƐHf(t) values ranging from -17.88 to -5.29 and model ages (TDM) ranging from 1.1 to 1.8 Ga (Figure 13). Nepheline syenite sample shows ƐHf(t) values ranging from -6.4 to -32 and model ages (TDM) ranging from 1.1 to 2.8 Ga.
8. Discussion
We chose to change the name Soarinho massif to Soarinho Intrusive Complex (SIC) due to the compositional variability of the rocks present and the presence of plutonic and volcanic rocks. Although the SIC is heterogeneous, attention is drawn to the compositional difference (geochemical and mineralogical) of all its rocks with neighboring intrusions (Tanguá and Rio Bonito) [9,19]. What most calls attention is the absence of nepheline (normative/modal) in the rocks of the SIC, which is present both in Tanguá and Rio Bonito.
The SIC rocks belong to the potassic series (Figure 9A) and are metaluminous to peraluminous with a predominance of normative quartz (Figure 9B). The presence of normative quartz demonstrates the saturated to weakly supersaturated silica character of the SIC rocks. The SSI index and the relationship between alkalis (Na and K) and aluminum (Figure 9C) demonstrate a strong influence of the host rocks in the magmatic processes that gave rise to the SIC. Analyzing the three diagrams in Figure 9, the chemical differences between the SIC and the neighboring massifs are evident.
The U-Pb ages also show differences between the SIC and Tanguá and Rio Bonito massifs. The crystallization ages obtained in the SIC were 60+2 Ma and 58+2 Ma, while the crystallization age obtained in Tanguá and published data of Rio Bonito massif is the same 65+1 Ma [9]. The age difference demonstrates that the SIC is younger than the Tanguá and Rio Bonito by around 4 to 8 Ma. All analyzed zircon grains have magmatic characteristics, such as well-defined oscillatory zoning, indicating no xenocrysts assimilated from the host rocks.
Some similarity between the SIC, Tanguá, and Rio Bonito can be observed in the isotopic data of Lu-Hf in zircon (Figure 14). The Lu-Hf data for the SIC point to an exclusively crustal component, where all ƐHf(t) values are negative, ranging between -17.88 and -5.29 (Figure 13). The quartz syenite and monzonite samples show less variation in the Lu-Hf data. In contrast, the alkali-feldspar syenite sample has a broader range of variation in the Lu-Hf data (Figure 13). Tanguá and Rio Bonito, in turn, presents values of ƐHf(t) ranging between -32 and 5.6 and TDM model ages ranging between 1.1 and 2.8Ga [9]. This range of overlap between the SIC and its neighbors demonstrates that the magmas that gave rise to these units present some connection, either by mixing different magmas or through the contamination of the magmas by the same host rocks.
The SIC samples show similar patterns for rare earth elements, with relative enrichment of light rare earth elements about heavy rare earth elements (Figure 10). Negative Eu anomalies are observed in the four distinct lithologies of the SIC, which suggests plagioclase fractionation during the process of magmatic evolution or plagioclase retention in the partially molten rock. The correlation matrices (Figure 7) demonstrate distinct evolution processes for the different SIC lithologies. For quartz syenite (QS), the highest correlation between P2O5 and TiO2 (0.99) suggests an essential fractionation of titanite, which is very common in alkaline rocks. Other significant correlations for QS are Fe2O3 x CaO, MgO x Fe2O3, and CaO x MgO, which suggests the fractionation of mafic minerals. In alkali-feldspar syenite (SY), the oxide pairs that show high correlations differ from the QS samples, indicating high linear correlations for several major oxide compounds. Finally, for the alkali-trachyte feldspar (TQ) samples, only two pairs of oxides show high linear correlations.
Magma mixing is suggested for the Soarinho intrusion with mixing between a monzonite magma (36% to 44%) and an alkali feldspar syenite (56% to 64%) resulting in an overall quartz syenite composition. This model use the mixing equation [42] - CH = (f*C1) + ((1-f)*C2) - where C1, C2 and CH are the concentrations of a trace element in magma 1, magma 2 and in the hybrid magma produced, respectively and f is the proportion of magma 1 in the mixing. Figure 15 presents comparisons of a real quartz syenite (SOA-01B) and samples modeled by mixing monzonite and alkali feldspar syenite samples in different proportions. The diagrams show an overall good fit except for a few elements (Th, U, P and Zr). This model is supported by binary diagrams and mantled phenocrysts found in quartz syenites, but it needs field data to confirmation.
9. Conclusions
Our data show that Soarinho Intrusive Complex is chemically and geochronologically different from Tanguá and Rio Bonito, but presents some isotopic similarity with the latter. Zircon U-Pb ages for three Soarinho samples (monzonite, alkali feldspar syenite and quartz syenite) show that Soarinho is about 4 to 8 Ma younger than Tanguá and Rio Bonito. Geochemical and zircon Lu-Hf isotopic data point to an enriched mantle source for Soarinho, but due to the presence of modal quartz in some samples, it is not discarded some crustal assimilation in this intrusion.
Supplementary Materials
The following supporting information can be downloaded at the website of this paper posted on Preprints.org.
Author Contributions
Conceptualization: Daniel Adelino da Silva and Mauro Cesar Geraldes; Methodology: Daniel Adelino da Silva and Mauro Cesar Geraldes; formal analysis: Daniel Adelino da Silva; investigation: Daniel Adelino da Silva and Mauro Cesar Geraldes; resources: Daniel Adelino da Silva and Mauro Cesar Geraldes; writing—review and editing: Daniel Adelino da Silva and Guilherme Loriato Potratz, visualization: Daniel Adelino da Silva and Guilherme Loriato Potratz. All authors have read and agreed to the published version of the manuscript.
Acknowledgments
The present research work has been performed under the financial support of Rio de Janeiro State University (Universidade do Estado do Rio de Janeiro, UERJ) and also by Coordenação de Aperfeiçoamento de Pessoal de Nível Superior – (CAPES), Brazil. Activation Laboratories Ltd., Ontario, Canada, has performed the chemical analyses. The U-Pb and Lu-Hf analyses were carried out at MultiLab Laboratory from Rio de Janeiro State University and Isotope Geochemistry Laboratory from Ouro Preto Federal University, Brazil. The authors are grateful to the above-mentioned institutions.), and Fundação Carlos Chagas Filho de Amparo à Pesquisa do Estado do Rio de Janeiro, FAPERJ (project processe: E-26/203.112/2016 and E-26/204.531/2021 to GLP) Brazil, for financial support.
Conflicts of Interest
The authors declare no conflict of interest
References
- Ulbrich, H.H.G.J. , e Gomes, C.B., 1981. Alkaline rocks from continental Brazil. Earth-Science Reviews. 17, 135-154. [CrossRef]
- Morbidelli, L. , Gomes, C.B., Beccaluva, Brotzu, P., Conte, A.M., Ruberti, E., Traversa, G. 1995. Mineralogical, petrological and geochemical aspects of alkaline and alkaline-carbonatite associations from Brazil. Earth Science Reviews, 39, 135-168. [CrossRef]
- Thompson, R.N. , Gibson, S.A., Mitchell, J.G., Dickin, A.P., Leonardos, O.H., Brod, J.A., Greenwood, J.C., 1998. Migrating Cretaceous-Eocene magmatism in the Serra do Mar Alkaline Province, SE Brazil: Melts from the deflected Trinidade mantle plume? Journal of Petrology, 39:1493-1526. [CrossRef]
- Amaral, G. , Bushee, J., Cordani, U.G., Kawashita, K., Reynolds, J.H. 1967.Potassium-argon ages of alkaline rocks from Southern Brasil. Geochimica et Cosmochimica Acta, 31(2), 117-142. [CrossRef]
- Sonoki, I.K.; Garda, G.M. 1988. Idades K Ar de rochas alcalinas do Brasil Meridional e Paráguai Oriental: Compilação e adaptação às novas constantes de decaimento. Boletim do IG USP, Série Científica, v. 19, p. 63 85. [CrossRef]
- Thomaz Filho, A. and Rodrigues, A.L. 1999. O alinhamento de rochas alcalinas Poços de Caldas Cabo Frio (RJ) e sua continuidade na cadeia Vitória Trindade. Brazilian Journal of Geology, v. 29, n. 2, p. 275 280. [CrossRef]
- Montes-Lauar, C.R. , Pacca, I.G., Melfi, A.J., Kawashita, K. 1995. Late Cretaceous Alkaline Complexes, Southeastern Brazil: Paleomagnetism and Geochronology. Earth and Planetary Science Letters, 134(3-4), 425-440. [CrossRef]
- Silva, D.A. , Geraldes, M.C., Vargas, T., Jourdan, F., Nogueira, C.C. 2015. 40Ar/39Ar age, lithogeochemistry and petrographic studies of the Cretaceous Alkaline Marapicu Intrusion, Rio de Janeiro, Brazil. Boletim do Museu Paraense Emílio Goeldi Ciências Naturais 10 (3), 399-422. [CrossRef]
- Silva, D.A. , Motoki, A., Santos, A.C., Mendes, J., Jourdan, Geraldes, M.C., F., Lana, C.C. 2020. Multiple processes of geochemical evolution for the alkaline rocks of Rio Bonito intrusive complex, State of Rio de Janeiro, Brazil: 40Ar/39Ar and U-Pb ages and Lu-Hf isotopes on zircon and constraints on crustal signature. Geologia USP. Série Científica, V.20, n.4. [CrossRef]
- Herz, N. 1977. Timing of Spreading in the South Atlantic: Information from Brazilian Alkali Rocks. Geological Society of America Bulletin, 88(1), 101-112. [CrossRef]
- Gibson, S.A. , Thompson, R.N., Leonardos, O.H., Dickin, A.P., Mitchel, J.G. 1995b. The late cretaceous impact of the Trindade Mantle Plume: Evidence from large-volume, mafic, potassic magmatism in SE Brazil. Journal of Petrology 36(1), 189-229. [CrossRef]
- Almeida, F.F.M. 1976. The system of continental rifts bordering the Santos basin, Brazil. Anais da Academia Brasileira de Ciências, 48 (supl.), 15-26. [CrossRef]
- Almeida, F.F.M. , Neves, B.B.B., Carneiro, C.D.R. 2000. The origin and evolution of the South American Platform. Earth-Science Reviews, 50, 77-111. [CrossRef]
- Oreiro, S.G.; Cupertino, J.A.; Szatmari, P.; Thomaz Filho, A. 2008. Influence of pre salt alignments in post Aptian magmatism in the Cabo Frio High and its surroundings, Santos and Campos basins, SE Brazil: An example of non plume related magmatism. Journal of South American Earth Sciences, 25(1), 116-131. [CrossRef]
- Fainstein, R. and Summerhayes, C.P. 1982. Structure and origin of marginal banks off eastern Brazil. Marine Geology, 46, 199-215. [CrossRef]
- Mota, C.E.M. , Geraldes, M.C., Almeida, J.C.H., Vargas, T., Souza, D.M., Loureiro, R.O., Silva, A.P. 2009. Características Isotópicas (Nd e Sr), Geoquímicas e Petrográficas da Intrusão Alcalina do Morro de São João: Implicações Geodinâmicas e Sobre a Composição do Manto Sublitosférico. Geologia USP Série Científica, São Paulo, v.9, n.1, p. 85-100. [CrossRef]
- Brotzu, P. , Beccaluva, L., Conte, A., Fonseca, M., Garbarino, C., Gomes, C.B., Leong, R., Macciotta, G., Mansur, R.L., Melluso, L., Morbidelli, L., Ruberti, E., Sigolo, J.B., Traversa, G., Valença, J.G. 1989. Petrological and geochemical studies of alkaline rocks from continental Brazil. 8. The syenitic intrusion of Morro Redondo, RJ. Geochimica Brasiliensis, 3(1), 63-80.
- Brotzu, P. , Barbieri, M., Beccaluva, L., Garbarino, C., Gomes, C.B., Macciotta, G., Melluso, L., Morbidelli, L., Ruberti, E., Sigolo, J.B., Traversa, G. 1992. Petrology and geochemistry of the Passa Quatro alkaline complex, southeastern Brazil. Journal of South American Earth Sciences, 6(4), 237-252. [CrossRef]
- Motoki, A. , Sichel, S.E., Vargas, T., Aires, J.R., Iwanuch, W., Mello, S.L.M., Motoki, K.F., Silva, S., Balmant, A., Gonçalves, J., 2010. Geochemical evolution of the felsic alkaline rocks of Tanguá, Rio Bonito, and Itaúna intrusive bodies, State of Rio de Janeiro, Brazil. Geociências, Rio Claro, Brazil, 29-3, 291-310.
- Motoki, A. , Araújo, A.L., Sichel, S.E., Geraldes, M.C., Jourdan, F., Motoki, K.F., Silva, S. 2013. Nepheline syenite Magma Differentiation with Continental Crustal Assimilation for the Cabo Frio Island Intrusive Complex, State of Rio de Janeiro, Brazil. Geociências, 32, 195-218.
- Shea, M.E. 1992. Isotopic geochemical characterization of selected nepheline syenites and phonolites from the Poços de Caldas alkaline complex, Minas Gerais, Brazil. Journal of Geochemical Exploration, 45, 173-214. [CrossRef]
- Ulbrich, H.H. , Vlach, S.R.F., Demaiffe, D., Ulbrich, M.N.C. 2005. Structure and origin of the Poços de Caldas Alkaline Massif. In: Comin-Chiaramonti, P. & Gomes, C.B. (orgs.). Mesozoic to Cenozoic Alkaline Magmatism in the Brazilian Platform. São Paulo, Edusp/Fapesp, pp. 367-418.
- Grohmann, C.H. , Riccomini, C., Alves, F.M. 2007. SRTM-based morphotectonic analysis of the Poços de Caldas Alkaline Massif, southeastern Brazil. Computers and Geosciences, 33, 10-19. [CrossRef]
- Takenaka, L.B. , Lana, C., Scholz, R., Nalini Jr, H.A., Abreu, A.T. 2015. Optimization of the in-situ U–Pb age dating method via LA-Quadrupole-ICP-MS with applications to the timing of U–Zr–Mo mineralization in the Poços de Caldas Alkaline Complex, SE Brazil. Journal of South American Earth Sciences, 62, 70-79. [CrossRef]
- Brotzu, P. , Gomes, C.B., Melluso, L., Morbidelli, Morra, V., Ruberti, E. 1997. Petrogenesis of coexisting SiO2-undersaturated to SiO2-oversaturated felsic igneous rocks: The alkaline complex of Itatiaia, Southeastern Brazil. Lithos, 40, 133-156. [CrossRef]
- Rosa, P.A.S. and Ruberti, E. 2018. Nepheline syenite to syenites and granitic rocks of the Itatiaia Alkaline Massif, Southeastern Brazil: New geological insights into a migratory ring Complex. Brazilian Journal of Geology, 48(2): 347-372. [CrossRef]
- Heilbron, M. , Pedrosa-Soares A.C., Campos Neto M.C., Silva L.C, Truow R.A.J., Janasi V.A. 2004. Província Mantiqueira. V. Mantesso-Neto, A. Bartoreli, C.D.R. Carneiro, B.B. Brito-Neves (Eds.), Geologia do Continente Sul-Americano: evolução da obra de Fernando Flávio Marques de Almeida, Beca, pp. 203-234.
- Heilbron, M.; Eirado, L.G.; Almeida, J. (Org) 2016. Mapa Geológico e de Recursos Minerais do Estado do Rio de Janeiro. Escala 1:400.000 Programa Geologia do Brasil (PGB), Mapas Geológicos Estaduais. CPRM-Serviço Geológico do Brasil, Superintendência Regional de Belo Horizonte.
- Valença, J.G. Geology, petrography and petrogenesis of some alkaline igneous complexes of Rio de Janeiro State, Brazil. London, Ontario, Canada, 1980. 247 p. Thesis (Doctor in Geosciences) – West Ontario University, London, Canada.
- Janousek, V. , Farrow, C.M., Erban, V. 2006. Interpretation of whole-rock geochemical data in igneous geochemistry: Introducing geochemical data toolkit (GCDkit). Journal of Petrology, 47(6): 1255-1259. [CrossRef]
- Ludwig, K.R. , 2003. Using Isoplot/Ex, Version 3.00, a Geochronological Toolkit for Microsoft Excel. Berkeley Geochronology Center Special Publication, 4 (74 pp.
- Tera, F. and Wasserburg, G.J. 1972. U-Th-Pb systematic in three Apolo 14 basalts and the problem of initial Pb in lunar rocks. Earth and Planetary Science Letters, 14: 281-304. [CrossRef]
- Bouvier, A. , Vervoort, J.D., Patchett, P.J. 2008. The Lu-Hf and Sm-Nd isotopic composition of CHUR: Constraints from unequilibrated chondrites and implications for the bulk composition of terrestrial planets. Earth and Planetary Science Letters, v. 273, p. 48-57. [CrossRef]
- Söderlund, U. , Patchett, P.J., Vervoort, J.D., Isachsen, C.E., 2004. The 176Lu decay constant determined by Lu-Hf and U-Pb isotope systematics of Precambrian mafic intrusions. Earth and Planetary Science Letter, 219(3-4), 311-324. [CrossRef]
- Chauvel, C. , Lewin, E., Carpentier, M., Arndt, N.T., Marini, J.C. 2008. Role of recycled oceanic basalt and sediment in generating the Hf-Nd mantle array. Nature Geoscience, 1, 64-67. [CrossRef]
- Blichert-Toft, J. 2008. The Hf isotopic composition of zircon reference material 91500. Chemical Geology, 253, 252-257. [CrossRef]
- Dhuime, B. , Hawkesworth, C., Cawood, P. 2011. When Continents Formed. Science, 331(6014), 154-155. [CrossRef]
- Frost, B.R. , Frost, C.D. 2008. A Geochemical Classification for Feldspatic Igneous Rocks. Journal of Petrology, 49 (11), 1955-1969. [CrossRef]
- Middlemost, E.A.K. , 1975. The basalt clan. Earth Science Reviews, 11, 337-364. [CrossRef]
- Boynton, W.V. , 1984. Cosmochemistry of the rare-earth elements: meteorite studies. In: Henderson, P. Rare-Earth Elements Geochemistry. Amsterdam: Elsevier, p. 63-114.
- Sun, S. , Mcdonough, W.F. 1989. Chemical and isotopic systematics of oceanic basalts: Implications for mantle composition and processes. In: Saunders AD, Norry MJ, eds. Magmatism in the ocean basins. Boston, Blackwell Scientific:313–345.
- Powell, R. 1984. Inversion of the assimilation and fractional crystallization (AFC) equations; characterization of contaminants from isotope and trace element relationships in volcanic suites. Journal of Geological Society of London, 141(3): 447-552. [CrossRef]
- Silva, D.A. , Geraldes, M.C., Rodrigues, S.W.O, Mcmaster, M., Evans, N., Nummer, A.R., Vargas, T. 2018. (U Th)/He Ages from the Fluorite Mineralization of the Tanguá Alkaline Intrusion. Anuário do Instituto de Geociências UFRJ. V. 41 (2), p. 14-21. [CrossRef]
Figure 1.
Map of the Serra do Mar Igneous Province.
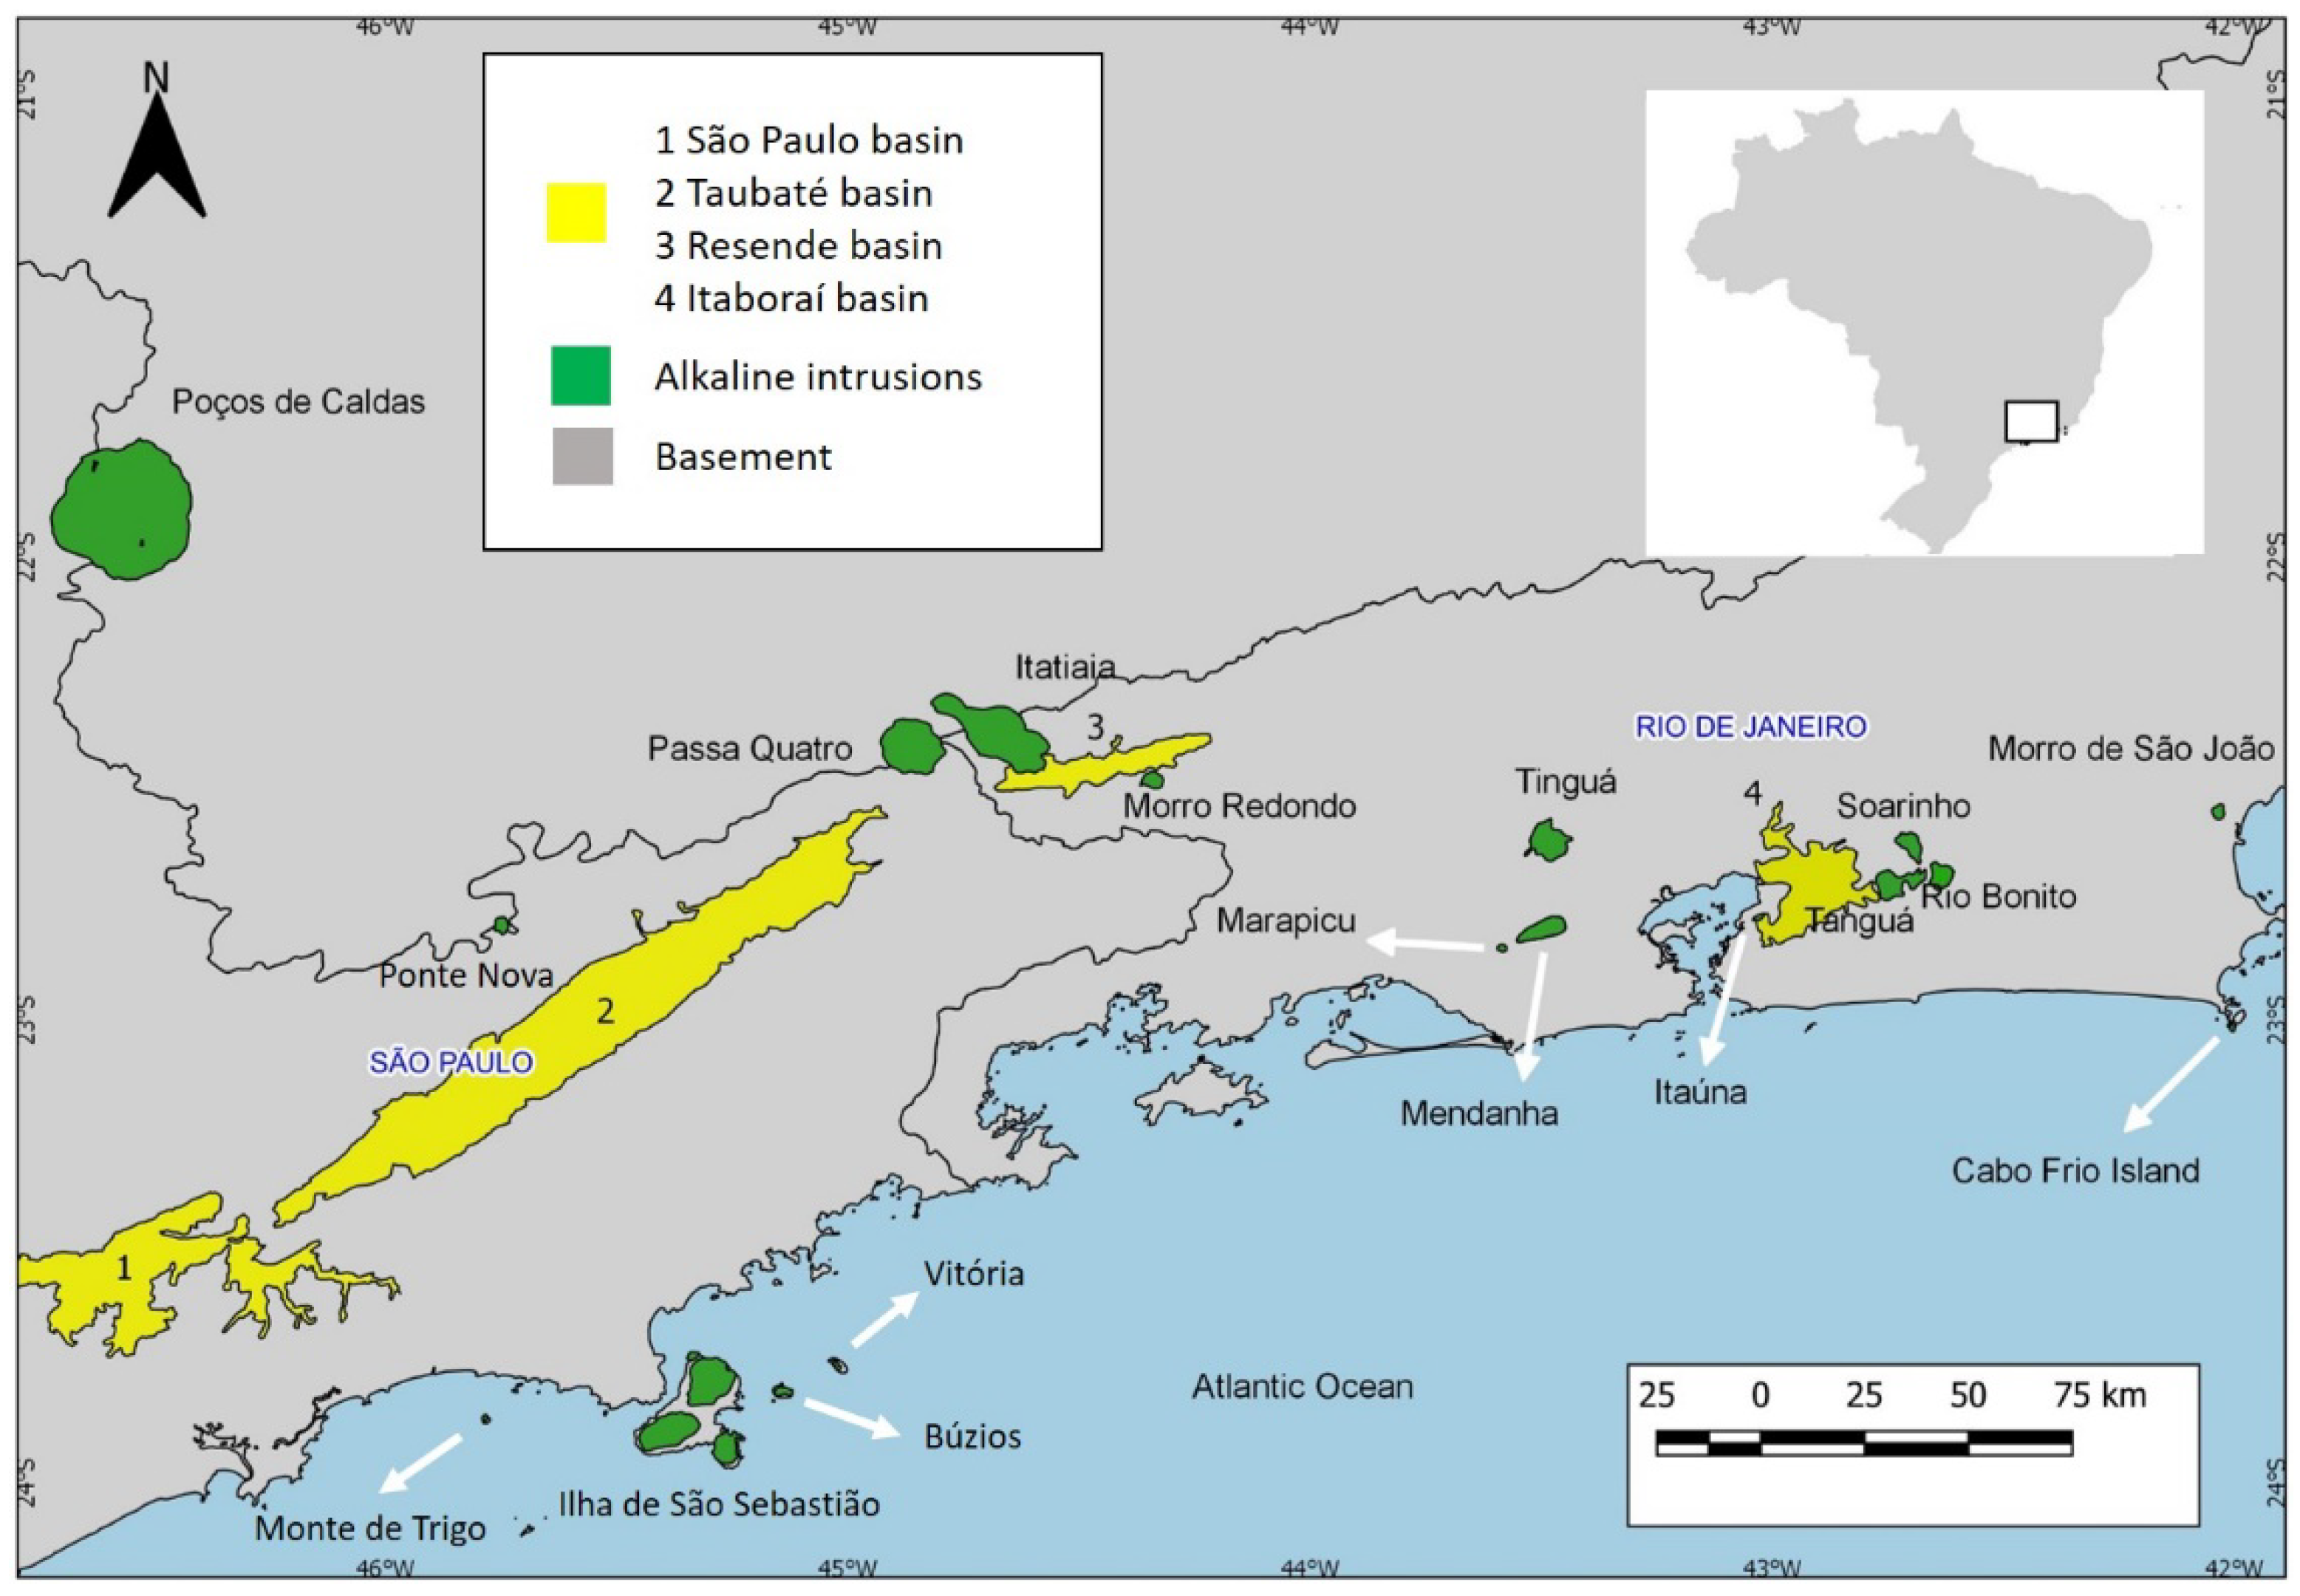
Figure 2.
Map of Soarinho alkaline massif including locals of sampling [8].
Figure 2.
Map of Soarinho alkaline massif including locals of sampling [8].
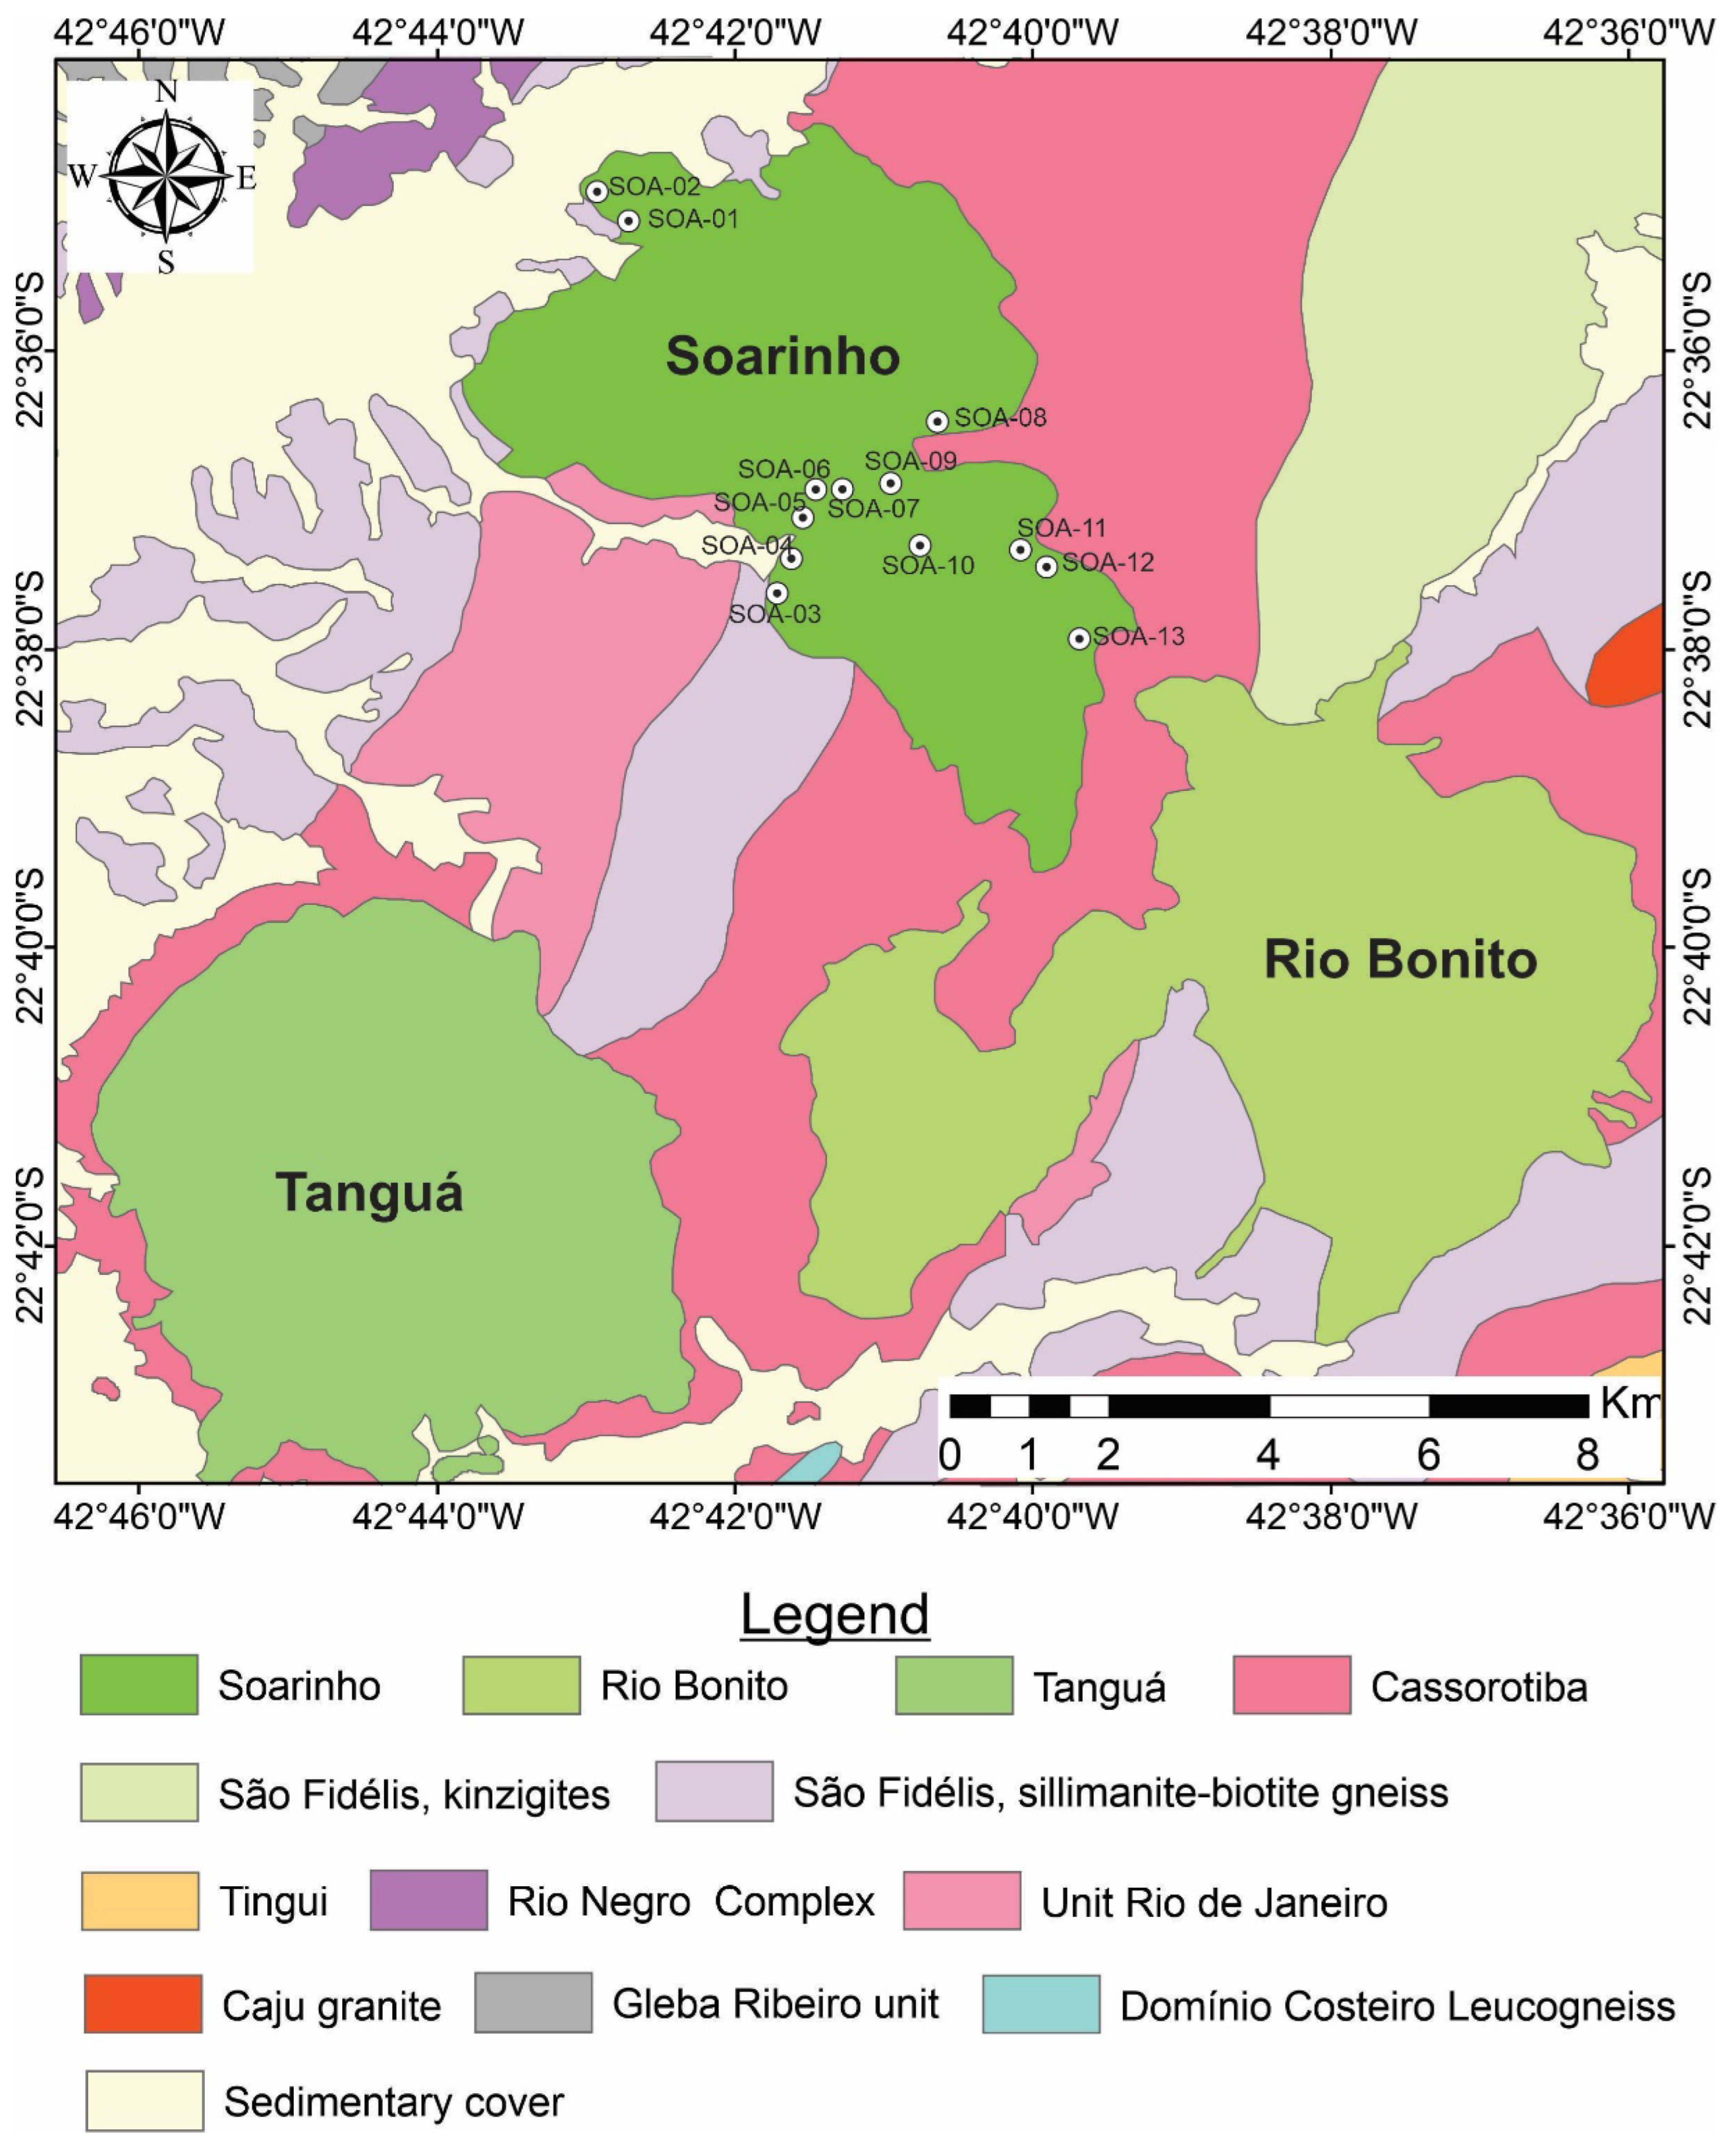
Figure 3.
(A) and (B) Hand specimen of the quartz syenite. (C) to (F) Photomicrographs of the quartz syenite. C and E cross-polarized light (xpl). D and F plane-polarized light (ppl). Or = orthoclase, Plg = plagioclase, Qtz = quartz.
Figure 3.
(A) and (B) Hand specimen of the quartz syenite. (C) to (F) Photomicrographs of the quartz syenite. C and E cross-polarized light (xpl). D and F plane-polarized light (ppl). Or = orthoclase, Plg = plagioclase, Qtz = quartz.
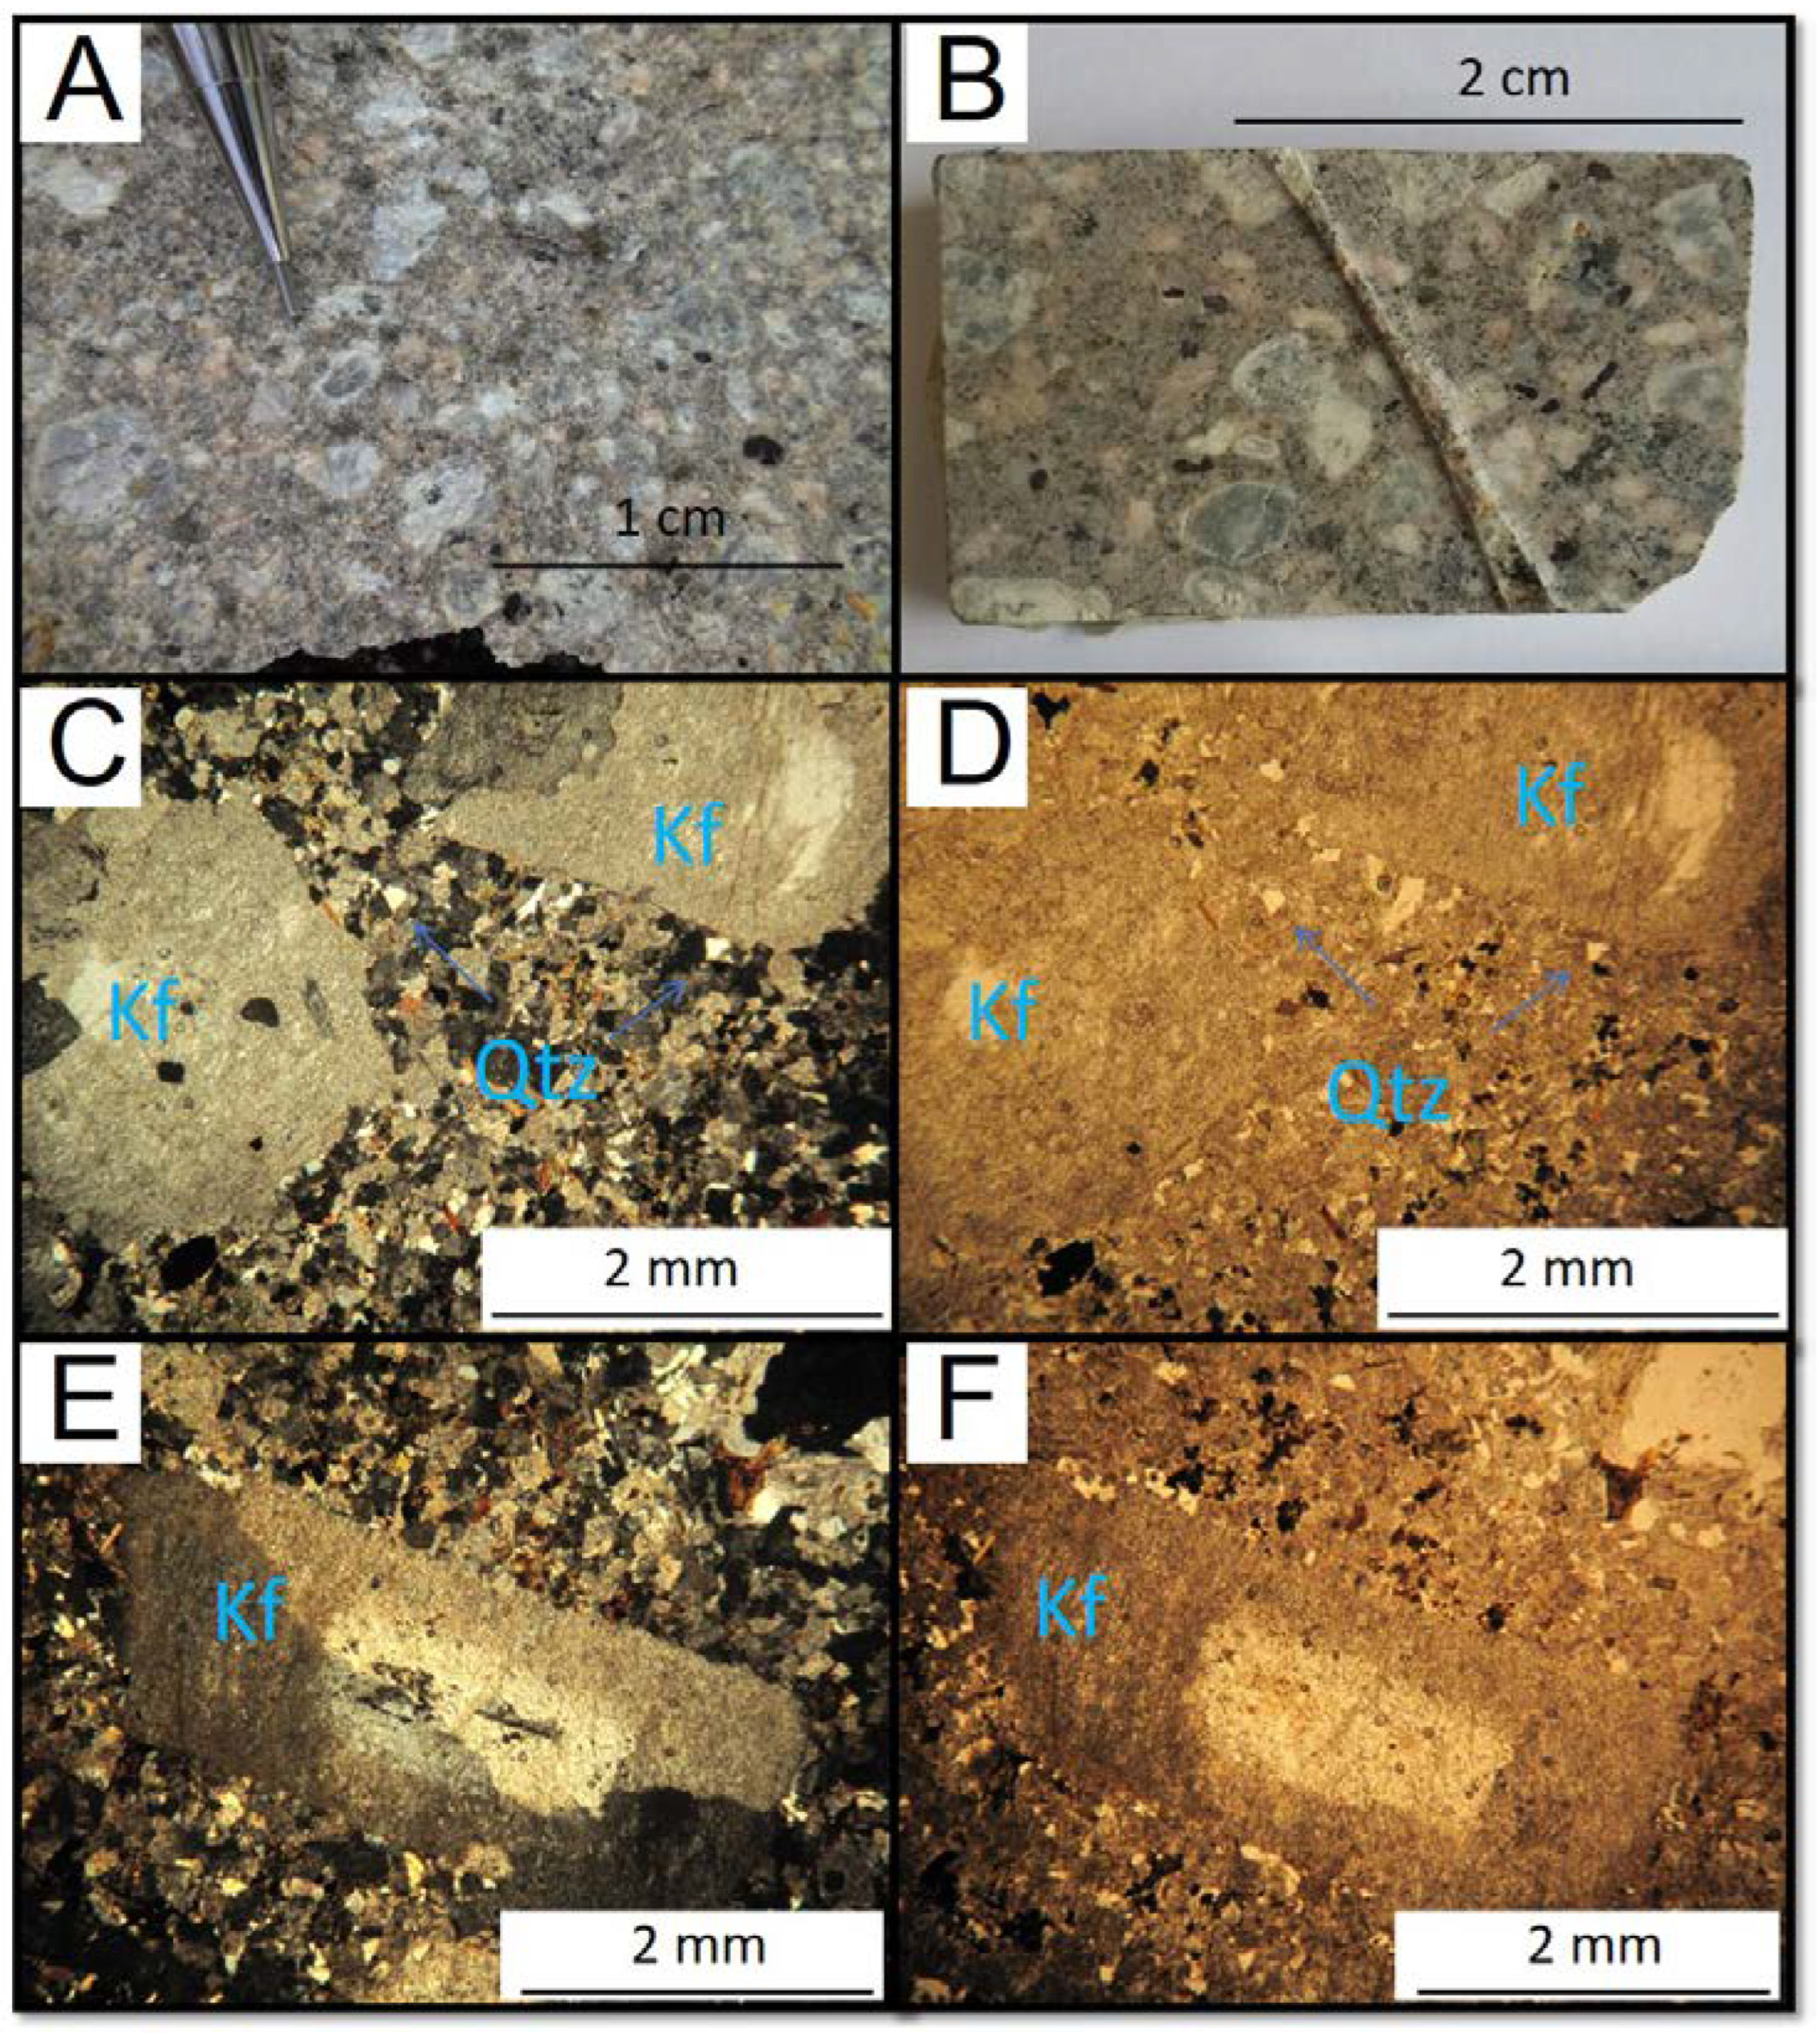
Figure 4.
(A) and (B) Hand specimen of the monzonite. (C) to (F) Photomicrographs of the monzonite. Bt = biotite, Px = pyroxene, Pl = plagioclase.
Figure 4.
(A) and (B) Hand specimen of the monzonite. (C) to (F) Photomicrographs of the monzonite. Bt = biotite, Px = pyroxene, Pl = plagioclase.
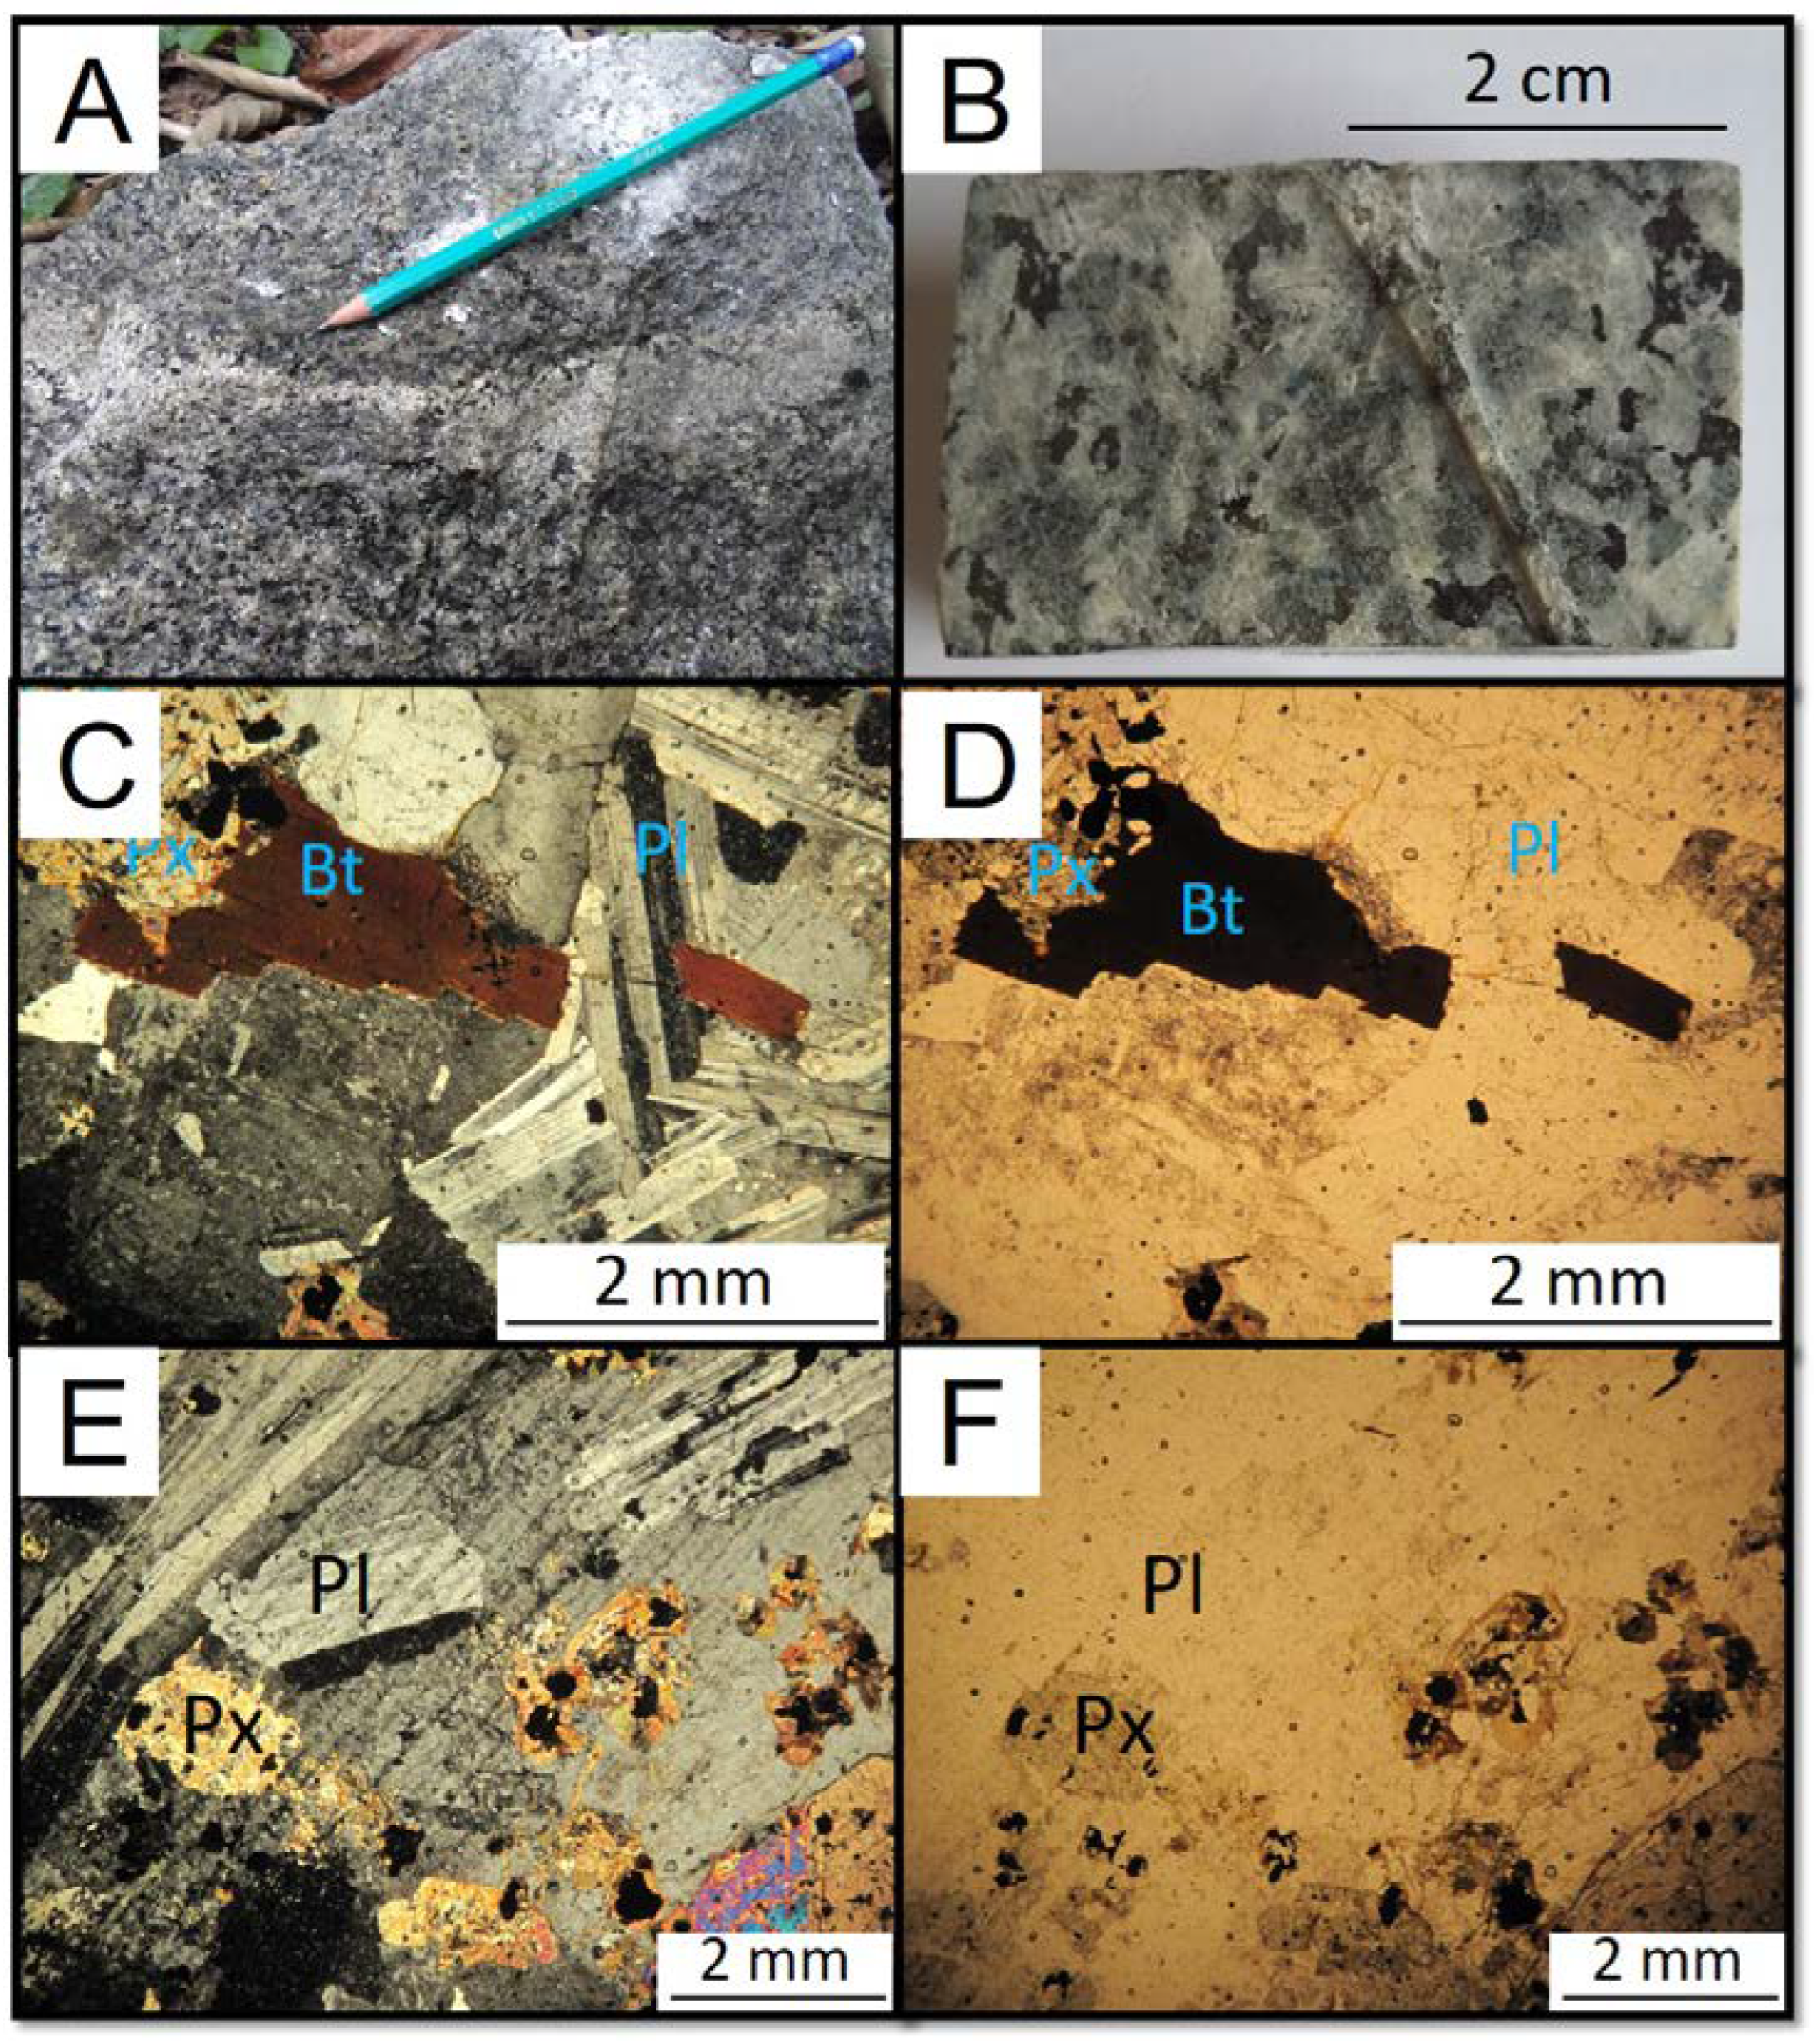
Figure 5.
(A) and (B) Hand specimen of the alkali feldspar syenite. (C) to (F) Photomicrographs of the alkali feldspar syenite. Kf = K-feldspar.
Figure 5.
(A) and (B) Hand specimen of the alkali feldspar syenite. (C) to (F) Photomicrographs of the alkali feldspar syenite. Kf = K-feldspar.
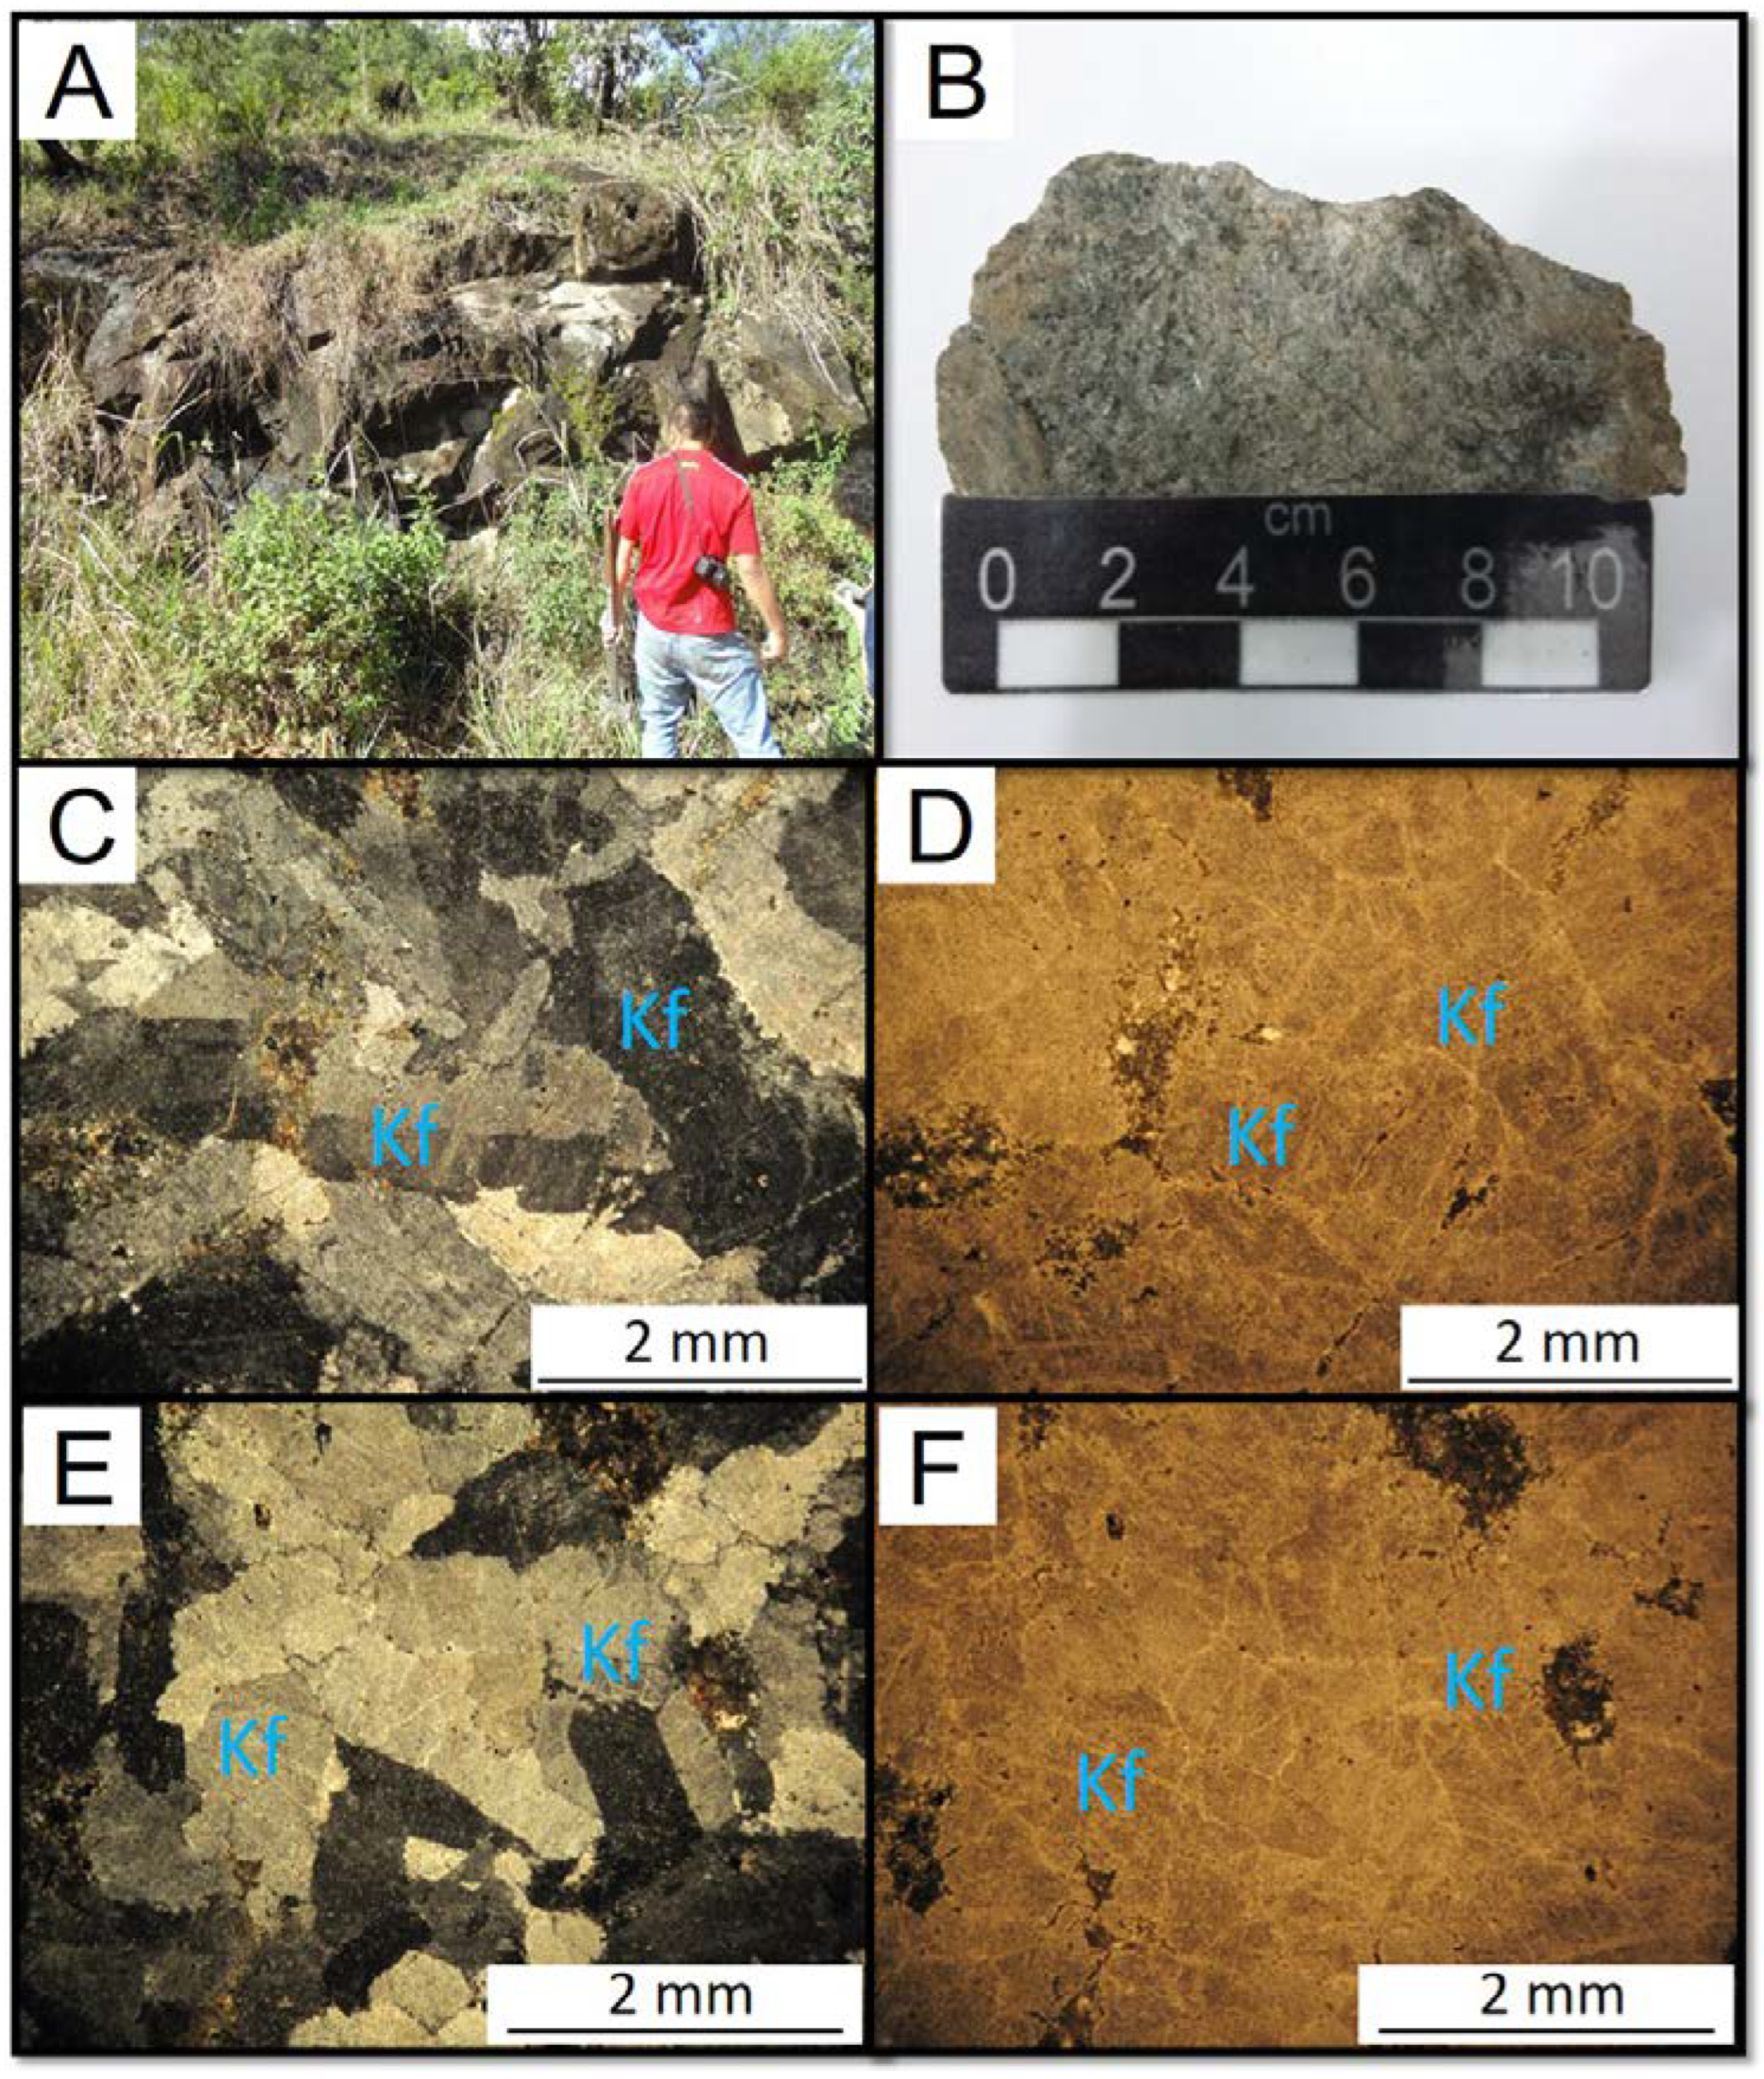
Figure 6.
(A) and (B) Hand specimen of the alkali feldspar trachyte. (C) to (F) Photomicrographs of the alkali feldspar trachyte. Sn = sanidine.
Figure 6.
(A) and (B) Hand specimen of the alkali feldspar trachyte. (C) to (F) Photomicrographs of the alkali feldspar trachyte. Sn = sanidine.
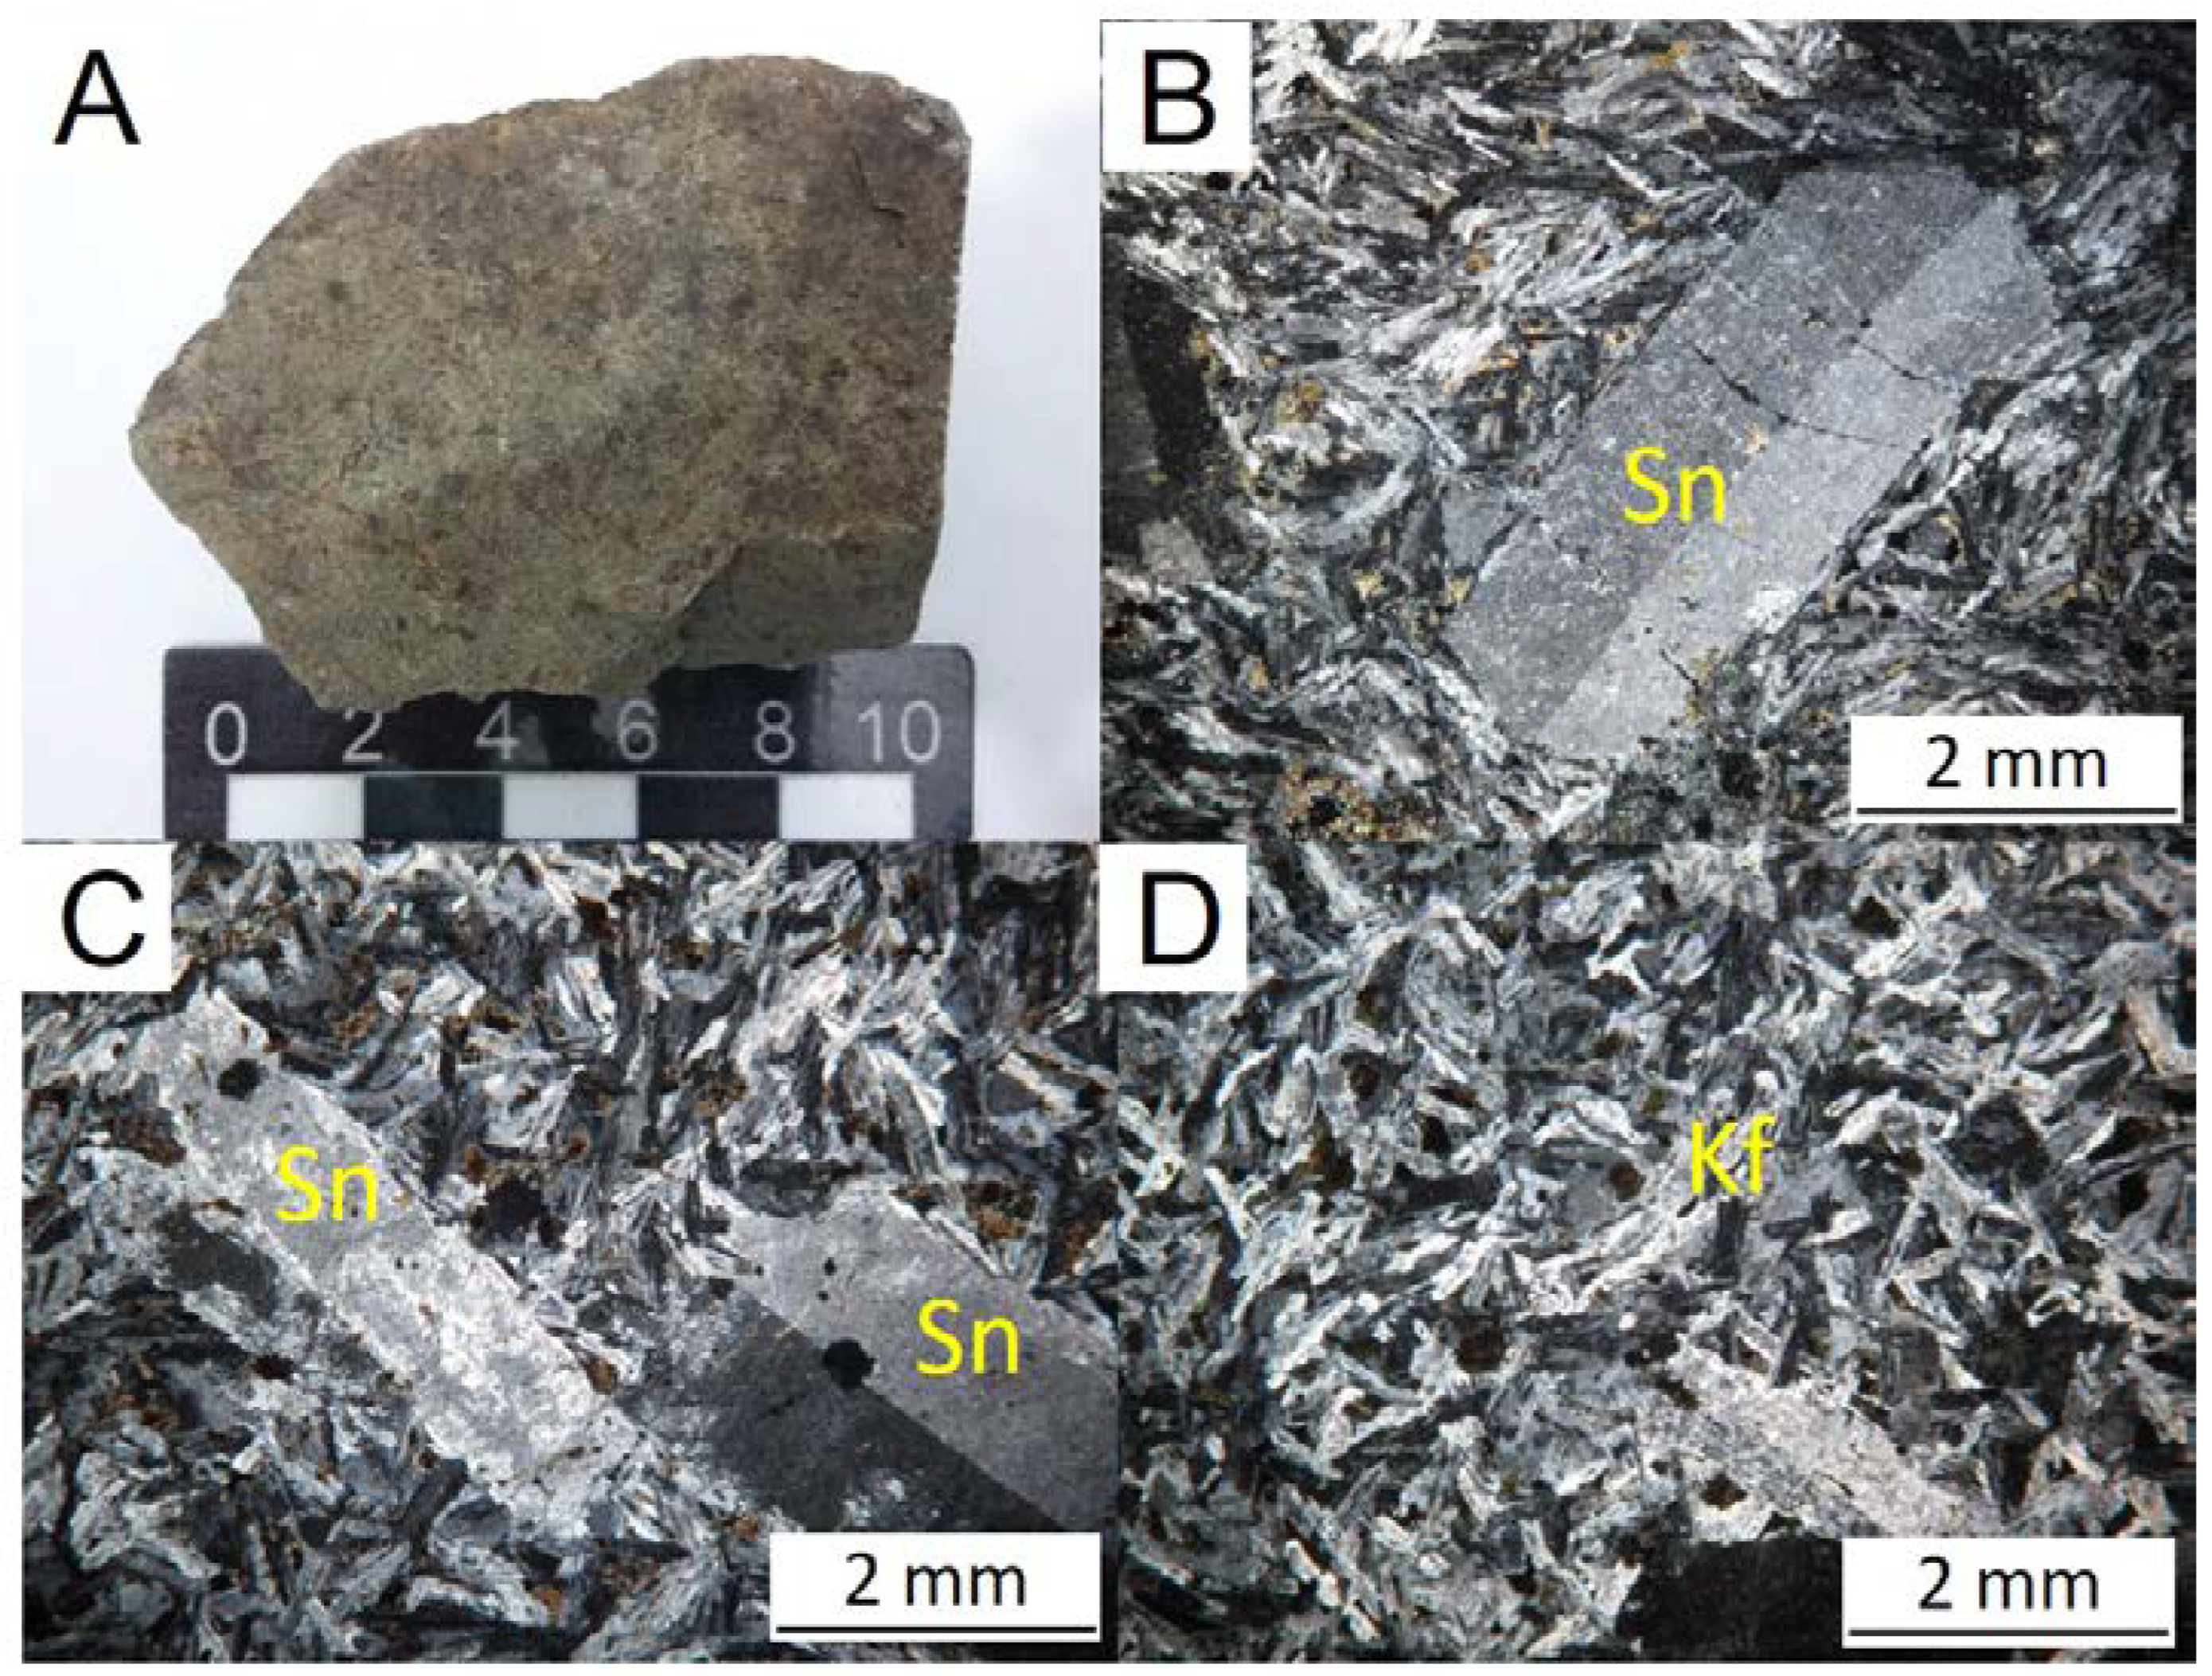
Figure 7.
Linear correlation matrices calculated for the main oxides and separated by different lithologies.
Figure 7.
Linear correlation matrices calculated for the main oxides and separated by different lithologies.
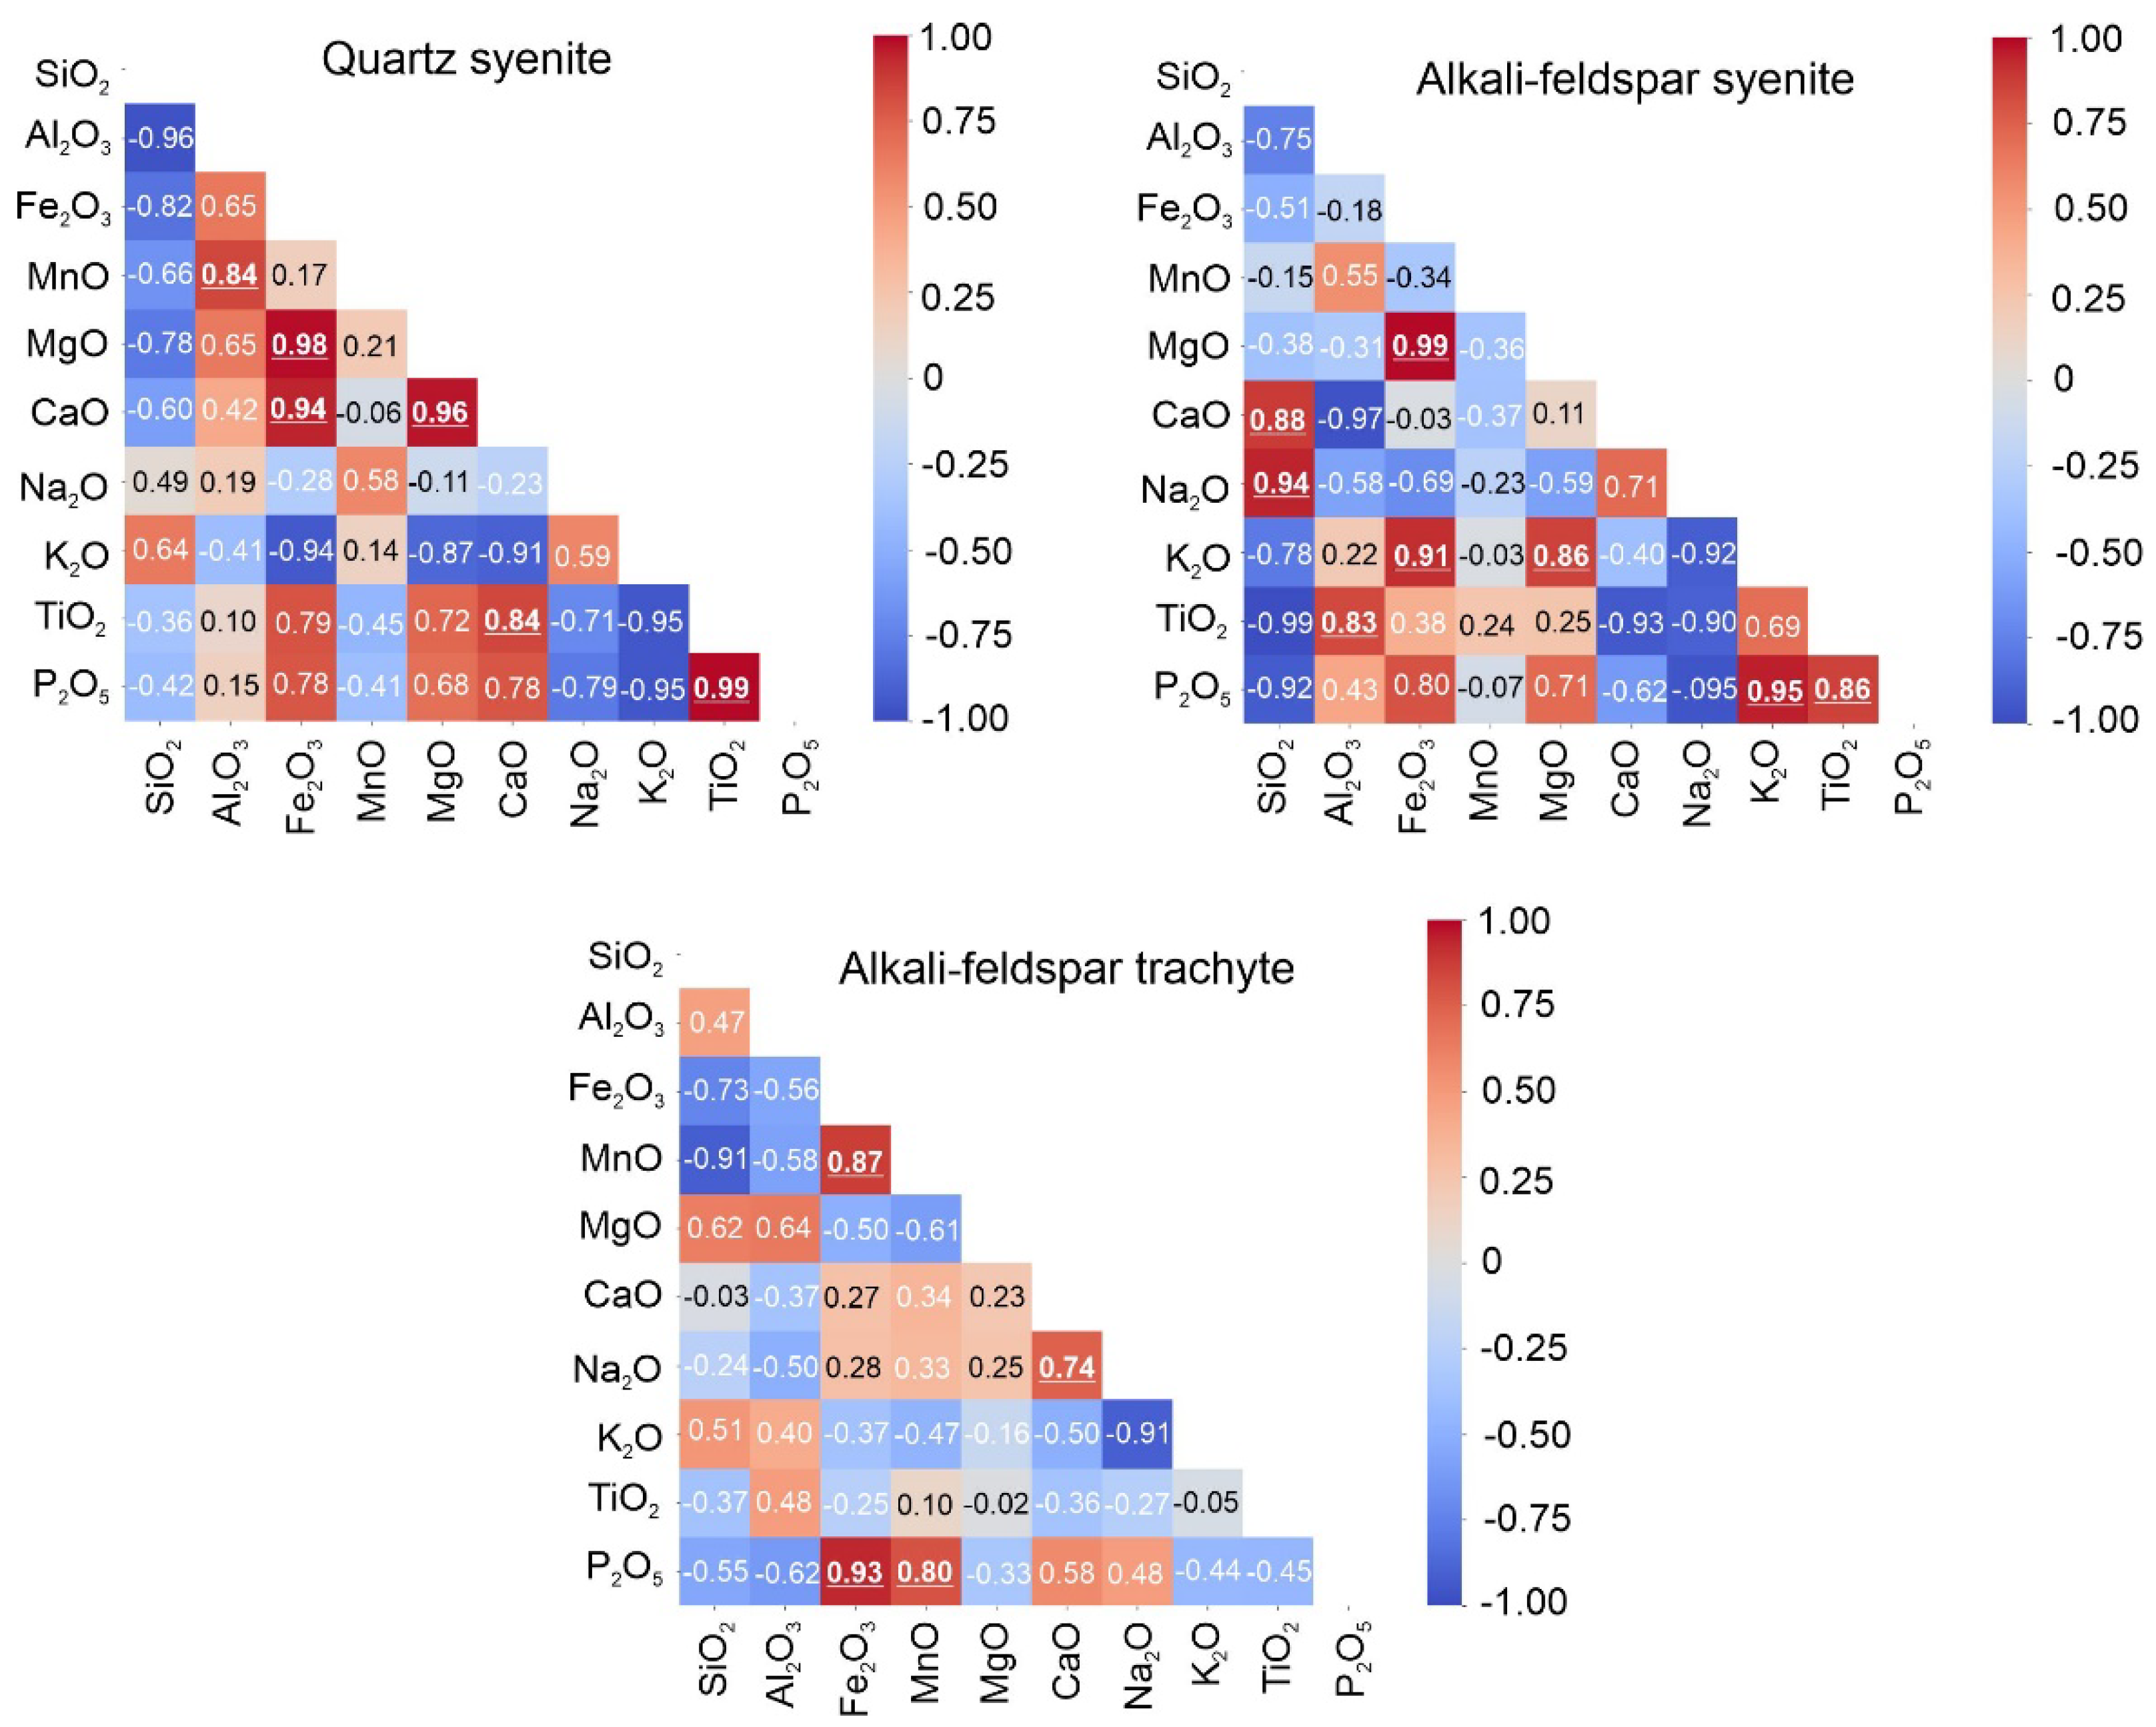
Figure 8.
TAS diagrams for classification of volcanic (A) and plutonic (B) rocks of the Soarinho intrusive complex.
Figure 8.
TAS diagrams for classification of volcanic (A) and plutonic (B) rocks of the Soarinho intrusive complex.
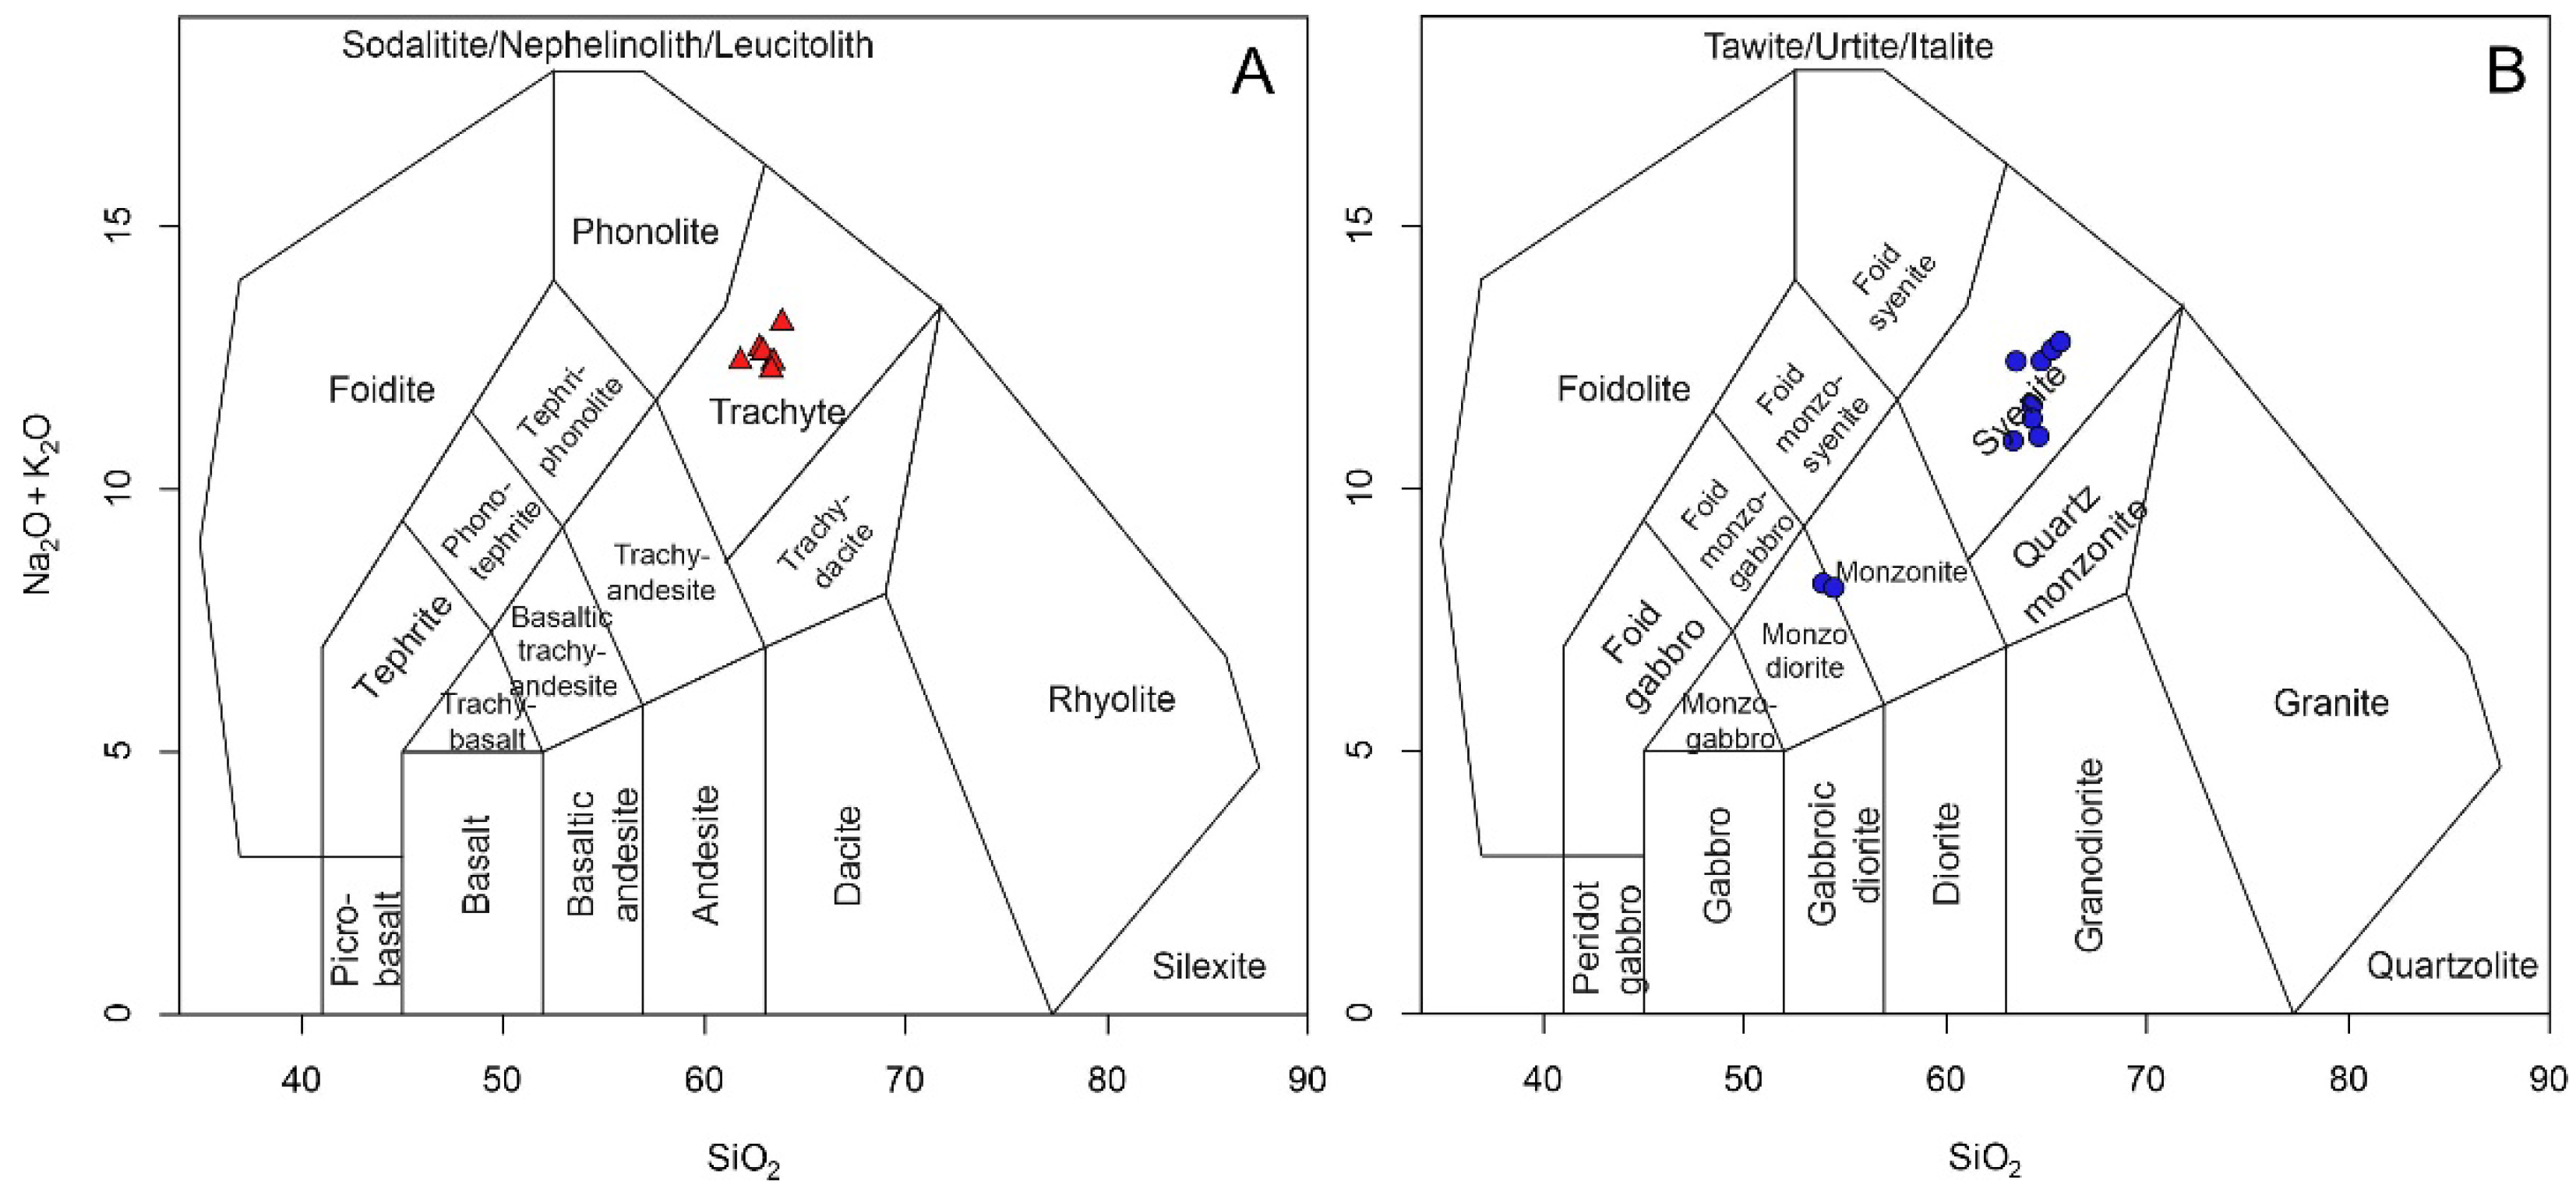
Figure 9.
Ultrapotassic, potassic, and sodic series diagram used to plot Soarinho, Rio Bonito, and Tanguá rocks (A). Al vs. SSI diagram with data from Soarinho, Rio Bonito, and Tanguá rocks (B). SSI vs. (N+K)/Al (mol) diagram with data from Soarinho, Rio Bonito, and Tanguá rocks (C) [9,19,38,39].
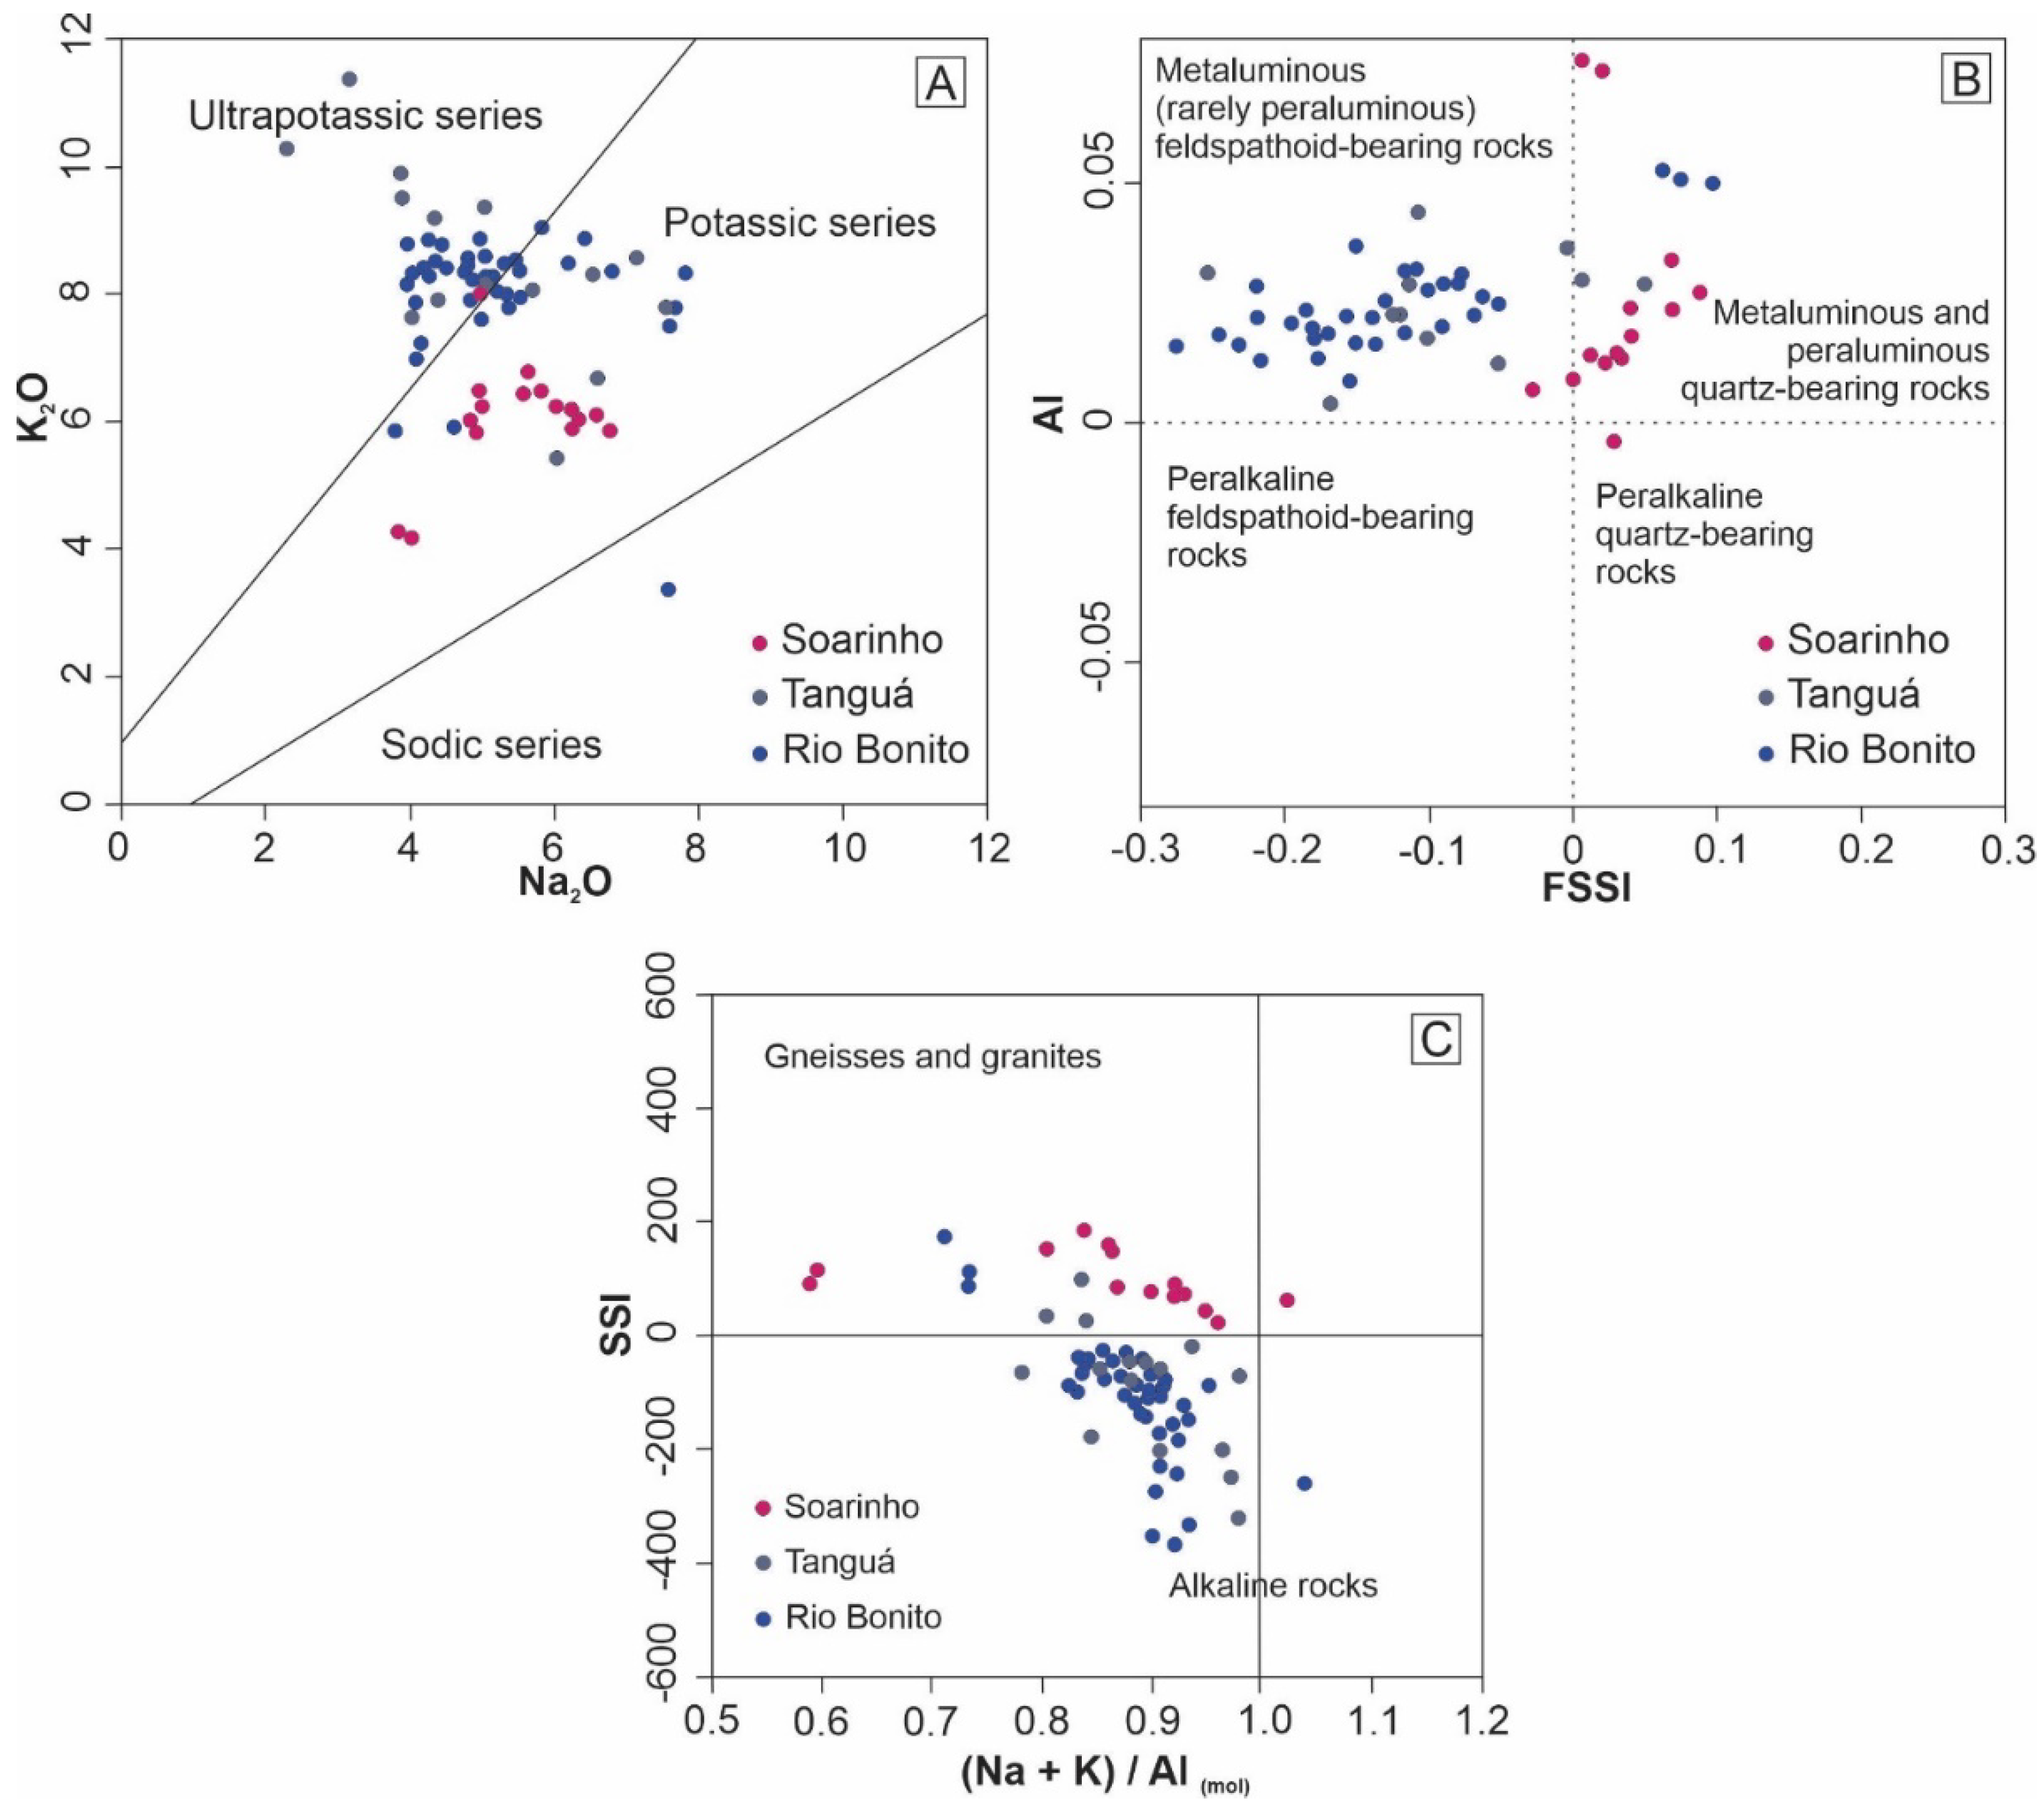
Figure 10.
Chondrite normalized REE diagrams for Soarinho rocks [40].
Figure 10.
Chondrite normalized REE diagrams for Soarinho rocks [40].
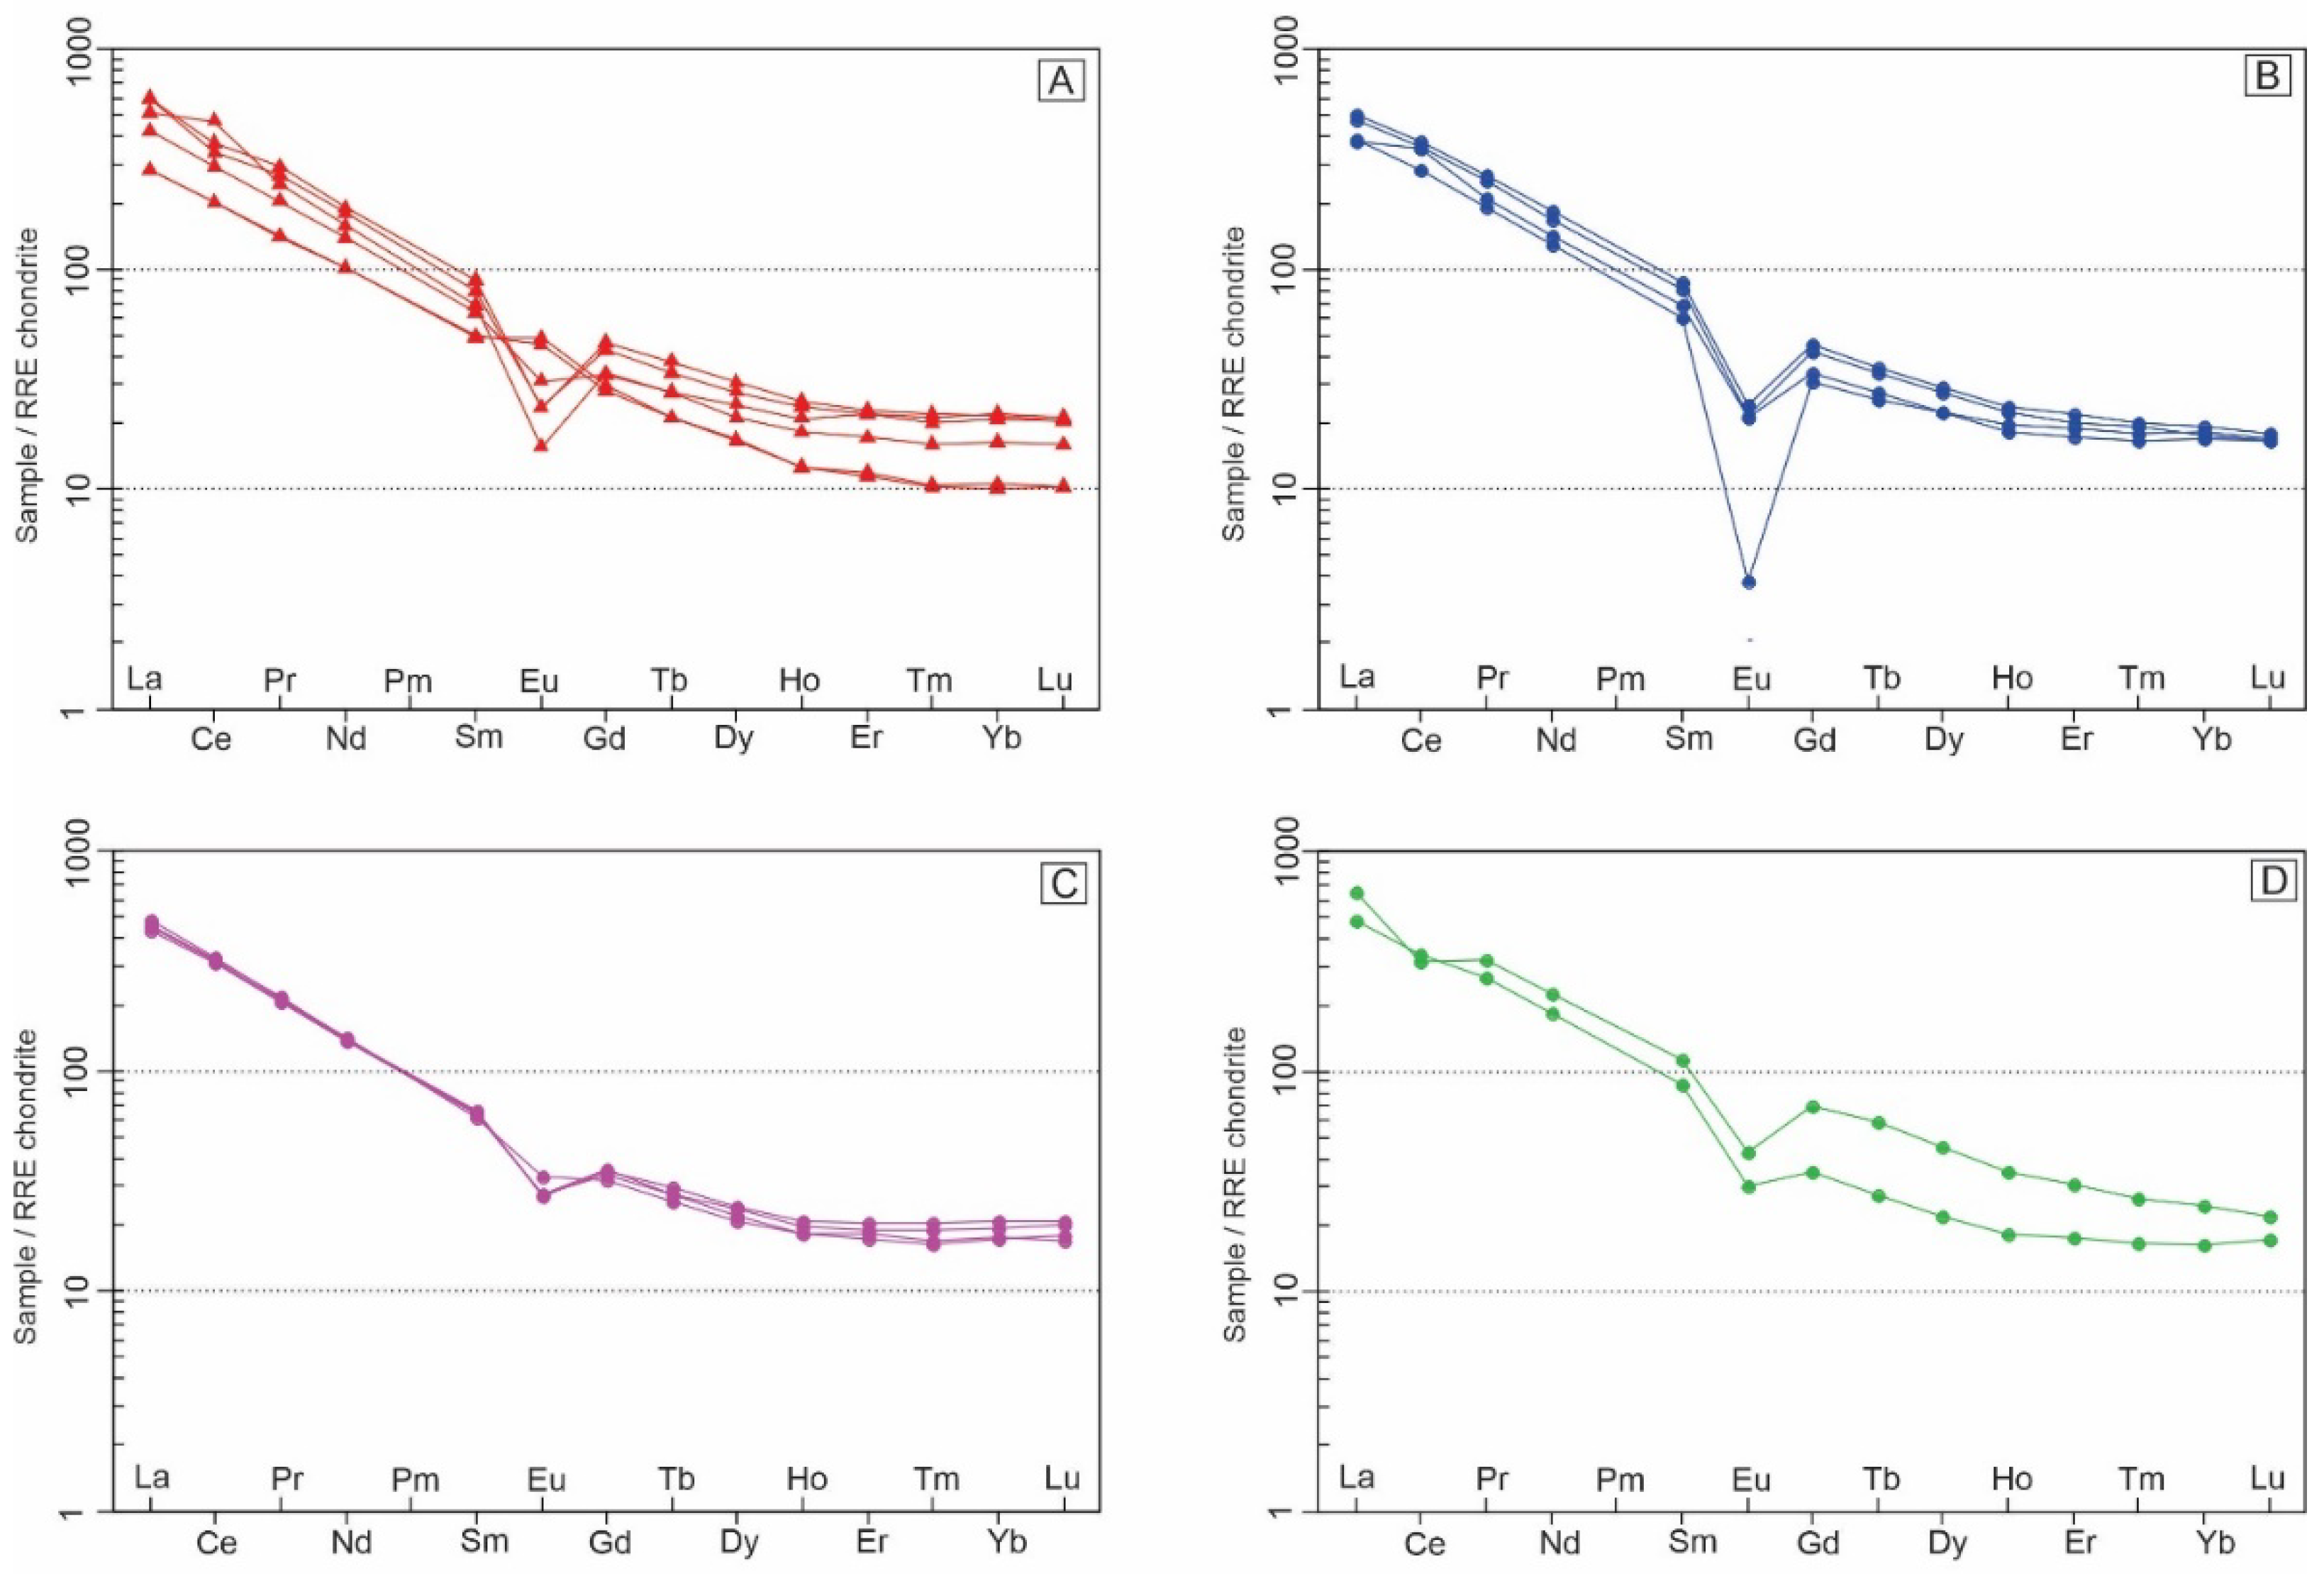
Figure 11.
Primitive mantle normalized multi-element diagrams for Soarinho rocks [41].
Figure 11.
Primitive mantle normalized multi-element diagrams for Soarinho rocks [41].
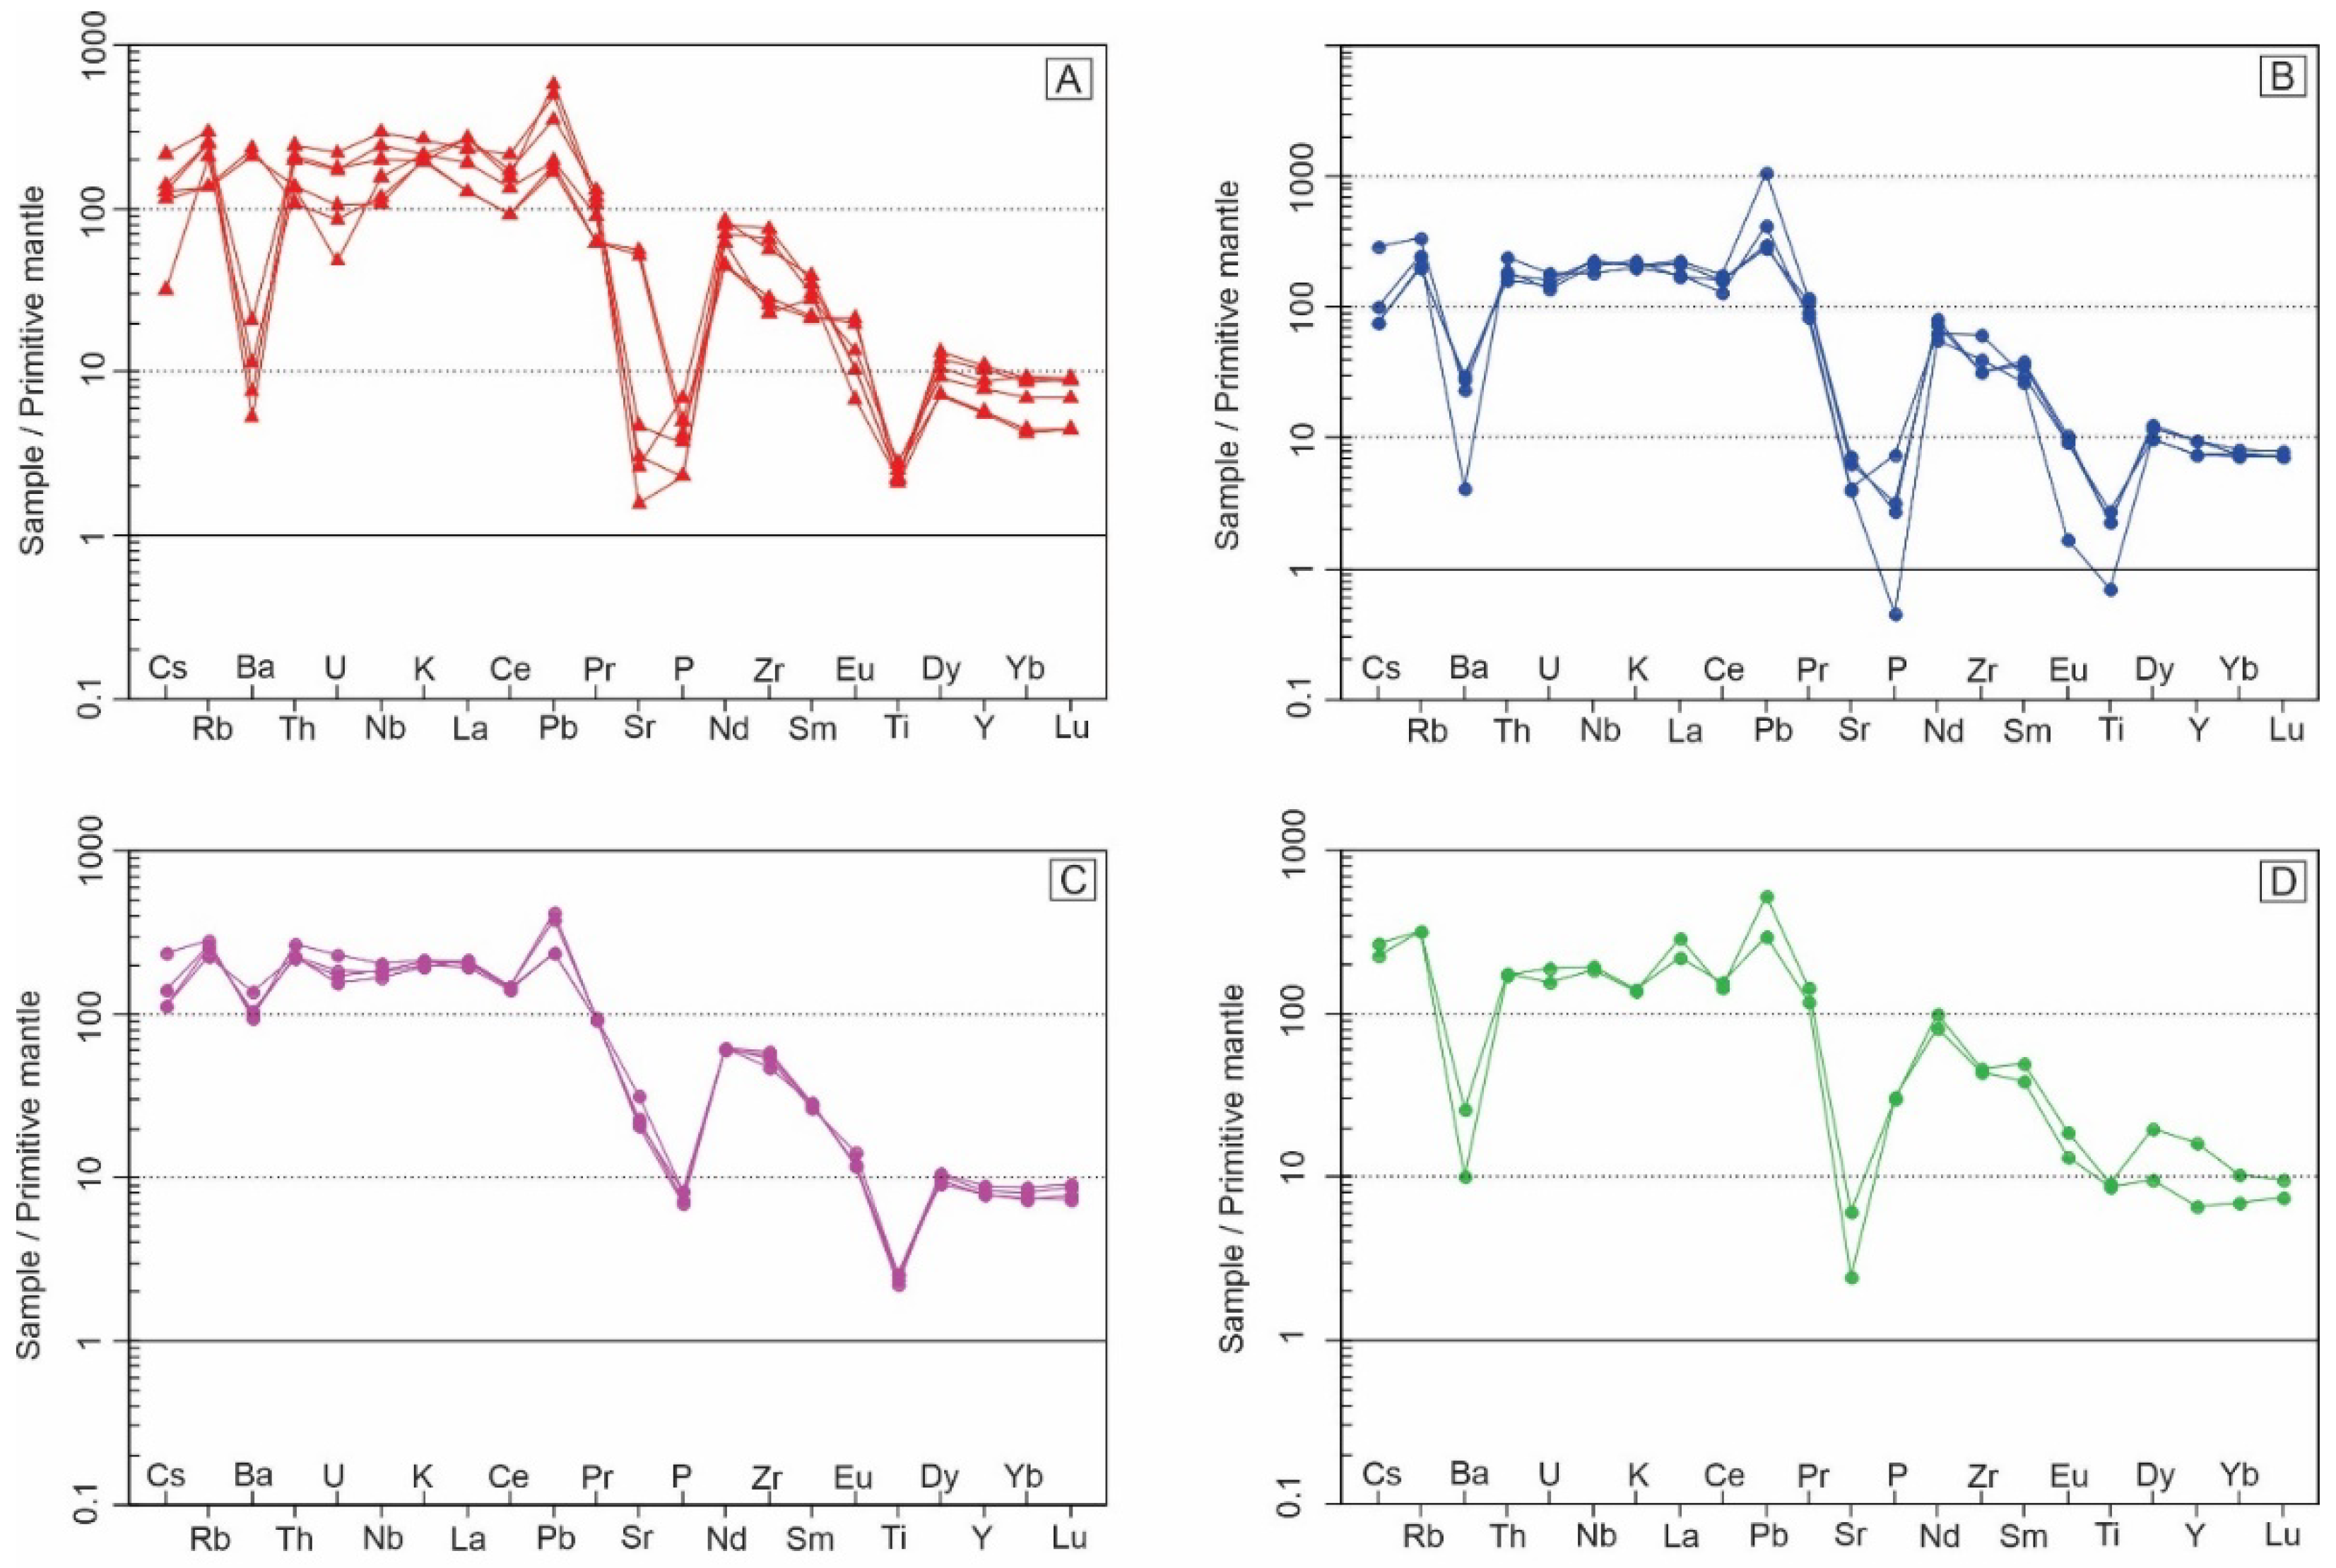
Figure 12.
Zircon U-Pb concord diagrams from quartz syenite (A), monzonite (B) and alkali-feldspar syenite (C).
Figure 12.
Zircon U-Pb concord diagrams from quartz syenite (A), monzonite (B) and alkali-feldspar syenite (C).
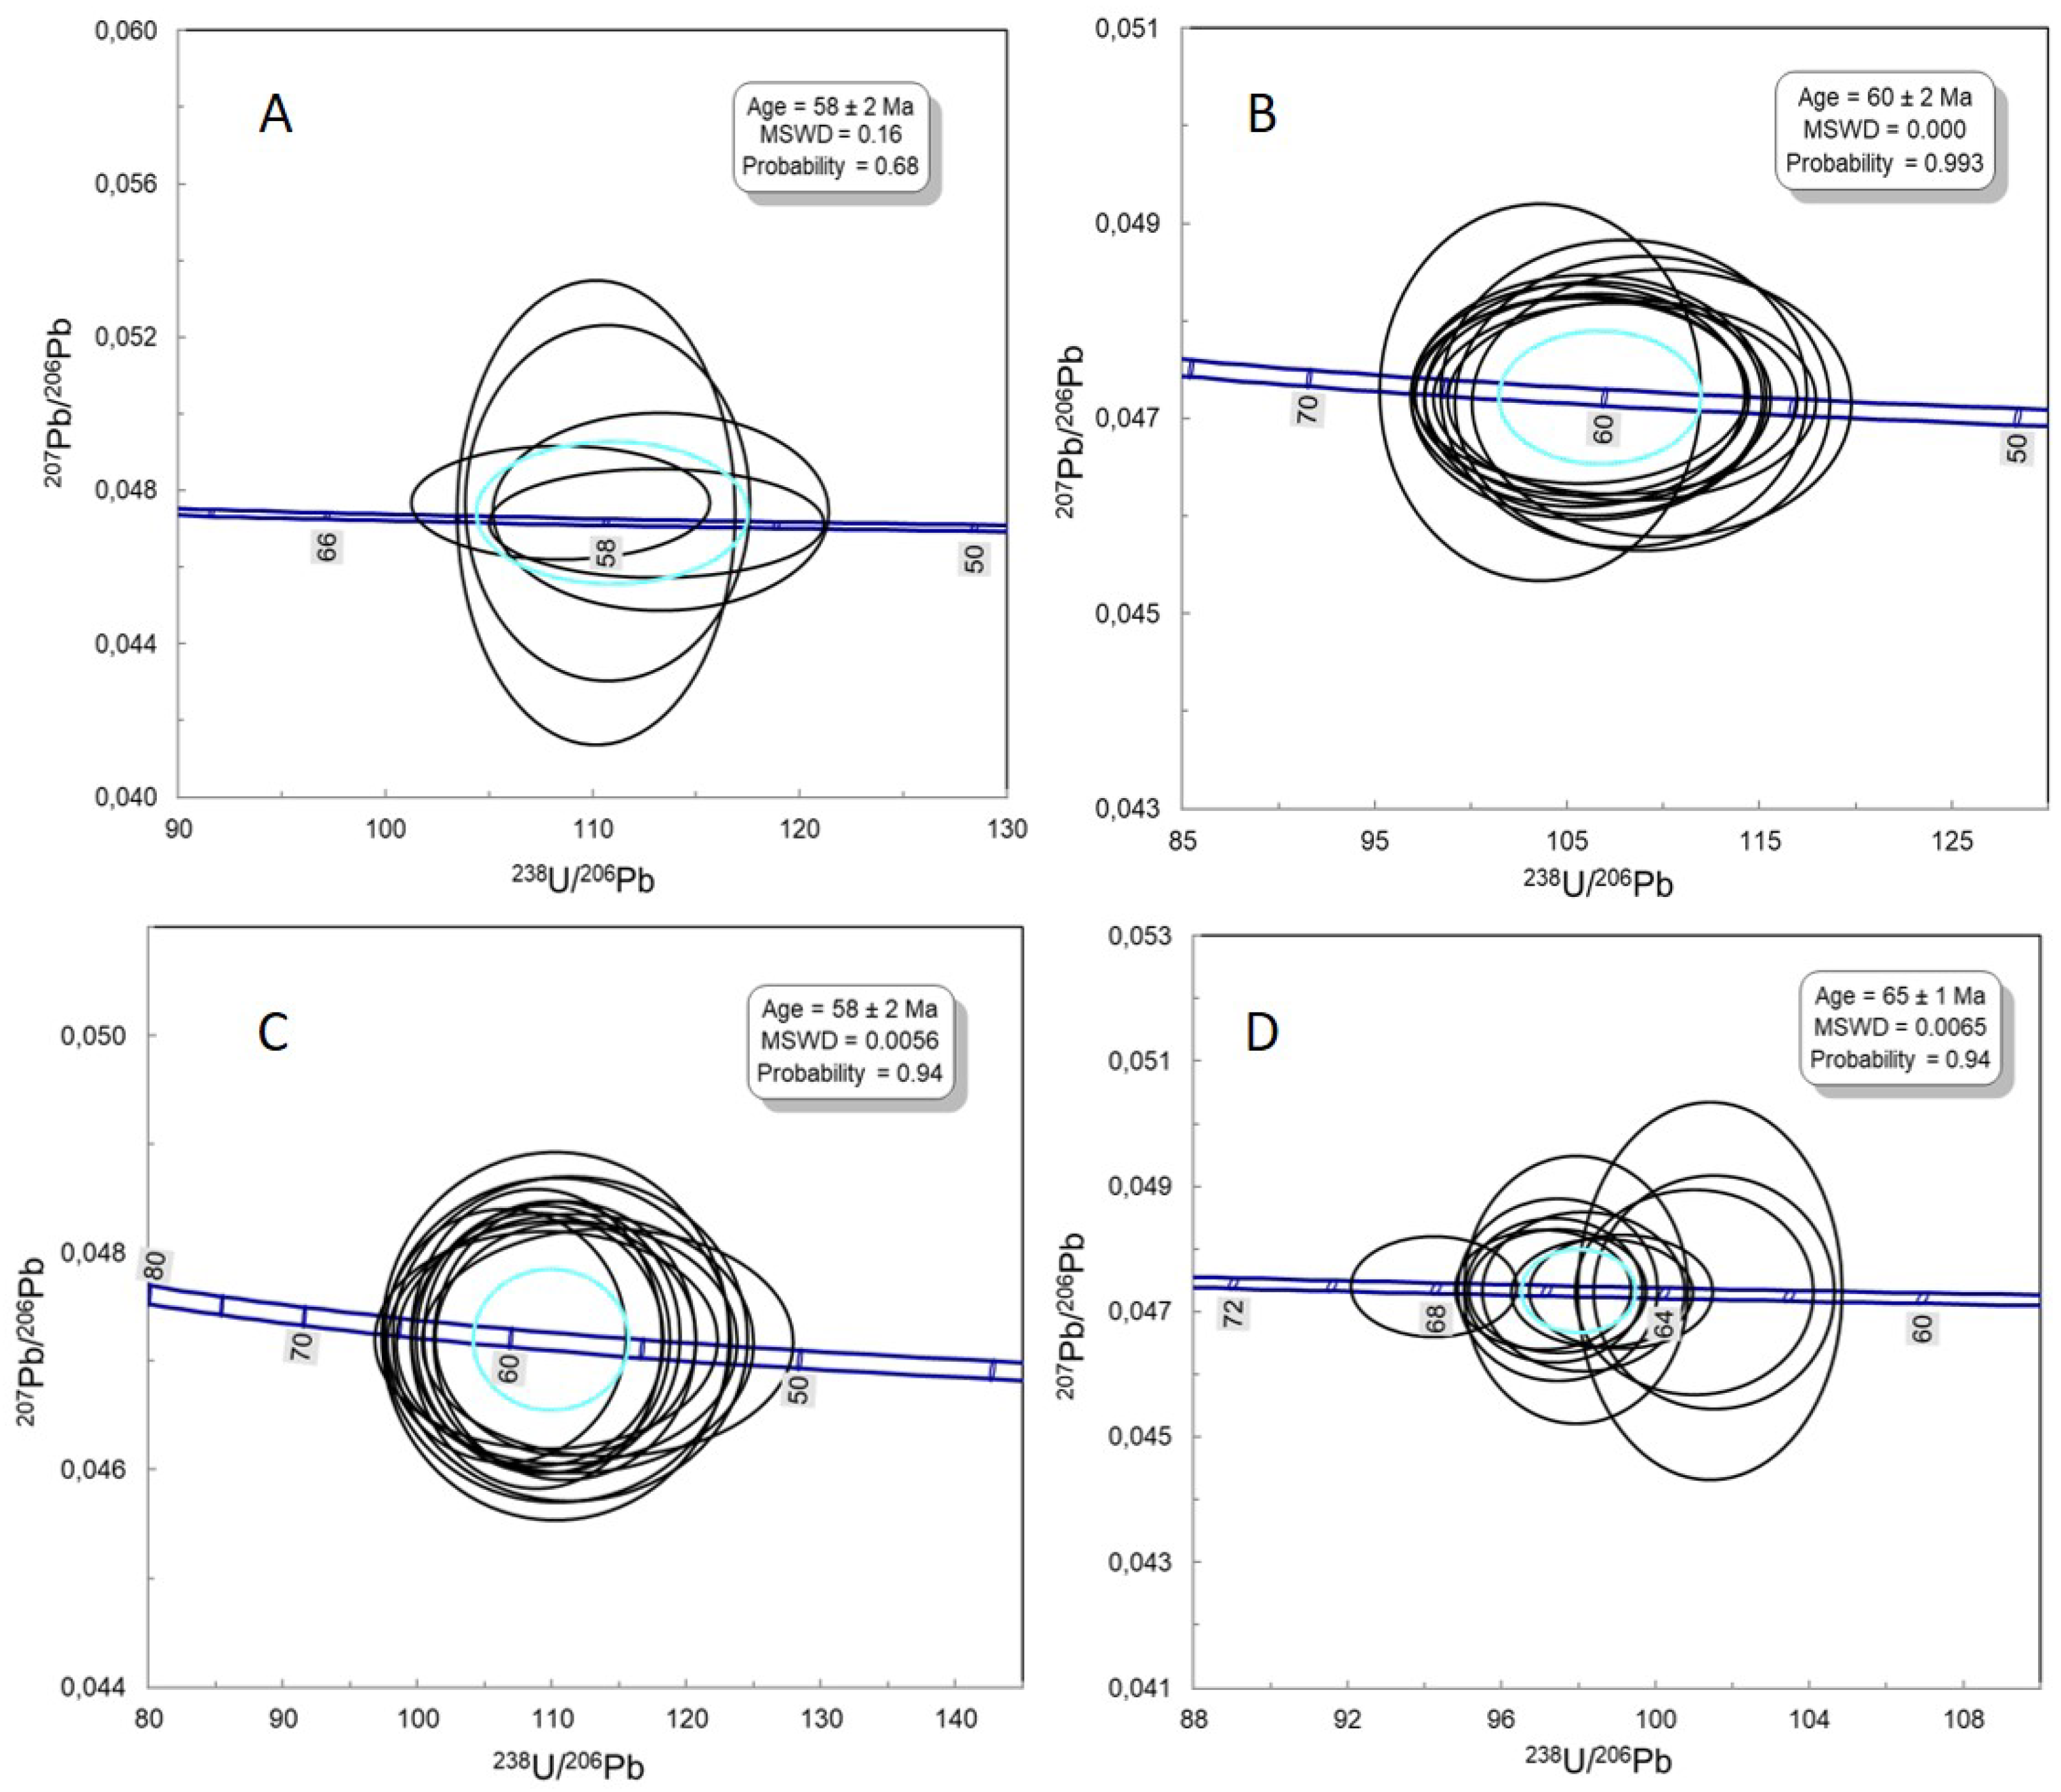
Figure 13.
Variation in epsilon Hf values in syenite, monzonite, and syenite alkali-feldspar samples. In the figure, the range of the epsilon Hf is demonstrated through histogram and boxplot diagrams.
Figure 13.
Variation in epsilon Hf values in syenite, monzonite, and syenite alkali-feldspar samples. In the figure, the range of the epsilon Hf is demonstrated through histogram and boxplot diagrams.
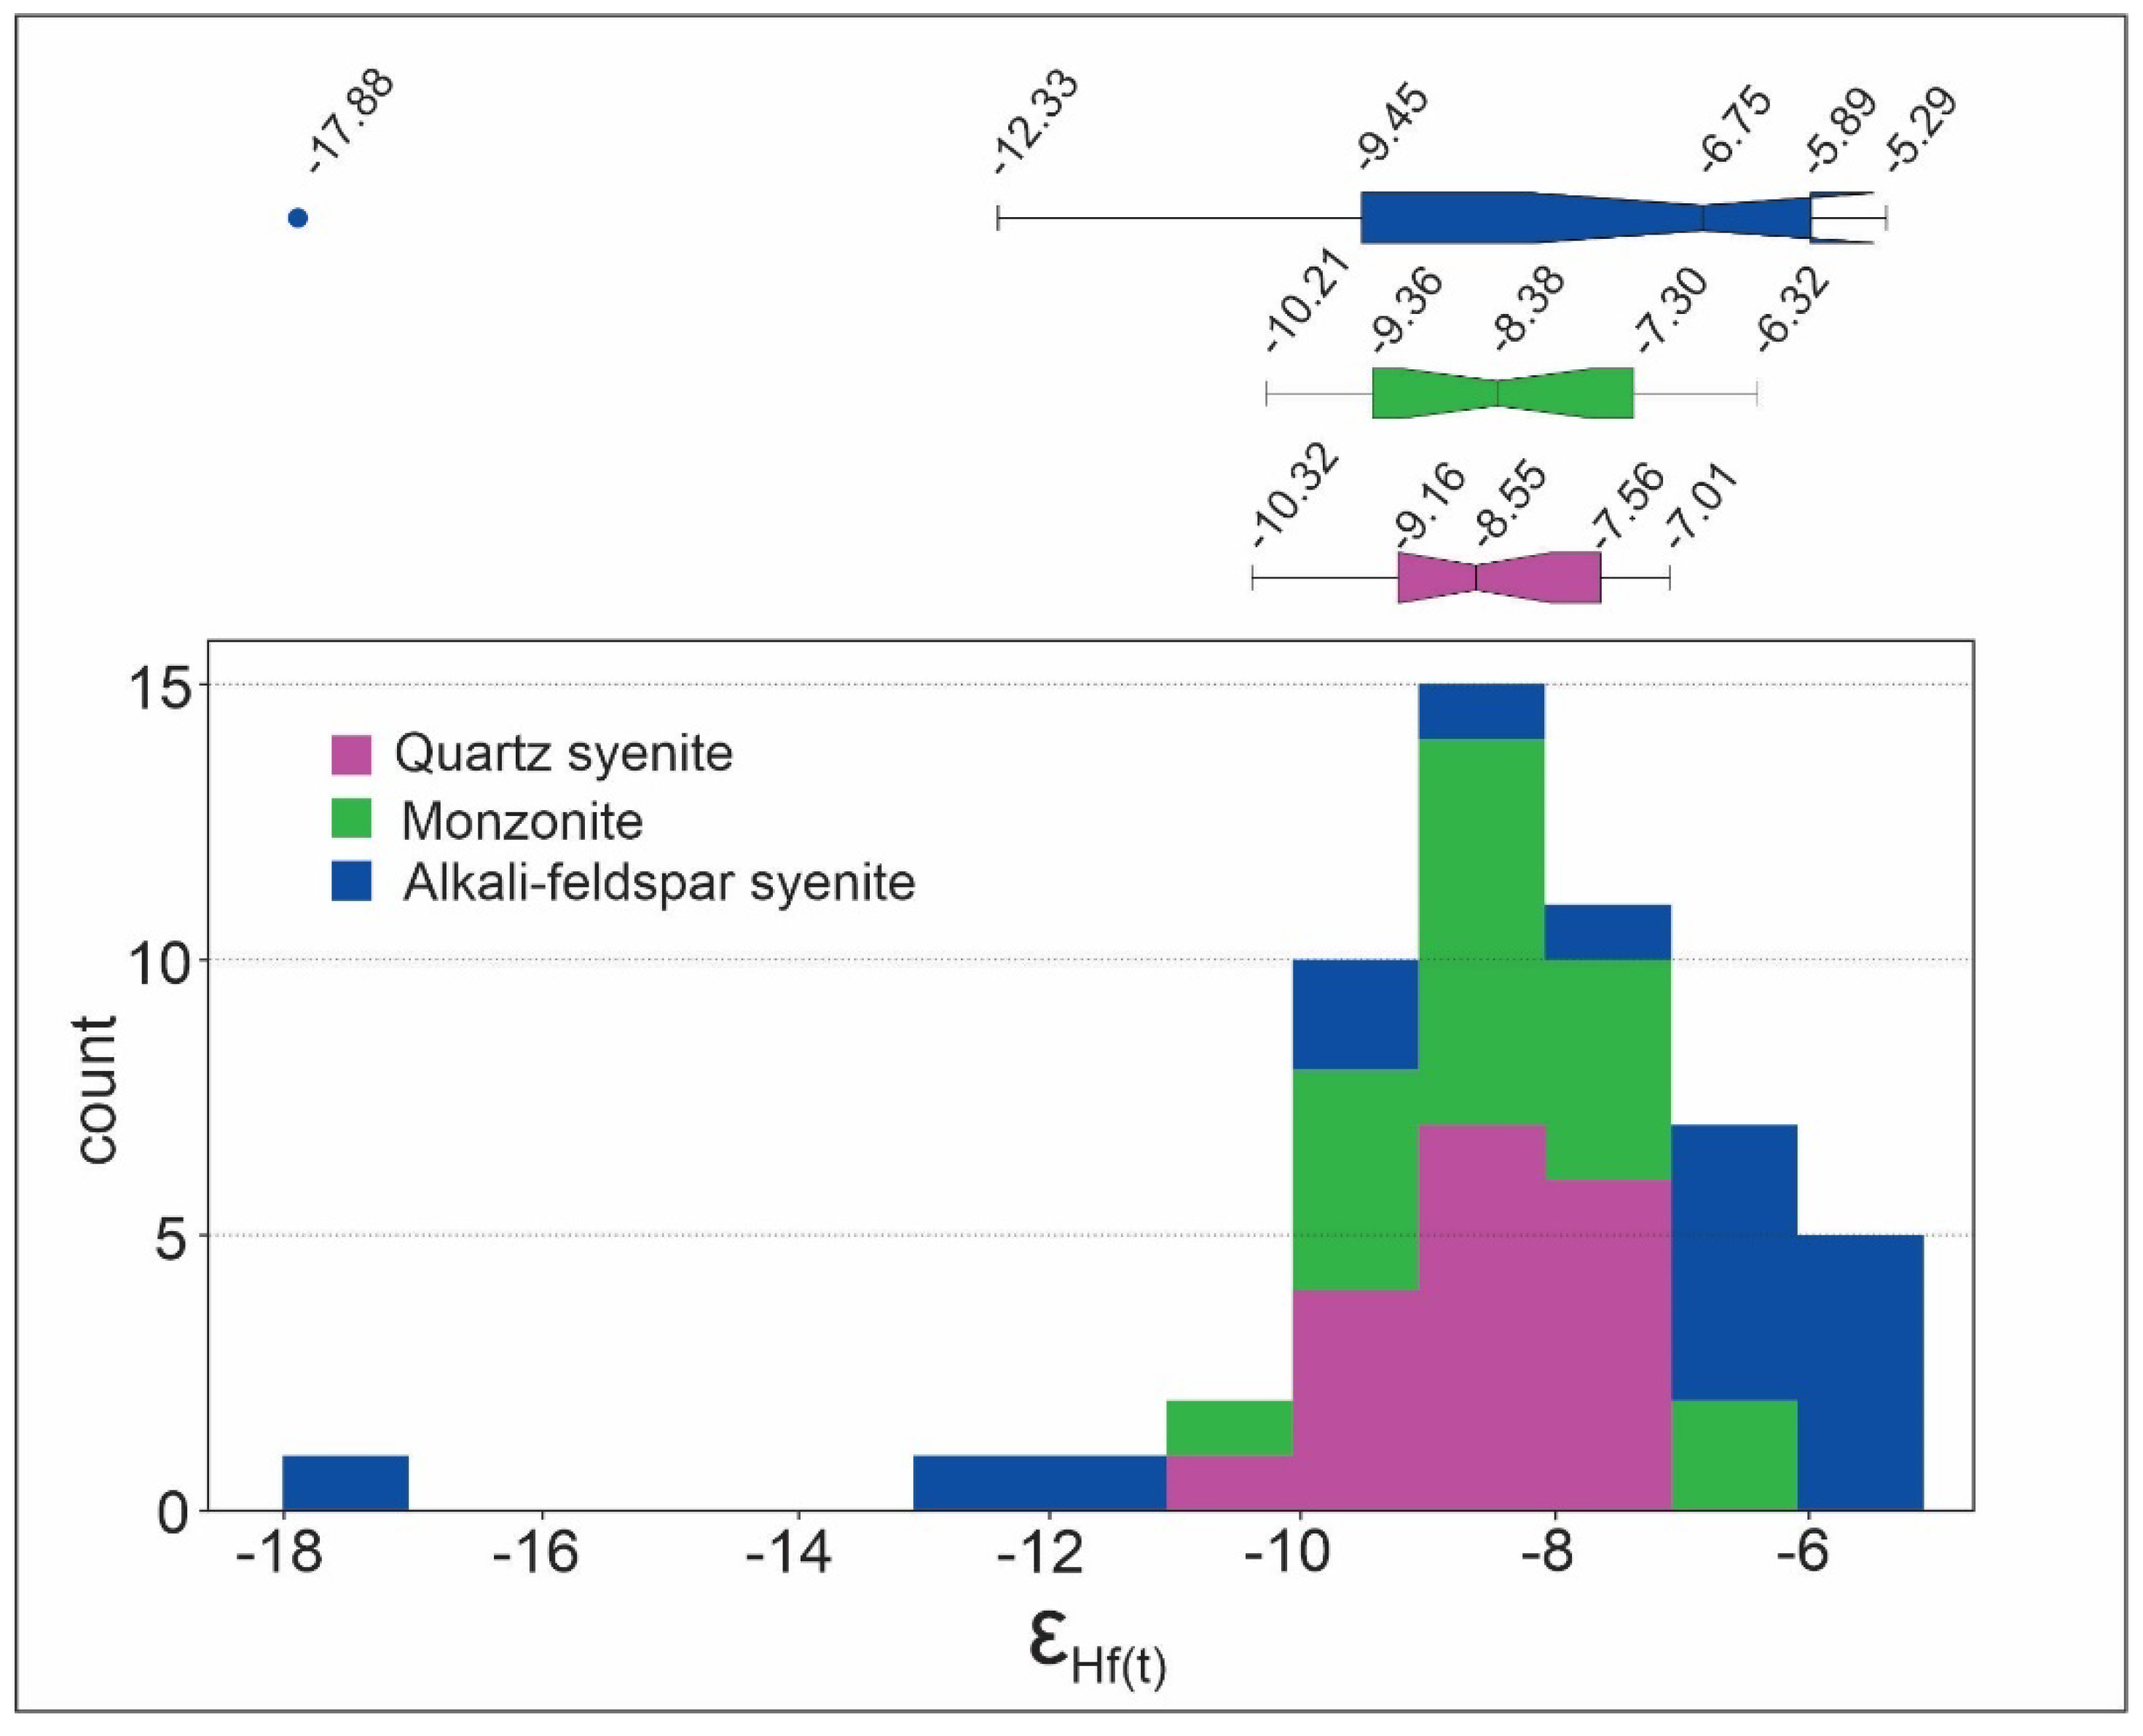
Figure 14.
Epsilon Hf evolution diagram with data from the Soarinho, Tanguá, and Rio Bonito massifs.
Figure 14.
Epsilon Hf evolution diagram with data from the Soarinho, Tanguá, and Rio Bonito massifs.
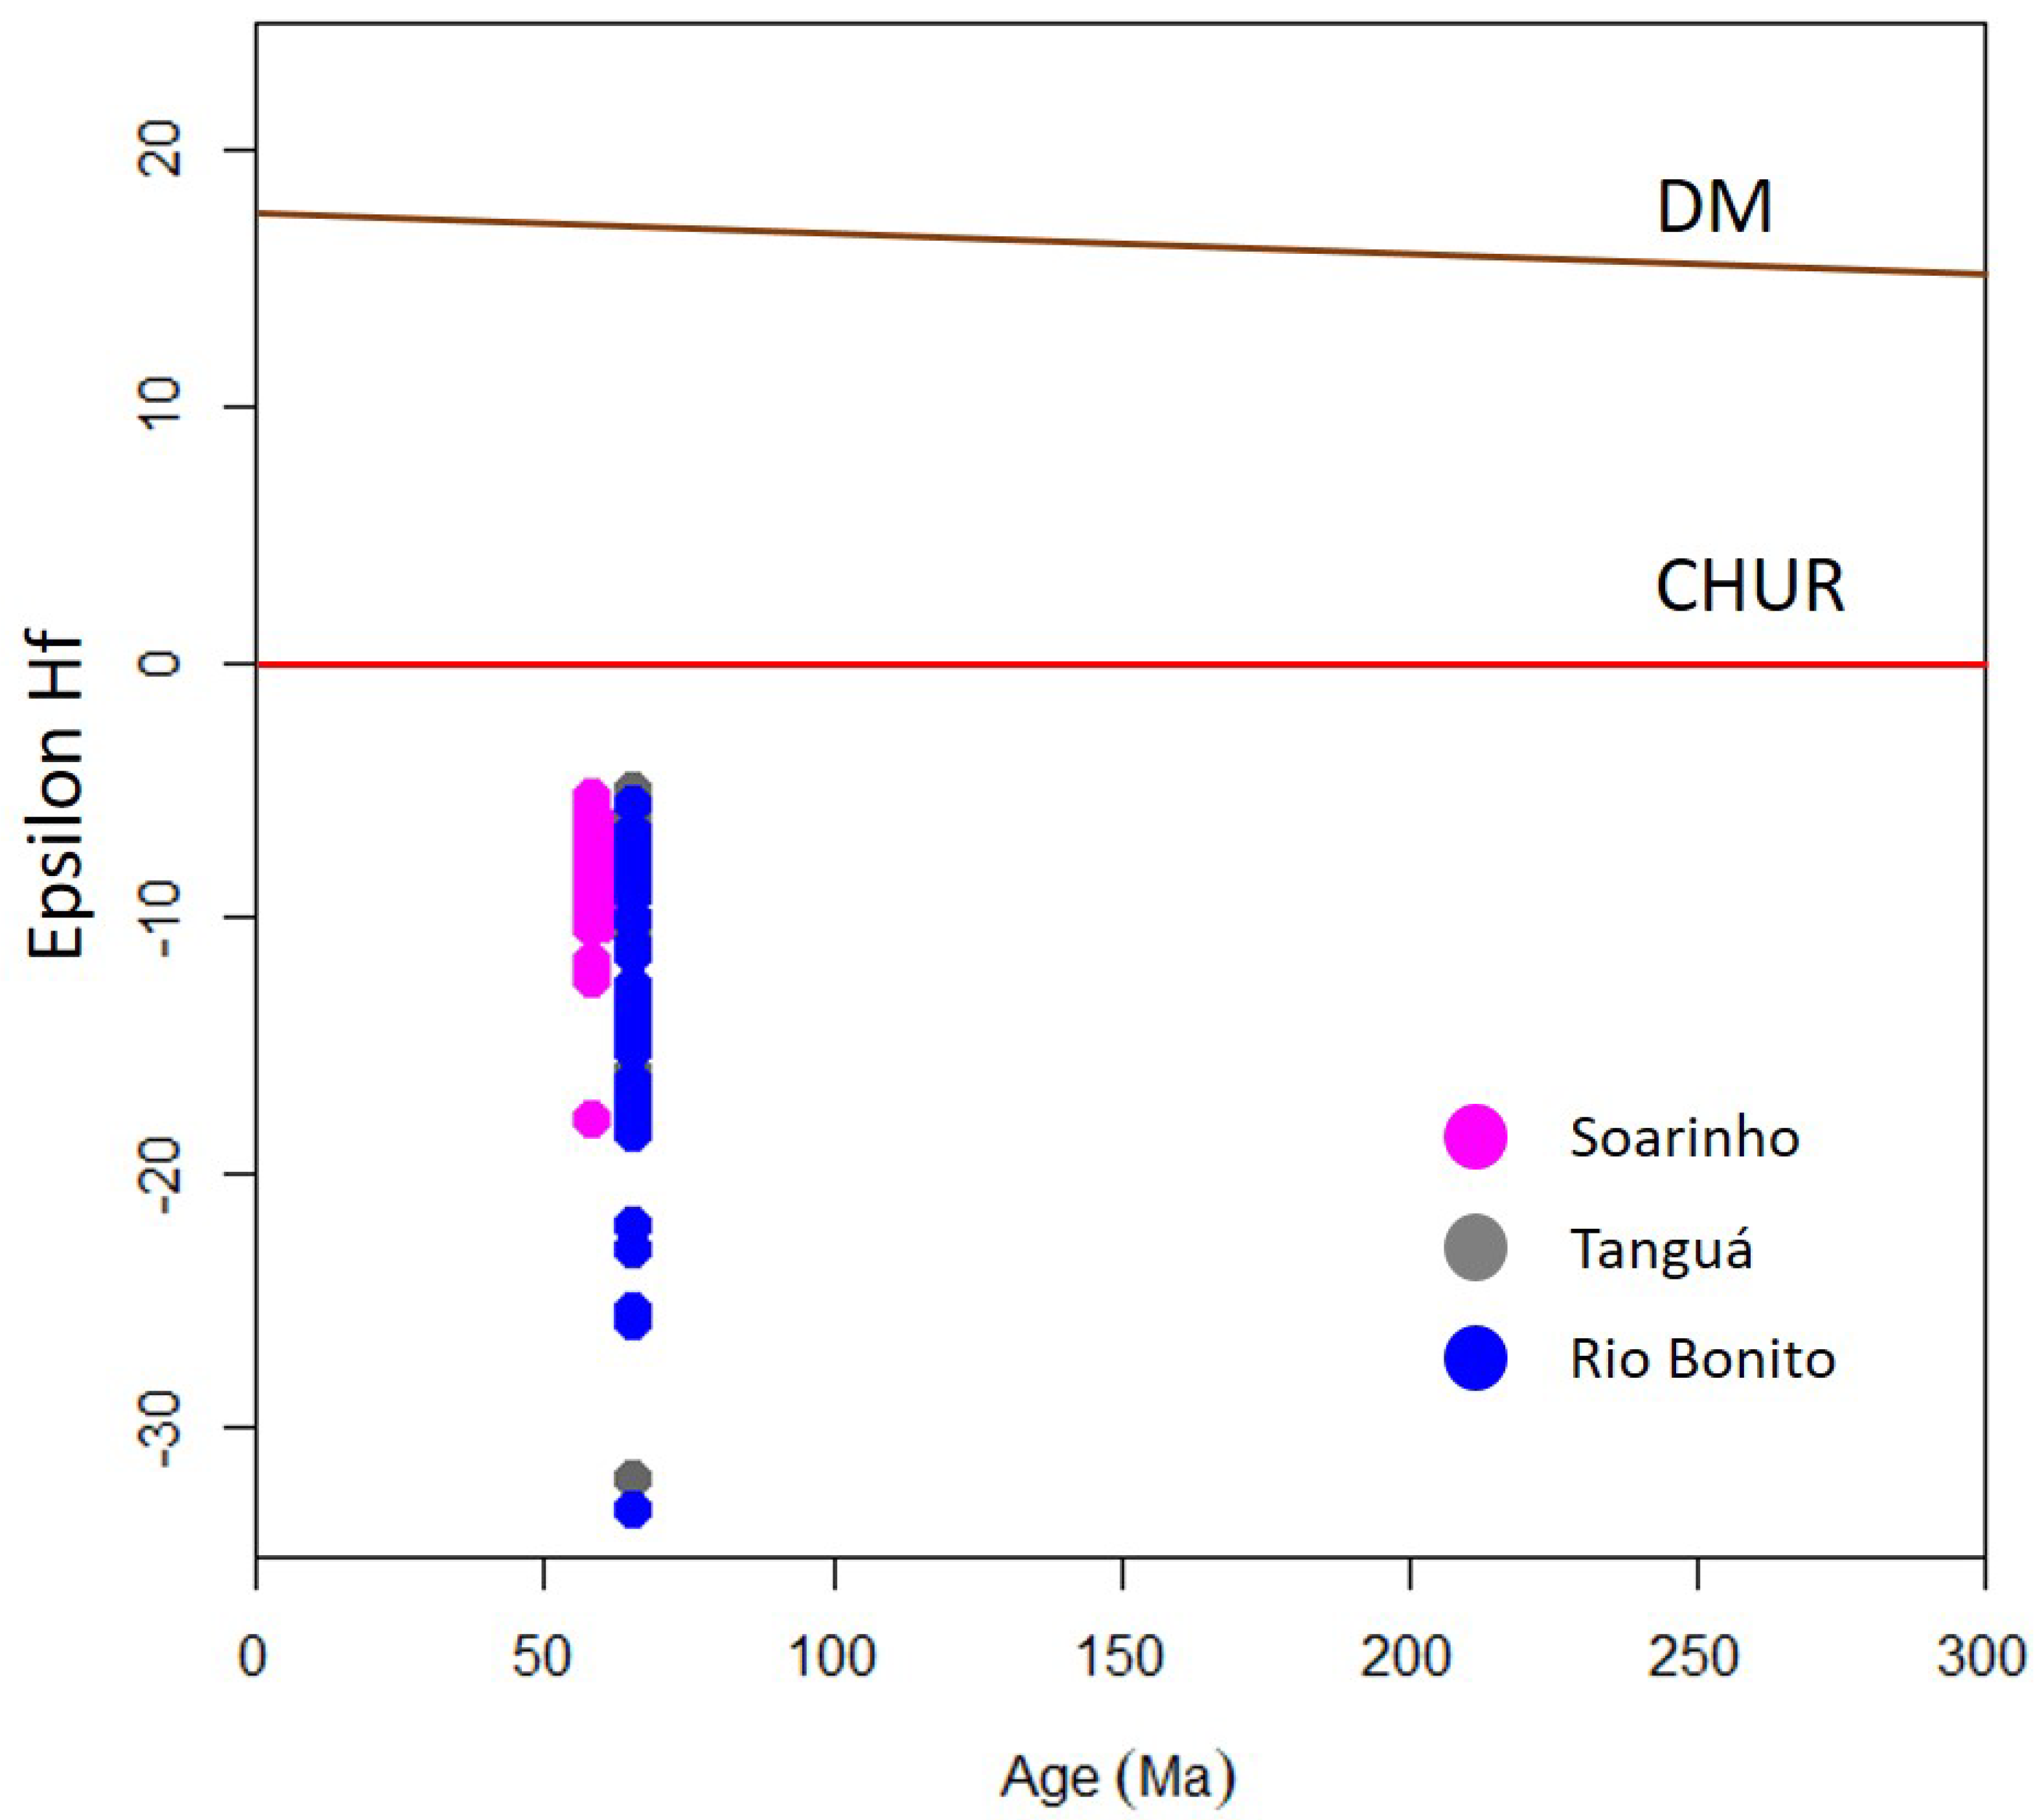
Figure 15.
Primitive mantle normalized [42] multi elementary diagrams comparing a sampled quartz syenite (SOA-01B) with a model of mixing between monzonite and alkali feldspar syenite. All diagrams use the sample SOA-02A (monzonite) as magma 1 mixing it with the four-alkali feldspar syenites (SOA-05 (A), SOA-03 (B), SOA-06A (C) and SOA-06B (D)) as magma 2.
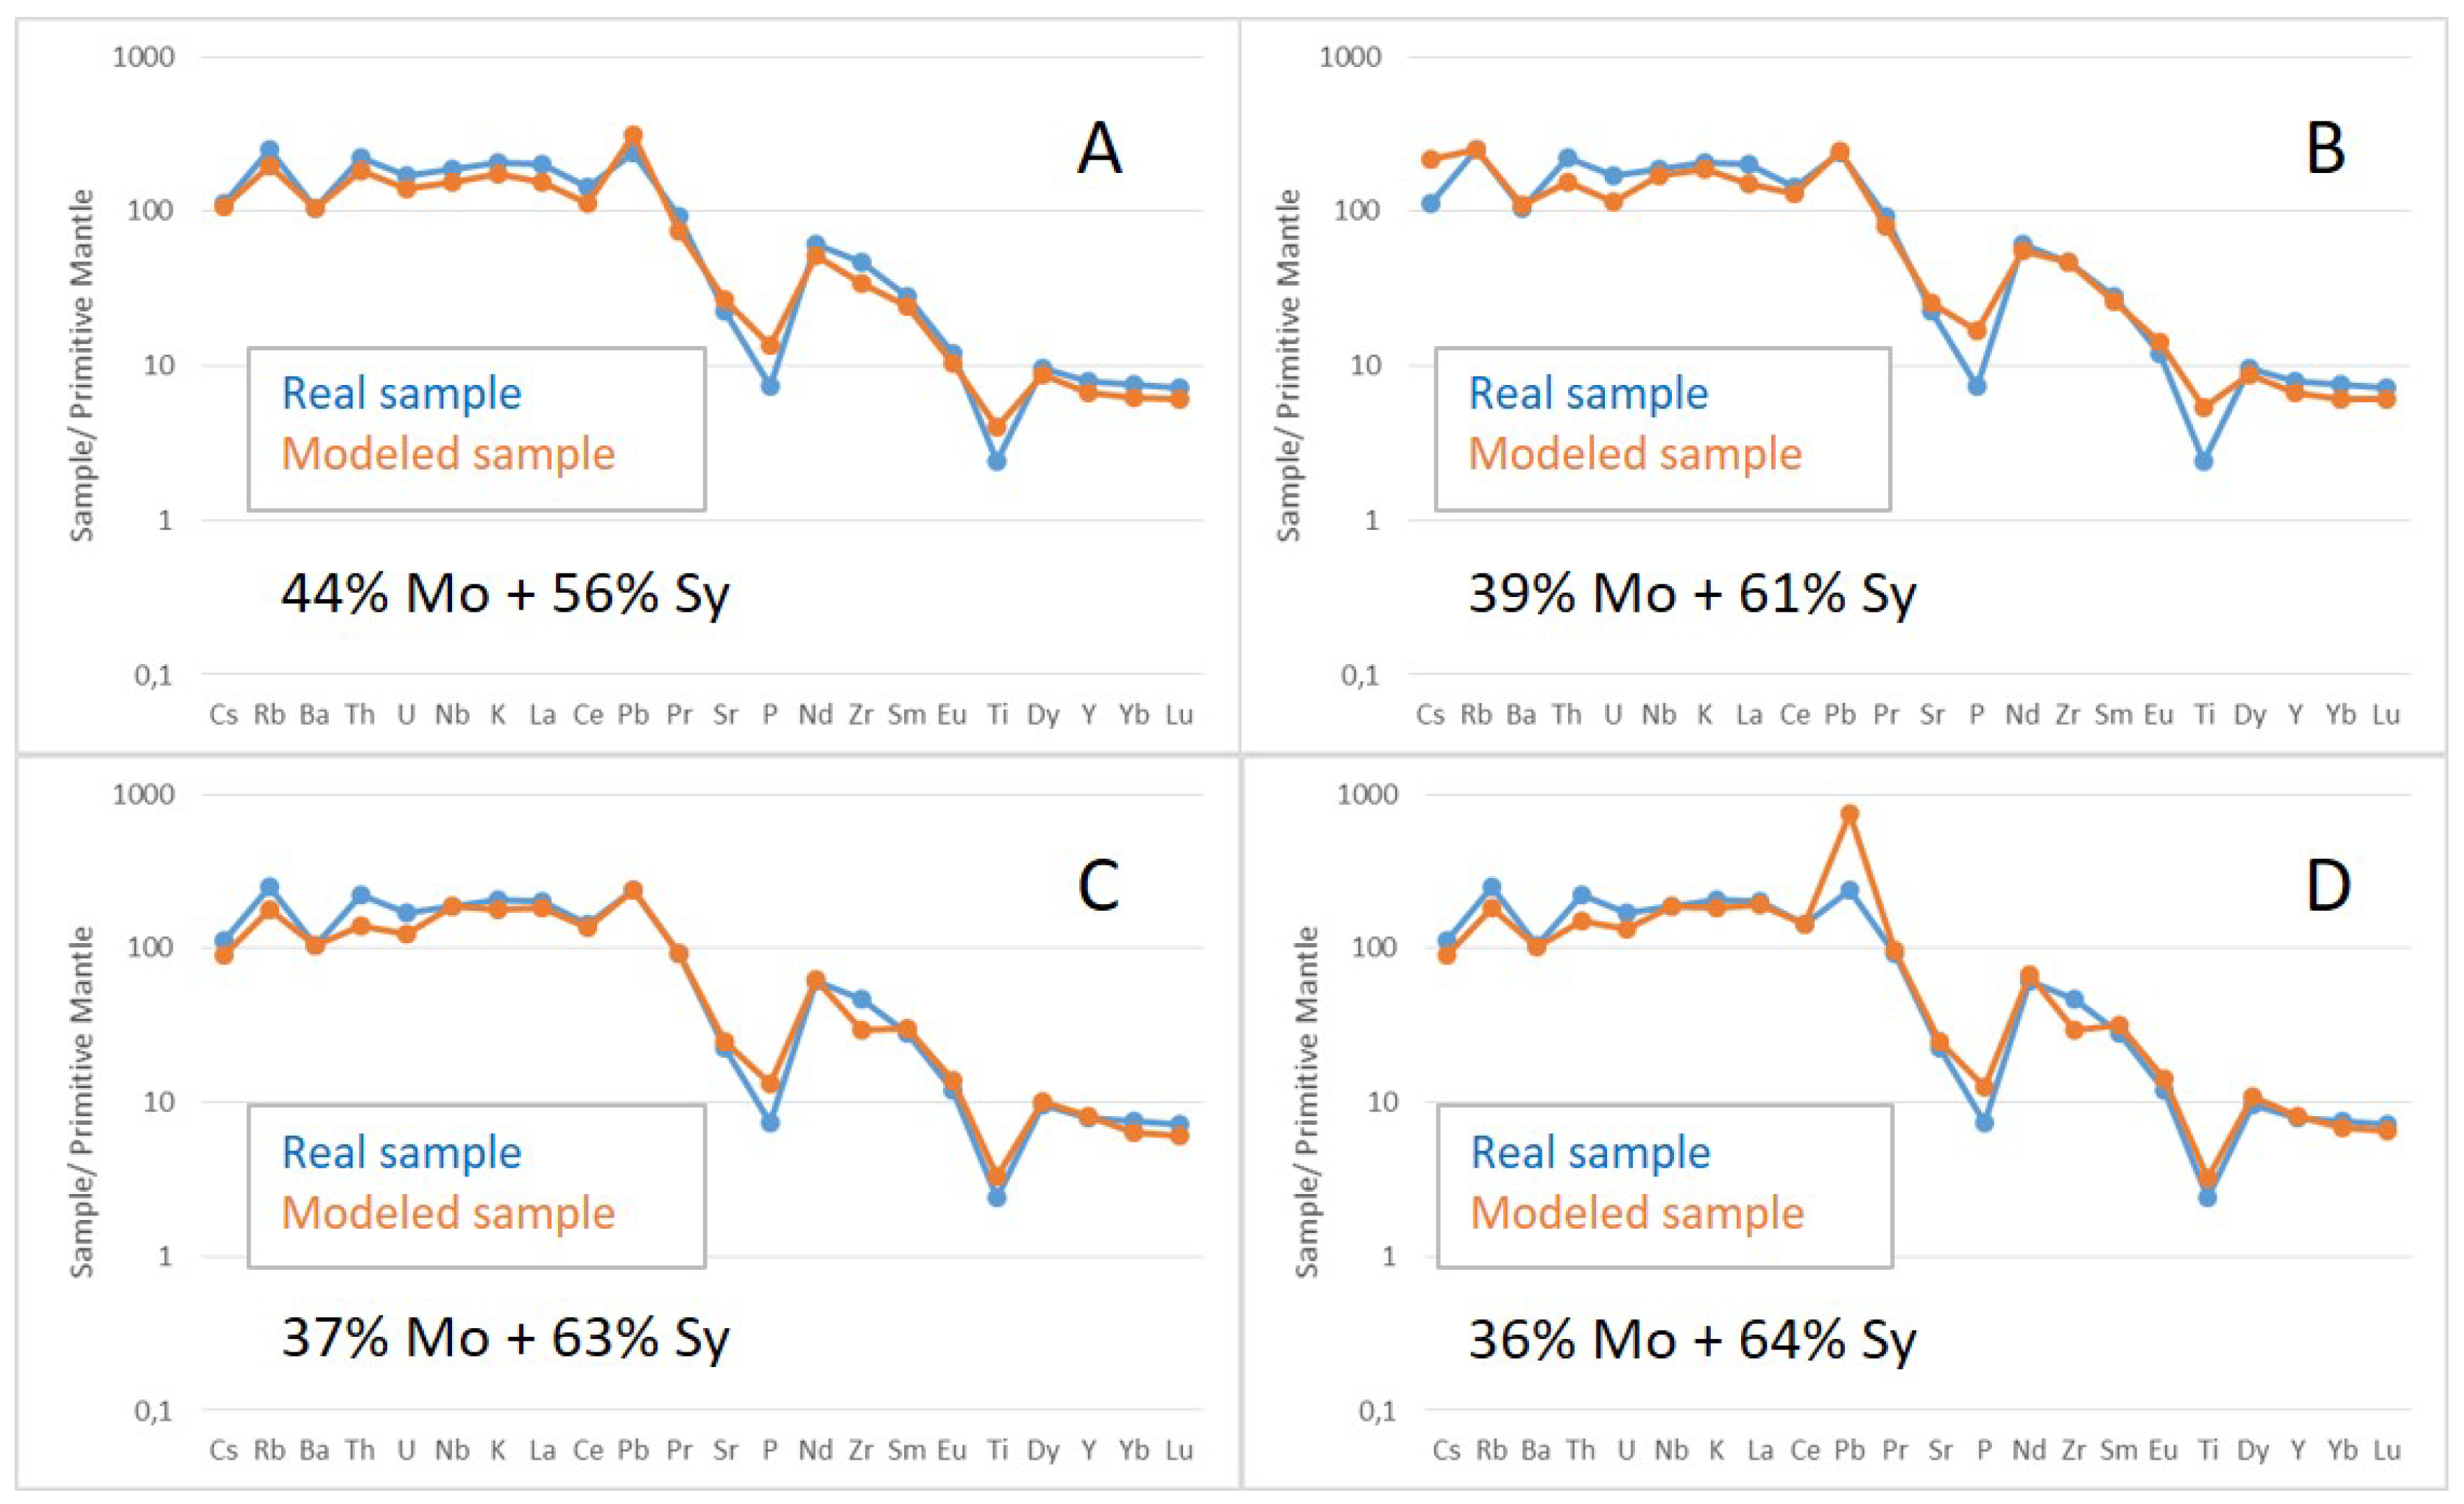

Table 1.
Lithogeochemical data of major and trace elements from the Soarinho Complex. Oxides are expressed in % by weight and trace elements are expressed in parts per million.
Table 1.
Lithogeochemical data of major and trace elements from the Soarinho Complex. Oxides are expressed in % by weight and trace elements are expressed in parts per million.
| Soa 01A | Soa 01B | Soa 01D | Soa 01I | Soa 03 | Soa 05 | Soa 06A | Soa 06B | Soa 02A | Soa 02B | Soa 04B | Soa 09A | Soa 09B | Soa 11 | Soa 01F | Soa 12 | |
|---|---|---|---|---|---|---|---|---|---|---|---|---|---|---|---|---|
| qs | sy | mo | tq | |||||||||||||
| SiO2 | 63.53 | 63.53 | 62.06 | 63.23 | 63.14 | 64.91 | 63.74 | 63.78 | 53.63 | 54.17 | 63.42 | 61.87 | 61.73 | 60.75 | 62.92 | 61.3 |
| Al2O3 | 17.29 | 17.4 | 17.89 | 17.57 | 18.03 | 17.02 | 18.34 | 18.58 | 18.82 | 18.38 | 18.3 | 18.61 | 17.94 | 17.97 | 18.18 | 17.89 |
| Fe2O3 | 3.9 | 3.89 | 4.05 | 3.81 | 4.01 | 2.55 | 2.19 | 2.11 | 7.77 | 7.93 | 3.54 | 3.78 | 4.24 | 5.45 | 4.18 | 4.12 |
| MnO | 0.13 | 0.14 | 0.15 | 0.15 | 0.2 | 0.13 | 0.08 | 0.9 | 0.13 | 0.14 | 0.07 | 0.22 | 0.24 | 0.53 | 0.21 | 0.4 |
| MgO | 0.5 | 0.52 | 0.59 | 0.46 | 0.56 | 0.28 | 0.13 | 0.13 | 2.67 | 2.72 | 0.36 | 0.42 | 0.35 | 0.3 | 0.46 | 0.32 |
| CaO | 1.5 | 1.56 | 1.83 | 1.12 | 0.41 | 1.23 | 0.32 | 0.32 | 5.71 | 5.6 | 0.15 | 0.15 | 0.13 | 0.42 | 0.82 | 0.63 |
| Na2O | 4.84 | 5 | 4.92 | 4.97 | 5.64 | 6.57 | 6.24 | 6.04 | 4.01 | 3.85 | 4.99 | 5.58 | 6.25 | 5.81 | 6.77 | 6.35 |
| K2O | 6.03 | 6.25 | 5.83 | 6.45 | 6.78 | 6.09 | 6.15 | 6.25 | 4.17 | 4.25 | 7.98 | 6.45 | 5.88 | 6.45 | 5.84 | 6.03 |
| TiO2 | 0.56 | 0.52 | 0.56 | 0.48 | 0.6 | 0.15 | 0.49 | 0.49 | 1.96 | 1.9 | 0.48 | 0.6 | 0.49 | 0.49 | 0.45 | 0.54 |
| P2O5 | 0.18 | 0.16 | 0.18 | 0.15 | 0.16 | 0.01 | 0.07 | 0.06 | 0.66 | 0.67 | 0.05 | 0.05 | 0.08 | 0.15 | 0.11 | 0.09 |
| LOI | 1.01 | 0.71 | 0.64 | 0.58 | 0.86 | 1.21 | 1.97 | 1.96 | 0.49 | 0.44 | 0.8 | 1.38 | 1.37 | 2.31 | 0.71 | 1.16 |
| Total | 99.46 | 99.66 | 98.7 | 98.96 | 100.4 | 100.2 | 99.7 | 99.79 | 100 | 100 | 100.1 | 99.1 | 98.72 | 100.6 | 99.65 | 98.83 |
| Sc | 3 | 3 | 3 | 3 | 4 | 3 | 3 | 3 | 3 | 3 | 3 | 3 | 3 | 2 | 10 | 10 |
| Be | 4 | 4 | 4 | 5 | 4 | 3 | 2 | 2 | 3 | 3 | 3 | 3 | 4 | 2 | 2 | 2 |
| V | 13 | 15 | 14 | 13 | 9 | < 5 | 10 | 8 | 6 | 8 | 6 | 7 | < 5 | < 5 | 145 | 139 |
| Ba | 694 | 731 | 963 | 654 | 162 | 29 | 208 | 198 | 183 | 70 | 53 | 80 | 145 | 37 | 1636 | 1466 |
| Sr | 456 | 480 | 671 | 435 | 88 | 84 | 136 | 152 | 129 | 52 | 33 | 64 | 99 | 56 | 1175 | 1104 |
| Zr | 637 | 532 | 593 | 654 | 685 | 449 | 359 | 358 | 513 | 490 | 722 | 257 | 839 | 624 | 291 | 318 |
| Cr | < 20 | < 20 | 20 | < 20 | < 20 | < 20 | < 20 | < 20 | < 20 | 20 | < 20 | < 20 | < 20 | < 20 | 30 | 30 |
| Co | 3 | 2 | 3 | 2 | 1 | < 1 | 3 | 3 | 1 | < 1 | < 1 | 1 | 1 | < 1 | 17 | 17 |
| Ni | < 20 | < 20 | < 20 | < 20 | < 20 | < 20 | < 20 | < 20 | < 20 | < 20 | < 20 | < 20 | < 20 | < 20 | 20 | < 20 |
| Cu | < 10 | < 10 | < 10 | < 10 | < 10 | < 10 | < 10 | < 10 | < 10 | < 10 | < 10 | < 10 | < 10 | 10 | < 10 | 10 |
| Zn | 100 | 90 | 90 | 90 | 190 | 80 | 220 | 180 | 60 | 130 | 150 | 200 | 150 | 150 | 100 | 100 |
| Ga | 23 | 24 | 22 | 24 | 24 | 27 | 23 | 23 | 22 | 23 | 27 | 21 | 23 | 25 | 23 | 23 |
| Ge | 2 | 2 | 1 | 1 | 1 | 1 | 1 | 1 | 1 | 2 | 1 | < 1 | 1 | 1 | 1 | 1 |
| As | < 5 | < 5 | < 5 | < 5 | < 5 | < 5 | < 5 | < 5 | < 5 | < 5 | < 5 | < 5 | < 5 | < 5 | < 5 | < 5 |
| Rb | 165 | 161 | 145 | 179 | 213 | 157 | 129 | 132 | 203 | 201 | 188 | 131 | 158 | 160 | 87 | 86 |
| Nb | 129 | 133 | 119 | 147 | 147 | 131 | 164 | 162 | 131 | 139 | 209 | 111 | 143 | 173 | 84 | 77 |
| Mo | 5 | 5 | 4 | 6 | 2 | 8 | 8 | 9 | 2 | < 2 | < 2 | 3 | 3 | 7 | 3 | 4 |
| Ag | 1.7 | 1.3 | 1.3 | 1.4 | 1.7 | 1.7 | 0.8 | 0.8 | 1.3 | 2.2 | 1.8 | 0.9 | 3 | 1.5 | 0.7 | 0.8 |
| In | < 0.2 | < 0.2 | < 0.2 | < 0.2 | < 0.2 | < 0.2 | < 0.2 | < 0.2 | < 0.2 | < 0.2 | < 0.2 | < 0.2 | < 0.2 | < 0.2 | < 0.2 | < 0.2 |
| Sn | 4 | 3 | 4 | 5 | 7 | 3 | 4 | 4 | 4 | 3 | 4 | 2 | 4 | 4 | 2 | 2 |
| Sb | 0.5 | < 0.5 | 0.6 | 0.5 | < 0.5 | < 0.5 | < 0.5 | < 0.5 | < 0.5 | < 0.5 | < 0.5 | < 0.5 | < 0.5 | < 0.5 | 0.5 | 0.6 |
| Cs | 1.1 | 0.9 | 0.9 | 1.9 | 2.3 | 0.8 | 0.6 | 0.6 | 2.1 | 1.8 | 1.7 | < 0.5 | 1.1 | 1 | 0.9 | 1 |
| Hf | 13.6 | 11.6 | 11.9 | 13.9 | 13 | 12.2 | 8 | 8.1 | 10.1 | 11.9 | 14.8 | 6.9 | 17.5 | 12.1 | 6 | 6.5 |
| Ta | 9.2 | 9.1 | 8.3 | 10.5 | 9.7 | 11.6 | 11.1 | 11.7 | 8.7 | 7.3 | 13.7 | 10.3 | 13 | 11.5 | 5.7 | 5.1 |
| W | 3 | 2 | 2 | 2 | 3 | < 1 | 2 | 2 | 1 | < 1 | 1 | < 1 | < 1 | 2 | 2 | 2 |
| Tl | 0.4 | 0.4 | 0.4 | 0.6 | 1 | 0.8 | 1.1 | 1.3 | 1 | 0.7 | 0.7 | 0.2 | 0.9 | 0.8 | 0.2 | 0.2 |
| Pb | 17 | 17 | 30 | 27 | 21 | 30 | 20 | 77 | 37 | 21 | 35 | 14 | 41 | 25 | 12 | 13 |
| Bi | < 0.4 | < 0.4 | < 0.4 | < 0.4 | < 0.4 | < 0.4 | < 0.4 | 0.8 | < 0.4 | < 0.4 | 0.8 | < 0.4 | < 0.4 | < 0.4 | < 0.4 | < 0.4 |
| Th | 19.4 | 18.9 | 19.1 | 22.7 | 16.2 | 20.6 | 13.7 | 15 | 15.1 | 14.5 | 20.7 | 11.3 | 17.7 | 17.1 | 9.1 | 11.6 |
| U | 3.9 | 3.6 | 3.3 | 4.9 | 2.9 | 3.8 | 3.1 | 3.4 | 3.3 | 4 | 4.6 | 1 | 3.7 | 3.6 | 1.8 | 2.2 |
Table 2.
Lithogeochemical data of rare earth elements from the Soarinho Intrusive Complex, expressed in parts per million.
Table 2.
Lithogeochemical data of rare earth elements from the Soarinho Intrusive Complex, expressed in parts per million.
| Soa 01A | Soa 01B | Soa 01D | Soa 01I | Soa 03 | Soa 05 | Soa 06A | Soa 06B | Soa 02A | Soa 02B | Soa 04B | Soa 09A | Soa 09B | Soa 11 | Soa 01F | Soa 12 | |
|---|---|---|---|---|---|---|---|---|---|---|---|---|---|---|---|---|
| qs | sy | mo | tq | |||||||||||||
| La | 135 | 139 | 149 | 143 | 117 | 120 | 147 | 156 | 201 | 151 | 159 | 131 | 185 | 184 | 87.1 | 87 |
| Ce | 251 | 255 | 265 | 261 | 283 | 228 | 289 | 310 | 257 | 274 | 380 | 237 | 276 | 303 | 162 | 162 |
| Pr | 25.3 | 25.6 | 26.2 | 26.3 | 25.4 | 23.2 | 30.7 | 32.6 | 39.6 | 32.8 | 29.8 | 24.8 | 32.6 | 35.5 | 17.2 | 17.1 |
| Nd | 82.3 | 83.8 | 84.5 | 83.8 | 85.1 | 76.8 | 101 | 110 | 135 | 110 | 94.5 | 83.4 | 108 | 114 | 60.6 | 60.7 |
| Sm | 12.4 | 12.6 | 11.9 | 12.9 | 13.3 | 11.7 | 15.9 | 17 | 22.1 | 17 | 13.4 | 12.4 | 15.4 | 17.3 | 9.5 | 9.7 |
| Eu | 2.02 | 2.03 | 2.43 | 1.98 | 1.56 | 0.28 | 1.59 | 1.76 | 3.17 | 2.22 | 1.14 | 2.27 | 1.73 | 1.72 | 3.57 | 3.33 |
| Gd | 9.2 | 8.8 | 8.2 | 9.1 | 8.8 | 7.9 | 11 | 11.8 | 18.1 | 9 | 8.7 | 8.5 | 11.1 | 12 | 7.6 | 7.2 |
| Tb | 1.3 | 1.3 | 1.2 | 1.4 | 1.3 | 1.2 | 1.6 | 1.7 | 2.8 | 1.3 | 1.3 | 1.3 | 1.6 | 1.8 | 1 | 1 |
| Dy | 7.6 | 7.1 | 6.7 | 7.8 | 7.2 | 7.2 | 8.8 | 9.4 | 14.6 | 7.1 | 7.8 | 6.8 | 8.9 | 9.8 | 5.4 | 5.3 |
| Ho | 1.4 | 1.3 | 1.3 | 1.5 | 1.3 | 1.4 | 1.6 | 1.7 | 2.5 | 1.3 | 1.5 | 1.3 | 1.7 | 1.8 | 0.9 | 0.9 |
| Er | 4 | 3.8 | 3.6 | 4.3 | 3.6 | 4 | 4.2 | 4.6 | 6.5 | 3.7 | 4.6 | 3.6 | 4.6 | 4.8 | 2.5 | 2.4 |
| Tm | 0.61 | 0.55 | 0.53 | 0.66 | 0.54 | 0.58 | 0.62 | 0.65 | 0.86 | 0.54 | 0.68 | 0.52 | 0.65 | 0.71 | 0.34 | 0.33 |
| Yb | 4 | 3.7 | 3.6 | 4.3 | 3.5 | 3.8 | 3.7 | 4 | 5.1 | 3.4 | 4.6 | 3.4 | 4.3 | 4.5 | 2.2 | 2.1 |
| Lu | 0.64 | 0.54 | 0.58 | 0.67 | 0.53 | 0.54 | 0.53 | 0.58 | 0.71 | 0.55 | 0.68 | 0.51 | 0.66 | 0.65 | 0.33 | 0.33 |
| Y | 38 | 36 | 36 | 41 | 34 | 34 | 44 | 44 | 73 | 30 | 40 | 36 | 47 | 50 | 26 | 25 |
Table 3.
Summary measurements for SIC principal oxides values.
| Measure summary | SiO2 | Al2O3 | Fe2O3 | MnO | MgO | CaO | Na2O | K2O | TiO2 | P2O5 | |
|---|---|---|---|---|---|---|---|---|---|---|---|
| QS | Max | 63.53 | 17.89 | 4.05 | 0.15 | 0.59 | 1.83 | 5.00 | 6.45 | 0.56 | 0.18 |
| Min | 62.06 | 17.29 | 3.81 | 0.13 | 0.52 | 1.12 | 4.84 | 5.83 | 0.48 | 0.15 | |
| Mean | 63.09 | 17.53 | 3.91 | 0.14 | 0.54 | 1.50 | 4.93 | 6.14 | 0.53 | 0.17 | |
| std | 0.70 | 0.26 | 0.10 | 0.01 | 0.05 | 0.29 | 0.07 | 0.27 | 0.04 | 0.02 | |
| SY | Max | 64.91 | 18.58 | 4.01 | 0.90 | 0.56 | 1.23 | 6.57 | 6.78 | 0.60 | 0.16 |
| Min | 63.14 | 17.02 | 2.11 | 0.08 | 0.13 | 0.32 | 5.64 | 6.09 | 0.15 | 0.01 | |
| Mean | 63.89 | 17.99 | 2.72 | 0.33 | 0.28 | 0.57 | 6.12 | 6.32 | 0.43 | 0.08 | |
| std | 0.74 | 0.69 | 0.88 | 0.38 | 0.20 | 0.44 | 0.39 | 0.32 | 0.20 | 0.06 | |
| TQ | Max | 63.42 | 18.61 | 5.45 | 0.53 | 0.46 | 0.82 | 6.77 | 7.98 | 0.60 | 0.15 |
| Min | 60.75 | 17.89 | 3.54 | 0.07 | 0.30 | 0.13 | 4.99 | 5.84 | 0.45 | 0.05 | |
| Mean | 61.99 | 18.15 | 4.22 | 0.28 | 0.37 | 0.38 | 5.96 | 6.43 | 0.51 | 0.09 | |
| std | 1.00 | 0.28 | 0.66 | 0.16 | 0.06 | 0.29 | 0.63 | 0.80 | 0.05 | 0.04 | |
Table 4.
Summary for U-Pb and Lu-Hf data obtained for the SIC.
| Sample | U-Pb Age (Ma) | TDM (Ga) | ƐHf (t) |
|---|---|---|---|
| Quartz syenite | 58 + 2 | 1.2 to 1.4 | -10.32 to -7.01 |
| Monzonite | 60 + 2 | 1.2 to 1.3 | -10.21 to -6.32 |
| Alkali-feldspar syenite | 58 + 2 | 1.1 to 1.8 | -17.88 to -5.29 |
| Nepheline syenite | 65 + 1 | 1.1 to 2.8 | -32 to -6.4 |
Disclaimer/Publisher’s Note: The statements, opinions and data contained in all publications are solely those of the individual author(s) and contributor(s) and not of MDPI and/or the editor(s). MDPI and/or the editor(s) disclaim responsibility for any injury to people or property resulting from any ideas, methods, instructions or products referred to in the content. |
© 2023 by the authors. Licensee MDPI, Basel, Switzerland. This article is an open access article distributed under the terms and conditions of the Creative Commons Attribution (CC BY) license (https://creativecommons.org/licenses/by/4.0/).
Copyright: This open access article is published under a Creative Commons CC BY 4.0 license, which permit the free download, distribution, and reuse, provided that the author and preprint are cited in any reuse.


