
Submitted:
22 May 2023
Posted:
23 May 2023
You are already at the latest version
Abstract
Accurate rainfall measurement is vital when investigating spatial and temporal precipitation variability at different scales. However, there are many regions around the world, such as North Darfur State in Sudan, where ground-based observations are few. Satellite-based precipitation products can fill such regions' spatial and temporal rainfall data gaps. Six satellite rainfall prod-ucts, namely the Tropical Rainfall Measuring Mission (TRMM) Multi-satellite Precipitation Analysis (TMPA), African Rainfall Climatology Version 2 (ARC2.0), Climate Hazards Group In-frared Precipitation with Station Data (CHIRPS2.0), the Integrated Multi-satellitE Retrievals for Global Precipitation Measurements (GPM) Final Run v 6 (GPM IMERG6), Precipitation Estima-tion from Remote Sensing Information using Artificial Neural Networks-Climate Data Record (PERSIANN-CDR), and the Tropical Applications of Meteorology using SATellite and ground-based observations (TAMSAT) v3.1 were evaluated to assess their accuracy in estimating rainfall amounts variability trends in the study area. The global-based satellite rainfall products were assessed at monthly and annual time scales by applying a point-to-pixel comparison with ground-based rain gauge data for the period 2000–2019. Based on the overall statistical results at monthly and temporal yearly scales, five satellite precipitation products (TMPA, CHIRPS, GPM IMERG6, PERSIANN-CDR, and TAMSATv3.1) overestimated rainfall amounts by values ranging from 1.49% to 82.69%. In contrast, the ARC2 product underestimated rainfall amounts by values ranging from-16.9% to-20.25%. The TAMSATv3.1, CHIRPS, and TMPA performed relatively better, showing stronger correlations and higher values of Nash-Sutcliffe efficiency. This study showed that the TAMSATv3.1 and CHIRPS products could reasonably estimate rainfall amounts in the North Darfur State.
Keywords:
Rain gauge
; observations
; satellite-based precipitation
; spatio-temporal
; TMPA
; CHIRPS
; ARC2
; and North Darfur State
; Sudan
1. Introduction
Rainfall is a vital component in climate systems and is important for the hydrological cycle of the Earth. The variability of rainfall in its distribution, rate and amount largely determines Earth’s ecosystem and water cycle [1,2]. Reliable measurement of rainfall data is essential for understanding the spatiotemporal variability of rainfall at various time scales and its effects on hydrology, agriculture, and ecosystem functioning. [2,3,4]. Traditionally, ground-based rain gauge observations are used to characterise the spatio-temporal variability of rainfall in a region [5]. However, ground-based observations are limited in several locations around the world, particularly in emerging nations in Africa, where data are sparsely and unevenly distributed [6].
In Sudan, political unrest and conflict have a significant impact on the distribution, sparsity, and quality of rain gauge measurements. This is particularly true in the Darfur region, which often shows gaps in temporal rainfall data [7,8]. The limitations associated with rain gauge observations have necessitated alternative methods to quantify rainfall for monitoring agriculture and weather [9]. Fortunately, a remote sensing method is able to fill the gap in gathering rainfall data from satellite-based products, and this is developing into an essential source of rainfall data [2]. A variety of satellite-based rainfall estimations (SREs) are produced by the passive microwave (PMW) and thermal infrared radiation (TIR) sensors onboard low-Earth orbiting and geostationary satellites. Using cloud top brightness temperature, TIR-based methods use an indirect relationship of cloud top brightness temperature to estimate rainfall [10]. On the other hand, TIR-based estimates are thought to be physically less direct than PMW-based methods [11,12]. However, Satellite sensors have limitations and do not measure precipitation directly, occasionally failing to reproduce long-term and single-event rainfall patterns [13].
Uncertainties may originate in the processes of temporal samplings, errors from algorithms, and satellite instruments themselves [14]. These will reduce the accuracy of satellite rainfall estimates and may result in significant errors. Ground-based data can be integrated with satellite remote sensing of rainfall estimates to calibrate/validate and correct for bias [15].
A few earlier studies investigated satellite-based rainfall estimates at the continental scale over Africa [16,17]. A study by Sanogo et al. 2015 [16] evaluated the spatio-temporal characteristics of recent rainfall for West African countries; the gridded African Rainfall Climatology Version 2 (ARC2) trends were broadly found to be consistent with ground calibration where data were available. However, in highland areas, there was a particular paucity of ground data. The validation conducted across Africa by Dezfuli et al. 2017 [17] showed that the diurnal precipitation cycle was better captured by IMERG6 product than Multi-satellite Precipitation Analysis (TMPA), and the products exhibited a better agreement with ground data in (dry) East and (humid) West Africa than the southern Sahel (transitional between humid areas to the south and the dry regions to the north. At the country scale, they are many studies have evaluated the use of satellite-based rainfall [13,15,18,19,20,21,22,23]. The Usman et al. 2018 [15] analysis assessed the capability of four satellite-based rainfall models to portray rainfall trends in West Africa. Additionally, Dembélé & Zwart 2016 [18] evaluated how well the TRMM 3B42 and TRMM 3B43 performed at estimating rainfall amounts in the semi-arid Sahelian region of Burkina Faso using the seven satellite-based rainfall dataset products (ARC 2.0, CHIRPS, PERSIANN, RFE 2.0, and TARCAT). The satellites did poorly at daily time scales but better at annual time scales, with the best product being the African Rainfall Estimation (RFE 2.0).
The best products for assessing drought in the Upper Blue Nile Basin, Ethiopia, according to the findings of a study by Bayissa et al. 2017 [19] comparing the capabilities of five satellite precipitation products (CHIRPS, PERSIANN, TARCAT, TMPA, and ARC 2.0)
In eastern Africa, Toté et al. 2015 [13] analysed three satellite rainfall estimates for drought and flood monitoring in tropical climate areas of Mozambique; they showed TARCAT was superior at modelling the relative frequency of rainfall events. Similar to this, the study evaluated two satellite-based products over the Sudanese portion of the Blue Nile River and found that the TRMM product performance was superior to RFE2.0 [23]. Girma 2020 [21] explored Tropical Applications of Meteorology using SATellite (TAMSAT) over the region of southern Ethiopia with limited data and demonstrated that TAMSAT matched gauge data well.
A study by Lu et al. 2016 [22] in southern Africa evaluated SREs for analyzing changes in rainfall patterns in Namibia’s unusually dry region, and they found that the TMPA estimations and the data from the rain gauges were in good agreement at monthly and annual time scales. For North Africa (Algeria), the study conducted by Babaousmail et al. 2019 [20] showed that (NOAA) CPC Morphing Technique (CMORPH) were the most suitable product for satellite-based precipitation estimates for the prevailing Mediterranean climate over. However, the majority of these studies demonstrate that algorithm performance varies significantly depending on topography, location, season, and local climate [13,15,24].
The Darfur region is characterised by spatial and temporal rainfall variability. This aggravates the problem of limited soil productivity and problematic spatial distribution of agricultural land. Despite these challenges, 80%–90% of the population relies on rainfed agriculture and livestock raising as their main sources of income [25,26]. The physical environment, especially rainfall variability and distribution, has a significant impact on this vital agricultural sector. As a result, climate-related risks are a concern for the region’s rainfed agriculture, and crop yields are unpredictable and difficult to anticipate. Such environmental degradation plays a role in national security and international stability considerations. For instance, the Sahel region’s devastating droughts and hunger in the 1970s, 1980s, and mid-1990s, particularly in Darfur, Sudan, and Chad, occasionally led to violent clashes between nomadic tribes and local farmers. In turn, this conflict has occasionally been linked to extensive environmental-induced transnational migration [27]. Therefore, experts and many international organisations recognise the critical importance of understanding the spatio-temporal variation in rainfall. This is especially true in arid regions so that environmental and human security can be improved and national/global food security and ecosystem protection/restoration can be strengthened [28].
Over the past three decades, rain gauge observations have been disrupted owing to unstable security conditions and conflicts in the Darfur region, especially in the North Darfur State. Therefore, accurately analysing and predicting rainfall variability and trends has been challenging. The aim of the study is to determine whether it is feasible to monitor rainfed agriculture by estimating rainfall variability across North Darfur State using satellite-based precipitation products.
The specific objectives of this study are i) to compare the spatio-temporal trends in rainfall from eleven ground-based observations measurements at monthly and annual scales with various satellite rainfall estimates, ii) to quantitatively evaluate and identify the best satellite products for rainfall estimates in the region at various scales, and iii) to assess the suitability of different SRE estimates to characterise the spatio-temporal distribution of precipitation across North Darfur, Sudan.
2. Materials and Methods
2.1. The Study Area
The study region is situated in western Sudan at 12.0°N, 20.0°N, 22.0°E, and 27.30°E, with the Jabbed Marrah Mountains having the maximum elevation, which is roughly 3,000 m above sea level, as shown in (Figure 1). The region is mainly arid and semi-arid, with great geographical and temporal variability in the rainfall. The rainy season is mainly from June to October, with average annual rainfall ranging between 152 mm yr−1 in the northern parts and 540 mm yr−1 in the southern parts. The peak rainfall is during the month of August [7,8]. The 42 °C and 11 °C, respectively, are the typical high and low temperatures [29].
2.2. Datasets
2.2.1. In Situ Rainfall Data
Monthly and annual rainfall data were obtained from the North Darfur State Ministry of Agriculture for rain gauge observation points (Figure 1). A brief description of 11 rain gauge stations is presented in (Table 1) including geographical attributes (namely, elevation, longitude and latitude) and data availability. The stations are installed at different elevations and have been recording data since 1950; available precipitation data were used to compare with the various satellite product estimates for SRE in the region at the monthly and annual time scales.
2.2.2. Satellite-Based Precipitation Products
We compared six satellite-based precipitation products against rain gauge observations to evaluate their efficiency in capturing the rainfall across North Darfur State for 20 years spanning between 2000 and 2019. The products used were the Tropical Rainfall Measuring Mission-based Multi-Satellite Precipitation Analysis (TMPA), African Rainfall Climatology Version 2 (ARC2.0), Climate Hazards Group Infrared Precipitation with Stations Data (CHIRPS2.0), Global Precipitation Measurements (GPM)—the Integrated Multi-satellitE Retrievals Final Runv6 (GPM IMERG6), Precipitation Estimation from Remote Sensing Information using Artificial Neural Networks (PERSIANN-CDR), and the Tropical Applications of Meteorological using SaTEllite and ground-based observations (TAMSATv3.1). These satellite products were selected due to their high spatial and temporal data coverage. The product parameters of the six SPPs are shown in (Table 2).
2.2.3. The Tropical Rainfall Measuring Mission-Based Multi-Satellite Precipitation Analysis (TMPA)
The TMPA offers products for quasi-global precipitation for the period 1998 to 2019 at 0.25° × 0.25° spatial resolution and covering an area 50 °N–50 °S at a temporal resolution of three hours. This precipitation product is combined into gauge-adjusted daily (3B42) and monthly (3B43) post-real-time precipitation. Compared to the (3B42v6) and the real-time TMPA product, the (3B42v7) performs better [30,31,32]. In this study, monthly TMPA product was used for the period 2000 to 2019, available at https://disc.gsfc.nasa.gov/.
2.2.4. African Rainfall Climatology Version 2
ARCv2.0 data has been available as daily gridded precipitation data centred over the African continent at a spatial resolution of 10 km (0.1°) since 1983. The Climate Prediction Center of the NOAA developed the ARCv2.0. ARCv2.0 data were retrieved from: i) The European Organization for the Exploitation of Meteorological Satellites (EUMETSAT) provides 3-hourly geostationary TIR data, and ii) the Global Telecommunication System gauge measurements reporting 24-hour rainfall accumulations over Africa are both of high quality [15,33]. This study used monthly ARCv2.0 rainfall estimates for the period 2000–2019, available at https://www.icpac.net/data-center/arc2/.
2.2.5. Climate Hazards Group Infrared Precipitation with Stations Data
The United States Geological Survey and the Climate Hazard Group at the University of California developed the CHIRPS Version 2.0 rainfall dataset; these data are available from 1981 onwards at the spatial resolution of 0.05° × 0.05°. The data inputs used for the CHIRPS algorithm are: i) satellite thermal infrared data to represent sparsely gauged locations; ii) blend station data to produce a primary product with a latency of approximately two days and a final product with an average latency of approximately three weeks; iii) atmospheric model rainfall fields from the United States NOAA Climate Forecast System version 2; iv) in situ rainfall data obtained from various sources of meteorological services such as regional and national, and v) This TMPA product from TRMM is used to calibrate estimates of global cold cloud duration precipitation [34]. For this study, monthly CHIRPS2.0 datasets from 2000 to 2019 were used as obtained from https://earlywarning.usgs.gov.
2.2.6. GPM IMERG6 Satellite Rainfall Estimates
The GPM mission’s level 3 production, the IMERG, has a spatial resolution of (0.1° 0.1°) and a temporal resolution of half an hour. The Global Precipitation Climatology Center’s (GPCC) monthly gauge analysis is used to calibrate the Integrated Multi-satellitE Retrievals for GPM (IMERG), which is produced using combined passive microwave (PMW) and infrared (IR) data from the GPM constellation [35,36]. The most recent version of GPM (IMERG) is Final Run v 6B (IMERG6), which covers Early Run (near real-time with a latency of 6 hours), Late Run (near real-time with a latency of 18 hours), and Final Run (gauge-adjusted with a delay of 4 months [30,36]. In this study, monthly IMERG6 for the period 2000–2019 was obtained from https://gpm.nasa.gov/data/.
2.2.7. Precipitation Estimation from Remote Sensing Information using Artificial Neural Networks-Climate Data Record
Scientists from the University of California’s Center for Remote Sensing and Hydrometeorology created the PERSIANN climate data database [37]. The input data used for the PERSIANN-CDR algorithm are retrieved from i) Global Precipitation Climatology Project (GPCP) v2.2 and ii) Griddled satellite data from the B1 Infrared Window (IRWIN) Channel of the International Satellite Cloud Climatology Project (ISCCP).
The PERSIANN product applied the ANN model to convert IR information into rain rates; the inputs of the ANN model are gridded satellite IR data, and the model is regularly updated using precipitation estimates from low-orbital satellites [38]. For this study, monthly PERSIANN data were downloaded from https://climatedataguide.ucar.edu, for the period 2000–2019.
2.2.8. The Tropical Applications of Meteorological Using SaTEllite and Ground-Based Observations (TAMSATv3.1)
The TAMSAT algorithm was developed at the University of Reading to estimate rainfall for drought, and famine warns in Africa, based on Meteosat thermal infrared (TIR) from EUMESTAT [18]. Many researchers believe that convective clouds that lead to chilly cloud tops cause rainfall in the TAMSAT rainfall estimation approach; the retrieval algorithm is calibrated using local rain gauge records [39,40,41]. Since 1982, TAMSAT products have been provided with a spatial resolution of 0.0375° and temporal resolutions of decadal, monthly, and seasonal intervals [2]. In this study, monthly TAMSATv3.1 data for the period 2000–2019 was obtained from https://www.tamsat.org.uk.
2.3. Methods
2.3.1. Evaluation of Satellite Products
The study focused on evaluating the performance of six SPPs (TMPA-3B42v7.0, CHIRPSv2.0, PERSIANN-CDR, GPMIMERG6, ARC2.0, and TAMSATv3.1) to identify the best products for capturing, estimating rainfall amounts and variability trends across the study area by comparing them against rain gauge rainfall measurements for the period 2000–2019 at monthly and annual time scales. Due to the lack of rain gauge stations in the study area, only eleven stations could be employed, as indicated in (Figure.1). The study employed a point-to-pixel pairwise comparison approach, in which satellite rainfall estimations are created and compared for each site of the gauge [2,30].
2.3.2. Model Evaluations
The accuracy assessment of satellite products were evaluated using continuous statistical measures a point-to-pixel-based pairwise comparison statistics measures such as the Pearson correlation coefficient (r), per cent bias (Pbias), root mean square error (RMSE), and Nash-Sutcliffe model efficiency (E). These were all applied to evaluate the performance of the satellite-based products SPPs in estimating the amount and variability of rainfall across the study area. In equation (1), r is expressed as:
r is used to assess the correlation’s goodness of fit, and the value of 1 is the perfect score [18].
The root means square error (RMSE) is calculated using equation (2):
The RMSE measures the mean difference between two variables: lower RMSE values indicate smaller errors [2,15,18].
The per cent bias was computed using equation (3) to show how well the satellite rainfall estimates correspond with the gauge rainfall data average. A positive indicates overestimates, while negative indicates underestimates.
The Nash-Sutcliffe model efficiency was computed using equation (4). Third item.
The text continues here.
The E values range from − ∞ to 1, with higher values suggesting a better agreement between observations and satellite estimates [42]. Regarding rainfall estimate products, negative E values (the null model) show that the mean observed value is a better estimate than estimate values from a product, while a value of zero shows that the product is only as accurate as the null model [43,44].
Where G = gauge rainfall amount, = average gauge rainfall amount; S = satellite rainfall estimates, = average satellite rainfall estimate, N = number of data pairs.
3.2.3. Assessment of the Rainfall Trends of Satellite Products
The rainfall trends were assessed for individual stations using error statistics such as correlation coefficient (r) equation (1) and per cent bias (Pbias) equation (3) at monthly and annual time scales. For each station, the mean monthly and annual rainfall of rain-gauge observation and satellite product were compared using correlation coefficient and per cent bias statistics.
3. Results
3.1. Monthly Comparisons of Rainfall Totals
Monthly comparisons reveal good agreement between the six SREs and ground-based rain gauge measurements, with a Nash-Sutcliffe model (E) coefficient ranging from E = (0.49 to 0.36) and a good correlation coefficient of r ≥ 0.75. Based on the statistical analysis, results show that TAMSAT performs better in estimating the monthly rainfall in the region than the other satellite products. The TAMSAT product produced the best values of the Nash-Sutcliffe model efficiency (E) coefficient (E= 0.49), followed by the CHIRPS product (E = 0.41), the ARC2.0 (E = 0.40); the GPMIMERG6 product (E=0.39), and the TMPA product (E = 0.36). The PERSIANN product produced the lowest E score of 0.35; see (Table 3).
All six satellite products produced relatively good correlation coefficients against rain gauge observations. The GPM IMERG6 (r = 0.72), the TMPA (r = 0.71), the ARC2 (r = 0.67), and the PERSIANN provided the lowest correlations (r = 0.66), with the TAMSAT product having the best correlation (r = 0.75).
The least RMSE was produced by the TAMSAT 3.1 product (RMSE = 47.10 mm month−1), followed by the CHIRPS product (RMSE = 50.64 mm month−1), the GPMIMERG6 product (RMSE = 51.49 mm month−1), the ACR2 product (RMSE = 51.19 mm month−1), the TMPA product (RMSE = 52.73 mm month−1). The PERSIANN product produced the highest RMSE of 76.66 mm month−1).
All satellite products overestimated the rainfall amount except the ARC2 product. The highest values of per cent bias were produced by the PERSIANN product (Pbias = 48.9%), followed by the GPM IMERG6 product (Pbias = 18.01%), the TMPA product (Pbias = 15.34%), and the TAMSAT product (Pbias = 10.29%). The lowest positive percent bias was produced by the CHIRPS product (Pbias = 1.49%). The ARC2 product underestimated the rainfall, showing a negative per cent bias (Pbias = -20.25%) (Table 3).
3.2. Annual Comparisons of Rainfall Totals
Strong agreement between the six SREs and rain gauge measurements is demonstrated by annual comparisons, with a producing Nash-Sutcliffe model (E) coefficients ranging from 0.61 to 0.19 and a good correlation coefficient (r) ranging from 0.81 to 0.58. The annual comparisons based on the point-to-pixel approach (Figure 3. and Table 4.) indicated that the TAMSAT product performs better compared to the other SRE products. The TAMSAT product produced a Nash-Sutcliffe model (E) coefficient of 0.61, and the TMPA product, E=0.50. The CHIRPS product, E= 0.39; the ARC2, E = 0.35; and the GPMIMERG6 product, E= 0.19. The PERSIANN product gave the lowest efficiency coefficient, E = −0.57.
All six satellite products showed relatively strong correlation coefficients with ground-based rain gauge observations. The GPM IMERG6 product produced a relatively higher correlation value (r = 0.81), followed by the TMPA product (r = 0.80), the CHIRPS product (r = 0.78); the ARC2 product (r = 0.76), the TAMSAT product with correlation coefficient (r = 0.71). The PERSIANN product produced the least correlation value of (r = 0.58). In terms of RMSE, the TAMSAT product had the lowest values (8.7 mm month−1), followed by the ARC (89.8 mm month−1), GPM IMERG6 (100 mm month−1), TMPA (110.2 mm month−1), and CHIRPS (mm month−1). The highest RMSE was achieved by the PERSIANN product (RMSE = 235.2 mm month−1) as shown in (Table 4).
All satellite products overestimated the rainfall amount except the ARC product, with the highest overestimate values scored by the PERSIANN product (Pbias = 82.6%), followed by the CHIRPS product with (Pbias = 22.85%), thereafter TMPA product with (Pbias = 21.33) and followed by TAMSAT product with (Pbias = 14.98%); then GPMIMERG6 product with (Pbias = 10.19). The ARC2.0 product underestimated rainfall, producing Pbias = −16.9%; see (Table 4).
Figure 4 illustrates the regional distribution of annual rainfall on average. Various rainfall spatial patterns were observed between the satellite rainfall estimate products, with a clear northern–south spatial gradient of decreasing rainfall amount. The areas in the south and southwest receive more rainfall compared to regions in the northeast and north. Based on the TMPA satellite, the annual rainfall of North Darfur for 2000–2019 ranged from 817.26 mm yr-1 to 254.23 mm yr−1, with a standard deviation of 146.34 mm yr−1. The CHIRPS-based product showed mean annual rainfall ranged from 784.46 mm yr−1 to 189.83 mm yr−1, with a standard deviation of 169.34 mm yr−1. The ARC2-based product showed mean annual rainfall ranged between 671.91 mm yr−1 and 142 mm yr−1, with a standard deviation of 127.5 mm yr−1. Additionally, ARC2’s estimate of the mean annual rainfall was less than that of the other products.
3.3. Mean Monthly Rainfall Trends
On a monthly scale, all SPPs estimated the rainfall trends as shown in (Table 5 and Figure 5) the rainy season ranging from May to October, with the peak rainfall in August and September at all stations over the study area.
Rainfall amounts were overestimated at all stations except at AL Liait and Kuma. Comparing TMPA and rain gauge at individual stations produced a correlation coefficient of r = 0.83 at AL Fashir and a lower r value of 0.47 at UMM Kaddada. The CHIRPS2 product produced a higher r value of 0.84 at the AL Fashir station and a lower r value of 0.41 at UMM Kaddada and AL Liait. Higher overestimated rainfall trends Pbias = 26.08% in UMM Kaddada.
The comparison between ARC2 and stations shows a higher r value of 0.79 in Kutum, a lower r value of 0.43 in ELTawiesha and a higher value of underestimated rainfall trends P bias = -43.36 in EL Malha. A comparison between GPMIMERG6 and the rain gauge at individual stations indicates that the high correlation coefficient r value was 0.80 at AL Fashir and a lower r value of 0.39 in Saraf Omra, while the rainfall trends overestimation all stations. A comparison between PERSIANN and rain-gauge at individual stations indicates that the high correlation coefficient r values were 0.80 at AL Fashir and lower r value 0.20 in AL Liait, while the rainfall trends overestimation of all stations except EL Malha, AL Liait and Kuma stations. The comparison between TAMSAT and stations shows a higher r value of 0.72 in Al Fashir, Saraf Omra and Dar EL Salam and a lower r value of 0.48 in AL Liait. At the same time, the rainfall trends overestimated all stations except Mellit and AL Liait stations. Based on (Table 1 and Figure 1) the TMPA product performed best in estimating rainfall trends at a monthly time scale.
3.4. Mean Annual Rainfall Trends
All the satellite products estimate the annual rainfall trends in all rain-gauge stations. On an annual time scale, all satellite products estimated the rainfall trends compared to the rain-gauge stations over the study area, as shown in (Table 6 and Figure 6). In the Al Fashir station, all satellite products tended underestimated rainfall trends except TMPA and PERSIANN products, where the PERSIANN performed best with a correlation coefficient of 0.66. In contrast, the GPMIMERG6 product was the worst performance.
In the Kutum station, all satellites overestimated except CHIRPS2 and ARC2 tended underestimated rainfall trends, and the PERSIANN performed best with a correlation coefficient of 0.74. In the Mellit station, the TMPA performed best, with a correlation coefficient of 0.61.
At the Kabkabiya station, the worse product was TMPA with r = (0.23), and the best outcome was PERSIANN with r = (0.72), and all products were overestimated rainfall except CHIRPS2 and ARC2 products. In the EL Malha station, the GPMIMERG6 performed best with r = (0.83), and CHIRPS2 performed worst with r = (0.34), but in the Umm Kaddada station all satellites tended overestimated rainfall trends, the CHIRPS2 performed best with r = (0.63), and TAMSAT performed worst with r = (0.21). At the ELTawiesha station, the best product was PERSIANN with r = (0.64), and the worst was CHIRPS2 with r = (0.22). On the other hand, at the Saraf Omra station, the PERSIANN performed best with r = (0.63) and TAMSAT worst product with r = (0.28). In Kuma station, all satellites underestimated rainfall trends except PERSIANN was overestimated and best performed with r values (0.76). Also, Dar EL Salam station CHIRPS2 is the best product with r = (0.51), and GPMIMERG6 is the worst product with r = (0.17). Based on (Table 6 and Figure 6) the GPMIMERG6 product performed best in estimated rainfall trends at an annual time scale.
4. Discussion
The accuracy of satellite products in estimating rainfall amount and trends across the North Darfur State of Sudan was analysed for a 20-year (2000–2019). Six satellite-based rainfall products (ARC2, TMPA, CHIRPS, GPM IMERG6, PERSIANN-CDR and TAMSATv3.1) were assessed and compared against eleven ground-based rain measurements at the monthly and annual time scales using point-to-pixel-based pairwise statistics (Figure 2, Figure 3, Figure 5 and Figure 6).
All satellite rainfall products could accurately estimate rainfall levels and display trends throughout the North Darfur State, according to an analysis of the statistical findings (Table 3, Table 4, Table 5 and Table 6). All SREs products showed relatively good agreement and correlation with rain gauge observations at both time scales. This is consistent with previous studies that found that increasing the aggregation of time scales improves the performance of satellite products [2,30,45]. Five of the SREs products (TMPA, CHIRPS, GPM IMERG6, PERSIANN, and TAMSATv3.1) showed a tendency to overestimate rainfall amounts with a percent bias ranging from 1.49% to 82.69% (Table 3 and Table 4). This may be due to the mismatch between point-to-pixel-based measurements leading to a positive per cent.
Moreover, the sensors have much larger spatial scales than rain gauges (point locations). This is in line with past studies that revealed overestimations of rainfall data from the TMPA, CHIRPS, and GPM IMERG6 systems for the Dhidhessa River in Ethiopia and from TAMSAT systems for the region of southern Ethiopia [21,30]. In contrast, the ARC2 product showed underestimated rainfall amounts for all time scales by as much as -20.25%. This finding is also in line with a study conducted in Ethiopia on the Upper Nile [2]. However, other studies found that CHIRPS and TMPA products underestimated rainfall in northern Ethiopia [46]. The inconsistency, in this case, maybe due to differences in topography or climate conditions.
The overall comparisons and statistical validation at monthly and annual time scales in (Figure 2 and Figure 3 and Table 3 and Table 4) showed that the TAMSAT and CHIRPS2 products performed best for rainfall amounts compared to the other products (ARC2, TMPA, GPM IMERG6 and PERSIANN). Consistent with our findings, the superiority of the two products (TAMSAT and CHIRPS) in estimating rainfall amounts in the nearby East African region has also been documented by other studies [11,21,47,48,49]. TAMSAT’s primary benefit is that it employs local calibration datasets where the temperature threshold and regression parameters are geographically and temporally variable [50]. The performance of CHIRPS2 has been in line with its high temporal and spatial resolutions, capacity to integrate satellite, gauge, and reanalysis outputs [34] and the usage of CHPClim, a gauge-satellite climatology that lessens mean biases.
However, at the annual time scale, as shown in (Figure 3 and Table 4), TMPA product performed better than ARC2, GPM IMERG6, and PERSIANN products. These results are in line with prior research on the Sudanese Blue Nile basin and the East African Sio-Malaba-Malakisi river basin [23,51]. However, a study carried out in Ethiopia’s Upper Blue Nile Basin contradicted the superiority of TMPA products at annual time scales[19].
For North Darfur State, the PERSIANN rainfall product generally underperformed for all periods; this underperformed in capturing rainfall variability amounts is consistent with studies conducted in East Africa and northern Egypt in which it was reported that PERSIANN-CRD is influenced by topography [52,53]. However, the PERSIANN-CRD has a rain gauge observation based on calibration using GPCP [54]; this does not guarantee better performance in the area, as exemplified by the PERSIANN-CRD product. The performance of GPM IMERG6 in rainfall estimations is better than ARC2 and PERSIANN; this is confirmed by the results of [55]. Due to the dual and high-frequency channels, which improve the detection of light and solid precipitation, GPM IMERG6 has a superior performance. [36]. This can be explained by the greater efficiency of PMW sensors [56]. For rainfall trends, the TMPA product performed best on a monthly time scale and the GPMIMERG6 product performed best on annual time scale, according to results from (Table 5 and Table 6).
5. Conclusions
For climate studies and meteorological applications in data-poor regions of Africa, such the Darfur region, satellite precipitation products represent an alternate source of rainfall data. The retrieval technique, measurement, and bias correction processes have led to mistakes that are included in the satellite rainfall estimates. Furthermore, regional topography and climatic circumstances have an impact on how accurately satellite-based rainfall estimates are made.
This study evaluated and tested the performance of six satellite rainfall products (ARC2, TMPA, CHIRPS, GPM IMERG6, PERSIANN-CDR and TAMSATv3.1) and determined their efficiency in estimating rainfall amount and variability trends across North Darfur State in Sudan for 2000–2019. A point-to-pixel-based comparison was carried out using statistical validation tools to analyse the performances of existing satellite products for obtaining rainfall data for the region at monthly and annual time intervals.
Based on the overall statistical validation at the monthly and annual temporal scales, five of the satellite precipitation products (TMPA, CHIRPS, GPM IMERG6, PERSIANN and TAMSATv3.1) overestimated rainfall amount from 1.49% to as much as 82.69%, while the ARC2 underestimated rainfall amount by up to -20.25%. At both time scales, the TAMSATv3.1 performed better compared to the other products producing high Nash-Sutcliffe efficiency (E =0.61) and correlation coefficient (r =0.75). With Nash-Sutcliffe efficiency levels (E= 0.41) and a correlation coefficient (r = 0.78), CHIRPS’ performance is extremely equivalent to that of the TAMSAT product. Overall, the results showed better agreement between satellite products and rain gauge observations at the monthly time scale than at the annual time scale. Based on this study, TAMSATv3.1 and CHIRPS are considered to be reliable products for estimating rainfall amounts in the North Darfur State, with TAMSATv3.1 being superior to CHIRPS2. The TMPA product performed best for rainfall trends than others at a monthly time scale, but GPM IMERG6 performed the best product for annual rainfall trends.
The performance of SRE products mainly depends on factors such as rain gauge calibration, regional topography and data inputs; the performances are also influenced by variability and quality of the rain gauge data itself.
Author Contributions
M B. Altoom: writing—original draft preparation; methodology; Conceptualization; software; validation; formal analysis; investigation; resources, E. Adam: conception, confirmation, formal analysis, writing—review and editing, visualization, supervision; Review, supervision and editing by K.A. Ali. All authors have read and agreed to the published version of the manuscript.
Funding
This research received no external funding.
Acknowledgments
The authors acknowledge NASA, NOAA, the University of Reading, and the University of California for providing easy access to satellite-based rainfall products. We also would like to thank the North Darfur State Ministry of Agriculture for providing the rainfall data.
Conflicts of Interest
The authors declare no conflict of interest.
References
- Stillman, S.; Ninneman, J.; Zeng, X.; Franz, T.; Scott, R.L.; Shuttleworth, W.J.; Cummins, K. Summer Soil Moisture Spatiotemporal Variability in Southeastern Arizona. J. Hydrometeorol. 2014, 15, 1473–1485. [Google Scholar] [CrossRef]
- Ayehu, G.T.; Tadesse, T.; Gessesse, B.; Dinku, T. Validation of new satellite rainfall products over the Upper Blue Nile Basin, Ethiopia. Atmospheric Meas. Tech. 2018, 11, 1921–1936. [Google Scholar] [CrossRef]
- Brocca, L.; Pellarin, T.; Crow, W.T.; Ciabatta, L.; Massari, C.; Ryu, D.; Su, C.; Rüdiger, C.; Kerr, Y. Rainfall estimation by inverting SMOS soil moisture estimates: A comparison of different methods over Australia. J. Geophys. Res. Atmos. 2016, 121. [Google Scholar] [CrossRef]
- Asfaw, A.; Simane, B.; Hassen, A.; Bantider, A. Variability and time series trend analysis of rainfall and temperature in northcentral Ethiopia: A case study in Woleka sub-basin. Weather. Clim. Extrem. 2018, 19, 29–41. [Google Scholar] [CrossRef]
- Zambrano-Bigiarini, M.; Nauditt, A.; Birkel, C.; Verbist, K.; Ribbe, L. Temporal and spatial evaluation of satellite-based rainfall estimates across the complex topographical and climatic gradients of Chile. Hydrol. Earth Syst. Sci. 2017, 21, 1295–1320. [Google Scholar] [CrossRef]
- Field, C.B.; Barros, V.R. Climate change 2014–Impacts, adaptation and vulnerability: Regional aspects; Cambridge University Press: 2014.
- Kevane, M.; Gray, L. Darfur: rainfall and conflict. Environmental Research Letters 2008, 3, 034006. [Google Scholar] [CrossRef]
- Ibrahim, F.N. Ecological imbalance in the Republic of the Sudan: with reference to desertification in Darfur. 1984.
- Maidment, R.I.; Grimes, D.; Black, E.; Tarnavsky, E.; Young, M.; Greatrex, H.; Allan, R.P.; Stein, T.; Nkonde, E.; Senkunda, S. A new, long-term daily satellite-based rainfall dataset for operational monitoring in Africa. Scientific data 2017, 4, 1–19. [Google Scholar]
- Trejo, F.J.P.; Barbosa, H.Á.; Peñaloza-Murillo, M.A.; Moreno, M.A.; Farias, A. Intercomparison of improved satellite rainfall estimation with CHIRPS gridded product and rain gauge data over Venezuela. Atmósfera 2016, 29, 323–342. [Google Scholar] [CrossRef]
- Ageet, S.; Fink, A.H.; Maranan, M.; Diem, J.E.; Hartter, J.; Ssali, A.L.; Ayabagabo, P. Validation of Satellite Rainfall Estimates over Equatorial East Africa. J. Hydrometeorol. 2022, 23, 129–151. [Google Scholar] [CrossRef]
- Kidd, C.; Huffman, G. Global precipitation measurement. Meteorological Applications 2011, 18, 334–353. [Google Scholar] [CrossRef]
- Toté, C.; Patricio, D.; Boogaard, H.; Van Der Wijngaart, R.; Tarnavsky, E.; Funk, C. Evaluation of Satellite Rainfall Estimates for Drought and Flood Monitoring in Mozambique. Remote Sens. 2015, 7, 1758–1776. [Google Scholar] [CrossRef]
- Gebremichael, M.; Krajewski, W.F.; Morrissey, M.L.; Huffman, G.J.; Adler, R.F. A Detailed Evaluation of GPCP 1° Daily Rainfall Estimates over the Mississippi River Basin. J. Appl. Meteorol. 2005, 44, 665–681. [Google Scholar] [CrossRef]
- Usman, M.; Nichol, J.E.; Ibrahim, A.T.; Buba, L.F. A spatio-temporal analysis of trends in rainfall from long term satellite rainfall products in the Sudano Sahelian zone of Nigeria. Agric. For. Meteorol. 2018, 260-261, 273–286. [Google Scholar] [CrossRef]
- Sanogo, S.; Fink, A.H.; Omotosho, J.A.; Ba, A.; Redl, R.; Ermert, V. Spatio-temporal characteristics of the recent rainfall recovery in West Africa. Int. J. Clim. 2015, 35, 4589–4605. [Google Scholar] [CrossRef]
- Dezfuli, A.K.; Ichoku, C.M.; Huffman, G.J.; Mohr, K.I.; Selker, J.S.; van de Giesen, N.; Hochreutener, R.; Annor, F.O. Validation of IMERG Precipitation in Africa. J. Hydrometeorol. 2017, 18, 2817–2825. [Google Scholar] [CrossRef] [PubMed]
- Dembélé, M.; Zwart, S.J. Evaluation and comparison of satellite-based rainfall products in Burkina Faso, West Africa. Int. J. Remote. Sens. 2016, 37, 3995–4014. [Google Scholar] [CrossRef]
- Bayissa, Y.; Tadesse, T.; Demisse, G.; Shiferaw, A. Evaluation of Satellite-Based Rainfall Estimates and Application to Monitor Meteorological Drought for the Upper Blue Nile Basin, Ethiopia. Remote Sens. 2017, 9, 669. [Google Scholar] [CrossRef]
- Babaousmail, H.; Hou, R.; Ayugi, B.; Gnitou, G.T. Evaluation of satellite-based precipitation estimates over Algeria during 1998–2016. J. Atmospheric Solar-Terrestrial Phys. 2019, 195, 105139. [Google Scholar] [CrossRef]
- Girma, D. Evaluation and Bias correction of Tropical Applications of Meteorology using SATellite (TAMSAT) daily rainfall estimates over the data-scarce region of Southern Ethiopia. 2021, 1–7. [CrossRef]
- Lu, X.; Wang, L.; Pan, M.; Kaseke, K.F.; Li, B. A multi-scale analysis of Namibian rainfall over the recent decade—comparing TMPA satellite estimates and ground observations. J. Hydrol. Reg. Stud. 2016, 8, 59–68. [Google Scholar] [CrossRef]
- Elhamid, A.M.; Eltahan, A.M.; Mohamed, L.M.; Hamouda, I.A. Assessment of the two satellite-based precipitation products TRMM and RFE rainfall records using ground based measurements. Alex. Eng. J. 2020, 59, 1049–1058. [Google Scholar] [CrossRef]
- Maidment, R.I.; Grimes, D.I.F.; Allan, R.P.; Greatrex, H.; Rojas, O.; Leo, O. Evaluation of satellite-based and model re-analysis rainfall estimates for Uganda. Meteorol. Appl. 2013, 20, 308–317. [Google Scholar] [CrossRef]
- Osman, A. Agricultural change, land and violence: An examination of the region of Darfur, Sudan. PhD Dissertation, Food Policy and Applied Nutrition, Gerald J. and Dorothy R …, 2012. [Google Scholar]
- Siddig, K.; Stepanyan, D.; Wiebelt, M.; Grethe, H.; Zhu, T. Climate change and agriculture in the Sudan: Impact pathways beyond changes in mean rainfall and temperature. Ecol. Econ. 2019, 169, 106566. [Google Scholar] [CrossRef]
- Brauch, H.G. Desertification–a new security challenge for the Mediterranean? Policy agenda for recognising and coping with fatal outcomes of global environmental change and potentially violent societal consequences. In Desertification in the Mediterranean Region. A Security Issue; Springer: 2006; pp. 11-85.
- Elagib, N.A.; Al Zayed, I.S.; Saad, S.A.; Mahmood, M.I.; Basheer, M.; Fink, A.H. Debilitating floods in the Sahel are becoming frequent. J. Hydrol. 2021, 599, 126362. [Google Scholar] [CrossRef]
- Mohmmed, A.; Zhang, K.; Kabenge, M.; Keesstra, S.; Cerdà, A.; Reuben, M.; Elbashier, M.M.; Dalson, T.; Ali, A.A. Analysis of drought and vulnerability in the North Darfur region of Sudan. Land Degrad. Dev. 2018, 29, 4424–4438. [Google Scholar] [CrossRef]
- Wedajo, G.K.; Muleta, M.K.; Awoke, B.G. Performance evaluation of multiple satellite rainfall products for Dhidhessa River Basin (DRB), Ethiopia. Atmospheric Meas. Tech. 2021, 14, 2299–2316. [Google Scholar] [CrossRef]
- Yong, B.; Chen, B.; Gourley, J.J.; Ren, L.; Hong, Y.; Chen, X.; Wang, W.; Chen, S.; Gong, L. Intercomparison of the Version-6 and Version-7 TMPA precipitation products over high and low latitudes basins with independent gauge networks: Is the newer version better in both real-time and post-real-time analysis for water resources and hydrologic extremes? Journal of Hydrology 2014, 508, 77–87. [Google Scholar]
- Huffman, G.J.; Bolvin, D.T.; Nelkin, E.J.; Wolff, D.B.; Adler, R.F.; Gu, G.; Hong, Y.; Bowman, K.P.; Stocker, E.F. The TRMM Multisatellite Precipitation Analysis (TMPA): Quasi-Global, Multiyear, Combined-Sensor Precipitation Estimates at Fine Scales. J. Hydrometeorol. 2007, 8, 38–55. [Google Scholar] [CrossRef]
- Novella, N.S.; Thiaw, W.M. African Rainfall Climatology Version 2 for Famine Early Warning Systems. J. Appl. Meteorol. Clim. 2013, 52, 588–606. [Google Scholar] [CrossRef]
- Funk, C.; Verdin, A.; Michaelsen, J.; Peterson, P.; Pedreros, D.; Husak, G. A global satellite-assisted precipitation climatology. Earth Syst. Sci. Data 2015, 7, 275–287. [Google Scholar] [CrossRef]
- Sungmin, O.; Foelsche, U.; Kirchengast, G.; Fuchsberger, J.; Tan, J.; Petersen, W.A. Evaluation of GPM IMERG Early, Late, and Final rainfall estimates using WegenerNet gauge data in southeastern Austria. Hydrol. Earth Syst. Sci. 2017, 21, 6559–6572. [Google Scholar] [CrossRef]
- Huffman, G.J.; Bolvin, D.T.; Braithwaite, D.; Hsu, K.; Joyce, R.; Xie, P.; Yoo, S.-H. NASA global precipitation measurement (GPM) integrated multi-satellite retrievals for GPM (IMERG). Algorithm Theoretical Basis Document (ATBD) Version 2015, 4.
- Ashouri, H.; Hsu, K.-L.; Sorooshian, S.; Braithwaite, D.K.; Knapp, K.R.; Cecil, L.D.; Nelson, B.R.; Prat, O.P. PERSIANN-CDR: Daily Precipitation Climate Data Record from Multisatellite Observations for Hydrological and Climate Studies. Bull. Am. Meteorol. Soc. 2015, 96, 69–83. [Google Scholar] [CrossRef]
- Hsu, K.-L.; Gao, X.; Sorooshian, S.; Gupta, H.V. Precipitation Estimation from Remotely Sensed Information Using Artificial Neural Networks. J. Appl. Meteorol. 1997, 36, 1176–1190. [Google Scholar] [CrossRef]
- Tarnavsky, E.; Grimes, D.; Maidment, R.; Black, E.; Allan, R.P.; Stringer, M.; Chadwick, R.; Kayitakire, F. Extension of the TAMSAT Satellite-Based Rainfall Monitoring over Africa and from 1983 to Present. J. Appl. Meteorol. Clim. 2014, 53, 2805–2822. [Google Scholar] [CrossRef]
- Maidment, R.I.; Grimes, D.; Allan, R.P.; Tarnavsky, E.; Stringer, M.; Hewison, T.; Roebeling, R.; Black, E. The 30 year TAMSAT African Rainfall Climatology And Time series (TARCAT) data set. J. Geophys. Res. Atmos. 2014, 119, 10–619. [Google Scholar] [CrossRef]
- Grimes, D.; Pardo-Igúzquiza, E.; Bonifacio, R. Optimal areal rainfall estimation using raingauges and satellite data. J. Hydrol. 1999, 222, 93–108. [Google Scholar] [CrossRef]
- Nash, J.E.; Sutcliffe, J.V. River flow forecasting through conceptual models part I—A discussion of principles. Journal of hydrology 1970, 10, 282–290. [Google Scholar] [CrossRef]
- Diem, J.E.; Hartter, J.; Ryan, S.J.; Palace, M.W. Validation of Satellite Rainfall Products for Western Uganda. J. Hydrometeorol. 2014, 15, 2030–2038. [Google Scholar] [CrossRef]
- Legates, D.R.; McCabe Jr, G.J. Evaluating the use of “goodness-of-fit” measures in hydrologic and hydroclimatic model validation. Water resources research 1999, 35, 233–241. [Google Scholar] [CrossRef]
- Katsanos, D.; Retalis, A.; Michaelides, S. Validation of a high-resolution precipitation database (CHIRPS) over Cyprus for a 30-year period. Atmos. Res. 2016, 169, 459–464. [Google Scholar] [CrossRef]
- Gebremicael, T.G.; Mohamed, Y.A.; van der Zaag, P.; Gebremedhin, A.; Gebremeskel, G.; Yazew, E.; Kifle, M. Evaluation of multiple satellite rainfall products over the rugged topography of the Tekeze-Atbara basin in Ethiopia. Int. J. Remote. Sens. 2019, 40, 4326–4345. [Google Scholar] [CrossRef]
- Fenta, A.A.; Yasuda, H.; Shimizu, K.; Ibaraki, Y.; Haregeweyn, N.; Kawai, T.; Belay, A.S.; Sultan, D.; Ebabu, K. Evaluation of satellite rainfall estimates over the Lake Tana basin at the source region of the Blue Nile River. Atmospheric Res. 2018, 212, 43–53. [Google Scholar] [CrossRef]
- Basheer, M.; Elagib, N.A. Performance of satellite-based and GPCC 7.0 rainfall products in an extremely data-scarce country in the Nile Basin. Atmospheric Res. 2018, 215, 128–140. [Google Scholar] [CrossRef]
- Dinku, T.; Funk, C.; Peterson, P.; Maidment, R.; Tadesse, T.; Gadain, H.; Ceccato, P. Validation of the CHIRPS satellite rainfall estimates over eastern Africa. Q. J. R. Meteorol. Soc. 2018, 144, 292–312. [Google Scholar] [CrossRef]
- Dinku, T.; Ceccato, P.; Grover-Kopec, E.; Lemma, M.; Connor, S.; Ropelewski, C. Validation of satellite rainfall products over East Africa’s complex topography. International Journal of Remote Sensing 2007, 28, 1503–1526. [Google Scholar] [CrossRef]
- Omonge, P.; Feigl, M.; Olang, L.; Schulz, K.; Herrnegger, M. Evaluation of satellite precipitation products for water allocation studies in the Sio-Malaba-Malakisi river basin of East Africa. J. Hydrol. Reg. Stud. 2021, 39, 100983. [Google Scholar] [CrossRef]
- Kimani, M.W.; Hoedjes, J.C.B.; Su, Z. An Assessment of Satellite-Derived Rainfall Products Relative to Ground Observations over East Africa. Remote. Sens. 2017, 9, 430. [Google Scholar] [CrossRef]
- Roushdi, M. Spatio-Temporal Assessment of Satellite Estimates and Gauge-Based Rainfall Products in Northern Part of Egypt. Climate 2022, 10, 134. [Google Scholar] [CrossRef]
- Liu, X.; Yang, T.; Hsu, K.; Liu, C.; Sorooshian, S. Evaluating the streamflow simulation capability of PERSIANN-CDR daily rainfall products in two river basins on the Tibetan Plateau. Hydrol. Earth Syst. Sci. 2017, 21, 169–181. [Google Scholar] [CrossRef]
- Zhang, Z.; Tian, J.; Huang, Y.; Chen, X.; Chen, S.; Duan, Z. Hydrologic Evaluation of TRMM and GPM IMERG Satellite-Based Precipitation in a Humid Basin of China. Remote. Sens. 2019, 11, 431. [Google Scholar] [CrossRef]
- Bitew, M.M.; Gebremichael, M. Assessment of satellite rainfall products for streamflow simulation in medium watersheds of the Ethiopian highlands. Hydrol. Earth Syst. Sci. 2011, 15, 1147–1155. [Google Scholar] [CrossRef]
Figure 1.
Map of the North Darfur State study area with the names of rainfall stations shown with a blue star.
Figure 1.
Map of the North Darfur State study area with the names of rainfall stations shown with a blue star.
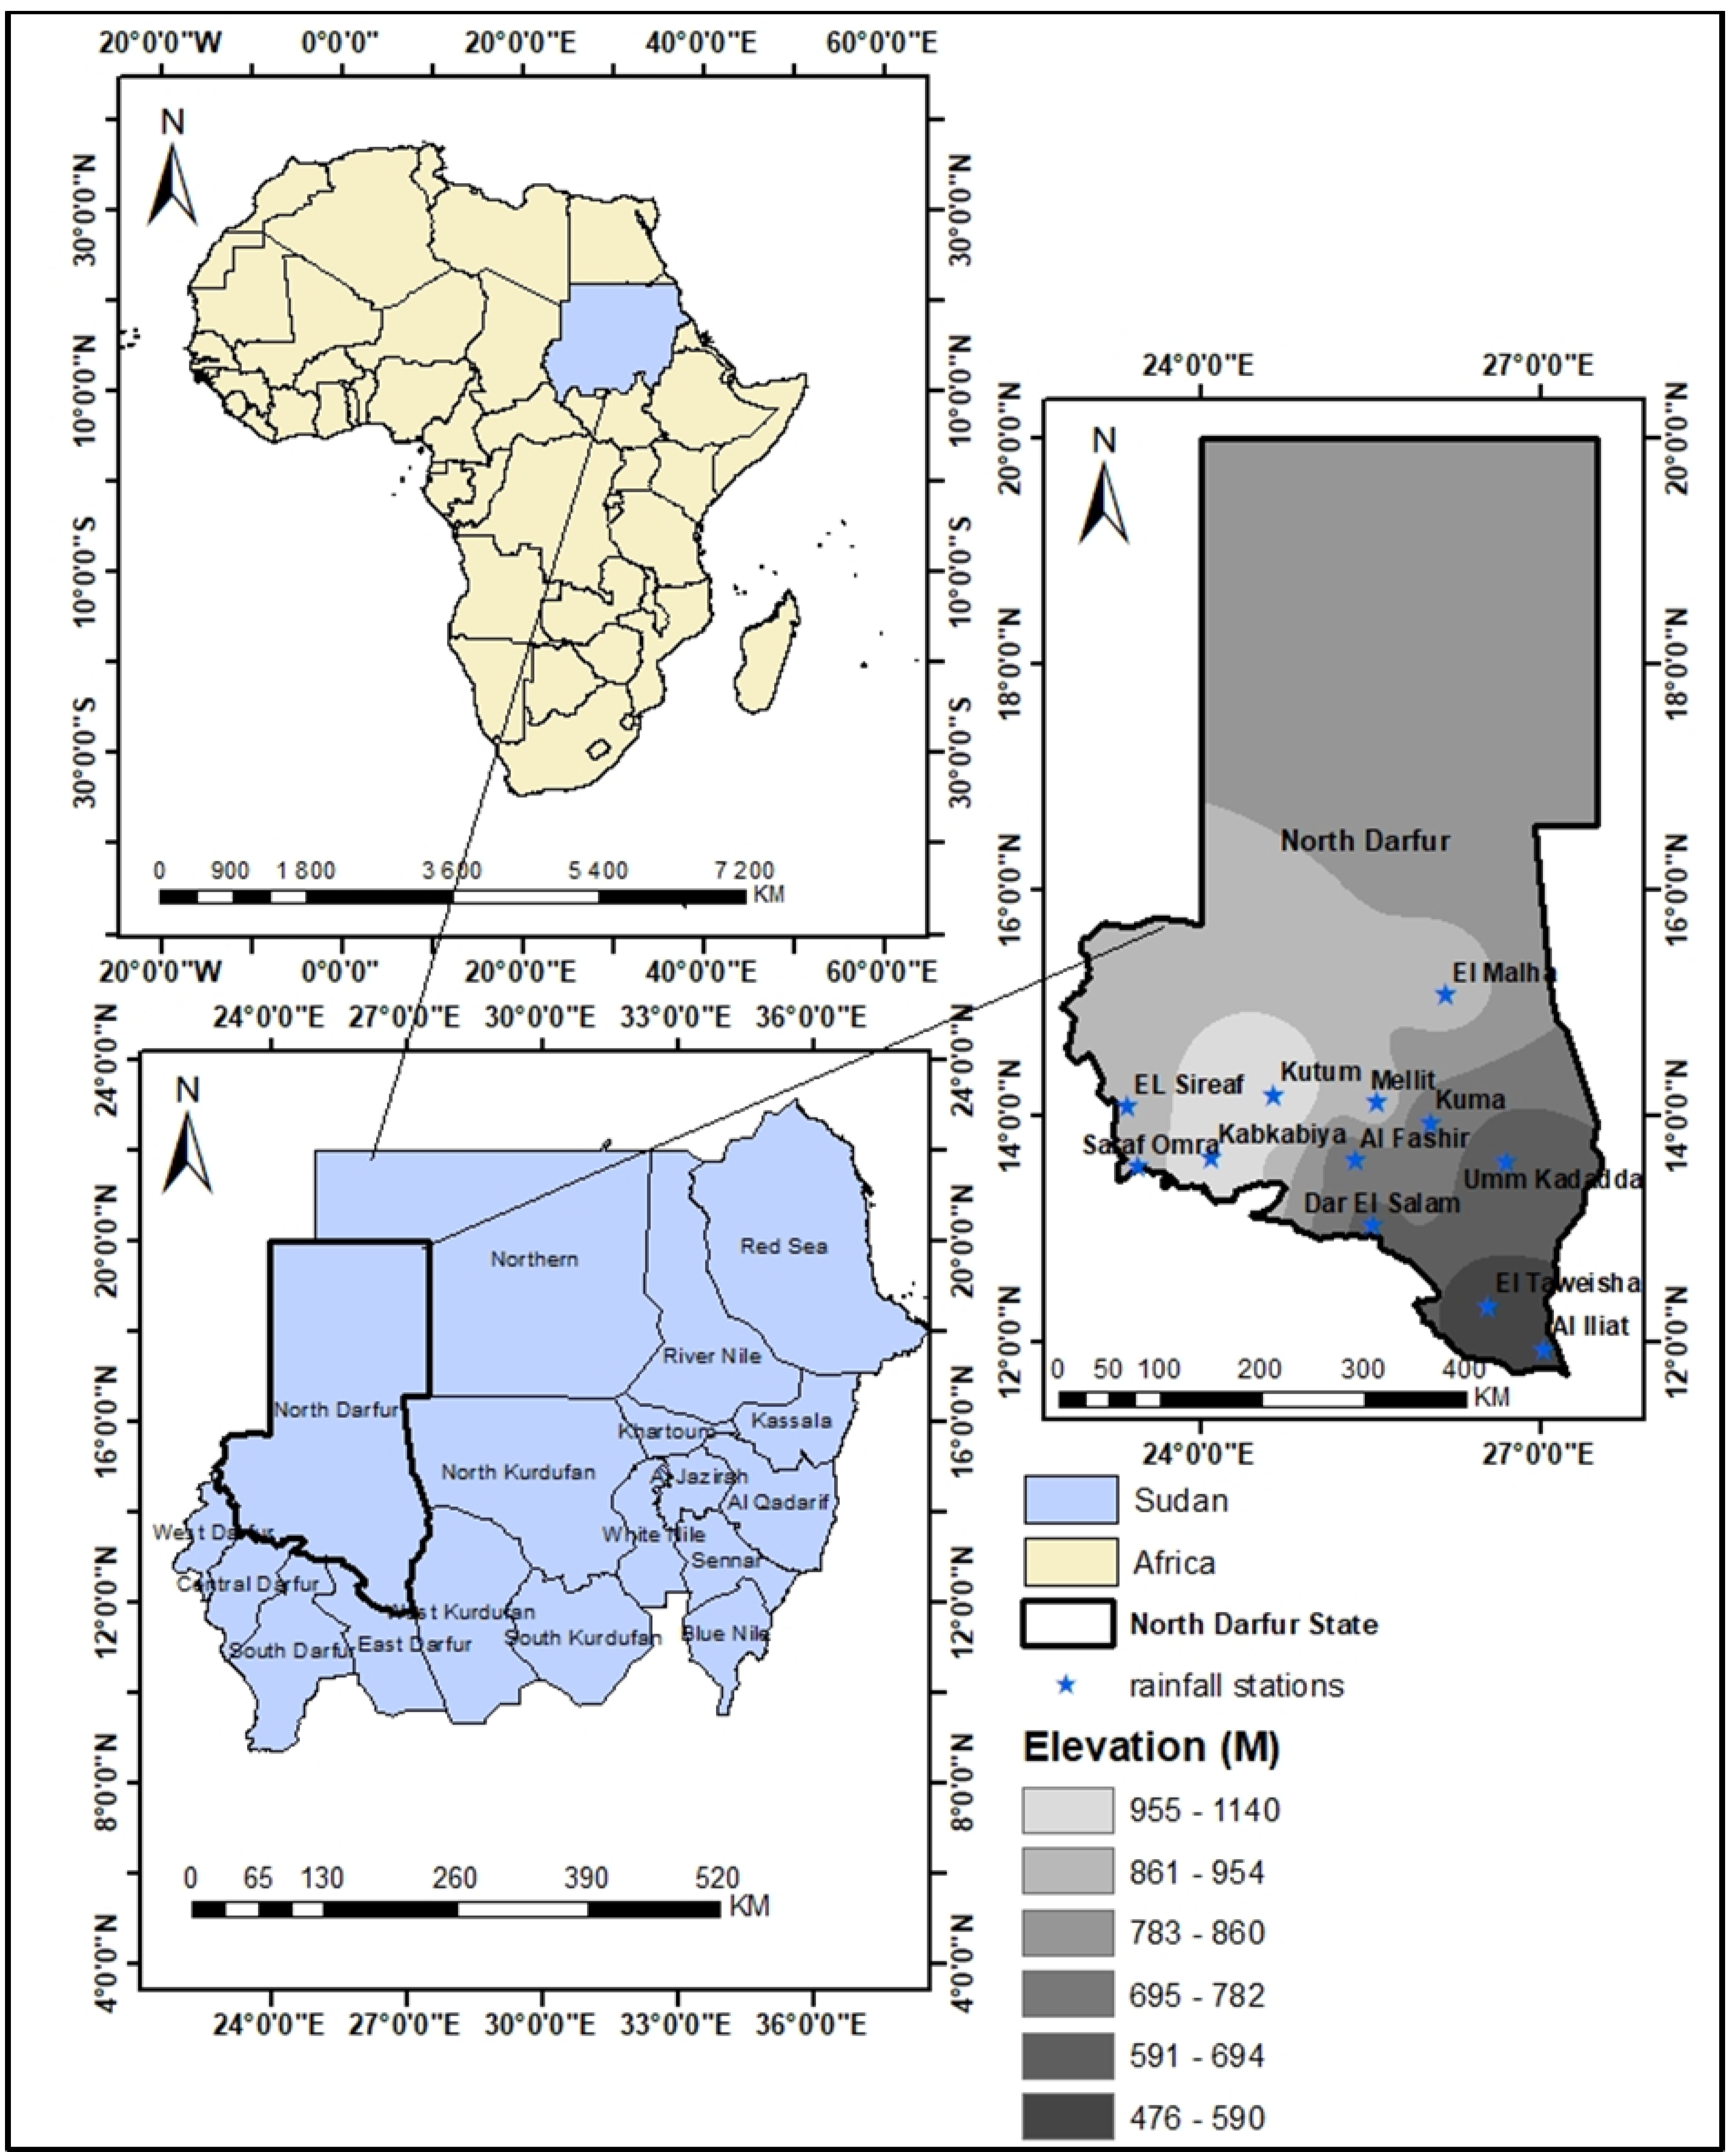
Figure 2.
Scatterplots of monthly precipitation between satellite-based rainfall estimates (SREs) and rain gauge rainfall for eleven stations between June and September 2000–2019 at point-to-pixel-based station locations.
Figure 2.
Scatterplots of monthly precipitation between satellite-based rainfall estimates (SREs) and rain gauge rainfall for eleven stations between June and September 2000–2019 at point-to-pixel-based station locations.
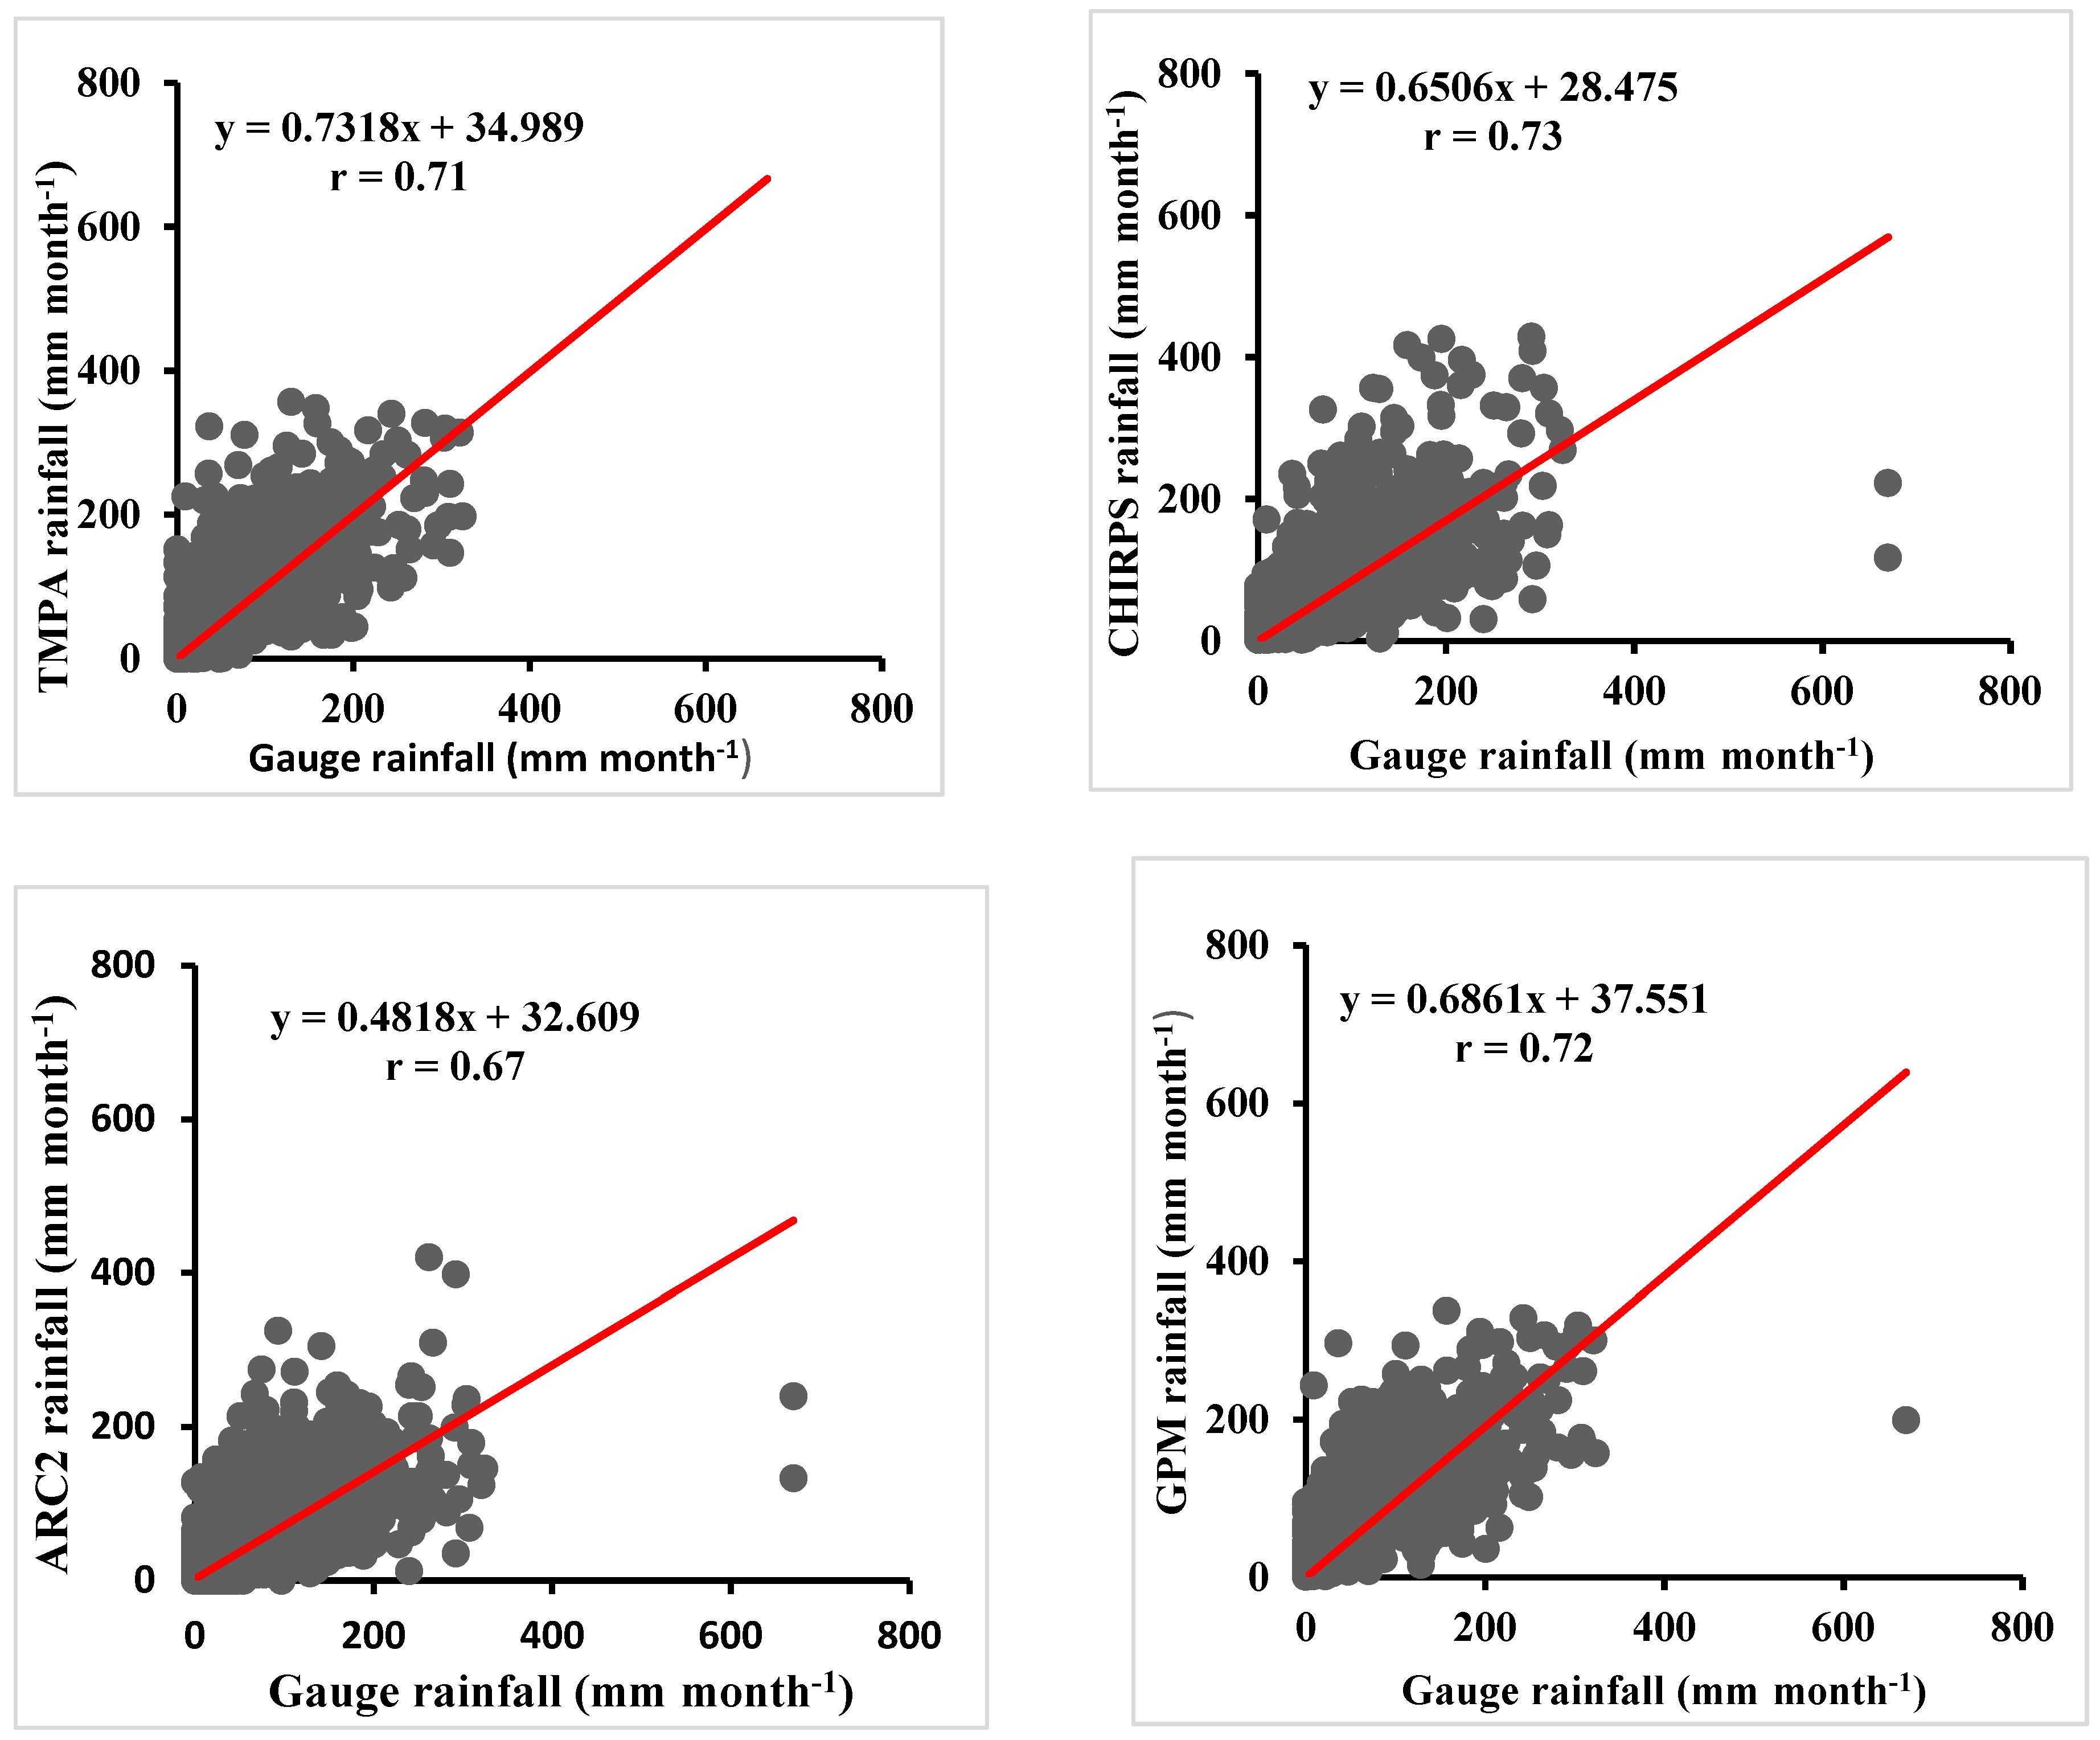
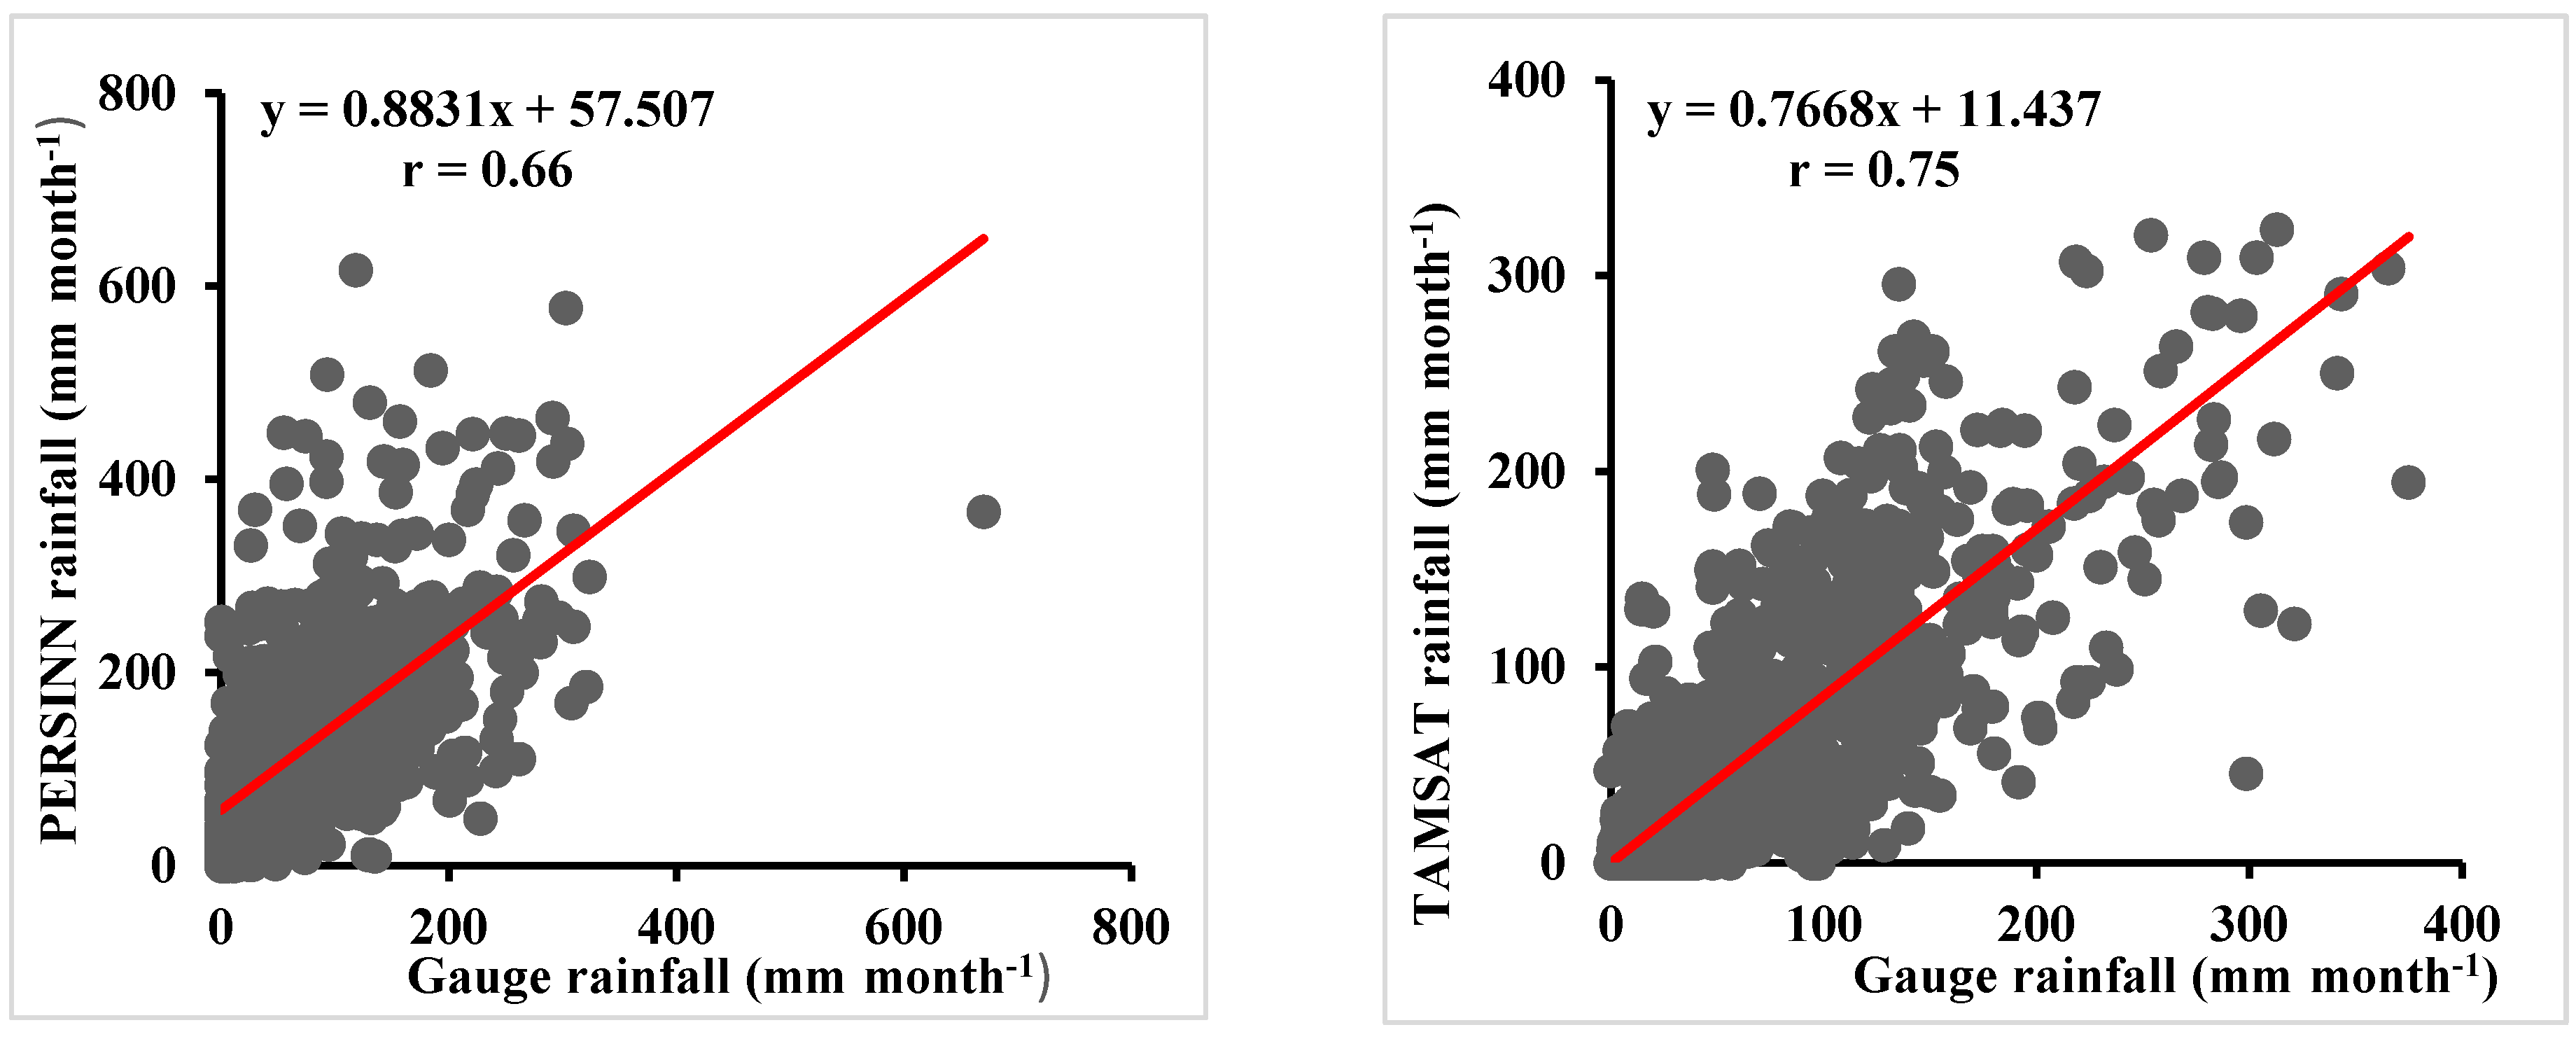
Figure 3.
Scatterplots of annual precipitation between satellite rainfall estimates and rain gauge rainfall for eleven stations during the periods 2000–2019 at point-to-pixel-based station locations.
Figure 3.
Scatterplots of annual precipitation between satellite rainfall estimates and rain gauge rainfall for eleven stations during the periods 2000–2019 at point-to-pixel-based station locations.
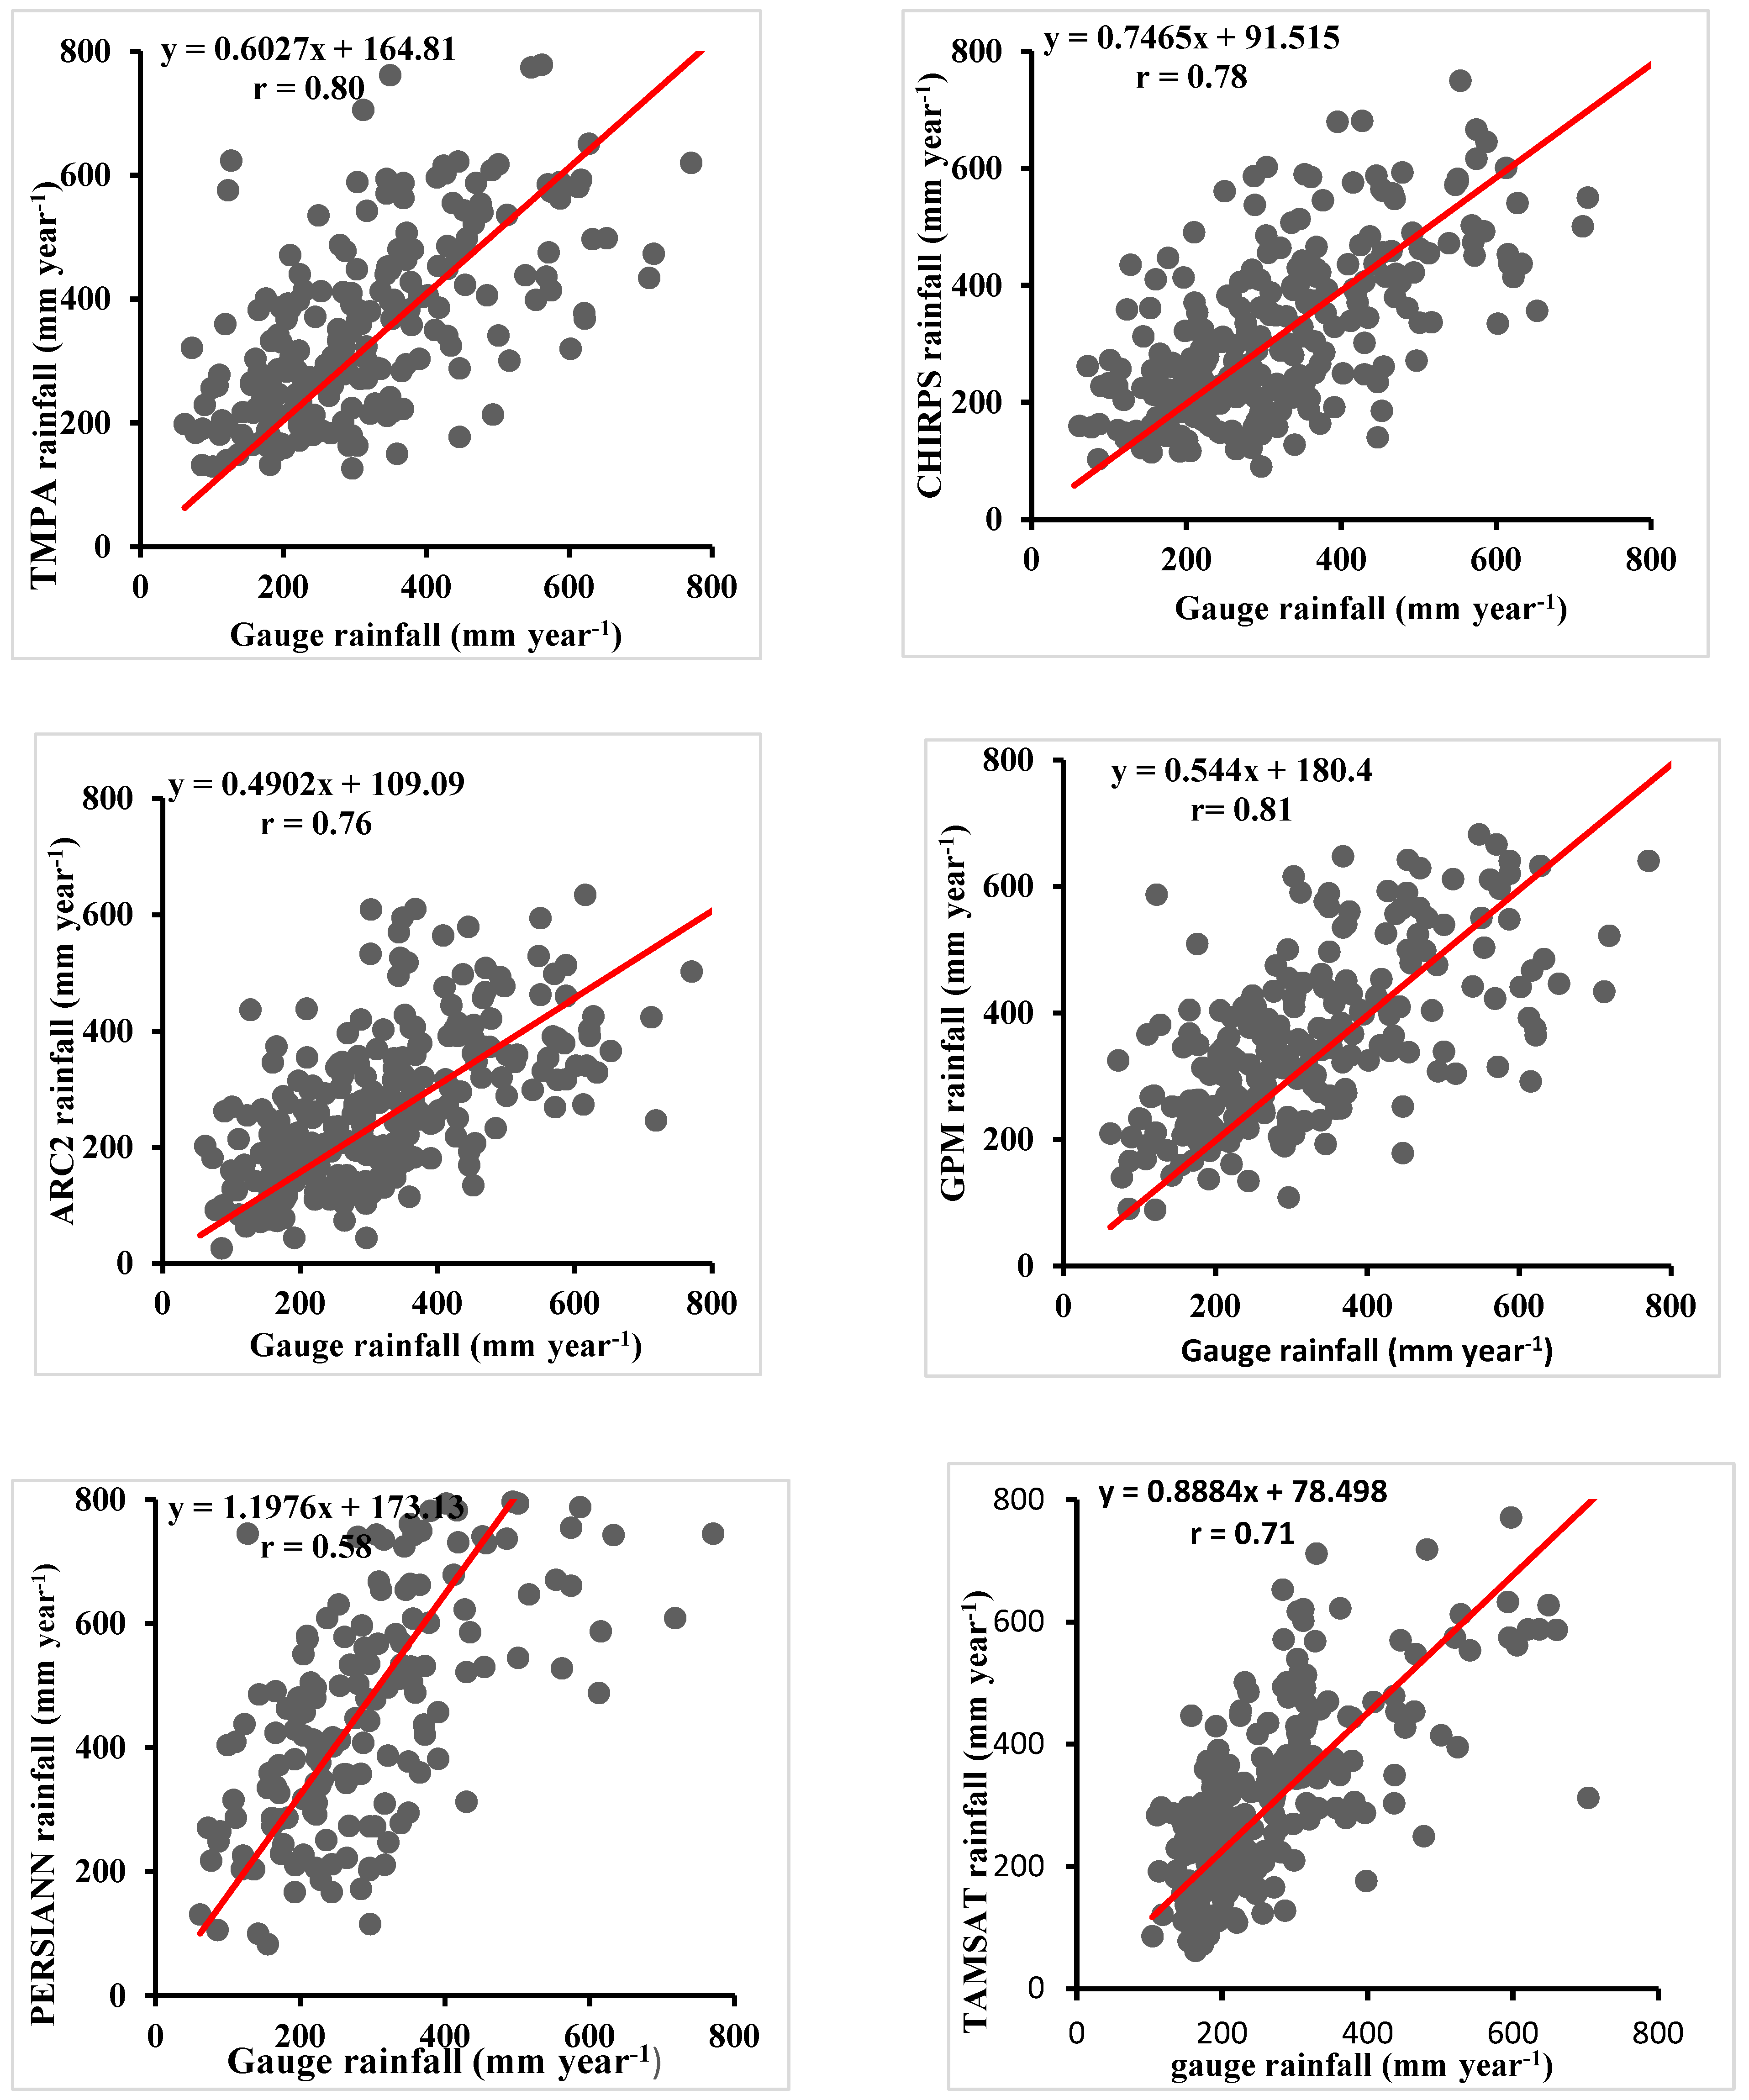
Figure 4.
Shows the spatial distribution of mean annual rainfall estimates from six satellites for the years 2000 to 2019.
Figure 4.
Shows the spatial distribution of mean annual rainfall estimates from six satellites for the years 2000 to 2019.
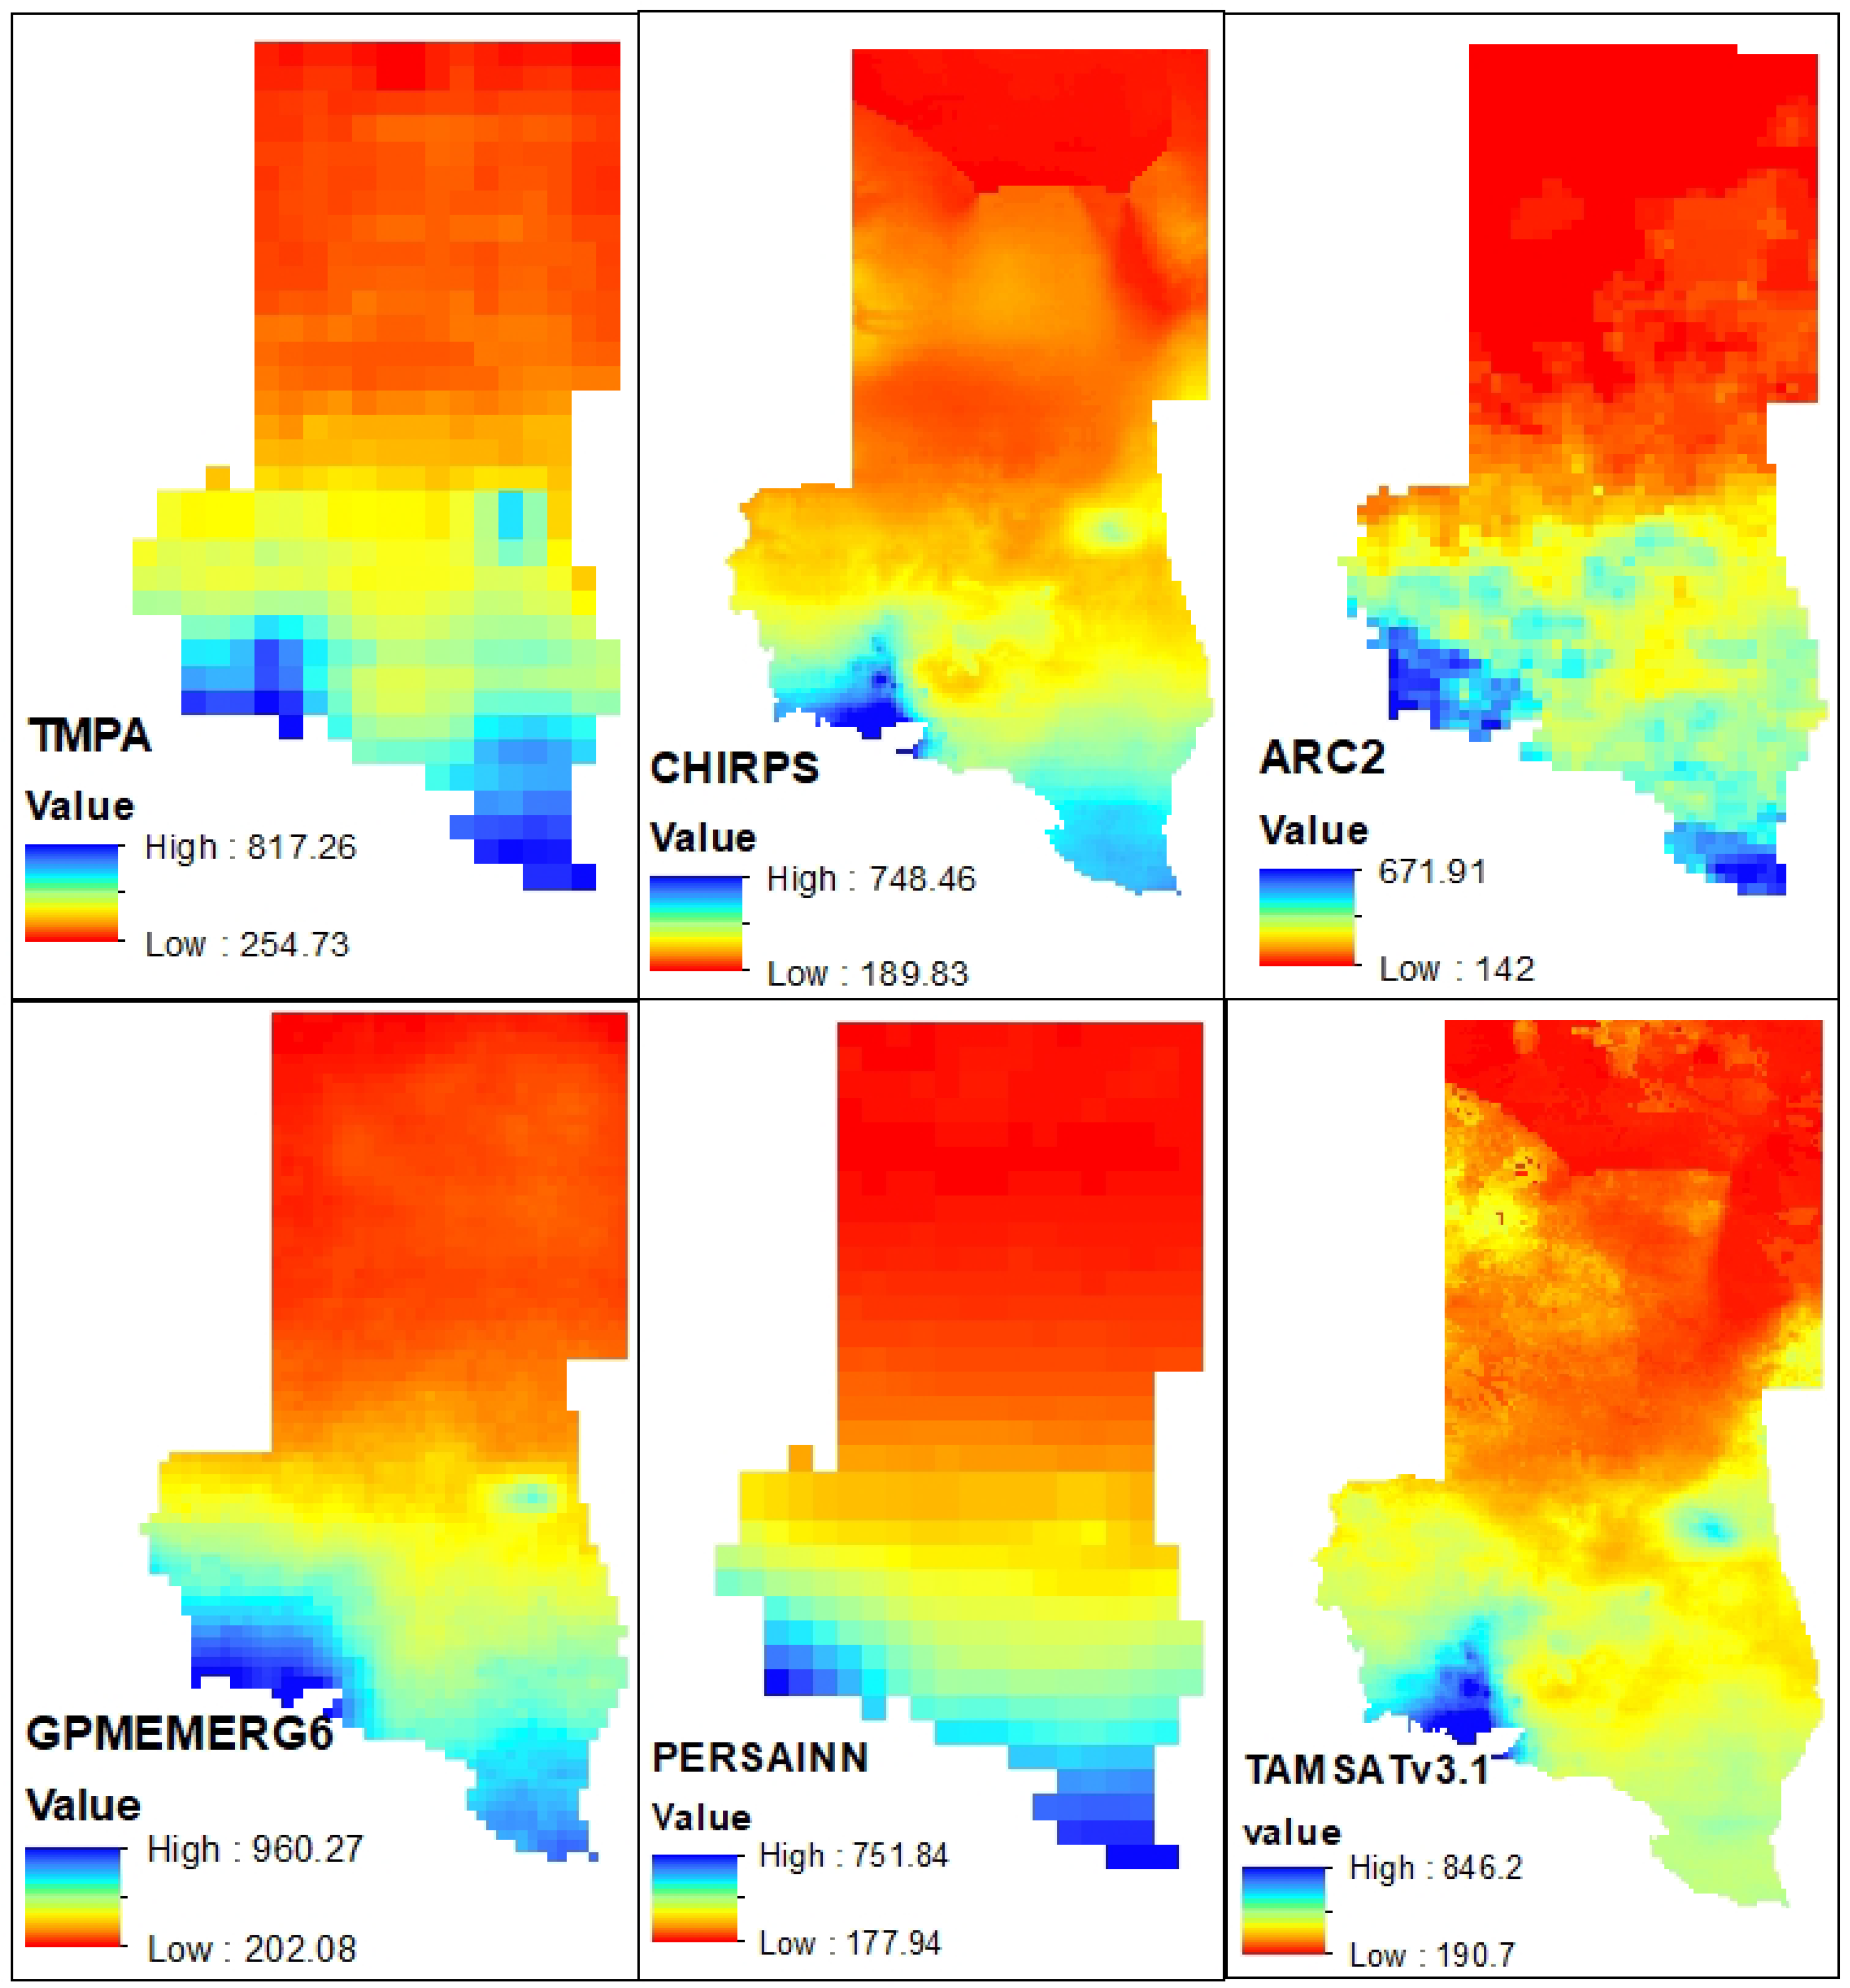
Figure 5.
Comparison of rain-gauge observations based on monthly rainfall trends in 11 stations over North Darfur state and six satellite precipitation products for 20 years.
Figure 5.
Comparison of rain-gauge observations based on monthly rainfall trends in 11 stations over North Darfur state and six satellite precipitation products for 20 years.
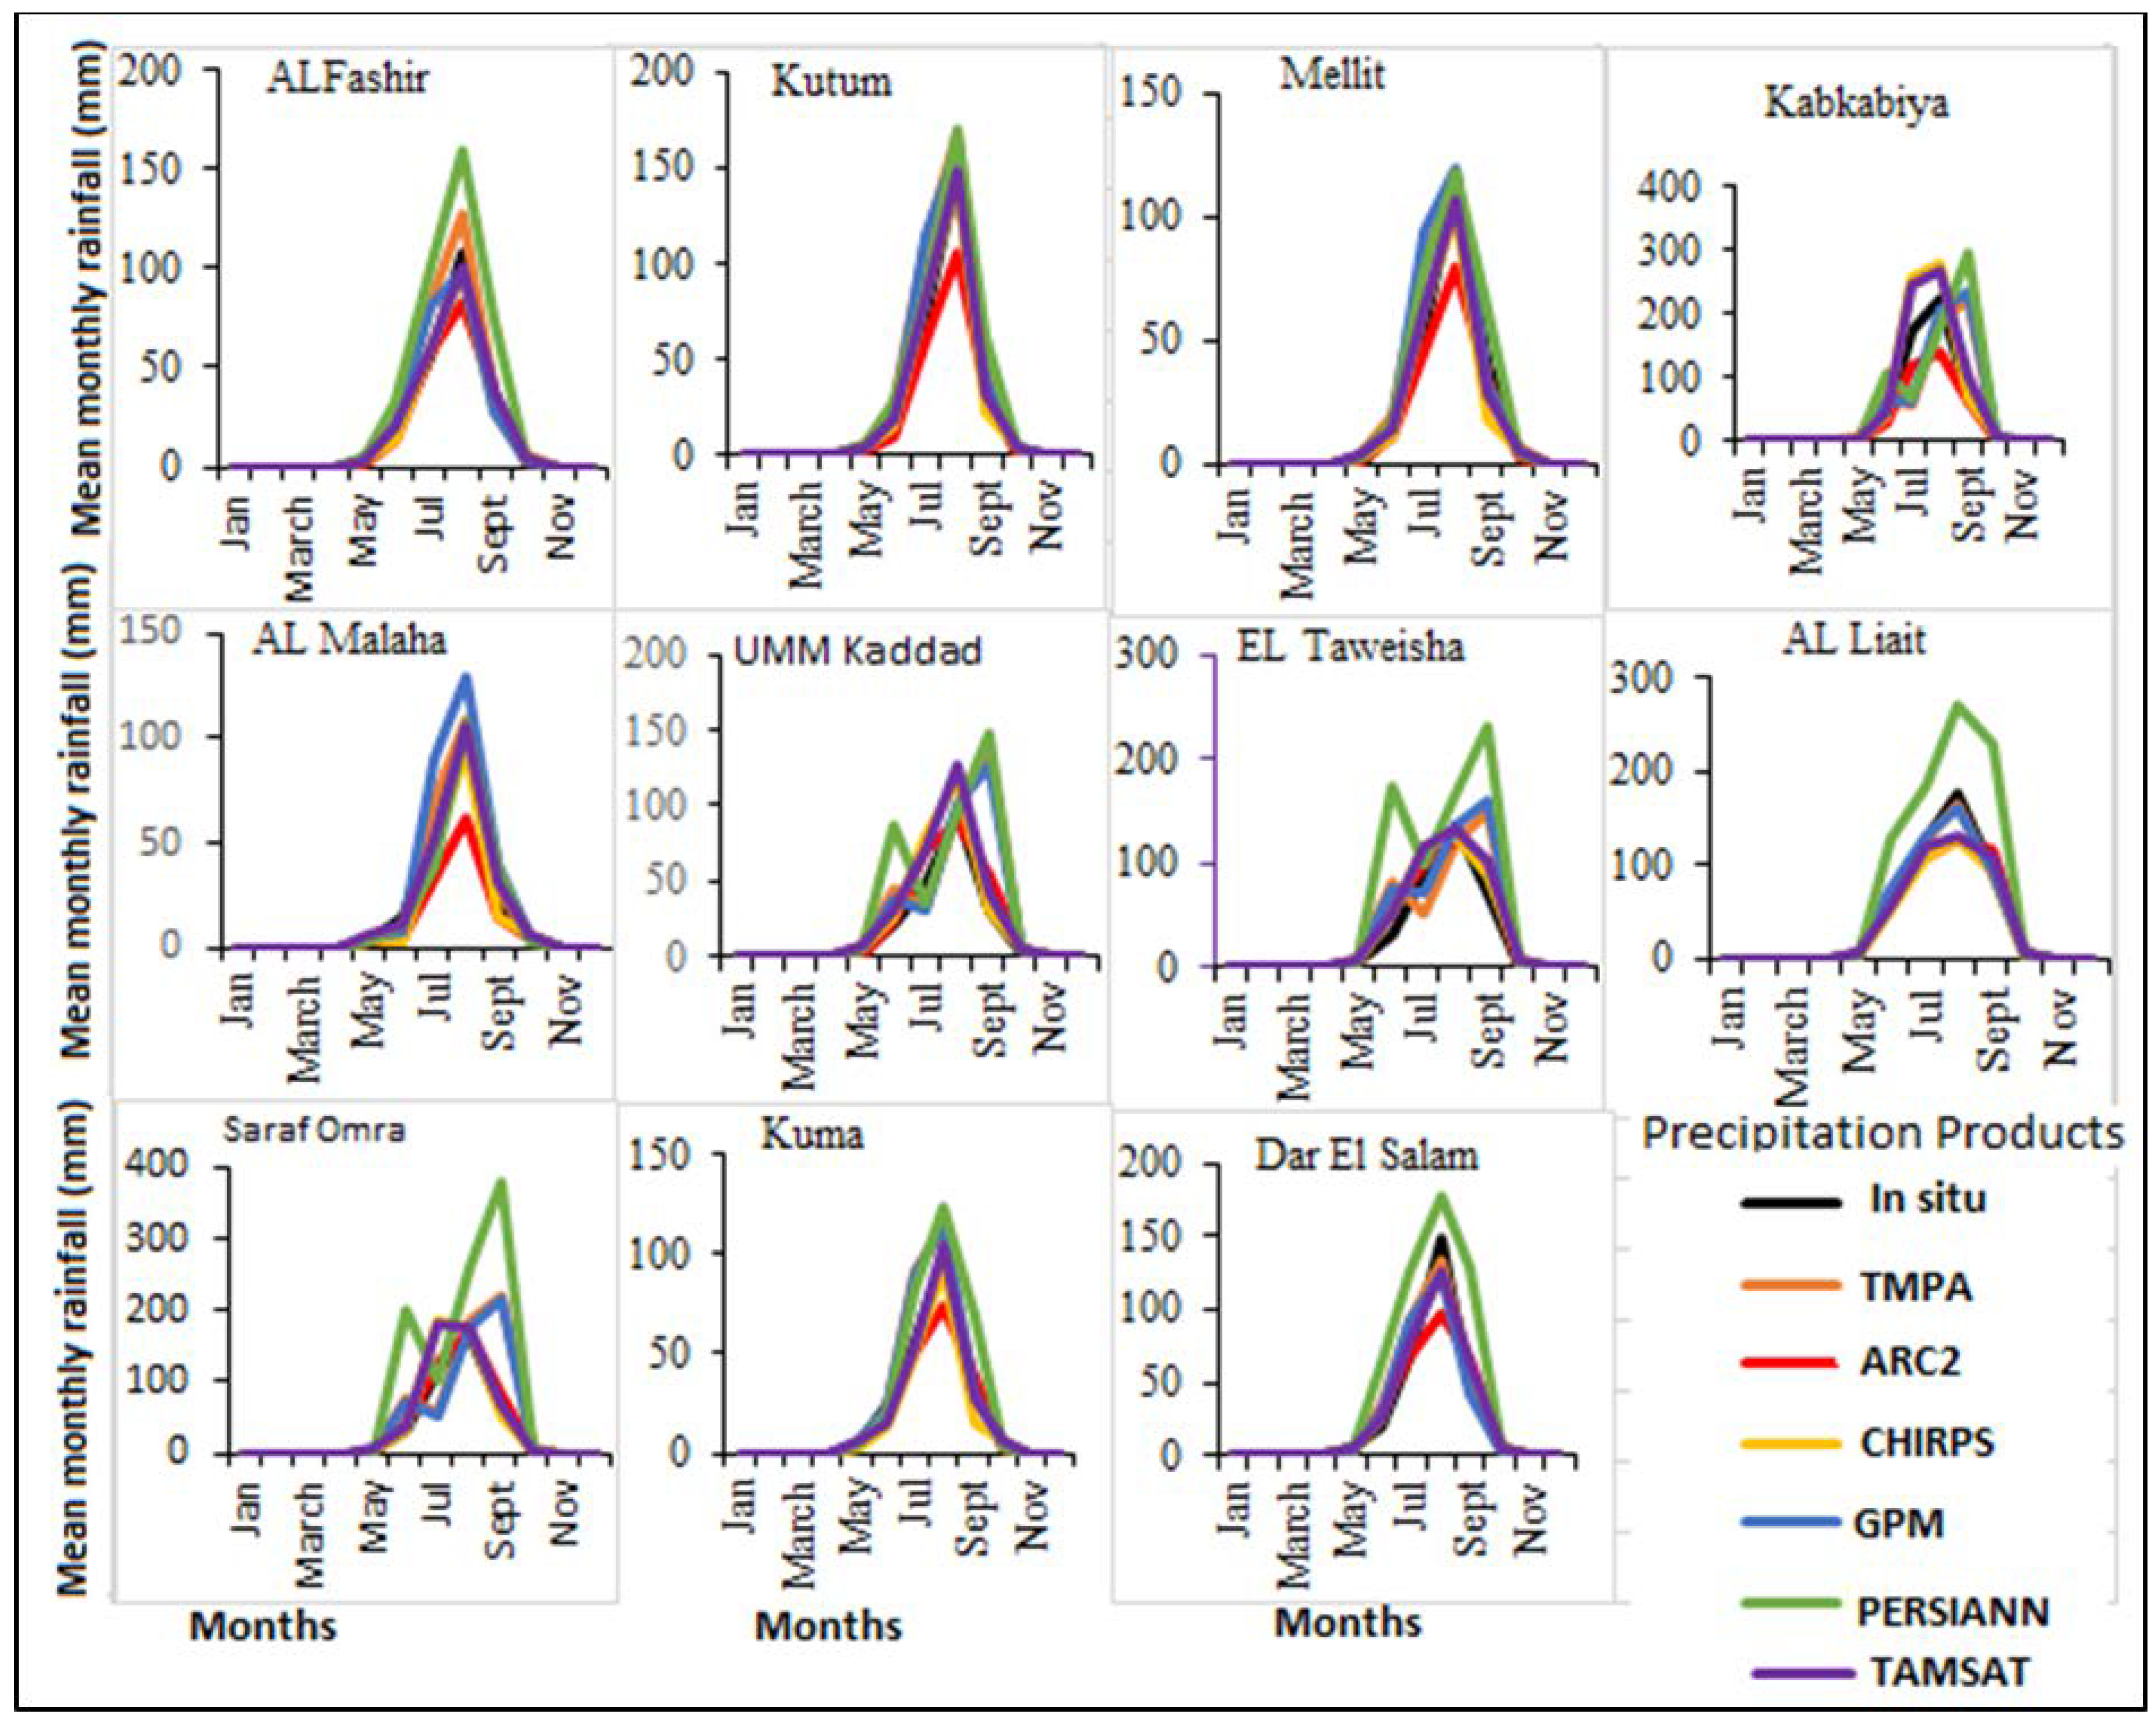
Figure 6.
Comparison of rain-gauge observations based on annual rainfall trends in 11 stations over North Darfur state and six satellite precipitation products for 20 years.
Figure 6.
Comparison of rain-gauge observations based on annual rainfall trends in 11 stations over North Darfur state and six satellite precipitation products for 20 years.
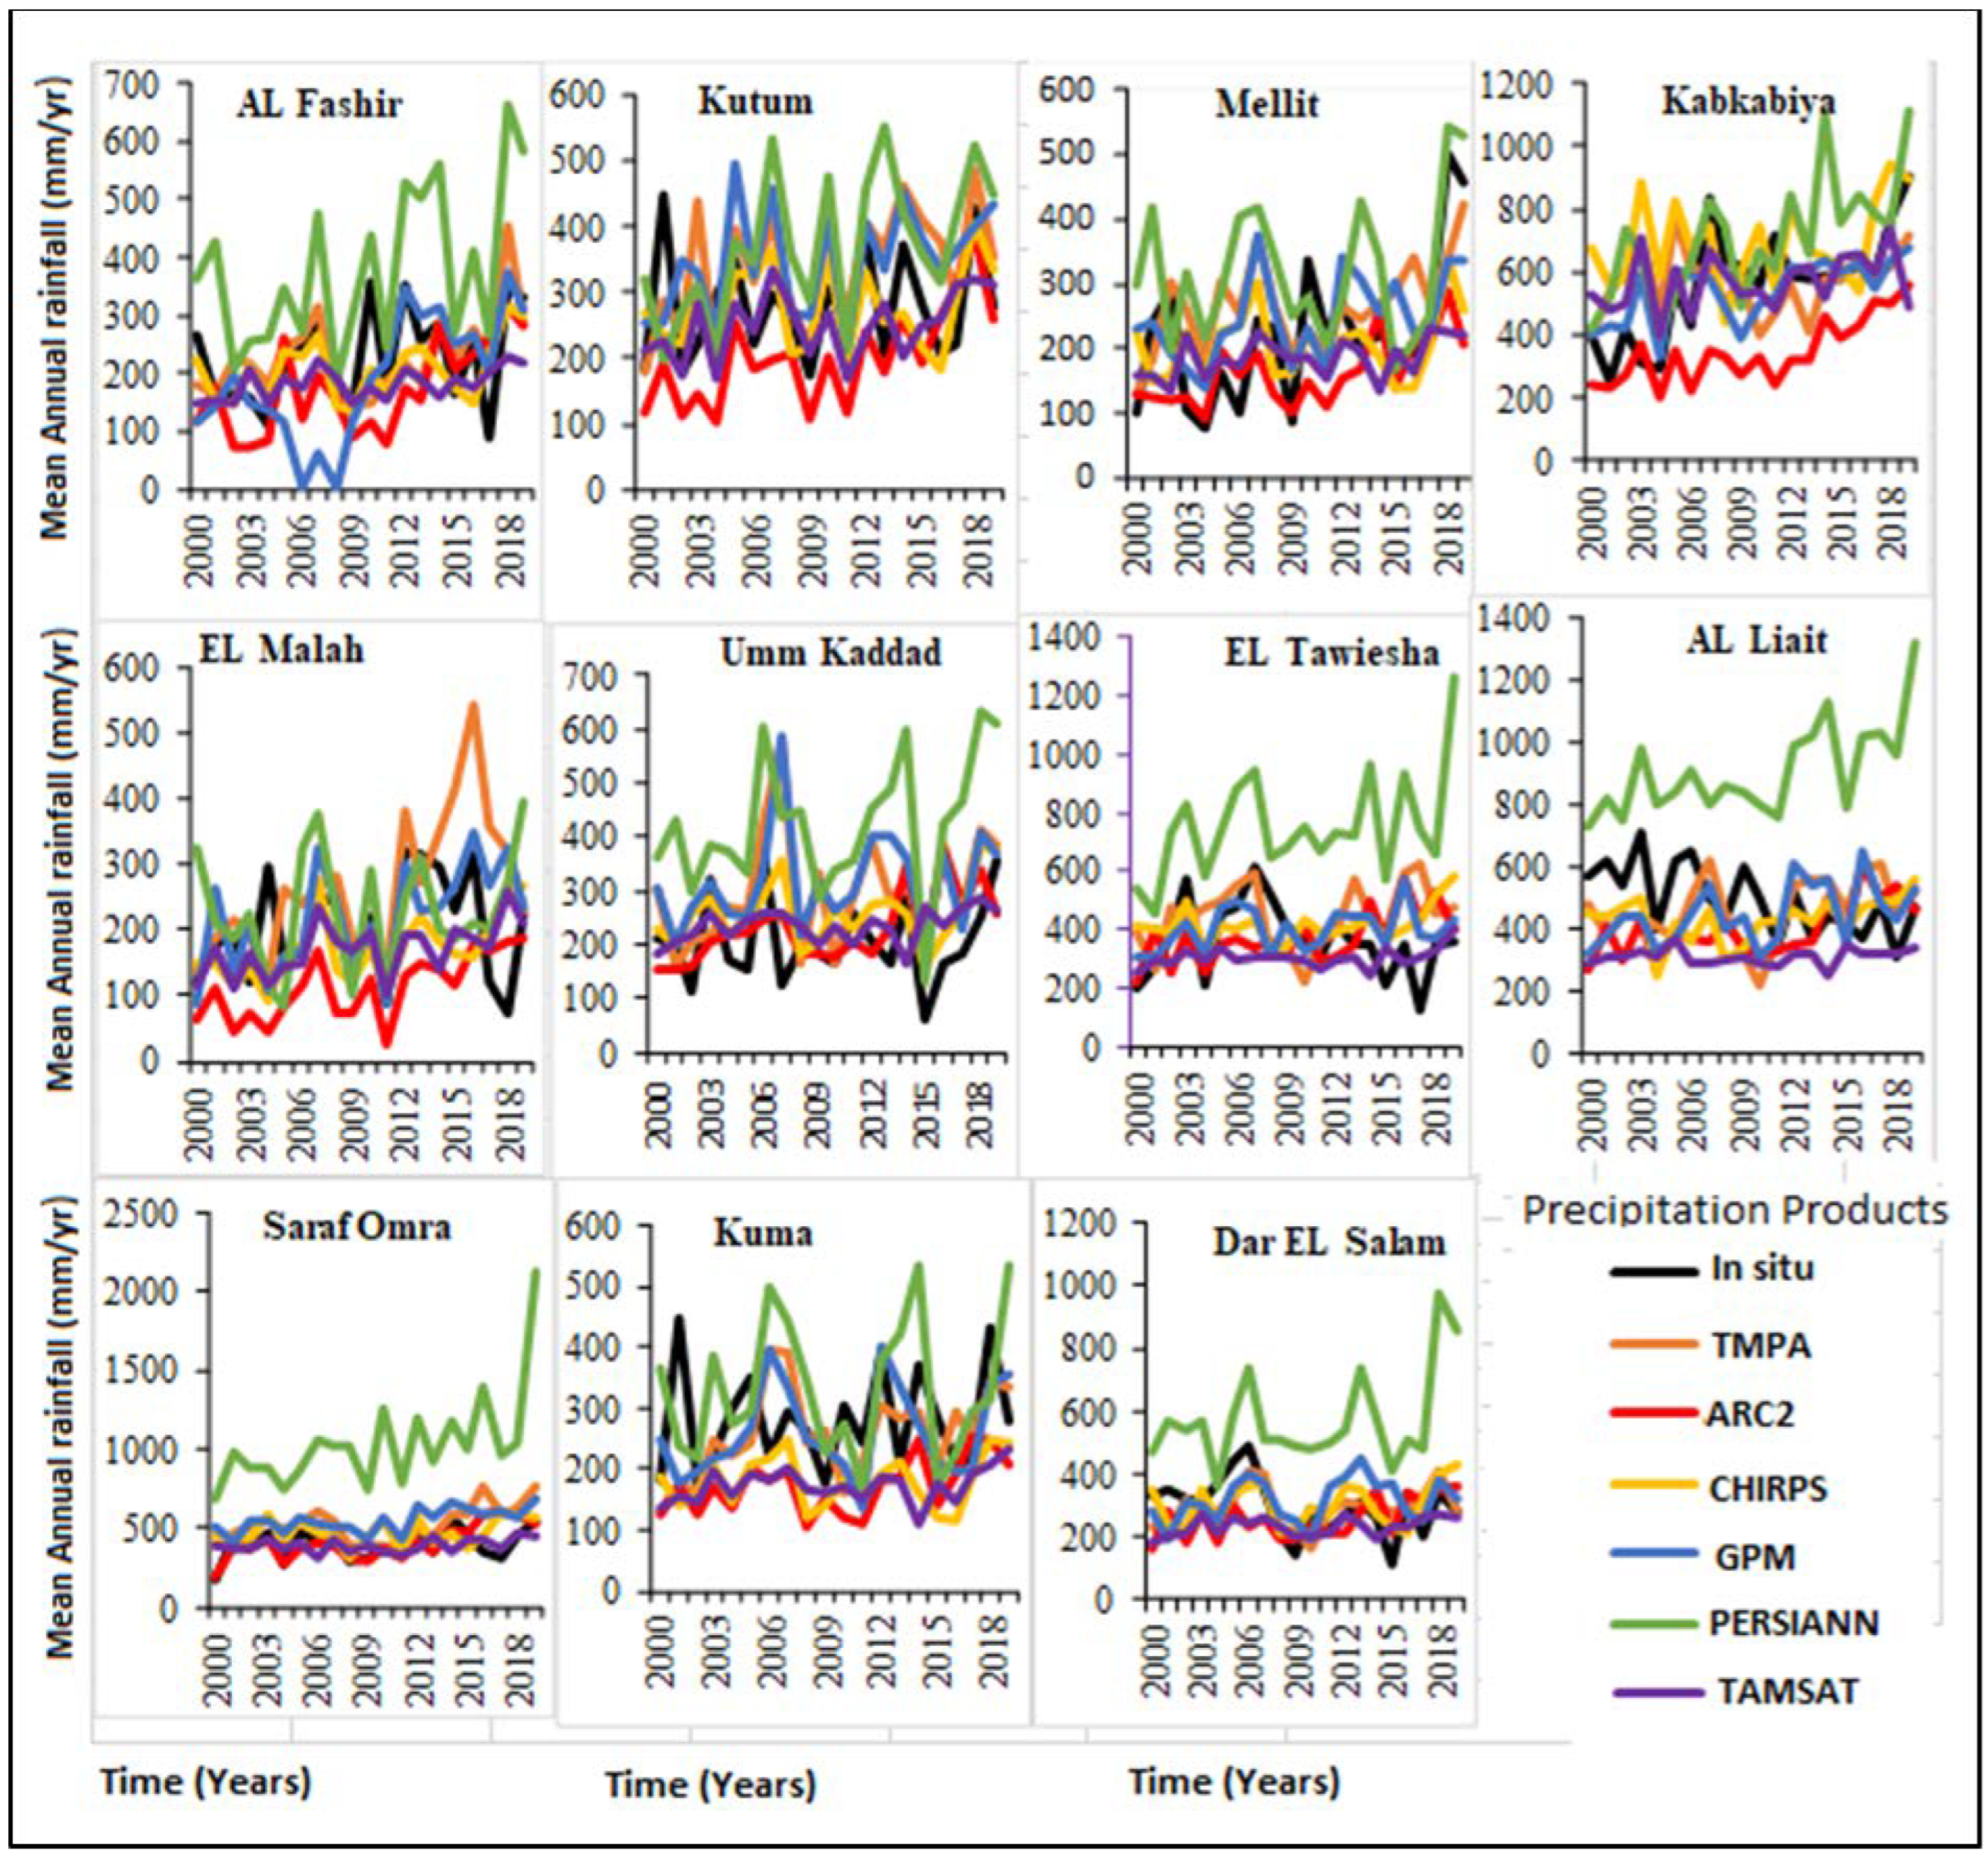

Table 1.
Meteorological data and geographical characteristics of 11 stations in North Darfur State: 2000–2019.
Table 1.
Meteorological data and geographical characteristics of 11 stations in North Darfur State: 2000–2019.
| No. | Rainfall station | Latitude (°N) | Longitude (°E) | Elevation (amsl) | Data availability | Mean annual rainfall |
| 1 | Al Fashir | 13° 38’ | 25° 20’ | 0740 | Monthly | 232.3 |
| 2 | Kutum | 14° 21’ | 24° 40’ | 1160 | Monthly | 279.8 |
| 3 | Mellit | 14° 13’ | 25° 55’ | 0900 | Monthly | 223.9 |
| 4 | Kabkabiya | 13° 39’ | 24° 5’ | 1120 | Monthly | 558.6 |
| 5 | EL Malha | 15° 09’ | 26° 15’ | 0900 | Monthly | 211.7 |
| 6 | Umm Kadadda | 13° 59’ | 26° 14’ | 0595 | Monthly | 227.2 |
| 7 | ELTawiesha | 12° 29’ | 26° 59’ | 591 | Monthly | 363.4 |
| 8 | AL Liait | 11° 57’ | 27° 04’ | 587 | Monthly | 517.1 |
| 9 | Saraf Omra | 13° 47’ | 23° 30’ | 1105 | Monthly | 404.3 |
| 10 | Kuma | 13° 39’ | 26° 01’ | 875 | Monthly | 220.2 |
| 11 | Dar EL Salam | 13° 05’ | 25° 53’ | 817 | Monthly | 302.2 |
Table 2.
Parameters of the six satellite-based precipitation products (SPPs) used in the study: 2000–2019.
Table 2.
Parameters of the six satellite-based precipitation products (SPPs) used in the study: 2000–2019.
| No. | Satellites-based rainfall products | Temporal coverage | Spatial coverage | Temporal resolution | Spatial resolution |
|---|---|---|---|---|---|
| 1 | TMPA-3B42v7.0 | 1998–2019 | Near global | Monthly | 0.25 ̊ × 0.25 ̊ |
| 2 | ARC Version 2.0 | 1983–present | Africa | Daily | 0.1 ̊ × 0.1 ̊ |
| 3 | CHIRPS Version 2.0 | 1981–present | Near global | Daily | 0.05 ̊ × 0.05 ̊ |
| 4 | GPM IMERG6 | 2000–2019 | Near global | Monthly | 0.1 ̊ × 0.1 ̊ |
| 5 | PERSIANN-CDR | 1982–2020 | Near global | Daily | 0.25 ̊ × 0.25 ̊ |
| 6 | TAMSATv3.1 | 1983–present | Africa | Daily | 0.0375 ̊ |
Table 3.
The point-to-pixel Evaluation at a monthly time scale using continuous statistical tools. The Correlation coefficient (r), root mean square error (RMSE), percent bias (Pbias), and Nash-Sutcliffe efficiency (E).
Table 3.
The point-to-pixel Evaluation at a monthly time scale using continuous statistical tools. The Correlation coefficient (r), root mean square error (RMSE), percent bias (Pbias), and Nash-Sutcliffe efficiency (E).
| Dataset | r | RMSE | Pbias | E |
|---|---|---|---|---|
| TMPA | 0.71 | 52.73 | 15.34 | 0.36 |
| CHIRPS2 | 0.73 | 50.64 | 1.49 | 0.41 |
| ARC2 | 0.67 | 51.19 | -20.25 | 0.40 |
| GPMIMERG6 | 0.72 | 51.49 | 18.01 | 0.39 |
| PERSIANN | 0.66 | 76.66 | 48.88 | -0.35 |
| TAMSAT | 0.75 | 47.1 | 10.29 | 0.49 |
Table 4.
The point-to-pixel Evaluation at an annual time scale using continuous statistical tools. The Correlation coefficient (r), root mean square error (RMSE), per cent bias (Pbias), and Nash-Sutcliffe efficiency (E).
Table 4.
The point-to-pixel Evaluation at an annual time scale using continuous statistical tools. The Correlation coefficient (r), root mean square error (RMSE), per cent bias (Pbias), and Nash-Sutcliffe efficiency (E).
| Dataset | r | RMSE | Pbias | E |
|---|---|---|---|---|
| TMPA | 0.80 | 110.2 | 21.33 | 0.50 |
| CHIRPS2.0 | 0.78 | 112.4 | 22.85 | 0.39 |
| ARC2.0 | 0.76 | 89.8 | -16.9 | 0.35 |
| GPMIMERG6 | 0.81 | 100.4 | 10.19 | 0.19 |
| PERSIANN | 0.58 | 235.2 | 82.69 | -0.57 |
| TAMSAT | 0.71 | 8.7 | 14.98 | 0.61 |
Table 5.
Performance of six SPPs in estimating rainfall trends on a monthly time scale at 11 stations, using correlation coefficient (r) and per cent bias (Pbias %).
Table 5.
Performance of six SPPs in estimating rainfall trends on a monthly time scale at 11 stations, using correlation coefficient (r) and per cent bias (Pbias %).
| stations | Statistic/ products | TMPA | CHIRPS2 | ARC2 | GPMIMERG6 | PERSIANN | TAMSAT |
|---|---|---|---|---|---|---|---|
| Al Fashir | r | 0.83 | 0.84 | 0.61 | 0.8 | 0.8 | 0.72 |
| Pbias | 24.91 | -10.23 | -19.72 | 5.56 | 67.57 | 3.62 | |
| Kutum | r | 0.77 | 0.79 | 0.79 | 0.7 | 0.67 | 0.67 |
| Pbias | 29.53 | -1.92 | -24.32 | 24.89 | 21.77 | 5.25 | |
| Mellit | r | 0.66 | 0.7 | 0.69 | 0.64 | 0.61 | 0.61 |
| Pbias | 14.59 | -10.77 | -24.68 | 21.38 | 25.45 | -1.94 | |
| Kabkabiya | r | 0.54 | 0.71 | 0.74 | 0.54 | 0.55 | 0.53 |
| Pbias | 0.55 | 23.57 | -34.98 | 5.67 | 16.10 | 28.46 | |
| EL Malha | r | 0.68 | 0.65 | 0.71 | 0.71 | 0.64 | 0.64 |
| Pbias | 4.19 | -20.84 | -43.36 | 28.49 | -4.58 | 7.50 | |
| Umm Kadadda | r | 0.61 | 0.41 | 0.44 | 0.55 | 0.57 | 0.6 |
| Pbias | 59.96 | 26.08 | 16.65 | 50.98 | 76.68 | 40.04 | |
| ELTawiesha | r | 0.47 | 0.65 | 0.43 | 0.53 | 0.53 | 0.66 |
| Pbias | 17.68 | 11.16 | 9.91 | 29.21 | 85.50 | 17.41 | |
| AL Liait | r | 0.48 | 0.41 | 0.25 | 0.42 | 0.2 | 0.48 |
| Pbias | -17.78 | -13.79 | 0.05 | 70.88 | -9.39 | -3.36 | |
| Saraf Omra | r | 0.5 | 0.7 | 0.68 | 0.39 | 0.46 | 0.72 |
| Pbias | 20.90 | 14.25 | 42.32 | 143.12 | 27.26 | 49.51 | |
| Kuma | r | 0.56 | 0.61 | 0.44 | 0.57 | 0.55 | 0.61 |
| Pbias | -15.65 | -14.13 | 27.71 | 37.49 | -2.47 | 29.27 | |
| Dar EL Salam | r | 0.61 | 0.62 | 0.56 | 0.59 | 0.45 | 0.72 |
| Pbias | 15.19 | 1.99 | -6.96 | 4.68 | 72.00 | 8.17 |
Table 6.
The rainfall trends were assessed at monthly time scales for six satellite products at 11 stations using Correlation coefficient (r) and per cent bias (Pbias %).
Table 6.
The rainfall trends were assessed at monthly time scales for six satellite products at 11 stations using Correlation coefficient (r) and per cent bias (Pbias %).
| stations | Statistic/ products | TMPA | CHIRPS2 | ARC2 | GPMIMERG6 | PERSIANN | TAMSAT |
|---|---|---|---|---|---|---|---|
| Al Fashir | r | 0.47 | 0.57 | 0.66 | 0.36 | 0.67 | 0.46 |
| Pbias | 0.79 | -24.26 | -9.45 | -16.26 | 65.96 | -20.22 | |
| Kutum | r | 0.50 | 0.57 | 0.56 | 0.61 | 0.72 | 0.74 |
| Pbias | 20.87 | -0.96 | -27.45 | 25.11 | 32.83 | 9.99 | |
| Mellit | r | 0.61 | 0.44 | 0.58 | 0.57 | 0.61 | 0.43 |
| Pbias | 19.08 | -8.07 | -26.94 | 11.15 | 42.91 | -16.70 | |
| Kabkabiya | r | 0.23 | 0.46 | 0.56 | 0.70 | 0.72 | 0.25 |
| Pbias | 23.25 | -38.37 | -3.59 | 25.58 | 1.12 | 1.30 | |
| EL Malha | r | 0.42 | 0.34 | 0.82 | 0.83 | 0.37 | 0.52 |
| Pbias | 29.50 | -15.47 | -44.78 | 6.97 | 12.97 | -15.97 | |
| Umm Kadadda | r | 0.25 | 0.63 | 0.38 | 0.44 | 0.46 | 0.21 |
| Pbias | 44.79 | 24.72 | 10.07 | 53.00 | 103.54 | 12.45 | |
| ELTawiesha | r | 0.41 | 0.22 | 0.43 | 0.42 | 0.64 | 0.36 |
| Pbias | 21.54 | 14.30 | 1.72 | 10.25 | 106.48 | -16.81 | |
| AL Liait | r | 0.22 | 0.38 | 0.46 | 0.55 | 0.66 | 0.34 |
| Pbias | -6.37 | -13.09 | -20.22 | -10.03 | 83.53 | -37.56 | |
| Saraf Omra | r | 0.51 | 0.40 | 0.51 | 0.62 | 0.63 | 0.28 |
| Pbias | 31.81 | 19.48 | 3.03 | 37.85 | 161.07 | -0.90 | |
| Kuma | r | 0.14 | 0.57 | 0.54 | 0.44 | 0.76 | 0.25 |
| Pbias | -7.25 | -35.51 | -38.05 | -6.63 | 18.67 | -37.98 | |
| Dar EL Salam | r | 0.43 | 0.51 | 0.39 | 0.17 | 0.47 | 0.46 |
| Pbias | -1.64 | 2.45 | -13.79 | 7.22 | 92.38 | -21.26 |
Disclaimer/Publisher’s Note: The statements, opinions and data contained in all publications are solely those of the individual author(s) and contributor(s) and not of MDPI and/or the editor(s). MDPI and/or the editor(s) disclaim responsibility for any injury to people or property resulting from any ideas, methods, instructions or products referred to in the content. |
© 2024 by the authors. Licensee MDPI, Basel, Switzerland. This article is an open access article distributed under the terms and conditions of the Creative Commons Attribution (CC BY) license (https://creativecommons.org/licenses/by/4.0/).
Copyright: This open access article is published under a Creative Commons CC BY 4.0 license, which permit the free download, distribution, and reuse, provided that the author and preprint are cited in any reuse.


