Submitted:
22 May 2023
Posted:
23 May 2023
You are already at the latest version
Abstract
Systematic reviews and meta-analyses have become an important way to summarize data. The hierarchy of evidence-based medicine confers a high platform to meta-analyses. Hence, it is imperative that the analytical and reporting strategy associated with a meta-analysis be standardized. The modern tradition of reporting and publishing a meta-analysis is riddled with several methodological flaws. The most common of these flaws involve the choice of the model used to conduct the meta-analysis and the way that the heterogeneity of studies is assessed. The use of the I2 statistic as a means of detecting within-study heterogeneity is a common methodological flaw encountered in reporting summary statistics.One of the ways to rectify the above flaws is to arm reviewers with an objective way to scrutinize the manuscript. This narrative review enlists six checklists for reviewers to improve the reporting of meta-analyses. The first two checklists address reporting of the risk of bias and assessment of publication bias with the help of a funnel plot. Checklists 3, 4, and 5 address the choice of model selected for the meta-analysis, the method to assess the confidence interval, and the measures of heterogeneity. The final checklist addresses the question asked in the meta-analysis, binary versus an effect size estimate. Although there are many more aspects which can help improve the assessment of a manuscript, these basic checklists can be employed by reviewers without the need for an external statistical analysis to enhance and improve meta-analyses.
Keywords:
Meta-analysis
; heterogeneity
; reviewer
; checklist
1. Introduction:
Systematic reviews and meta-analyses have become an effective way to present summary data. Since different trials are conducted with differing background patient characteristics, it is extremely difficult to assess the generalizability of the outcomes by simply looking at the final summarized effect size. Most of the summary data tend to report the mean effect size to generalize it. However, with the backdrop of significant differences in the baseline characteristics of the patients as well as the study design characteristics, a summary statistic is better suited to assess the heterogeneity of the mean effect size. [1] The reporting of most meta-analyses is riddled with methodological and reporting errors. However, these reporting styles have become the standardized way of reporting data, leading to the accumulation of a plethora of manuscripts with inaccurate estimates and conclusions. For example, the reporting of heterogeneity based on I2 statistics is a very common mistake. [2] One of the most effective ways to rectify these perennial problems is to arm reviewers with a short and summarized checklist for reviewing a meta-analysis. This review was undertaken to provide such a checklist.
2. Checklist for reviewing a meta-analysis
2.1. Assessment of publication bias and risk of bias of the included studies
2.1.1. The risk of bias of a systematic review
There are several tools and algorithms used to assess the risk of bias associated with the studies included for analysis. [3] The most used methods are GRADE (Grading of Recommendations Assessment, Development and Evaluation) and the Cochrane risk-of-bias algorithm. As far as the latter is concerned, it is extremely common to encounter assessments performed with either a 5-point domain (bias due to the randomization process, bias due to deviation from the intended intervention, bias due to missing data, bias in the measurement of the outcome, bias in the selection of the reported result) or a 7-point domain (confounding, participant selection, intervention classification, deviation from the intended intervention, missing data, outcome measurement bias, and selective reporting). It is important to keep in mind that the 5-point domain is used when randomized controlled trials (RCTs) are analysed, while the 7-point domain is used in the case of the analysis of nonrandomized data. [4]
2.1.2. Funnel plot
Assessment of the funnel plot is the least frequently commented upon figure while reviewing a meta-analysis. It is included as a supplementary material and hence remains neglected. It is important to remember that, even after conducting a thorough search, it is practically impossible to identify all the studies that fit the inclusion criteria. As a result, systematic biases are introduced in the search, which can influence the final inference of the analysis. The problem of missing studies can lead to overestimation as well as an underestimation of the summary effect size. A reviewer needs to remain aware of all the possible biases that can influence a meta-analysis (citation bias, time-lag bias, multiple publication bias, language bias, and other reporting bias). [5] The statistical methods to identify publication bias involve reporting a funnel plot.
The initial step is to detect the “small-study effect”. [6] Since small studies have larger effect sizes, they are more likely to be published, and their inclusion in the pooled analysis would lead to an inflation of the summary effect size. In addition, since the standard error is directly proportional to the sample size, smaller studies inject a larger error into the pooled analysis.
Example 1: A case of publication bias
We prepared a hypothetical dataset with events and total participants in the active and control arms. The effect size analysed is the standardized mean difference. There were 18 studies included for analysis.
A contour-enhanced funnel plot is more informative than a nonenhanced funnel plot. (Figure 1) By observation, we can identify three small studies (dots higher up the funnel are large studies, while those lower down are small studies) that have large effect sizes as well as large standard errors. These studies impart asymmetry to the funnel plot, which indicates missing studies in the p>0.05 part of the funnel plot. The Egger’s test p value was significant, indicating funnel plot asymmetry. This could imply a small-study effect, significant heterogeneity between the studies, or a mixture of high risk-of-bias and moderate or low risk-of-bias studies. [4]
The tests for funnel plot asymmetry can only be performed when there are at least 10 studies included in an analysis. Reviewers should remain extremely cautious when a meta-analysis is conducted with a smaller number of studies. It is also important to note that the tests for funnel plot asymmetry depend on the method used to estimate the effect size. In the case of mean difference or standardized mean difference (SMD), Egger’s or Begg & Thomson’s tests are preferred, while in the case of binary data (odds ratio or risk ratio), Peter’s or Harbourd’s tests are preferred. [4]
Once a significant publication bias is established, it is important to estimate the quantum by which the bias would influence the summary effect size. One way is to conduct a modified Egger’s test estimation by using a modification suggested by Pustejovsky and Rodgers. [4]
If the modified summary effect size is not grossly affected, we can ignore the bias and continue with the meta-analysis. However, any gross difference needs to be explored further. A very popular method is the Duval & Tweedie trim and fill method, which imputes missing articles and restores funnel symmetry. [7] (Figure 2) Another method is to remove the outliers and reanalyze for funnel symmetry. (Supplementary Figure 2 b)
Finally, the imputed effect size needs to be analysed in place of the original analysis.
2.2. Which statistical model was used?
The first step in conducting a meta-analysis is identifying the model that needs to be chosen to conduct the meta-analysis. There are three models to choose from – the random effects model, the fixed effect model, and the fixed effects model. [8] Of the three, the first two are used most often. A reviewer needs to focus on how the study population included for the meta-analysis was chosen.
- Random effects model: The term “effects” is used as a plural because the search for citations is assumed to be conducted from an infinite possibility of studies. Since the selection of the final citations is to be made from a random sample of studies, the term random is used. The summary or mean effect size reflects the observed effect size, and reviewers need to identify how much it differs from the true effect size. This is a perfect scenario to assess the heterogeneity of the outcomes. This model also helps us decide whether a conclusion is generalizable to a larger population. In other words, if the inference from the included studies can be extrapolated to a wider population. [9]
- Fixed effect model: The term “effect” is used as a singular since it is assumed that the included citations reflect a common pool of population from which the different samples are drawn. In other words, all the articles selected for analysis are identical in all possible ways. The mean or summary effect size is the true effect size and not the observed one as in the random effects model. Hence, it is inappropriate to assess the heterogeneity of outcomes using the fixed effect model. Hence, the inference is specific to the population included for analysis and cannot be extrapolated to a wider population. [9]
2.3. How was the confidence interval of the mean effect size assessed?
The confidence interval, also called the precision interval, assesses the precision with which the summary effect was assessed. It is frequently confused with the effect size distribution reflecting heterogeneity. One of the common assumptions when reporting a confidence interval (95% CI) is that the standard deviation of the effect size in the population being analysed is known. In such a scenario, the Z-statistic is used to compute the CI. This is usually a standard strategy when a fixed effect model is used. However, we rarely have knowledge about the standard deviation in the background population, as is usually the case when a random effects model analysis is being performed. Under such circumstances, the t-statistic is used to compute the CI. The latter strategy modifies the standard error around the mean, resulting in a more conservative (wider) CI, and is dependent on the number of included studies. If more than 30 studies are included in an analysis, the difference between the two strategies is not significant. However, for fewer than 30 studies, the CI should be computed with a t-distribution, also called the Knapp and Hartung adjustment. [10]
Example 2: A fictitious example with six studies is presented to better understand the problem. Comprehensive Meta-Analysis Version 4 software was used for analysis. Figure 3 (a) shows the standard presentation where the variance and statistic used for computation of the CI are camouflaged. In fgure 3 (b), we provide an expanded presentation of the method used to assess the CI. However, as a practical approach, we need not ask the authors about the method used to compute the CI. Any analysis with fewer than 30 included studies should be assessed with the Knapp and Hartung adjustment.
The data shown in Figure 4 suggest that while the summary effect size remained the same, the CI widened from 0.76-0.98 to 0.68-1.04, altering the inference significantly.
2.4. Assessment of the heterogeneity of the effect size
A vast majority of meta-analyses report the existence of heterogeneity of studies using the I2 statistic. Most of the statements in manuscripts classify heterogeneity as insignificant (<25%), moderate (50%-75%), or severe (>75%) based on the I2 statistic or based on the Q statistic and the degrees of freedom. The I2 statistic indicates how much of the heterogeneity is explained by the variance in the true effect size, and is not a measure of heterogeneity per se. [2] Detection of heterogeneity is accomplished by assessment of the prediction interval, which is a measure of the dispersion of the true effect size. [10]
Example 3: A meta-analysis of six studies with the hazard ratio (HR) as the effect size measure is reported in Figure 5. Figure 5 (a) shows the standard reporting technique, while Figure 5 (b) includes the prediction interval.
The presentation of meta-analyses most frequently encountered in medical literature corresponds to the forest plot in Figure 1 a. The reviewer would be misled by the statement that an I2 statistic value of 21% represents a low heterogeneity, and hence would ignore the influence of any covariate on the summary outcome. However, the prediction interval ranging between 0.66 and 1.13 indicates the dispersion of the true effect size. This data indicates that there are 13% patients in whom the intervention could be harmful or worse than placebo.
The I2 statistic gives a measure of the true variance proportional to the total variance. [10] Hence, an I2 of 21% would suggest that sampling error could explain 79% of the observed variance, while the remaining 21% could explain the variance in the true effect size.
Another mistake is to refer to the p value for the test statistic (Q) as a marker of effect size variation. When many studies are included in the analysis, the p value may be significant despite minimal heterogeneity, and conversely, with a small number of studies, the p value may be nonsignificant in the presence of substantial heterogeneity. The Q statistic is an indicator of the amount of heterogeneity, not its dispersion. A Q statistic value greater than the degrees of freedom (df) indicates positive variance, while a value less than the df indicates zero variance.
2.5. The null hypothesis versus effect size estimation
One of the common mistakes in data reporting is the use of null hypothesis testing (p value) to report the quantum of effect size estimate. The two indices answer two different questions and should not be confused as a common entity. [10]
The P value or the null hypothesis is used to answer questions in the form of a binary. For example, if the question is “Does drug A perform better than placebo in reducing blood pressure?” Since the answer will be in the form of yes or no, formal null hypothesis testing is most appropriate. As a tradition, a p value of <0.05 would rule out the null hypothesis, resulting in the inference that drug A is indeed superior to the placebo in reducing blood pressure. Such a strategy of questioning is frequently employed by drug approval agencies.
In contrast, the effect size estimate tells us about the clinical utility of the intervention, with the confidence interval indicating the precision with which the estimate has been made. While estimating the quantum of benefits associated with a particular intervention, if we employ the null hypothesis, we will miss out on certain population and clinical characteristics where the intervention would be useful.
Example 4:
Analysing the forest plot from the null hypothesis angle would lead to dismissal of the result as insignificant. However, from the effect size perspective, approximately 11% of the population would benefit from the intervention, and this should become the basis of future analysis. (Figure 6) Since the p value focuses on the mean, the dispersion of the effect size is completely ignored.
3.0. Discussion
Systematic reviews and meta-analyses are featured in the tiers of the evidence-based pyramid. [11] In view of such a high degree of importance ascribed to meta-analyses, it is imperative that we standardize the way a meta-analysis is analysed and reported. The process of validating a meta-analysis starts with peer review. Hence, the common errors and means of addressing them must be clearly laid out for the reviewers. Although most journals provide the option to refer to a statistician, this option is rarely utilized. As a result, a plethora of manuscripts are published with reporting errors. [12] The most common mistakes encountered are related to the model used to conduct the meta-analysis and detect heterogeneity. In this review, we clarify that the model selected depends upon the homogeneity of the backdrop population as well as the intervention. While selecting from a defined pool of studies with similar background characteristics, the aim of the analysis is to detect the true effect size in the population. As a result, a fixed effect model would be appropriate. However, in most of the analyses, a web search is conducted, which is a random process resulting in pooling of studies with varied background characteristics. Hence, a random effects model is most appropriate. As evident from this selection criterion, a fixed effect model is reflective of the background homogeneity and hence not suited for the detection of heterogeneity in the effect size. The ideal model to assess for effect size heterogeneity is the random effects model. As far as the assessment of heterogeneity is concerned, we highlight the common mistake of identifying I2 as a marker of heterogeneity. The I2 statistic is the ratio between the variance in the true effect size to that of the total variance and hence cannot be used as an absolute measure of heterogeneity. The prediction interval is the optimal method to detect heterogeneity and reviewers should encourage authors to include it in all forest plots presented.
Apart from these two very important and common mistakes, the most often ignored measure is screening for publication bias with the funnel plot. When an adequate number of studies (minimum 10) are included in a meta-analysis, the symmetry of the funnel plot must be reported with appropriate methods of assessment (Peter’s method for OR/RR and Egger’s for SMD). The detection of significant bias should be followed up with adequate readjustments in the effect size measurement. Finally, reporting of the summary effect size must be in tune with the question asked in the meta-analysis. If the question is in the form of a binary; the null hypothesis must be invoked and there should be no attempt to quantify the range of the effect size estimate. In contrast, if the question in the meta-analysis is about the effect size, a nonsignificant p value should not lead to discarding the result. Rather, a detailed analysis with the aim of identifying potential populations who could benefit, and a subsequent trial aimed at exploring those possibilities should be reported.
This review article focuses on a few important aspects of reviewing a meta-analysis without the need to refer to a statistician. The checklist for reviewers is summarized in Table 1.
4.0. Conclusion:
Summarizing data in the form of a meta-analysis has become very common. With the incorporation of such data into guidelines, it is important to review the analytical and reporting processes associated with publication of a meta-analysis. Since the reviewer is at the centre of assessment of a meta-analysis, this review was conducted to provide a few important checklists for reviewers to improve the reporting and quality of meta-analyses published in the future.
Author Contributions
SG conceptualised the manuscript, created the figures, and have written it.
Funding
No funding was received for this manuscript.
Ethics approval
It is a review article and hence ethics approval was not required.
Consent to participate
Not applicable.
Written Consent for publication
Not applicable.
Availability of data and material
All data generated or analysed during the present study are included in the article.
Code Availability
Not applicable.
Conflict of interest
None
References
- Linden AH, Hönekopp J. Heterogeneity of Research Results: A New Perspective from Which to Assess and Promote Progress in Psychological Science. Perspect Psychol Sci. 2021;16(2):358-376. https://www.ncbi.nlm.nih.gov/pmc/articles/PMC7961629/.
- Borenstein M. In a meta-analysis, the I-squared statistic does not tell us how much the effect size varies. Journal of Clinical Epidemiology 2022. [CrossRef]
- Ma, LL., Wang, YY., Yang, ZH. et al. Methodological quality (risk of bias) assessment tools for primary and secondary medical studies: what are they and which is better? Military Med Res 2020; 7:7. [CrossRef]
- Harrer M, Cuijpers P, Furukawa TA, Ebert DD. Doing Meta-analysis with R. A Hands-On Guide. First edition. CRC Press. 2022. https://bookdown.org/MathiasHarrer/Doing_Meta_Analysis_in_R/.
- Felson DT. Bias in meta-analytic research. J Clin Epidemiol. 1992;45(8):885-92. https://www.jclinepi.com/article/0895-4356(92)90072-U/pdf.
- Rücker G, Carpenter JR, Schwarzer G. Detecting and adjusting for small-study effects in meta-analysis. Biom J. 2011;53(2):351-68. https://onlinelibrary.wiley.com/doi/10.1002/bimj.201000151.
- Shi L, Lin L. The trim-and-fill method for publication bias: practical guidelines and recommendations based on a large database of meta-analyses. Medicine (Baltimore). 2019 ;98(23): e15987. https://www.ncbi.nlm.nih.gov/pmc/articles/PMC6571372/.
- Rothstein HR, Sutton AJ, Borenstein M. Publication bias in Meta-analysis. Prevention, Assessment, and adjustments. First edition. John Wiley & Sons Ltd. 2005. https://www.wiley.com/enus/Publication+Bias+in+Meta+Analysis%3A+Prevention%2C+Assessment+and+Adjustments-p-9780470870150.
- Borenstein M, Hedges LV, Higgins JPT, Rothstein HR. Introduction to Meta-analysis. Second edition. John Wiley & Sons Ltd. 2021. https://www.wiley.com/en-us/Introduction+to+Meta+Analysis%2C+2nd+Edition-p-9781119558392.
- Borenstein M. Common Mistakes in Meta-analysis and how to avoid them. First edition. Biostat, Inc. 2019.
- Murad MH, Asi N, Alsawas M, et al. New evidence pyramid BMJ Evidence-Based Medicine 2016;21:125-127. https://ebm.bmj.com/content/ebmed/21/4/125.full.pdf.
- Ezeala C, Nweke I, Ezeala M. Common errors in manuscripts submitted to medical science journals. Ann Med Health Sci Res. 2013 l;3(3):376-9. https://www.ncbi.nlm.nih.gov/pmc/articles/PMC3793443/.
Supplementary Figure 1.
Funnel plot to assess publication bias.
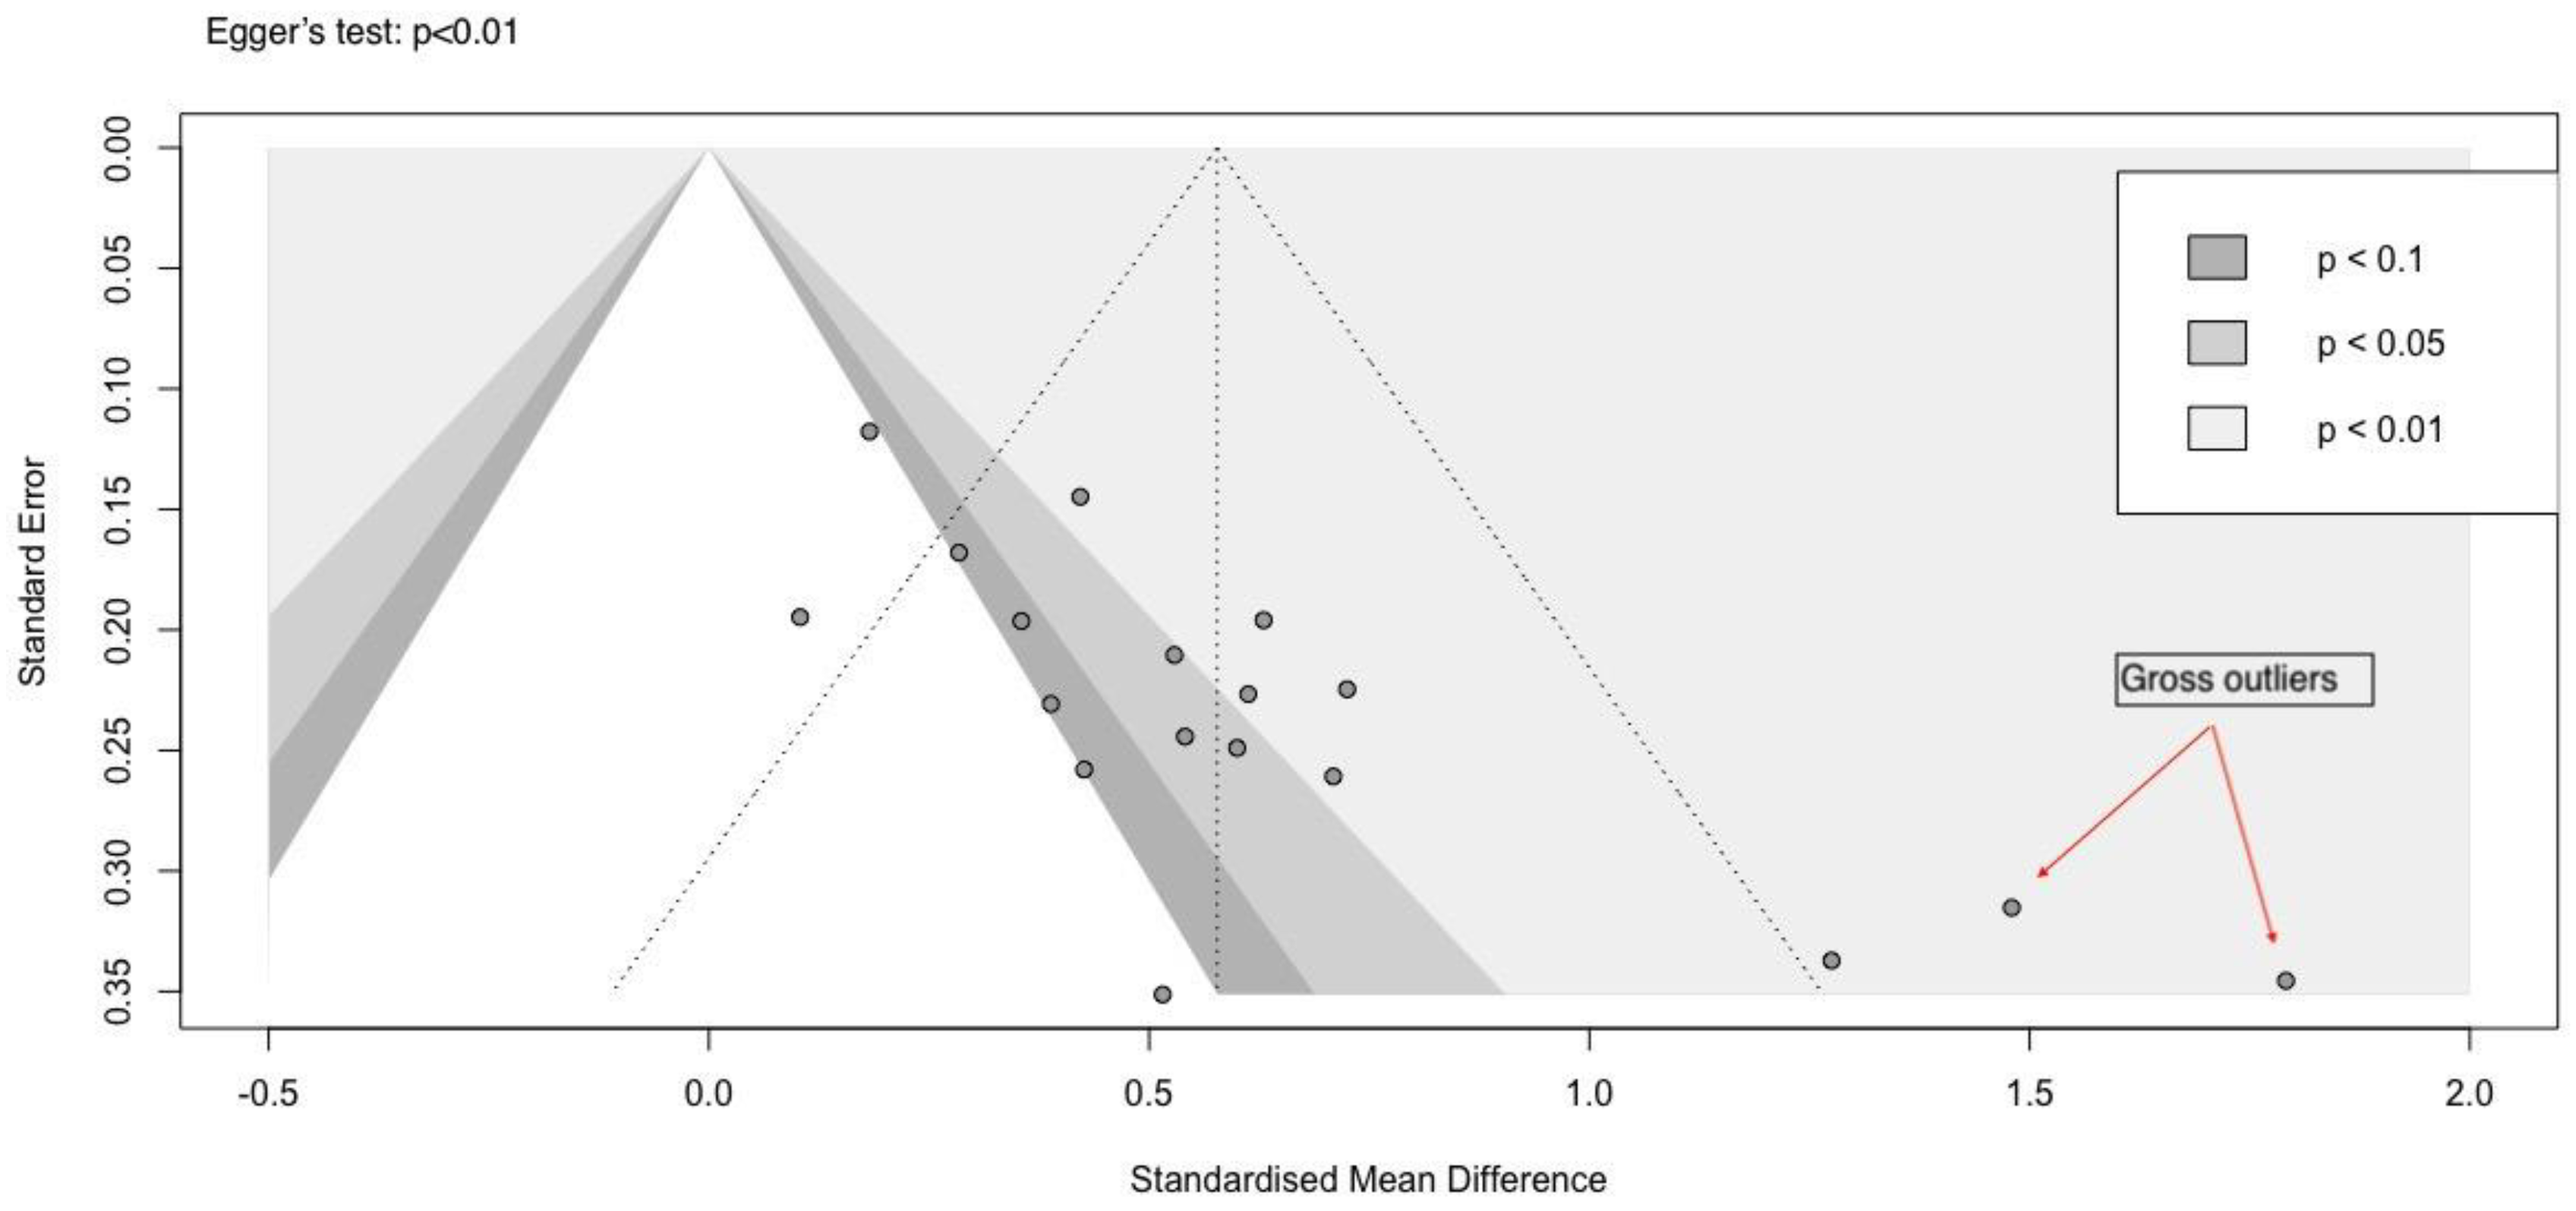
Figure 2.
The trim and fill method for bias-corrected effect size estimates (a). With data imputation, (b). With significant outliers removed. *Circles with no fill are the imputed studies.
Figure 2.
The trim and fill method for bias-corrected effect size estimates (a). With data imputation, (b). With significant outliers removed. *Circles with no fill are the imputed studies.
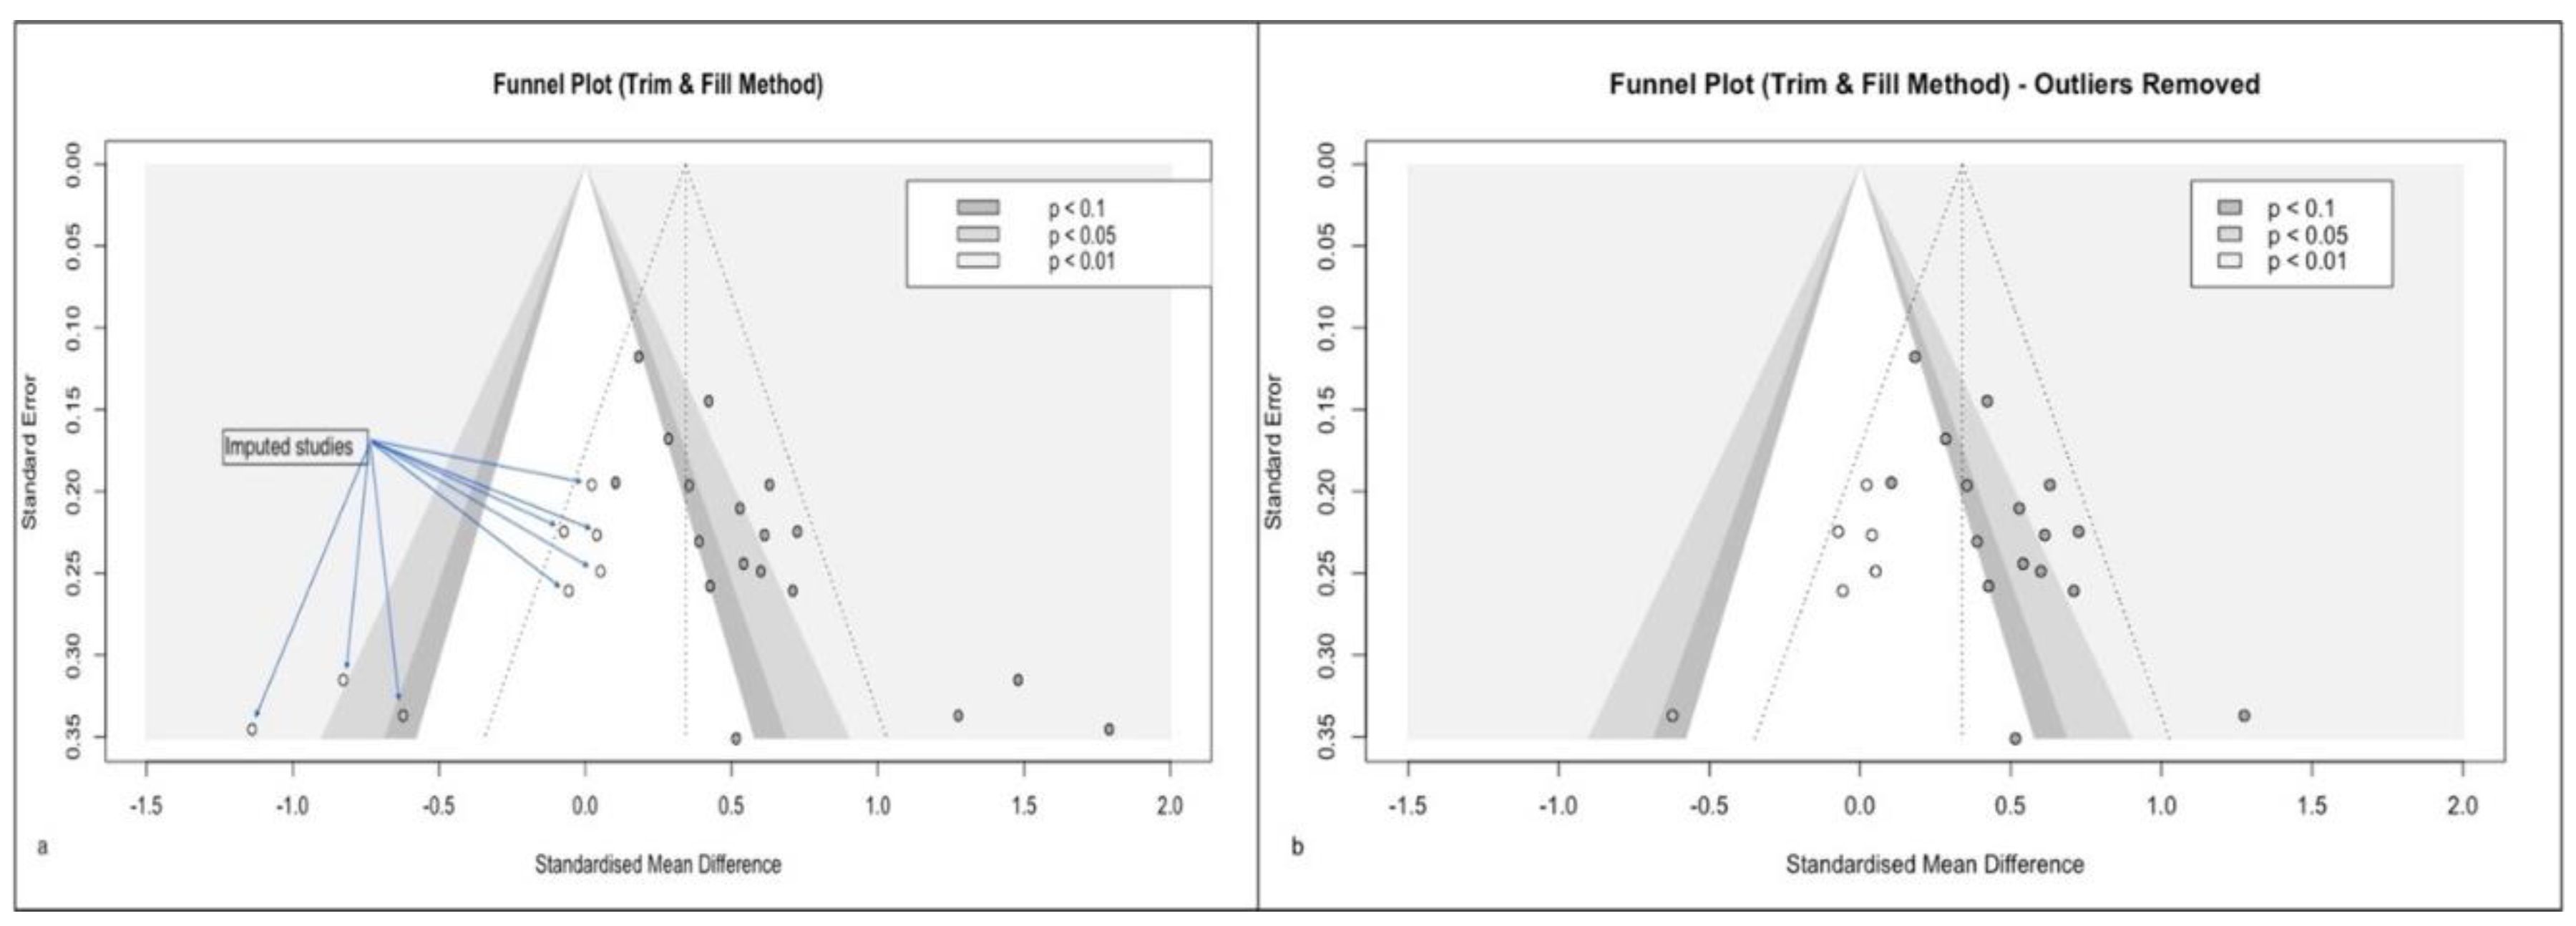
Figure 3.
Meta-analysis comparing an Rx versus placebo on outcome “X”: (a). Standard presentation, (b). Expanded presentation.
Figure 3.
Meta-analysis comparing an Rx versus placebo on outcome “X”: (a). Standard presentation, (b). Expanded presentation.
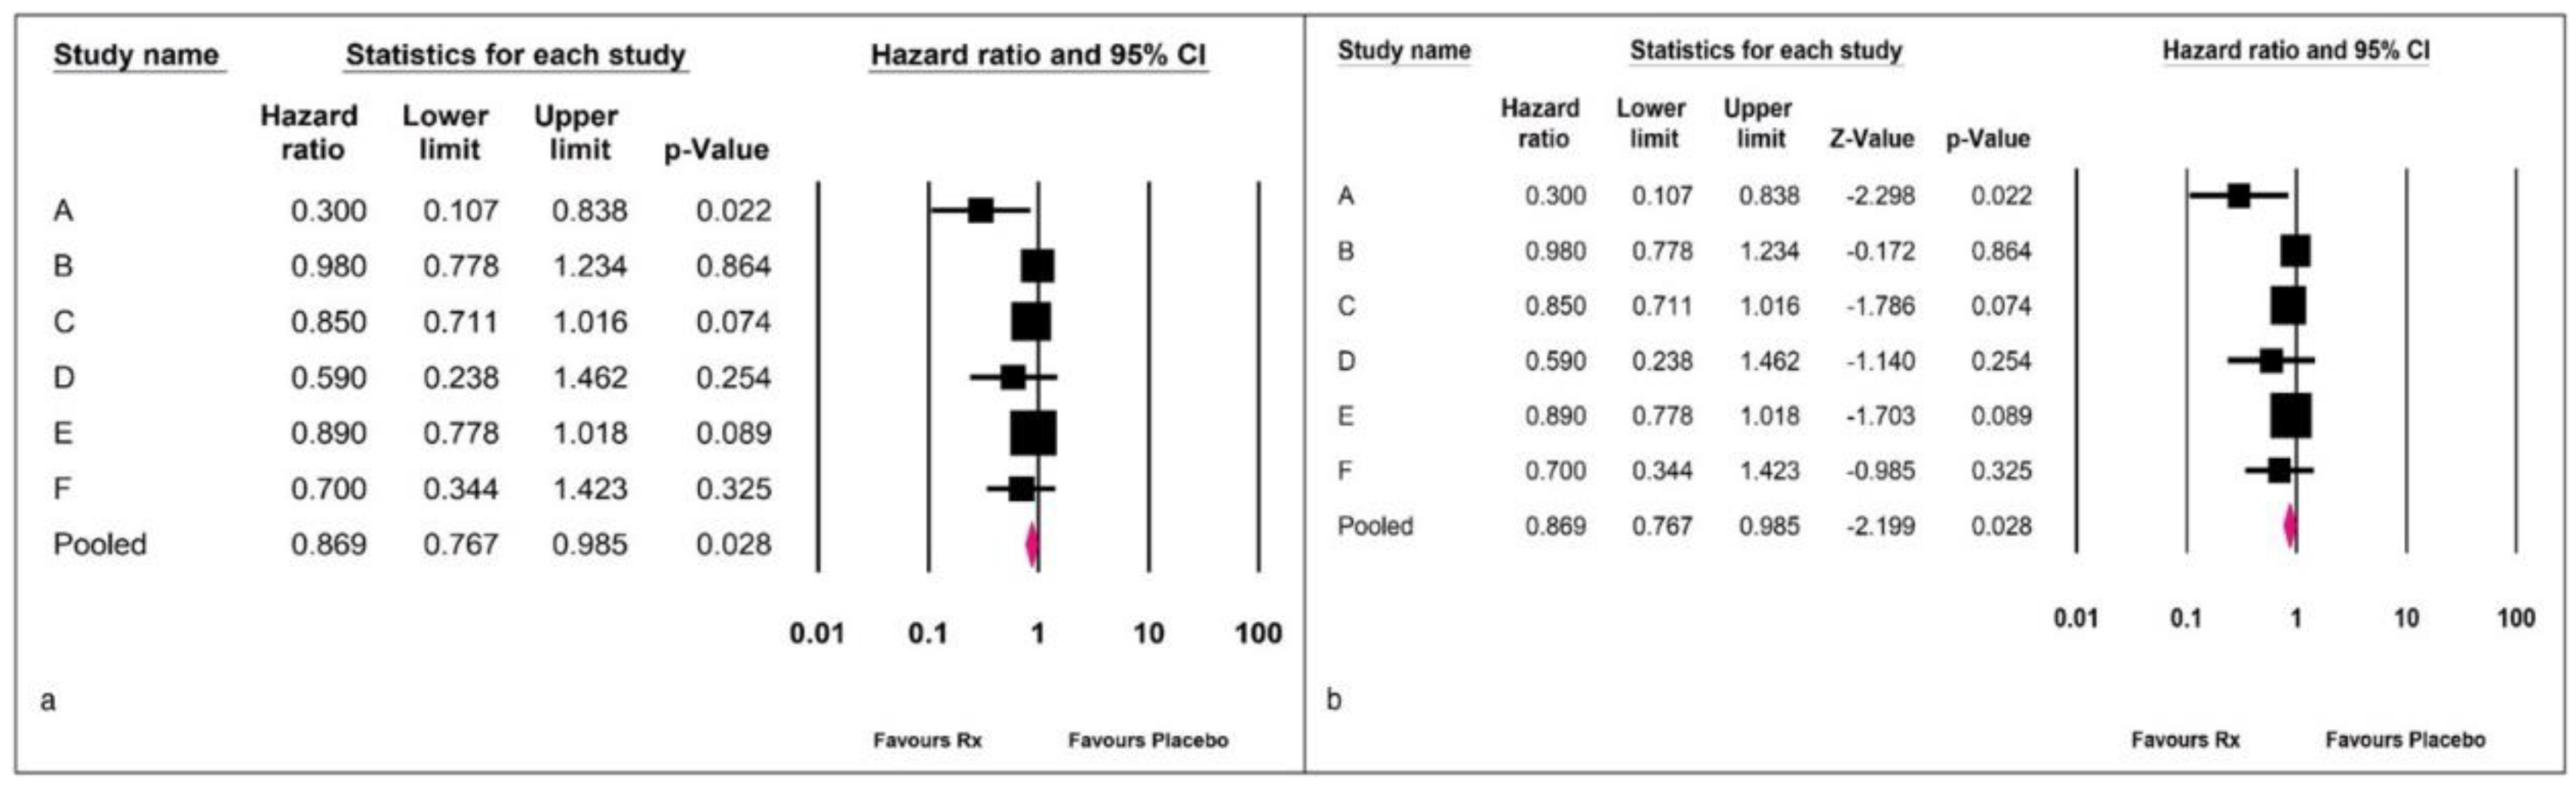
Figure 4.
The Knapp and Hartung adjustment.
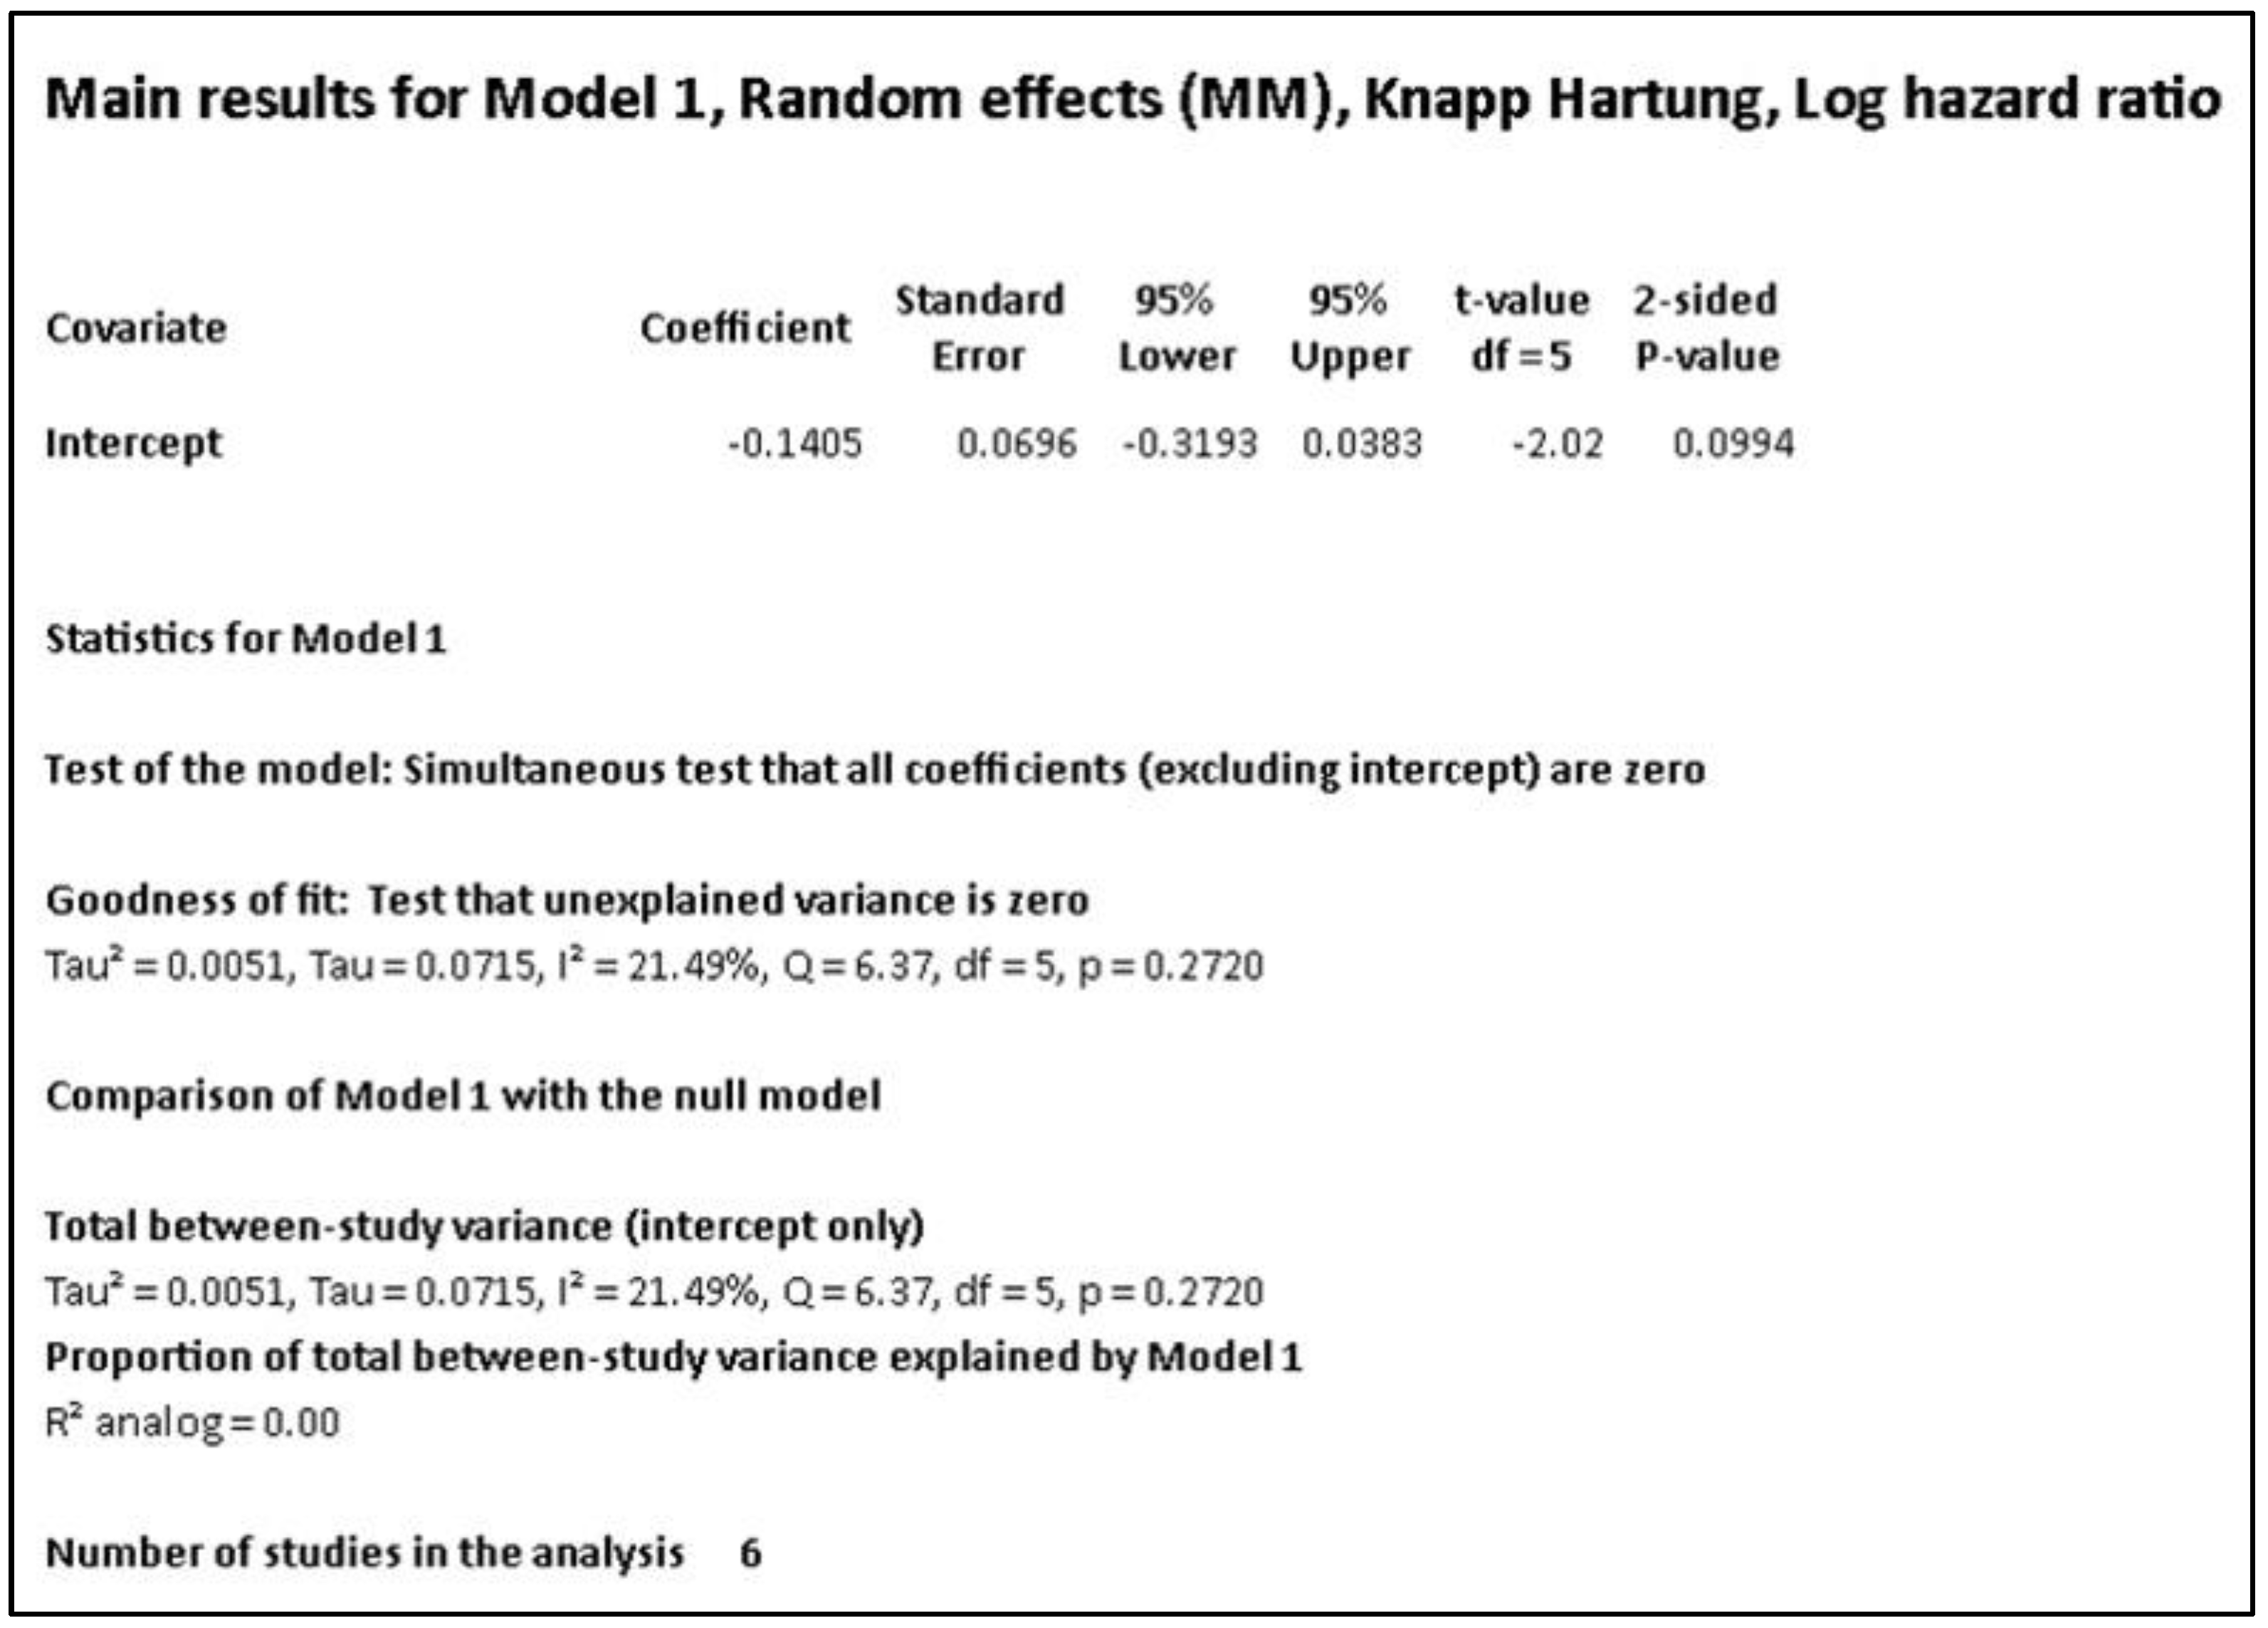
Figure 5.
Detection of heterogeneity (a). Standard display: prediction interval not presented, (b). with prediction interval.
Figure 5.
Detection of heterogeneity (a). Standard display: prediction interval not presented, (b). with prediction interval.
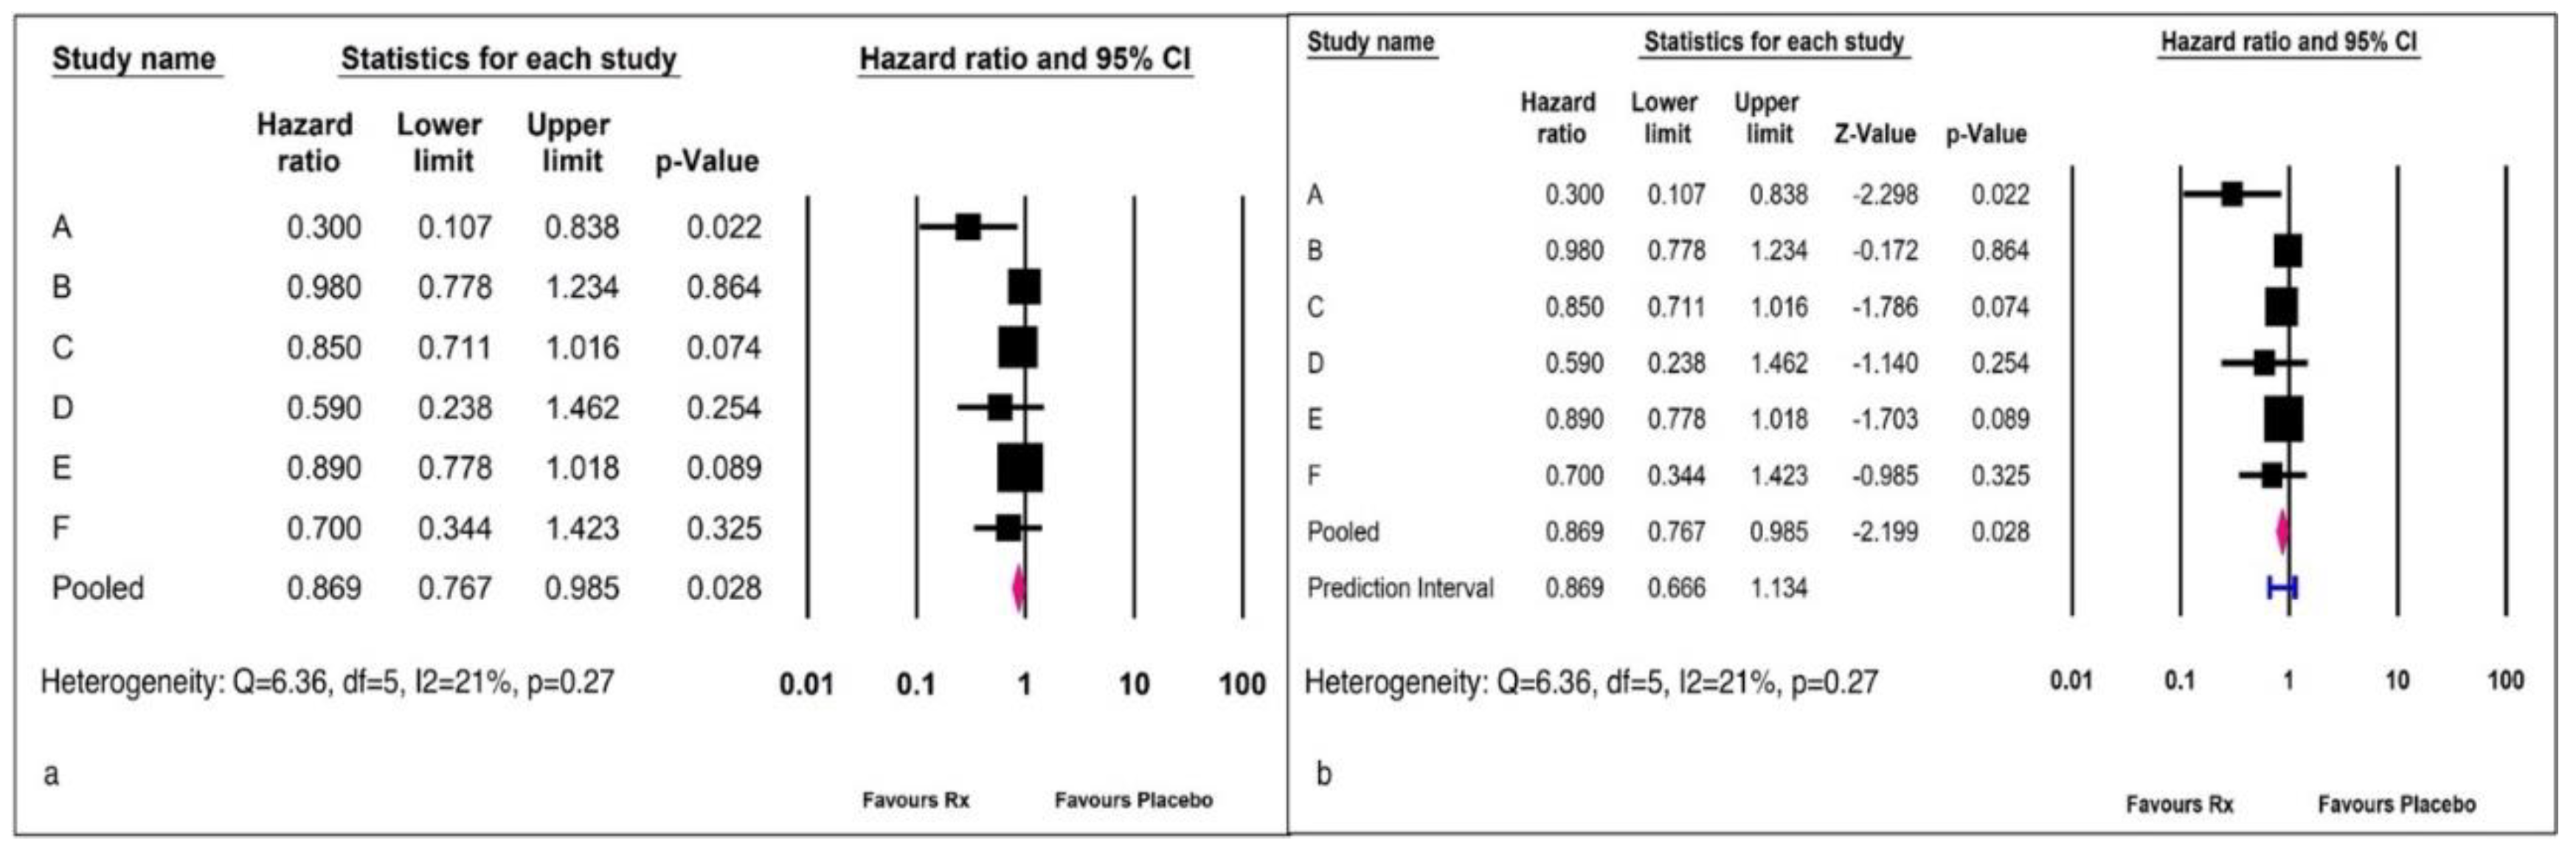
Figure 6.
Forest plot: The effect of an Rx versus placebo on outcome “Y”.
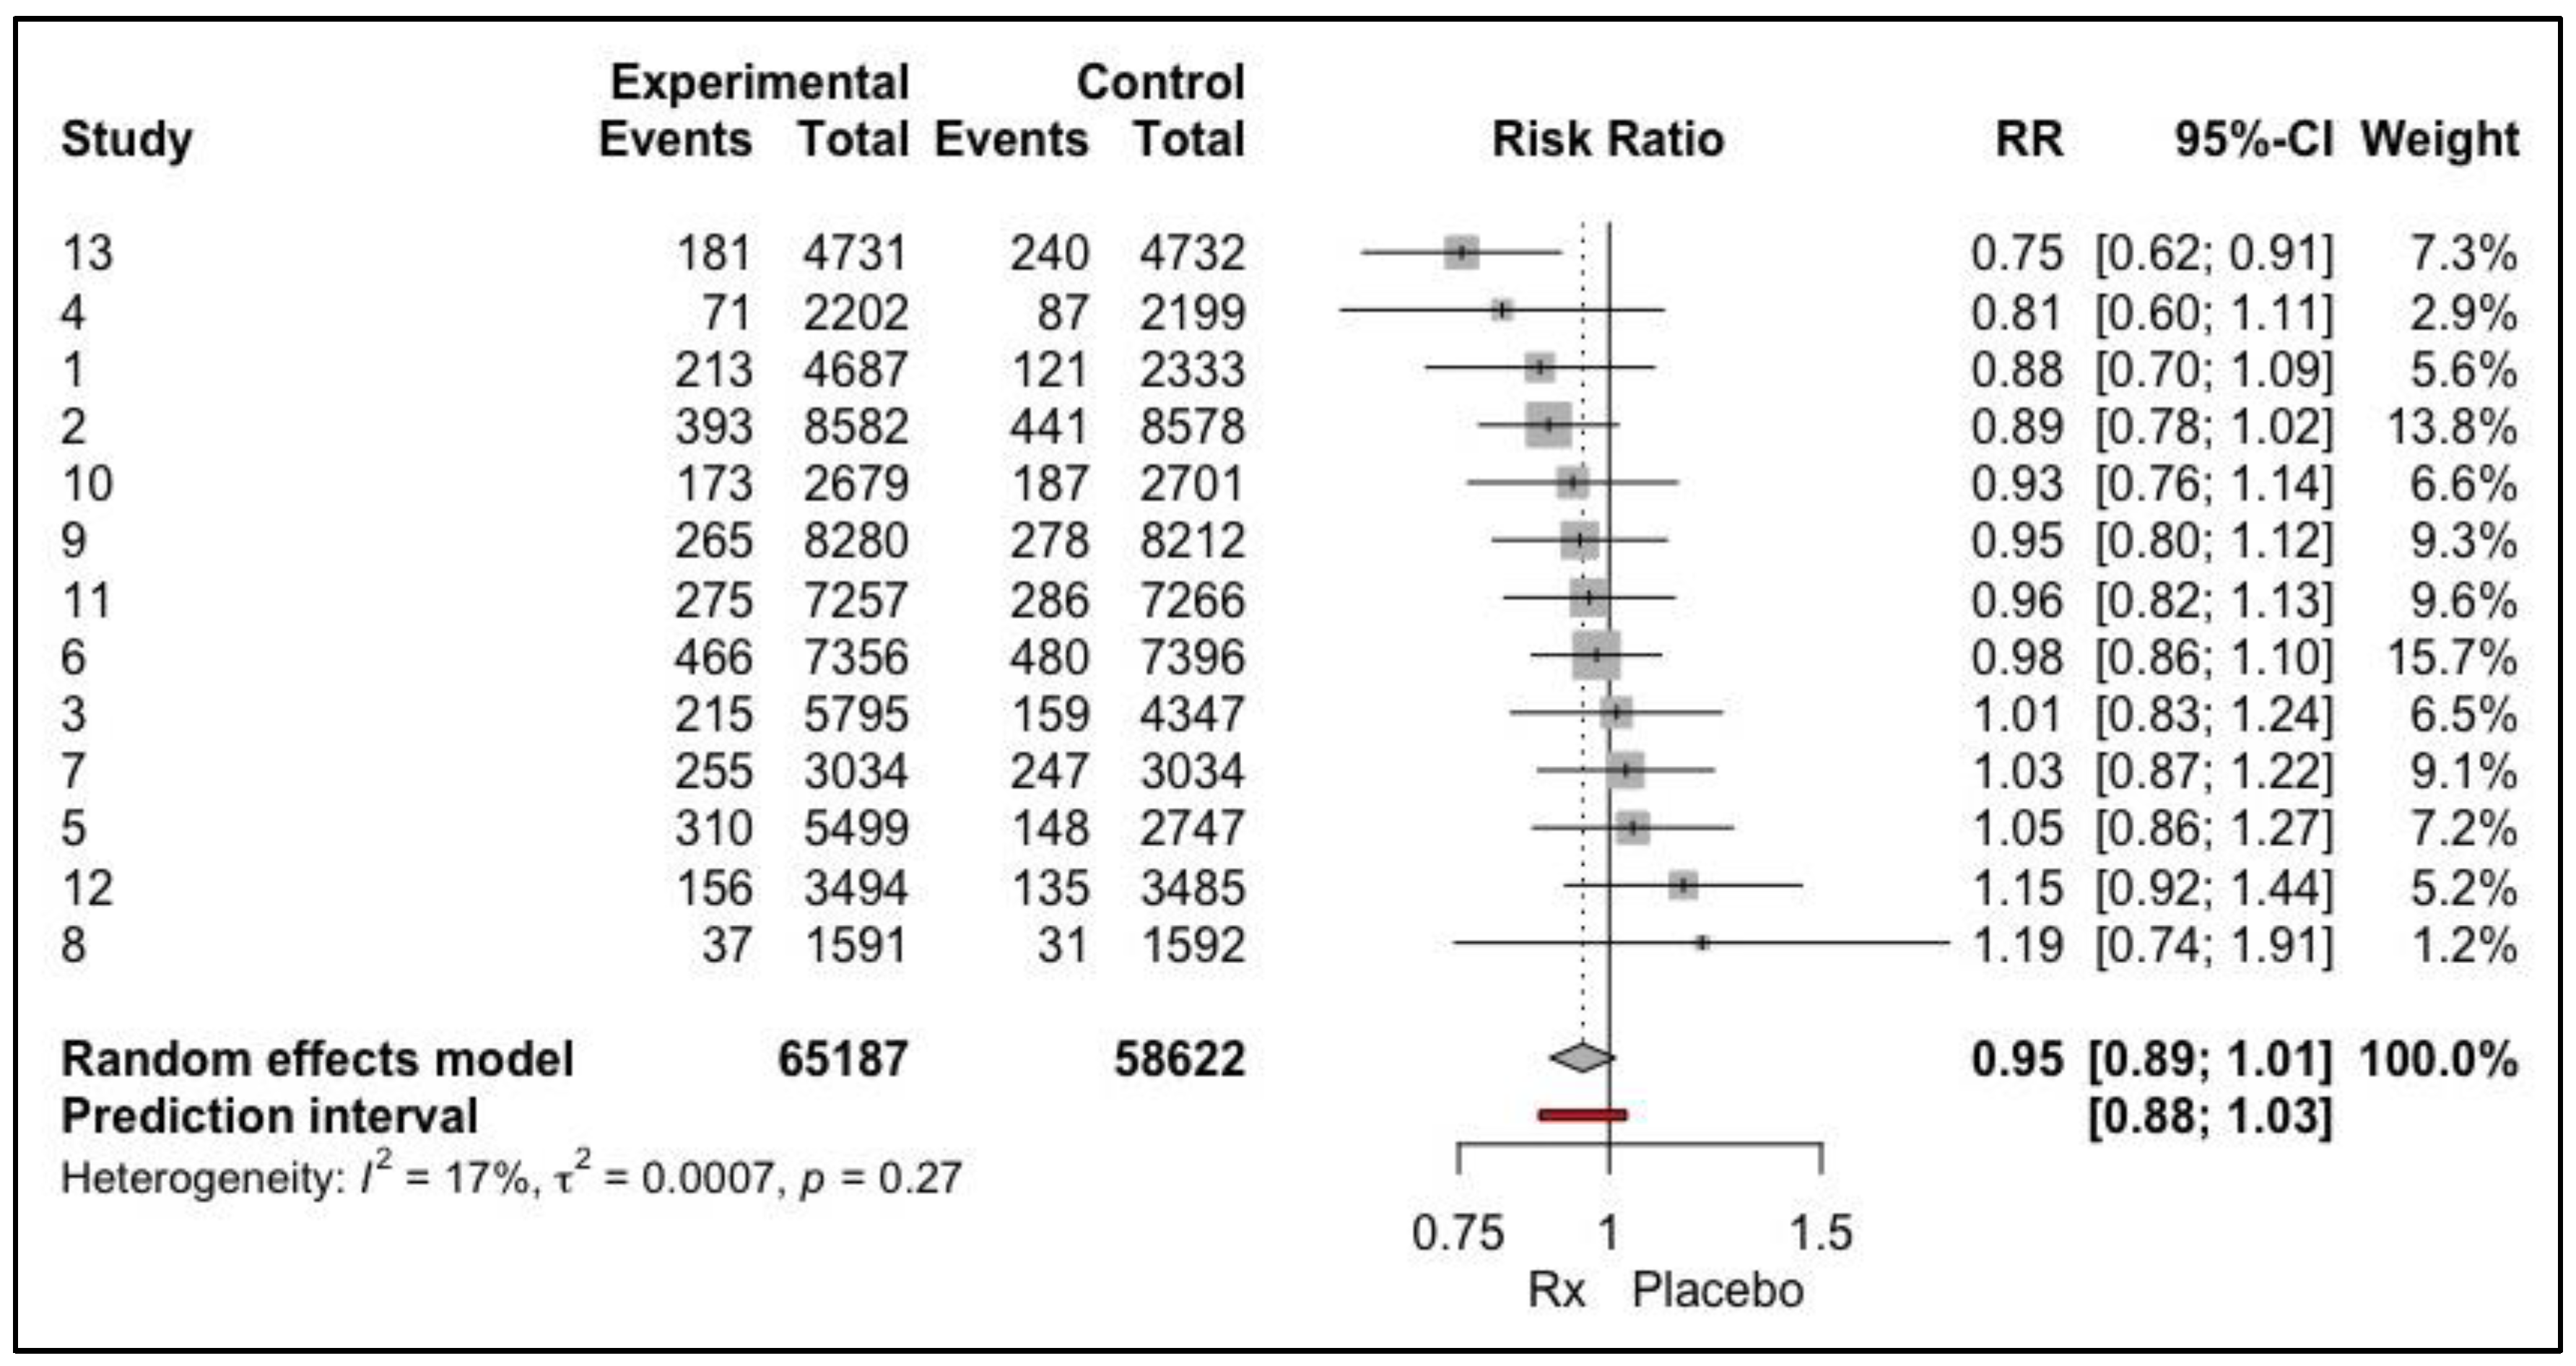

Table 1.
Summary of checklists for reviewers to improve the analysis and reporting of a meta-analysis.
Table 1.
Summary of checklists for reviewers to improve the analysis and reporting of a meta-analysis.
| Attributes | Checklist |
| Risk of bias | Checklist number 1:While reporting risk of bias associated with pooling randomized trials, the 5-point domain should be used with the Cochrane risk-of-bias algorithm. The 7-point domain should be used in the case of nonrandomized trials. |
| Publication bias | Checklist number 2:Check for funnel plot symmetry. At least ten studies are required to assess significance of publication bias. For mean difference or SMD, Egger’s or Begg & Thomson’s tests are preferrable, while in the case of binary data (odds ratio or risk ratio) Peter’s or Harbourd’s tests are preferred. On detection of significant bias, request an imputed analysis using the trim and fill method. |
| Model used in the meta-analysis | Checklist number 3:When a web search is conducted to identify the articles for analysis, a random effects model should be used with the aim of assessing the heterogeneity of the mean effect size. In addition, look for differences in the background population included for analysis as well as differences in the dose and route of application of the medications. Generally, discourage use of both fixed effect and random effects models, as they represent different outcome implications. |
| Assessment of the confidence interval | Checklist number 4:If the number of studies is less than 30, ask for a Knapp and Hartung adjustment of the CI. For meta-analysis with more than 30 studies, the Z-distribution can be used. |
| Determination of heterogeneity | Checklist number 5:Request authors to furnish the prediction interval along with the effect size confidence interval in all forest plots. The prediction interval and not the I2 statistic should be used to define the heterogeneity of the effect size. Classifying the heterogeneity as mild, moderate, and severe based on the I2 statistic should be discouraged. The Q statistic value and its p value of significance should not be reported as indicators of the amount of heterogeneity. |
| Binary question or effect size estimate? | Checklist number 6:What is the question asked in the analysis? If an effect size estimate is the prime objective, both the precision of the estimate as well as its dispersion should be the focus of analysis, not the p value. If it is in the form of a binary question, null hypothesis testing should be reported. |
Disclaimer/Publisher’s Note: The statements, opinions and data contained in all publications are solely those of the individual author(s) and contributor(s) and not of MDPI and/or the editor(s). MDPI and/or the editor(s) disclaim responsibility for any injury to people or property resulting from any ideas, methods, instructions or products referred to in the content. |
© 2023 by the authors. Licensee MDPI, Basel, Switzerland. This article is an open access article distributed under the terms and conditions of the Creative Commons Attribution (CC BY) license (http://creativecommons.org/licenses/by/4.0/).
Copyright: This open access article is published under a Creative Commons CC BY 4.0 license, which permit the free download, distribution, and reuse, provided that the author and preprint are cited in any reuse.


