Preprint
Article

Metal Pollution Influences Habitat Preference in Three Endogeic Earthworms

Altmetrics

Downloads

121

Views

32

Comments

0

A peer-reviewed article of this preprint also exists.

This version is not peer-reviewed

Submitted:

19 May 2023

Posted:

22 May 2023

You are already at the latest version

Alerts
Abstract
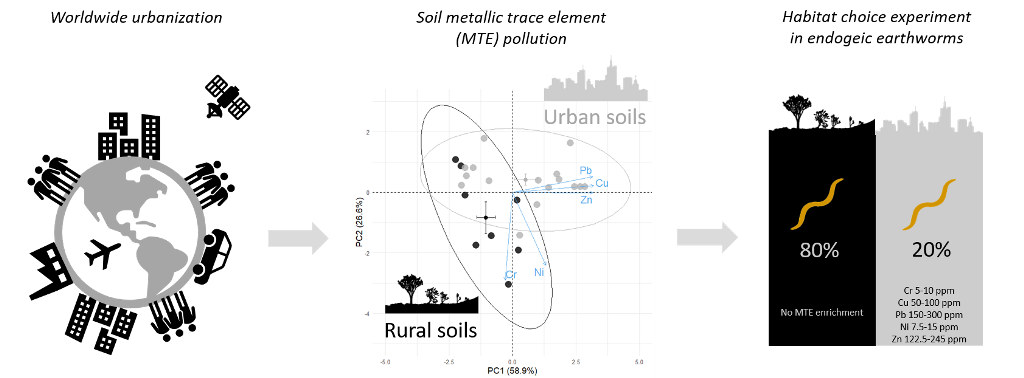
In response to long-lasting high levels of Metallic Trace Elements (MTEs) in urban soils, we expect soil invertebrates inhabiting urban environments to have evolved detection and avoidance and/or tolerance mechanisms to MTE pollution. In this study, I used artificial soils with concentrations of lead, zinc, copper, chromium and nickel that reflect pollution levels in soils of Parisian parks. Using choice experiments, I compared habitat preference (i.e. the occurrence of individuals in the polluted vs. unpolluted soil) and health status (i.e. body mass maintenance, mobility, mortality) between three species of endogeic earthworms – Apporectodea caliginosa, Apporectodea icterica and Allolobophora chlorotica – originating either from urban or rural grasslands. This study highlights a clear avoidance of MTE polluted soils in all three species, as well as MTE-induced health impairments, especially in A. chlorotica. Interestingly, earthworm response to MTE exposure only slightly differed between earthworms from urban and rural origin, suggesting the absence of widespread acclimatization or adaptation mechanisms to MTE pollution in cities. As a consequence, MTE pollution is expected to significantly shape earthworm spatial distribution in both urban and rural environments and, as a consequence, affect ecosystem functioning.
Keywords: 
Subject: Biology and Life Sciences  -   Ecology, Evolution, Behavior and Systematics

1. Introduction

Metallic trace elements (MTEs) are particularly abundant in urban soils; lead, copper, zinc, chromium, nickel, cadmium, mercury and arsenic are the main MTE pollutants in urban soils [1,2]. For instance, lead concentrations can be fourteen times higher in urban than in rural soils [3]. For these reasons, soil organisms are likely to be affected by MTE pollution in urban soils. Yet, soil invertebrates fulfil numerous soil-based ecosystem services such as organic matter decomposition, regulation of microbial activity, soil structure, etc. [4,5]. Amongst others, earthworms are of primary importance for ecosystem functioning by modifying the availability of resources for other organisms through physical and chemical changes in their surrounding soil environment [6]. Therefore, understanding how soil invertebrate populations respond to MTE pollution in urban soils is key to comprehend variations in soil ecosystem functioning in an increasingly urbanized world.
Both experimental and correlative studies at industrially and geologically MTE-contaminated sites demonstrated profound effects of soil MTE pollution on soil invertebrates. For instance, MTE soil pollution is associated with reduced density, biomass, diversity index and richness of soil invertebrates, including earthworms, close to smelters or mining sites [7,8,9,10]. Earthworms were virtually absent in a 2 km radius around the smelter in Avonmouth (England), likely as a result of soil zinc pollution [11,12]. Moreover, experimental studies on Eisenia fetida and Eisenia Andrei demonstrated negative effects of copper, cadmium, chromium, lead, nickel and zinc exposure on either survival, body mass maintenance, cocoon production and viability, growth or sexual development [11,12,13,14,15,16]. However, MTE concentrations at industrial sites are usually extremely high sites (e.g. 28000 ppm lead [17], 2500 ppm copper [18], 19000 ppm zinc [9]. Similarly, MTE concentrations used in experimental studies often exceed the mean concentrations measured in this study in Parisian gardens [11]. Maybe more importantly, toxicity assessments are based on the exposure to a single MTE and do not account for synergetic, antagonistic or additive effects between MTEs [19]. Therefore, while MTE pollution may contribute to the lower species richness and the altered community composition of invertebrates in cities relative to less disturbed habitats [20,21], the effects of soil MTE pollution in urban environments on soil invertebrates has not been directly tested so far.
Soil MTE pollution may affect soil invertebrate spatial distribution by influencing habitat preference/avoidance [22,23]. Avoidance behavior toward MTE polluted habitats varies between species of invertebrates [24]. For instance, several species of earthworms were shown to avoid copper and zinc enriched soils, although the concentration threshold determining departure was species-specific (Lukkari and Haimi 2005; Lukkari et al. 2005); interestingly, the threshold concentration for avoidance of arsenic contaminated soil was lower in individuals originating from uncontaminated soil, suggesting either acclimatization or adaptation mechanisms [27]. The evolution of avoidance behavior, which implies the capacity to detect MTEs and to move away, depends on the cost of exploration and/or of disperal [28]. In fragmented landscapes, such as urban environments [29], the energy expenditure and mortality risk associated with dispersal can be particularly high [28,30]. Populations may then evolve alternative strategies to overcome the adverse influence of otherwise toxic MTE concentrations, which strategies involve the absorption, immobilization and/or excretion of MTEs. The evolution of MTE tolerant genotypes is well known in vascular plants [31,32]. In invertebrates, MTE exposure, although not in a context of urbanization, is associated with genetic and phenotypic variations (reviewed in Posthuma and Van Straalen 1993; Morgan et al. 2007; Janssens et al. 2009). For instance, wild populations of common fruit fly Drosophila melanogaster that have been exposed to MTE pollution are endowed with a duplicated gene coding for metallothionein (Mtn), a protein involved in the binding, transport and detoxification of MTEs; this confers individuals a better tolerance to copper and cadmium exposure [36]. In the earthworm Dendrobaena octaedra, offspring had a higher survival rate when exposed to elevated cadmium concentrations if their parents originated from MTE polluted than from unpolluted forests [37]. Experimentally comparing populations exposed, in their natural environment, to different levels of MTE pollution is an interesting avenue to gain insight on the effects of urbanization on soil invertebrates and to identify adaptation and/or acclimatization mechanisms shaping spatial distribution in cities [38].
Using soils with MTE concentrations mimicking MTE pollution level in urban parks, I compared the effect of MTE soil pollution on habitat preference between three species of endogeic earthworms, namely Apporectodea caliginosa, Apporectodea icterica and Allolobophora chlorotica, originating either from urban or rural grasslands. The aim of this study was two-fold: to 1) understand whether soil MTE pollution explains earthworm movements and habitat selection and 2) test whether habitat preference depends on earthworm previous exposure to MTE-polluted soil. Earthworm response to soil MTE pollution was also characterized by measuring mortality, mobility, body mass maintenance and MTE accumulation.

2. Methods

2.1. Subjects and housing

Free-living adult earthworms from three endogeic species – Apporectodea caliginosa, Apporectodea icterica and Allolobophora chlorotica (green morph) – were collected from February to May 2016 in gardens, squares or grasslands at 16 urban sites in Paris, and 8 rural sites across France (based on land use; see Table A1). At each urban site, they were collected from three different locations less than 200 m apart. The rural and urban soils (0-30 cm deep) were similar in terms of physico-chemical characteristics other than MTEs (i.e. pH, CO3, TOC, OM, Norg, ρ, P205), except for the proportion of bigger particles (> 6.3 mm) being more abundant in rural than in urban sites (see Table A3). Earthworms were identified in the lab using morphological characteristics [39,40]. To reduce potential stress effects of capture on earthworm behavior, earthworms were kept in acclimatizing terrariums (12 cm x 10 cm x 8 cm) filled with suitable soil (i.e. grassland soil sampled from a brown earth at the Research Institute for Development (Bondy, France; 48°54’N, 2°29’E) hosting large earthworm populations); they were kept at a maximum density of 10 earthworms per terrarium, at 20°C during the day and night. Acclimatization lasted at least 3 weeks but varied between individuals depending on their capture and trial dates. Twice a month, acclimatizing terrariums were humidified and enriched with a cupped hand of homogenized horse dropping spread on the surface of the soil. At least a week before the start of the trial, earthworms were transferred in MTE-less control soil (see §2.2) enriched with homogenized horse dropping, in a similar way as acclimatizing terrariums. Each individual earthworm was used only once during the experiment. The species names used herein are conformed to the Fauna Europaea web site (http://www.faunaeur.org/index.php).

2.2. Terrarium set-up for behavioral trials

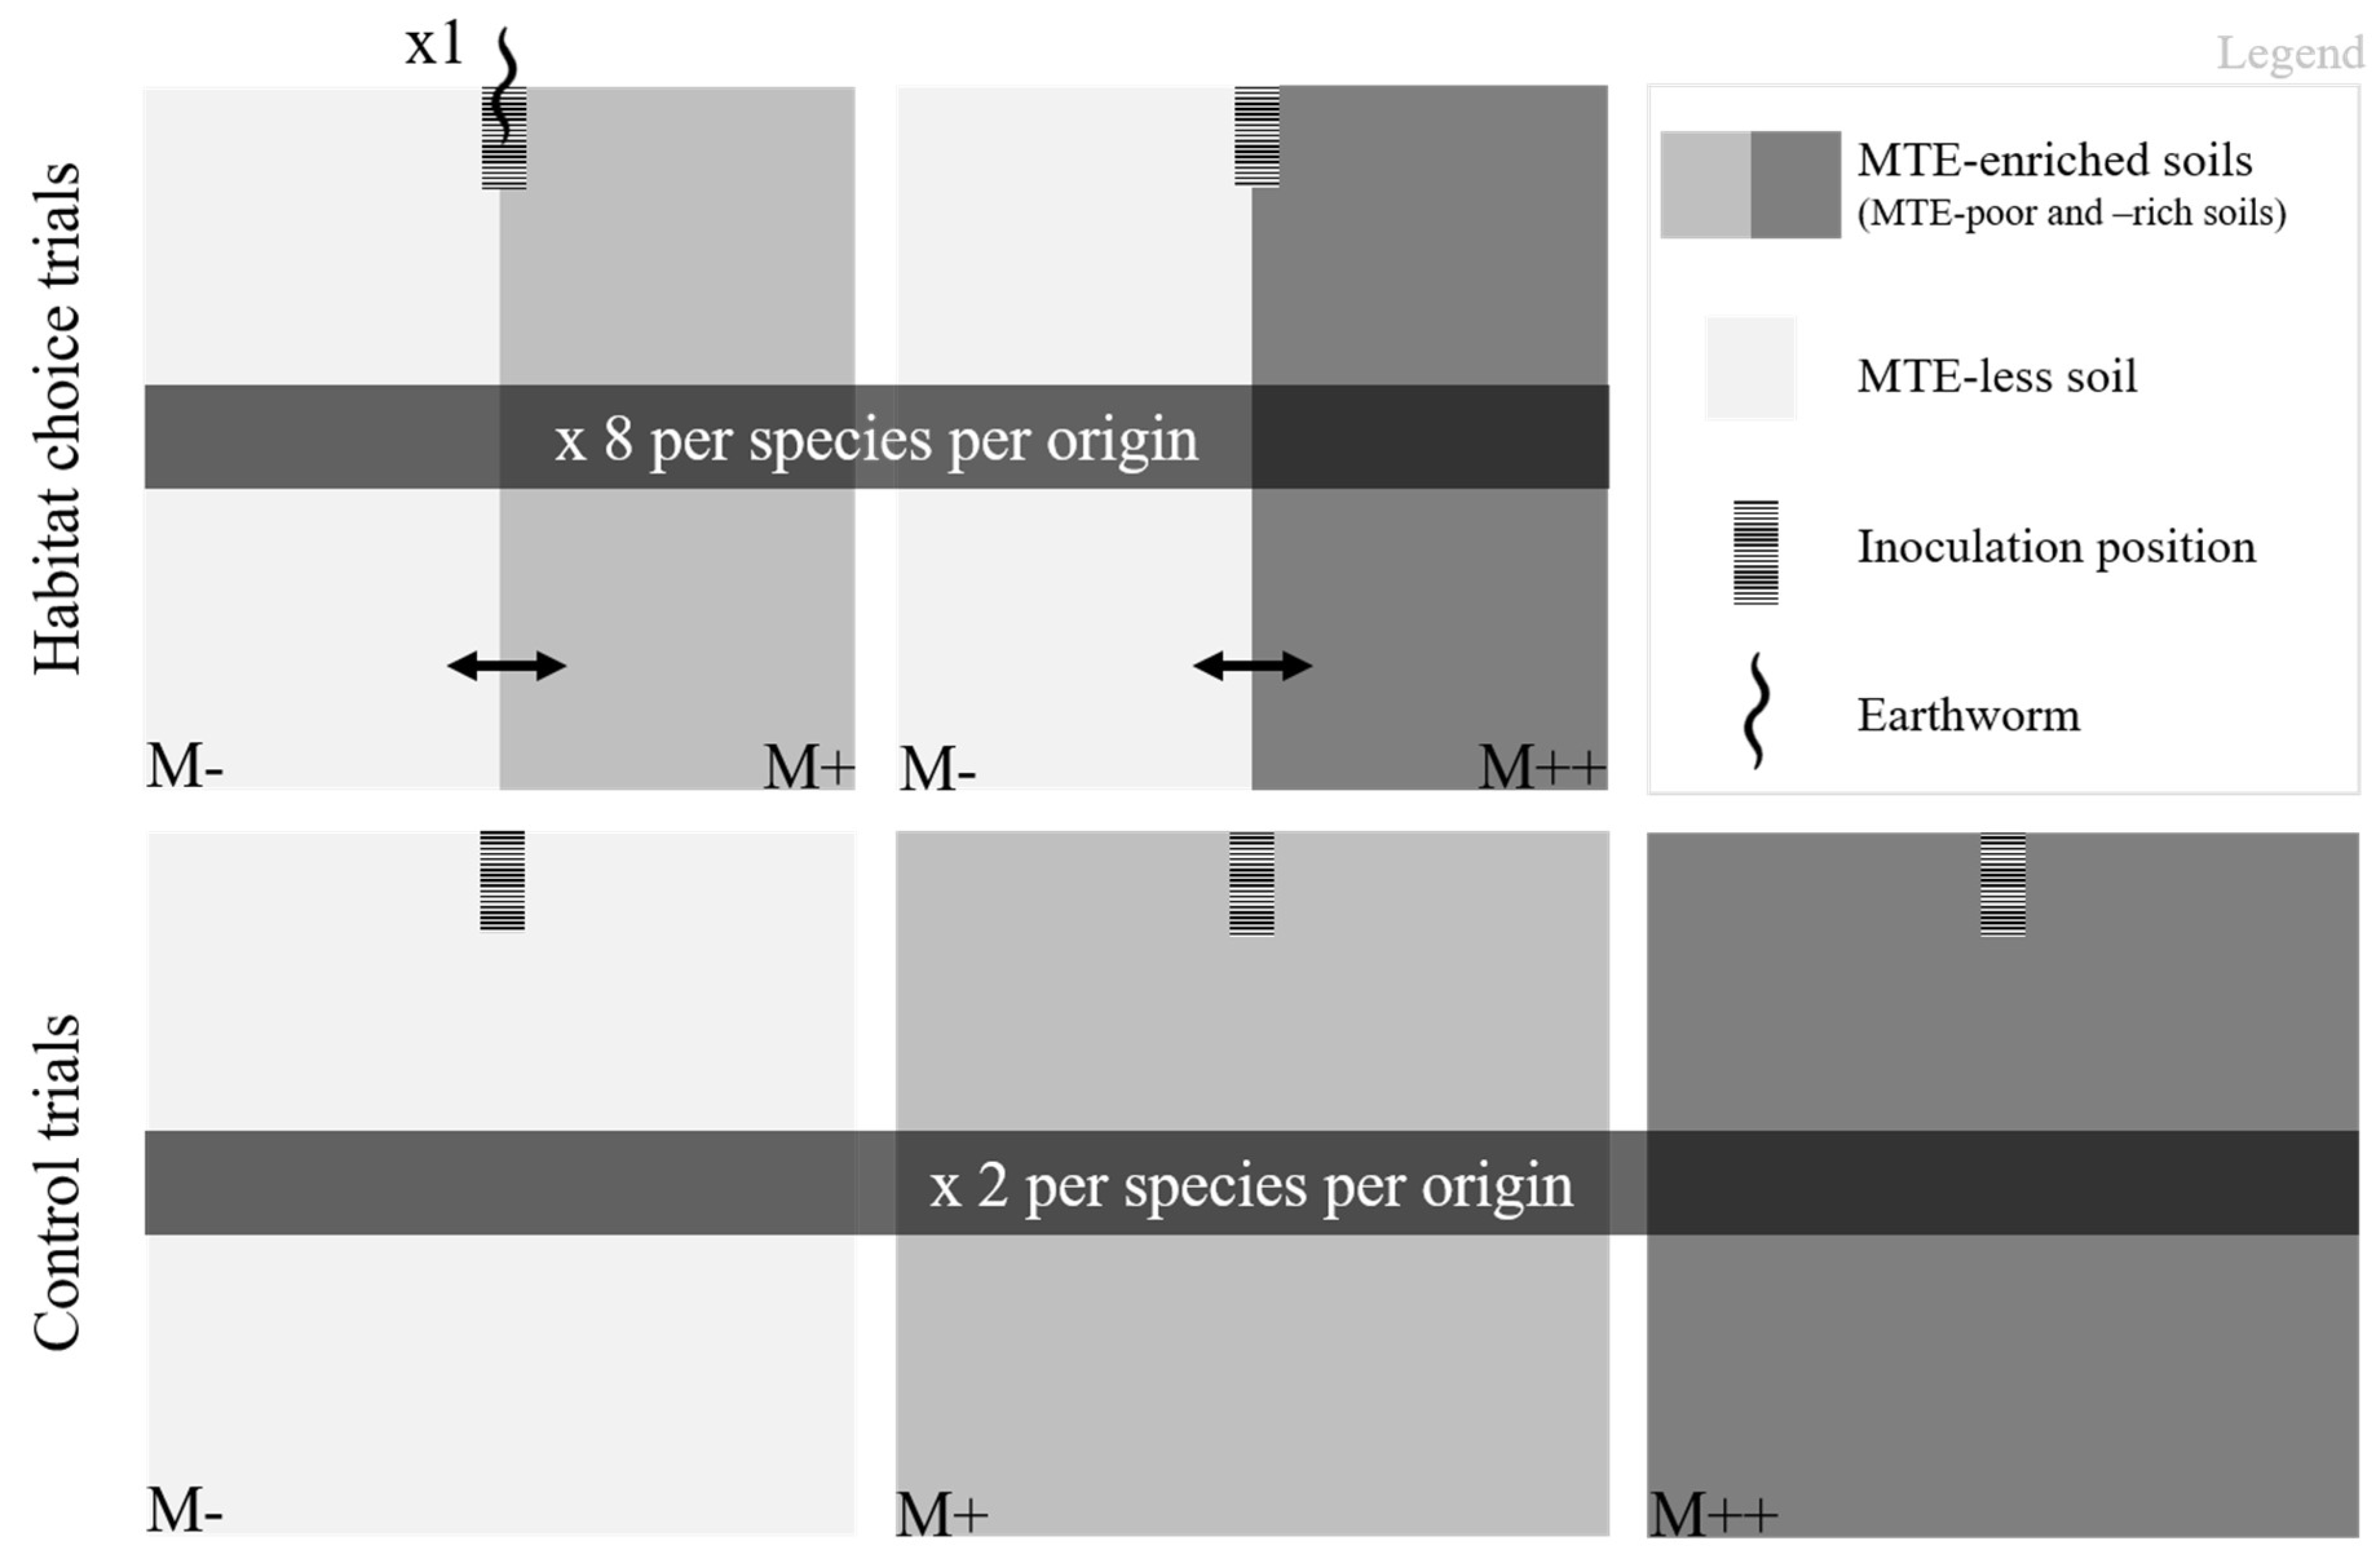
Behavioral trials were carried out in terrariums (25 x 25 x 1cm) with transparent walls to allow easy location of the earthworms and observation of the galleries (see §2.3). The two sides of the terrariums were filled separately with MTE-enriched (MTE-rich M++ or MTE-poor M+) or MTE-less soil (M-); the two soils were held apart by a divider which was subsequently removed. The soils were slightly compacted whenever needed to obtain a visually homogeneous and similar soil density among and between terrariums. To ensure that MTE-enriched and MTE-less soils differed only in MTE concentrations, artificial soils were created; they consisted of 70% sand, 20% clay and 10% sphagnum. Forty-eight hours before the start of the trial, dry soil was transferred into soil preparation buckets where soils were humidified up to 25% of the dry mass with distilled water (M-), or MTE enriched solutions (chromium sulphate, copper sulphate, lead acetate, nickel acetate and zinc chloride; Sigma-Aldrich, St-Louis, USA) to obtain a MTE-rich soil (M++: Cr 10 ppm, Cu 100 ppm, Pb 300 ppm, Ni 15 ppm and Zn 245 ppm) and a MTE-poor soil (M+: half concentrated compared to the MTE-rich soil) (Figure 1). MTE concentrations were chosen to mimic average MTE levels in soils of public green spaces in Paris (personal data from Florence Dubs collected in 2015), which concentrations are in the range of concentrations measured in urban soils worldwide [1,2,41]. MTE salts were chosen for their solubility in water. Although not significantly so, MTE enriched soils (both M++ and M+) had systematically lower pH, carbon to nitrate ratio and assimilable phosphorus (see Table A2). However, the pH (from 5.42 to 6.55) always remained very close to the 6.0 ± 0.5 pH advised in the OECD guideline for the testing of chemicals.
To test whether earthworm habitat preference depends on MTE exposure, the two sections were filled with a MTE-enriched and with the MTE-less soil (M+/M- or M++/M-); the two soils were alternatively on the right or on the left of the terrarium. I carried out a total of 96 habitat choice trials: eight trials per species (A. caliginosa, A. icterica and A. chlorotica) per origin (urban and rural) per MTE exposure (M-/M+ and M-/M++) (Figure 1). In addition, to ensure that earthworm location within the terrarium results from a choice rather than from impaired mobility caused by MTE exposure, both sections were filled with a MTE-enriched (M+/M+ or M++/M++) or the MTE-less soil (M-/M-; Figure 1). I carried out a total of 36 control trials: two per species per origin per MTE exposure.

2.3. Trial procedure

In order not to influence earthworm choice for one of the two sides of the terrariums, a hole of 2cm of depth was perpendicularly dug from the top of the soil such as it was in the middle of the terrarium. For each trial, a single worm was introduced to the hole, anterior end first (Figure 1). The terrarium was immediately closed and let undisturbed in a dark room at 20°C. During five consecutive days, earthworm location was marked (i.e. a cross was drawn on the terrarium at the middle of the earthworm’s body) every two hours from 9am to 5pm, resulting in 23 to 25 location marks per trial. At the end of both control and choice trials, the galleries were traced on both sides of the terrarium; a picture of the empty terrarium – allowing to simultaneously see the galleries on both sides – was taken. Total gallery length in the MTE-enriched and MTE-less soils (i.e. the total length of all galleries formed on each side of the terrarium) was measured using the SmartRoot package in ImageJ [42]. Each earthworm was weighed before and at the end of a trial to measure mass change, calculated as the difference between post and pre-trial mass divided by pre-trial mass. At the end of the choice trials, earthworms were moved back in an acclimatizing terrarium; they were released in their environment at the end of the study. Earthworms from the control trials were individually kept fasting during 24h in a petri dish containing a wet sponge, then froze at -20°C until MTE analysis (see §2.4).
Earthworm movements were measured using five variables: mobility, total gallery length and side choice (in control trials), and specificity and soil choice (in choice trials). For each control trials (M-/M-, M+/M+ and M++/M++), mobility was calculated as the number of non-overlapping location marks. In addition, side choice was measured by counting the number of locations on the left and the right section of the terrarium to verify that earthworm movements were homogeneous within the terrarium. For each choice trial (M+/M- and M++/M-), specificity for the MTE-less soil was defined as 0 when the individual visited the MTE-enriched soil at least once and as 1 when all the locations were in the MTE-less soil. Moreover, soil choice was measured by (i) counting the number of locations, and (ii) measuring the size of the galleries in the MTE-enriched soil (M+ or M++) and in the MTE-less soil (M-); the locations in the middle of the terrarium were excluded.

2.4. MTE analyses

In earthworm native soils – To ensure that wild earthworms collected in rural and urban environments were exposed to different level of MTE pollution, soil of each site was collected and MTE concentrations (i.e. chromium, copper, lead, nickel and zinc) were measured. For urban sites, soil was collected at three different locations not more than 200 m apart. Briefly, a 30 x 30 x 30 cm block of soil was extracted and from which at least 1 L of soil was sampled from the topsoil (from 0 to 5 cm below the surface) and from the subsoil (from 10 to 30 cm below the surface), separately. MTE analyses were carried out by the Laboratoire d’Agronomie de la ville de Paris (France): soil samples were dried at 40°C, 2 mm sieved and 150 µm ground with a ball mill (MM400 Retsch). A total of 0.5 g per sample was then digested simultaneously in 1.2 mL HNO3 (65%) and 3.5 mL HCl (37%) during 16h at room temperature, then 2h at 100°C. Ultrapure water was added to reach a final volume of 50 mL and left to decant during 8h. Total chromium, copper, lead, nickel and zinc concentrations were determined using an inductively coupled plasma optical emission spectrometer (iCAP 7000 ICP-OES, Thermo Electron, USA). The ICP-OES conditions were as follows: plasma power 1150 W, nebulize gaz flow 0.5 L/min, auxiliary gas flow 0.5 L/min. The ICP-OS was calibrated before performing measurements with the use of Cr, Cu, Ni, Pb and Zn standard solutions (1000 ± 2 mg dm− 3 in 5% HNO3) from Chem-Lab. Each MTE was measured three times per sample. Relative standard deviation between the three measurements per sample were all below 10%. The blanks and certified reference materials (Internal Soil Reference Materials ISRM1 and ISRM2) were prepared and analyzed using the same methods as the samples. Calibration and blank samples were analyzed every ten measurements. To estimate earthworm exposure to MTEs at each site, MTE concentrations in the topsoil and the subsoil were averaged. For urban sites, MTE concentrations at the three locations, less than 200 m apart within the site, were averaged.
In artificial soils – To test the validity of my MTE supplementation protocol, the MTE-less (M-), -poor (M+) and -rich soils (M++) were sampled twice during the study. Forty-eight hours after their preparation, ca. 1L of soil was taken from the soil preparation buckets. The samples MTE concentrations were measured using the same protocol as described above.
In earthworms – Earthworms that were used in the control trials were defrosted and dried for 48h at 50°C. They were weighed to the nearest 0.1 mg then digested simultaneously in 1 mL HNO3 (68%) and 1 mL HF (40%) during 24h at 80°C. The product of digestion was transferred into plastic tubes and ultrapure water was added to reach a final 1% acid concentration. Total chromium, copper, lead, nickel and zinc concentrations were determined using an inductively coupled plasma mass spectrometer (NexION 300D ICP Mass Spectrometer, Perkin Elmer SCIEX, USA) in the Biological and Chemical Research Centre (Faculty of Chemistry, University of Warsaw, Poland). A conventional Mainhardt nebulizer and a quartz cyclonic spray chamber were used for sample introduction. The ICP-MS conditions were as follows: plasma power 1100 W, plasma argon flow 15 L/min, auxiliary gas flow 1.21 L/min, nebulizer gas flow 0.86 L/min. The ICP-MS was calibrated before performing measurements with the use of multi standard solutions (ICP Calibration Standard from Merck). During the measurements, the parameters of calibration were checked using the standard containing mercury at the concentration of 1 μg/L in 1% nitric acid. Each isotope was measured three times and each sample was analysed two times. Relative standard deviation between the three measurement per isotope and between the two measurements per sample were all below 10%. The blanks and Certified Reference Materials (CRMs; trace elements in water 1643f from LGC Standards and SPS-SW1 batch 112 from SpectraPure Standards) were prepared and analysed using the same methods as the samples.

2.5. Statistical analyses

Statistical analyses were performed using R software (version 3.5.1).
MTE concentrations in natural soils – To ensure that earthworms collected in urban and rural soils were, in their natural environment, exposed to different level of MTE pollution, chromium, copper, lead, nickel and zinc concentrations in urban and rural soils where earthworms have been collected were compared using linear models (R built-in ‘lm’ function) with the log-transformed MTE concentration as the dependent variable and the origin (urban vs. rural) as the explanatory variable.
MTE-induced health impairments (control trials) – To investigate MTE exposure health effects on earthworms, I performed linear mixed-effects models (‘lmer’ function from the ‘lme4’ package (Bates et al., 2015)) with either i) mobility, ii) log-transformed gallery length or iii) mass loss as the dependent variable, and MTE exposure (M-, M++ or M++), earthworm origin (rural vs. urban) and species (A. caliginosa, A. chlorotica and A. icterica), and their two-way interactions as explanatory variables; the low sample size (i.e. two individuals per species per MTE exposure) prevented to test for the three-way interaction. The capture site was added as random intercept. Moreover, to insure that earthworm movements were homogeneous within the terrarium, I performed a generalized mixed-effects model (‘glmer’ function from the ‘lme4’ package) with the number of locations in the left section over the total number of locations (binomial distributions) as the dependent variable, and MTE exposure, earthworm origin and species, and their two way interactions as the explanatory variables. The capture site was added as random intercept. The trial identity was also added as random intercept to correct for overdispersion.
MTE accumulation in earthworms (control trials) – To test whether MTE accumulation differed in response to MTE exposure and depending on the species and the origin of the earthworm, I performed similar models as previously described to test MTE-induced health impairments, with log-transformed MTE concentrations (chromium, copper, lead, nickel or zinc) as explanatory variables.
MTE-linked habitat preference (choice trials) – To explain the variability in earthworms movements in response to MTE exposure, I performed generalized mixed-effects models (‘glmer’ function) with the proportion of locations or galleries in the MTE-enriched soil (M+ or M++) as the dependent variable (binomial distributions), and MTE exposure (M+/M- vs. M++/M-), earthworm origin and species, and their two and three-way interactions as the explanatory variables. The capture site was added as random intercept. The trial identity was also added as random intercept to correct for overdispersion. More than half of the earthworms did not visit the MTE-enriched soil. Visiting or not the MTE-enriched soil may reflect different habitat selection strategies (e.g. strict avoidance of MTE polluted soils associated with high sensory capacities vs. tolerance to MTE pollution associated with a benefit for exploratory behavior). Therefore, in a second step, I analysed separately the behaviour of earthworms that visited the MTE-less soil only and the ones that visited both soils. Variation in specificity for the MTE-less soil was investigated using a similar generalized mixed-effects model as described above. However, the low sample size prevented to test for the three-way interaction. In individuals that visited both MTE-less and MTE-enriched soils, I investigated both soil choice (i.e. the proportion of locations or galleries in the MTE-enriched soil), using a similar generalized mixed-effects model as describe above, and learning – defined as the variation of earthworm location between the MTE-less and -enriched soils over the course of the trial – using a generalized mixed-effects model with earthworm location (in MTE-less or MTE-enriched soil) as the dependent variable (binomial distribution) and time (the number of location marks; from 1 to 23), MTE exposure, earthworm origin and species, and the two-way interactions with time as the explanatory variables. The capture site and the trial identity were added as random intercepts. The low sample size prevented to test for other interactions between the explanatory variables.
Linear mixed-effects models and generalized mixed-effects models were fitted using the restricted maximum likelihood (REML) and the Laplace approximation of the maximum likelihood methods, respectively. For each model, I performed a backward stepwise selection using the AIC. A Type III Wald chisquare test Anova was used to determine the significance of the retained variables in the final models. Contrasts among groups were tested using least-square mean pairwise comparisons (contrast function of the ‘lsmeans’ package; Lenth 2016).

3. Results

3.1. MTE concentrations in natural and artificial soils

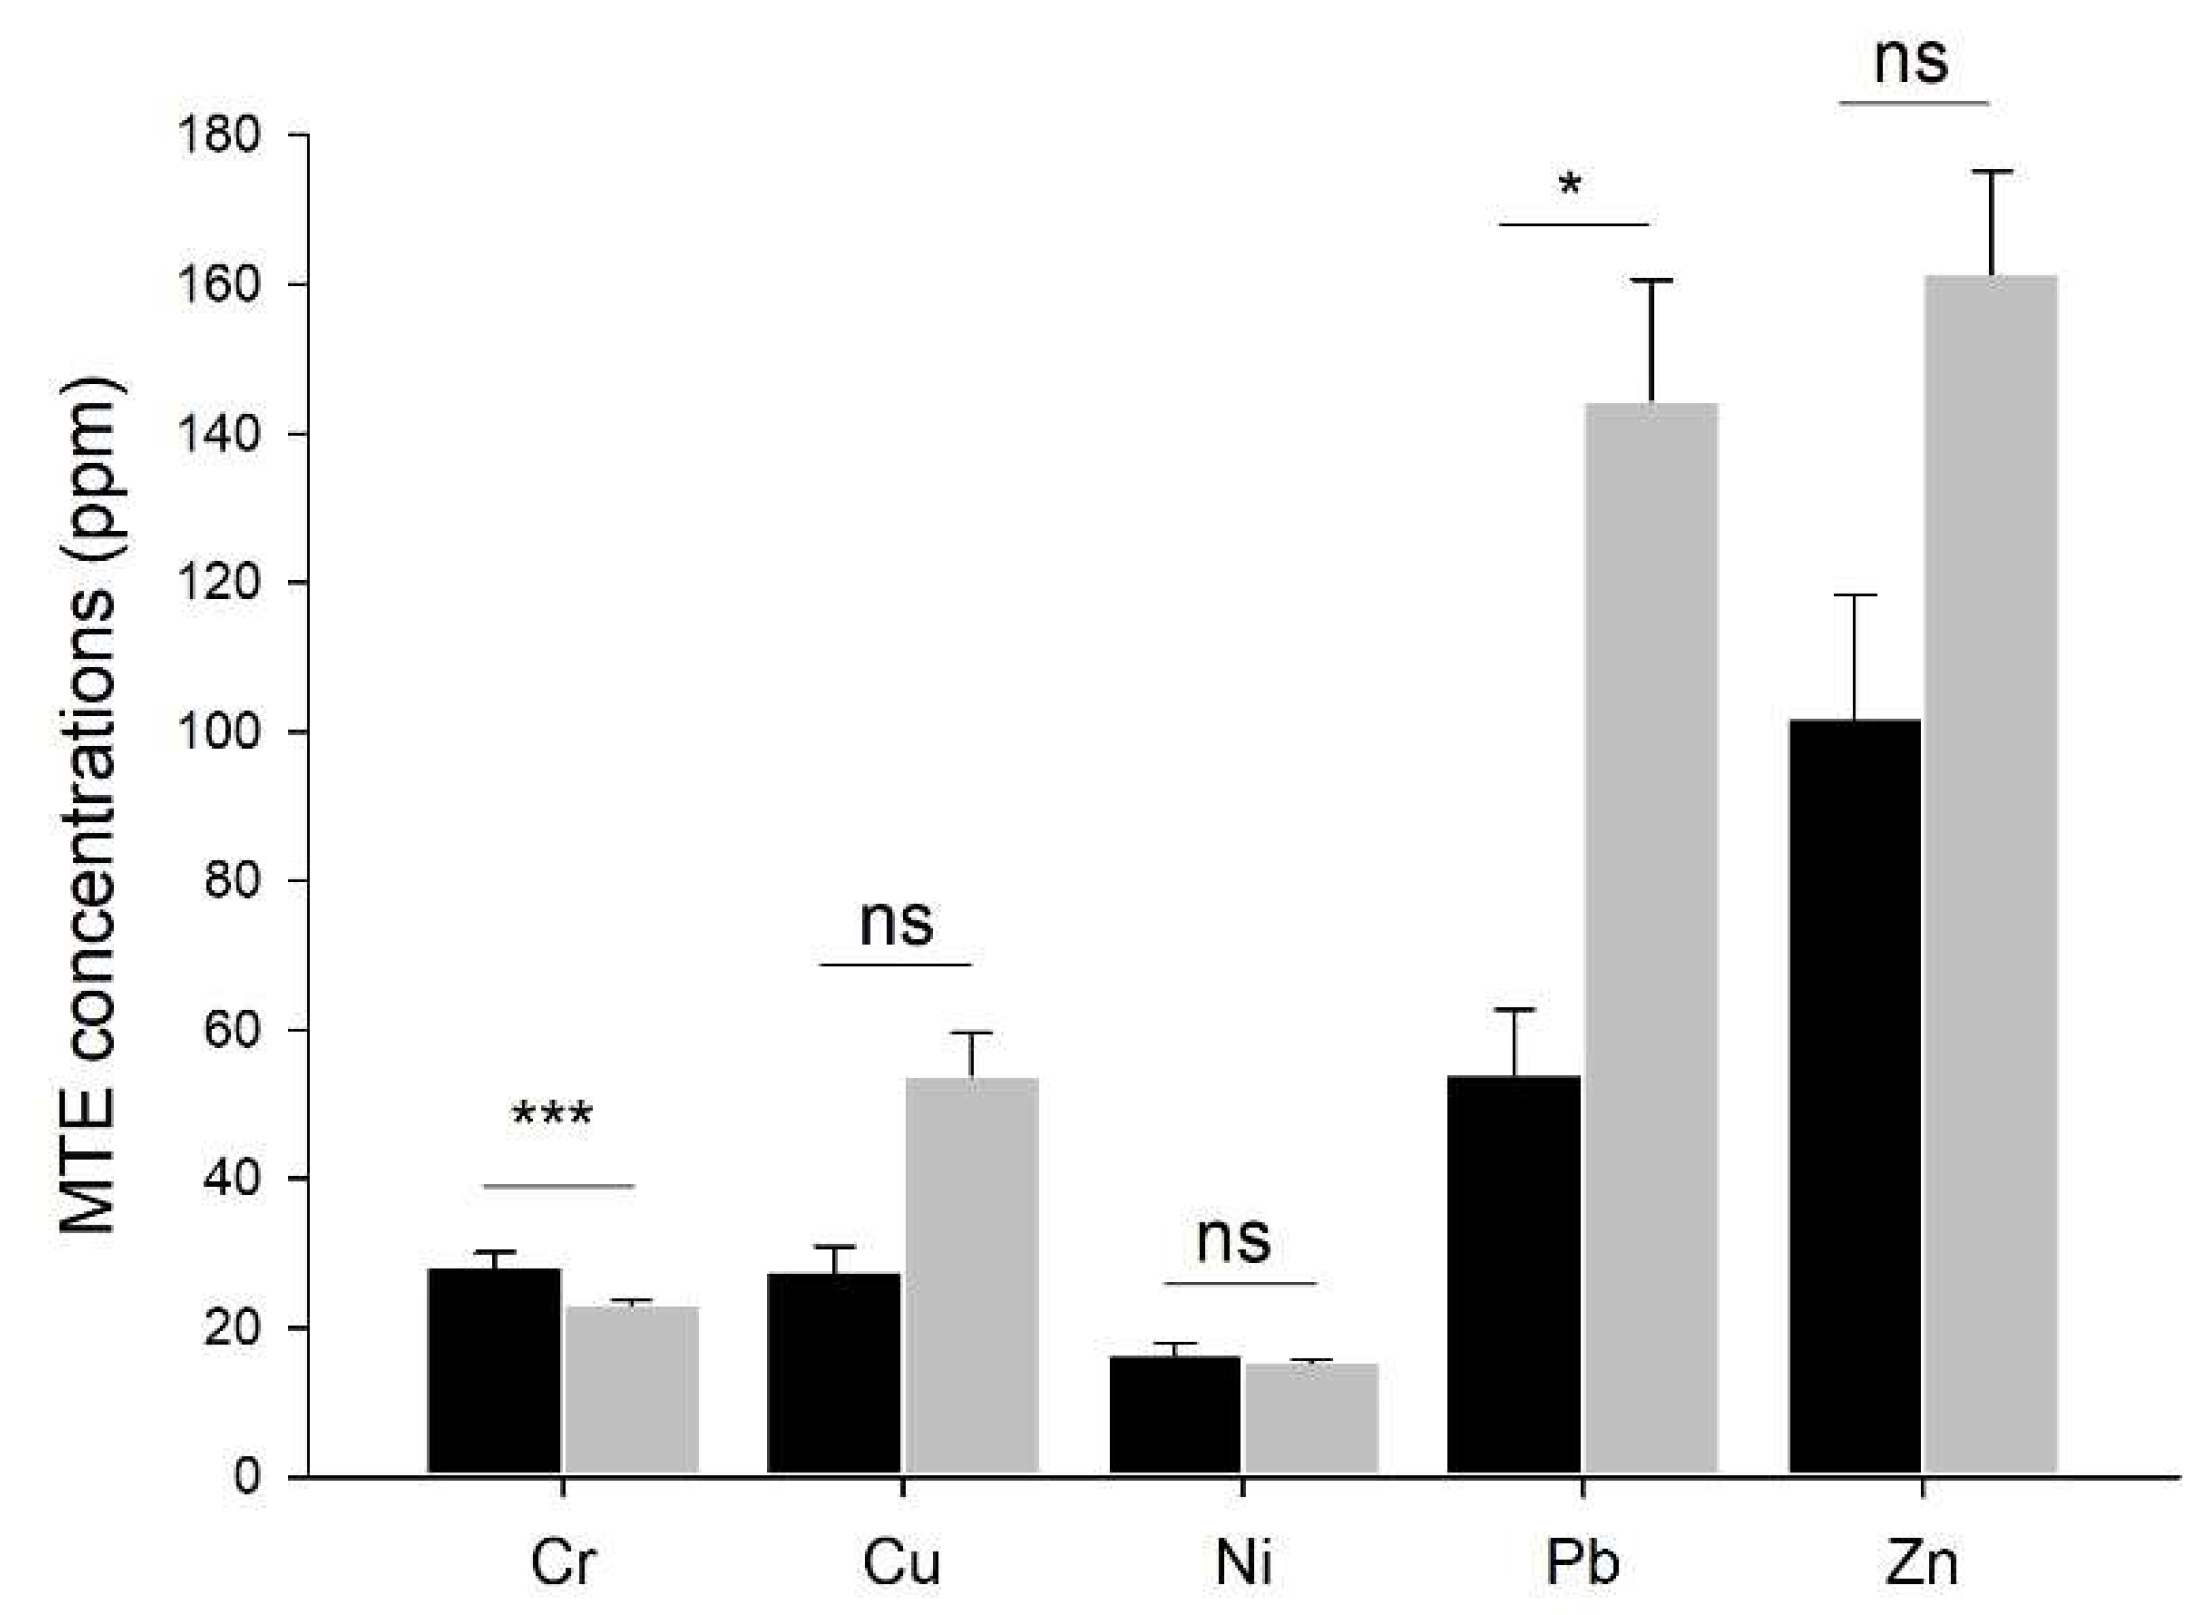
MTE concentrations in earthworm native soil were higher in urban sites than in rural ones for copper (F=5.27, P=0.032) and lead (F=8.61, P= 0.008), while they were lower in urban than in rural soils for chromium (F=8.02, P=0.010) and were not significantly different for zinc (F=3.33, P=0.082) and nickel (F=0.55, P=0.466). However, zinc concentrations in 12 out of 16 urban sites were higher than the median zinc concentration in rural sites (82.5 ppm). Moreover, they were higher in urban than in rural soils when removing one rural site with zinc concentrations 2.33 times higher than zinc mean concentrations in the other rural soils (F=5.32, P=0.031; Figure 2).
Globally, MTE concentrations were higher in the MTE-enriched (MTE-poor and -rich) than in the MTE-less soil. MTE enrichment was slightly lower than intended but for chromium and lead in the MTE-poor soil (M+). MTE enrichment was higher in the MTE-rich (M++) than -poor soil (M+); the coefficients of multiplication varied from 1.2 to 2.7 (Table 1).

3.2. MTE-induced health impairment (control trials)

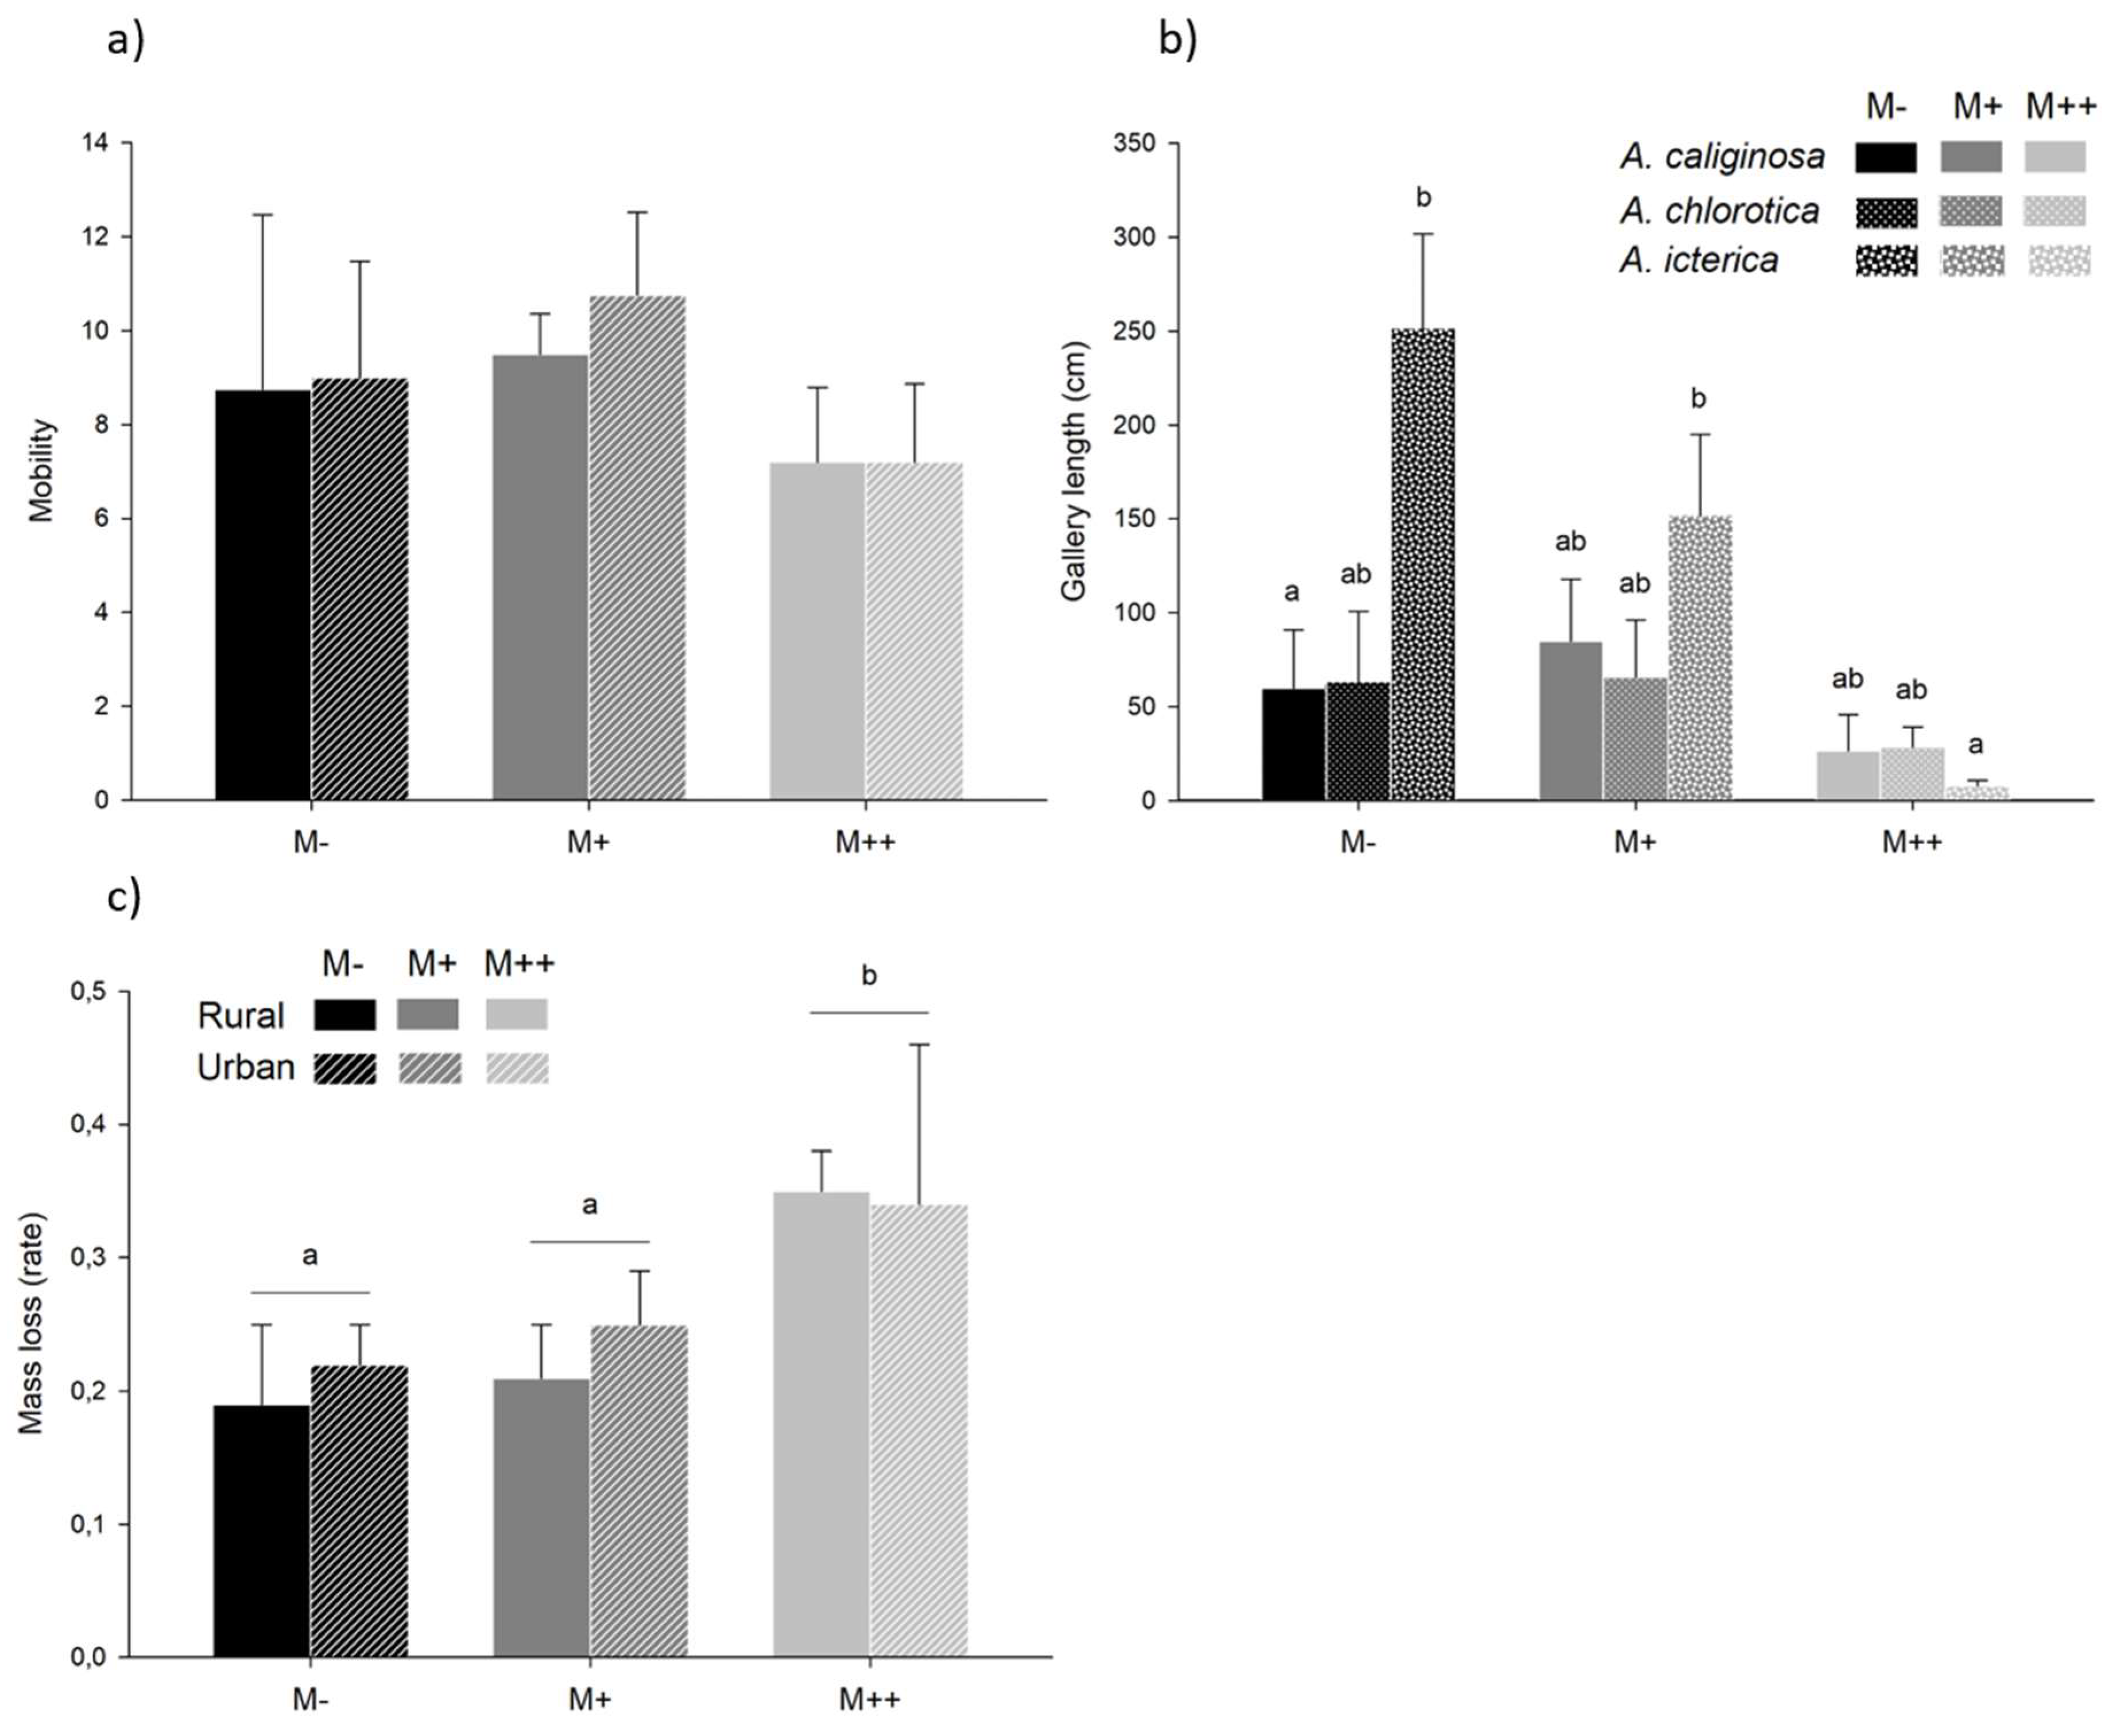
Three earthworms from A. chlorotica (two from rural and one from urban origin) died when exposed to the MTE-rich soil; they were removed from the analysis. None of the explanatory variables were retained in the model investigating earthworm mobility variability. Gallery length tended to depend on the interaction between MTE exposure and species (χ²=8.80, P=0.066): gallery length was shorter in the MTE-rich than in the MTE-poor (t=3.48, P=0.046) and MTE-less soils (t=3.60, P=0.036) in A. icterica. The trend was similar in A. caliginosa and A. chlorotica, although non-significantly so (Figure 3a). Mass loss was significantly different between the three MTE exposures (χ²=15.56, P<0.001): it was higher in MTE-rich than in MTE-poor (t=3.01, P=0.014) and MTE-less soils (t=3.51, P=0.004; Figure 3b). The proportion of locations on the left section of the terrarium varied from 0 to 1 with a mean ± se of 0.55 ± 0.06 (meaning that, on average, 55% of the locations were in the left section and 45% on the right section). It differed between species (χ²=8.94, P=0.011): it was lower in A. caliginosa (mean±se=0.38±0.10) than in A. chlorotica (mean±se=0.79±0.11; z=-2.99, P=0.008). A. icterica space occupation was the most homogeneous (mean±se=0.53±0.33).

3.3. MTE accumulation in earthworms (control trials)

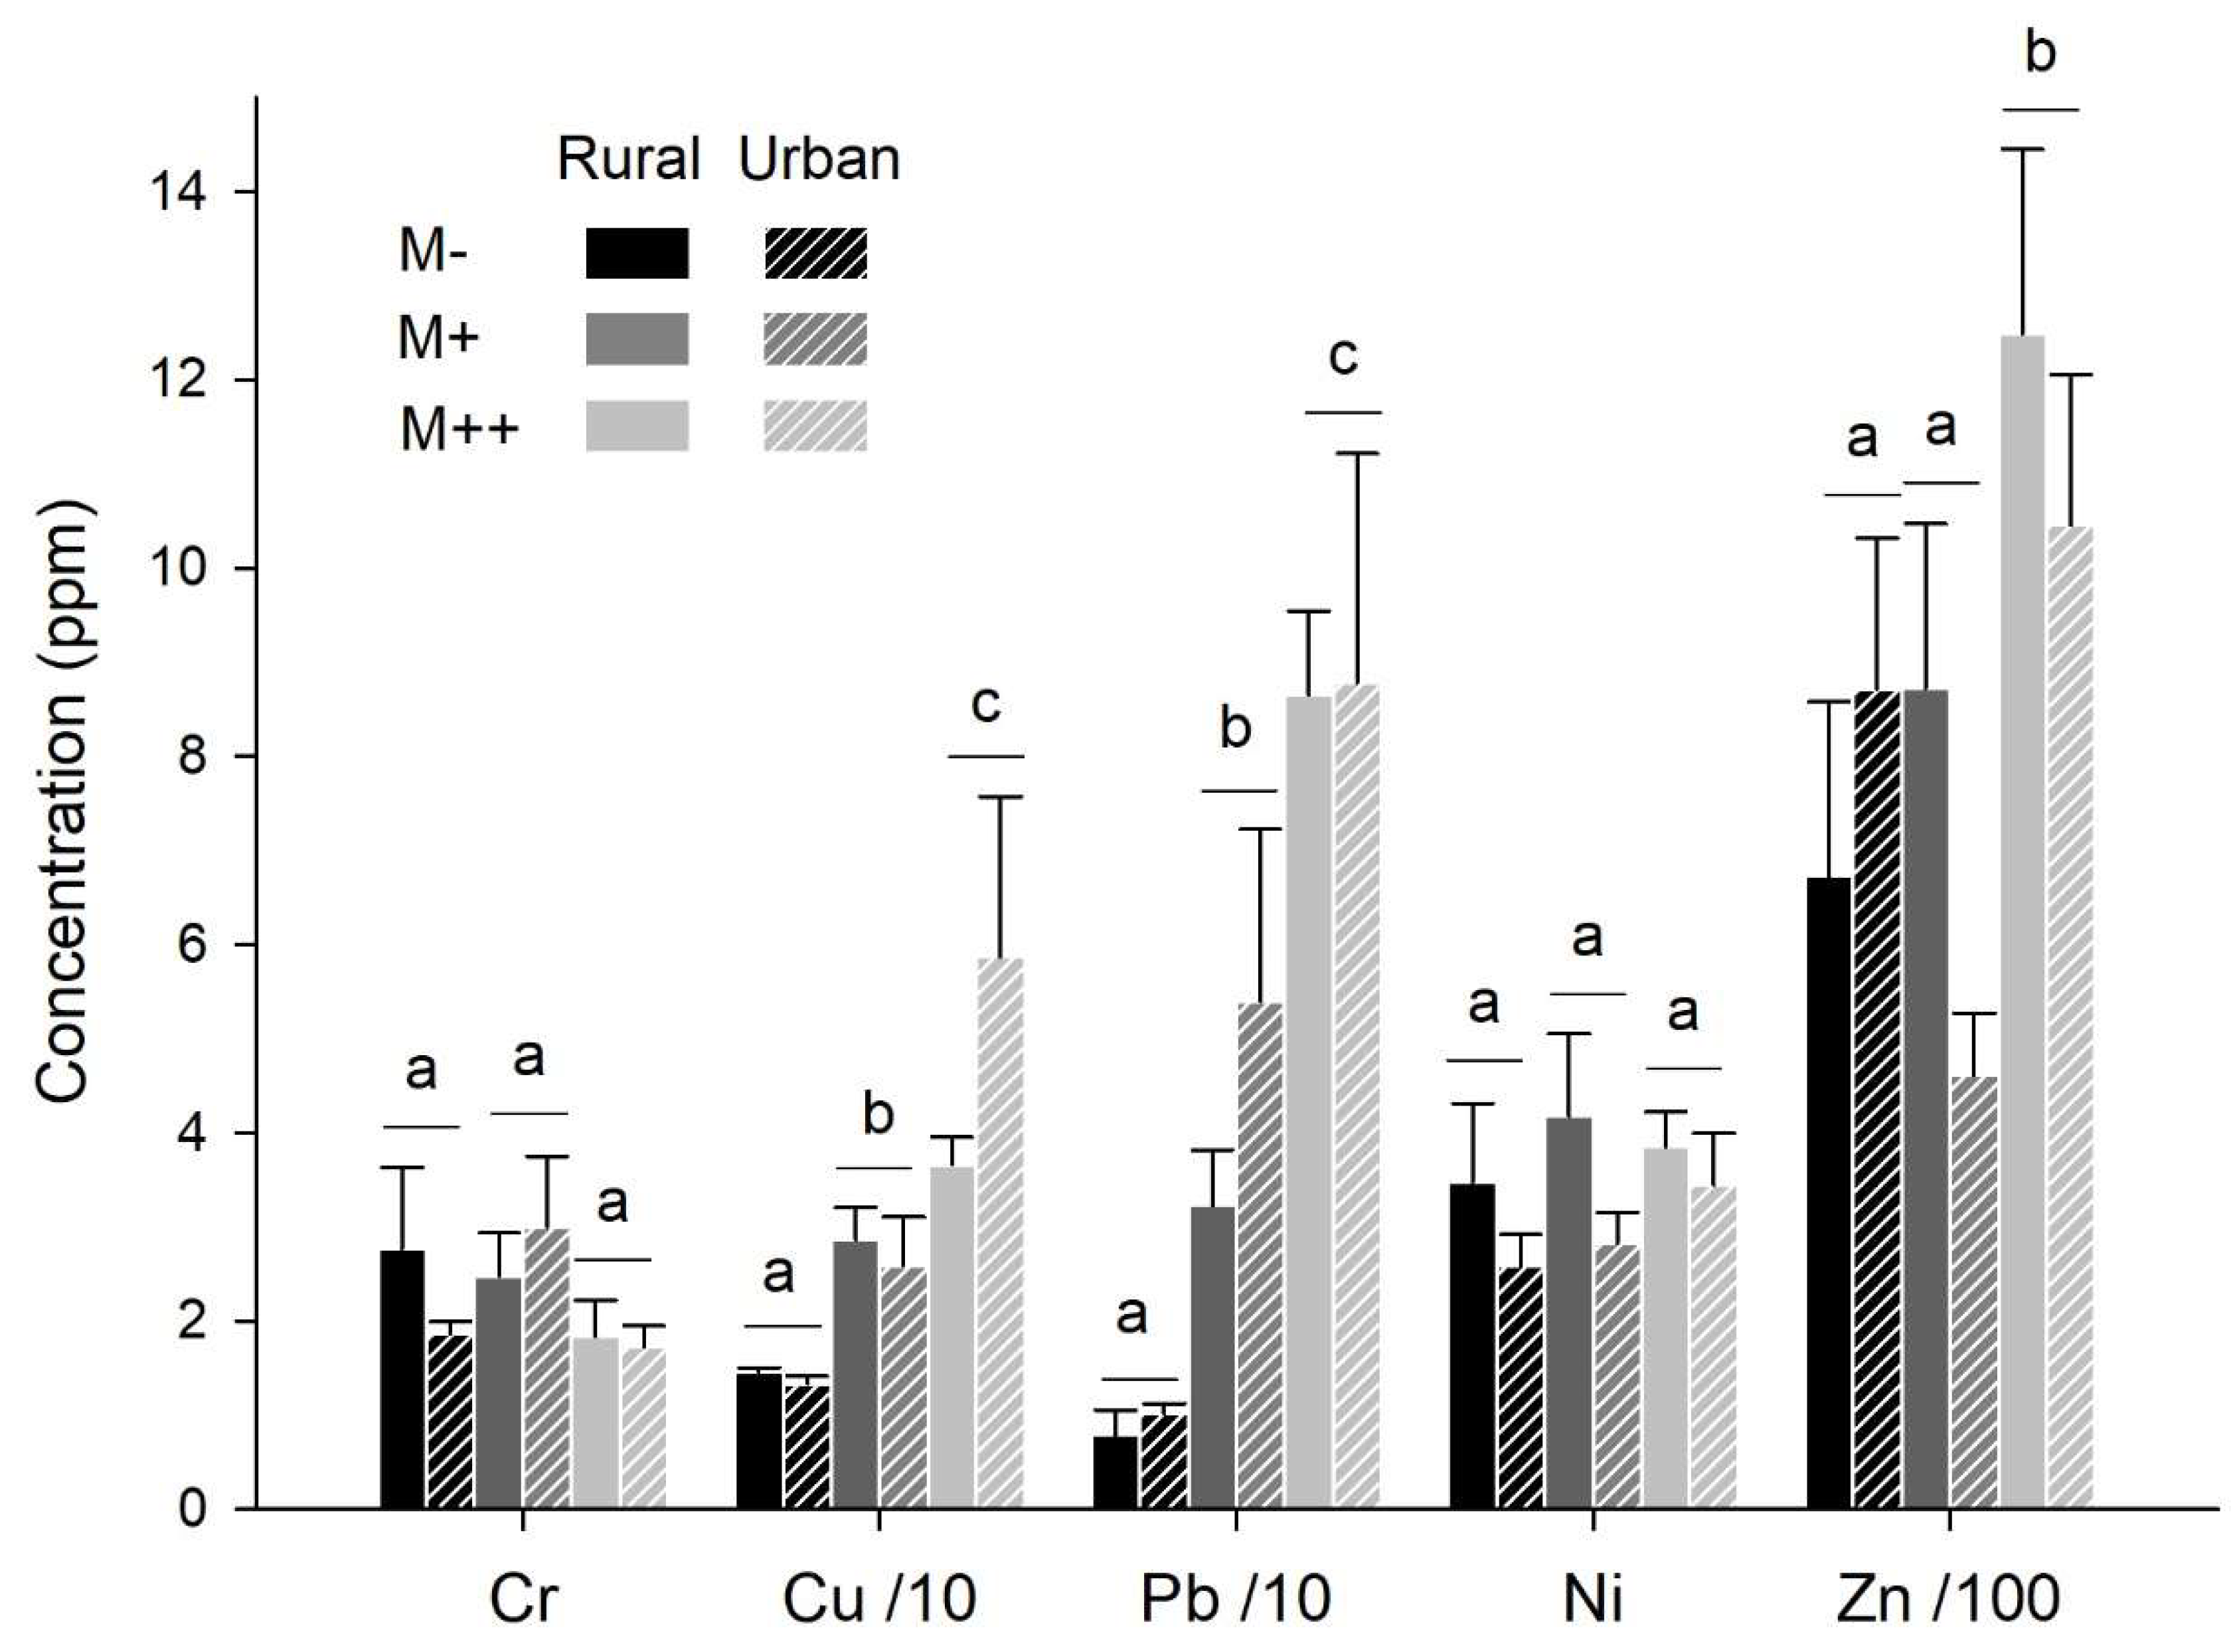
Copper, lead and zinc concentrations in earthworms varied between MTE exposure (χ²=69.29, P<0.001; χ²=101.79, P<0.001 and χ²=15.97, P<0.001, respectively): for copper and lead, they were higher in earthworms exposed to the MTE-rich than -poor soil (t=3.71, P=0.023 and t=3.51, P=0.005, respectively), than -less soil (t=4.81, P<0.001 and t=6.88, P<0.001, respectively). For zinc, they were higher in earthworms exposed to the MTE-rich than -poor and -less soils (t=3.90, P=0.003 and t=2.92, P=0.022, respectively); zinc concentrations were not significantly different between earthworms exposed to the MTE-poor and -less soils (t=0.89, P=0.655). Moreover, zinc concentrations differed between species (χ²=9.82, P=0.007): they were higher in A. caliginosa than in A. icterica (t=3.11, P=0.011). None of the explanatory variables were retained in the models investigating chromium and nickel concentration variability. Earthworm origin (rural vs. rural) was retained in none of the models (Figure 4).

3.4. MTE-linked habitat preference (choice trials)

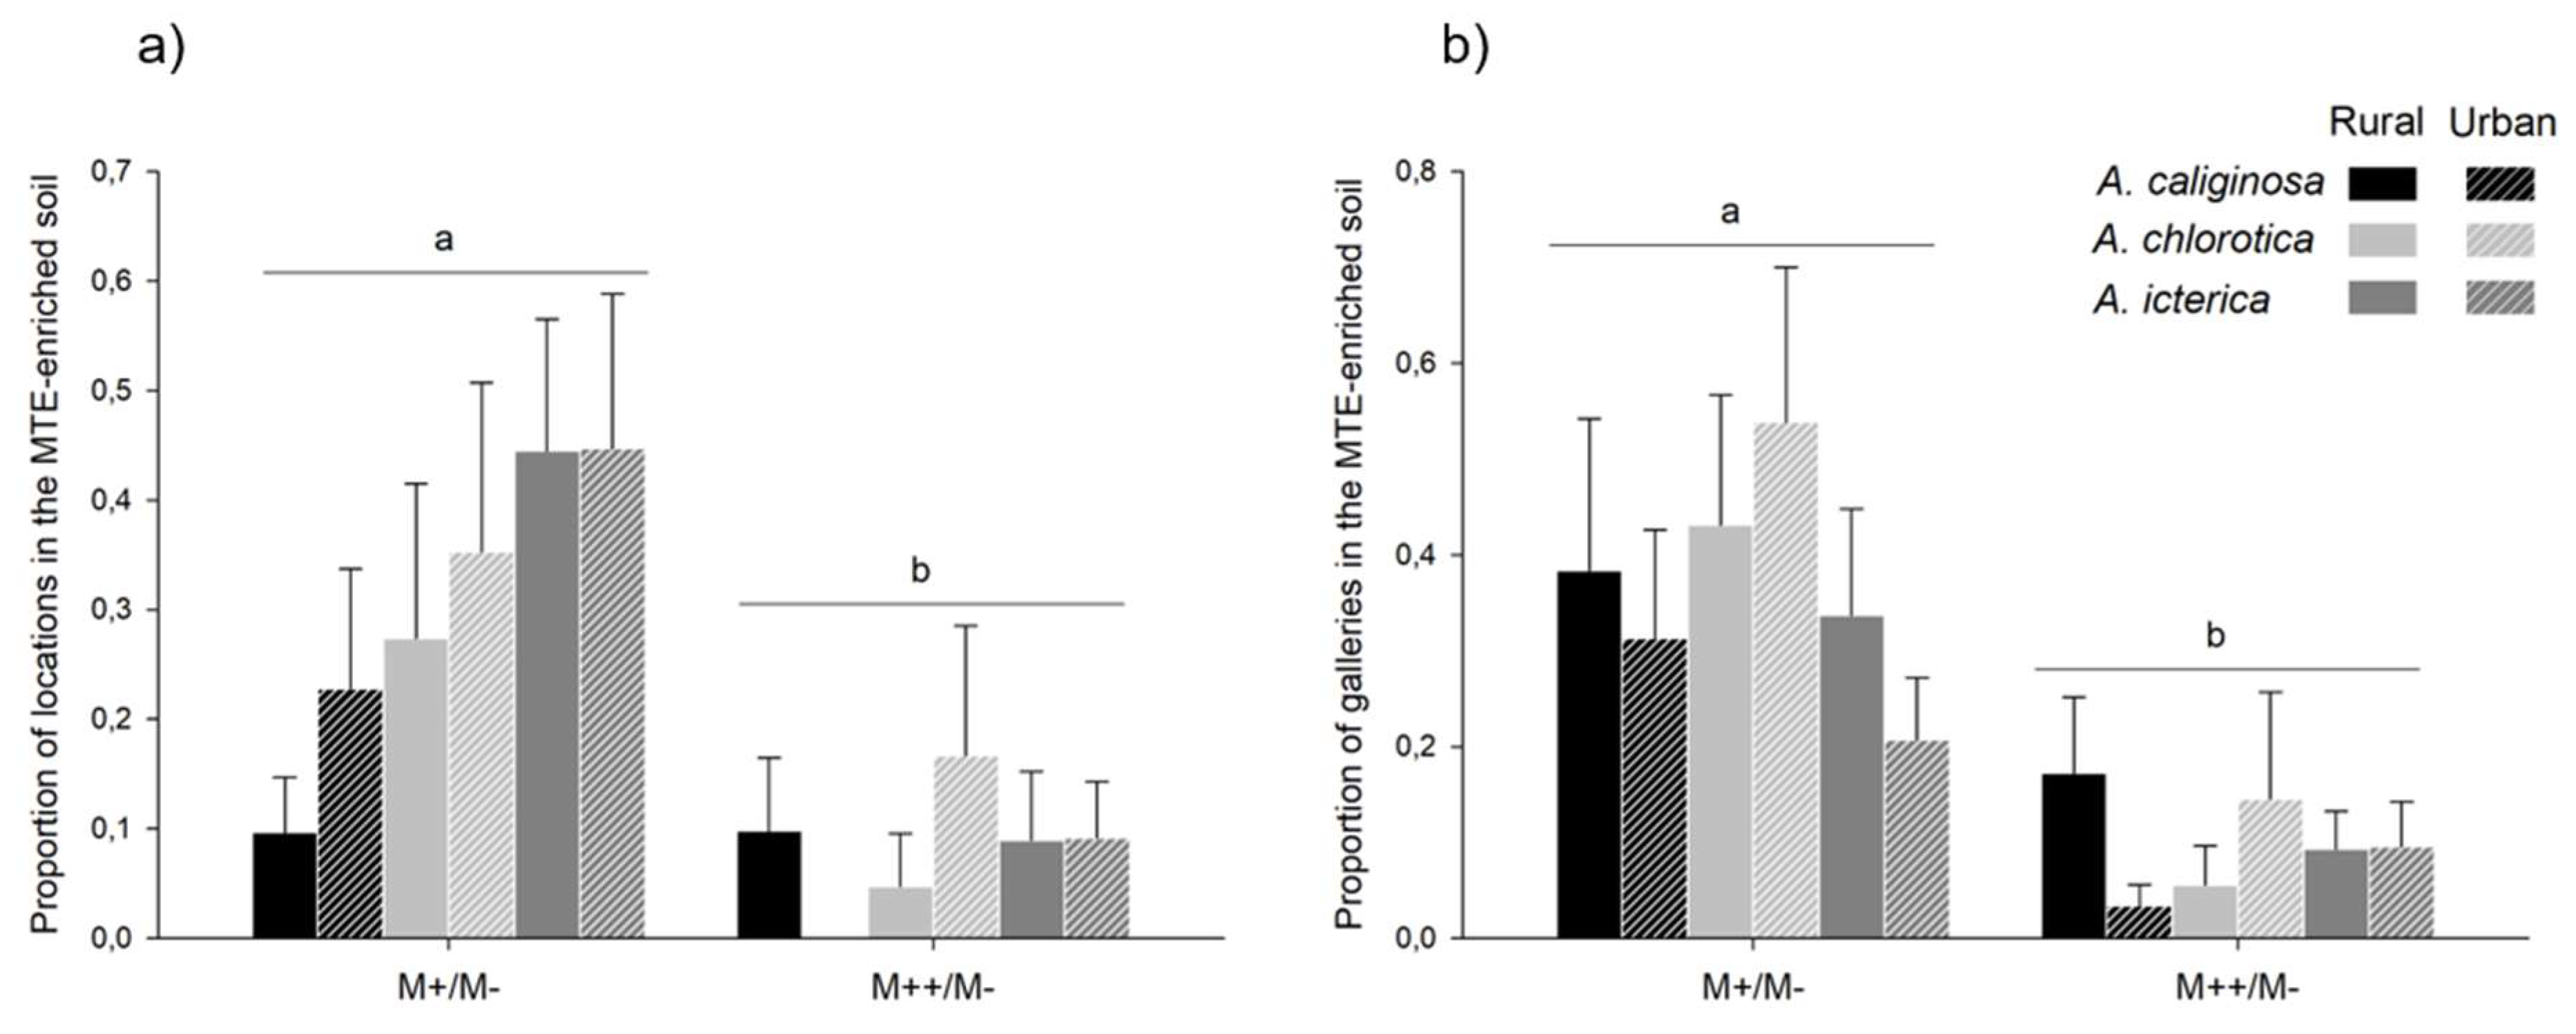
The proportion of locations in the MTE-enriched soil (M+ or M++) varied from 0 to 1; on average, 20% of the locations were in the MTE-enriched soil (mean±se=0.20±0.03). This proportion depended on MTE exposure (χ²=17.71, P<0.001): it was lower when earthworms were exposed to the MTE-rich than -poor soil (z=-4.21, P<0.001; Figure 5a). Similarly, the proportion of galleries in the MTE-enriched soil varied from 0 to 1; on average, 24% of the galleries were in the MTE-enriched soil (mean±se: 0.24±0.03). This proportion depended on MTE exposure (χ²=20.20, P<0.001): it was lower when earthworms were exposed to the MTE-rich (M++/M-) than -poor soil (M+/M-; z=-4.49, P<0.001; Figure 5b). One individual from A. chlorotica died after spending 3.5 days in the MTE-less soil then 1 day in the MTE-rich soil.
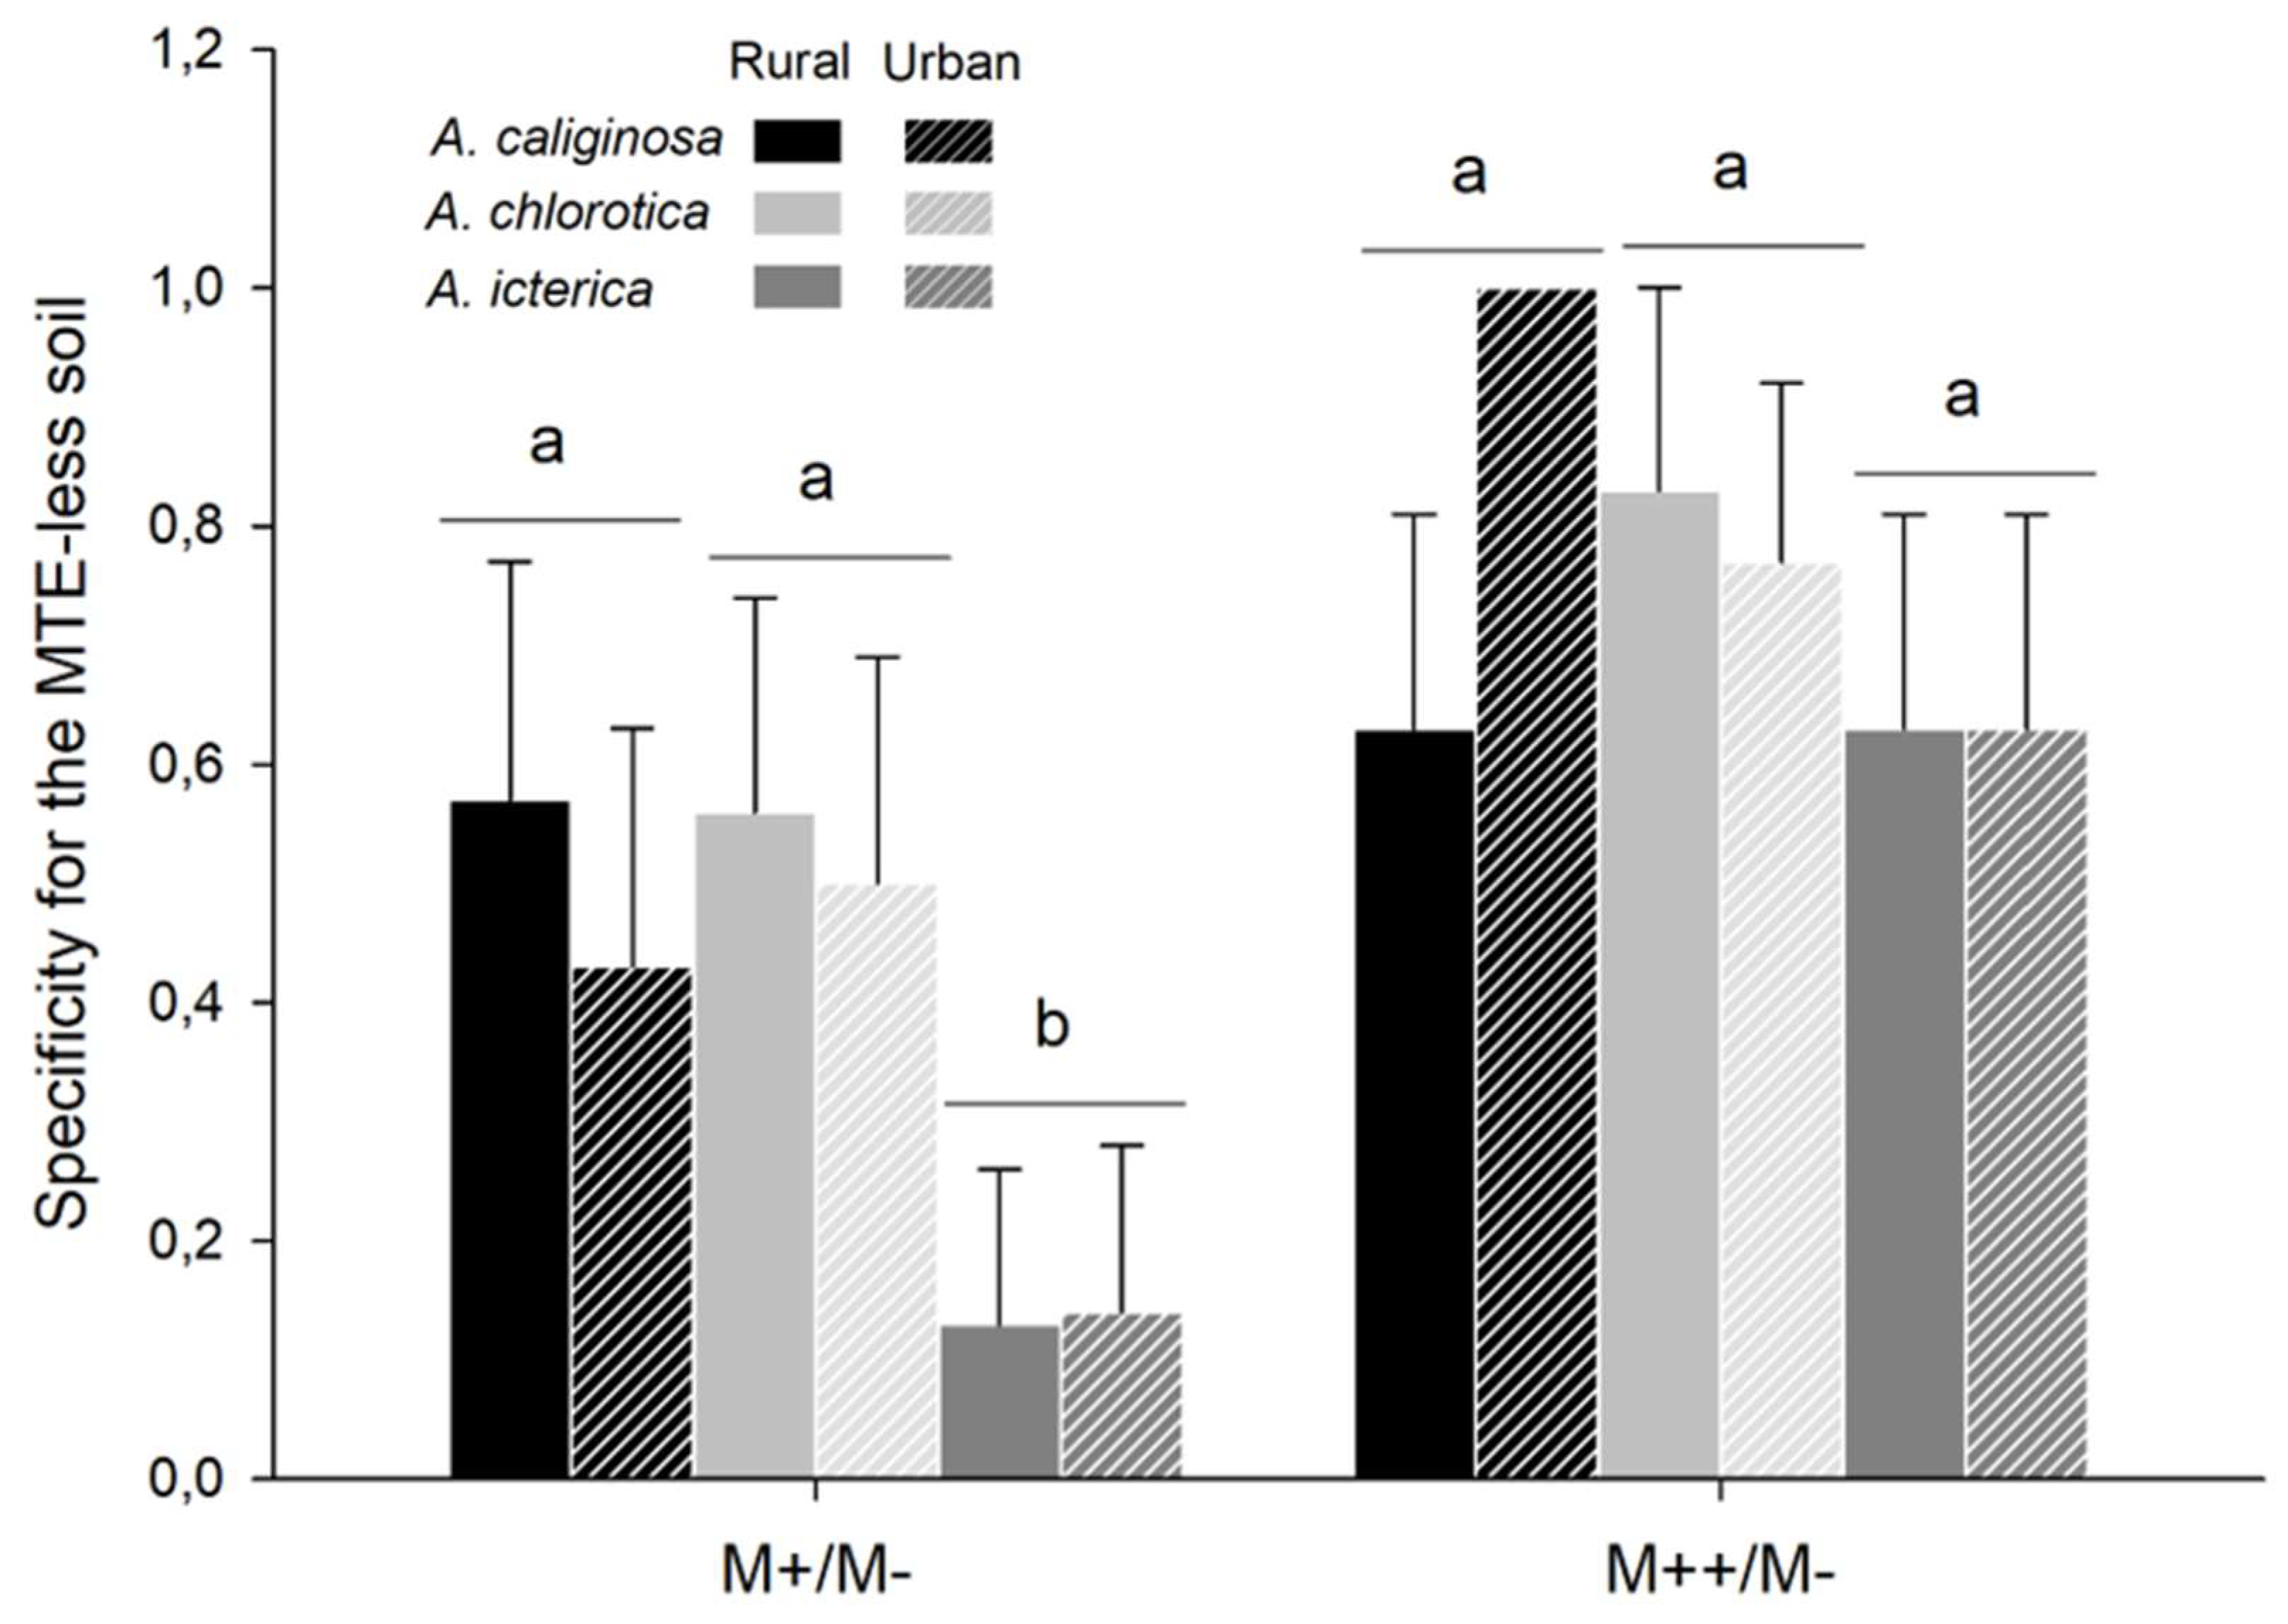
In 54 out of 96 choice trials, earthworms were observed in the MTE-less soil (M-) only, meaning that in those trials, none of the locations were in the MTE-enriched soil. Specificity for the MTE-less soil depended on MTE exposure (χ²=10.82, P=0.001): it was higher in trials with the MTE-rich soil than in trials with the MTE-poor soil (z=3.29, P<0.001). Specificity for the MTE-less soil also differed between species (χ²=6.35, P=0.015): it tended to be lower in A. icterica than in A. chlorotica (z=-2.30, P=0.056) and A. caliginosa (z=-2.13, P=0.084; Figure 6). In six out of 95 trials, earthworms were observed in the MTE-enriched soil only: five and one in the MTE-poor and -rich soil, respectively. Four were A. chlorotica (two from each origin) and two were A. icterica (one from each origin). One earthworm from A. chlorotica died after staying exclusively in the MTE-rich soil.
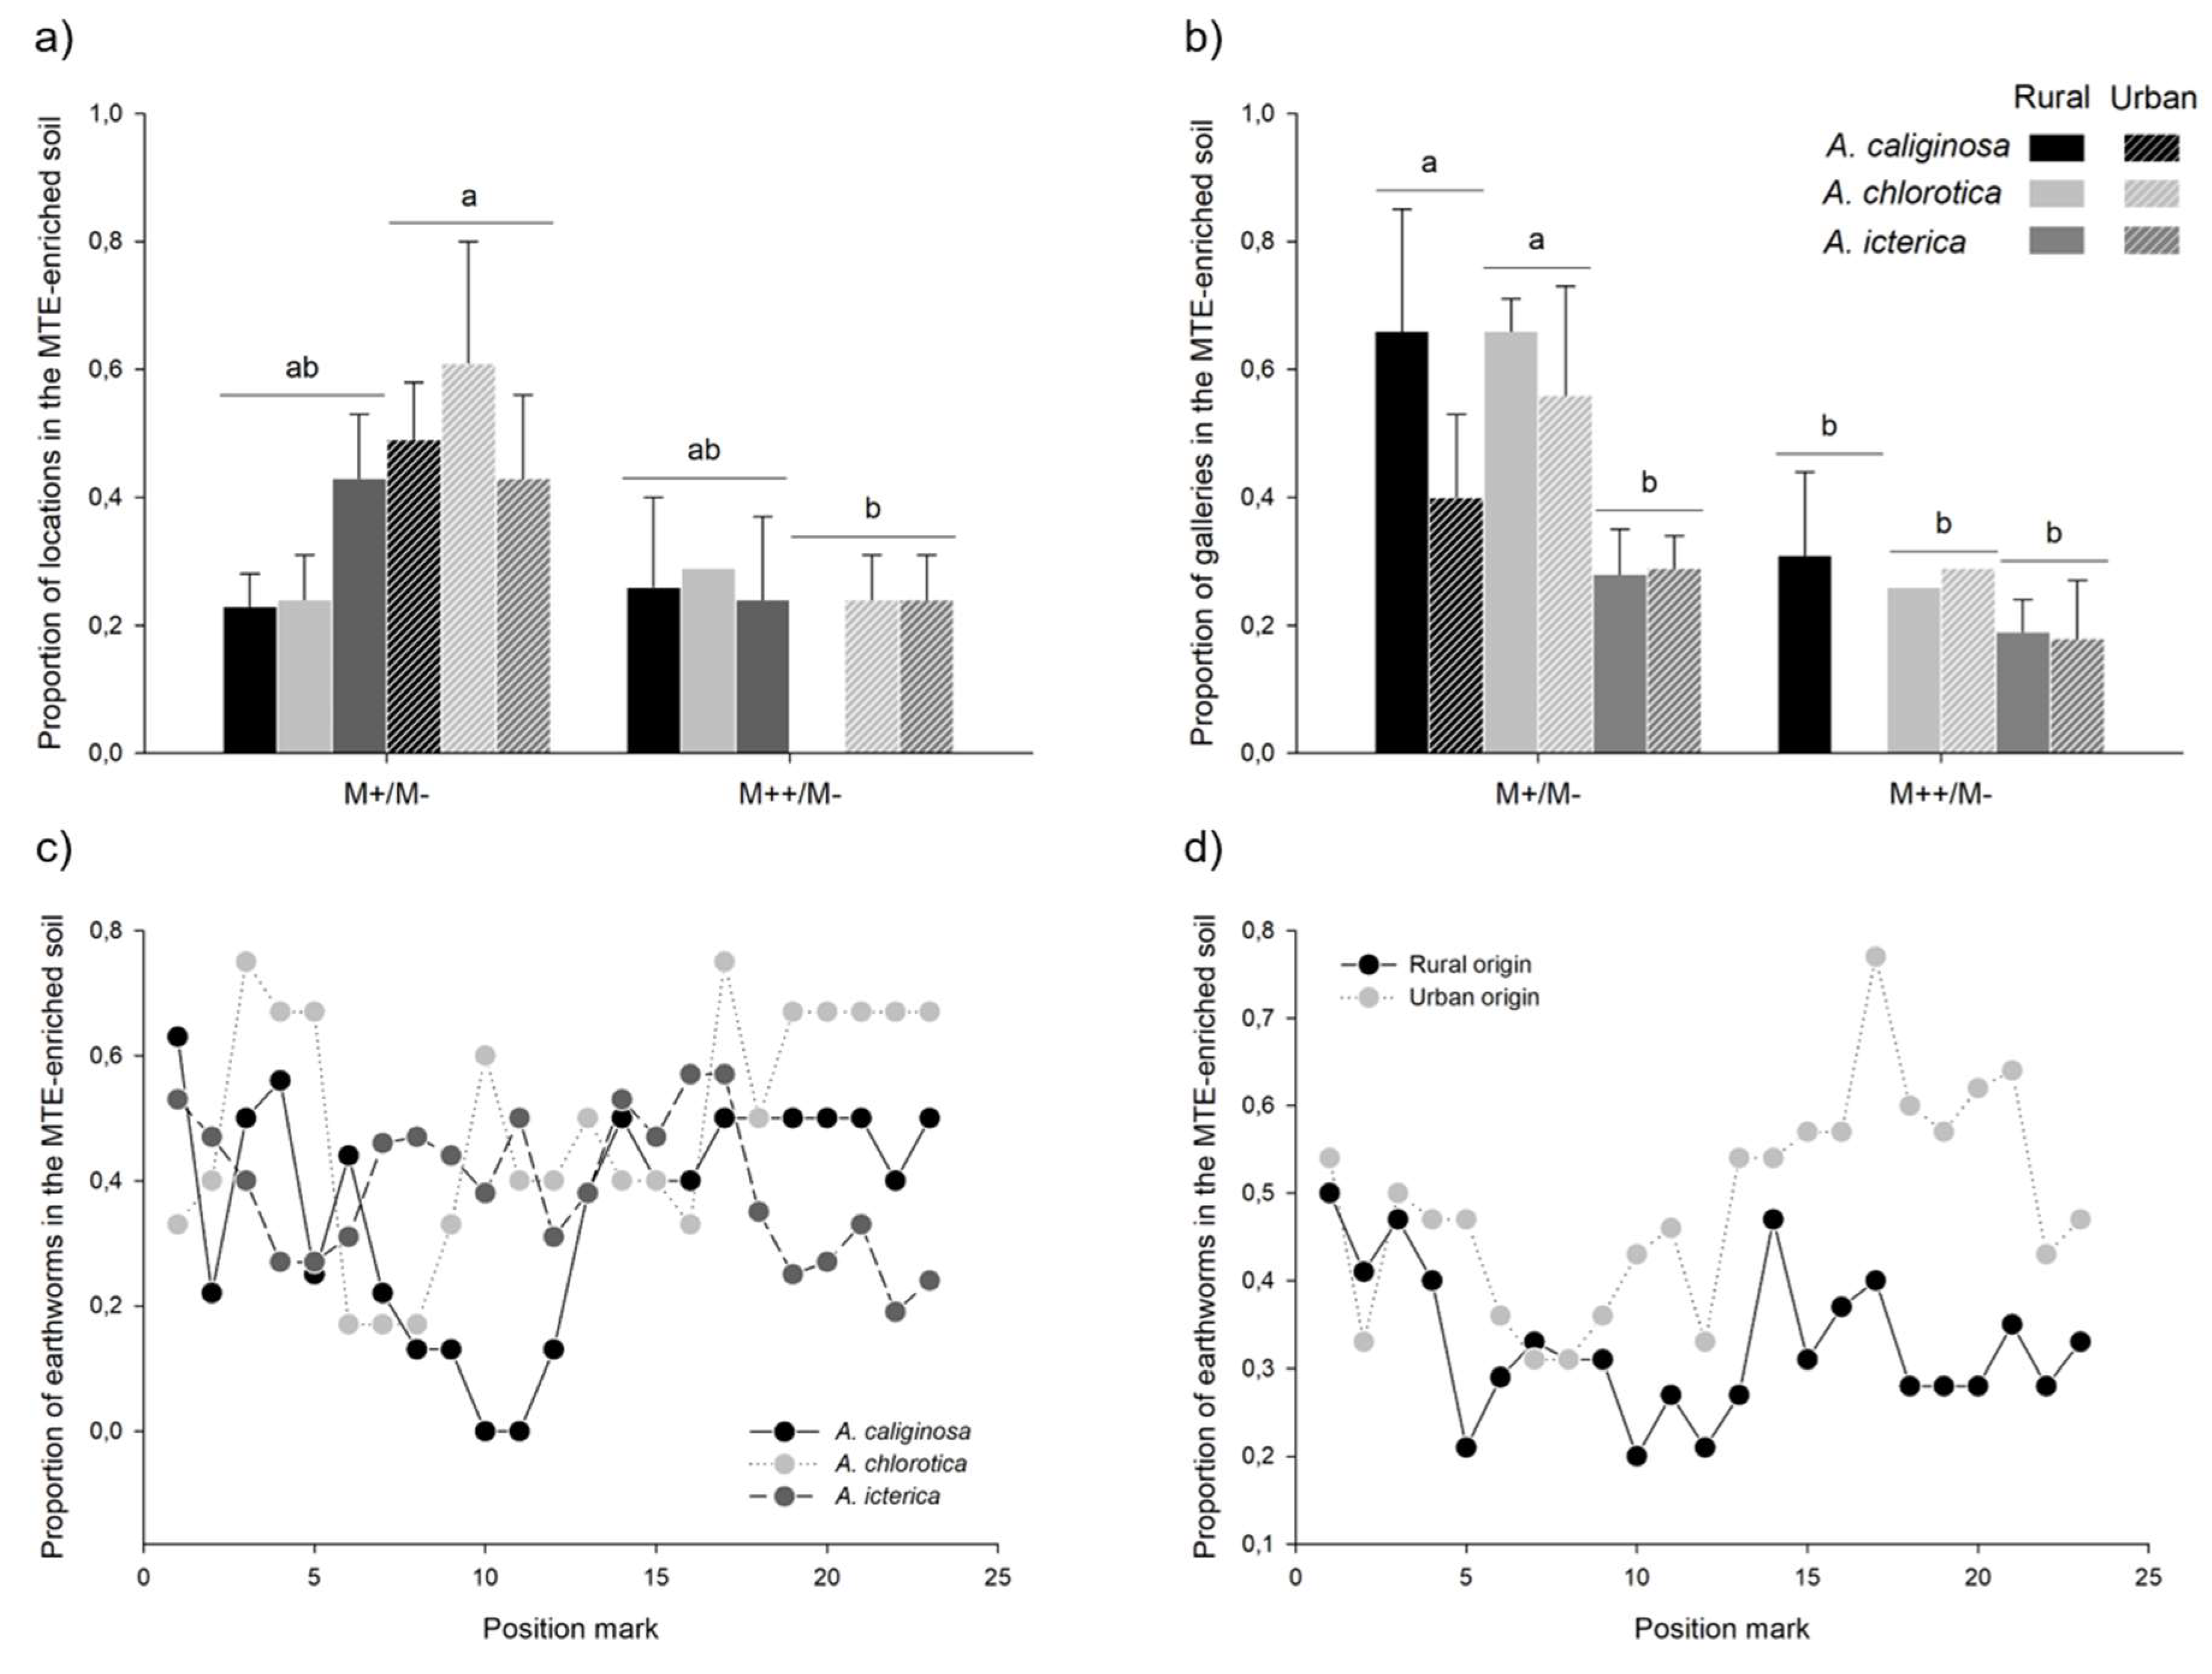
Thirty-five earthworms visited both MTE-less and MTE-enriched soils. In these individuals, the proportion of locations in the MTE-enriched soil varied from 0.05 to 0.91; on average, 37% of the locations were in the MTE-enriched soil (mean±se=0.37±0.04). This proportion depended on the interaction between MTE exposure and earthworm origin (χ²=5.36, P=0.021): it was lower in earthworms from urban origin exposed to the MTE-rich than -poor soil (z=-2.70; Figure 7a). Similarly, the proportion of galleries in the MTE-enriched soil varied from 0.04 to 0.99; on average, 36% of the galleries were in the MTE-enriched soil (mean±se: 0.36±0.04). This proportion depended on MTE exposure (χ²=6.51, P=0.011): it was lower in earthworms exposed to the MTE-rich than -poor soil (z=-2.55, P=0.011; Figure 7b). The proportion of galleries in the MTE-enriched soil also varied between species (χ²=8.80, P=0.012): it was lower in A. icterica than in A. chlorotica (z=-2.70, P=0.011) and A. caliginosa, although not significantly so (z=-2.16, P=0.077). Finally, earthworm location depended on the interaction between time (i.e. the number of location marks) and species (χ²=12.86, P=0.002): the slope between earthworm location in the MTE-enriched soil and time tended to be slightly negative in A. icterica (r=-0.10, t=-1.89, P=0.06), slightly positive in A. chlorotica (r=0.10, t=1.81, P=0.072) but not significantly different from 0 in A. caliginosa (r=0.09, t=1.45, P=0.15). However, the post-hoc model failed to detect significant differences between the three slopes (P>0.368; Figure 7c). Earthworm location also depended on the interaction between time and site (χ²=6.16, P=0.013): the slope between earthworm location in the MTE-enriched soil and time tended to be slightly positive in earthworms from urban origin (r=0.09, t=1.76, P=0.079), while it was not significantly different from 0 in earthworms from rural origin (r=-0.07, t=-1.26, P=0.209). However, again, the post-hoc model failed to detect significant differences between the two slopes (P=0.176; Figure 7d).

4. Discussion

This study experimentally tested the effect of MTE polluted soils, with MTE concentrations close to the ones measured in Parisian parks, on health proxies and movements of endogeic earthworms from urban and rural origins. Overall, it highlighted weak MTE-induced health impairments, yet a clear avoidance of MTE polluted soils; importantly, the results were consistent between the three endogeic species A. caliginosa, A. icterica and A. chlorotica. However, earthworm response to MTE exposure only slightly differed between earthworms from urban and rural origin, suggesting the absence of widespread acclimatization or adaptation mechanisms to MTE pollution in cities.

4.1. MTE exposure decreases body mass maintenance

Overall, MTE pollution at levels similar to the ones measured in Parisian parks had only slight effects on earthworm health proxies: i) earthworm mobility was unaffected by MTE concentrations in the soil; ii) while earthworms built shorter galleries when exposed to MTEs, this pattern was significant for A. icterica only; iii) earthworms exposed to the MTE-rich soil lost more weight over the course of the trial than earthworms exposed to the MTE-less soil but mass loss was not significantly different between individuals exposed to MTE-poor and MTE-less soils; iv) three individuals from A. chlorotica died while exposed to the MTE-rich soil and two others died during the choice trial after visiting the MTE-rich soil. All in all, this study showed that earthworm health was impaired in the MTE-rich soil, meaning that earthworms were sensitive to a cocktail of around 70 ppm of copper, 240 ppm of lead, 8 ppm of nickel and 190 ppm of zinc. Copper, lead and zinc concentrations in the MTE-rich soil are largely similar to the levels measured in Square des Batignolles but are still lower than concentrations measured in four of the 16 Parisian parks (see Table A1). Moreover, these concentrations are lower than the average concentrations in urban areas (Biasioli et al. 2006; Ajmone-Marsan and Biasioli 2010). For instance, out of 86 cities where lead concentrations in the soil have been measured, 14 and 12 have concentrations higher than 200 and 500 ppm, respectively [2]. While MTE concentrations in urban soils can vary between and within cities [2], these results suggest that urban green spaces can be poor-quality habitats for earthworms, especially for some species such as A. chlorotica. This study underlines the importance of conducting more studies investigating the effects of cocktails of “low” concentrations of MTEs on soil invertebrates to better estimate acceptable MTE levels in soils [45]. Moreover, comparing earthworm sensitivity to MTE exposure in cities more or less polluted with MTEs is an interesting avenue to investigate whether earthworm sensitivity can vary as a response to MTE exposure. Indeed, differences in earthworm sensitivity threshold to MTE would arise from the evolution of tolerance mechanisms; alternatively, the absence of variation in earthworm sensitivity would suggest a strong impact of MTE pollution on population dynamic and viability in urban environments.

4.2. MTE exposure strongly affects habitat preference

The measures of locations and gallery length consistently showed that, during the course of the experiment, earthworms were detected only 1 time out of 5 in the MTE-enriched soil. Importantly, the percentage of occurrence in the MTE polluted soil dropped from around 35% in the MTE-poor soil to only 10% in the MTE-rich soil. This result highlights that, even if MTE concentrations in the MTE-poor soil, which mimic rather well MTE pollution in Paris’s squares and parks (see Figure 2), did not impair earthworm survival, mobility and body mass maintenance (see §4.1), they significantly influence earthworm habitat preference. Previous studies also showed that earthworm avoided MTE contaminated soils even though MTE concentrations were below the mortality and reproduction endpoints [46,47,48]. Those results suggest that earthworms evolved an avoidance mechanism toward MTE exposure that should result from MTE exposure having strong detrimental effects, even though those costs have not been identified in this study (e.g. long-term survival, reproduction, immunity, etc.; Spurgeon et al. 2003). Interestingly, after inoculation, a large proportion of earthworms exclusively visited the MTE-less soil; this proportion increased with increasing MTE concentrations. This result suggests that habitat preference in earthworms relies on high sensory capacities. Indeed, the presence of chemoreceptors and sensory tubercles render earthworms highly sensitive to chemicals in the environment [50,51,52]. While the mechanisms by which earthworms discriminate soils with different MTE pollution levels are poorly understood, earthworm avoidance of zinc contamination would result from a direct effect of Zn2+ ions on epidermal chemosensitive receptors [53]. Surprisingly, in individuals that did visit the MTE-enriched soil, the visiting frequency of this soil did not decrease over time. This suggests that earthworm avoidance of MTE-polluted soil does not result from a learning process but rather from an innate mechanism. Overall, MTE pollution-linked habitat preference strongly suggests that MTE pollution at levels measured in urban parks is likely to affect earthworm community composition, and, as a consequence, ecological services in urban soils. Interestingly, the fact that earthworms originating from Paris largely preferred habitats with low MTE concentrations despite the fact that those earthworms were collected in habitats with rather similar levels of MTEs suggests the poor availability of better quality habitats in their natural environment and/or a high competition for such “pristine” habitats.

4.3. Response to MTE exposure only slightly differs between species

Overall, A. caliginosa, A. icterica and A. chlorotica exhibited similar responses to MTE exposure: the three endogeic species preferred the MTE-less soil to the MTE-enriched soils. Nonetheless, A. chlorotica seemed to suffer higher health impairments than the two other species. Indeed, five individuals died in the MTE-rich soil, while we did not record any mortality in the two other species. A. chlorotica high sensitivity to MTE exposure might have impair their movements and explain that four individuals were found in the MTE-enriched soil only during the choice trials. Such variability in species sensitivity to MTE pollution might result from earthworm body size. Indeed, the three species used in this experiment significantly vary in mass; from the smallest to the largest: A. chlorotica (≈ 300 ± 20 g), A. caliginosa (≈ 420 ± 30 g) and A. icterica (≈ 740 ± 40 g; average masses are based on earthworm mass before the trials). Similarly, smaller earthworm species were more sensitive (i.e. higher DNA damage) to cadmium exposure than larger species [54]. More generally, sensitivity to xenobiotics decreases with increasing body size in invertebrates [55,56]. This might result from smaller organisms absorbing higher amounts of toxicants through their epidermis, due to their greater body surface area in relation to their volume compared to larger organisms [57]. The death of three out of four individuals from A. chlorotica exposed to the MTE-rich soil during the control trial prevented to test whether mobility, gallery length and MTE accumulation differed between species in this treatment. Surprisingly, A. chlorotica high sensitivity to MTE exposure did not translate into a stronger choice for the MTE-less soil compared to the two other species. The behavioral response to MTE exposure only differed between A. icterica and the two other species, but such differences were not consistent between the variables that were measured. Previous studies measured differences in earthworm avoidance behavior toward MTE contaminated soils between species. For instance, avoidance behavior toward MTE pollution was lower in epigeic than in anecic and endogeic species, suggesting that epigeic species would be less sensitive to MTEs [25,46]; but see [58]. Comparing habitat preference in response to urban soil pollution between species with different ecological characteristics – differently exposed to MTE pollution and exhibiting different mobility and/or dispersal capacities – is an interesting avenue to better understand how MTE pollution may affect earthworm community composition in cities.

4.4. Little evidence of evolutionary divergence between urban and rural populations

Species vary in their ability to adapt to the often drastic physical changes along the urban–rural gradient [59]. Several invertebrate species evolved in response to urbanization even though examples of local adaptation are still scarce [60]. Of interest, urban and rural populations of the mosquitos Anopheles coluzii and Anopheles gambiae show signs of evolutionary divergence on genes involved in xenobiotic tolerance [61]. Earthworms in urban environments being exposed to higher concentrations of potentially toxic MTEs – especially of lead, copper and zinc – than their counterparts in rural environments, I expected earthworms from urban habitats to have evolved coping or avoidance mechanisms toward MTE pollution [62]. In other words, I expected earthworms from urban sites to be more tolerant to MTE exposure and, therefore, to be both less sensitive to MTE exposure (i.e. to show less sign of health impairment) and less choosy when given the choice between a MTE-enriched and a MTE-less soil [27]. Alternatively, earthworms chronically exposed to MTEs could have evolved improved sensory mechanisms allowing a better detection of MTEs and an escape response when exposed to a MTE-enriched soil. Yet, my study highlighted only few differences in earthworm response to MTE exposure between individuals from urban and rural origin: earthworms from rural and urban origin showed similar patterns of mobility, gallery length, body mass maintenance, mortality and MTE accumulation. On average, their percentage of occurrence in the MTE-enriched soil were 18% and 22%, respectively. Finally, a similar proportion of rural and urban earthworms visited the MTE-enriched soil. However, in earthworms that visited both MTE-enriched and MTE-less soils, while individuals from rural origin preferred the MTE-less soil whatever the level of MTE pollution in the MTE-enriched soil, individuals from urban soils preferred the MTE-less soil only when given the choice with the MTE-rich soil; when given the choice with the MTE-poor soil, earthworms were detected almost one out of two times in the MTE-enriched soil. We may expect the variation in earthworm selectivity to increase with decreasing MTE pollution level. Conducting similar habitat preference experiments while using lower pollution levels than the ones tested in this study would allow to identify the “No Observed Effect Concentration” (NOEC), meaning the maximum MTE pollution level at which earthworms from urban and rural populations express a choice between the MTE-enriched and -less soils. Ideally, future experiments should also measure fitness proxies to test whether earthworm habitat preference confers any fitness advantage and, therefore, could be selected.

Funding

This work was supported by the Austian Science Fund [grant numbers M2628-B25].

Acknowledgments

This work was carried out with the help of two master’s students – Mégane Philippé and Aleksander Miedziejewski, and one bachelor’s student – Neyla Turak, to whom I am very grateful. Moreover, I would like to thank the “Direction des Espaces verts et de l’Environnement” for allowing me to sample earthworms and soil in the parks and squares in Paris. I am also thankful to all the team of the “Laboratoire d’Agronomie de la ville de Paris” who measured MTE concentrations in the soils, and to Eliza Kurek and Ewa Bulska from the Biological and Chemical Research Centre (Faculty of Chemistry, University of Warsaw), who measured MTE concentrations in earthworms. Finally, I thank Jérôme Mathieu, who helped identifying earthworms and designed the terrariums, as well as Gladys Nicolas and Leonardo Lauriot for their help building the terrariums.

Competing interests

The author declares no competing interests.

References

  1. Biasioli, M.; Barberis, R.; Ajmonemarsan, F. The Influence of a Large City on Some Soil Properties and Metals Content. Sci. Total Environ. 2006, 356, 154–164. [CrossRef]
  2. Ajmone-Marsan, F.; Biasioli, M. Trace Elements in Soils of Urban Areas. Water. Air. Soil Pollut. 2010, 213, 121–143. [CrossRef]
  3. Roux, K.E.; Marra, P.P. The Presence and Impact of Environmental Lead in Passerine Birds along an Urban to Rural Land Use Gradient. Arch. Environ. Contam. Toxicol. 2007, 53, 261–268. [CrossRef]
  4. Jones, C.G.; Lawton, J.H.; Shachak, M. Organisms as Ecosystem Engineers. In Ecosystem Management; Springer New York: New York, NY, 1994; pp. 130–147 ISBN 978-0-387-94667-2.
  5. Jones, C.G.; Gutiérrez, J.L.; Byers, J.E.; Crooks, J.A.; Lambrinos, J.G.; Talley, T.S. A Framework for Understanding Physical Ecosystem Engineering by Organisms. Oikos 2010, 119, 1862–1869. [CrossRef]
  6. Blouin, M.; Hodson, M.E.; Delgado, E.A.; Baker, G.; Brussaard, L.; Butt, K.R.; Dai, J.; Dendooven, L.; Peres, G.; Tondoh, J.E.; et al. A Review of Earthworm Impact on Soil Function and Ecosystem Services: Earthworm Impact on Ecosystem Services. Eur. J. Soil Sci. 2013, 64, 161–182. [CrossRef]
  7. Bengtsson, G.; Tranvik, L. Critical Metal Concentrations for Forest Soil Invertebrates: A Review of the Limitations. Water. Air. Soil Pollut. 1989, 47, 381–417. [CrossRef]
  8. Lévêque, T.; Capowiez, Y.; Schreck, E.; Mombo, S.; Mazzia, C.; Foucault, Y.; Dumat, C. Effects of Historic Metal(Loid) Pollution on Earthworm Communities. Sci. Total Environ. 2015, 511, 738–746. [CrossRef]
  9. Nahmani, J.; Lavelle, P. Effects of Heavy Metal Pollution on Soil Macrofauna in a Grassland of Northern France. Eur. J. Soil Biol. 2002, 38, 297–300. [CrossRef]
  10. Tyler, G.; Påhlsson, A.-M.B.; Bengtsson, G.; Bååth, E.; Tranvik, L. Heavy-Metal Ecology of Terrestrial Plants, Microorganisms and Invertebrates: A Review. Water. Air. Soil Pollut. 1989, 47, 189–215. [CrossRef]
  11. Spurgeon, D.J.; Hopkin, S.P. Effects of Cadmium, Copper, Lead and Zinc on Growth, Reproduction and Survival of the Earthworm Eisenia Fetida (Savigny): Assessing the Environmental Impact of Point-Source Metal Contamination in Terrestrial Ecosystems. Environ. Pollut. 1994, 84, 123–130.
  12. Spurgeon, D.J.; Hopkin, S.P. Effects of Metal-Contaminated Soils on the Growth, Sexual Development, and Early Cocoon Production of the EarthwormEisenia Fetida,with Particular Reference to Zinc. Ecotoxicol. Environ. Saf. 1996, 35, 86–95. [CrossRef]
  13. Neuhauser, E.F.; Loehr, R.C.; Milligan, D.L.; Malecki, M.R. Toxicity of Metals to the Earthworm Eisenia Fetida. Biol. Fertil. Soils 1985, 1, 149–152. [CrossRef]
  14. van Gestel, C.A.M.; van Dis, W.A.; Dirven-van Breemen, E.M.; Sparenburg, P.M.; Baerselman, R. Influence of Cadmium, Copper, and Pentachlorophenol on Growth and Sexual Development of Eisenia Andrei (Oligochaeta; Annelida). Biol. Fertil. Soils 1991, 12, 117–121. [CrossRef]
  15. Van Gestel, C.A.M.; Dirven-Van Breemen, E.M.; Baerselman, R.; Emans, H.J.B.; Janssen, J.A.M.; Postuma, R.; Van Vliet, P.J.M. Comparison of Sublethal and Lethal Criteria for Nine Different Chemicals in Standardized Toxicity Tests Using the Earthworm Eisenia Andrei. Ecotoxicol. Environ. Saf. 1992, 23, 206–220. [CrossRef]
  16. Lock, K.; Janssen, C.R. Effect of New Soil Metal Immobilizing Agents on Metal Toxicity to Terrestrial Invertebrates. Environ. Pollut. 2003, 121, 123–127. [CrossRef]
  17. Bisessar, S. Effect of Heavy Metals on Microorganisms in Soils near a Secondary Lead Smelter. Water. Air. Soil Pollut. 1982, 17. [CrossRef]
  18. Bengtsson, G.; Rundgren, S. Ground-Living Invertebrates in Metal-Polluted Forest Soils. Ambio 1984, 13, 29–33.
  19. Spurgeon, D.J.; Jones, O.A.H.; Dorne, J.-L.C.M.; Svendsen, C.; Swain, S.; Stürzenbaum, S.R. Systems Toxicology Approaches for Understanding the Joint Effects of Environmental Chemical Mixtures. Sci. Total Environ. 2010, 408, 3725–3734. [CrossRef]
  20. McKinney, M.L. Effects of Urbanization on Species Richness: A Review of Plants and Animals. Urban Ecosyst. 2008, 11, 161–176. [CrossRef]
  21. Raupp, M.J.; Shrewsbury, P.M.; Herms, D.A. Ecology of Herbivorous Arthropods in Urban Landscapes. Annu. Rev. Entomol. 2010, 55, 19–38. [CrossRef]
  22. Morris, D.W. Temporal Variation, Habitat Selection and Community Structure. Oikos 1990, 59, 303–312. [CrossRef]
  23. Dunning, J.B.; Danielson, B.J.; Pulliam, H.R. Ecological Processes That Affect Populations in Complex Landscapes. Oikos 1992, 65, 169–175. [CrossRef]
  24. Mogren, C.L.; Trumble, J.T. The Impacts of Metals and Metalloids on Insect Behavior. Entomol. Exp. Appl. 2010, 135, 1–17. [CrossRef]
  25. Lukkari, T.; Haimi, J. Avoidance of Cu- and Zn-Contaminated Soil by Three Ecologically Different Earthworm Species. Ecotoxicol. Environ. Saf. 2005, 62, 35–41. [CrossRef]
  26. Lukkari, T.; Aatsinki, M.; Väisänen, A.; Haimi, J. Toxicity of Copper and Zinc Assessed with Three Different Earthworm Tests. Appl. Soil Ecol. 2005, 30, 133–146. [CrossRef]
  27. Langdon, C.J.; Piearce, T.G.; Meharg, A.A.; Semple, K.T. Survival and Behaviour of the Earthworms Lumbricus Rubellus and Dendrodrilus Rubidus from Arsenate-Contaminated and Non-Contaminated Sites. Soil Biol. Biochem. 2001, 33, 1239–1244. [CrossRef]
  28. Bonte, D.; Van Dyck, H.; Bullock, J.M.; Coulon, A.; Delgado, M.; Gibbs, M.; Lehouck, V.; Matthysen, E.; Mustin, K.; Saastamoinen, M.; et al. Costs of Dispersal. Biol. Rev. 2012, 87, 290–312. [CrossRef]
  29. Grimm, N.B.; Faeth, S.H.; Golubiewski, N.E.; Redman, C.L.; Wu, J.; Bai, X.; Briggs, J.M. Global Change and the Ecology of Cities. Science 2008, 319, 756–760. [CrossRef]
  30. Cote, J.; Bestion, E.; Jacob, S.; Travis, J.; Legrand, D.; Baguette, M. Evolution of Dispersal Strategies and Dispersal Syndromes in Fragmented Landscapes. Ecography 2017, 40, 56–73. [CrossRef]
  31. Singh, M.; Kumar, J.; Singh, S.; Singh, V.P.; Prasad, S.M.; Singh, M. Adaptation Strategies of Plants against Heavy Metal Toxicity: A Short Review. Biochem. Pharmacol. Open Access 2015, 04. [CrossRef]
  32. Singh, S.; Parihar, P.; Singh, R.; Singh, V.P.; Prasad, S.M. Heavy Metal Tolerance in Plants: Role of Transcriptomics, Proteomics, Metabolomics, and Ionomics. Front. Plant Sci. 2016, 6. [CrossRef]
  33. Posthuma, L.; Van Straalen, N.M. Heavy-Metal Adaptation in Terrestrial Invertebrates: A Review of Occurrence, Genetics, Physiology and Ecological Consequences. Comp. Biochem. Physiol. C Pharmacol. Toxicol. Endocrinol. 1993, 106, 11–38. [CrossRef]
  34. Morgan, A.J.; Kille, P.; Stürzenbaum, S.R. Microevolution and Ecotoxicology of Metals in Invertebrates. Environ. Sci. Technol. 2007, 41, 1085–1096. [CrossRef]
  35. Janssens, T.K.S.; Roelofs, D.; van Straalen, N.M. Molecular Mechanisms of Heavy Metal Tolerance and Evolution in Invertebrates. Insect Sci. 2009, 16, 3–18. [CrossRef]
  36. Maroni, G.; Wise, J.; Young, J.E.; Otto, E. Metallothionein Gene Duplications and Metal Tolerance in Natural Populations of Drosophila Melanogaster. Genetics 1987, 117, 739–744.
  37. Rożen, A. Effect of Cadmium on Life-History Parameters in Dendrobaena Octaedra (Lumbricidae: Oligochaeta) Populations Originating from Forests Differently Polluted with Heavy Metals. Soil Biol. Biochem. 2006, 38, 489–503. [CrossRef]
  38. Beeby, A.; Richmond, L. Adaptation by an Urban Population of the Snail Helix Aspersa to a Diet Contaminated with Lead. Environ. Pollut. 1987, 46, 73–82. [CrossRef]
  39. Bouché, M.B. Lombriciens de France: Écologie et Systématique.; 1972;
  40. Sims, R.W.; Gerard, B.M. Earthworms: Keys and Notes for the Identification and Study of the Species. Brill Archive.; Doris M. Kermack & R.S.K. Barnes: London, UK, 1985; Vol. 31;.
  41. Manta, D.S.; Angelone, M.; Bellanca, A.; Neri, R.; Sprovieri, M. Heavy Metals in Urban Soils: A Case Study from the City of Palermo (Sicily), Italy. Sci. Total Environ. 2002, 300, 229–243. [CrossRef]
  42. Lobet, G.; Pages, L.; Draye, X. A Novel Image-Analysis Toolbox Enabling Quantitative Analysis of Root System Architecture. PLANT Physiol. 2011, 157, 29–39. [CrossRef]
  43. Bates, D.; Mächler, M.; Bolker, B.; Walker, S. Fitting Linear Mixed-Effects Models Using Lme4. J. Stat. Softw. 2015, 67. [CrossRef]
  44. Lenth, R.V. Least-Squares Means: The R Package Lsmeans. J. Stat. Softw. 2016, 69, 1–33.
  45. Monchanin, C.; Devaud, J.-M.; Barron, A.B.; Lihoreau, M. Current Permissible Levels of Metal Pollutants Harm Terrestrial Invertebrates. Sci. Total Environ. 2021, 779, 146398. [CrossRef]
  46. Lowe, C.N.; Butt, K.R.; Cheynier, K.Y.-M. Assessment of Avoidance Behaviour by Earthworms ( Lumbricus Rubellus and Octolasion Cyaneum ) in Linear Pollution Gradients. Ecotoxicol. Environ. Saf. 2016, 124, 324–328. [CrossRef]
  47. Sivakumar, S. Effects of Metals on Earthworm Life Cycles: A Review. Environ. Monit. Assess. 2015, 187, 530. [CrossRef]
  48. Syed, Z.; Alexander, D.; Ali, J.; Unrine, J.; Shoults-Wilson, W.A. Chemosensory Cues Alter Earthworm ( Eisenia Fetida ) Avoidance of Lead-Contaminated Soil: Chemosensory and Earthworm Avoidance. Environ. Toxicol. Chem. 2017, 36, 999–1004. [CrossRef]
  49. Spurgeon, D.J.; Weeks, J.M.; Van Gestel, C.A.M. A Summary of Eleven Years Progress in Earthworm Ecotoxicology. Pedobiologia 2003, 47, 588–606. [CrossRef]
  50. Laverack, M.S. Tactile and Chemical Perception in Earthworms —I. Responses to Touch, Sodium Chloride, Quinine and Sugars. Comp. Biochem. Physiol. 1960, 1, 155–163. [CrossRef]
  51. Laverack, M.S. Tactile and Chemical Perception in Earthworms —II. Responses to Acid PH Solutions. Comp. Biochem. Physiol. 1961, 1, 22–34.
  52. Stephenson, G.L.; Kaushik, A.; Kaushik, N.K.; Solomon, K.R.; Steele, T.; Scroggins, R.P. Use of an Avoidance-Response Test to Assess the Toxicity of Contaminated Soils to Earthworms. Adv. Earthworm Ecotoxicol. 1998, 67–81.
  53. Ma, W.-C.; Bonten, L.T.C. Bioavailability Pathways Underlying Zinc-Induced Avoidance Behavior and Reproduction Toxicity in Lumbricus Rubellus Earthworms. Ecotoxicol. Environ. Saf. 2011, 74, 1721–1726. [CrossRef]
  54. Fourie, F.; Reinecke, S.A.; Reinecke, A.J. The Determination of Earthworm Species Sensitivity Differences to Cadmium Genotoxicity Using the Comet Assay. Ecotoxicol. Environ. Saf. 2007, 67, 361–368. [CrossRef]
  55. Baird, D.J.; Van den Brink, P.J. Using Biological Traits to Predict Species Sensitivity to Toxic Substances. Ecotoxicol. Environ. Saf. 2007, 67, 296–301. [CrossRef]
  56. Ippolito, A.; Todeschini, R.; Vighi, M. Sensitivity Assessment of Freshwater Macroinvertebrates to Pesticides Using Biological Traits. Ecotoxicology 2012, 21, 336–352. [CrossRef]
  57. Klaassen, C.D. Absorption, Distribution, and Excretion of Toxicants. Casarett Doulls Toxicol. Basic Sci. Poisons 1991, 50–87.
  58. Langdon, C.J.; Hodson, M.E.; Arnold, R.E.; Black, S. Survival, Pb-Uptake and Behaviour of Three Species of Earthworm in Pb Treated Soils Determined Using an OECD-Style Toxicity Test and a Soil Avoidance Test. Environ. Pollut. 2005, 138, 368–375. [CrossRef]
  59. McKinney, M.L. Urbanization, Biodiversity, and Conservation. BioScience 2002, 52, 883. [CrossRef]
  60. Johnson, M.T.J.; Munshi-South, J. Evolution of Life in Urban Environments. Science 2017, 358, eaam8327. [CrossRef]
  61. Kamdem, C.; Fouet, C.; Gamez, S.; White, B.J. Pollutants and Insecticides Drive Local Adaptation in African Malaria Mosquitoes. Mol. Biol. Evol. 2017, 34, 1261–1275. [CrossRef]
  62. Sih, A.; Ferrari, M.C.O.; Harris, D.J. Evolution and Behavioural Responses to Human-Induced Rapid Environmental Change: Behaviour and Evolution. Evol. Appl. 2011, 4, 367–387. [CrossRef]
Figure 1. Schematic representation of the experimental design. The study consisted of a total of (i) 96 choice trials – i.e. eight trials per species (Apporectodea caliginosa, Apporectodea icterica and Allolobophora chlorotica) per origin (urban and rural) and per MTE exposure (M-/M+ and M-/M++), and 36 control trials – i.e. two trials per species per origin and per MTE exposure (M-, M+ and M++).
Preprints 74140 g001
Figure 2. MTE concentrations in natural soils. Mean ± se chromium, copper, nickel, lead, and zinc concentrations in the soils from rural and urban origins where earthworms were samples. Significant differences of MTE concentrations between the two origins are highlighted by asterisks; they account for the capture site.
Preprints 74140 g002
Figure 3. Health impairment. Mean ± se a) mobility (calculated as the number of non-overlapping locations at the end of a trial) in earthworms from rural and urban origin exposed to MTE-less (M-), -low (M+) and -rich soils (M++), b) gallery length in A. caliginosa, A. chlorotica and A. icterica exposed to MTE-less, -low and rich soils, and c) mass loss (calculated as the difference between post and pre-trial mass divided by pre-trial mass) in earthworms from rural and urban origin after exposure to MTE-less, -low and rich soils. Significant differences between species and MTE exposure (in b), and between MTE exposure (in c) are highlighted by different letters. Mobility did not significantly differ between MTE exposure, origin and species.
Preprints 74140 g003
Figure 4. MTE accumulation. Mean ± se chromium, copper, nickel, lead, and zinc concentrations in earthworms from rural and urban origin and exposed to MTE-less (M-), -poor (M+) and rich soils (M++). For graphical purpose, copper and lead concentrations have been divided by 10 and zinc concentrations by 100. For each MTE, significant differences of concentrations between MTE exposure (M-, M+ and M++) are highlighted by different letters. MTE concentrations did not vary according to earthworm origin.
Preprints 74140 g004
Figure 5. Habitat preference. Mean ± se proportion of a) locations, b) galleries in the MTE-enriched soil in earthworms from rural and urban origin and exposed to MTE-poor and –rich soils. Significant differences between MTE exposure are highlighted by different letters. Earthworm movements did not significantly vary according to earthworm origin and species.
Preprints 74140 g005
Figure 6. Specificity. Mean ± se specificity for the MTE-less soil in earthworms from rural and urban origin and exposed to MTE-poor and -rich soils. For graphical purpose, significant differences between MTE exposure and species are highlighted by different letters. However, only the simple effects of MTE exposure and species significantly explained specificity; the interaction between the two variables was not retained in the model.
Preprints 74140 g006
Figure 7. Choice mechanism. Mean ± se proportion of a) locations and b) galleries in the MTE-enriched, and of earthworms in the MTE-enriched soil according to c) earthworm species and d) origin in earthworms that visited both MTE-enriched and -less soils. For graphical purpose, significant differences between MTE exposure and earthworm origin, and MTE exposure and species are highlighted by different letters, respectively in a) and b). However, only the simple effects of MTE exposure and species significantly explained the proportion of galleries in the MTE-enriched soil; the interaction between the two variables was not retained in the model.
Preprints 74140 g007
Table 1. MTE concentrations in artificial soils.
Chromium Copper Lead Nickel Zinc
M- 5.5±0.2 (BDL) 5.5±5.5 (BDL) 38.8±6.3 (BDL) BDL (BDL) 12.5±12.5 (BDL)
M+ 6.2±0.4 (5.0) 42.0±3.0 (50.0) 154.3±9.8 (150.0) 2.9±2.8 (7.5) 106.0±7.0 (122.5)
M++ 7.1±0.1 (10.0) 69.5±7.5 (100.0) 243.8±28.8 (300.0) 7.9±0.0 (15.0) 189.5±12.5 (245.0)
Mean ± se measured (in black) and expected (in grey) MTE concentrations (in ppm) in artificial soils. Some MTE concentrations were below detection limit (BDL).
Disclaimer/Publisher’s Note: The statements, opinions and data contained in all publications are solely those of the individual author(s) and contributor(s) and not of MDPI and/or the editor(s). MDPI and/or the editor(s) disclaim responsibility for any injury to people or property resulting from any ideas, methods, instructions or products referred to in the content.
Copyright: This open access article is published under a Creative Commons CC BY 4.0 license, which permit the free download, distribution, and reuse, provided that the author and preprint are cited in any reuse.
Prerpints.org logo

Preprints.org is a free preprint server supported by MDPI in Basel, Switzerland.

Subscribe

© 2024 MDPI (Basel, Switzerland) unless otherwise stated