Submitted:
19 May 2023
Posted:
19 May 2023
Read the latest preprint version here
Abstract
As the demand for liquefied petroleum gas (LPG) continues to increase worldwide, more LPG facilities are being constructed. However, the design and manufacture of pressure vessels used to store dangerous liquids or pressurised fluids, such as LPG, has been a major cause of hazards, including explosions and leakage. In this study, we aim to address this issue by designing and analysing a vertical pressure vessel with a capacity of 10 m3 of pressurised LPG in accordance with the American Society of Mechanical Engineers (ASME) code.
Safety is the primary concern in designing pressure vessels due to the potential risks posed by accidents. Therefore, the main objective of this project is to design a pressure vessel that is safe from failure. The vessel is cylindrical with two elliptical heads, two nozzles, a manway and four leg supports, and we used Autodesk Inventor Professional 2023 for geometric modelling and Inventor Nastran for FEA analysis.
To investigate the displacements, deflections and Von-Mises stresses in the pressure vessel, we used the finite element method, and Autodesk Inventor Nastran was employed for the analysis. Our results showed that changes to the structure of the pressure vessel were needed to reduce stress in the structure. Specifically, the displacement showed an inverse relationship with the tank section shell thickness. Moreover, we observed that the factor of safety increased linearly with shell thickness.
We carefully considered permissible pressures and determined the required wall thickness to ensure acceptable maximum stresses. Our results indicate that the design is safe from failure, and the highest stresses are experienced by the manway followed by the shell, while the heads, nozzles and legs support experienced the lowest stresses. We also performed a theoretical calculation for the entire model and checked the results to ensure they were within the acceptable limits.
In summary, our study highlights the importance of designing pressure vessels in accordance with ASME codes to ensure safety and prevent hazards caused by improper design and manufacturing. By using the finite element method, we identified potential stress points in the pressure vessel and were able to make modifications to improve its safety.
Keywords:
pressure vessel:
; ASME code
; optimum design
; working pressure
; structural analysis
; finite element method
; autodesk inventor professional
1. Introduction
In the early 20th century, several catastrophic accidents involving steam boilers and pressurized vessels resulted in numerous fatalities. As a response, various states began to enact regulations regarding the construction of such vessels. However, the differing rules made it challenging to construct vessels for interstate commerce. In 1880, a group of interested parties sought help from the Council of the American Society of Mechanical Engineers (ASME) to develop standard specifications for steam boilers and pressure vessels. This led to the formation of the ASME in 1911.
The first code of rules for pressure vessels, titled "Rules for the Construction of Unfired Pressure Vessels," was published in 1925. Since then, the code has undergone several revisions and evolved into an eleven-section document with multiple subdivisions, parts, subsections, and mandatory and non-mandatory appendices.
Section VIII, Division 1 is used to design and construct almost all pressure vessels used in the process industry in the United States. A pressure vessel is a closed container that holds gases or liquids at a different pressure than the surrounding air. The cylindrical body of the vessel is capped at the ends with heads. Pressure vessels have various applications in both the private and industrial sectors. Steel pressure vessels are designed to work safely at a specific pressure and temperature, known as the "design pressure" and "design temperature," respectively.
However, poorly constructed vessels that cannot handle high pressure pose a serious safety risk. Therefore, there are regulations in place that dictate how pressure vessels should be made and certified to ensure safe operation.
Design codes like the ASME Boiler and Pressure Vessel Code in North America, the Pressure Equipment Directive of the EU (PED), the Japanese Industrial Standard (JIS), CSA B51 in Canada, AS1210 in Australia, and other international standards like Lloyd's and Germanischer Lloyd Lloyd, Det Norske Veritas, Stoomwezen, etc. Theoretically, pressure vessels can be almost any shape, but most are made of pieces of spheres, cylinders, and cones. More complicated shapes have always been harder to figure out how to use safely and are usually much harder to build. The best shape for a pressure vessel, from a theoretical point of view, would be a sphere (Yahya, et al., 2018).
A pressure vessel is a device that has a pressure difference inside it due to atmospheric pressure. As high operating pressures are dangerous, great care should be taken when designing the pressure vessels. Any mechanical structure will break if there are stresses in it. How long a pressure vessel lasts under cyclic load depends on the number of cycles it goes through and how hard the stress is (Tamboli, 2014).
Since it is assumed that the pressure vessel is a thin cylinder, the analysis follows the thin cylinder formulae. The modelling was done with a software called Autodesk Inventor Professional 2023, and a finite element analysis was done to find the places where stress was most concentrated. As expected, the highest stress level is at the point where the nozzle is attached. This is done to study how stress can build up when the end of a high-pressure vessel is connected to a cone-shaped nozzle. The main reason for this is that the cone-shaped nozzle has to be attached separately. This method would cause the pressure vessel and nozzle to have different shapes at the point where they connect (Niranjana, et al., 2018). The stress calculations were carried out using finite element method, and a parametric model was developed. Tests were carried out for various positions of the cylindrical nozzle on the pressure vessel along with multiple orientations of the connection instead of a central radial hole (Kumar, 2019). The tests confirmed that the actual stress value of the maximum allowable internal pressure is different for different attachment orientations, requiring further investigation to determine the most efficient connection.
The mesh resolution of a finite element model determines its accuracy. If the mesh is coarse, the results will be less effective. We eventually reach the point of diminishing returns, where the quality of the mesh has no significant effect on the accuracy of the results.
At this point, the mesh is said to have converged. As the mesh was refined, convergence was observed for all previously analysed models (Huda & Hani Ajani, 2015). The accuracy of the result improves as the number of nodes and elements increases. Based on the results of the analysis, the nozzle-to-pressure-vessel interface has the highest stress. Due to the abrupt change in geometry and stress level, a high-stress state of concentration develops. As has been observed, symmetry is a greater factor than certain nozzles. A symmetrical nozzle possesses extremely low stress and a low stress increment factor (Narale & Kachare, 2012).
Experiments and math have been used to figure out the stress intensity factor at places where a crack is spreading on the inside and outside of a cracked cylindrical pressure vessel. The results showed that the stress intensity factor goes up as the length of the crack gets longer. Strain gauges were used to measure the movements, and empirical formulas were used to figure out the stress intensity and correction factors. The results from theory and experiment matched up (Niranjana, et al., 2018).
In this study, the Inventor Nastran for finite element analysis is used to look at the parts of a pressure vessel. It talks about how to model different parameters in a cracked pressure vessel. It also gives a few rules for doing analysis with FEA, like "starting with a simple design" and "using closed-form solutions for analysis."
Devaraju & Pazhanivel, (2015) have studied stress analysis on pressure vessels by considering the internal pressure, self-weight, and the fluid weight. They have designed the pressure vessel using manual calculations and compared these computed stress values with the results obtained from the ANSYS software. They concluded that the stress acting on the designed pressure vessel's shell is much less than the allowable stress of the vessel material. Thus, the pressure vessel is safe for use.
Nitinchandra R et al. (2013) have investigated the pressure vessel for marine substation applications, considering different materials the stress analysis has been performed. Putting pressure vessels at different heights lets you think about the internal and external pressure of these different materials depths of the ocean from the sea surface using MATLAB software. The external pressure applied is caused by the pressure from the water at that depth and the pressure inside the ship caused by the gas inside. To balance the external pressure. They have concluded that the pressure vessel design will be helpful for marine applications.
Durga & Sachidananda H, (2019) has done research on design and analysis of pressure vessel using finite element method. They have sub-divided the vessel into smaller elements and applied the internal pressure to analyse the stress. They used principal stress theory and distortion energy theory for validating their design and the calculated results were compared with the results from the FEA software. They concluded that the maximum principal stress as per manual calculation was in line with the FEA results and hence the pressure vessel design considered was safe.
Amol et al. (2008) has done analysis on the pressure vessel. The selection of the material, design and stress calculation of the pressure vessel was done as per the ASME standards. They have also intended to prove that the multilayer pressure vessels can withstand a higher internal pressure rather than that of the solid wall. They have done the analysis of the pressure vessel considering different materials to reduce the cost of construction. They concluded that the maximum stress developed in pressure vessel was within the yield stress of the material.
Pendbhaje et al. (2018) has done research on design and analysis of the pressure vessel. Their focus is to analyse the safety parameters of the pressure vessel for a given working pressure. They have taken the main parameters that effect the safety of the pressure vessel like, material selection, design and fabrication. They have designed the pressure vessel using seamless pipe instead of making the shell using a plate. They concluded that the maximum working pressure considered was within the allowable limit.
Ţălu & Ţălu, (2018) have done analysis on pressure vessel to find the difference between flat head and hemispherical head. They have done the analysis considering different orientation and different number of saddle support. They concluded that the Von-Moses and normal stress of the pressure vessel are almost same for both flat head and hemispherical head whereas, the stress at the closure of flat head is found to be almost double on the hemispherical head vessel.
Wilde et al. (2000) has studied the design and analysis of full composite pressure vessel using FEA. They studied the different types of end domes for optimising the weight and material variation. They concluded that the composite material can be used for optimizing the weight in case of pressure vessels. Wadkar et al. has studied design and analysis of pressure vessel using ANSYS software. They studied the stress concentration of a pressure vessel considering the shell and end dome by comparing the results of ANSYS with the manual calculations. They concluded that the stress concentration was very less and the pressure vessel is safe for use in industries.
2. Materials and Methods by using (ASME Section VIII, Div1)
This code (standard) is used for designing vertical tanks (vessels), according to minimum tank parts must not fail due to design requirements. The specialised code for the vessels those used in the range of (0.1 MPa to 20 MPa) and most vertical vessels are used in this range selected (Moss, 2004). The cylindrical vertical pressure vessel is made up of the following parts: shell, head, nozzles, and base support. As conceptual design there are some initial details provided in the technical description of the required vertical pressure vessel as shown in Table 1. The pressure vessel must also include a manway, inlet and blowdown outlet. There are no interface requirements for these components to connect to.
The pressure vessel chosen for this study is a pressure vessel used to contain liquid propane gas (LPG). This pressure vessel has elliptical heads and is designed to be used in fixed location on legs support. The pressure vessel will have an inner shell diameter (d) mm and a shell length (L) mm as shown in Figure 1. The overall capacity of the tank is driven by the design pressure for the required amount of liquid to be stored. The requirement states 10,000 L of LPG, not exceeding 1.55 MPa maximum pressure.
Assuming the LPG is 100% liquid, the cylindrical body of the tank needs to have a volume of 10,000 L, or 10 cubic meters.
Design pressure is 10% over maximum operating pressure.
Based on maximum design operating pressure and using the following Table 2 for Optimum pressure vessel designs and the converted internal pressure, an L/D ratio of 3 is selected.
Optimum pressure vessel proportions are per the above Table 2 suggest a L/D Ratio of 3. The formula for volume is wrote as:
And formula for L/D Ratio is given:
Substituting L into Volume:
Now substituting r into Volume:
Therefore, this pressure vessel shall be of the following conceptual design. Assuming a usage factor of 0.85 for thermal expansion and vapour volume, the volume required is 11.76 m3. Initially assuming a cylinder with hemispherical ends (although for this capacity spherical vessel could be used). For an L/D of 3, the overall initial dimensions shall be 5.4 m in Length (cylinder length) and 1.75 diameter. This produces a volume of 11.59 m3 with an L/D of 3.08. Large LPG vessels are typically horizontal or spherical depending on the capacity however a vertical pressure vessel is required.
2.1. Mechanical properties of vessel material
Since LPG is flammable, low melting point materials such as aluminium and brass shall not be used as the main construction material. Therefore, a carbon steel or stainless steel shall be used.
Given that this is a large vessel (10,000 litres) of high capacity and high temperature, it is important to consider the hazards relating to safety. The ASME Boiler and Pressure vessel Code section VIII states that low-melting point materials should not be used. LPG itself has a very low ignition temperature which may compromise the vessel in a fire scenario. The vessel design must mitigate concentrated stress on the bottom end (since it is vertical) because LPG is almost twice as heavy as air, meaning LPG has a propensity to accumulate at lowest levels. The hemispherical ends are typically more expensive to produce, and the detailed design may allow for tori-spherical or ellipsoidal ends, which are more commonly used.
The full height of the vessel will likely exceed 6.5 m when legs are added, it would be advantageous to investigate the wind loads and seismic loads on the vessel however it is not required for this study.
The Explosives Act must be followed for this application because of the risk of fire and/or explosions. The flammability concentration with air for LPG is between 2% and 10% so suitable storage and usage if imperative.
The pressure vessel shall be mainly constructed using steel for its strength & weldability. Specifically, a carbon steel is to be used, SA-516 Gr70 Steel Plate. Mechanical Properties are shown below in Figure 2. This material complies with the regulations in ASME Section VIII, Div1 and material specification and properties are given in Table 3.
2.2. Shell Design
The ASME codes presents basic rules while designing shells based on the (Liu, et al., 2007). The thickness of these shells is main consideration, the welding operation on vessels is necessary too. For the required thickness, when the stress does not exceed the allowable stress.
Allowable stress is calculated as per the ASME standards (1/3.5) x Tensile strength (Jha, 2020). In this study tensile strength is 484 MPa, so (1 x 484)/3.5 = 138 MPa approx. Therefore, the allowable stress S for the SA-516 Gr70 Steel Plate is 138 MPa.
Note that: E = 1.0 if radiated test is used, meanwhile E = 0.7 is used if non-radiated tests are used.
In this study, it is selected E = 0.7, for non-radiated tests. The used thickness equations are given as below:
In this design study, is the case of circumference stresses (longitudinal welding), the variables are shown in Table 4.
Where:
ts = Shell thickness.
P = Designing pressure.
Ps = Maximum pressure
R = Internal radius.
d = Internal Diameter.
S = Maximum allowable stress.
E = Coefficient of connection of welding.

Table 4.
Variables & Dimensions.
| Variable | Value | Unit |
|---|---|---|
| Design Pressure, P | 1.705 | MPa |
| Inner Radius, R | 0.81 | m |
| Inner Diameter, d | 1.62 | m |
| Maximum Allowable Stress, S | 138 | MPa |
| Weld Efficiency, E | 0.7 | - |
| Corrosion Allowance | 0.003 | m |
The calculated design material thickness should be 14 mm. This is not a commonly available material, so it shall be rounded up to 14 mm thickness which is more readily available from suppliers.
2.2.1. Circumferential Stress
The formula for circumferential stress, can be written as following.
where:
σc = Circumferential/Hoop stress
P = Design pressure
d = Internal diameter
t = Wall thickness
2.2.2. Longitudinal Stress
The formula for longitudinal stress, can be written as following.
where:
σL = Longitudinal stress
P = Design pressure
d = Internal diameter
t = Wall thickness
2.2.3. Circumferential Strain
From the material properties of A516 Carbon Steel, grade 70, extracting the values of the modulus of elasticity, E = 200 GPa.
Then, using the formula for circumferential strain, it can be written as following.
where:
εC = Circumferential strain
σc = Circumferential stress
E = Modulus of elasticity
2.2.4. Longitudinal Strain
From the material properties of A516 Carbon Steel, grade 70, extracting the values of the modulus of elasticity, E = 200 GPa.
Then, using the formula for longitudinal strain, it can be written as following.
where:
εL = Longitudinal strain
σL = Longitudinal stress
E = Modulus of elasticity
2.2.5. Diameter Change
The formula for circumferential strain, can be written in another form as following.
Therefore, rearranging the equation 19 to define the diameter change, then, the change in diameter can be written as following.
where:
εC = Circumferential strain
δd = Change in diameter
d = Internal diameter of shell
2.2.6. Length Change
The formula for longitudinal strain, can be written in another form as following.
Therefore, rearranging the equation 21 to define the shell length change, then, the change in length can be written as following.
m = 1.193 mm (increase)
where:
εL = Longitudinal strain
δl = Change in length
d = Internal diameter of shell
2.3. Head Design
Most of used closing heads are curved to resist pressure, reduce thickness and cost reduction. There are many types of closing heads and mostly used is semi-elliptical head. In this study the base diameter to the high = D/h = 4/1. The head cover will consist of two main parts as shown in Figure 3.
Spherical radius = L = 0.9 x D = 0.9 x 1.62 = 1.458 m.
Radius of the neck = ri = 0.17 x D = 0.17 x 1.62 = 0.275 m.
For the required thickness, when the stress does not exceed the allowable stress.
Allowable stress is calculated as per the ASME standards (1/3.5) x Tensile strength (Jha, 2020). In this study tensile strength is 484 MPa, so (1 x 484)/3.5 = 138 MPa approx. Therefore, the allowable stress for the SA-516 Gr70 Steel Plate is 138 MPa.
The maximum pressure on the head will be 1.702 MPa.
Where:
th = Head thickness.
P = Designing pressure.
Ph = Maximum pressure.
S = Maximum allowable stress.
D = Internal diameter of tank body.
E = Coefficient of connection of welding.
2.4. Nozzle Design
The number of nozzles should be kept to a minimum to reduce the number of stress raisers. This leads to an increased risk of failure and therefore an increased risk of fire, explosion, or leakage. Initially selecting a 20 cm diameter nozzle. Therefore, with a tolerance of 12.5% and fillet of 10 mm. During providing the pressure vessels with nozzles, it is important to support these nozzles to avoid or prevent any failure. The type of nozzle and parameters is shown in Figure 4.
So, external nozzle diameter is = Dn = 177.5 mm. Nozzle thickness, as shown in the Figure 3, can be calculate as below.
where:
P = Design pressure.
S = Maximum allowable stress.
E = Coefficient of connection of welding.
R = Internal radius.
Dn = External nozzle diameter.
2.5. Nozzle Reinforcement
Various calculations can be done to approximate the minimum thicknesses of material required to support a nozzle in a pressure vessel, as follows.
Internal nozzle diameter
- Assuming corrosion allowance = 3 mm.
- Internal nozzle diameter on tank wall
- Actual nozzle thickness
Area of nozzle hole
- Assuming correction coefficient = 1.
- Area of connecting region
- Area of nozzle wall
- Y, Nozzle Height
where:
Dn = External nozzle diameter.
dn = Internal nozzle diameter.
ds = Diameter of nozzle on tank wall.
f = correction coefficient = 1.
ts = Required thickness of tank.
Ts = Actual body thickness.
tn = Required nozzle thickness.
Tn = Actual nozzle thickness.
rn = Radius of internal hole.
Ar = Area of nozzle hole.
As = Area of connecting region.
An = Area of nozzle wall.
2.6. Design of Gasket
As a result, this research study design shall progress with a nozzle diameter as calculated using the ASME Code, with internal diameter (dn) 142.7 mm.
- Gasket diameter
Assuming internal diameter of gasket (Gi) shall approximately match internal diameter of nozzle as shown in Figure 6 and based on instruction details on (BARNWELL, 2023) in Figure 5 , the gasket dimensions are as following.
- ○
- Internal diameter of the gasket (Gi) = 141 mm.
- ○
- External diameter of the gasket (Go) = 254 mm.
- ○
- Pitch Circle Diameter (P.C.D) = 216 mm.
- ○
- Number of holes = 8.
- ○
- Holes diameter = 22 mm.
Therefore,
- Hydrostatic End Force (H)
Where,
H = Hydrostatic pressure force.
Go = External diameter.
Pi = Design pressure.
2.7. Set-up of FE Model
The 3D modelling of a vertical pressure vessel was completed using Autodesk Inventor Professional 2023, with Finite Element Analysis (FEA) performed using Autodesk Inventor Nastran. Through careful analysis and comparison of mesh element numbers with equivalent stress in Table 5, it was observed that there was a slight difference in stress values until an element size 19. However, after further decreasing the element size, it was found that the equivalent stress did not change. Therefore, the 3D geometry model was meshed using tetrahedral mesh elements, resulting in a total of 591292 mesh elements with an element size of 18 mm. Figure 7 and Figure 8 provide visual representations of the 3D modelling and meshing of the pressure vessel. Overall, this process ensures accurate and reliable FEA analysis results.
The pressure vessel under analysis is designed for a pressure of 1.705 MPa, with a uniform thickness of 14 mm throughout the vessel. To achieve accurate results with minimal computation time, the model is analysed using different element sizes, with the size selected based on satisfactory accuracy. The analysis begins with an axisymmetric analysis of the pressure vessel, which includes hemispherical heads, a cylindrical shell, and leg supports. In terms of boundary conditions, the vessel is supported at the end corners, with an internal pressure of 1.705 MPa applied at the inner surface. This finite element model accurately captures the geometry and material properties of the pressure vessel, allowing for reliable and precise analysis results. All parts of vessel have been drawn after finishing all designing calculations. The 3D solid modelling and mesh view of vertical pressure vessel are shown in Figure 9 and Figure 10.
A fixed constraint was placed on the base of each leg, with a gravitational acceleration downwards of 9.8066 m/s2. A fixed pressure was setup on the internal faces of the vessel using the design pressure stated throughout, this was 1.705 MPa. Finally, a hydrostatic pressure was introduced to represent the fluid weight within the vessel as though filled to 100% capacity of 10,000 L.
3. Results Discussion and Validation
Autodesk Inventor Professional 2023 (Student Edition Static Structural) is an incredibly useful software tool for 3D modelling and stress analysis, which is a critical step in designing pressure vessels. By analysing the stresses and deformation caused by inner pressure, as well as the weight of the vessel and contained fluid, engineers can identify weaknesses in the design and gain confidence in its strengths.
This software offers a range of powerful features for stress analysis, including the ability to model the vessel in three dimensions, specify boundary conditions, and use equations to calculate total deformation and equivalent stress. By using a numerical analysis method, engineers can simulate the behaviours of the pressure vessel under different conditions, giving them the confidence to move forward with the design.
In this study, the boundary conditions set include a constant pressure and a hydrostatic pressure induced by the contained fluid. These conditions are appropriate for accurately modelling the stresses and deformation of the pressure vessel. The design pressure of 1.705 MPa, which is the total pressure vessel, has also been specified. This information is important for ensuring that the design meets safety standards and can withstand the intended use.
Overall, Autodesk Inventor Professional 2023 and especially Autodesk Inventor Nastran provides engineers with a powerful tool for stress analysis in pressure vessel design, helping to ensure that the resulting designs are safe, reliable, and effective.
The below images show simulation results for the static structural analysis of the design. Equivalent stress (von mises), normal and shear stress, displacement along y-axis and displacement along x-axis are showing in Figure 12, Figure 13, Figure 14, Figure 15 and Figure 16 respectively. Instead, the simulation results of their maximum values are summarised in Table 6.
Figure 9.
Equivalent stress, Von Mises.
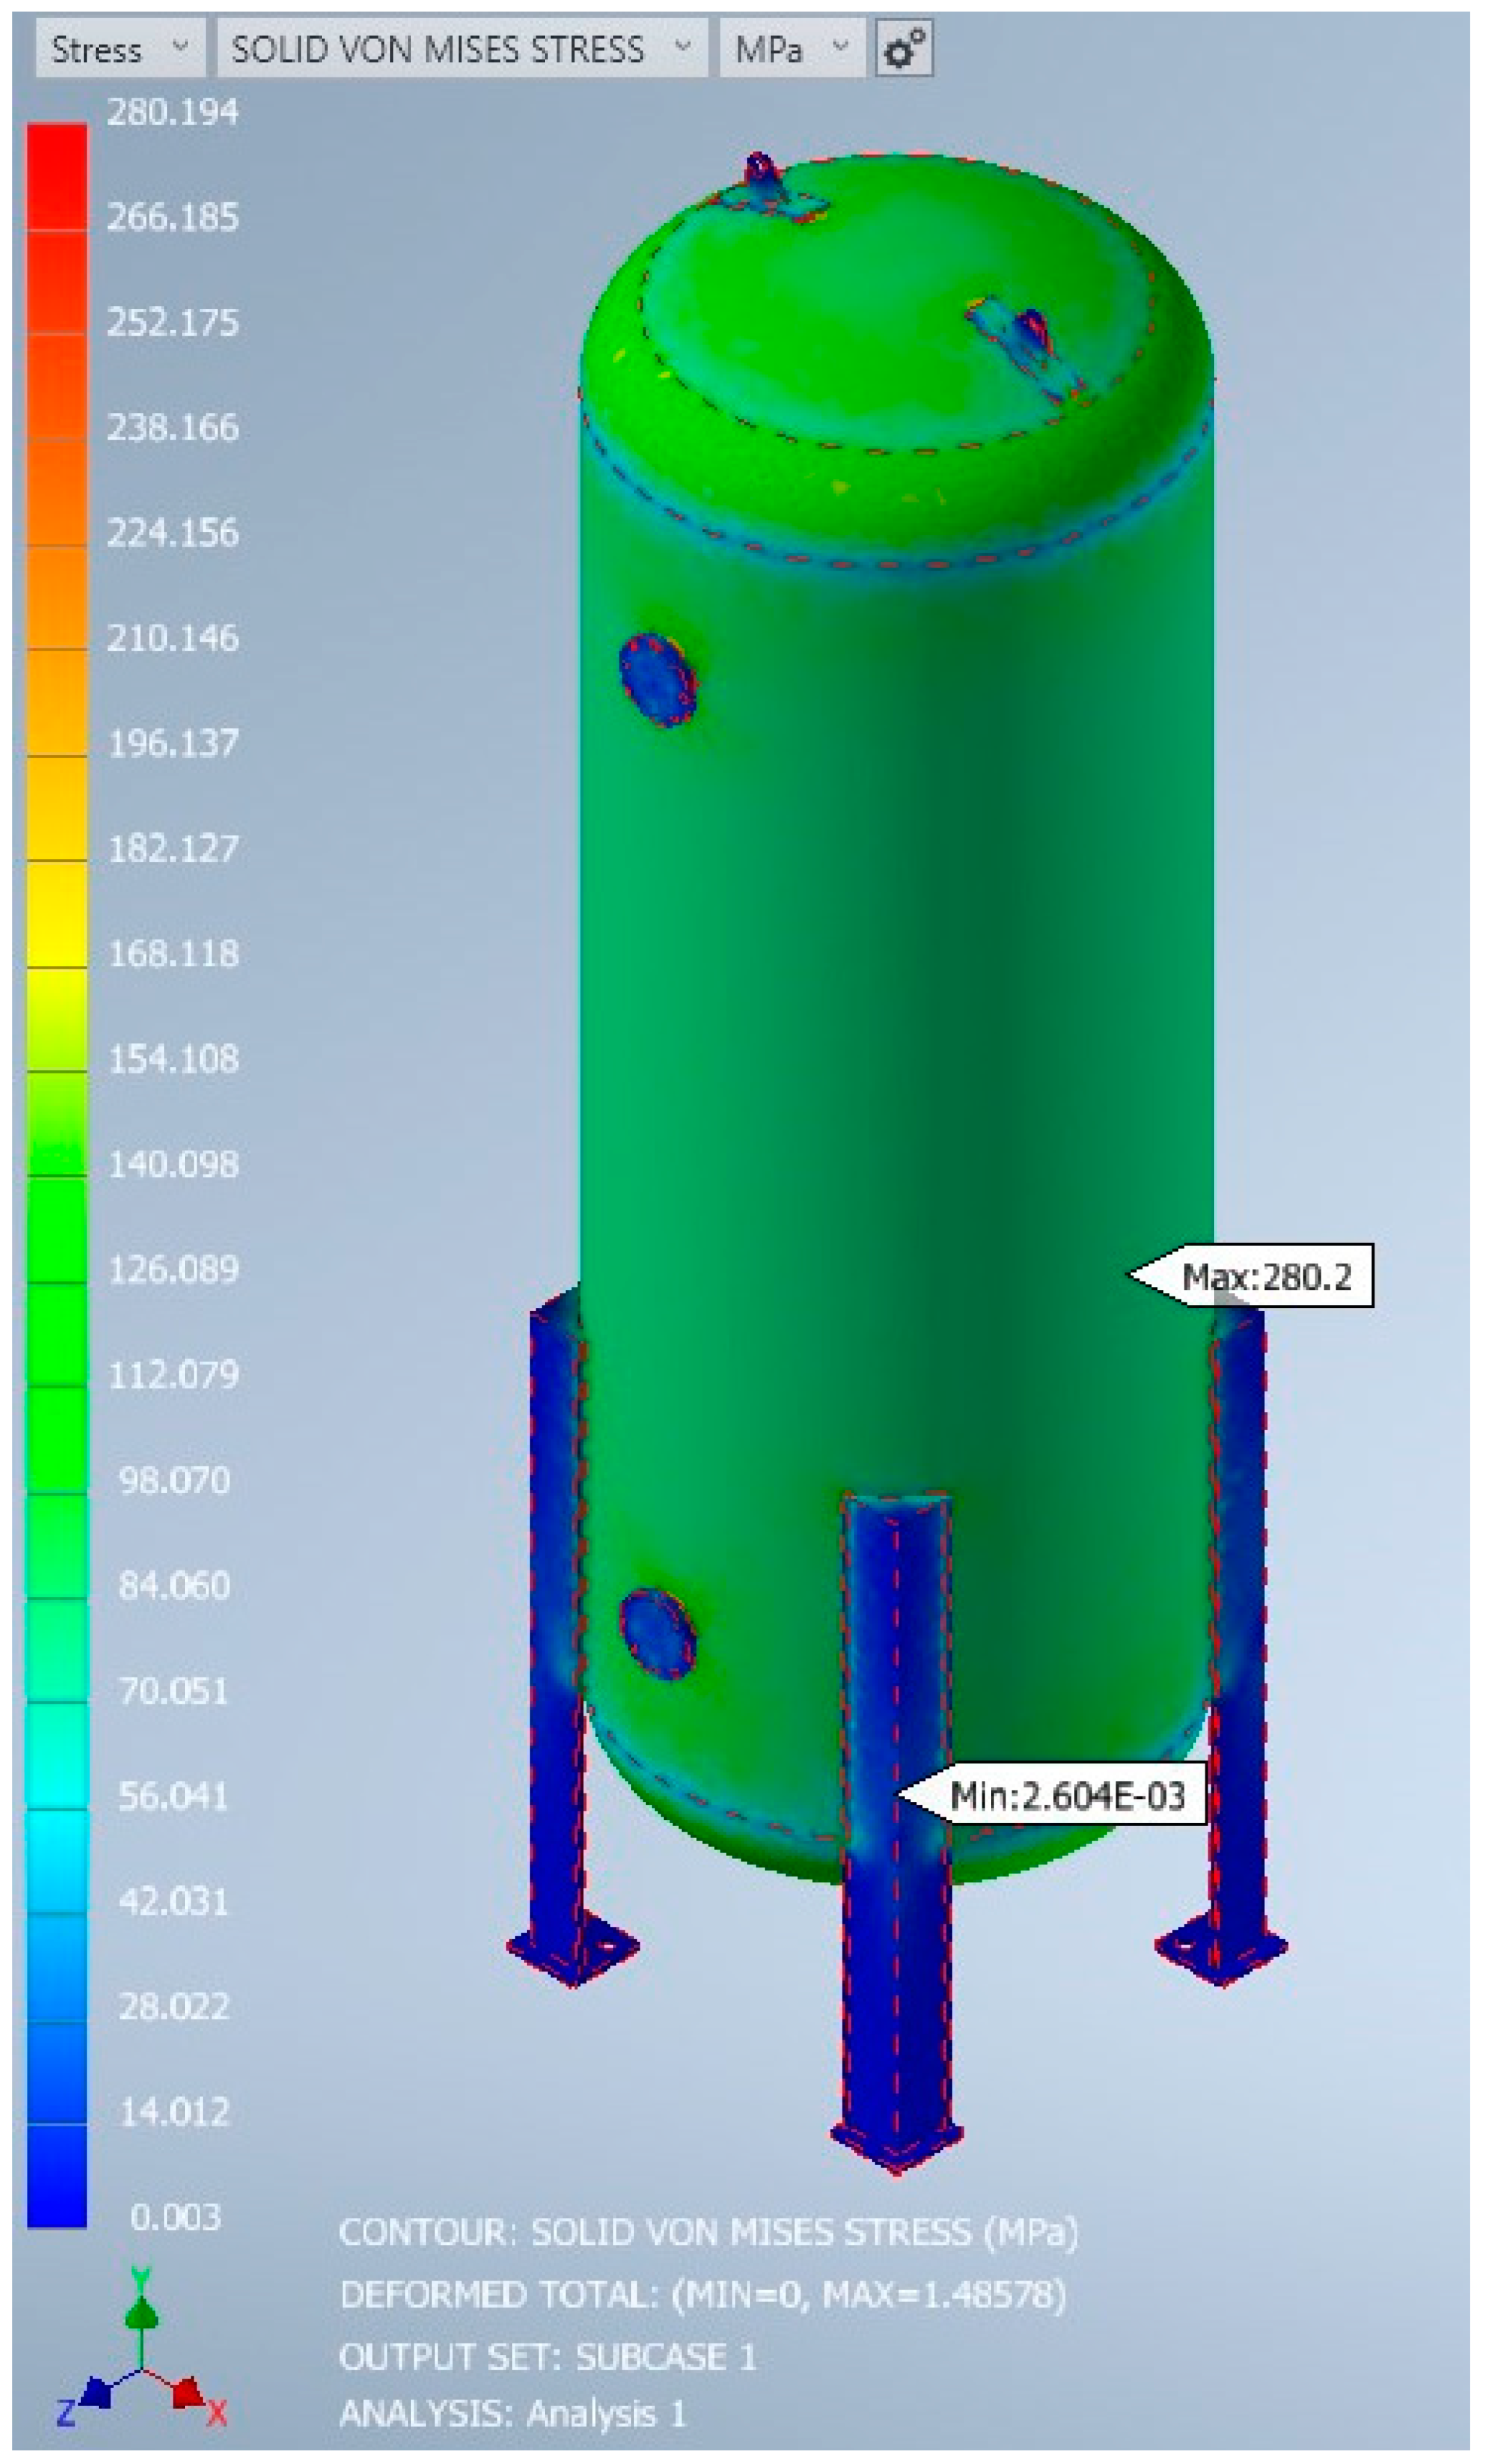
Figure 10.
Z -Normal Stress.
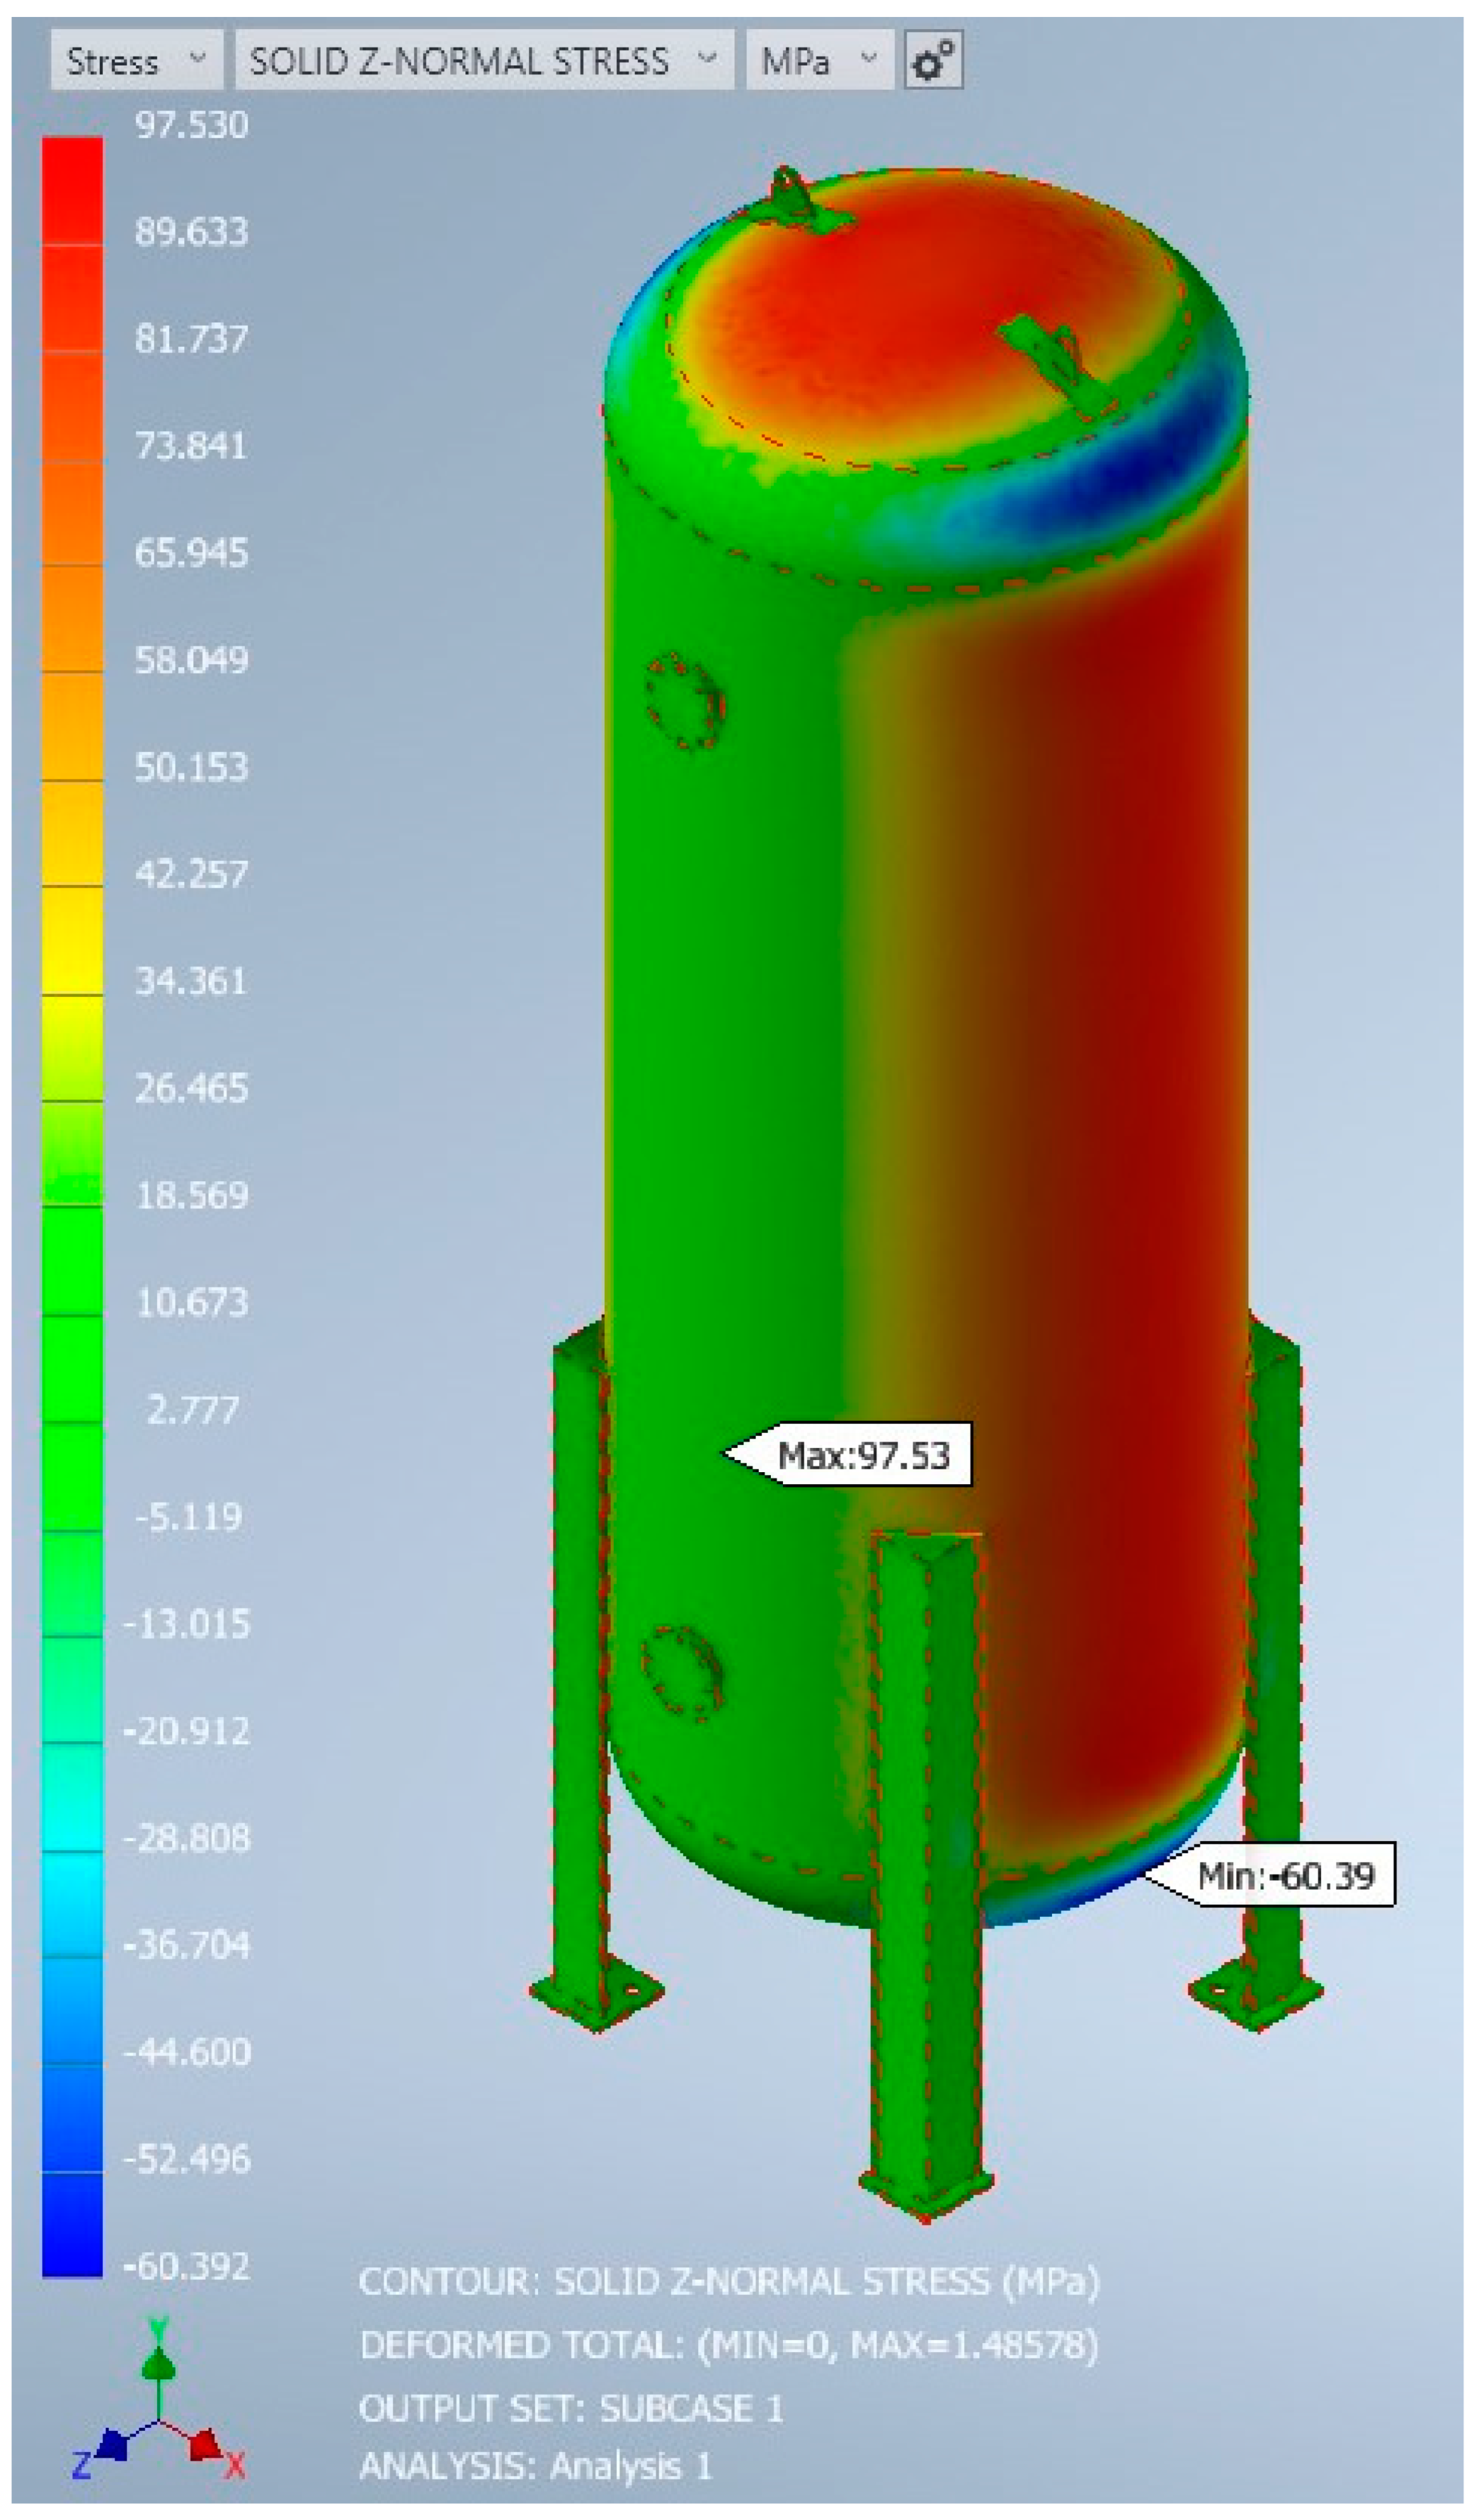
Figure 11.
YZ- Shear Stress.
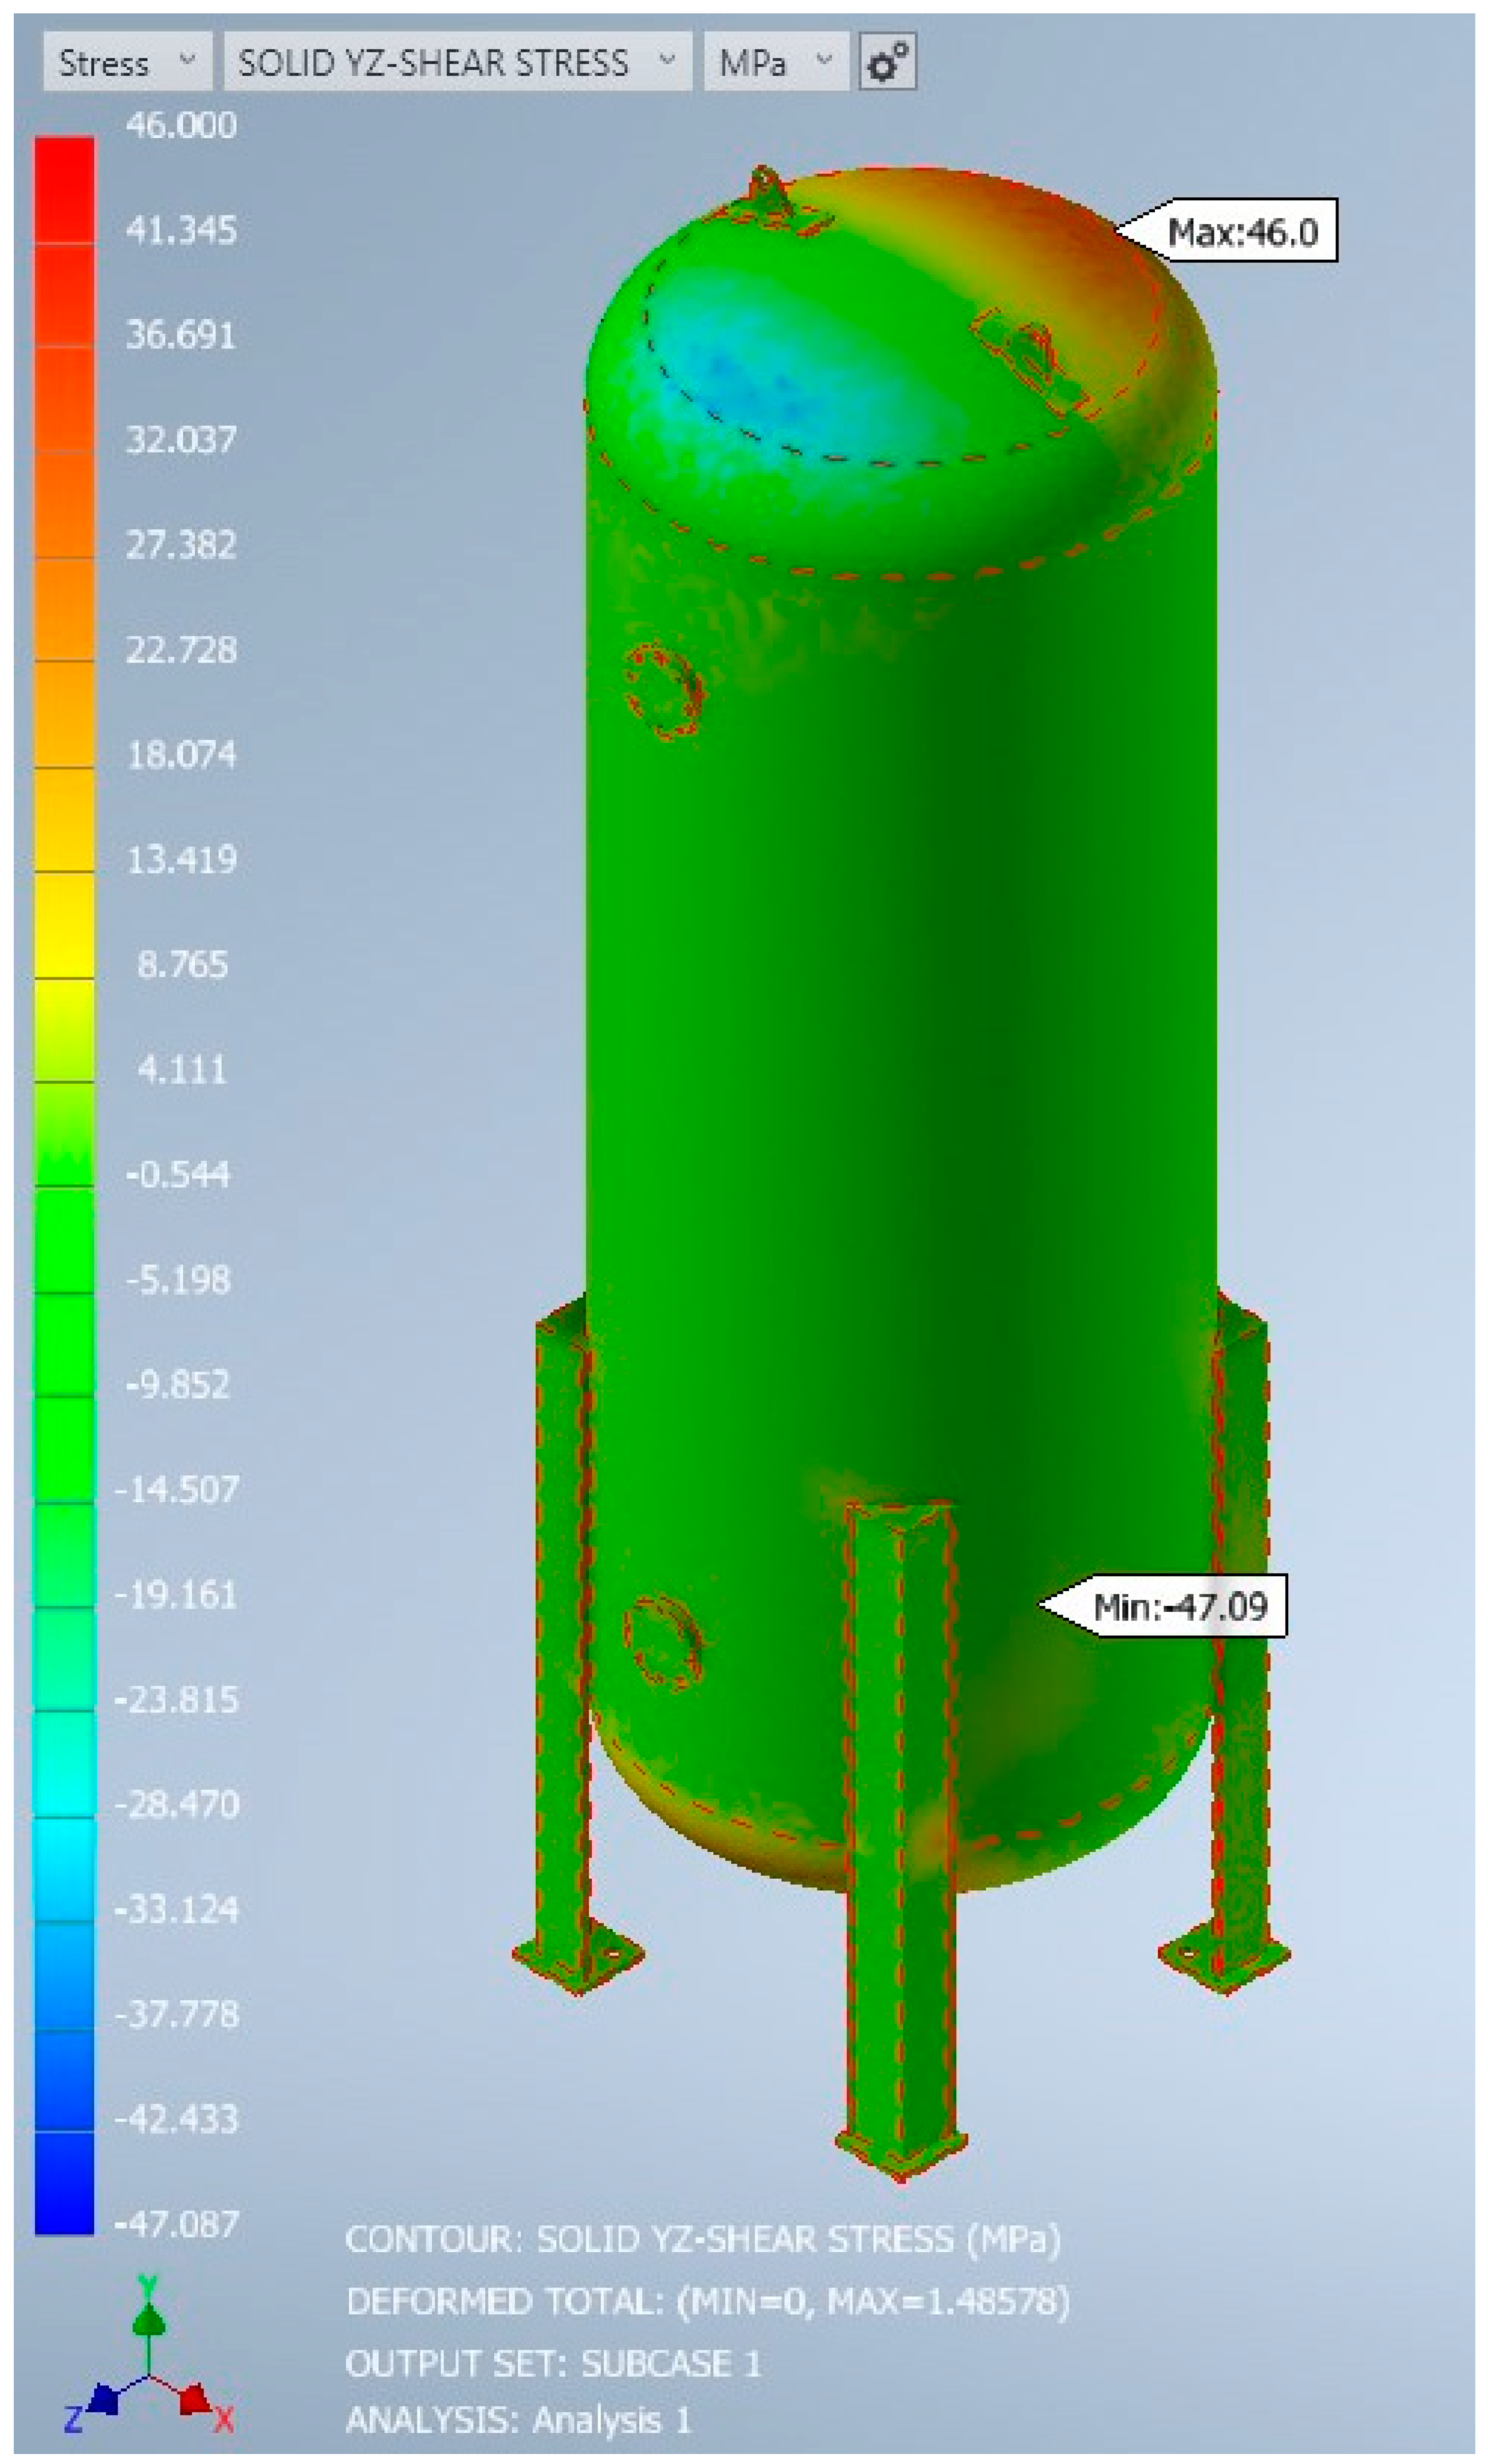
Figure 12.
Displacement along y axis.
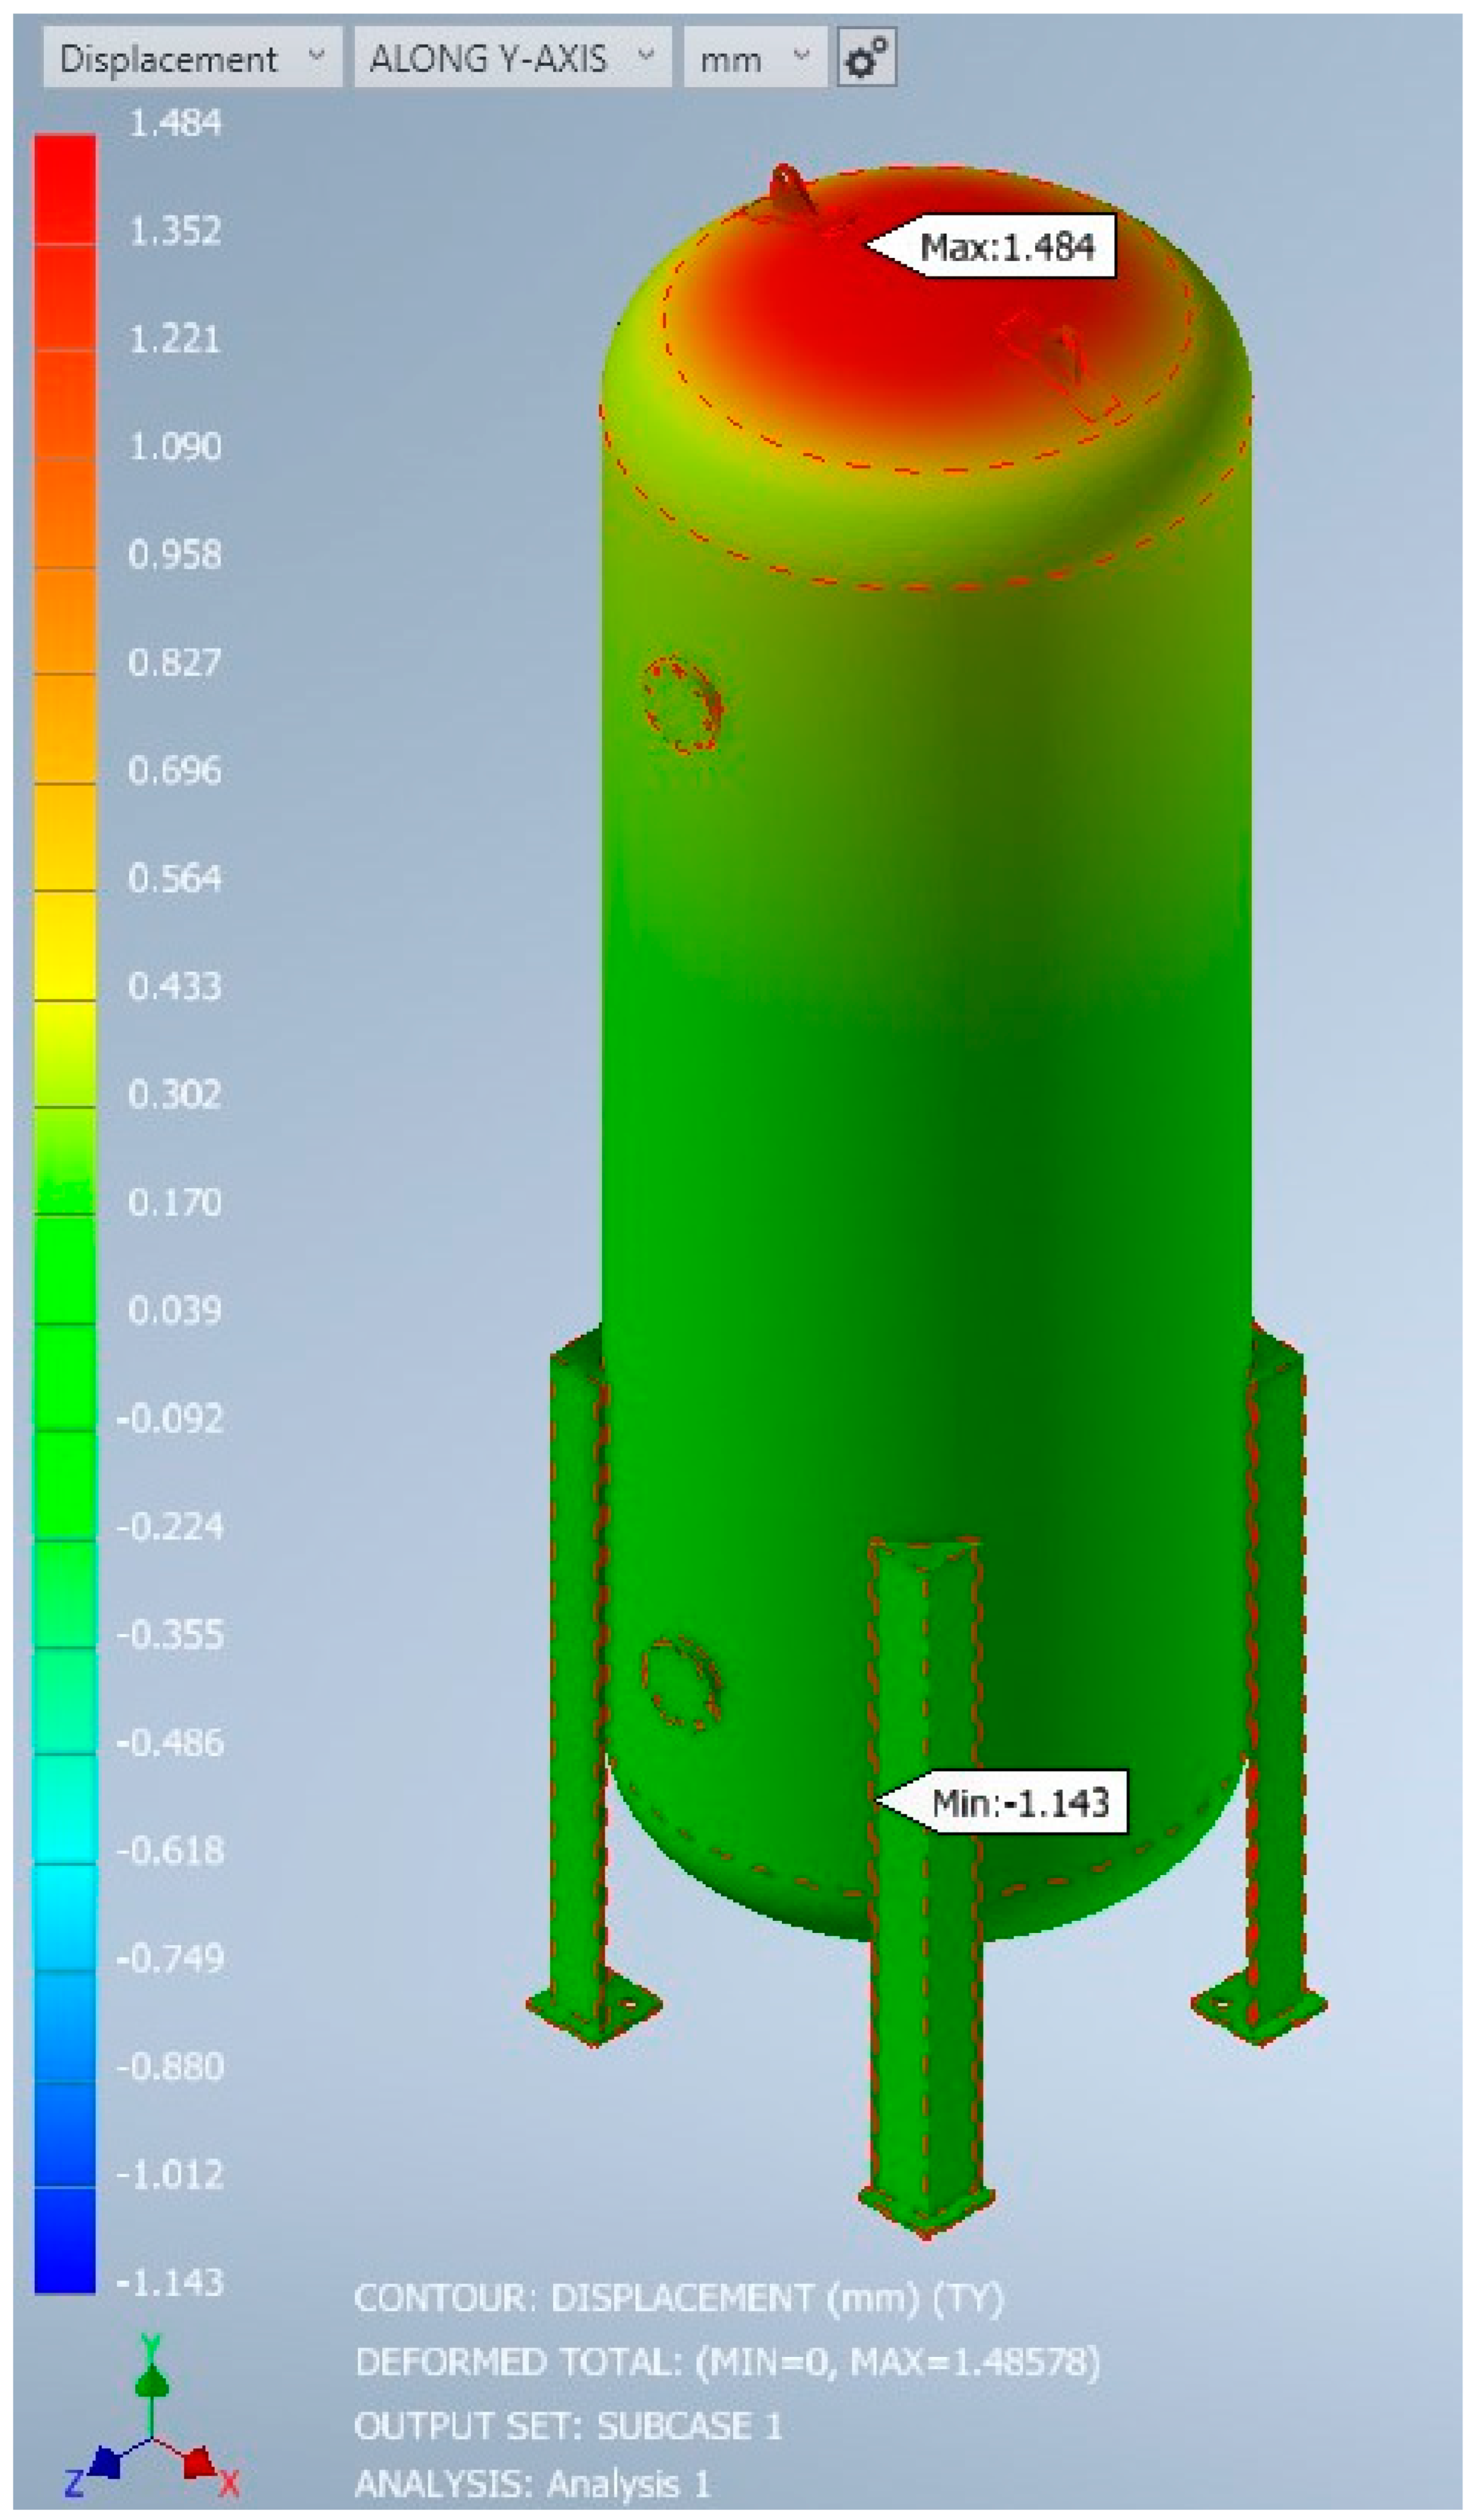
Figure 13.
Displacement along x axis.
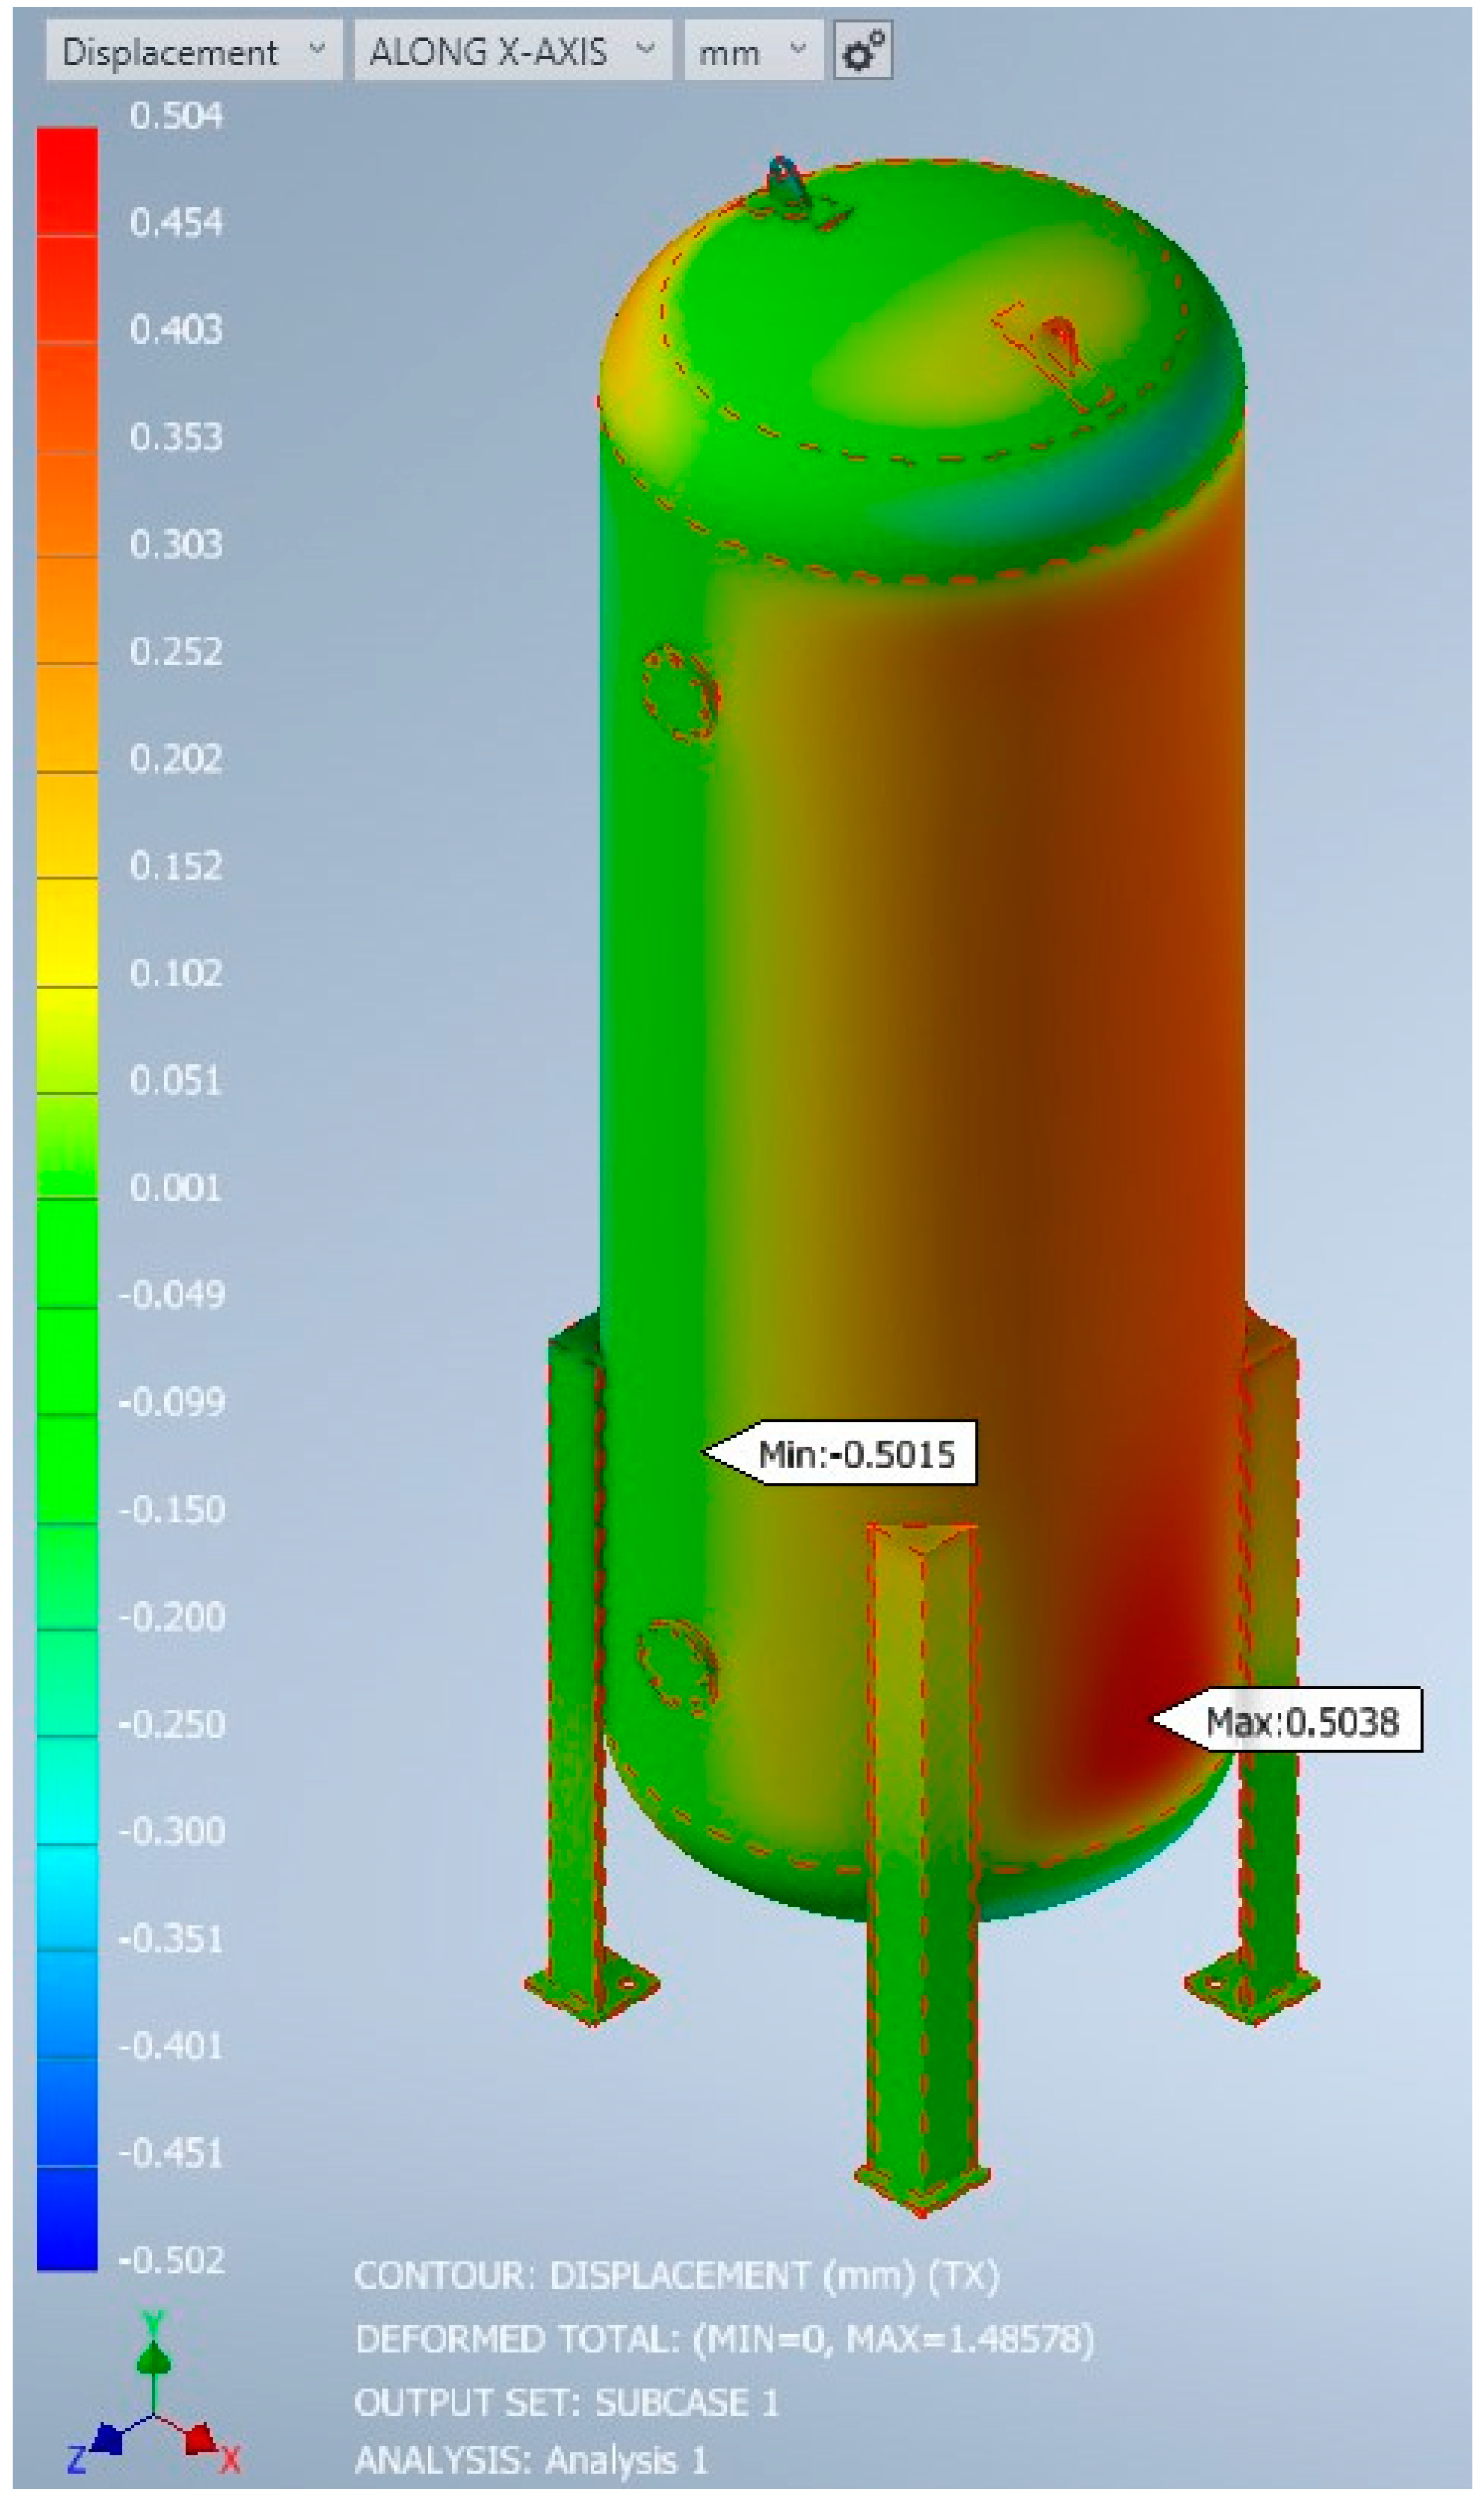
The simulation results are positive, with most stress & strain values lying within the safe operating limits of the vessel material. There is some concern to be raised around the peak values however, these have been investigated. The stresses and displacement values all lie within the required boundaries for material conditions. When comparing the longitudinal and hoop stress values (captured from the results using a stress probe in respective directions), it seems the initial calculations values are close and similar. The highest equivalent stress value experienced by the pressure vessel is 42.228% difference with the equivalent stress value as shown in the Figure 12. It is showing that is lower than the maximum tensile strength of the material, which is 485 MPa.
Overall, a thorough validation of an FEA model for the design and analysis of a typical vertical pressure vessel should involve a combination of theoretical analysis and sensitivity analysis (FEA results) to ensure that the model is accurate, reliable, and representative of the actual physical system. When validating a finite element analysis (FEA) model for the design and analysis of a typical vertical pressure vessel, it is important to consider a sensitivity analysis. FEA results conduct a sensitivity analysis to determine the impact of changes in input parameters, such as material properties or boundary conditions, on the results of the FEA model. This can help identify the most critical parameters and ensure that the FEA model is robust and reliable.
The stress components x, xy, y, z, xz, or yz in an Inventor Nastran FEA model stress analysis can be used to estimate the longitudinal and circumferential stresses in a pressure vessel, but they must be transformed into the appropriate coordinate system.
In general, the yz-shear stress component is aligned with the longitudinal axis of the pressure vessel, the y stress component is aligned with the radial direction, and the z-normal stress component is aligned with the circumferential direction.
To compare the circumferential stress component from Inventor Nastran with the analytical solution, need to identify which stress component corresponds to the circumferential direction. Typically, this will be the z-normal stress component. Therefore, it should compare the z-normal stress component from the Inventor Nastran analysis with the circumferential stress calculated from the analytical solution.
The third principal stress is a measure of the maximum shear stress in the material, and it is an important factor in determining the failure of the material under load. The longitudinal stress, on the other hand, is a type of stress that occurs in the direction of the vessel's longitudinal axis due to the applied pressure.
Compare the Von Mises stress obtained from the FEA model results with the yield strength of the material to ensure that the pressure vessel is not over-stressed is another way of validation techniques.
Also, it will be useful to compare the deformation or displacement of the pressure vessel obtained from the analytical calculation with the deformation obtained from the FEA model results.
In summary, comparing analytical calculations mentioned above with FEA model results are valid techniques to validate the FEA model, but they should be complemented by other validation techniques for a more comprehensive validation such as comparing strain, and experimental data.
The acceptable margin of error for the validation of a typical vertical pressure vessel using FEA depends on various factors such as the design requirements, safety factors, and industry standards. Typically, the validation process in this study aims to ensure that the FEA results are within an acceptable range of error compared to the analytical calculation.
It is important to note that the margin of error should be evaluated in the context of the entire validation process, which may include multiple stress components, material properties, loading conditions, and other factors. Therefore, it is essential to follow established industry standards and guidelines and consult with subject matter experts to determine the acceptable margin of error for a specific application.
A general guideline for the acceptable margin of error is that the FEA results should be within 5-10% of the analytical or experimental results. However, this can vary based on the specific application and industry standards. For example, some industries may require a tighter tolerance for safety-critical applications, while others may allow for a higher degree of error for non-critical applications.
In Table 7 has been summarised the analytical and simulated results together with a percentage difference comparison. As can be seen in the Table 7, the stresses values all lie within the required boundaries for material conditions. After comparing the longitudinal and hoop stress values obtained from the simulation using a stress probe in respective directions, it appears that the initial calculations are within an acceptable margin of error. However, there is a significant discrepancy between the calculated and simulated results in terms of displacement along the y-axis and x-axis. The percentage difference values for these displacement results are greater than the acceptable margin of error.
One possible reason for this discrepancy is the complexity of the geometry considered in the simulation. While the initial calculations may have been based on simple stress and strain calculations for the material, the simulation considers a more complex set of factors that may be contributing to the discrepancies in the displacement results. For example, the simulation may be accounting for more intricate load patterns or other factors that were not included in the initial calculations.
Despite these discrepancies, the simulation results can still be useful for identifying potential issues and areas for improvement in the design. By analysing the differences between the calculated and simulated results, engineers can gain valuable insights into the behaviours of the system and make necessary adjustments to improve the design.
Overall, it's important to keep in mind the limitations of any simulation or calculation method, and to use multiple approaches to validate results and ensure the accuracy of the final design.
Table 7.
Analytical and Simulation Results Comparison.
| VARIABLE | CALCULATED VALUE | SIMULATED VALUE | % DIFFERENCE |
|---|---|---|---|
| σc/Z-Normal Stress (MPa) | 98.646 | 97.53 | 1.131 |
| σL/yz-Shear Stress (MPa) | 49.323 | 46 | 6.737 |
| Displacement along y-axis (mm) | 1.193 | 1.484 | 19.609 |
| Displacement along x-axis (mm) | 0.798 | 0.504 | 36.842 |
The Von-Mises stress and displacement in the Liquefied petroleum gas (LPG) pressure tank under pressure distribution and ambient condition has been obtained using the finite element. A minimum plate thickness was deduced for pressure value of 1.55 MPa. At this minimum plate thickness, the Von-Mises stresses were found to be lower than the tank material allowable stress (485 MPa ). The finite element Von-mises stress developed during simulation were in the same range with the ASME Von-mises. The range of thickness and stress follow ASME section VIII division 1 part ULT.
The vessel material ASTM A516 Grade 70 already has a factor of safety of 3.5; therefore, design consideration should include material's yield and allowable stress and factor of safety greater than 3.5. For this research work, there are different possible scenarios. Once the boundary condition changes, the result will change, therefore, each should be treated as a case study. The effect of weldment along the seams of the vessel was not carried out in this work.
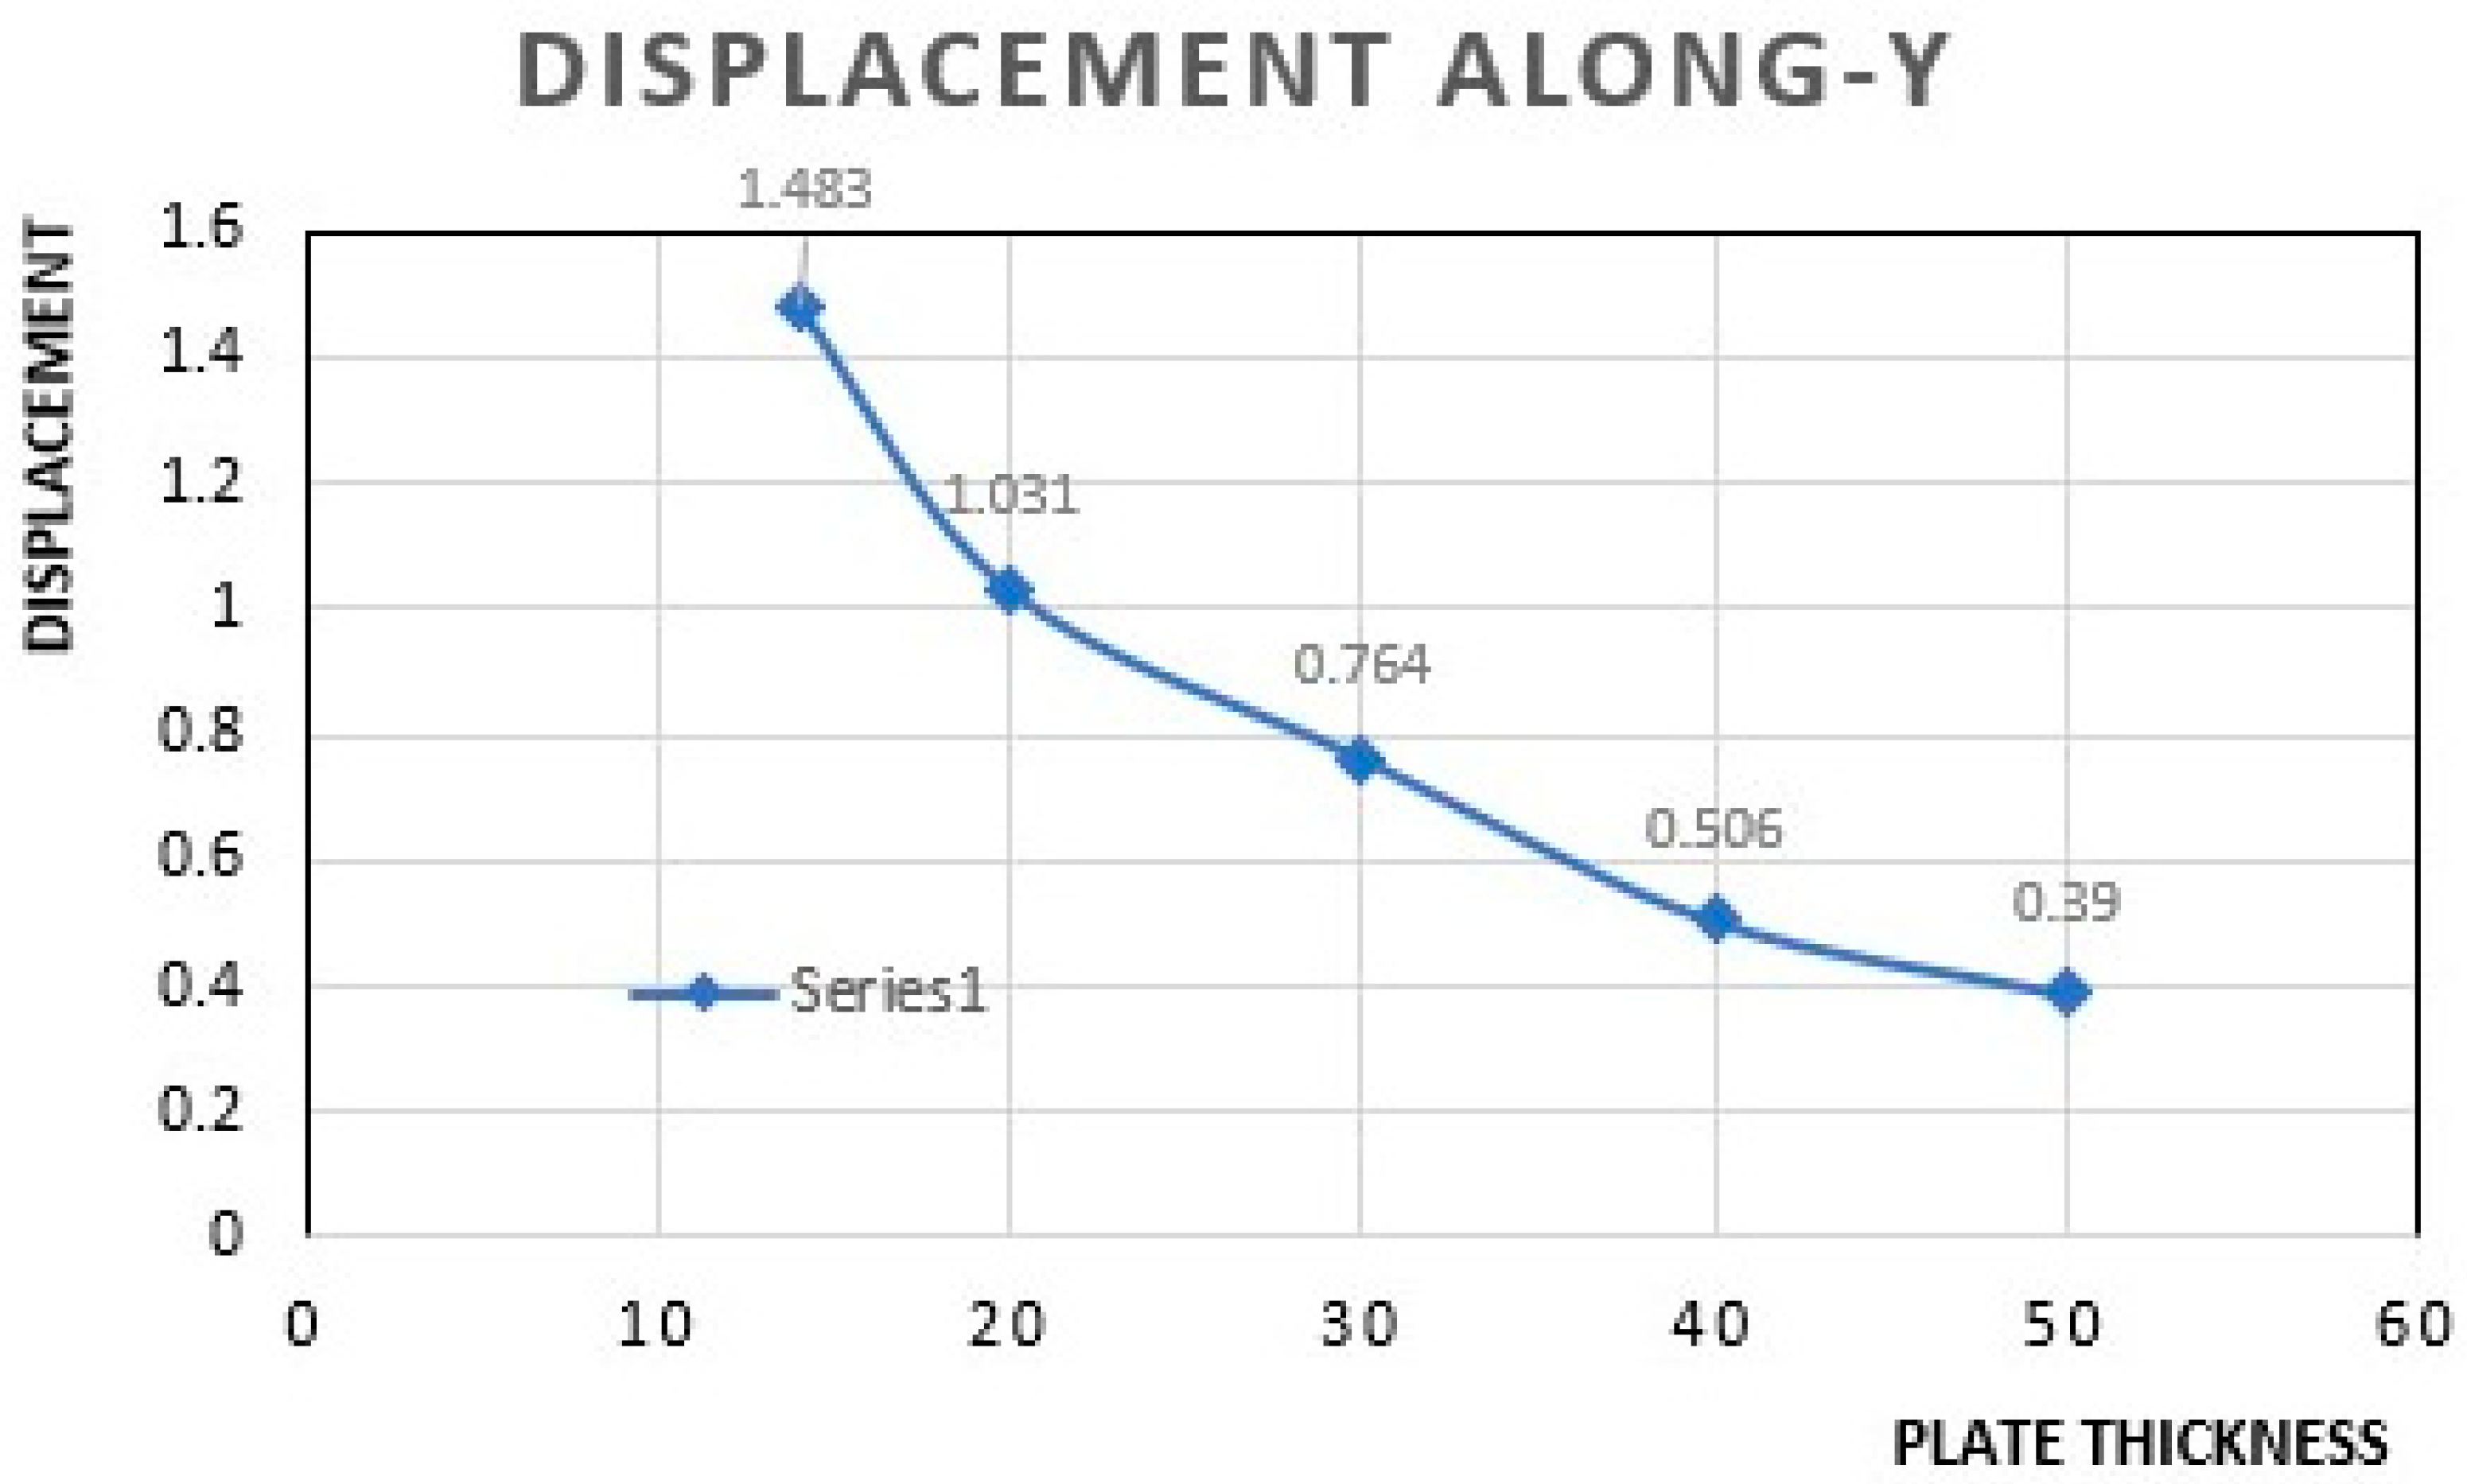
Table 8, is showing a summary of von mises, factor of safety and displacement FEA values extracted for different plate thickness. These FEA values has been represented also graphically as shown in Figure 14, von-Mises Stress (stress developed) versus thickness, in Figure 15, factor of safety at different plate thickness and in Figure 16, displacement along-Y-axis versus plate thickness.
Figure 14 shows the nonlinear relationship between stress and plate thickness. It also shows the convergence of finite element von-mises stress (stress developed) and ASME von-mises stress. The inverse relationship between thickness and stress is due to the disparity between circumferential stress (hoop stress) and plate thickness. Increasing the LPG pressure tank plate thickness decreases the displacement and von-mises stress as presented in Figure 16 and in Figure 14. The plate material (ASTM A516 Grade 70) of the LPG tank already has a factor of safety of 3.5.
For the range of thicknesses considered as shown in Table 8, 14 mm thickness and below will cause catastrophic failure if the LPG pressure tank is to operate at 1.55 MPa and 60 oC, since their factor of safety is less than 3.5 (material's factor of safety). At 50 mm thickness and above, the tank material will not yield (failure will not occur) since this range of thickness offers factor of safety greater than 3.5. Since the vessel material is isotropic in nature, increasing plate thickness will keep the hoop stress/circumferential stress below the material yield stress, therefore, it will be twice as strong in the axial direction. The major disadvantage is the increase in weight of the vessel.
Table 8.
FEA stress Factor of Safety and Displacement along y-axis at different plate thickness.
| Plate Thickness (mm) | Von-Mises Stress (MPa) | Factor of Safety | Displacement along y-axis (mm) |
|---|---|---|---|
| 14 | 280.194 | 1.054 | 1.483 |
| 20 | 238.339 | 1.284 | 1.031 |
| 30 | 155.522 | 1.765 | 0.764 |
| 40 | 129.5 | 2.428 | 0.506 |
| 50 | 106.803 | 3.008 | 0.39 |
Figure 14.
FEA Von-Mises Stress (stress developed)Versus thickness.
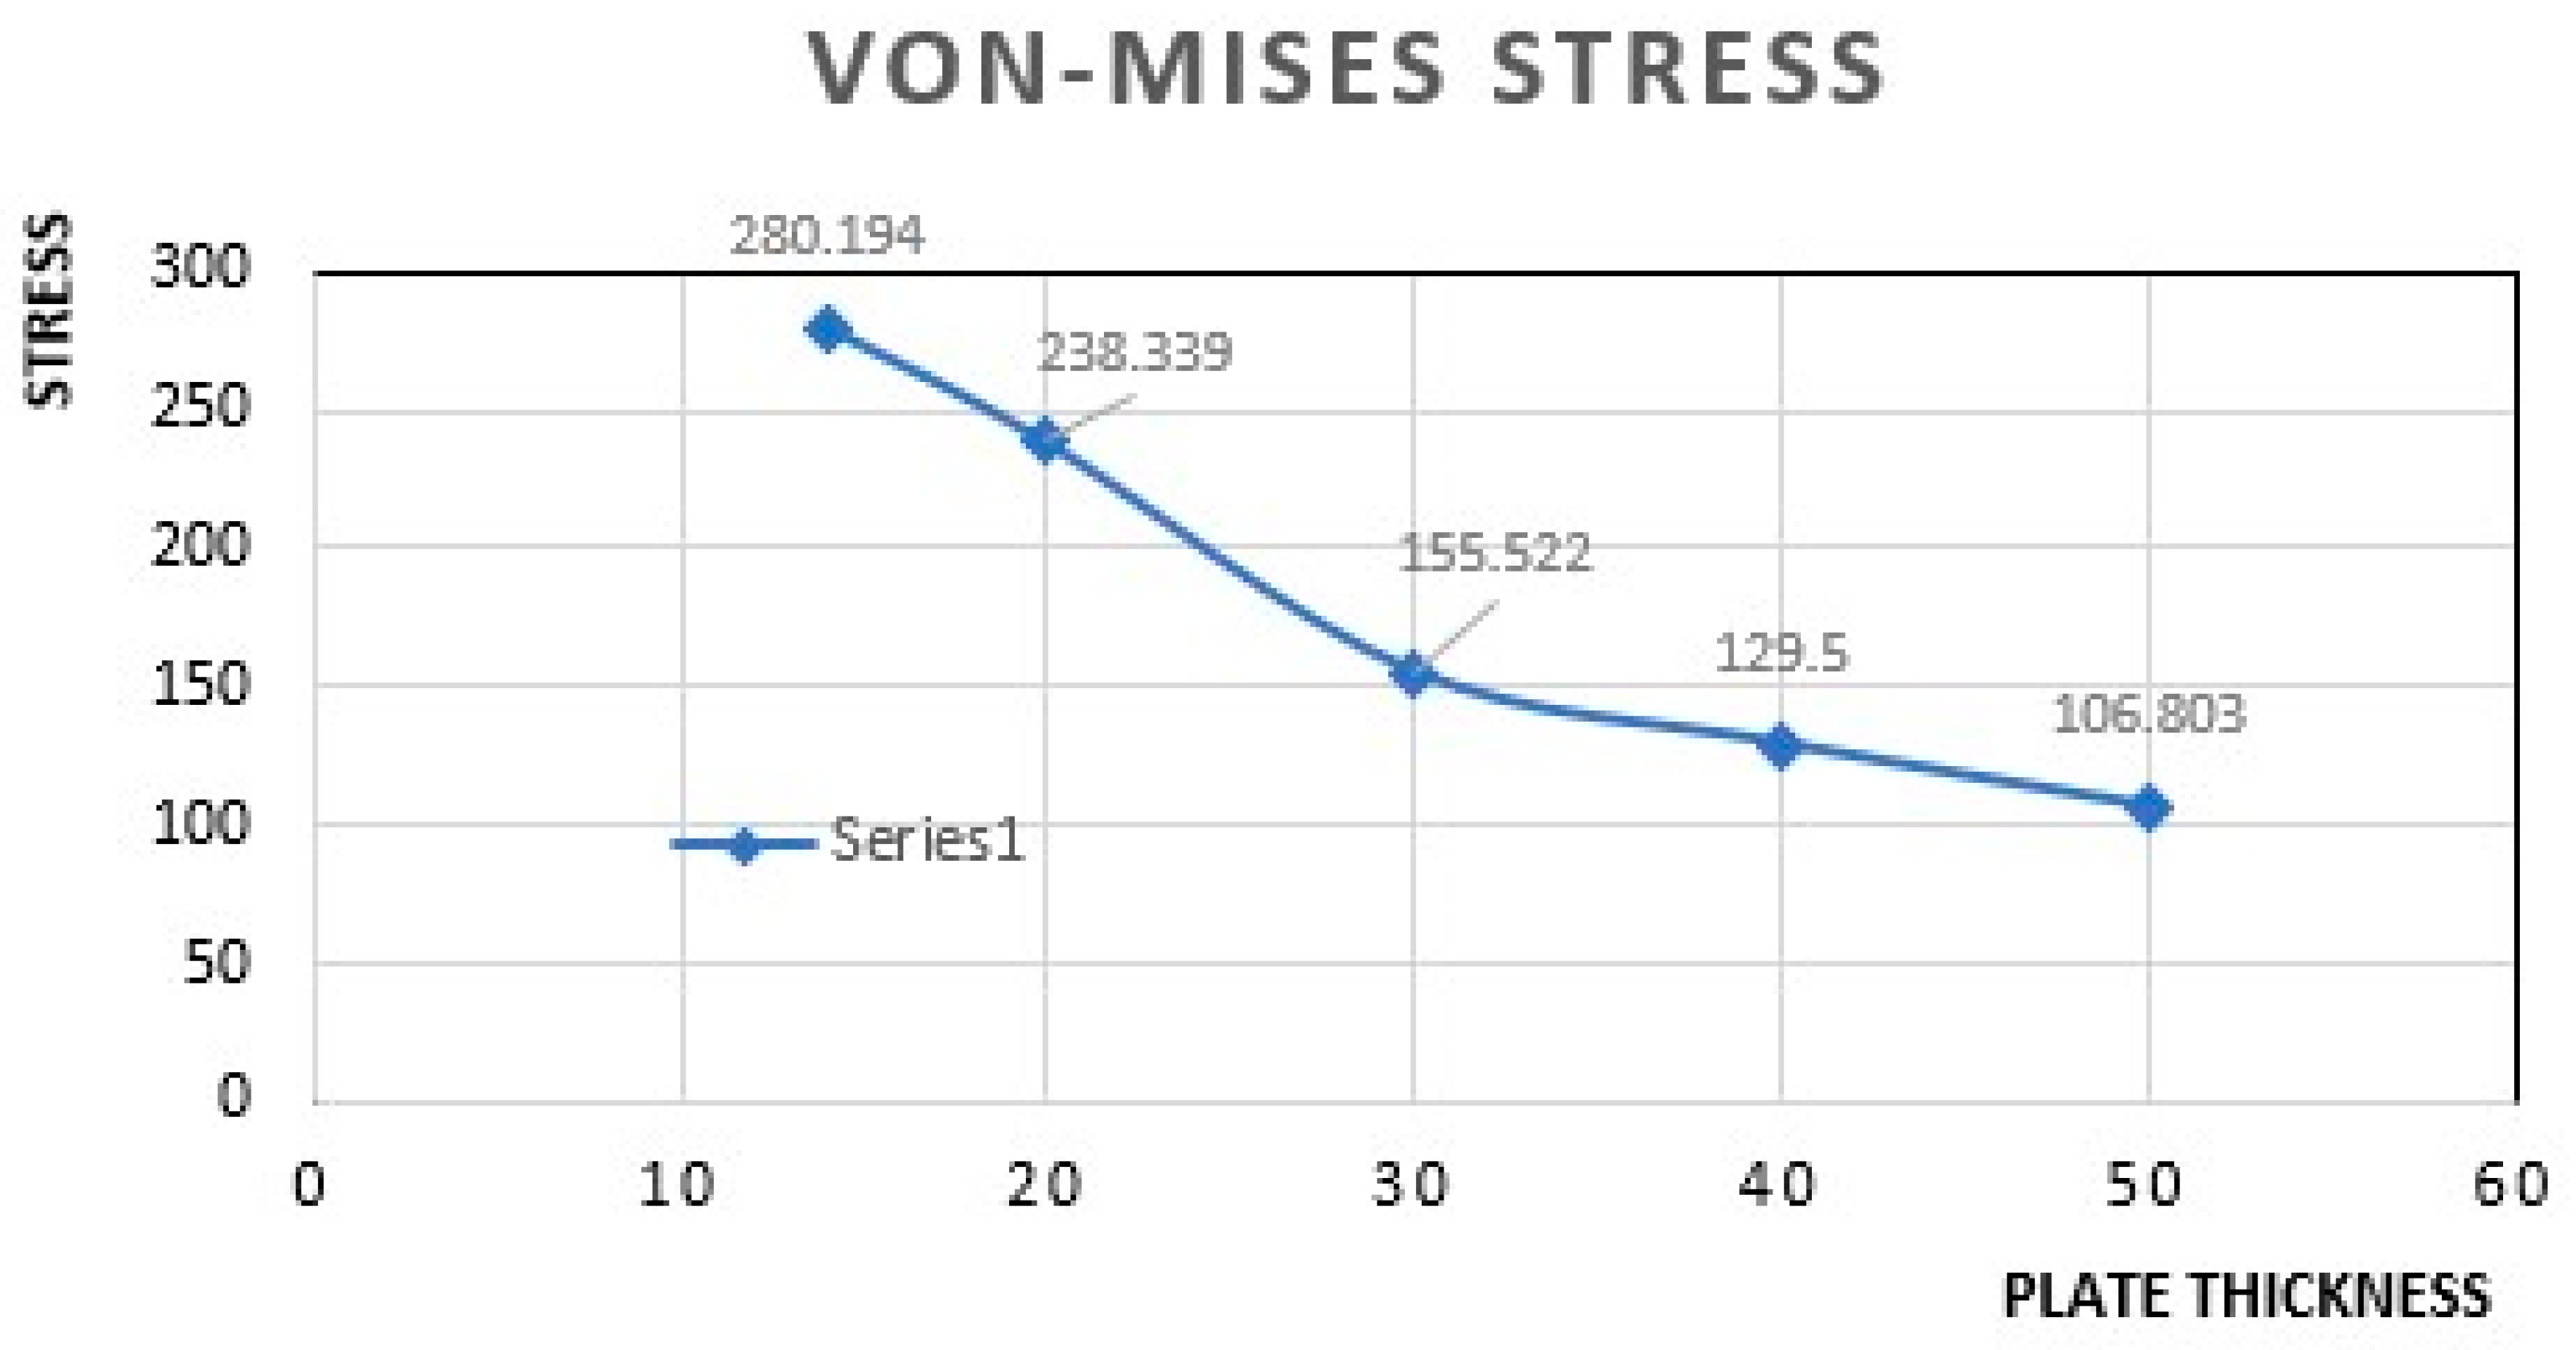
Figure 15.
Factor of Safety Versus thickness.
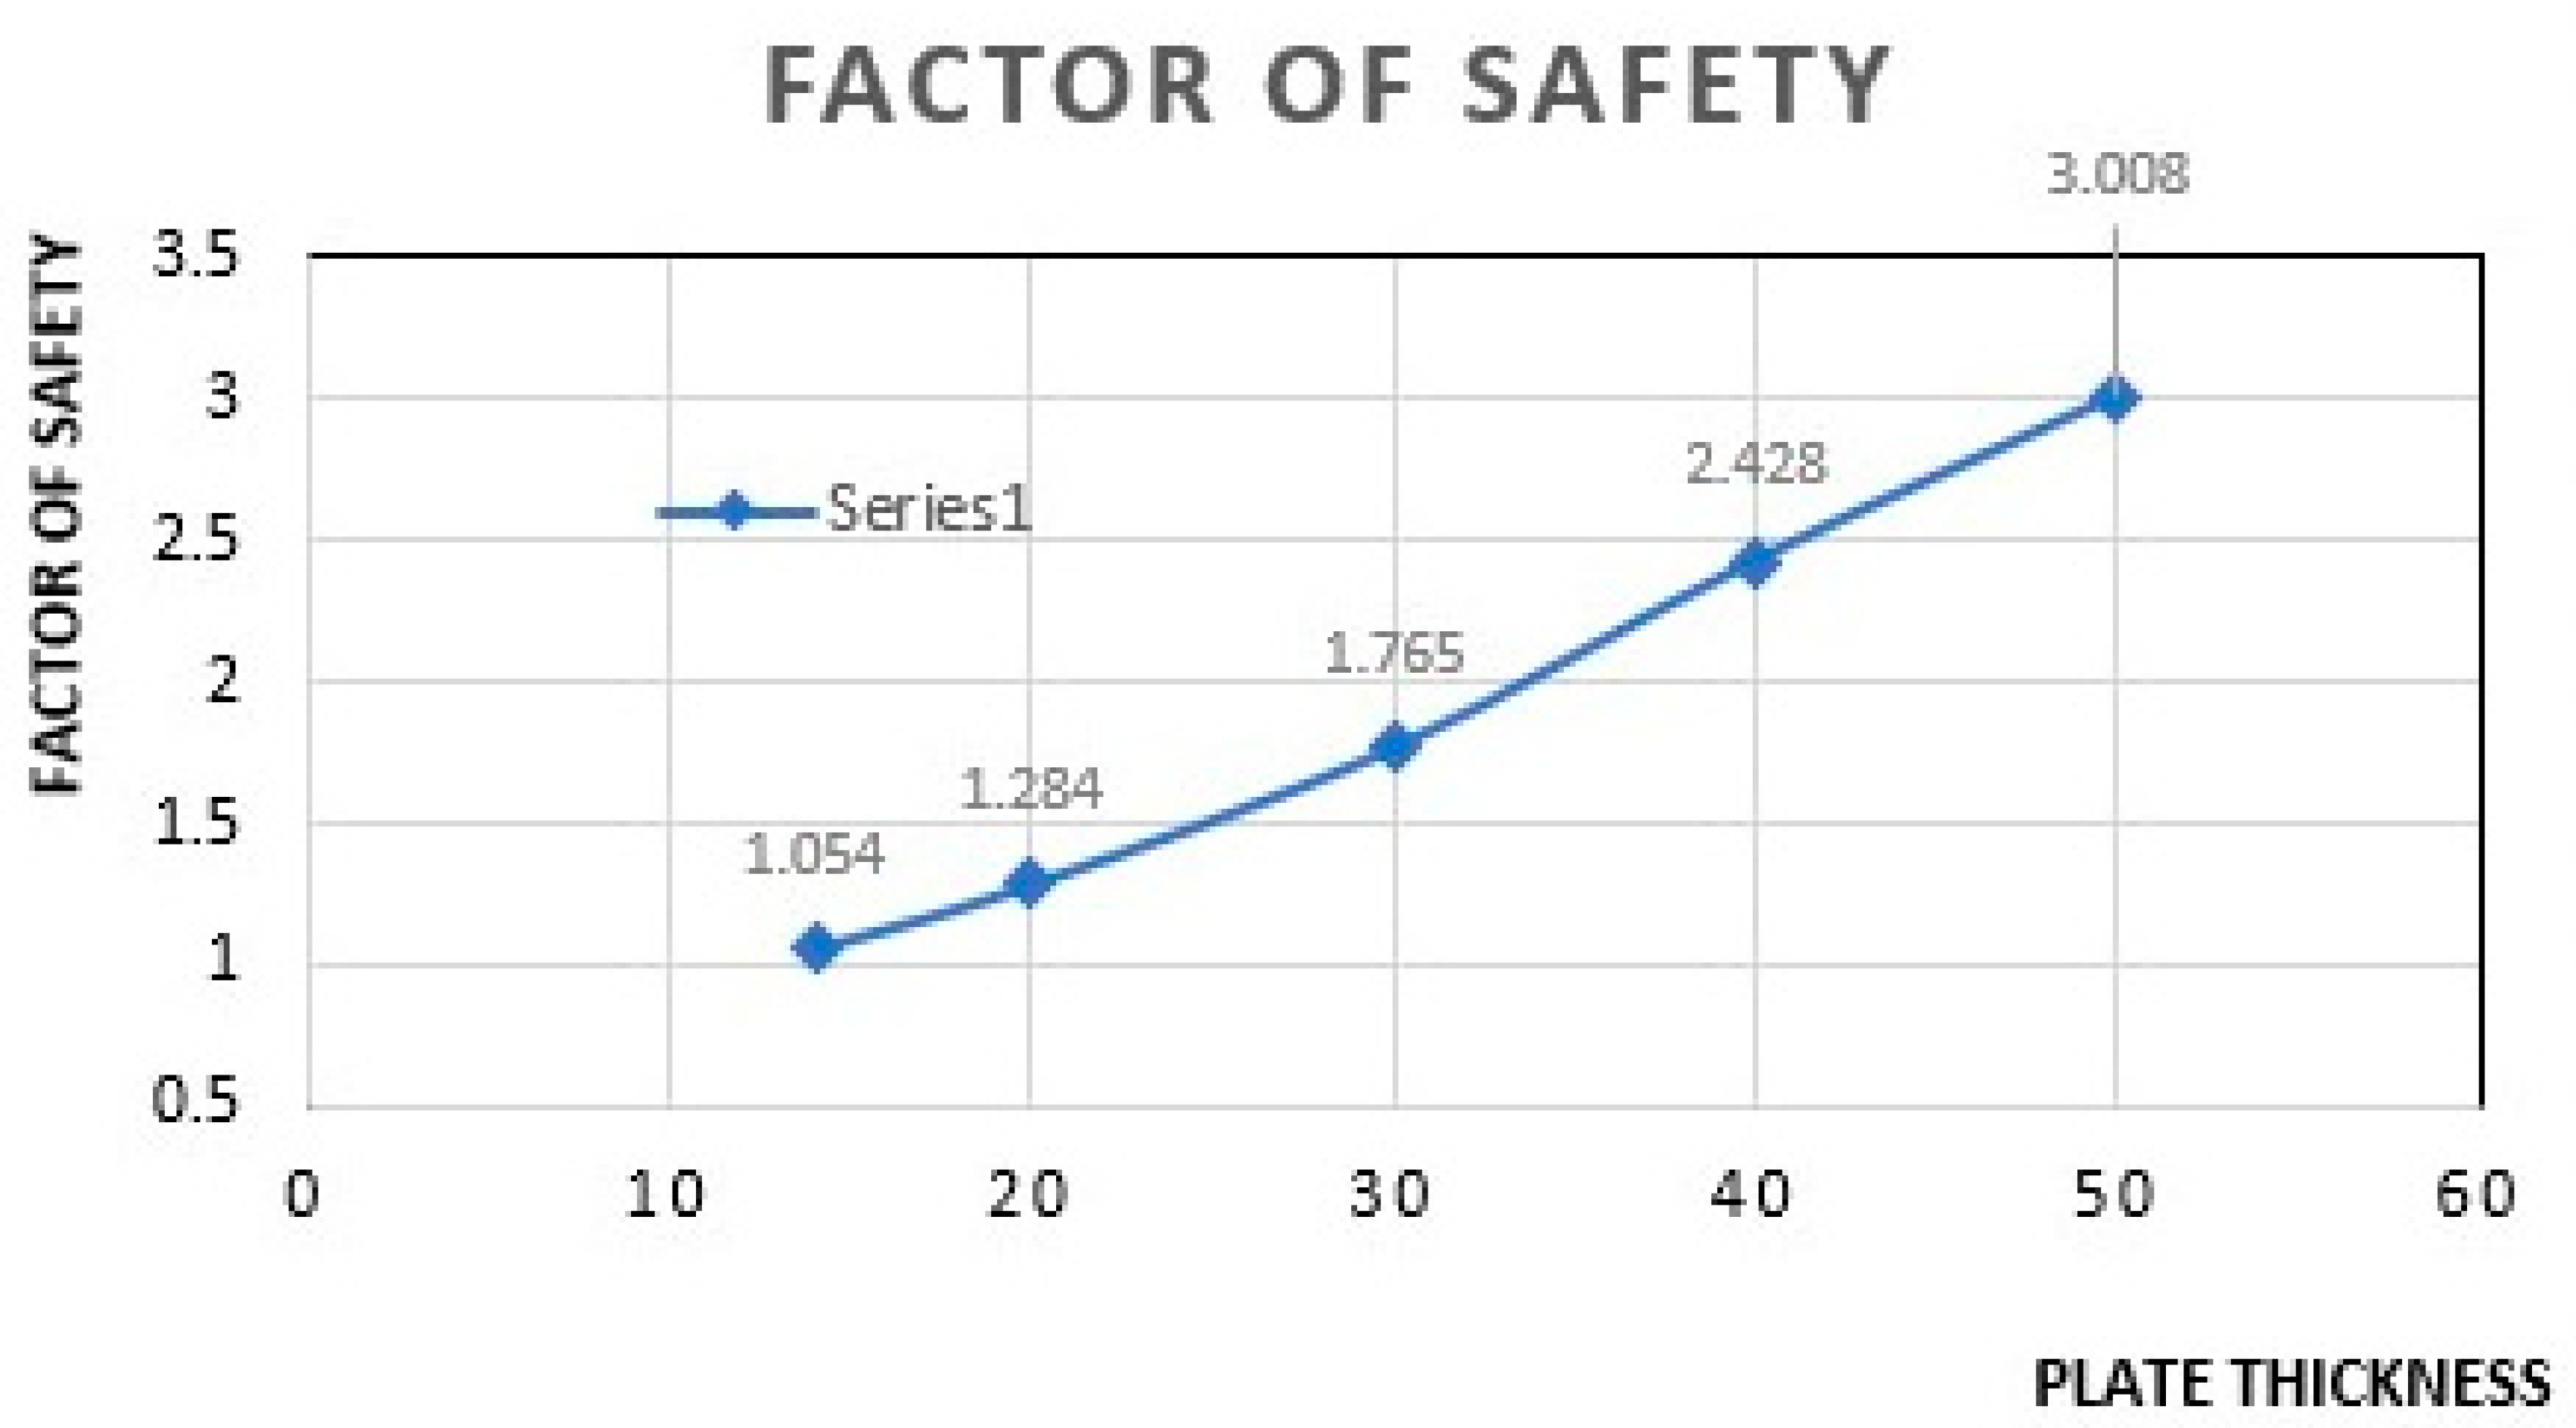
Figure 16.
Displacement Along-Y-Axis Versus thickness.
4. Conclusion
The results obtained from the Autodesk Inventor Professional 2023 especially the Inventor Nastran FEA software are in close agreement with the detailed calculations when comparing the average stress and deformation to the change in length and diameter of the pressure vessel. While the detailed calculations are valid, they only consider the cylinder's change in length and diameter, without considering the manway, ends, nozzle, or support legs. These components have a significant impact on the overall behaviours of the pressure vessel, highlighting the importance of considering the entire system in the design process.
To achieve more accurate designs for vertical pressure vessels, it is important to design each component individually. In this project, all pressure vessel components were selected based on the available ASME standards, and the manufacturers followed these standards during the manufacturing process.
The resulted stresses were found to be significantly lower than the ultimate strength of the material, which was 485 MPa. However, the highest stresses exceeded the design stress, indicating that some adjustments may be necessary to ensure the safe operation of the pressure vessel.
It is worth noting that the highest deformation occurs at the manway, which is consistent with the complexity of this component. In summary, the design of a pressure vessel is an integrated system that requires a thorough understanding of the individual components, as well as their interactions with one another. By considering these factors and following industry standards, engineers can design safe and efficient pressure vessels.
The stress concentrations were observed at the contact points between the manway and the shell, indicating the importance of carefully considering the design of this component. The design simulation further revealed that the stress concentration regions were concentrated on the regions that connect between the bottom of the tank and the fixing base, as well as the regions where the nozzle is fixed to the tank body.
Additionally, the simulation results showed that the regions farthest away from the fixing points experienced the highest displacement values under internal pressure. This information highlights the need to carefully consider the distribution of pressure and the structural support of the pressure vessel during the design process.
In summary, the stress and displacement analysis of the pressure vessel revealed critical regions that require careful attention during the design process, such as the manway and the fixing points. By taking these factors into consideration and following industry standards, engineers can design pressure vessels that meet safety and efficiency requirements.
References
- Amol, M., Bhosale, H., Singh, B. & Akash, M., 2008. A Review Paper on Study of Pressure Vessel, Design and Analysis. International Research Journal of Engineering and Technology.
- BARNWELL, 2023. Pipe Gasket Dimensions IBC Gaskets (mm) Full Face Gasket (mm) N-Bore (in) mm OD ID OD ID Holes, Birmingham: s.n.
- Devaraju, A. & Pazhanivel, K., 2015. A STUDY ON STRESS ANALYSIS FOR DESIGN OF PRESSURE VESSEL. International Journal of Mechanical And Production Engineering, Issue 3, pp. 2320-2092.
- Durga, P. & Sachidananda H, K., 2019. DESIGN AND ANALYSIS OF PRESSURE VESSEL.
- Gang, S., 2022. Equal Steel Plate. [Online] Available at: https://gangsteel.net/product/boiler/EqualGrade/2012/0404/SA516/Gr/70/steel/plate.html.
- Group, PAR, 2023. Manufacture, process and supply plastic, insulation and rubber products to industry, How to Measure a Gasket. [Online] Available at: https://www.par-group.co.uk/sealing-and-jointing/gaskets/how-to-measure-a-gasket/#:~:text=Measuring%20Flange%20Gaskets&text=The%20PCD%20is%20the%20measurement,the%20hole%20diameters%20are%20equal.
- Huda, Z. & Hani Ajani, M., 2015. Evaluation of Longitudinal and Hoop Stresses and a Crtitical Study of Factor of Safety i Design of Glass-Fibre Pressure Vessel. [CrossRef]
- Jha, A. K., 2020. An Optimum Design of Pressure Vessel using ASME (BPVC) Sec-VIII Div-I, II and ASME (BPVC) Sec-II Part-A. International Journal for Research in Applied Science and Engineering Technology, 8(5), pp. 1670-1682. [CrossRef]
- Kumar, M. D. L. P., 2019. Investigation of Von - Mises Stress and Stress Concentration Factor for Cylinders with Holes in Different Locations and Varying Pressure using Analytical Method and FEA. International Journal for Research in Applied Science and Engineering Technology, 7(7), pp. 888-894. [CrossRef]
- Liu, C., Eng, P. & Brundrett, L., 2007. Sample Vessel 8 PVE-Sample 8 Pressure Vessel Calculations, s.l.: s.n.
- Moss, D., 2004. Pressure Vessel Design Manual. s.l.:s.n. [CrossRef]
- Narale, P. & Kachare, P. S., 2012. Structural Analysis of Nozzle Attachment on Pressure Vessel Design. International Journal of Engineering Research and Applications, 2(4), pp. 1353-1358.
- Niranjana, S. J., Patel, S. V. & Dubey, A. K., 2018. Design and Analysis of Vertical Pressure Vessel using ASME Code and FEA Technique. s.l., IOP Conference Series: Materials Science and Engineering.
- Nitinchandra R, P. et al., 2013. DESIGN AND ANALYSIS OF PRESSURE VESSEL AMALGAMATING WITH SELECTION OF MATERIAL USED IN MARINE APPLICATION. International Journal of Innovative Research in Science, Engineering and Technology, Volume 2.
- Pendbhaje, A. R., Gaikwad, M., Deshmukh, N. & Patil, R., 2018. DESIGN AND ANALYSIS OF PRESSURE VESSEL. International Journal of Innovative Research in Technology & Science.
- Ţălu, Ş. & Ţălu, M., 2018. Algorithm for optimal design of pressurized toroidal LPG fuel tanks with constant section described by imposed algebraic plane curves Fuel Tanks View project Surface and interface materials at micro and nano scale View project Algorithm for Optimal Design.
- Tamboli, K., 2014. Fatigue Analysis of Pressure Vessel by FEA Techniques. International Journal of Engineering Trends and Technology.
- Wilde, W. P., Blain, W. R. & Brebbia,, C. A., 2000. Advances in composite materials and structures VII. s.l.:s.n. [CrossRef]
- Yahya, N. A., Daas, O. M., Alboum, N. O. F. & Khalile, A. H., 2018. Design of Vertical Pressure Vessel Using ASME Codes. s.l., s.n. [CrossRef]
- Yahya, N. A., Daas, O. M., Alboum, N. O. F. & Khalile, A. H., 2018. Design of Vertical Pressure Vessel Using ASME Codes. s.l., s.n. [CrossRef]
Figure 1.
Hoop or circumferential stress acting on the shell details (Niranjana, et al., 2018).
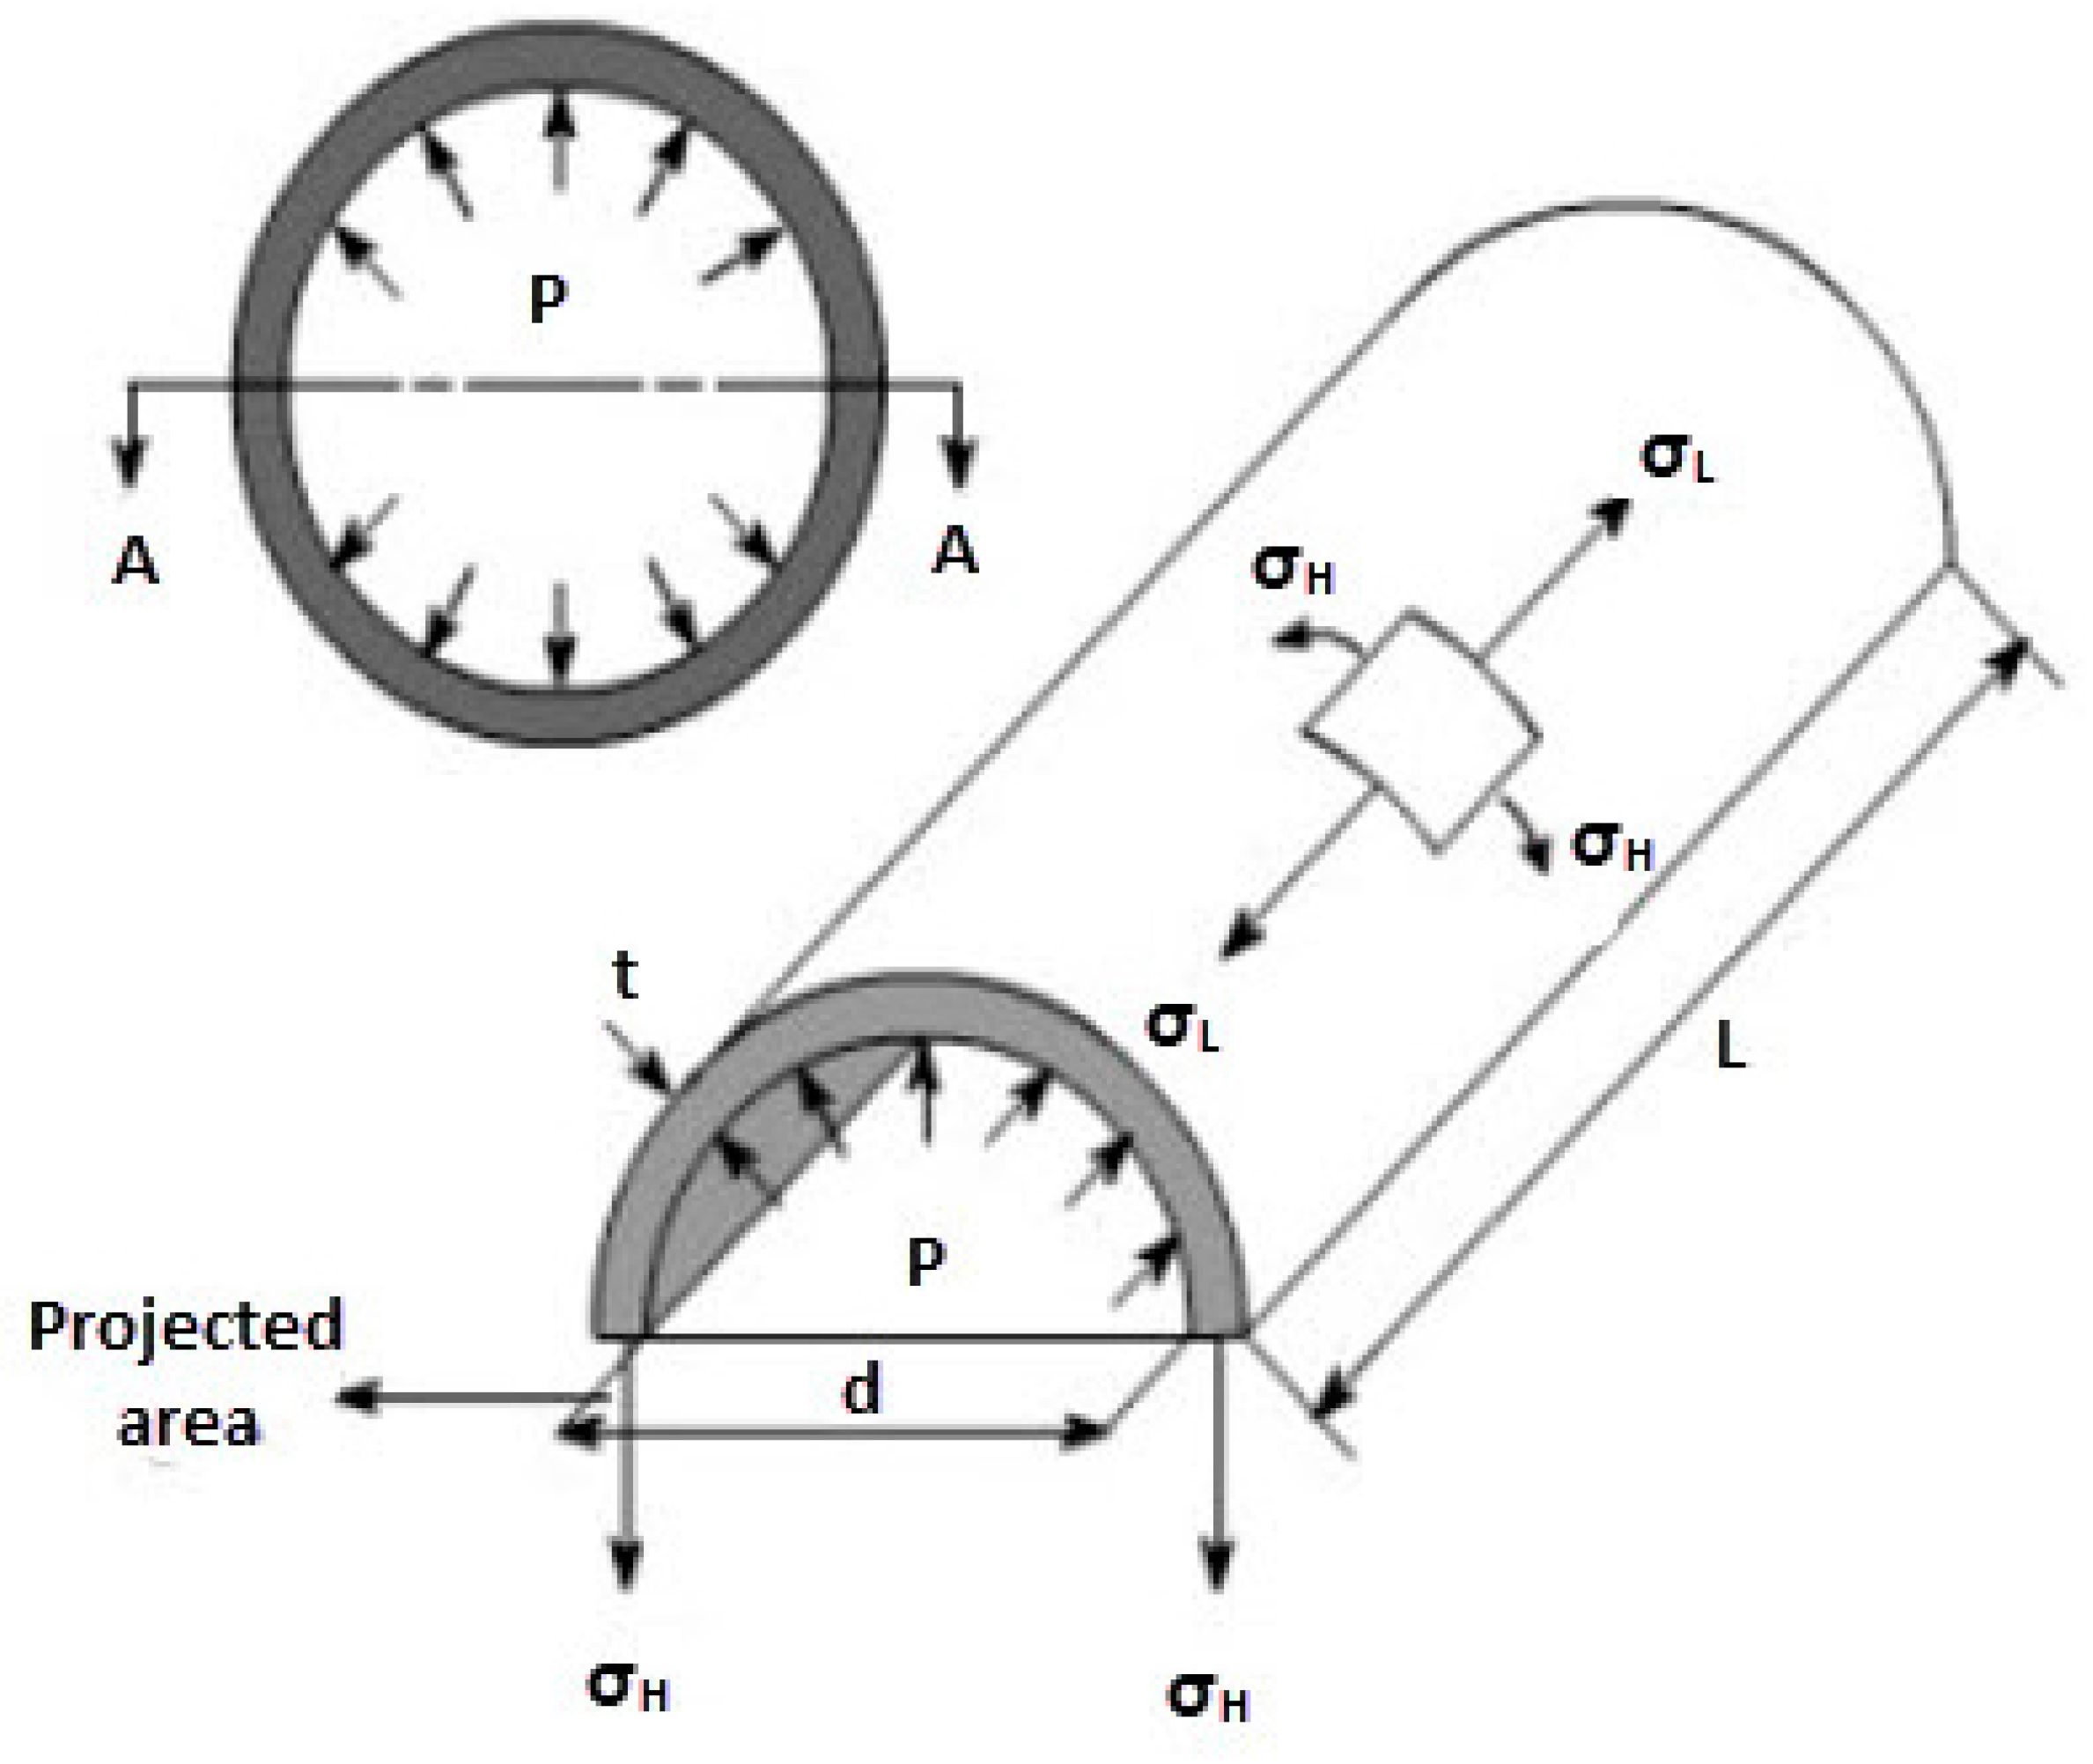
Figure 2.
ASME SA516 Steel Plate (Gang, 2022).
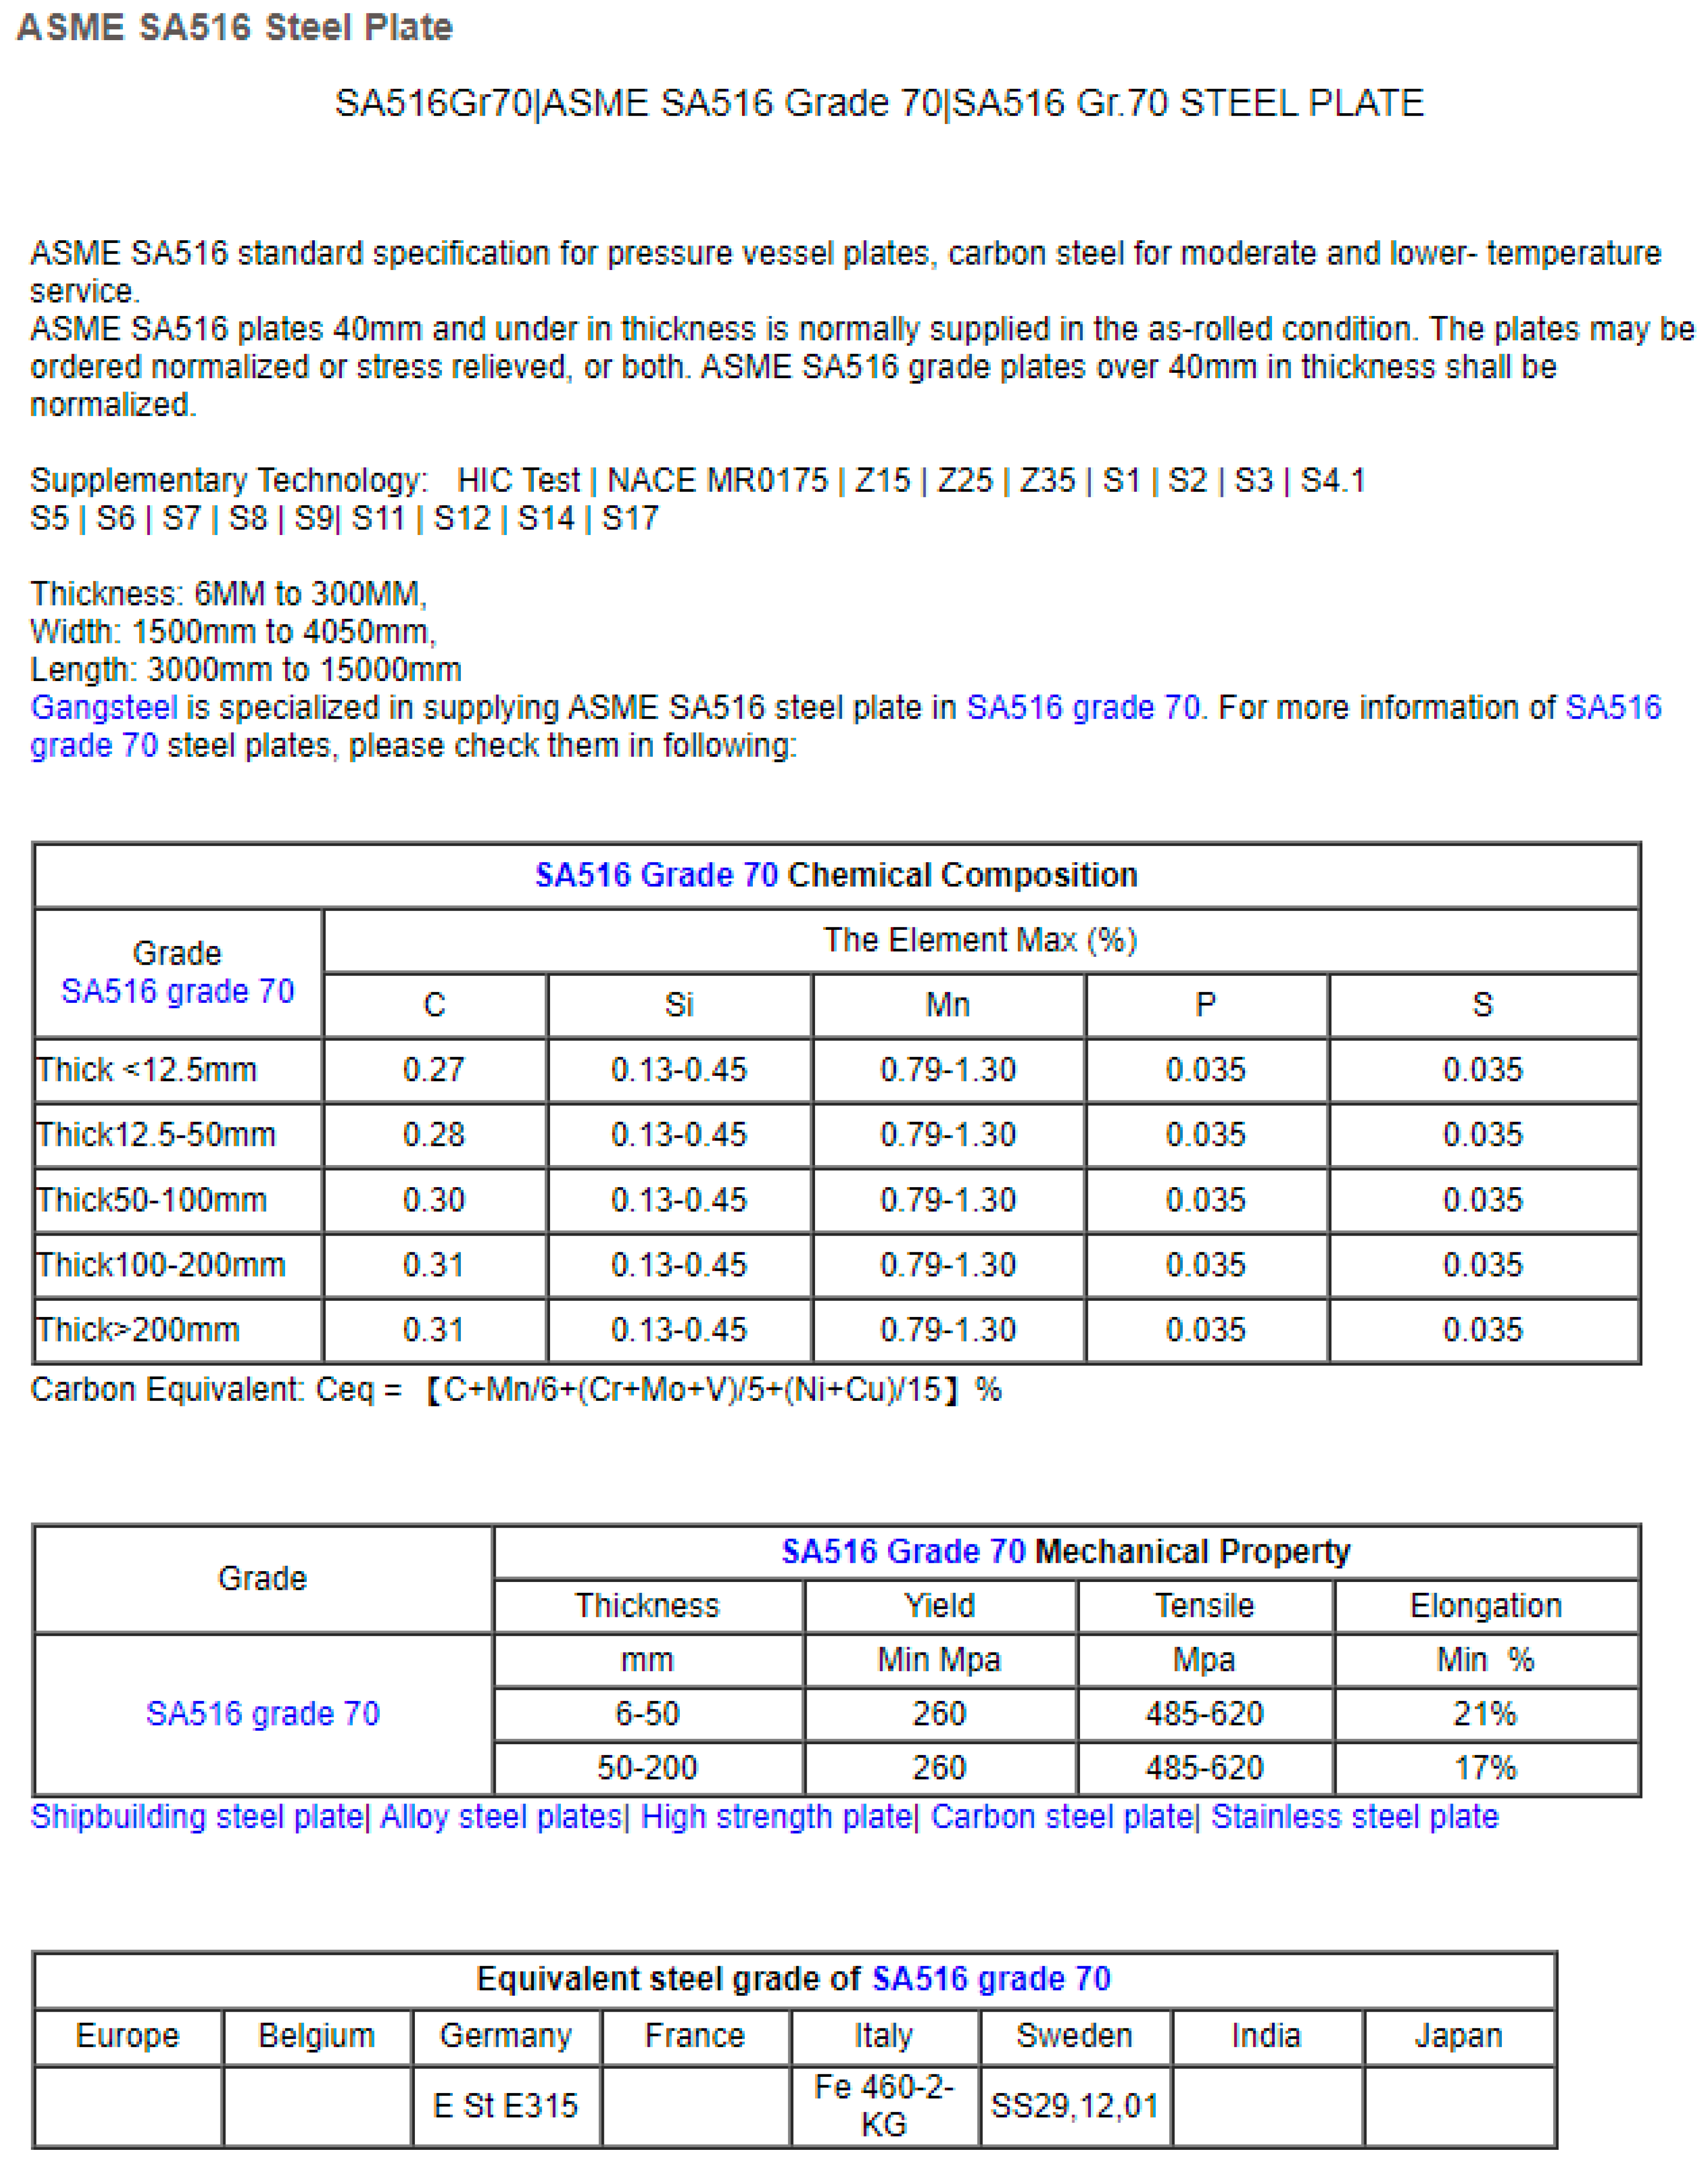
Figure 3.
Heads Design Dimensions (Yahya, et al., 2018).
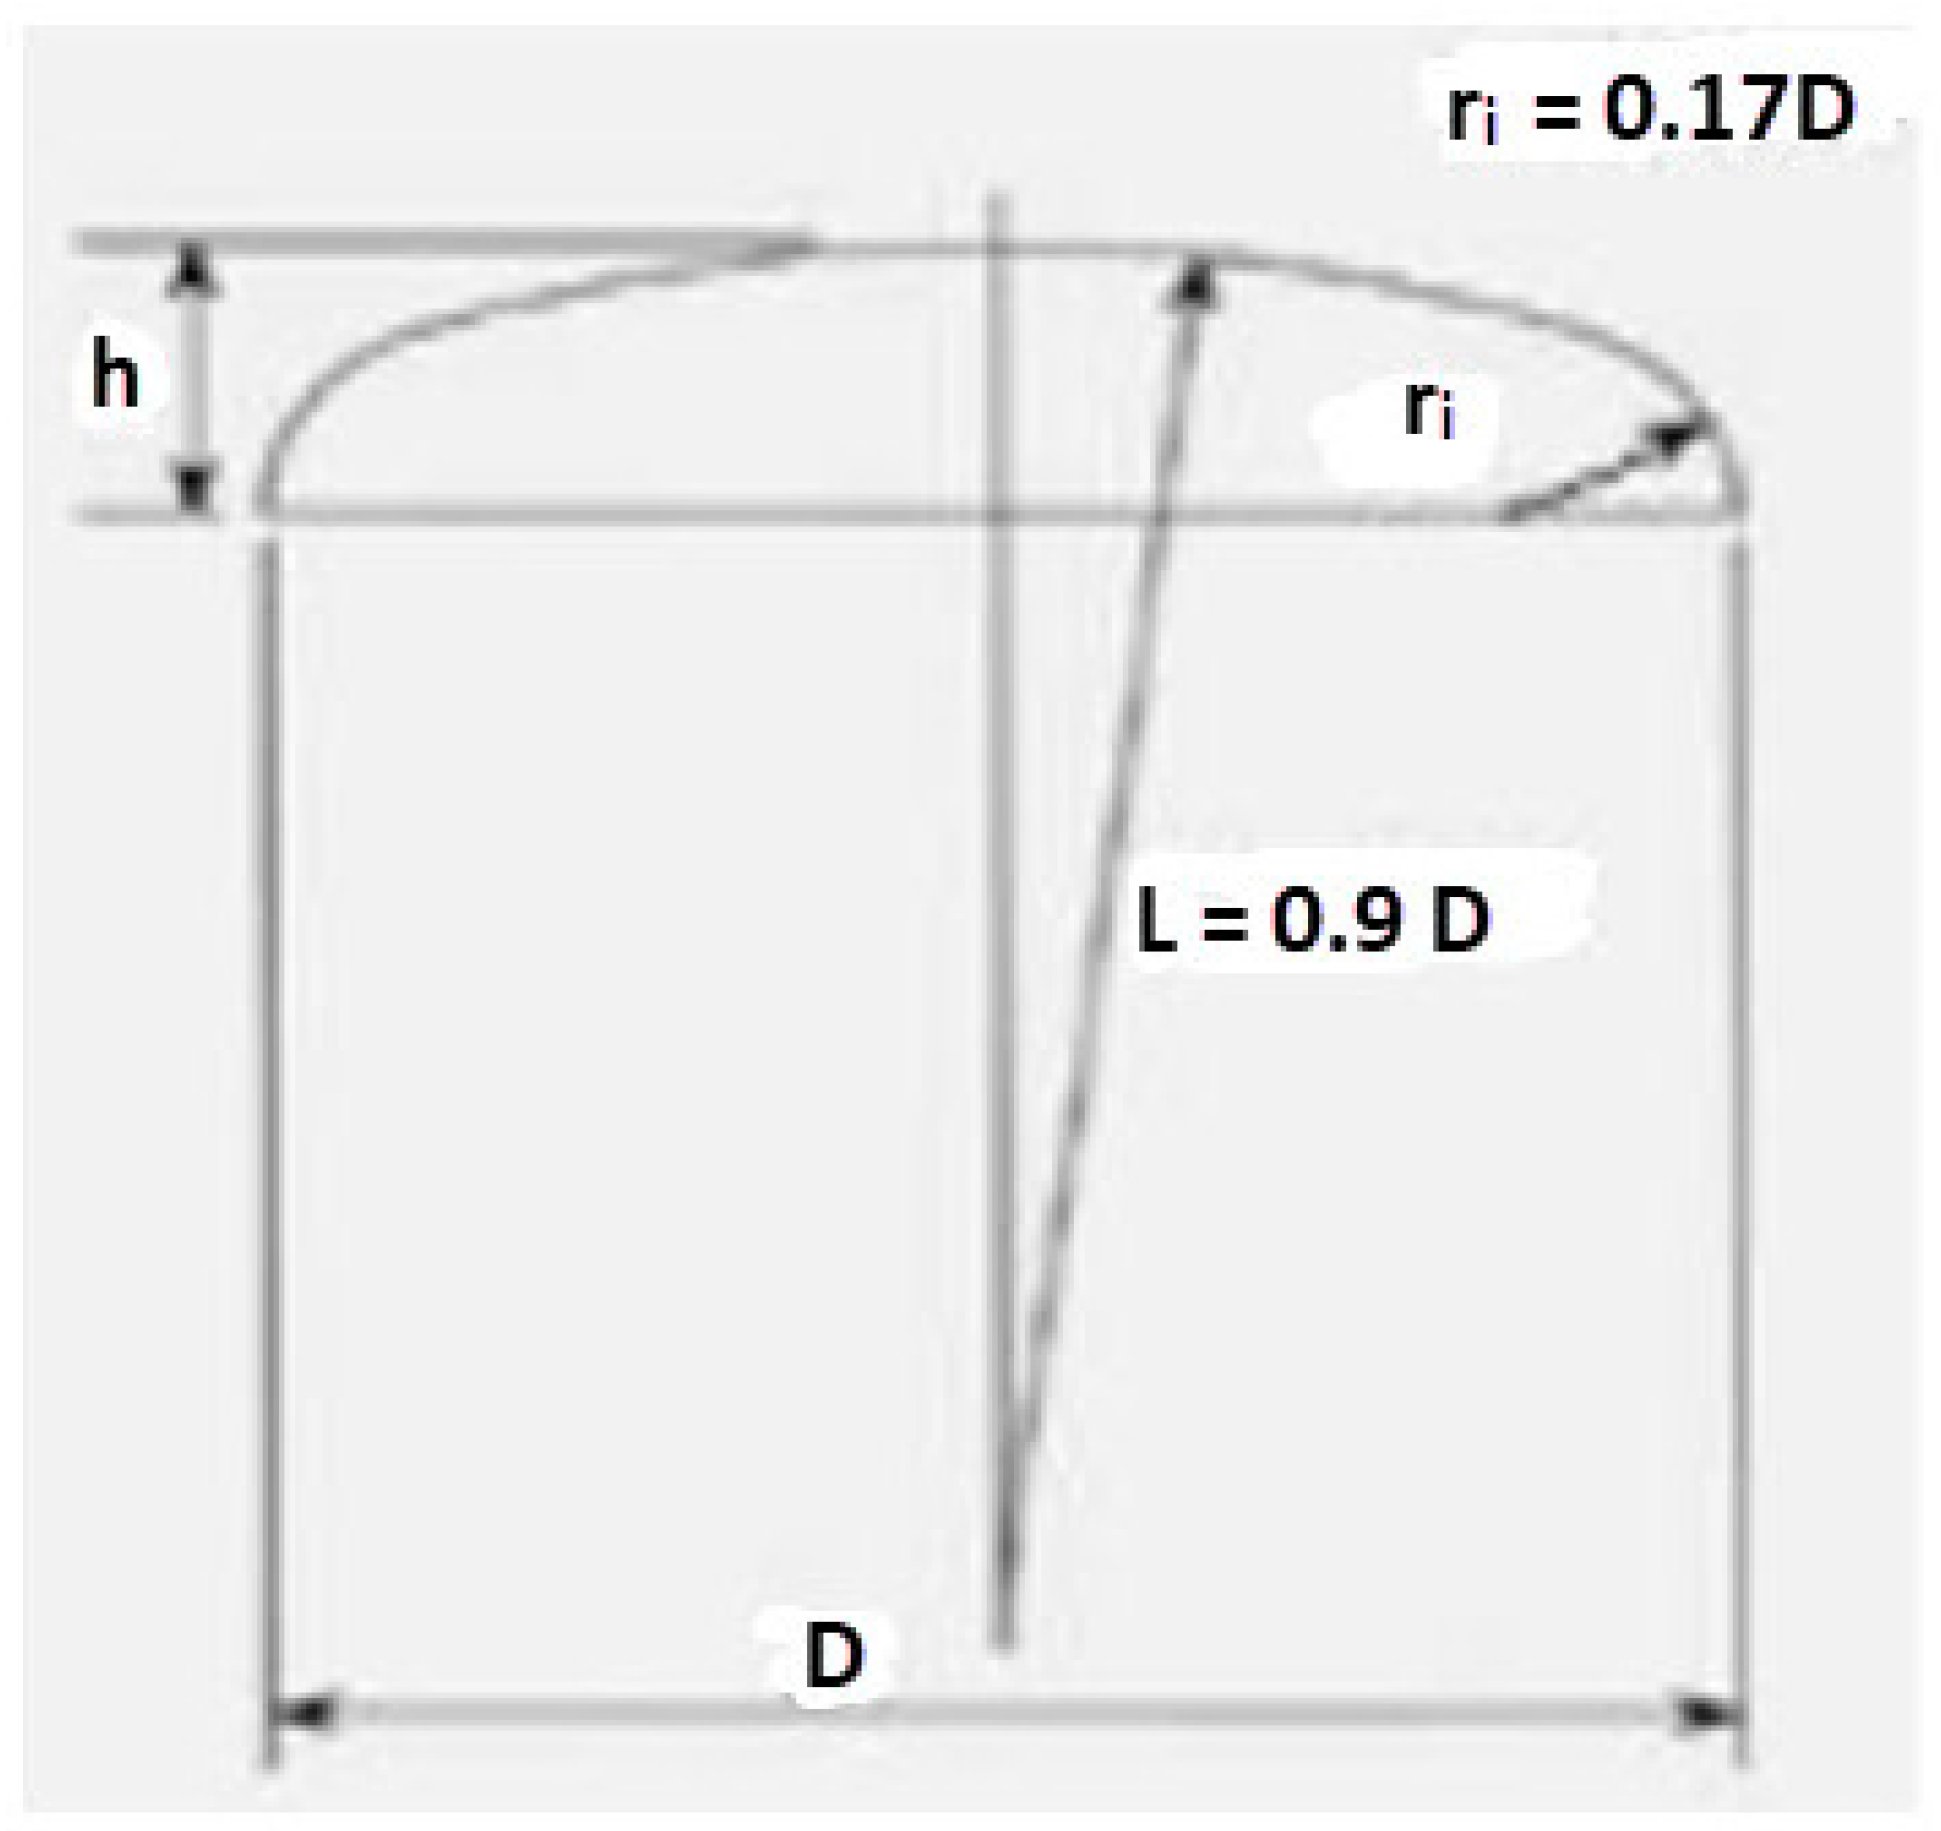
Figure 4.
Nozzle Design Parameters (Yahya, et al., 2018).
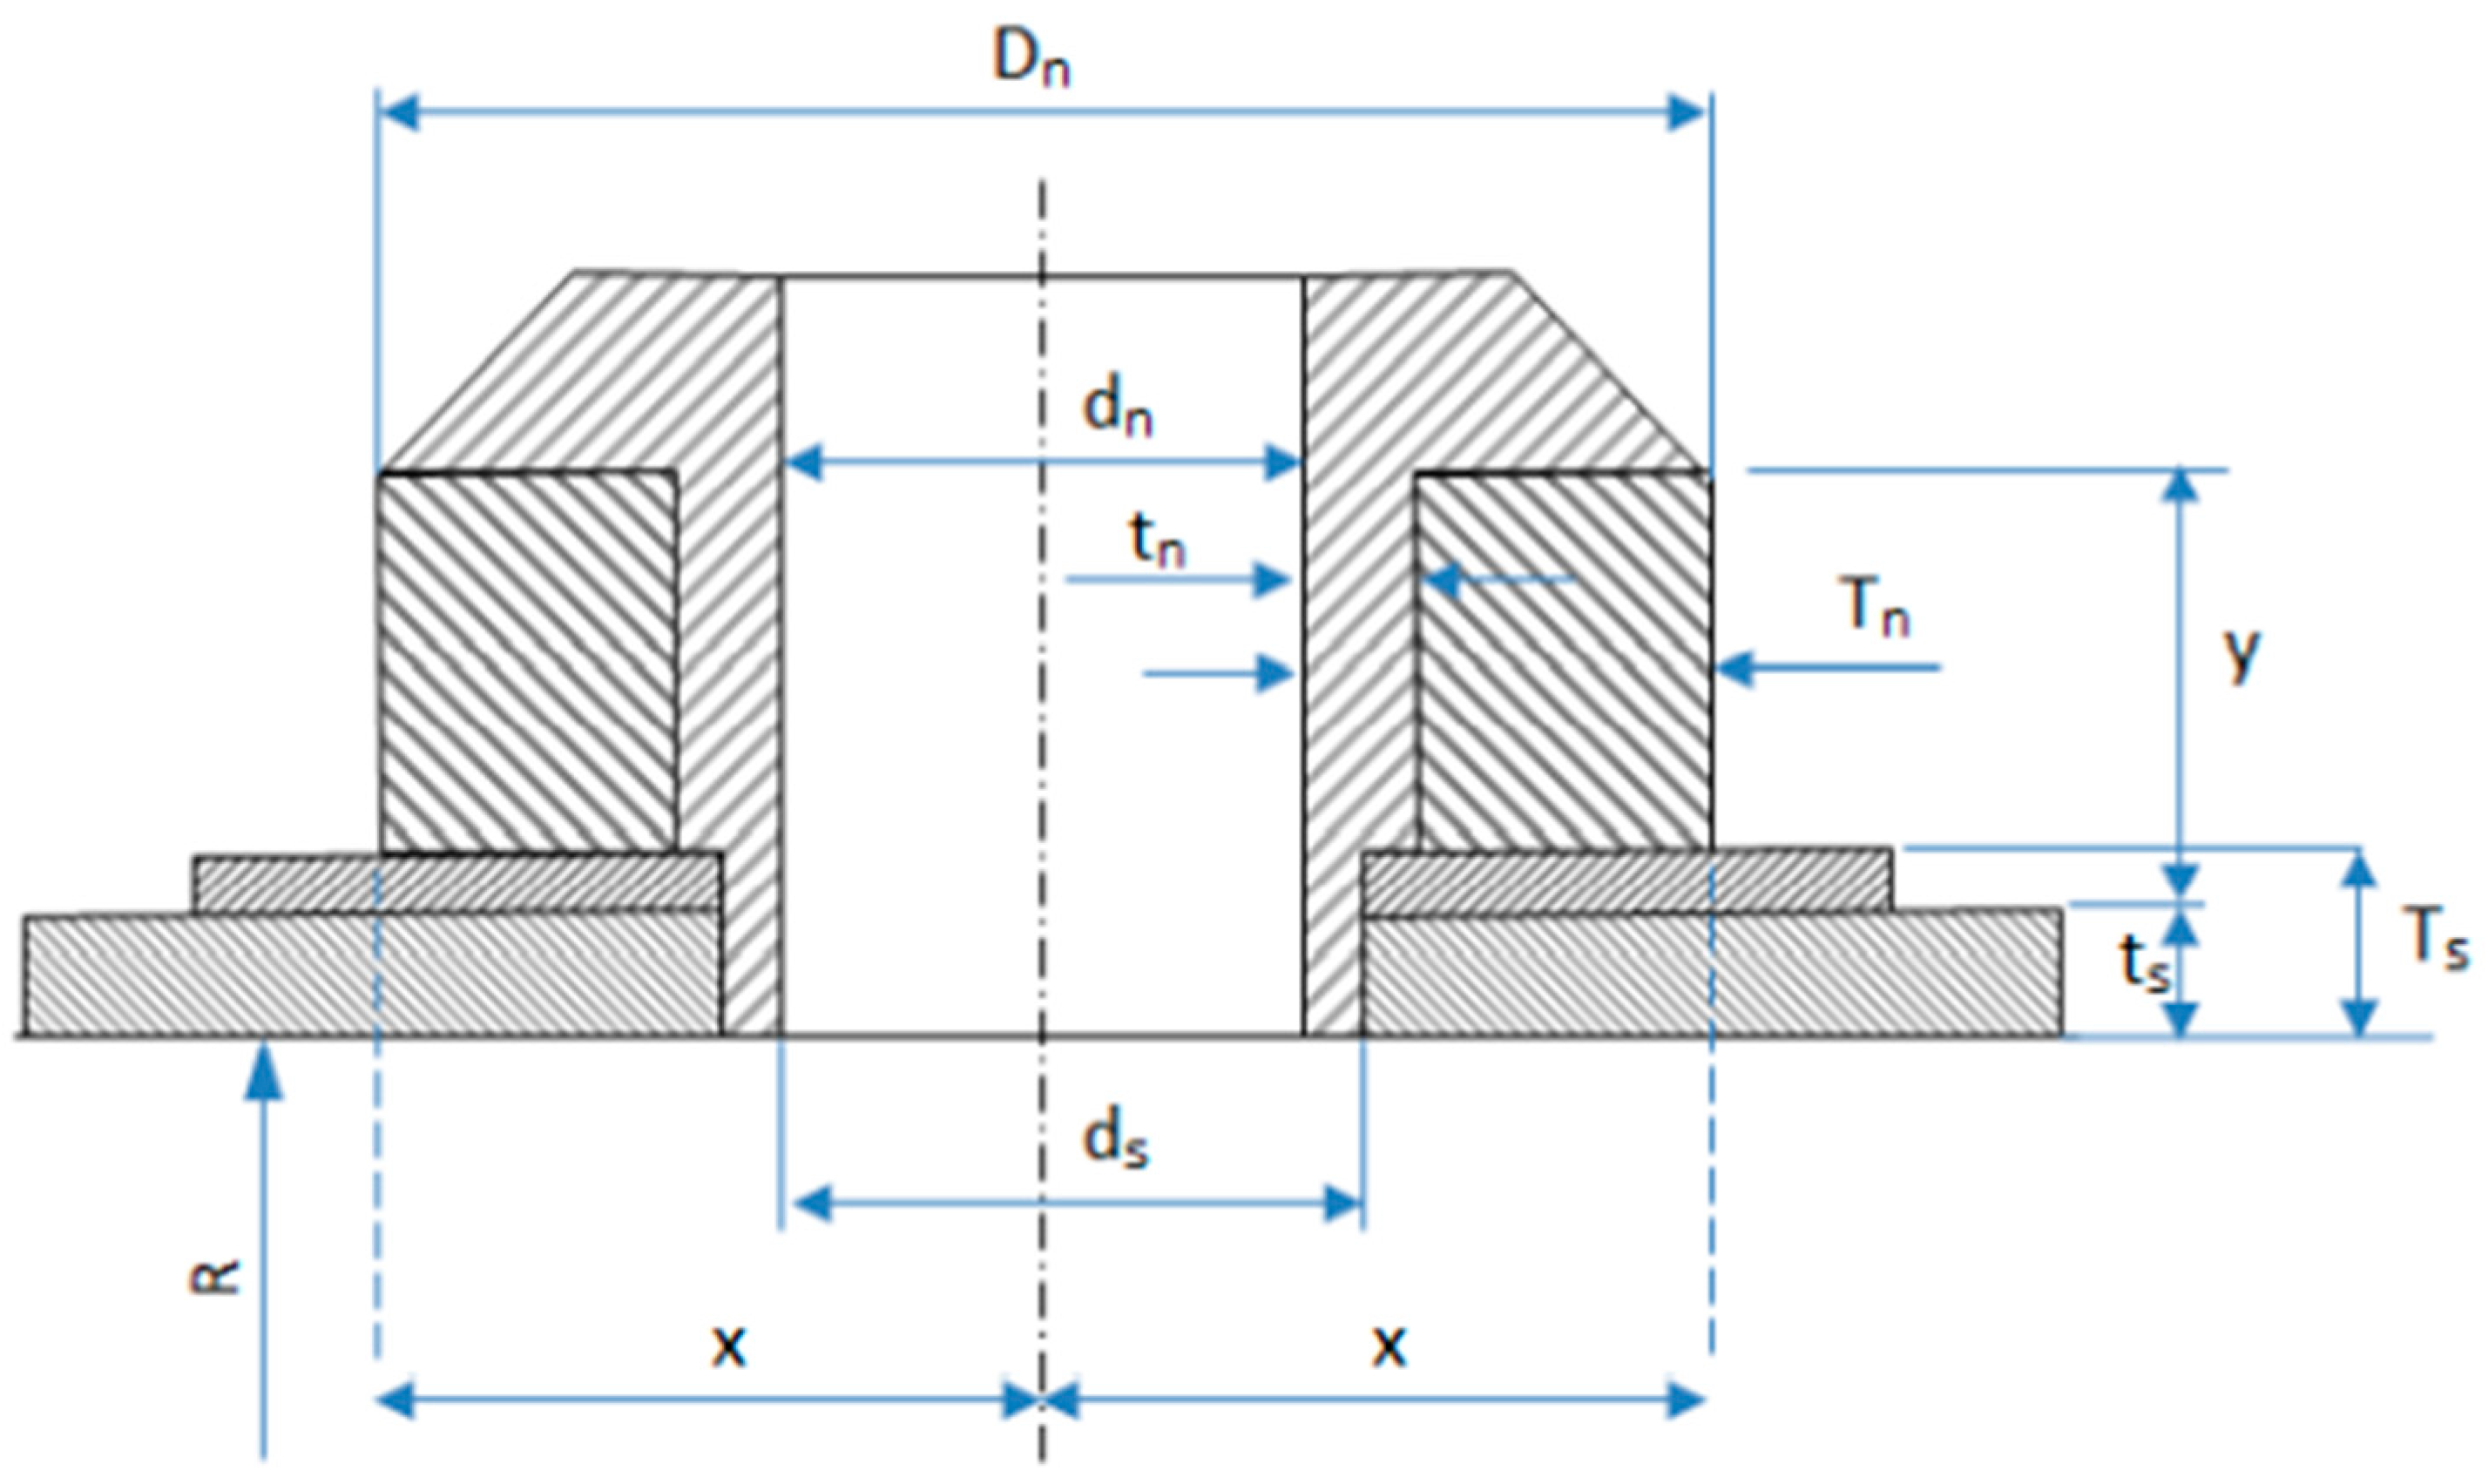
Figure 5.
Gaskets for Class designated Flanges Suitable for ANSI Standard Flanges (ASA) (BARNWELL, 2023).
Figure 5.
Gaskets for Class designated Flanges Suitable for ANSI Standard Flanges (ASA) (BARNWELL, 2023).
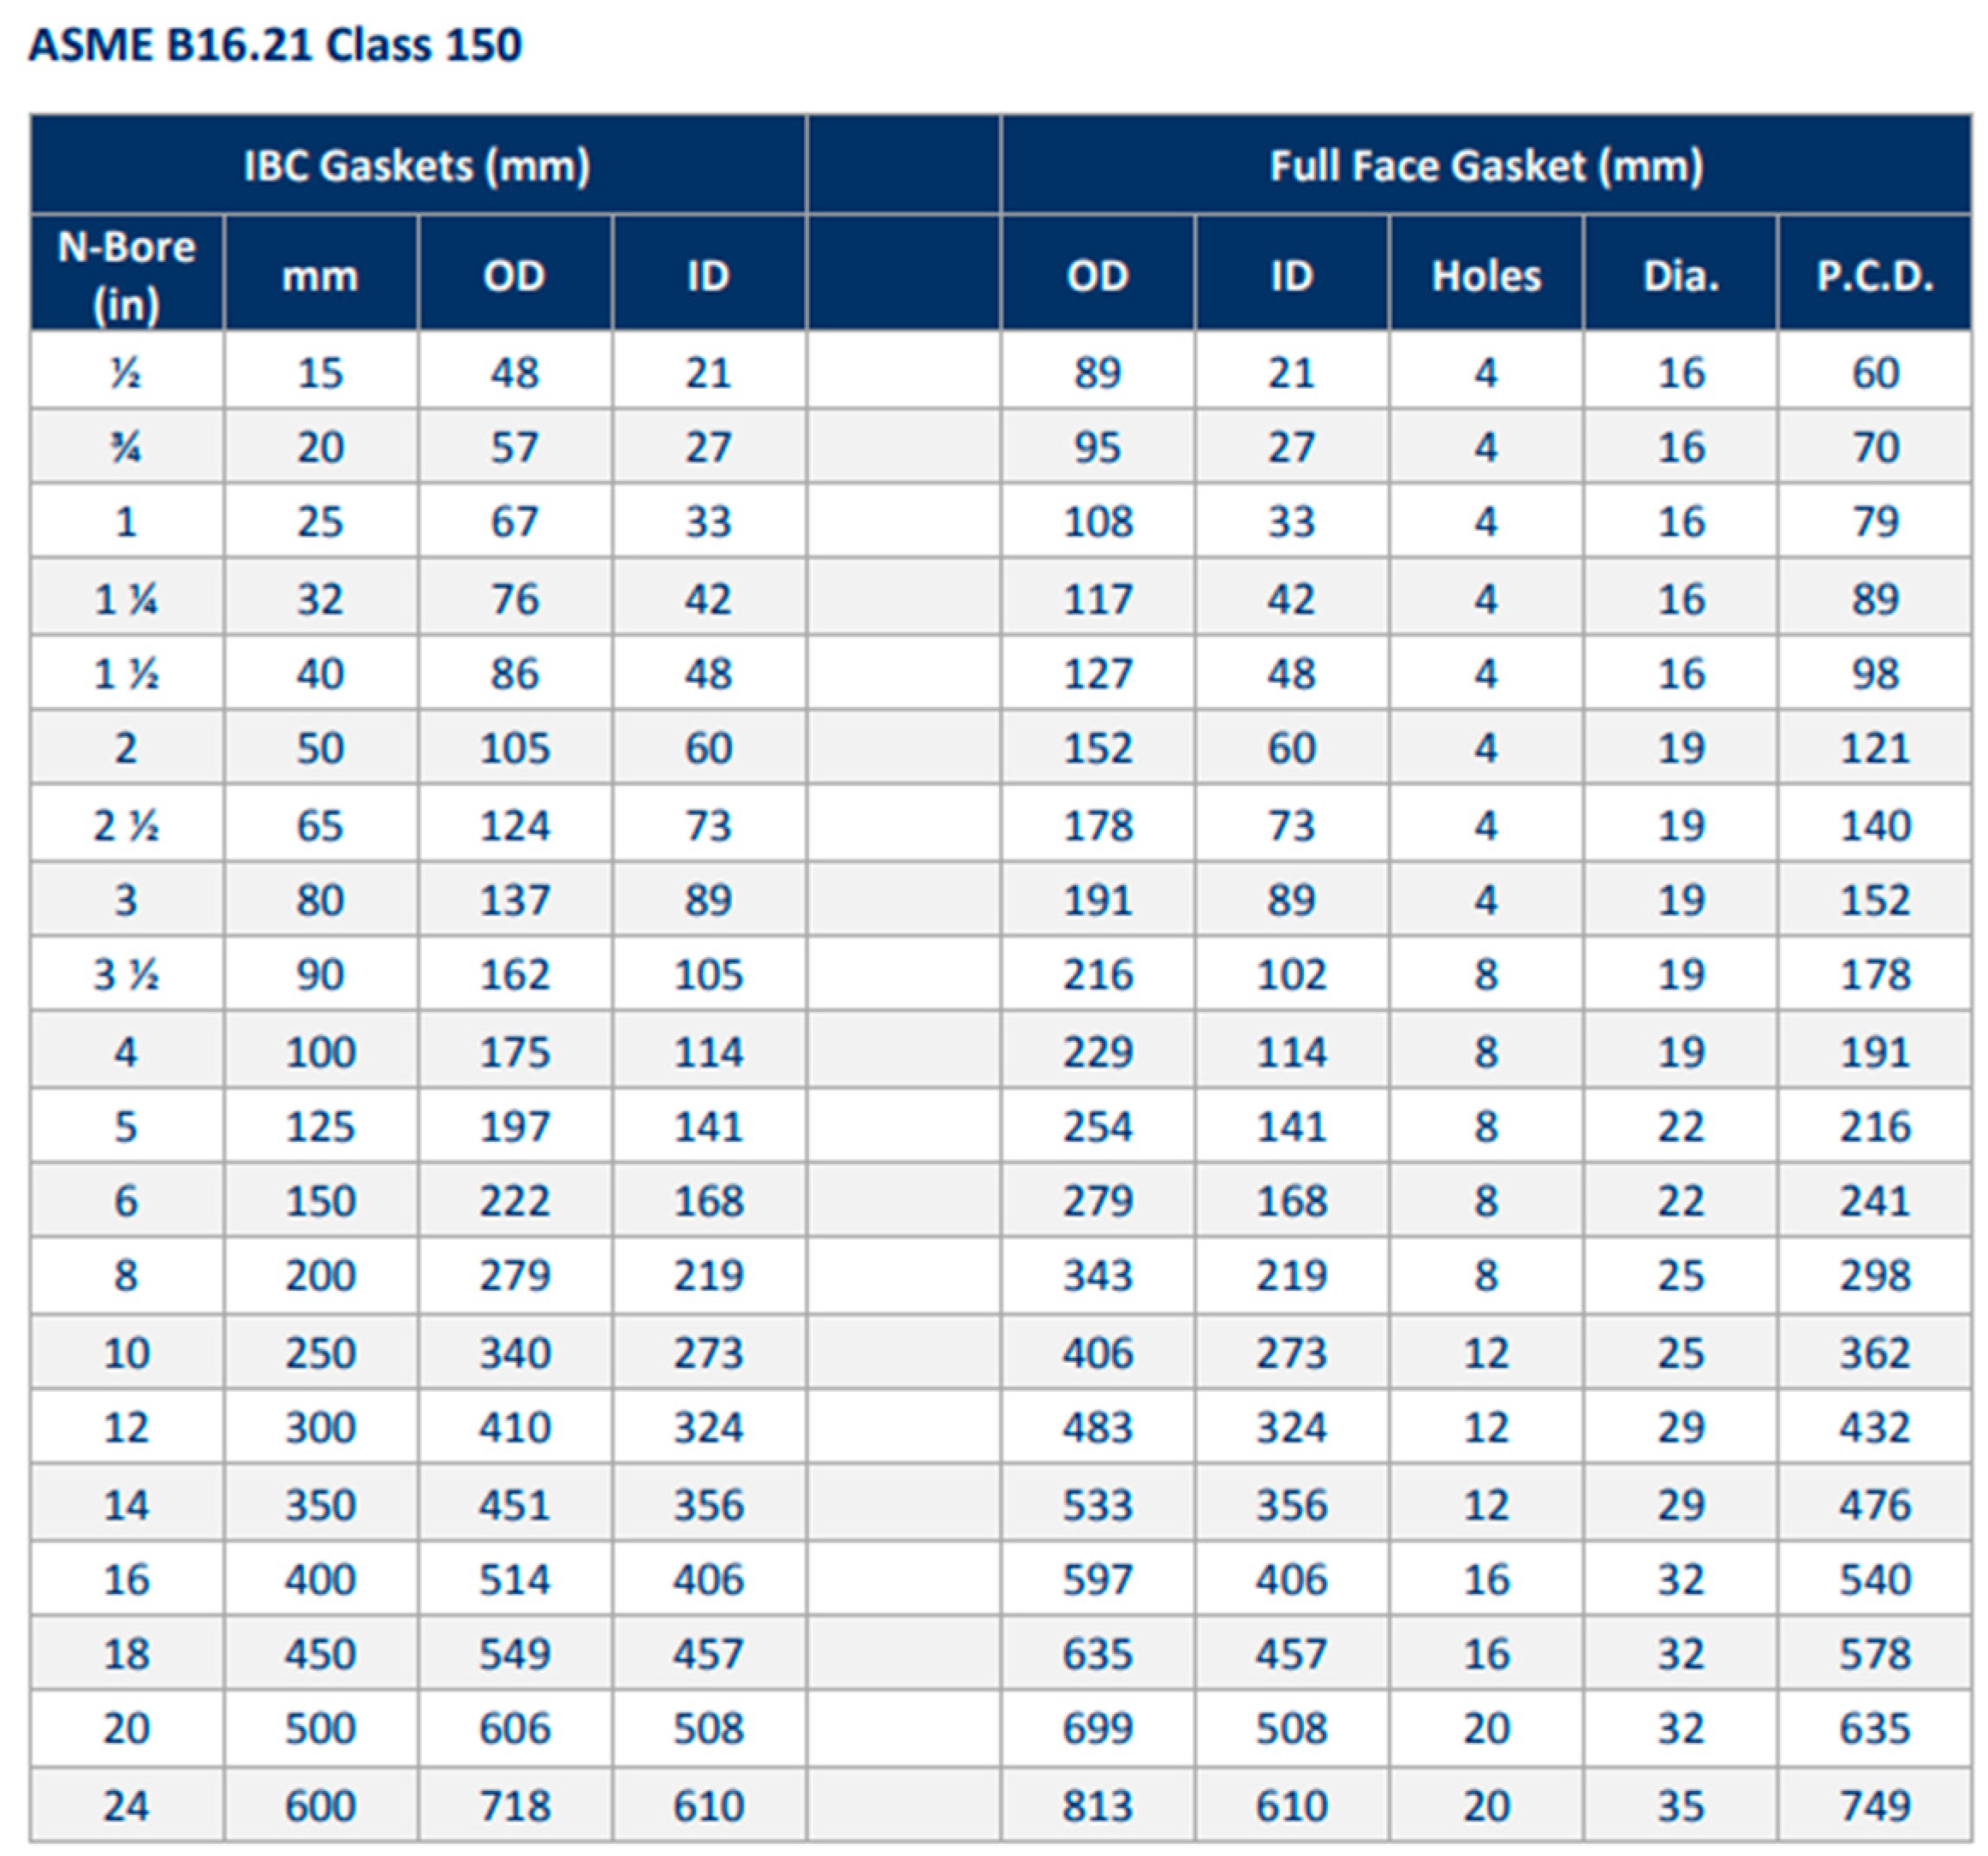
Figure 6.
Flange Gasket (Group, PAR, 2023).
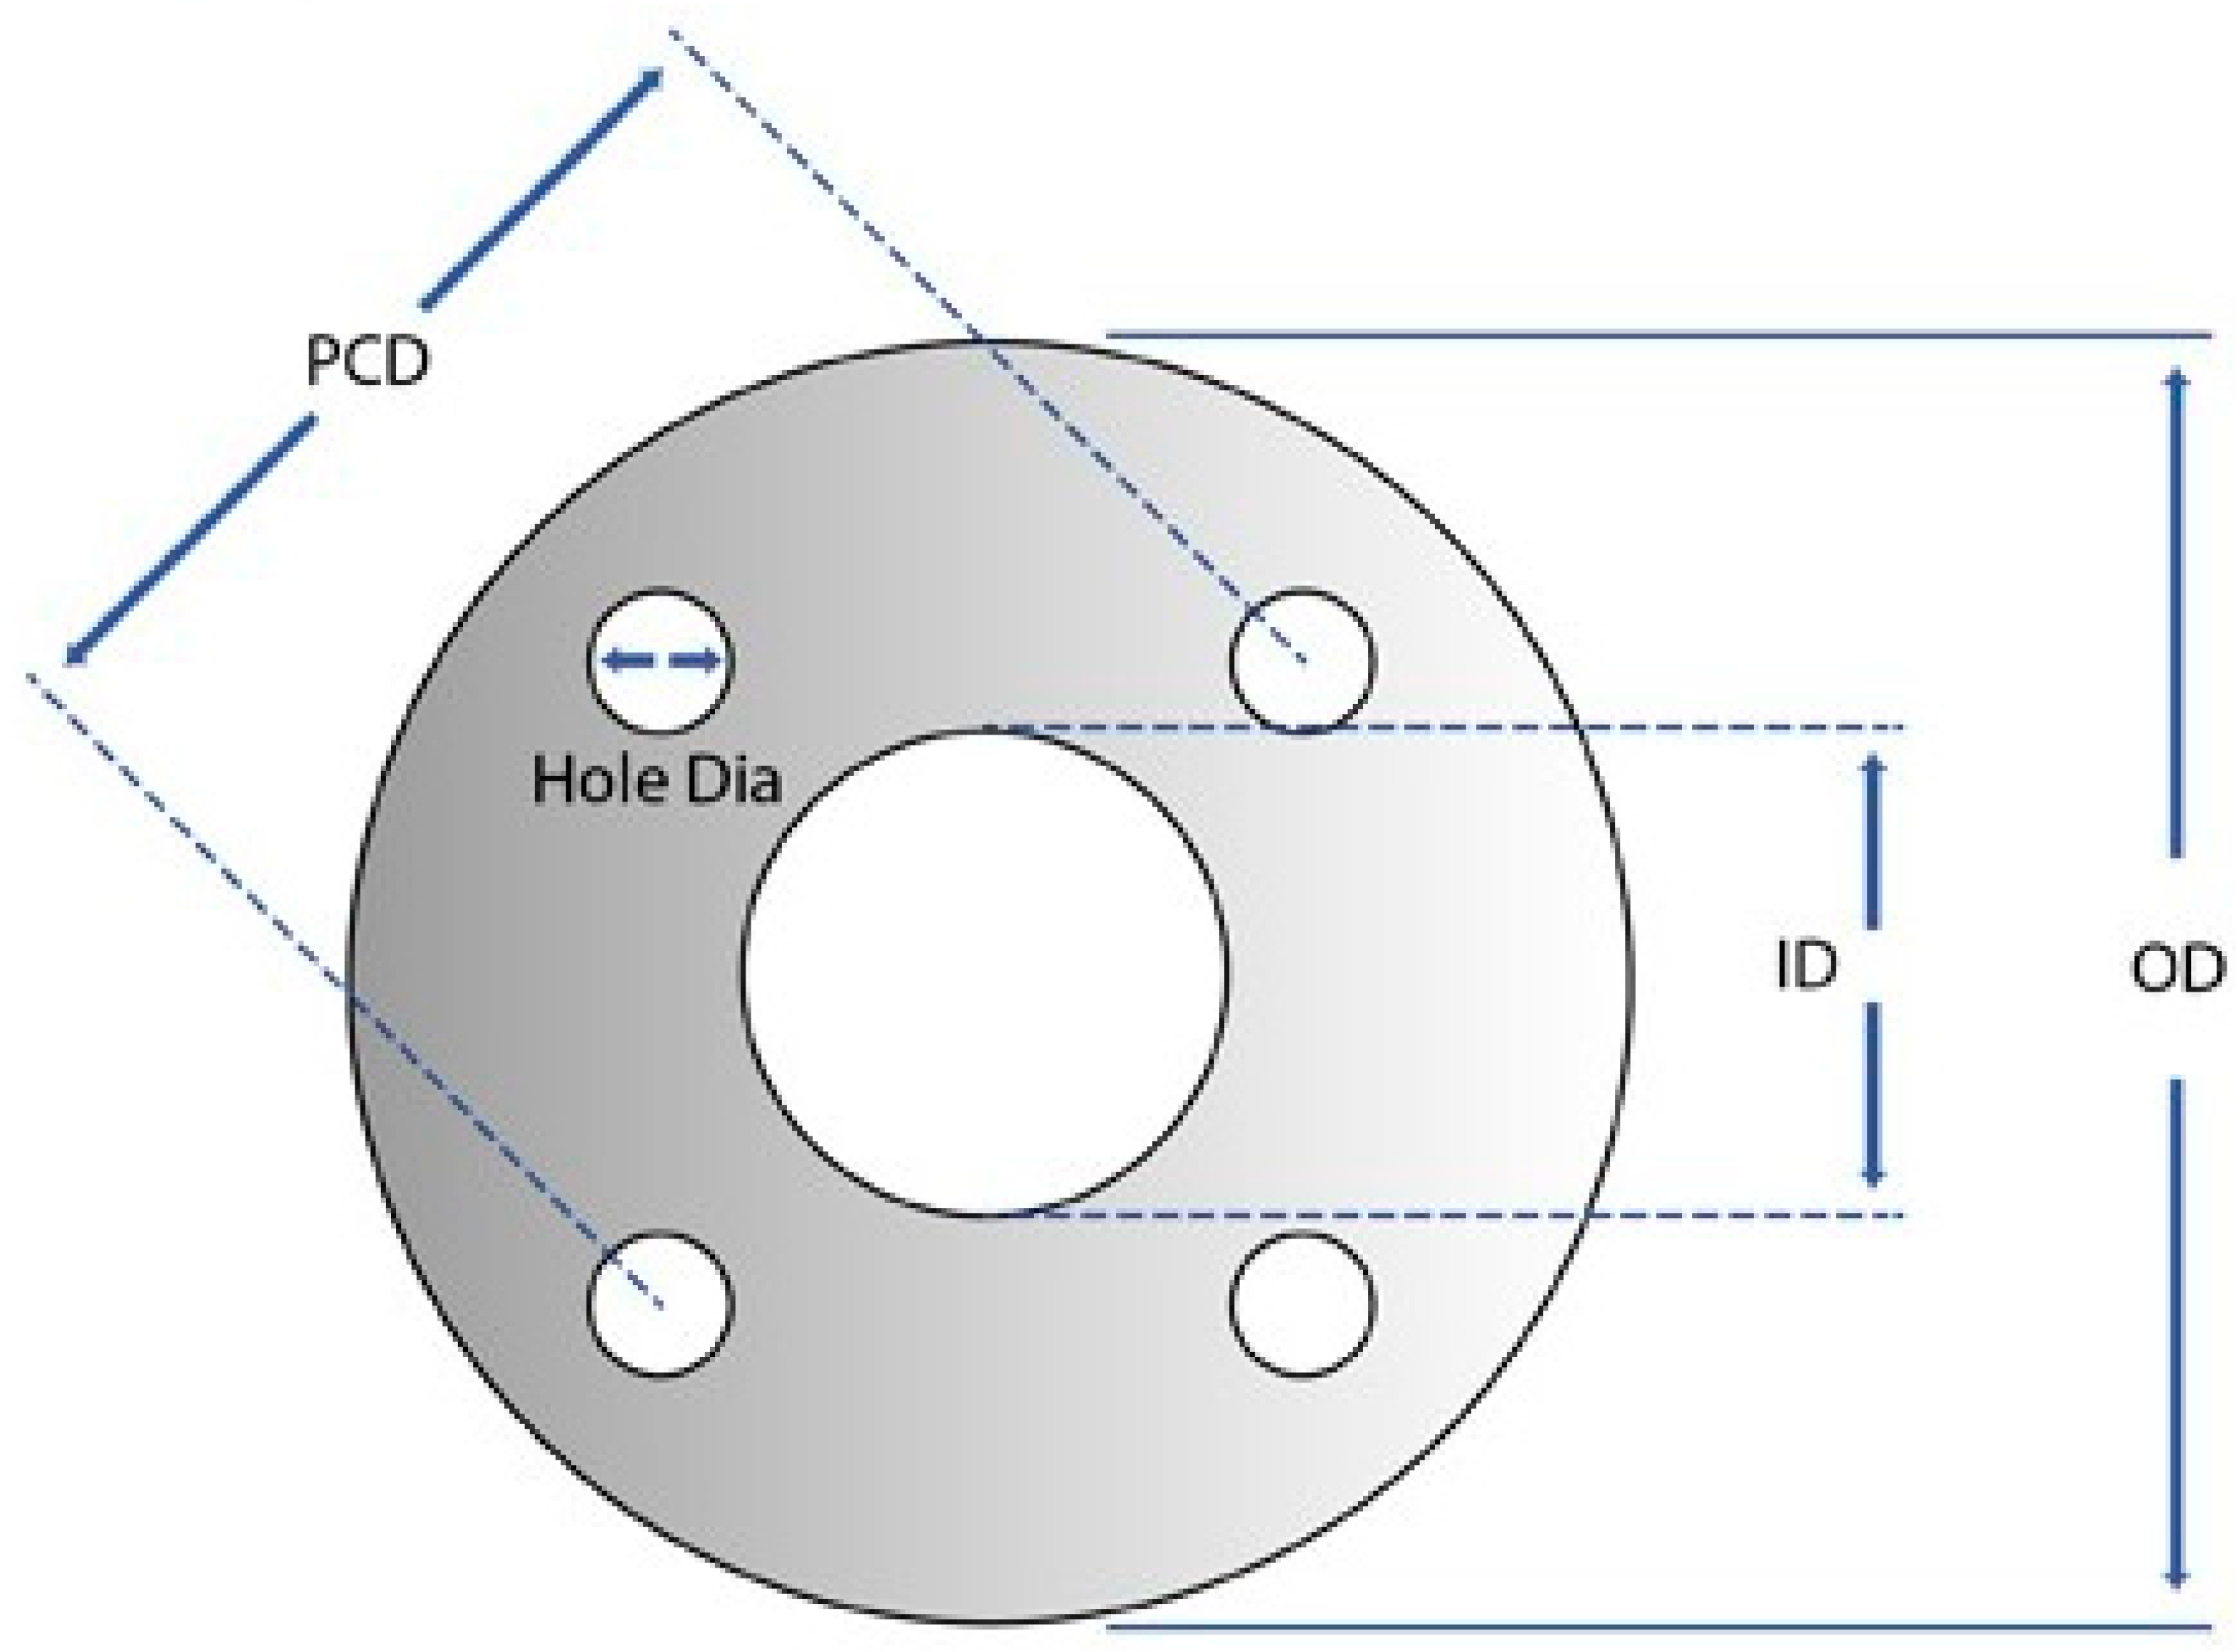
Figure 7.
Mesh View.
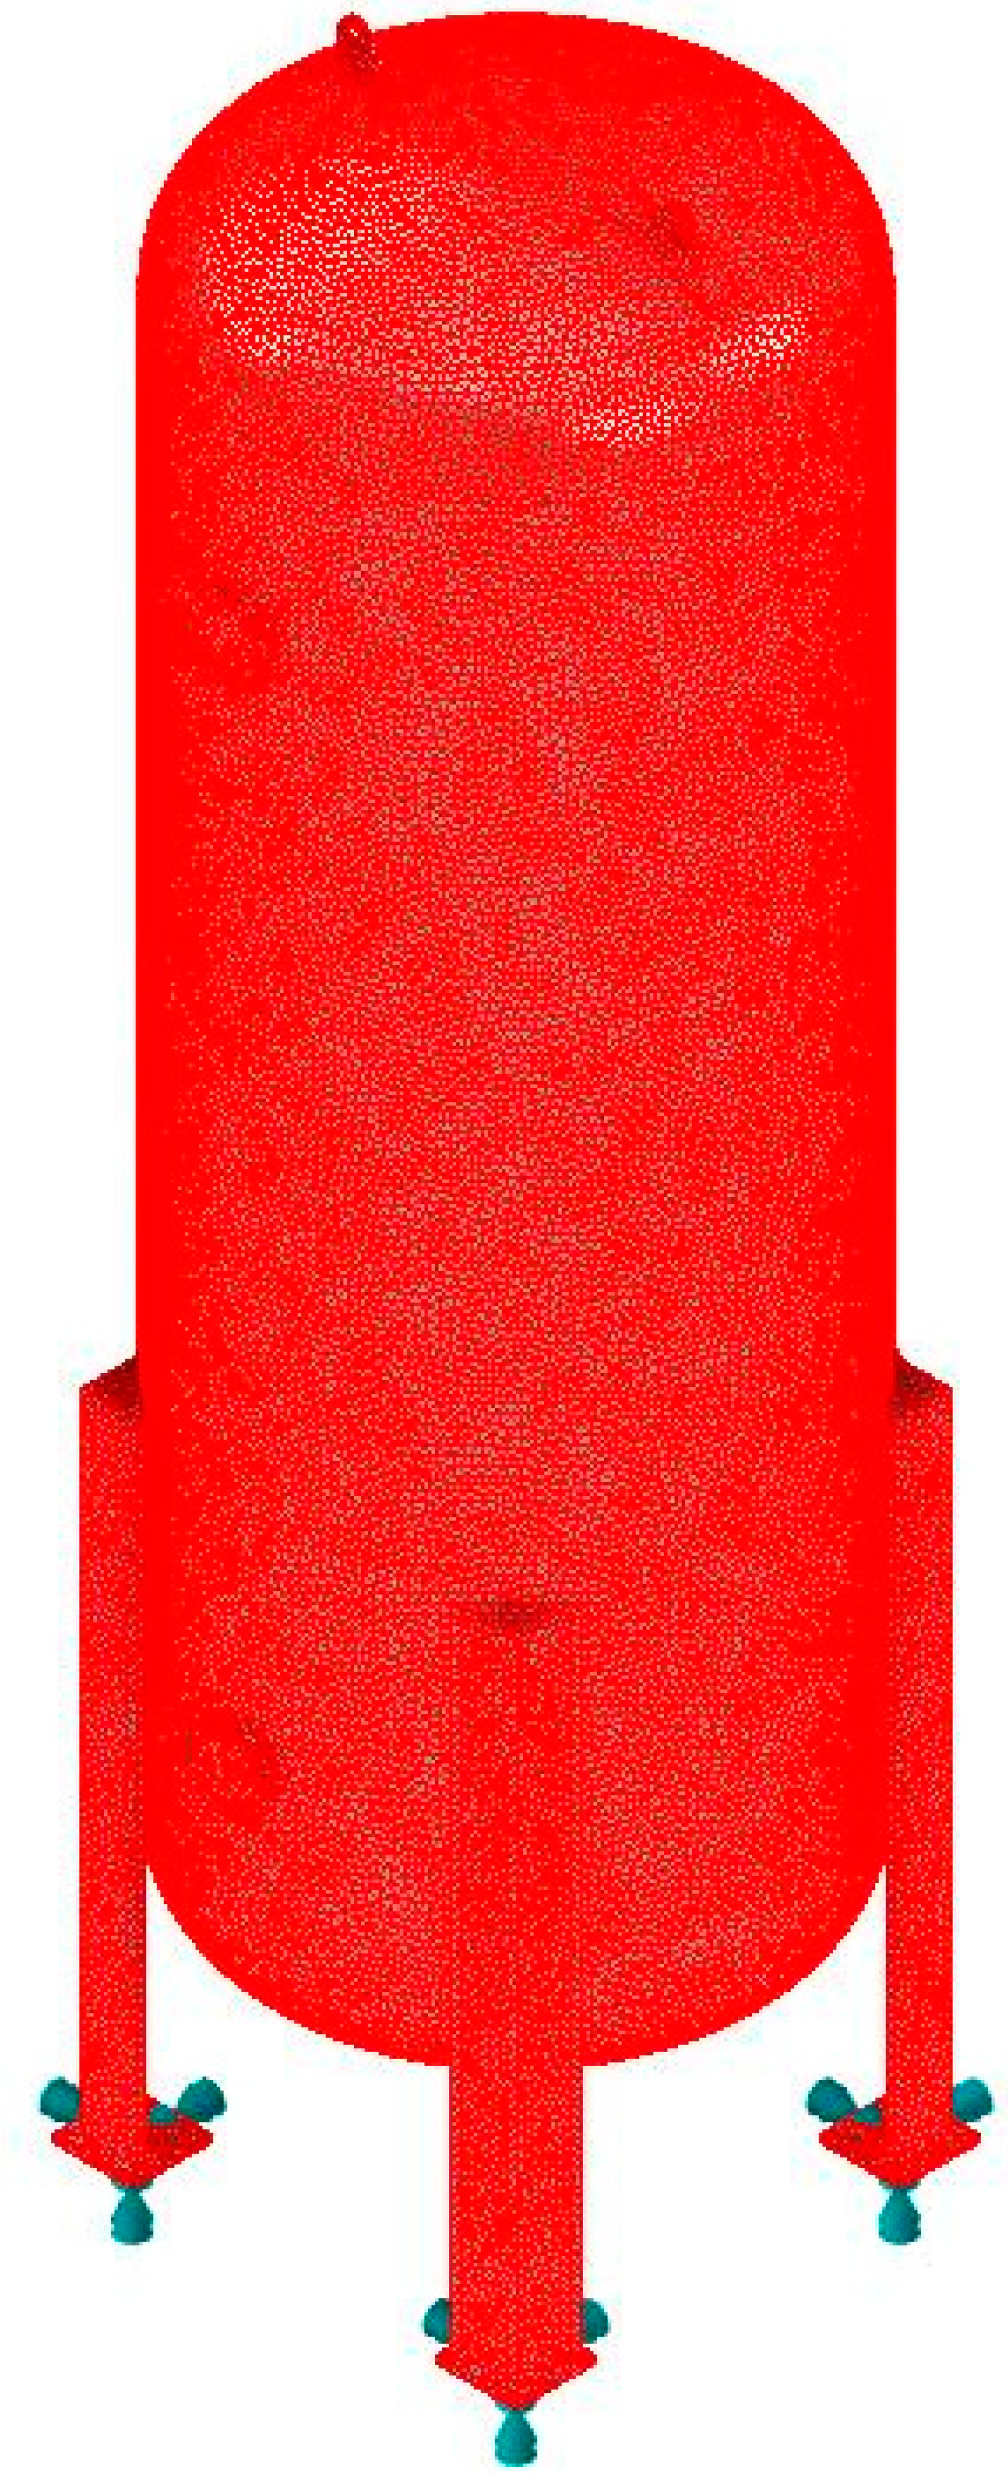
Figure 8.
D View Model.
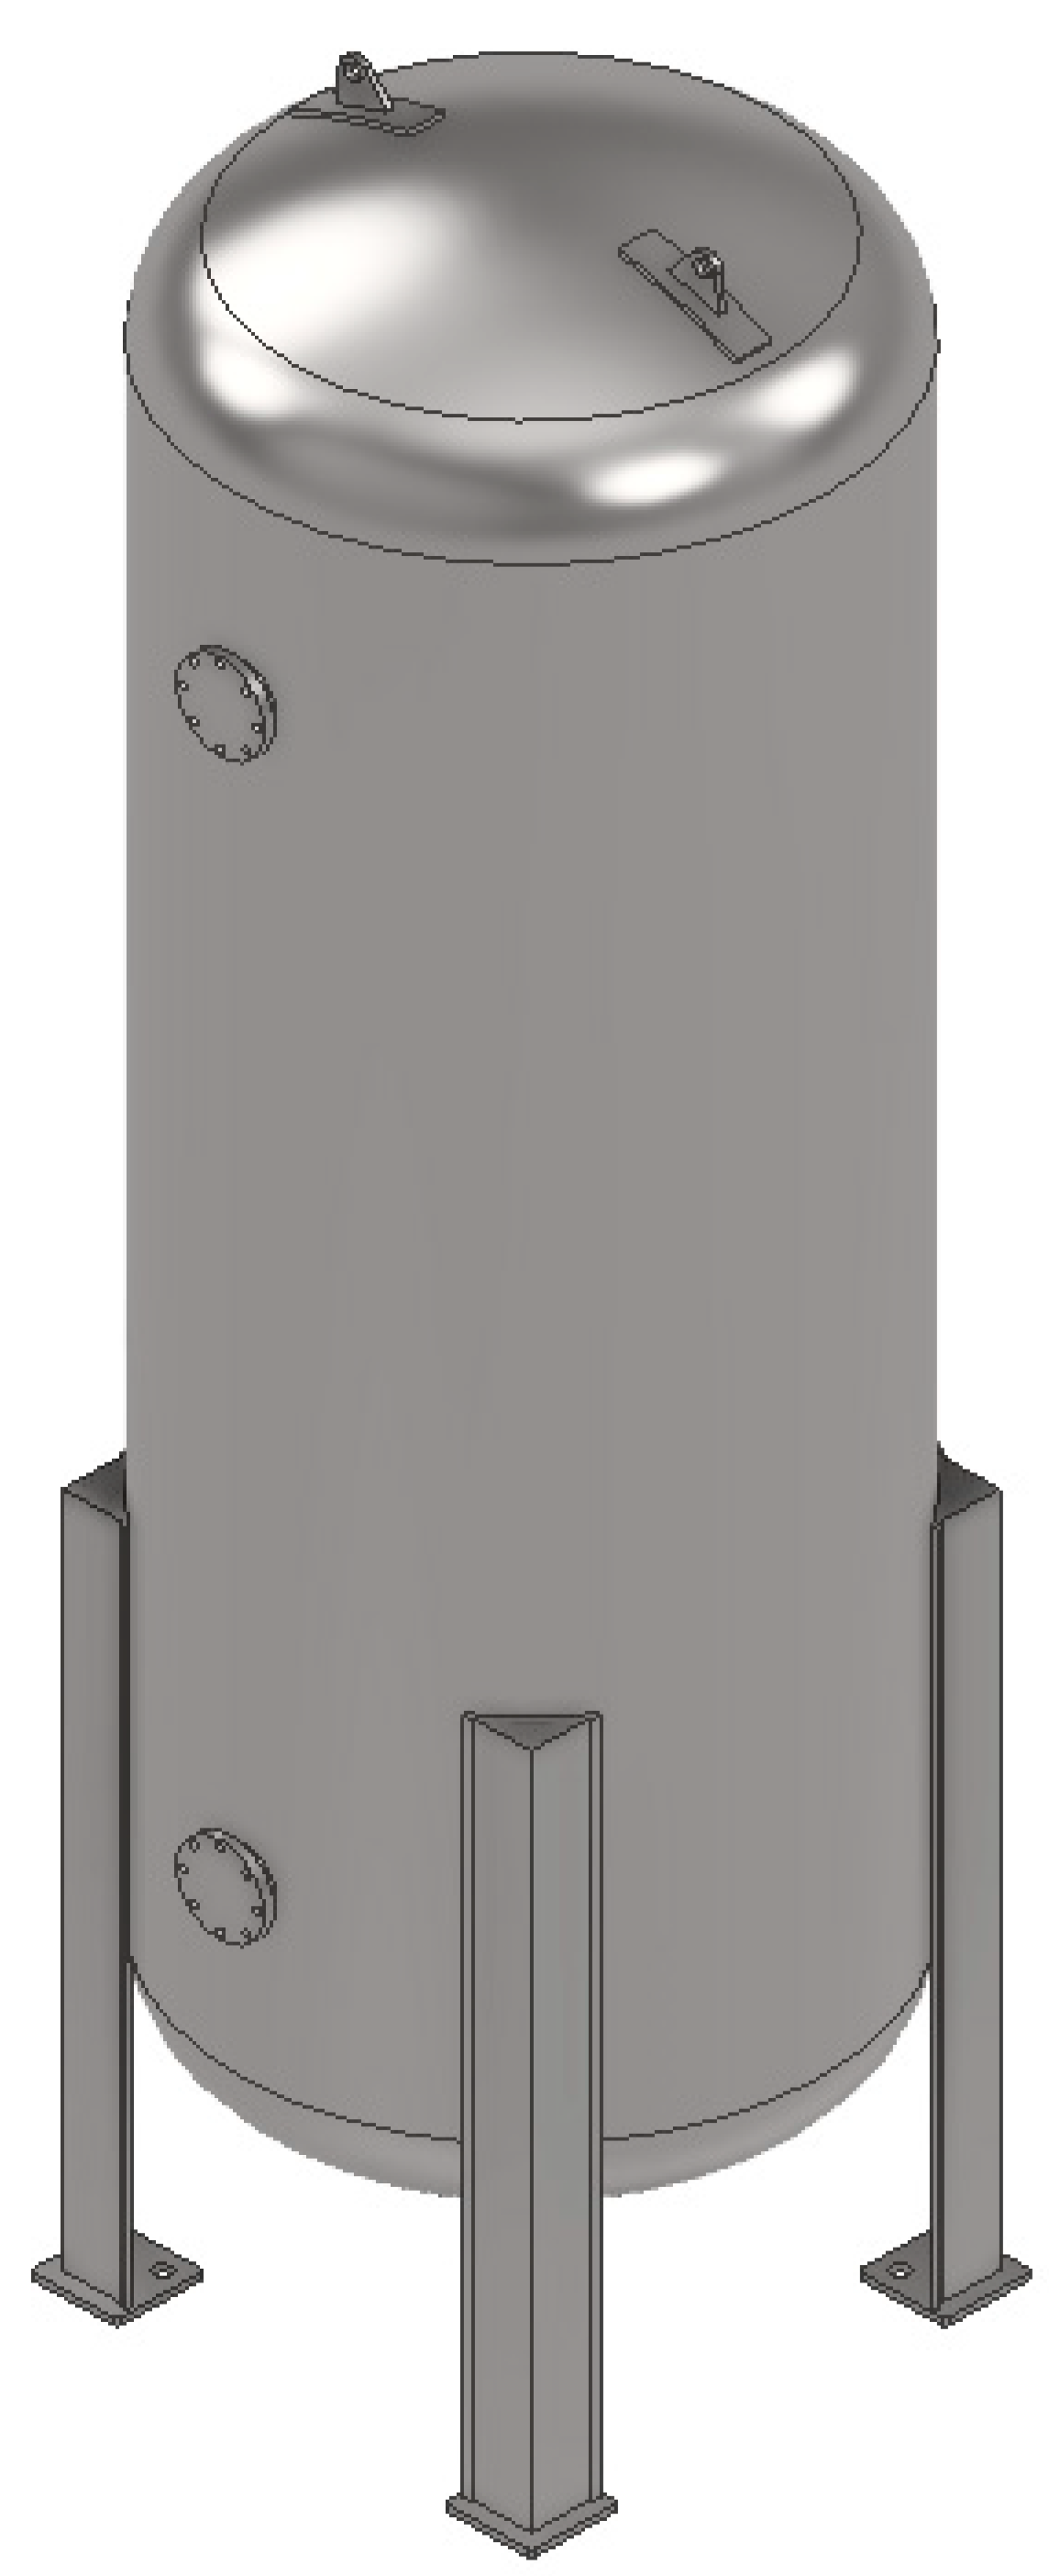
Table 1.
Initial Technical Detail.
| Initials | Value | Units |
|---|---|---|
| Internal Design Pressure Max | 1.55 | MPa |
| Internal Temperature Max | 100 | °C |
| Capacity | 10,000 | L |
| Orientation | Vertical | N/A |
| Fluid | LPG | N/A |
| Corrosion Allowance | 3.0 | mm |
Table 2.
Optimum geometry ratios based on ASME guidelines.
| Pressure (PSIG) | Length/Diameter Ratio |
|---|---|
| 0-250 | 3 |
| 250-500 | 4 |
| >500 | 5 |
Table 3.
Material Specification & Properties.
| Specification | Mechanical Properties | ||
|---|---|---|---|
| COMPONENTS | MATERIAL GRADE | ||
| Shell | SA- 516 Gr 70 | Tensile strength, Ultimate | 485-620 MPa |
| Head | SA- 516 Gr 70 | Tensile Strength, Yield | 260 MPa |
| Base Plate | SA- 516 Gr 70 | Young ‘s modulus of Elasticity | 200 GPa |
| Rib Plate | SA- 516 Gr 70 | Bulk Modulus | 160 GPa |
| Flange | SA- 516 Gr 70 | Poisson’s Ratio | 0.29 |
| Leg | SA- 516 Gr 70 | Shear Modulus | 80 GPa |
Table 5.
Comparison Mesh Element Number Versus Equivalent Stress.
| Element size | Mesh Element Number | Equivalent stress (MPa) |
|---|---|---|
| 26 | 279282 | 426.207 |
| 25 | 299221 | 435.837 |
| 24 | 325105 | 434.686 |
| 23 | 354472 | 438.399 |
| 22 | 388533 | 431.13 |
| 21 | 430232 | 427.282 |
| 20 | 477625 | 429.282 |
| 19 | 534206 | 427.866 |
| 18 | 591292 | 424.76 |
| 17 | 660785 | 424.76 |
| 16 | 741392 | 424.76 |
| 15 | 855912 | 424.76 |
| 14 | 991044 | 424.76 |
| 13 | 1162782 | 424.76 |
Table 6.
Simulation results.
| Variable | Maximum value | Units |
|---|---|---|
| Equivalent stress, Von mises | 280.194 | MPa |
| Z-Normal Stress | 97.530 | MPa |
| XY-Shear Stress | 46 | MPa |
| Displacement along y-axis | 1.484 | mm |
| Displacement along x-axis | 0.504 | mm |
Disclaimer/Publisher’s Note: The statements, opinions and data contained in all publications are solely those of the individual author(s) and contributor(s) and not of MDPI and/or the editor(s). MDPI and/or the editor(s) disclaim responsibility for any injury to people or property resulting from any ideas, methods, instructions or products referred to in the content. |
© 2023 by the authors. Licensee MDPI, Basel, Switzerland. This article is an open access article distributed under the terms and conditions of the Creative Commons Attribution (CC BY) license (http://creativecommons.org/licenses/by/4.0/).
Copyright: This open access article is published under a Creative Commons CC BY 4.0 license, which permit the free download, distribution, and reuse, provided that the author and preprint are cited in any reuse.


