1. Introduction
Different medical imaging modalities are available for diagnostic purposes, including magnetic resonance imaging (MRI), X-ray, ultrasound (US), nuclear medicine and computed tomography (CT) during last decade. These images are used in the implementation and validation of new segmentation algorithms and depending on the imaging modality, the applications developed are for edge detection, organ localization, region segmentation or lesion detection. Furthermore, several images of the same type of modality are usually taken over a period of time on a particular part of the body to observe and analyze how the structure evolves. In many cases, this same process is carried out on several people who meet certain conditions to compare them with each other and observe the pattern that follows [
1,
2,
3,
4].
In recent years, the adaptation of segmentation systems in the medical field has become increasingly important [
5,
6,
7,
8,
9]. These tools, with the supervision of specialized personnel, facilitate the work they perform in hospitals [
10,
11]. In essence, segmentation involves the process of dividing an image into separate regions by examining pixel attributes. This allows for the identification of objects or boundaries, ultimately simplifying the image and enabling more efficient analysis. In the medical field, image segmentation allows a more precise analysis of anatomical data. Segmentation is a crucial step in extracting the region of interest from a medical image (2D or 3D). This process can be carried out manually, semi-automatically, or fully automatically [
12,
13,
14,
15].
In the pediatric field, many studies are focused on extracting images using US techniques, as well as the execution of segmentation techniques applied to these images [
16]. An example of such a case is the automatic segmentation of ultrasound images employing morphological operators [
17]. In this study, a technique for the automatic measurement of femur length in fetal ultrasound images is introduced. Additional examples concentrate on investigating the fully automatic segmentation of the common carotid artery through machine learning techniques applied to ultrasound (US) images. This research explores a notable distinction from prior studies by primarily focusing on pixel classification using artificial neural networks to detect Intima-Media Thickness (IMT) boundaries [
18]. In this context, brain imaging was employed to perform real-time segmentation, analysis, and visualization of the deep cervical muscle structure using ultrasound [
19].
In addition, some authors use a method based on Hough voting, a strategy that allows localization and fully automatic segmentation using Convolutional Neural Networks (CNN) in magnetic resonance images. Research has been conducted on the examination of the brain in premature infants using magnetic resonance imaging (MRI) to compare cortical folding patterns between healthy fetuses and early preterm infants through cross-sectional imaging [
20]. It is important to notice that this study is during a critical developmental period for the folding process between 21–36 weeks gestational age (GA). Furthermore, an investigation was conducted to explore the dynamics of cortical folding waves and deviations associated with prematurity. This analysis involved spatial and spectral analysis of gyrification patterns [
21]. Finally, a typical folding characterization and progression are performed to post-term period using a spectral analysis of gyration (SPANGY) method in preterm infants.
Medical imaging, particularly ultrasound, can present challenges in identifying well-defined structures (i.e. grooves) due to the presence of speckle noise. Speckle noise is a type of noise that is present in ultrasound images and is caused by the interference of the sound waves as they bounce off different tissues and structures in the body. Speckle noise appears as a granular pattern, which can significantly degrade the image quality, making it difficult to distinguish fine details in images during a diagnostic examination. To overcome this challenge, multiple image processing techniques, including filtering and segmentation, can be applied to reduce speckle noise effects and enhance the visual clarity of structures. Specifically, the cerebral cortex, which constitutes the brain’s outer surface, exhibits a markedly uneven nature distinguished by a unique arrangement of folds called gyri (singular: gyrus) and grooves referred to as sulci (singular: sulcus) [
23].
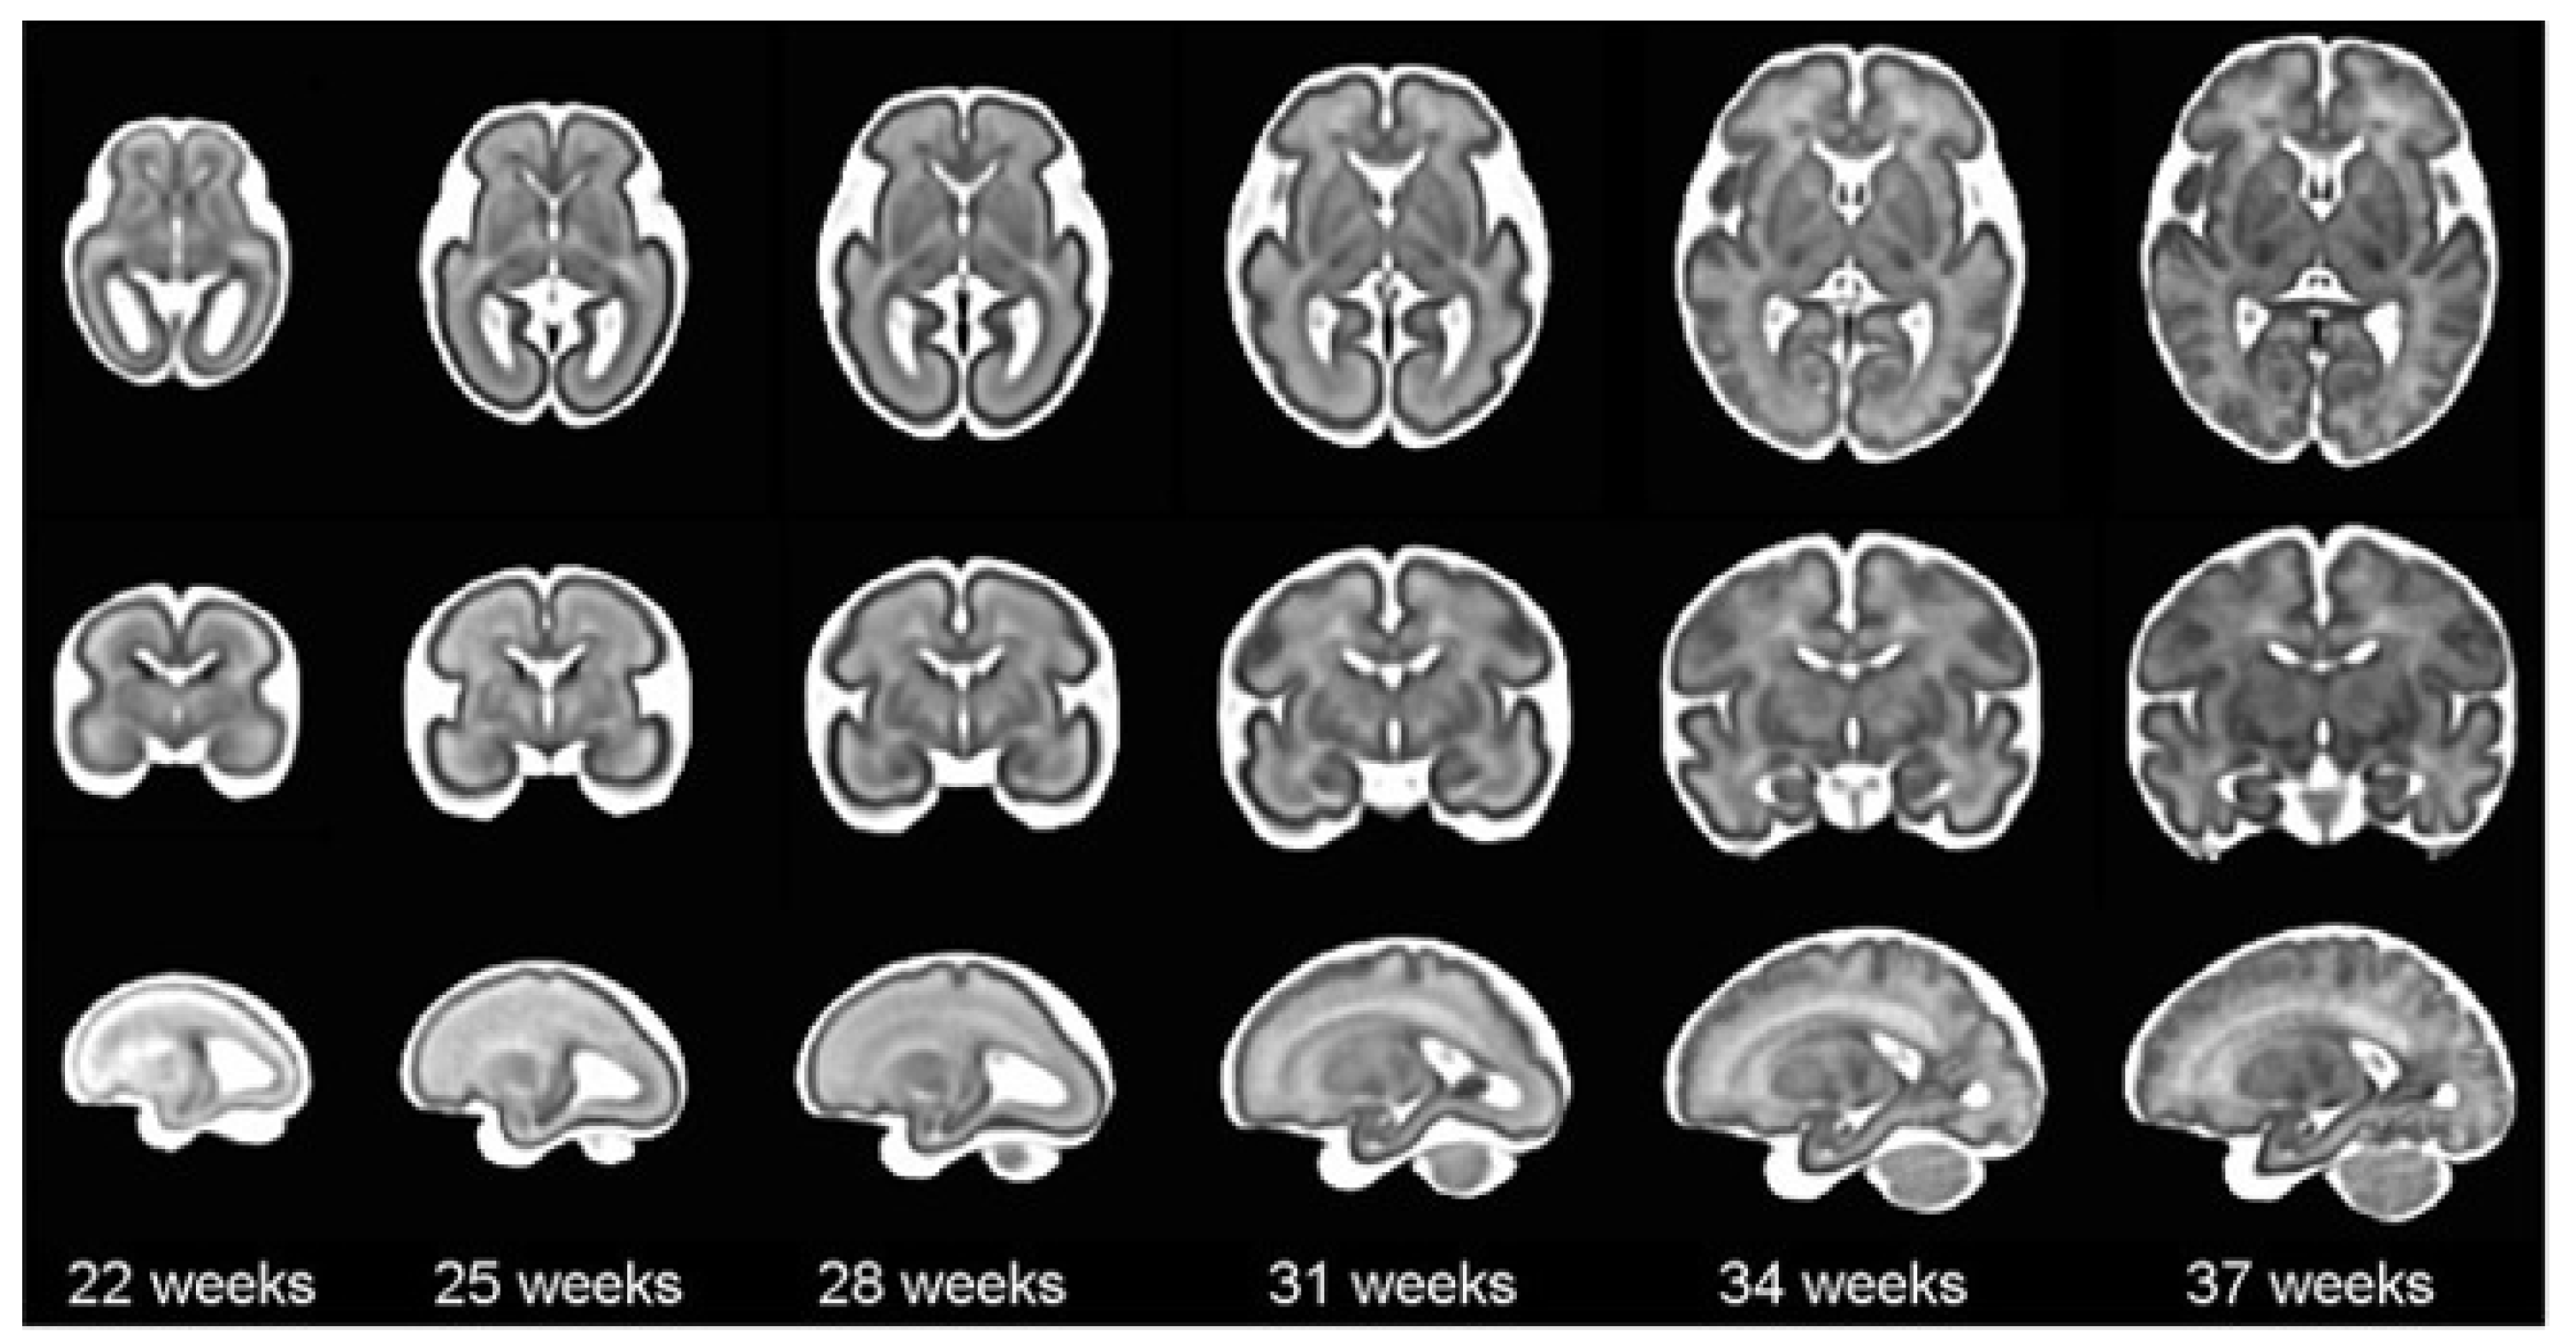
Concerning the theoretical framework, it is worth mentioning that brain maturation is different when comparing a newborn that has completed 9 months of gestation with a preterm baby that has grown outside the womb. All babies born alive before 37 weeks of pregnancy are considered premature.The categorization is contingent upon the gestational week of birth where the subcategory is defined as: "Extremely preterm" encompasses infants born before 28 weeks; "Very preterm" between 28 to 32 weeks; and "Moderate" to late preterm between 32 to 36 weeks. The causes that lead to preterm birth are diverse and may be due to maternal, fetal, or placental factors. The database used is based on a set of brain images (ultrasounds) that show its evolution. These images contain the evolution of the grooves through two planes: coronal and sagittal [
24]. The sulci of the brain are developed in the last trimester of pregnancy and are important since they fulfill a function of increasing the surface. Depending on the development, the gestation date can be dated using magnetic resonance techniques (
Figure 1).
In this work, the hospital’s medical staff is in charge of checking and correcting the results obtained from the segmentation to guarantee its accuracy. To achieve this objective, we will work with sequential brain images provided by two neonatologists from Hospital Sant Joan de Déu of premature babies of different gestational ages and in different coronal and sagittal planes. The objectives for the complete application would be the following:
Develop a semi-automatic GUI platform that enables the segmentation of cerebral grooves in ultrasound images.
Implement various segmentation techniques and pre-processing tools to improve the accuracy of the segmentation results.
Provide a user-friendly design for running, visualizing, and analyzing of the segmented images.
Enable the storage and management of a validated atlas of cases by medical experts to monitor the evolution of cerebral grooves in premature babies as the weeks progress.
Ensure that the platform is easy to use and accessible to medical professionals, even those without extensive image processing expertise.
By achieving these objectives, the work will provide a valuable tool for clinicians to monitor the brain development of premature babies and identify any potential issues early on.
This paper is structured into distinct sections. One section focuses on the dataset, providing an overview of the implementation and features of the proposed semi-automatic GUI platform (
Section 2). The methodology, implementation details, and results obtained are presented, highlighting the different segmentation algorithms utilized and their respective characteristics. Another section includes a specific experimental case study that serves to showcase the benefits of the proposed approach (
Section 3). Lastly, the results are discussed from a clinical perspective (
Section 4), leading to the presentation of conclusions and outlining potential avenues for further works (
Section 5).
2. Materials and Methods
Materials and methods used for the development of the application will be explained in this section. In the initial part of this study, we provide a detailed description of the database comprising ultrasound images of a group of premature infants (
Section 2.1). Secondly, the design of the GUI platform and the software requirements applied to develop the application, and are detailed in
Section 2.2. Finally, the methods to obtain the segmentation of the main furrows are explained and some examples of each one of them are shown in
Section 2.3 and digital repository and distribution (
Section 2.4).
2.1. Database and experimental data
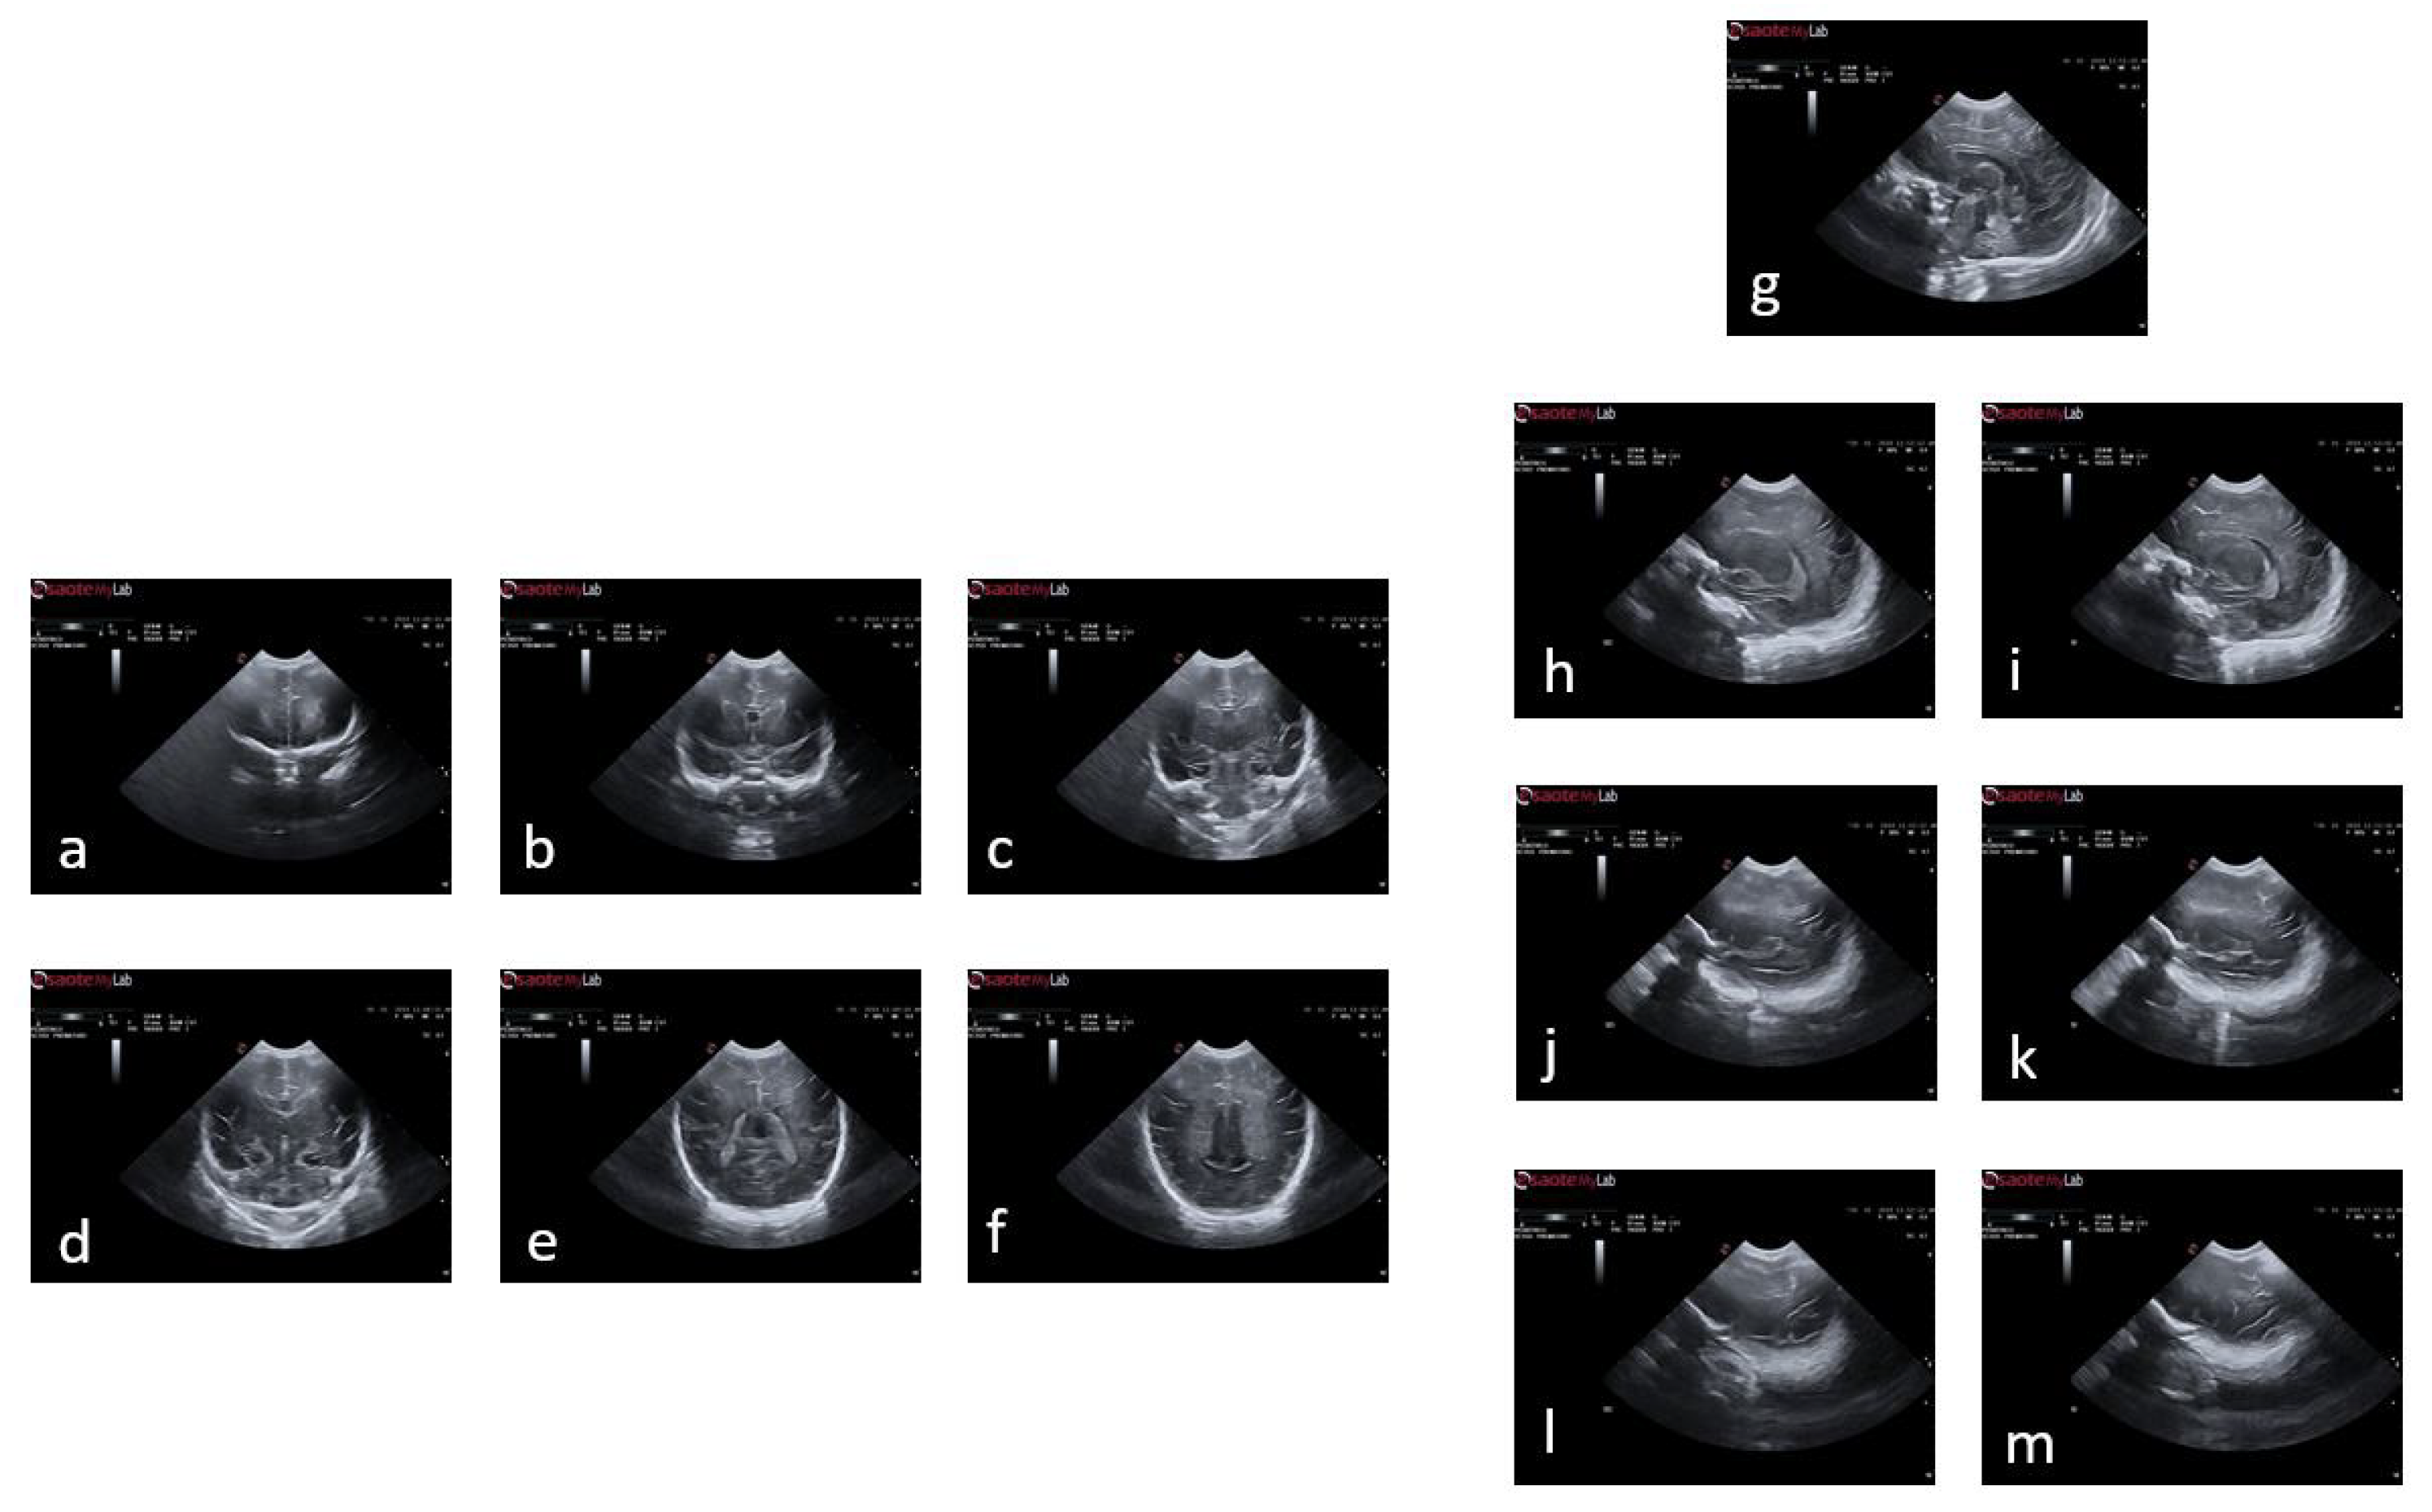
The neonatology department at Hospital Sant Joan de Déu has contributed a comprehensive brain ultrasound database. The database is organized into multiple sections, covering several weeks of examination. Two imaging planes, namely coronal (c1, c2, c3, c4, c5, and c6) and sagittal (s1, s2l, s2r, s3l, s3r, s4l, and s4r), were analyzed and included in the database (
Figure 2). The timing in each case could vary depending on the clinical status of the infant. The final repository of images provided for the tool had more than 140 subjects of which 77 have been used for this study. Infants were excluded if they presented brain pathology at birth, intrauterine growth restriction, there were born from a multiple pregnancy or they presented genetic anomalies or major malformations. The original images provided by the clinicians are RGB images in BMP format measuring 800 pixels high and 1068 pixels wide. These images were pre-processed before being used in the application and converted into RGB images in JPG format measuring 550 pixels high and 868 pixels wide.
2.2. Graphical User Interface and software requirements
This section will explain three different aspects of programming in the project: the coding programs used, the programming languages utilized, and the libraries employed. The libraries will provide pre-existing, complex functions for the programmer to use in the defined code.
2.2.1. GUI interface design and functionalities
To simplify the execution and interaction with the code without the need for direct programming, an interface was necessary for the algorithm. The Dash library was used to accomplish this, as it allows for the creation of interactive platforms that can be accessed through a browser without requiring knowledge of HTML, CSS, or Javascript. Dash offers several advantages, including the ability to work with complementary libraries such as dash-html-components for designing structures, and dash-core-components for basic components like buttons, plots, and drag and drop functionality. Both libraries can be used with Python, allowing for the creation of a platform with its corresponding functions entirely using this programming language.
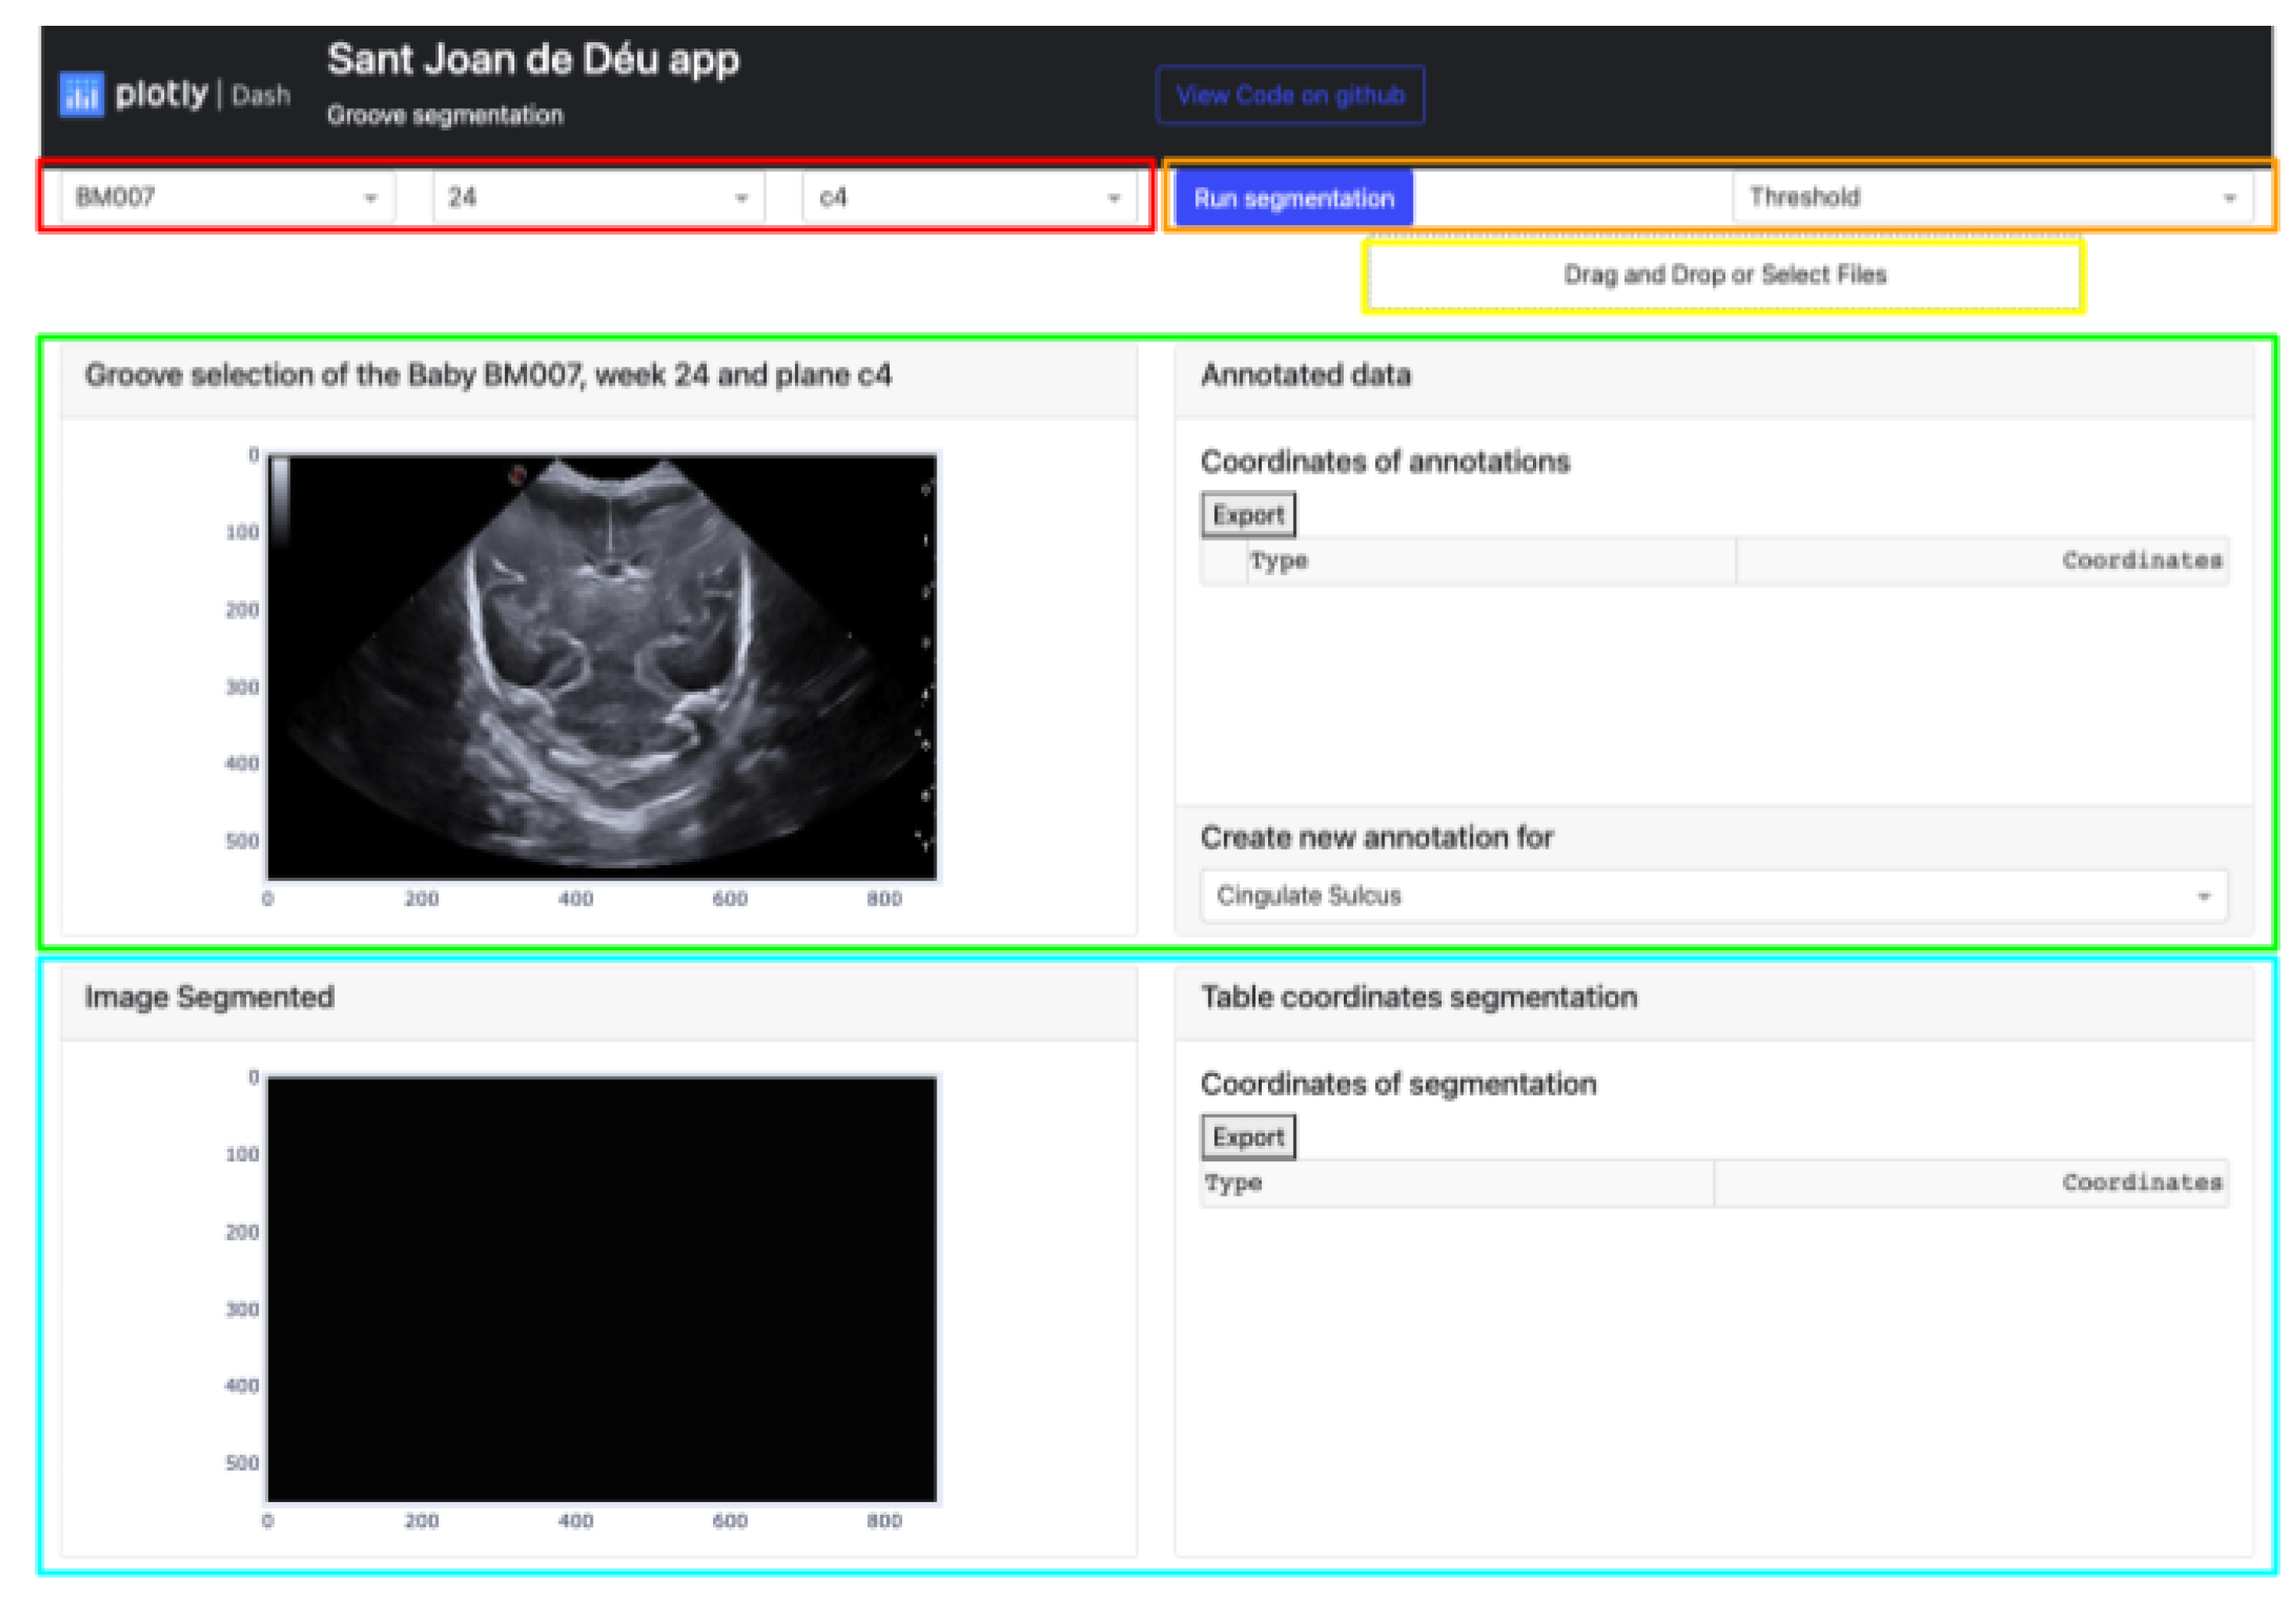
Dash can be divided into two distinct parts: one is focused on defining the aesthetic design of the application, while the other is more concerned with the functional aspects that rely on user interaction. The GUI platform depicted in
Figure 3 offers a range of powerful functionalities for image processing and segmentation functions. The main features of this platform include:
The buttons that allow the selection of the image from which the manual segmentation is going to be performed. These buttons are adaptive and show the infant identification, weeks and plane.
Located in the top-right corner of the platform are two buttons. The leftmost button displays the type of segmentation applied, which could be either Threshold, Sigmoid + Threshold or Snake. Clicking the blue button initiates the execution of the selected segmentation algorithm.
The Select Box or Drag and Drop feature enables the import of an exported Excel file and displays it through the upper cards. This allows viewing both the segmentation obtained by certain methods and the corresponding coordinates in the annotation table.
The top section of the interface contains two cards that handle the segmentation process. The card on the left displays the image selected via the top buttons and enables the user to define the groove area to be segmented. On the other hand, the right card exhibits the coordinates of each manual segmentation executed for each pathway in a table. A button at the bottom enables the selection of the path to be segmented, while the top button exports the table to an excel file.
The lower section of the platform consists of two cards. The first card displays the segmented grooves obtained by the selected method, while the second card displays the numerical coordinates of the defined segmentation. The second card also features an export button that enables users to save the data in an Excel file.
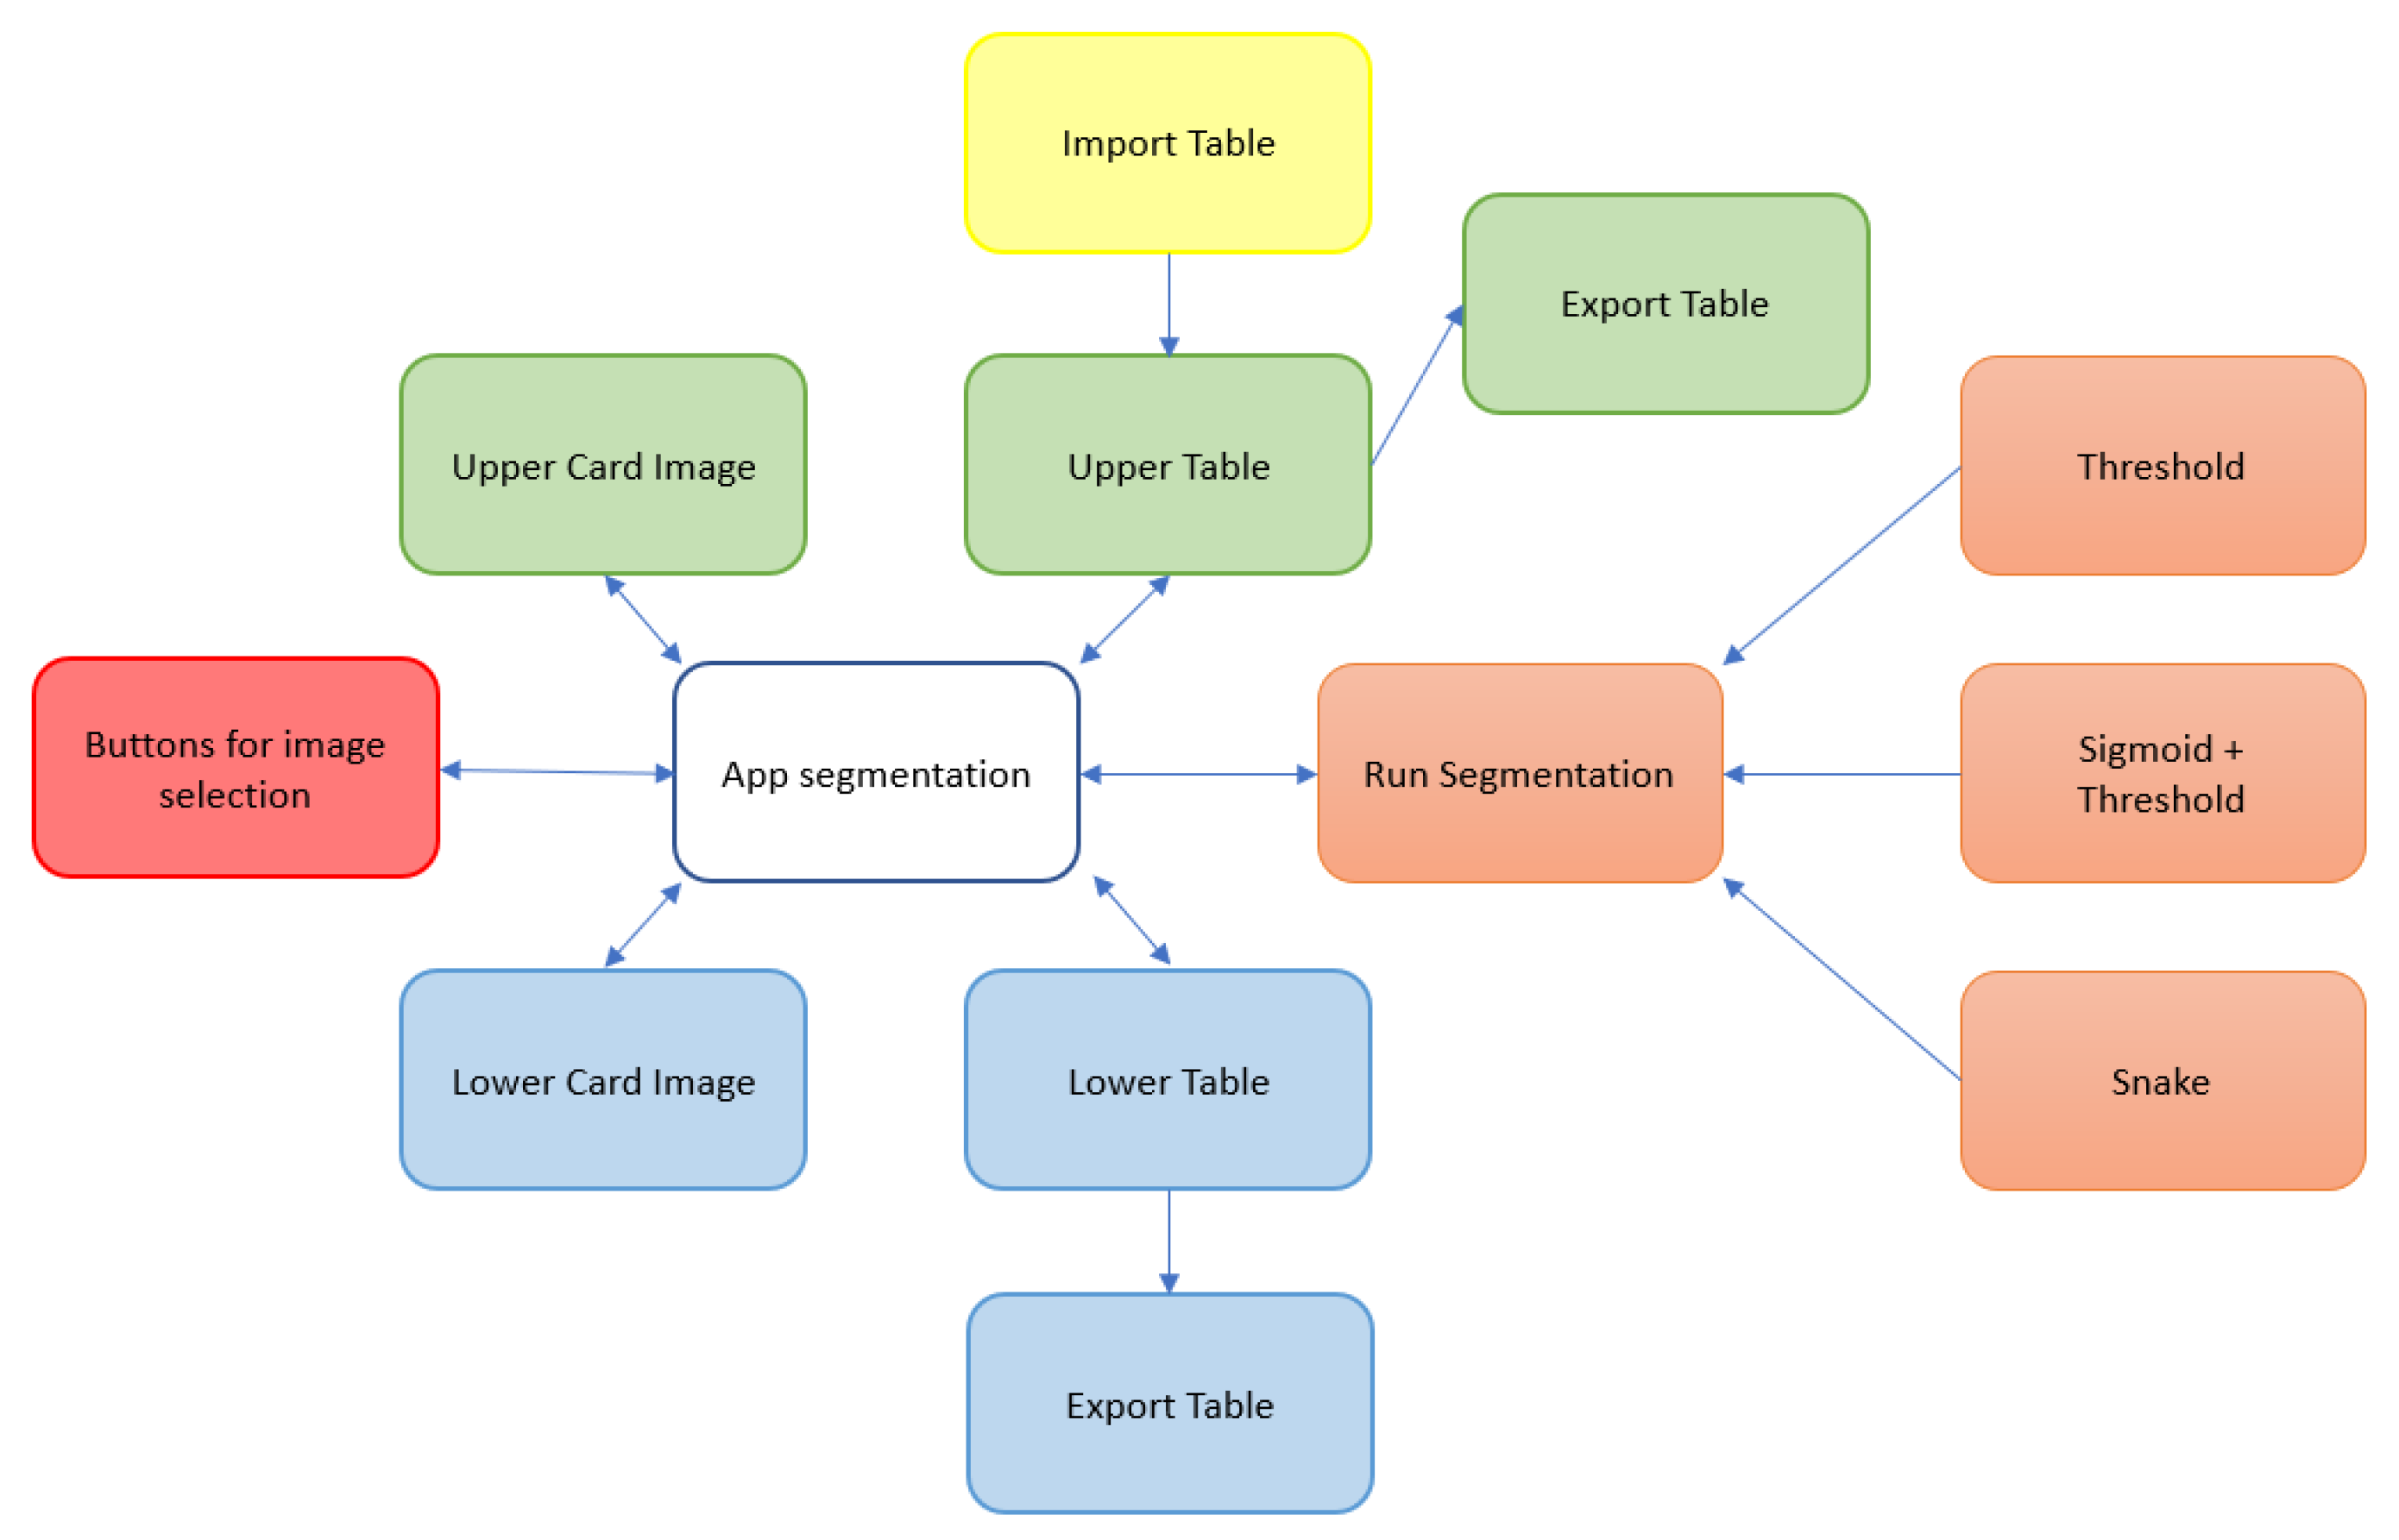
Figure 4 illustrates the block diagram showing the functionalities and interactions of the proposed application, and providing an overview of how different components work together.
2.2.2. Software requirements
This platform is utilized for programming algorithms and functions by writing lines of code. They not only facilitate code execution but also enable result visualization.For this project, two distinct development tools were used (Google Colab and Jupyter). Each program has its own advantages, although both are used for the same programming language.
Google Colab was utilized to test and evaluate the various methods applied to the images, as their size varied depending on the operations performed, making them too large to be processed locally.
Jupyter was employed to develop and evaluate the platform specifically designed for medical practitioners, after finalizing its functionalities and design. This allowed for the local machine-based verification of both the platform and the algorithm’s performance.
Python has been the programming language of choice for the project, used for implementing various techniques, functions, neural networks, and developing the platform. Python is a multiparadigm programming language that supports object-oriented and imperative programming, as well as functional programming to some extent. In order to use Python for creating interfaces and obtaining the desired results from various methods, it is necessary to install and import relevant libraries depicted in
Table 1.
To conclude this section, specialists will utilize the Docker platform to run the web analytic platform. Docker enables developers to swiftly create, run, and scale their platforms by generating containers. These containers serve as standard units that bundle the code and dependencies required for the platform to function reliably in different computing environments. Each container requires an image, which is a self-contained, lightweight, executable software package containing all the necessary components such as code, runtime, system tools, libraries, and configurations. Containers are isolated from the host environment, ensuring consistent performance regardless of variations between development and staging environments. Essentially, containers provide virtualization of the operating system or environment rather than the hardware, resulting in portable and efficient platforms when moved across devices.
2.3. Methodology structure and implementation
In grayscale images, the intensity increases as the pixel value approaches 255, which represents white. This value is determined by the fact that each pixel is represented by an 8-bit binary value, which, when converted to decimal, can range only from 0 to 255. The platform utilizes the Local Thresholding method to account for the noise and undefined areas commonly present in ultrasound images. This method involves selecting regions (
) around each pixel in the input image to determine its value based on a defined method and parameter (
). In the "Gaussian" method, a specific sigma value is utilized, whereas in the "generic" method, a function object is employed to calculate the threshold for the center pixel. This calculation is based on the flat matrix of the local neighborhood, as specified in Equation
1.
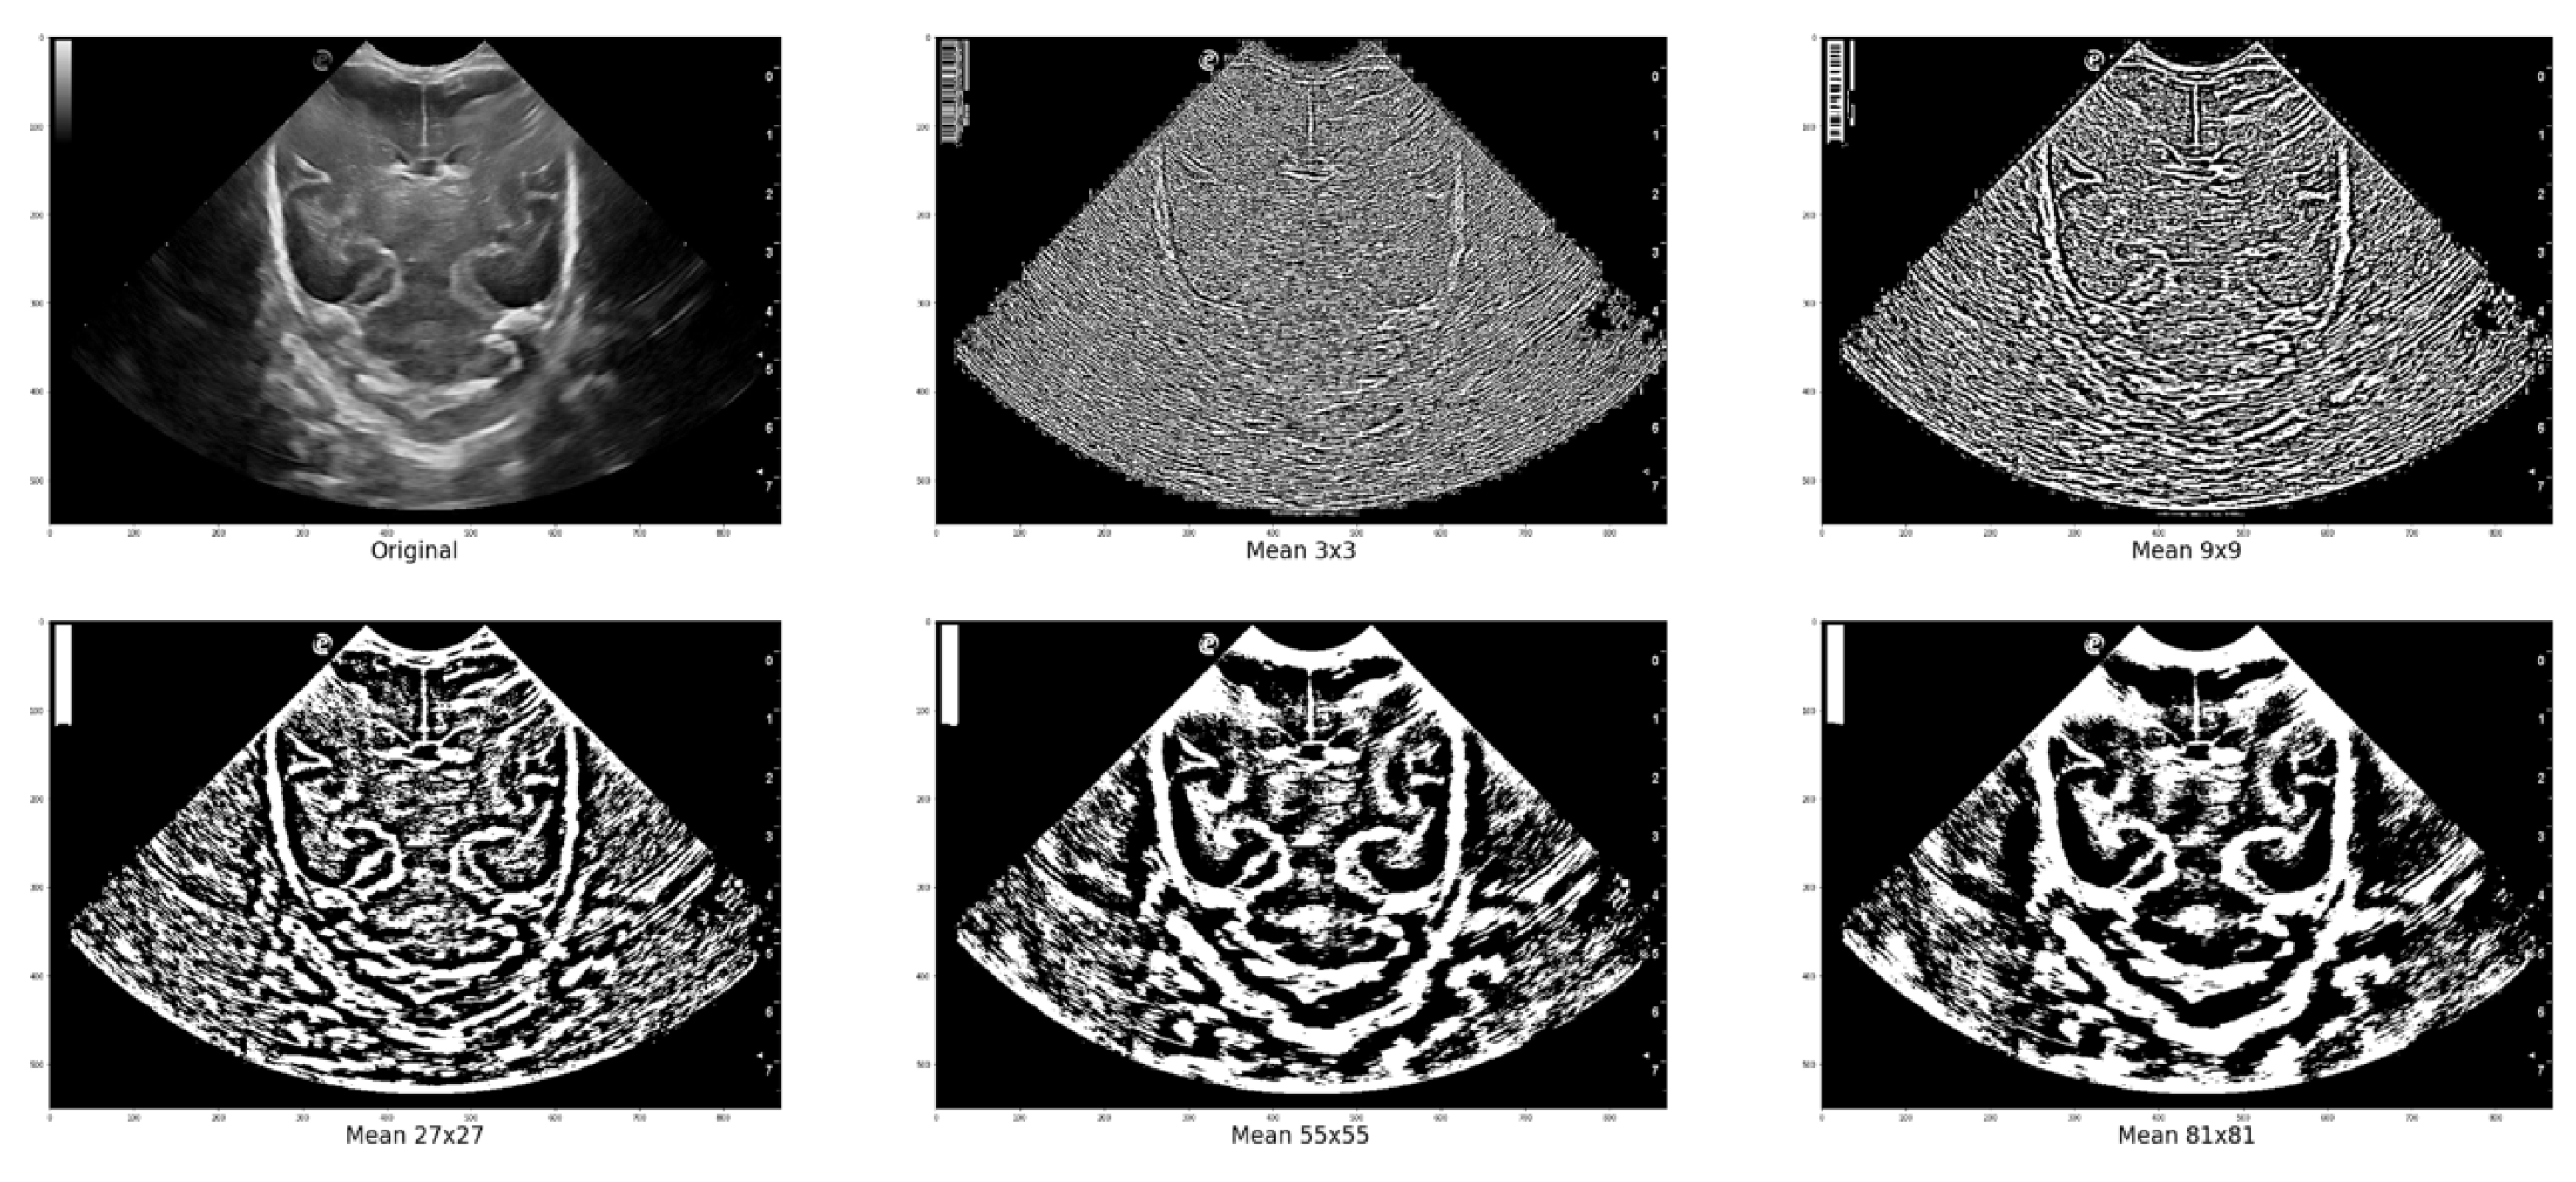
Figure 5 displays various images where local thresholding was performed on different regions. The images show how regions with greater intensity are distinct and separated from other areas where there are no grooves or bones.
In all the utilized methods, a cropping operation is performed on the designated groove area, followed by a pre-processing step for the segmented region. This pre-processing involves scaling and adjusting the maximum and minimum pixel values of the obtained images. The largest pixel value is normalized to 1, while the smallest pixel value is normalized to 0. For the remaining pixels, a scaling function is applied, where each pixel in the image is subtracted by the minimum value and divided by the difference between the maximum and minimum values within the clipped image represented in Equation
2.
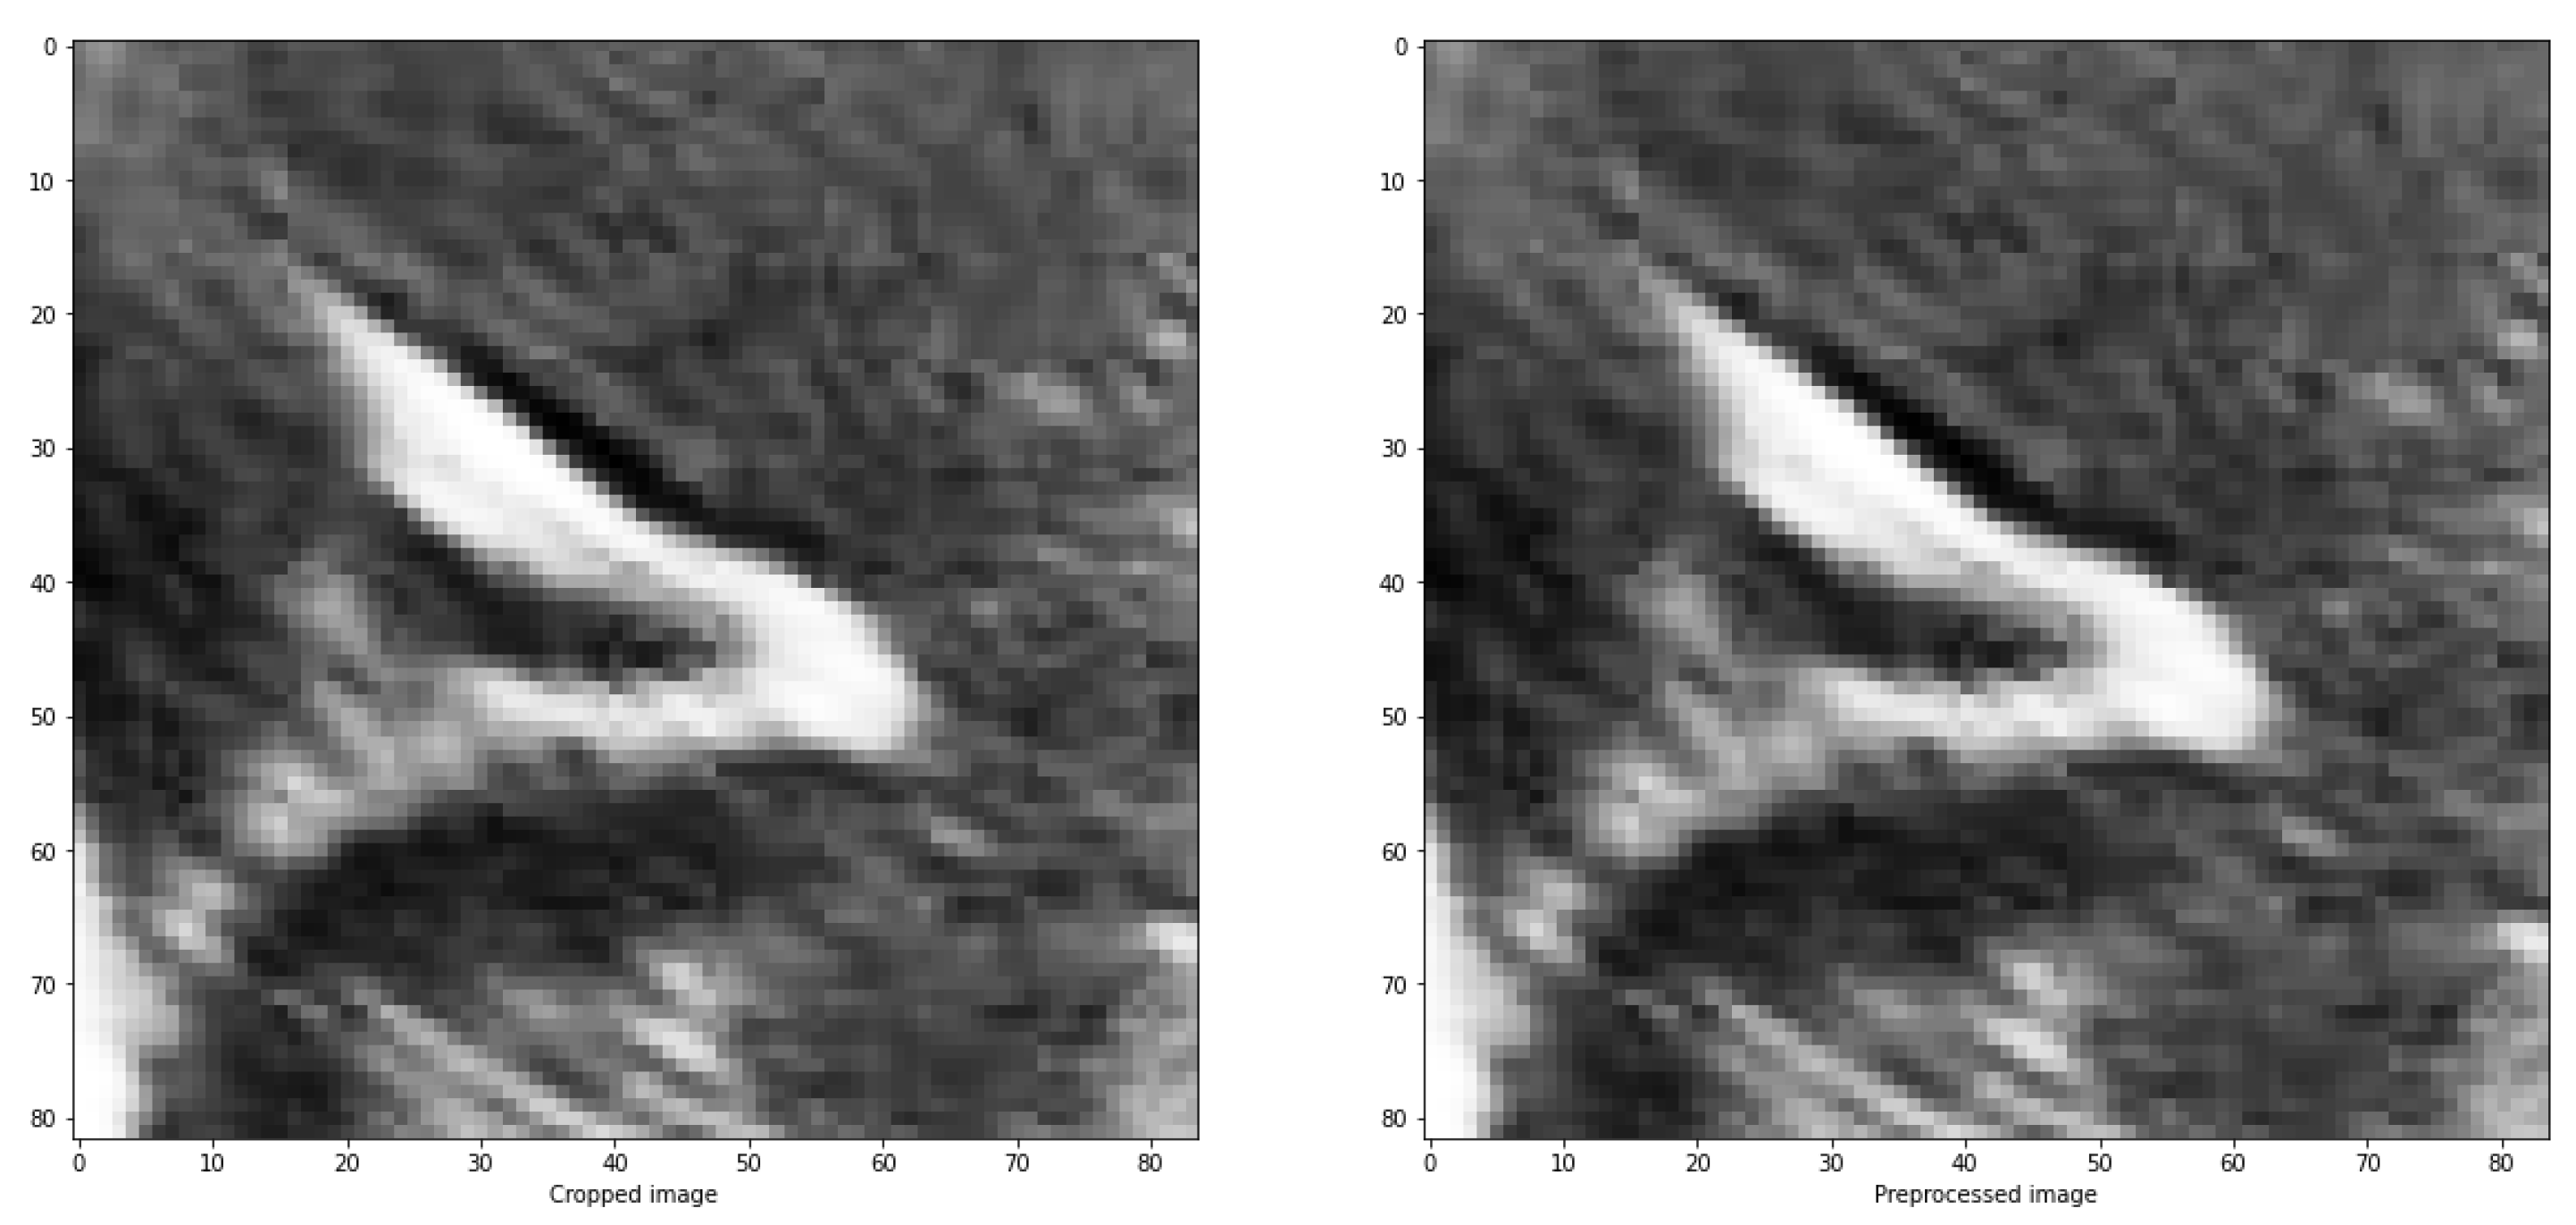
The purpose of doing this is to distinguish between the structures and the background, as well as the noise present in the image, which are generally darker than the grooves that have values close to 1. An example of the results is depicted in
Figure 6.
There exist multiple methods to enhance the contrast between the background and elements in ultrasound images. One of such methods is Sigmoid correction, also referred to as Contrast Adjustment (Equation
3).
Equation
4 illustrates the Sigmoid Correction, which performs a pixelwise transformation on the input image, scaling each pixel to the range of 0 to 1.
The parameter determines the cut-off point of the Sigmoid function, shifting the characteristic curve horizontally. The parameter represents the constant multiplying factor in the power of the function. Additionally, the parameter controls the behavior of the correction: when set to False, it returns the Sigmoid correction, and when set to True, it returns the negative Sigmoid correction.
The overall contrast of an image, particularly in the case of ultrasound images, can be improved by applying various treatments that enhance the contrast between the elements and the image background. One such method is the Sigmoid correction, which is also referred to as Contrast Adjustment.
Adjusting the cutoff contrast factor and the gain value can control the overall contrast enhancement by regulating the amount of brightening and darkening. While the default values for cutoff and gain are 0.5 and 10, respectively, they may not always be optimal for the images under consideration. Therefore, several modifications need to be made to determine the best cutoff and gain values that maintain the structure of the grooves while eliminating noise in the surrounding areas. It has been observed that a cutoff value of 0.4 combined with a gain value between 10 iterations to eliminate some of the noise around the groove without modifying its structure.
Figure 7 illustrates an example comparing the original image with the result obtained after applying the sigmoid function.
In image processing, erosion reduces bright regions and enlarges dark regions by setting the pixel value at (i, j) to the minimum over all pixels in the neighborhood centered at (i, j). Conversely, dilation enlarges bright regions and reduces dark regions by setting the pixel value at (i, j) to the maximum over all pixels in the neighborhood centered at (i, j). In the platform, both operations are used in a function called "closing" represented by Equation
5. This function performs greyscale morphological closure of an image by applying dilation followed by erosion. It effectively removes small dark spots and connects small bright cracks. This operation is useful for closing dark spaces between bright features in the image. The function takes the image and the trace (expressed as a matrix of ones and zeros) as parameters.
Figure 8 illustrates an example of the application, demonstrating how a group of initially connected structures is merged together to achieve a segmentation result that closely resembles the intended structure.
After binarizing and applying the closing function to the ultrasound image, the identification and characteristics of each structure are obtained using two functions from the Python library skimage.measures: label and regionsprops. The label function takes the image to be labeled (
) as input and optionally accepts a parameter called
. When
is set to True, the function returns the number of regions found as an integer. The output of this function is an image and an optional integer value.
The labeling function (Equation
6) is employed for structure recognition and labeling, but it does not provide detailed information about individual regions, such as their area, centroid, etc. For that purpose, the regionprops function is an algorithm that returns a list with the same number of elements as the number of structures detected in the
(Equation
7). Each element in the list contains a dictionary with various characteristics of the corresponding structure, such as area, coordinates, centroid, etc. Then, a histogram is used to determine the number of structure based on their area (
Figure 9).
Moreover, a method for defining the image furrows is to use the morphsnakes library based on a Morphological Active Contours without Edges (MorphACWE) method [
25]. This technique is particularly useful for segmenting objects in images and volumes with indistinct edges called. It can handle scenarios where the interior of the object is either brighter or darker than the surrounding background. Additionally, it is robust against noise and can operate on images without the need for pre-processing to enhance object contours. Upon execution, the function generates a mask of equal dimensions as the input image, which can then be used for segmentation. However, it has been observed that this function may produce errors, as sometimes the path is designated with a value of 0 instead of 1, which can hinder segmentation.
Figure 10 illustrates an example that demonstrates how to address the issue of errors caused by assigning a value of 0 instead of 1 to the path in the segmentation process. By checking if the percentage of values equal to 1 in the masks is greater than 50%, and inverting them if True, this approach helps overcome the problem.
The segmentation process categorizes an image into segments or extracts contours to detect edges. These segments represent regions with similar color intensity or other characteristics, while neighboring regions have distinct features. In many cases, visualizing the entire region is unnecessary, and highlighting the contour in a specific color (e.g., red) suffices for structure identification in the original image. The
library offers the slic function, which employs k-means clustering for image segmentation. This function requires input parameters such as the image to be segmented, the initial number of labels, an optional mask to limit superpixel calculation to specific areas, and the start label. Equation
8 represents the function:
Figure 12 demonstrates the process and outcomes of the slic function. It includes the original image, the corresponding mask, the number of segments (e.g., 10) used, and the resulting image segmentation. The image and mask are adjusted to align with the structure, allowing the grid (indicated by the yellow line in the third image) to adapt and conform to the structure’s contours. The segmentation of the structure is represented by the red line in the fourth image.
Figure 11.
Example of the original image, the corresponding mask, the number of segments (e.g., 10) used, and the resulting image segmentation.
Figure 11.
Example of the original image, the corresponding mask, the number of segments (e.g., 10) used, and the resulting image segmentation.
2.4. Digital repository and distribution
This platform is available in a
GitHub repository and distributed with a free open source license on request for prior access. The primary objective of this project is to offer a user-friendly tool that facilitates image processing tasks for the community. The intention is to provide this tool to the scientific community, allowing for enhancements and the integration of new features and capabilities. To fulfill this purpose, the tool is made available as open-source, enabling users to freely redistribute and utilize it in both source and binary forms, with or without modifications. However, users are required to comply with the following conditions:
If this code is used for any purpose, it is mandatory to include the original
copyright notice.
If the code is redistributed in binary form, it must reproduce the aforementioned copyright notice, the list of conditions, and the following disclaimer in the accompanying documentation and/or other materials.
The names of the copyright holder and its contributors cannot be used to endorse or promote products derived from this software without explicit prior written permission.
3. Experimental case of use and results
The following sections will explain the structure and design of the platform that has been created using the dash library. The user will be guided on how to interact with the platform to ensure the appropriate utilization of functions at the desired moment. This enables users to obtain a customizable final result according to their specific requirements.
Firstly, the visualisation of the platform has been designed to be user-friendly and simple, ensuring easy access to the desired information.
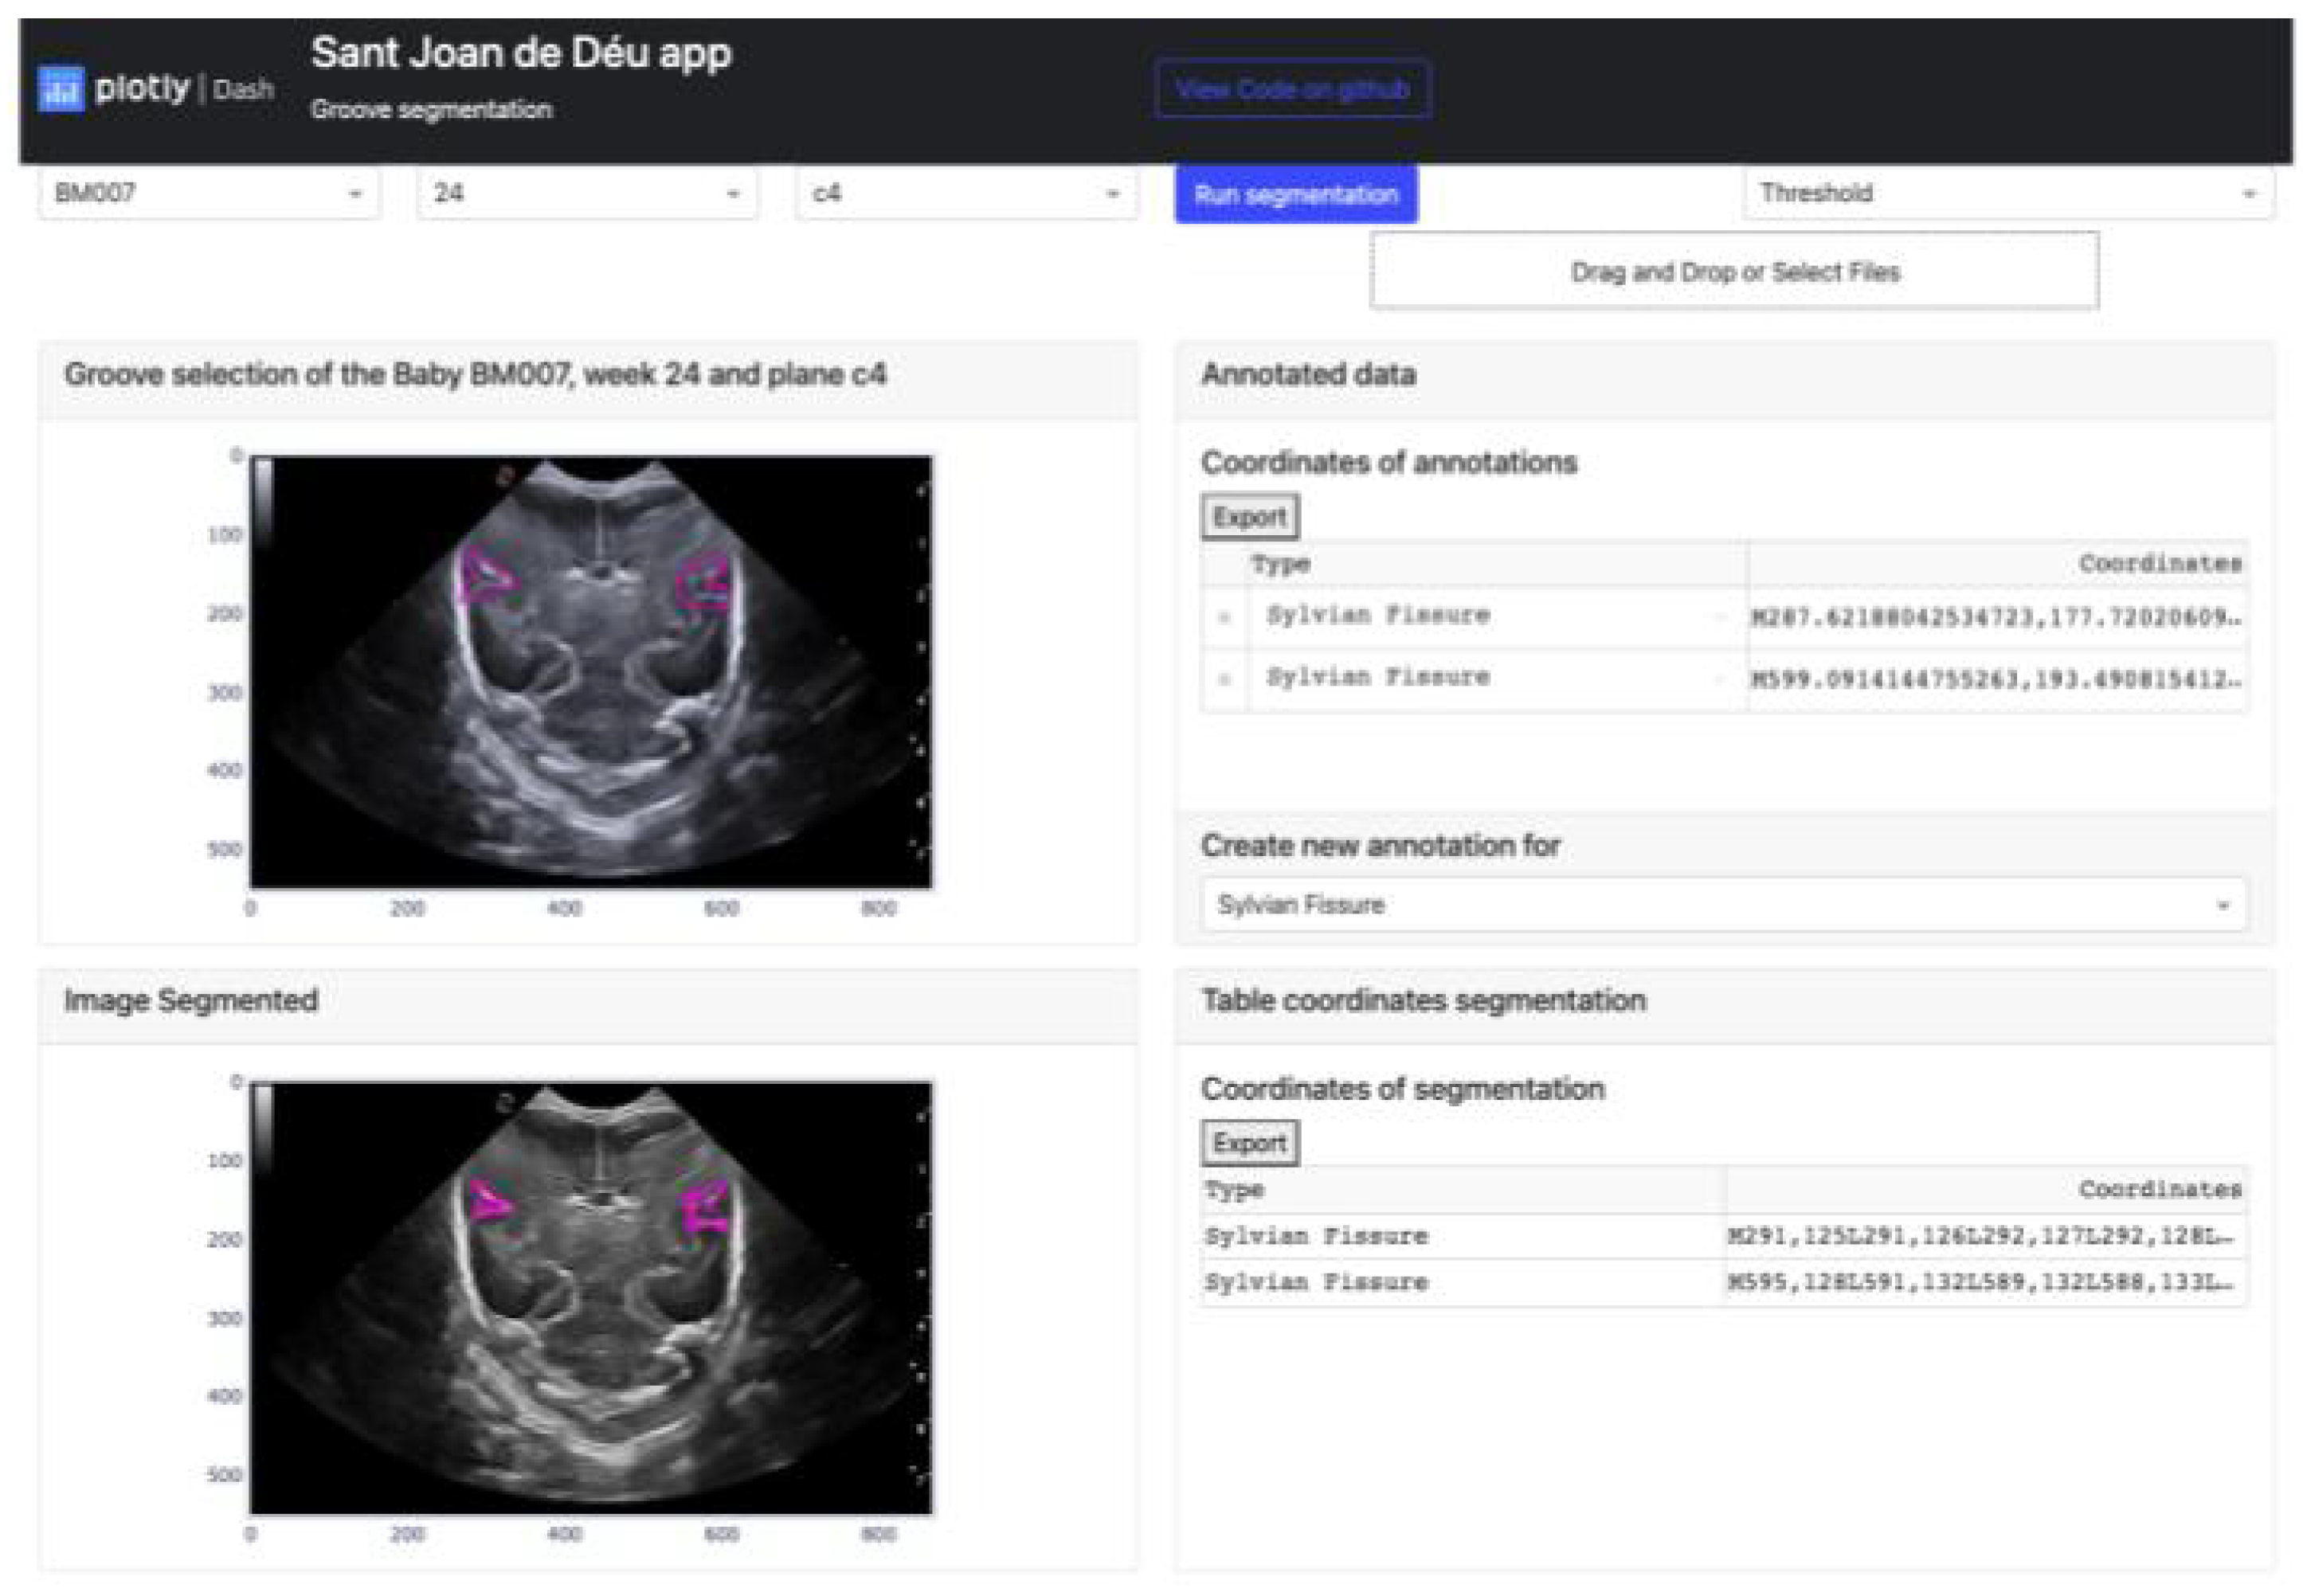
Figure 12 illustrates the layout of the application, which consists of three rows and two columns. The first row includes drop-down buttons on the right side to select the baby, week and cut-off from the database. On the left side of this row there are two additional buttons. Clicking on the blue button executes the algorithm chosen in the drop-down button below, which is applied to the image selected by the user. Below these two buttons, there is an additional button for importing documents containing slot segmentations.
The second and third rows follow a similar structure, featuring a card in the first column that displays a plotted figure, and a second card in the second column with a header and body where the coordinate table is located. The distinction between these two rows is that the second row includes a footer in the second column, which contains a dropdown menu for selecting the groove type in the original image.
Figure 12.
Result of the manual segmentation of each groove defined in the upper cards and carried out by the platform algorithms, in this case Threshold.
Figure 12.
Result of the manual segmentation of each groove defined in the upper cards and carried out by the platform algorithms, in this case Threshold.
To summarize, the platform is divided into two main parts. The first part involves selecting the image to be segmented and defining the groove areas, while the second part displays the results of the algorithms once the necessary information is entered. User participation is required for semi-automatic learning in the first part, while the second part allows users to modify the resulting segmentation. To apply the function, users need to click on the "Run Segmentation" button, which has five points defined below:
- 1
-
The first step is to select one of the three methods that can be chosen. Each technique performs different steps in processing the image and obtaining the sulcus mask:
Threshold: The initial step involves cropping the image using a rectangular region. This process entails determining the maximum and minimum values along both axes to establish the appropriate scaling for the cropping operation. Subsequently, the next step involves applying the local thresholding technique to reduce noise and extract the segmented groove from the image.
Sigmoid + Threshold: The process applied when selecting this option is similar to the previous one, but before cutting out the groove area, the image is treated with the sigmoid correction function.
Snake: In this option, the image where the furrow has been manually identified is cropped and the Morphological Active Contours without Edges (MorphACWE) method is applied. The mask obtained is analyzed and it is seen if the sum of the pixels that contain the value 1, which corresponds to the groove, is less than 50% of the pixels that the image contains. Otherwise, the mask is inverted and the pixels that contain the value 1 pass to the value 0 and vice versa.
- 2
In the second step, the structures are identified and their centroids and areas are determined. Only the structures whose centroids fall within the manual segmentation are retained, while the rest are eliminated. Subsequently, the structure with the largest surface area is identified and all other structures are removed, resulting in an image with a black background and a single remaining structure.
- 3
After obtaining the image from the previous step, the next step is to multiply it with a black and white image that defines the structure based on the manual segmentation. The purpose of this image multiplication is to remove the parts of the structure that are outside the manually segmented area.
- 4
Finally, the coordinates of the segmented region are adjusted to align with the original image. This is achieved by transposing the coordinates of the cropped region using the maximum and minimum values of the x and y axes obtained during the initial cropping step.
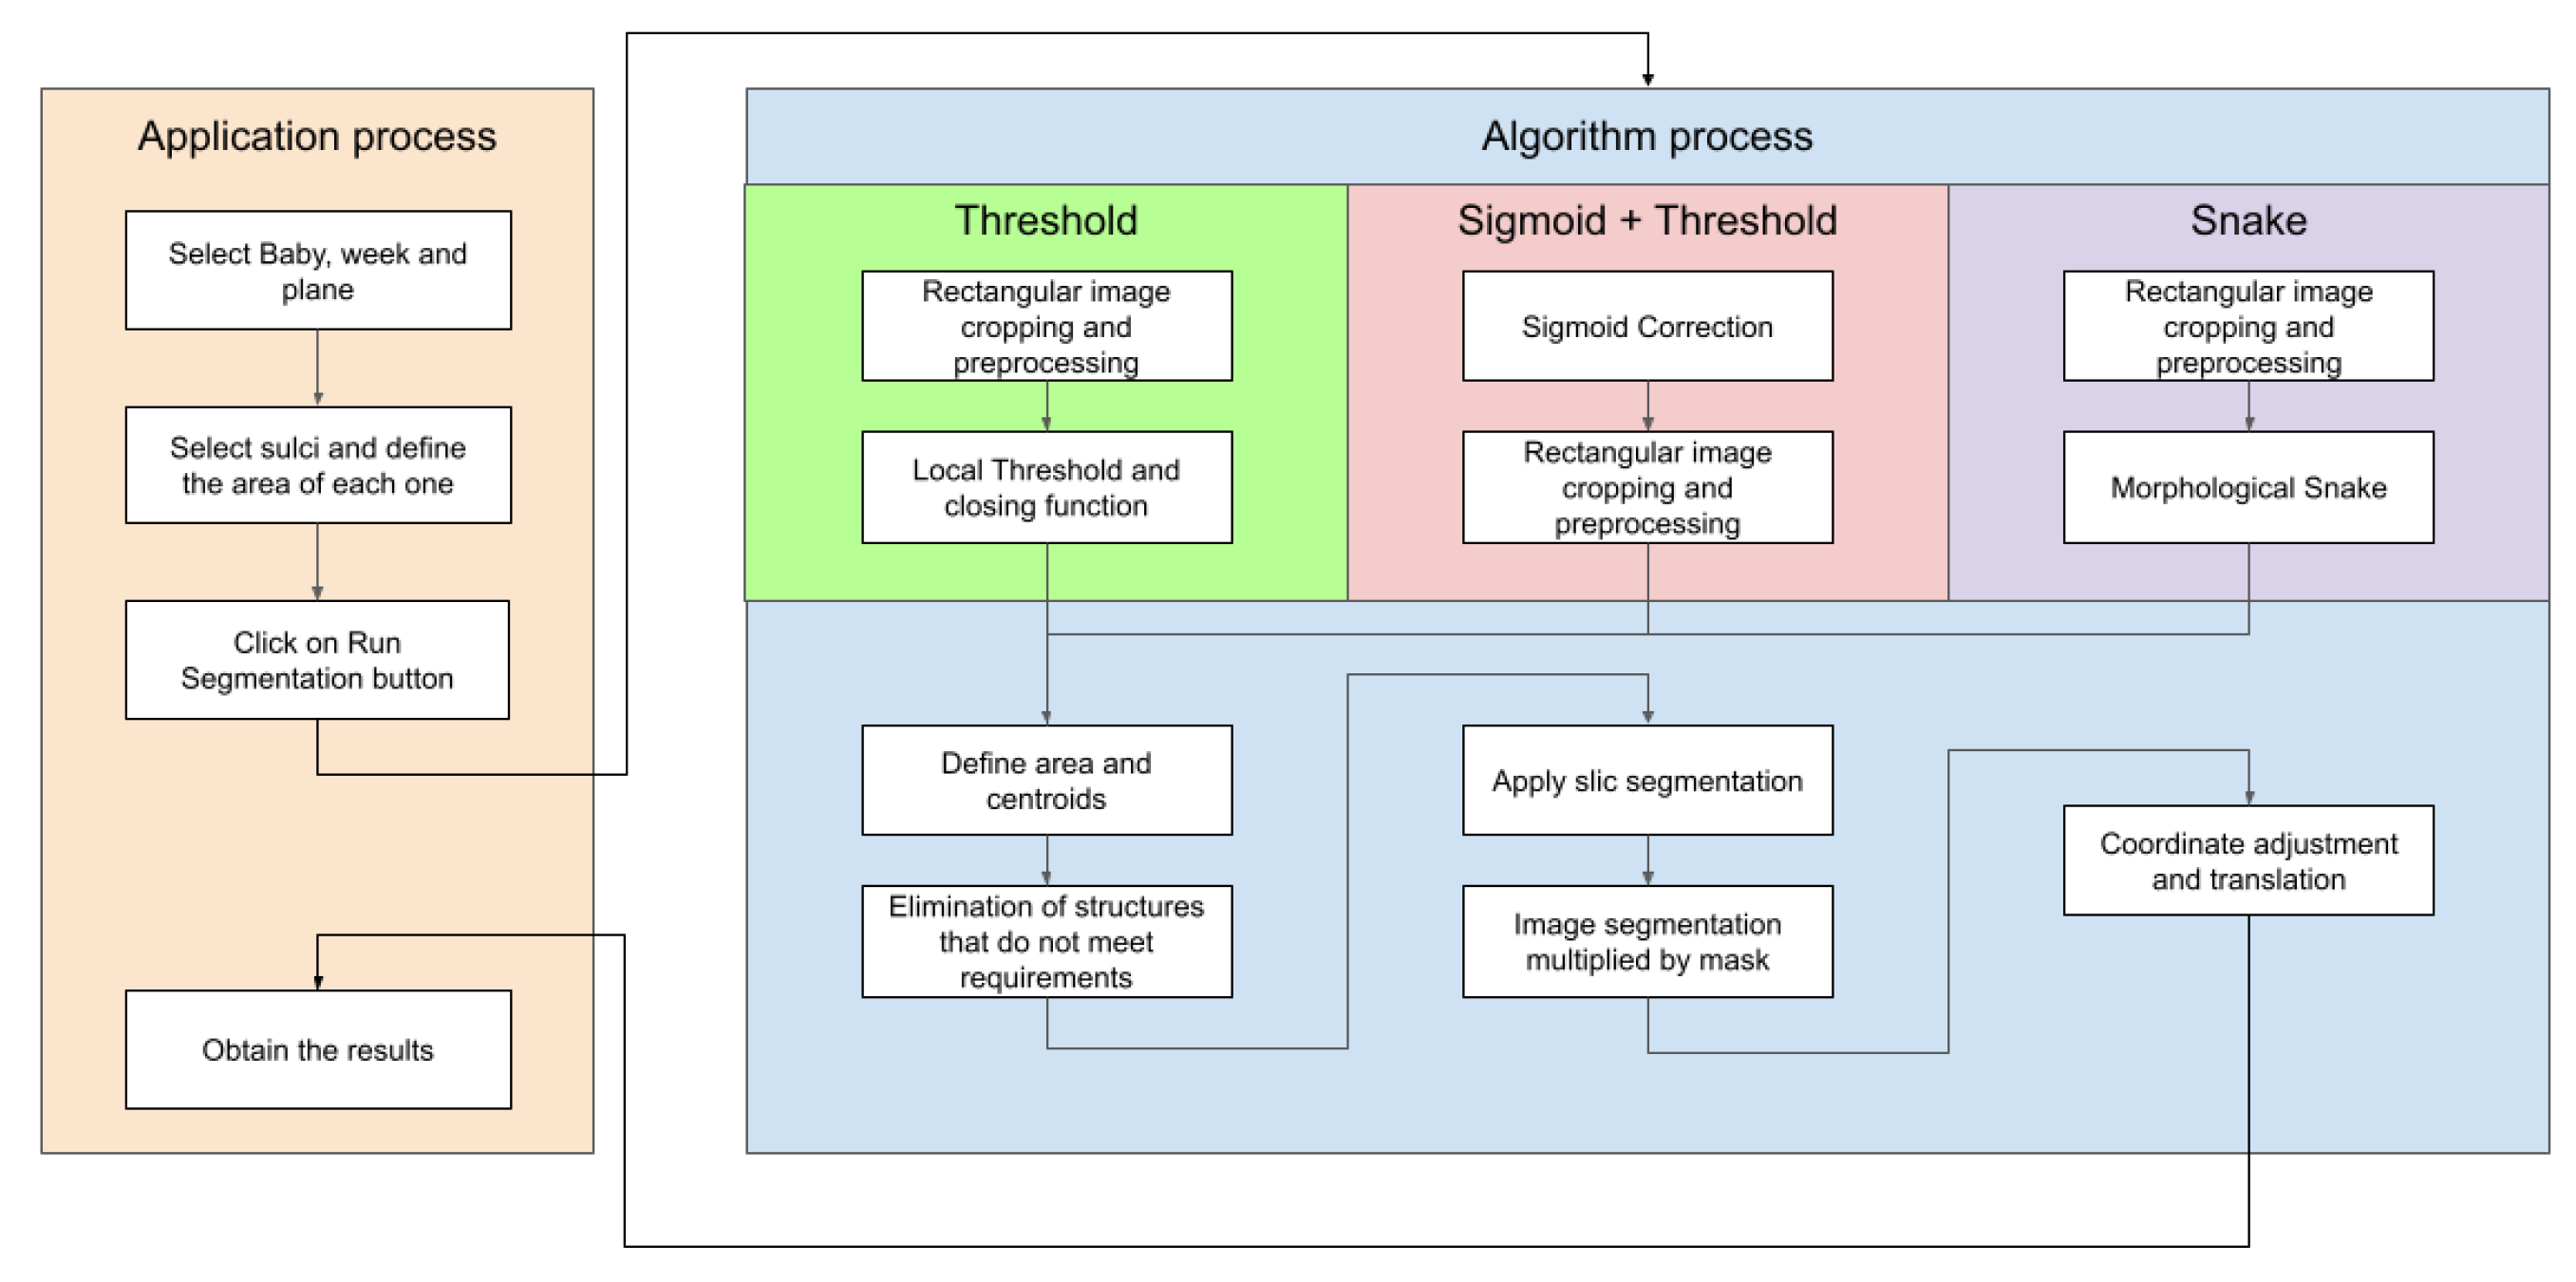
The steps to be followed in the platform and the various implemented methods are depicted in the diagram shown in
Figure 13. This diagram enables users to view the actions to be taken in each method and display the results on the screen. Upon clicking the execute algorithm button, two identical images of the selected baby, week, and cut are displayed. The lower image showcases the segmentation obtained through the chosen algorithm. The manual segmentation is modified to better fit the shape of the chosen groove. The corresponding annotation table, containing the vertex coordinates for the horizontal and vertical axes defining each groove, is saved in the left card alongside its respective image.
However, sometimes the segmentation algorithm fails due to factors such as incorrect separation of the groove. To rectify this, users can modify the segmented image by adjusting the vertices. An example is shown in
Figure 14, where the segmentation result is incorrect and requires vertex adjustments. The image shows that some vertices have been moved to new positions to correctly define the groove. The modifications made to the vectors in the image are reflected in the corresponding table, where the displayed values of the selected coordinates are updated accordingly. Additionally, the data specified in the tables can be exported to a spreadsheet file by utilizing the "Export" button positioned at the upper part of both tables.
Despite this, the semi-automatic process generally achieves good accuracy and precision. Moreover, the defined algorithm meets its objective of allowing for modifications to be made to the segmentation results without having to rerun the algorithm.
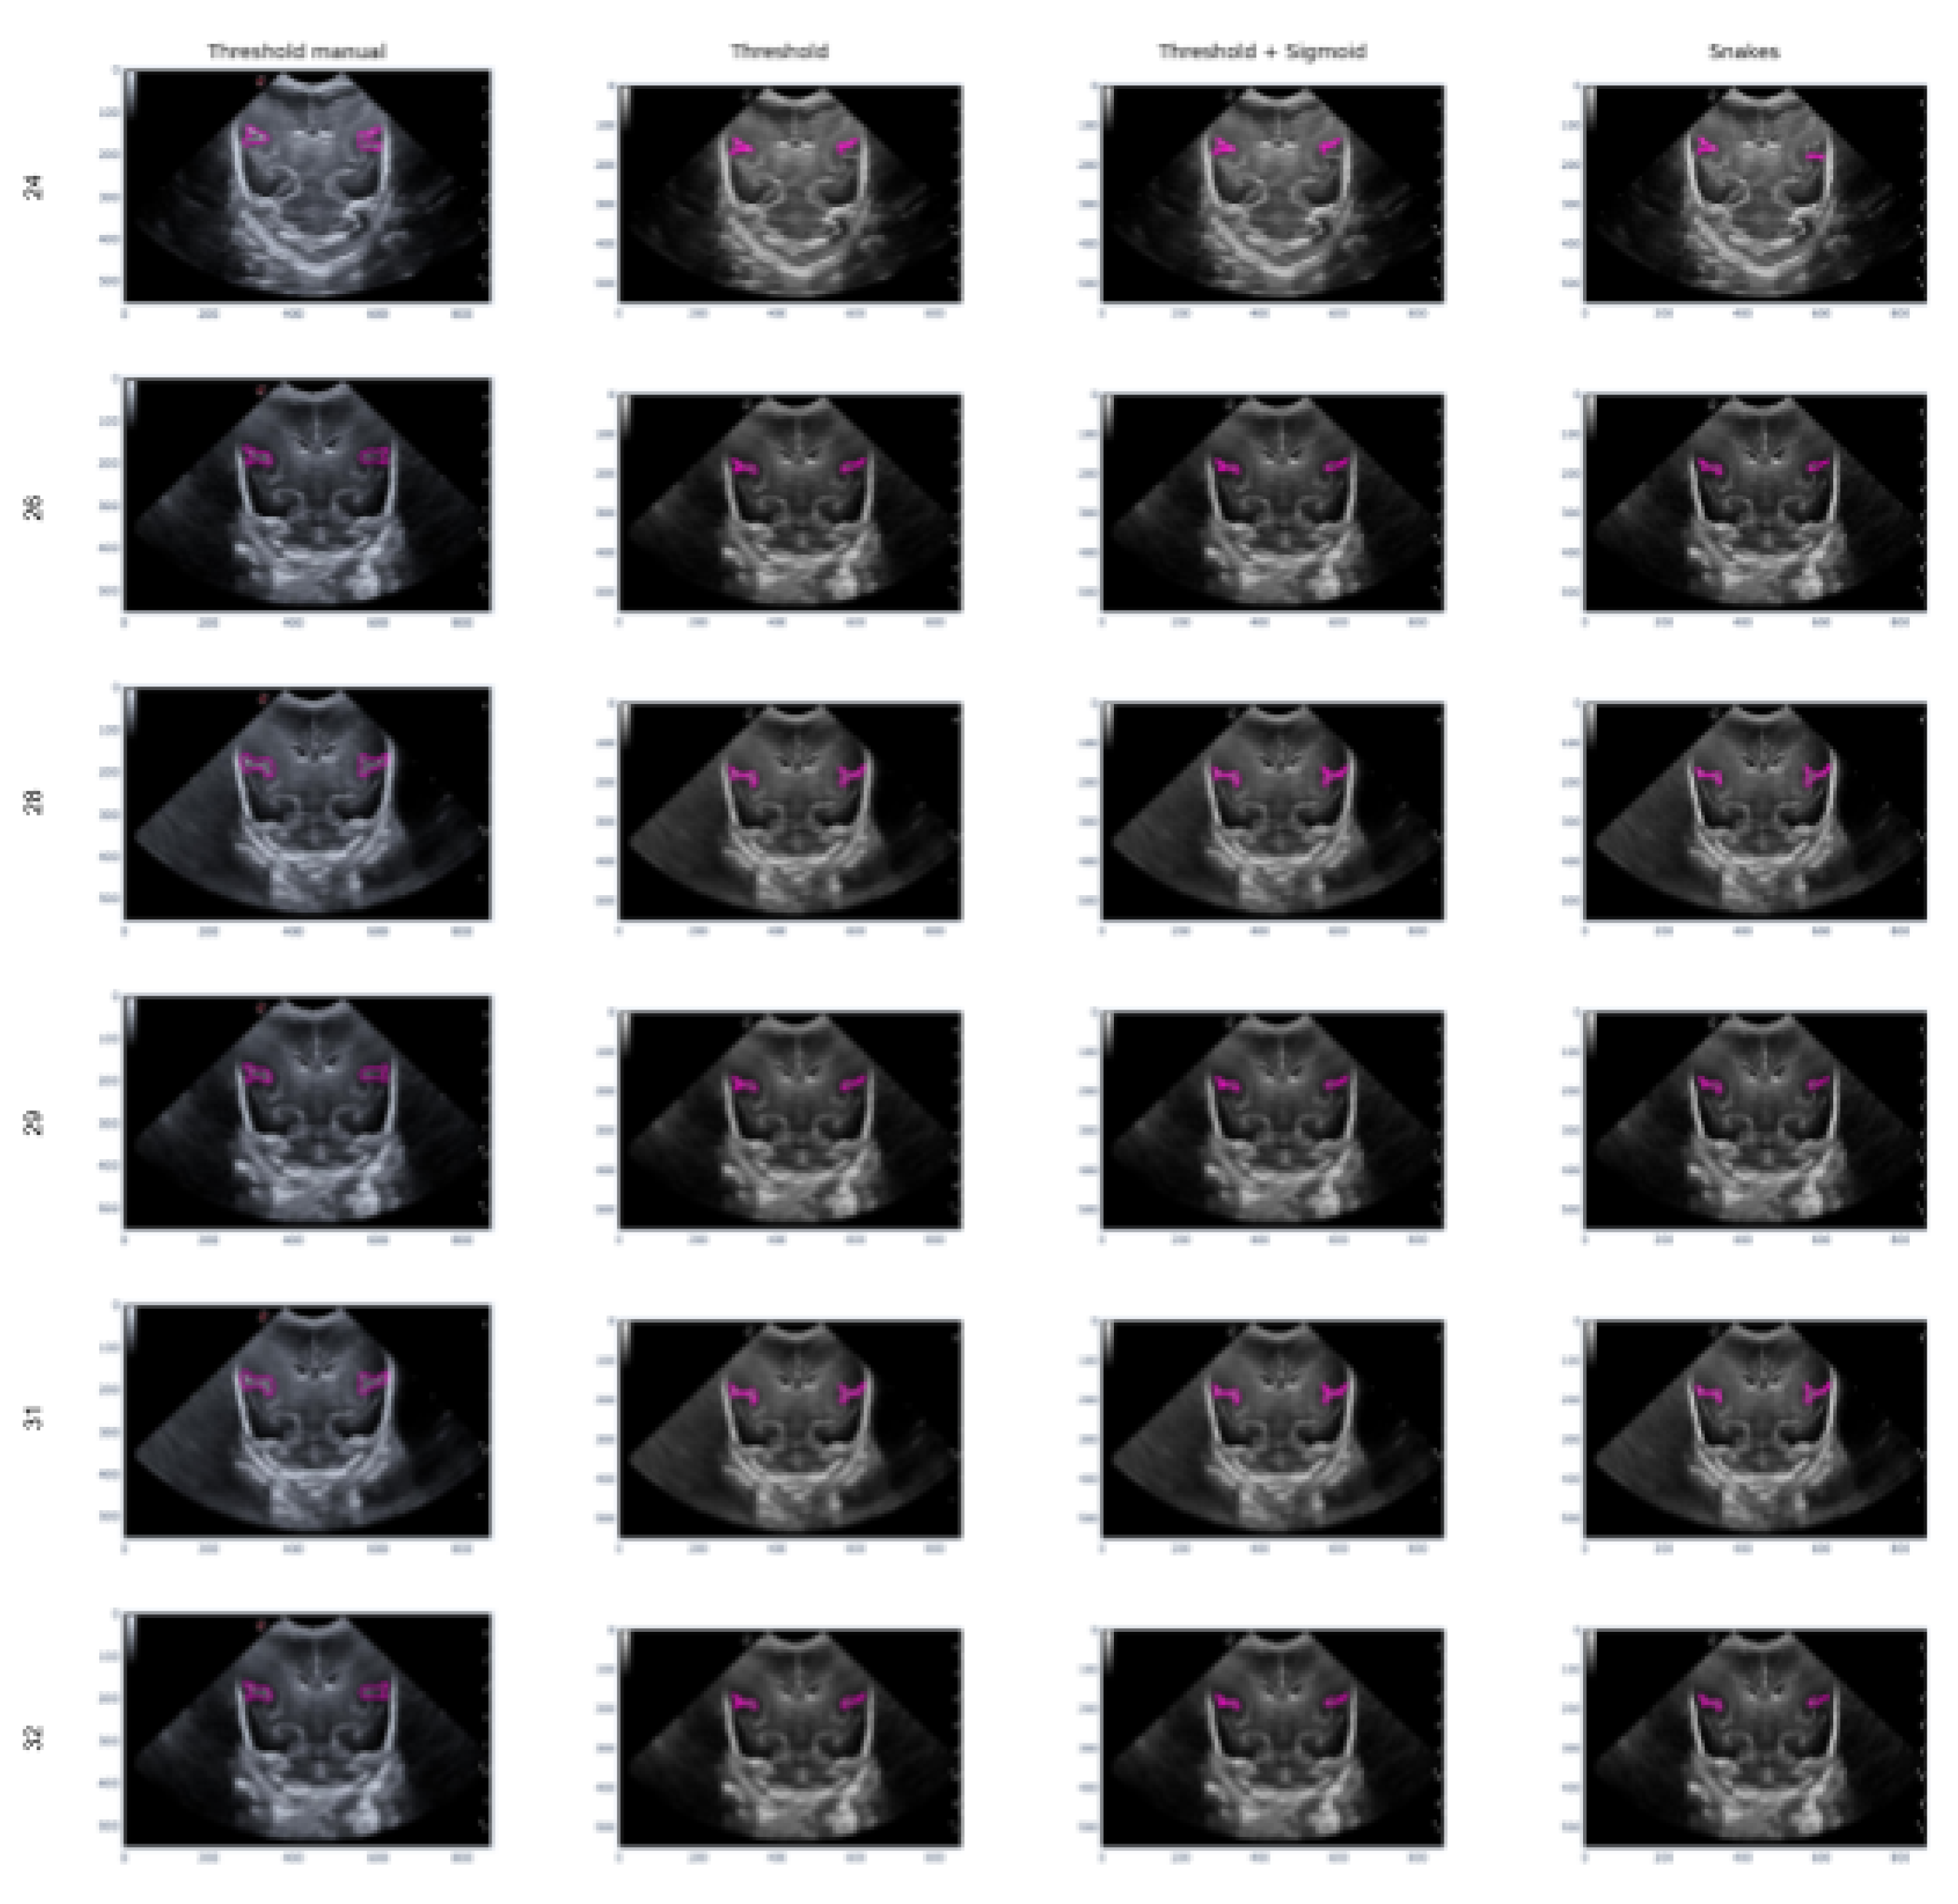
Figure 15 provides an example of the segmentation on the Sylvian furrow at different stages of gestation using the manual slicer, Threshold, Sigmoid + Threshold, and Snakes algorithms in the columns from left to right. Each row represents the week of gestation when the ultrasound was taken (from top to bottom: 24, 26, 28, 29, 31, and 32). The results demonstrate that the algorithms are effective when the groove is moderately defined and noise is not a significant factor. However, in areas with high noise levels, the algorithms may struggle to accurately define the groove, resulting in an irregular contour that may not represent the original structure correctly.
4. A comprehensive discussion of the segmentation results
This section will provide an in-depth analysis of the results obtained from a series of segmentation experiments carried out using the three methods implemented in the platform. The grooves will be segmented in the Coronal C4 cut from images of different babies and weeks.
Three different cases will be analyzed. Firstly, the behavior of the algorithms will be observed in different grooves shown in the image. Secondly, an analysis will be carried out on the Sylvian groove to observe how it behaves according to the noise that appears in the image. Lastly, each method’s behavior will be analyzed according to how the manual segmentation has been done.
The first case analyzed used an image of a premature infant at week 29 of gestation, in which several furrows have been segmented, as shown in
Figure 16. Each color represents a particular groove in which manual segmentation has been applied in the first image or one of the methods applied in the following images, in the order of Threshold, Sigmoid + Threshold, and Snakes.
Figure 16 shows that when applying the Threshold method (second and third images), there is not much variation in obtaining the segmentation. However, applying the sigmoid preprocessing was able to segment the pink-colored groove on the right side. In contrast, the Snakes method (fourth image) was able to segment an orange-colored groove in the lower right part that had not been segmented with the Threshold method.
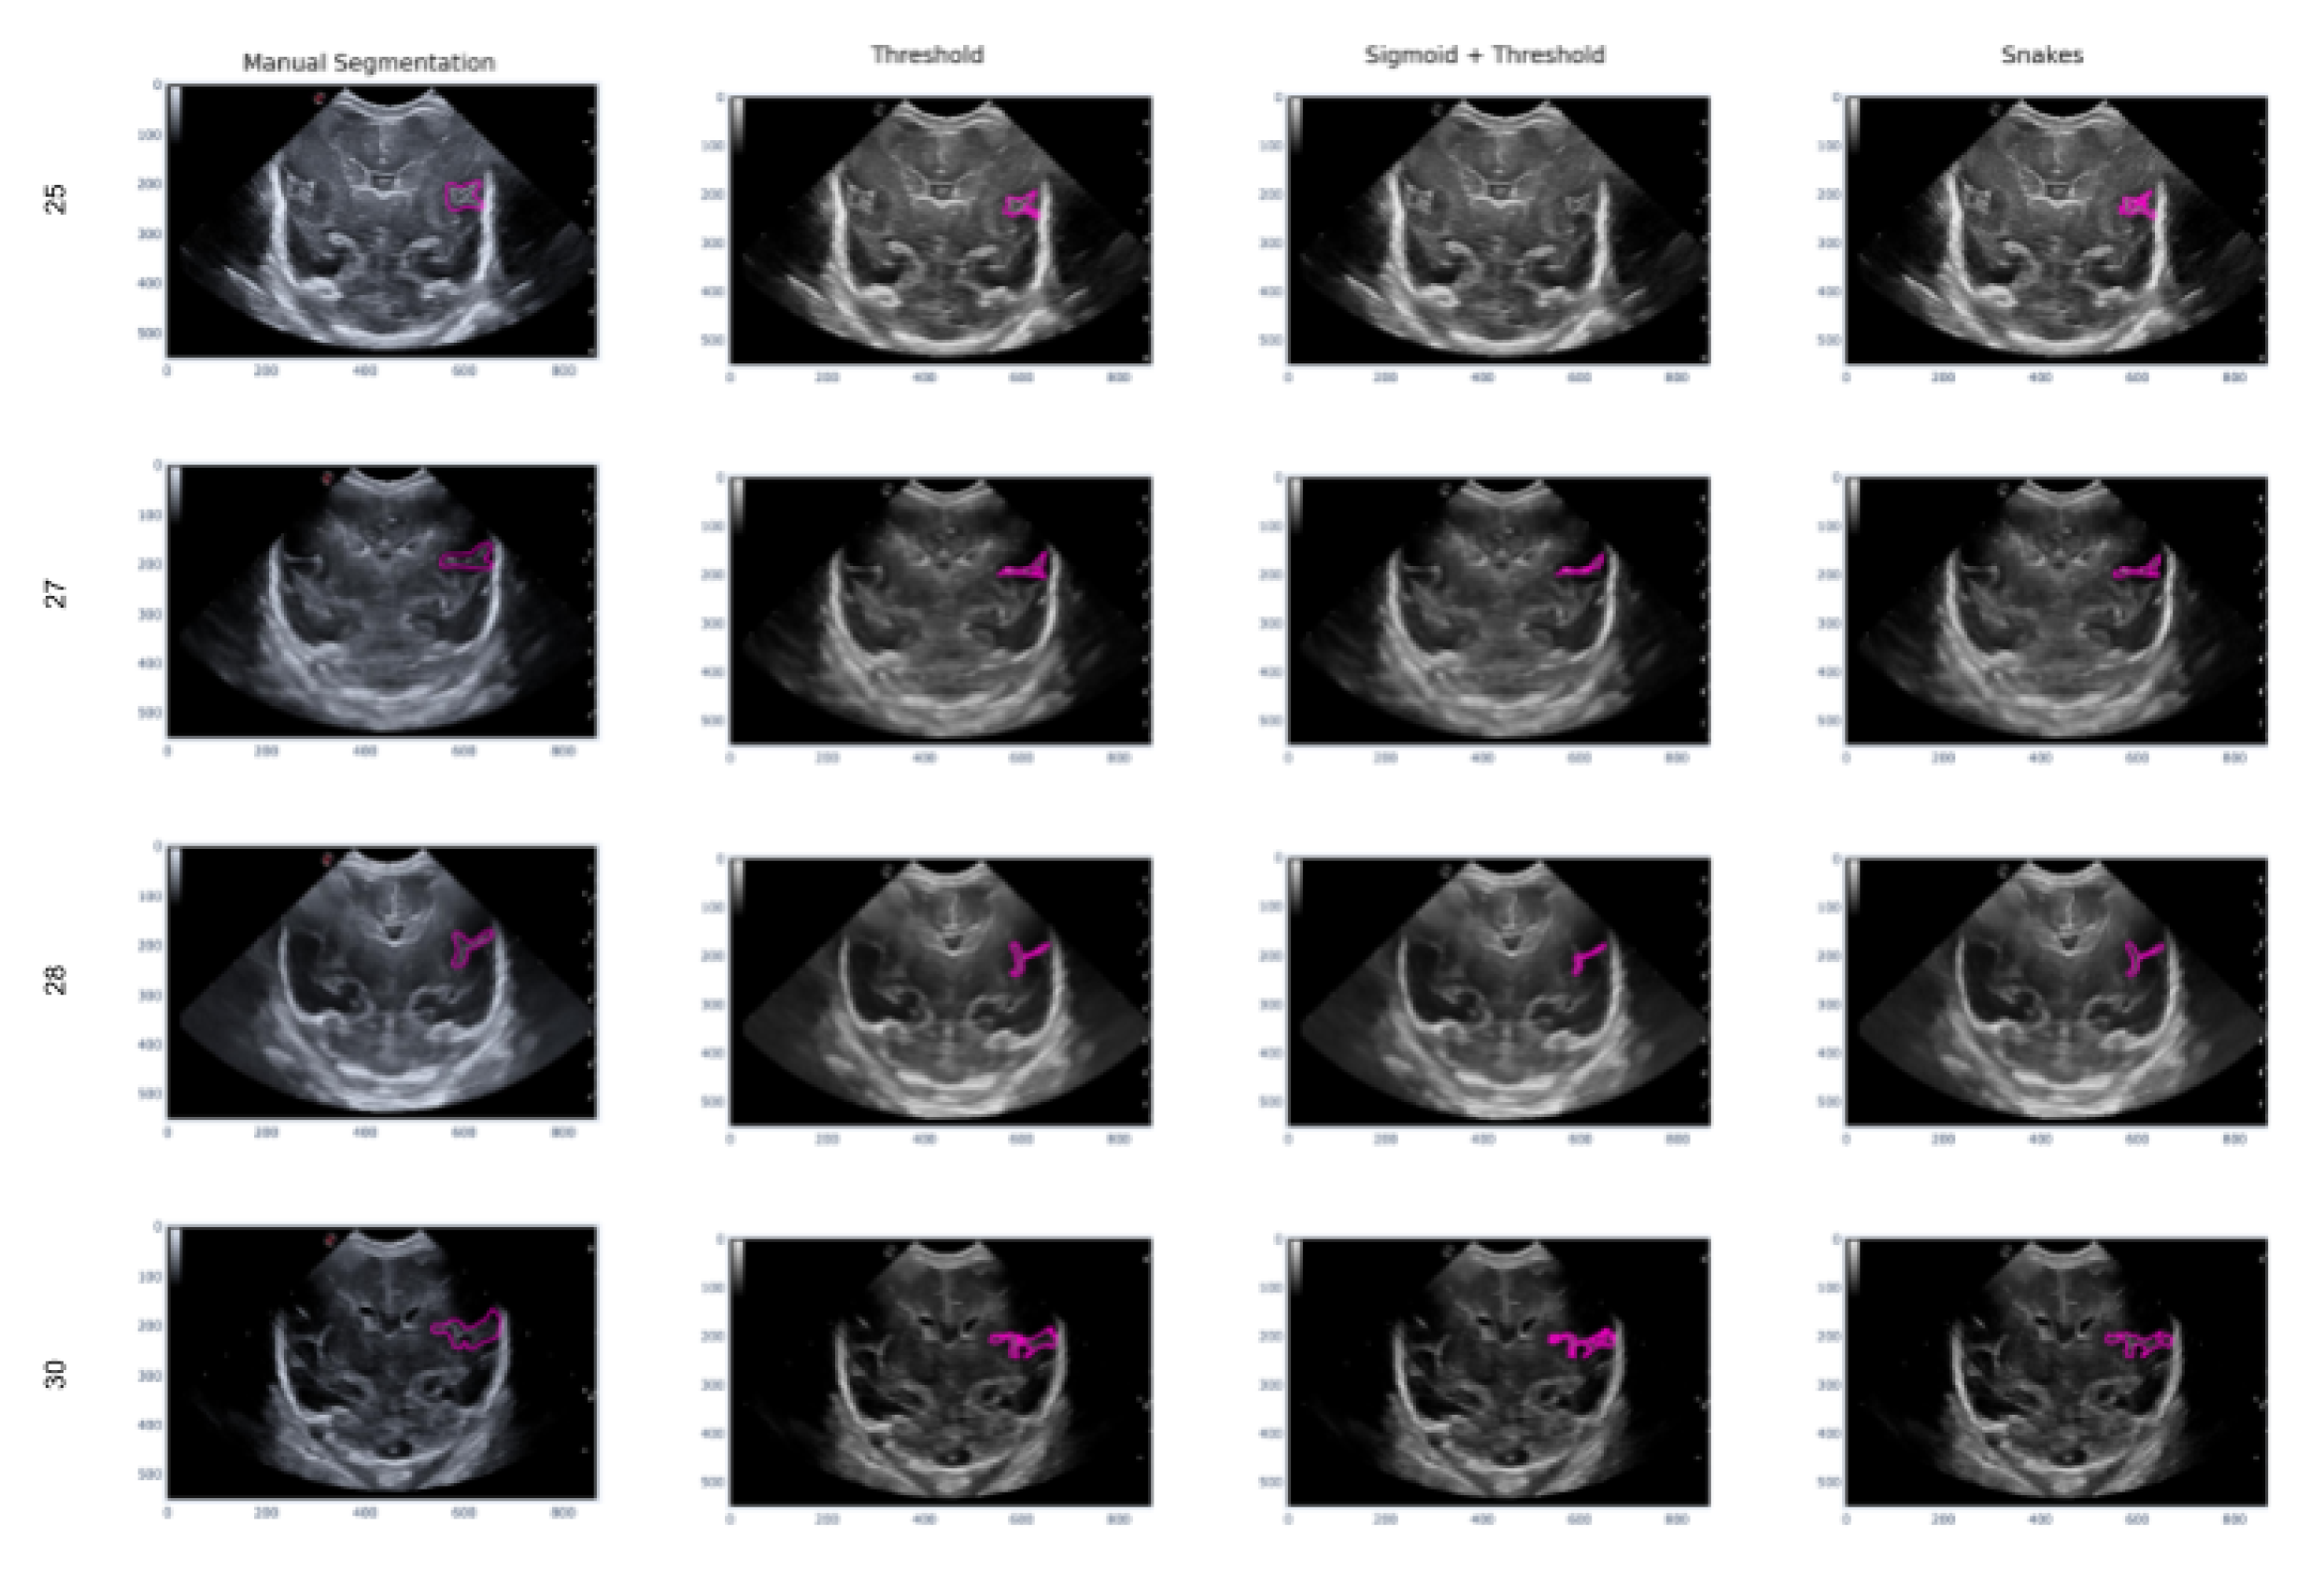
In this second scenario, we will analyze the segmentation results of the different methods applied to the Sylvian furrow at four different weeks of gestation (week 25, 27, 28, and 30) in various infants. Our aim here is to investigate how the noise present in ultrasound images affects the performance of the segmentation algorithms across different cases.
In the first row of
Figure 17, it was observed that the Sigmoid + Threshold method failed to segment the groove, while the Threshold and Snakes methods were successful, but only if the groove was well defined. In the subsequent rows, which corresponded to weeks 27, 28, and 30 of gestation, a clear difference was observed between the methods that utilized the Threshold (Threshold and Sigmoid + Threshold). The Sigmoid + Threshold method was found to be more sensitive and faithful in segmenting the furrow, but lost precision when defining its shape. On the other hand, the Threshold method lost precision during segmentation but improved the definition of the furrow’s shape.
Another notable observation from the figure is the difference in the way the methods perform segmentation. Specifically, the Snake method produces smoother segmentation results, which appear to be more regular and follow the shape of the groove more accurately. In contrast, when the Threshold method is applied, the segmentation result is more irregular and abrupt, with small peaks visible in the defined shape of the groove.
Finally, it is evident that in some instances where the groove is more affected by noise, particularly during weeks 27 and 28, the Sigmoid preprocessing can lead to the loss of information about the groove’s shape, resulting in a failure to segment part of it using this method.
Considering the previous explanations and using the same manual segmentation as a starting point, it is apparent that each of the three methods has its advantages and drawbacks. However, it is also possible to lose precision when defining the shape of the groove, whether in its actual shape or in the segmentation process. Moreover, it is important to acknowledge that ultrasound noise can render some of these methods unsuitable as they may compromise the precision of the segmentation of the groove.
To conclude this section and proceed to the conclusions, the third case is explained, which demonstrates how each method performs segmentation depending on the precision of the manual segmentation.
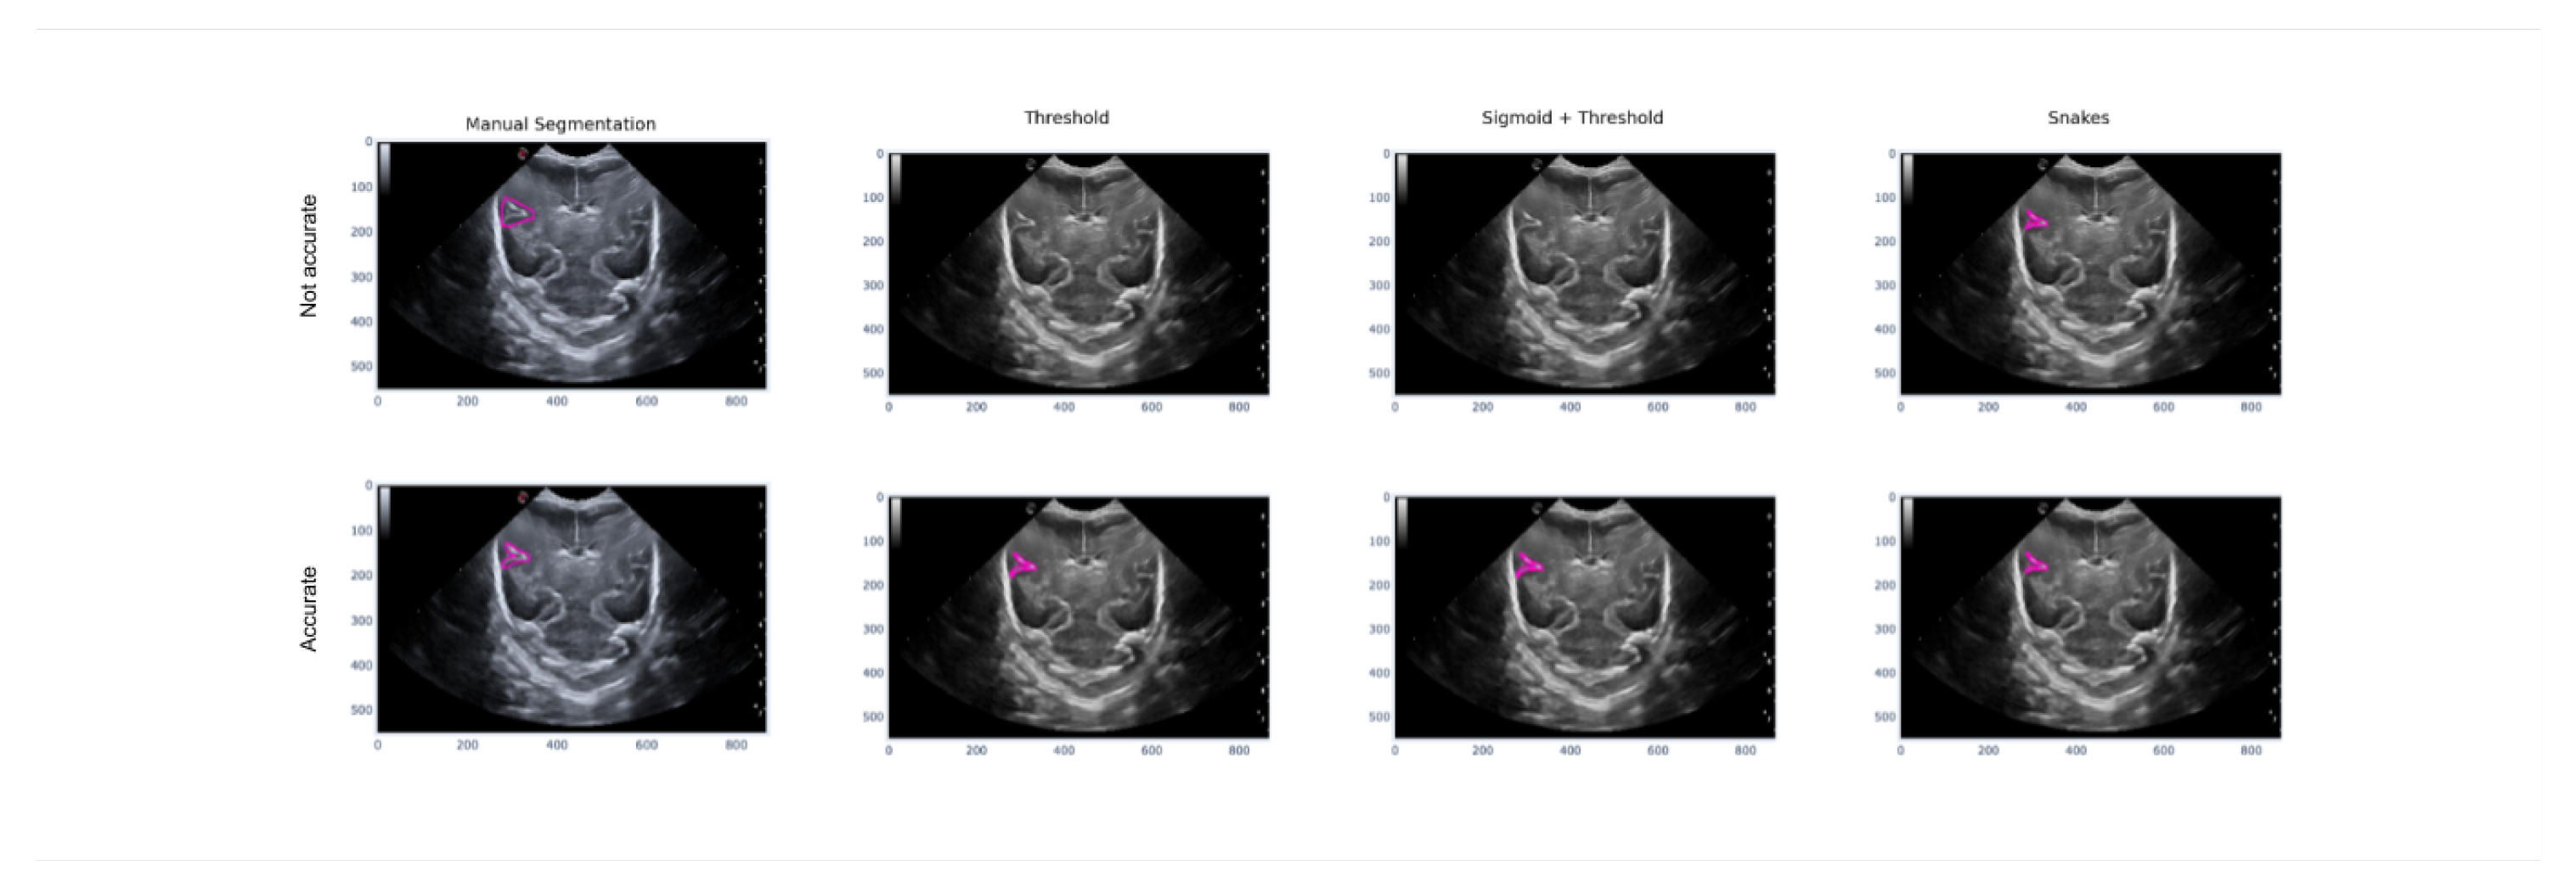
Figure 18 illustrates how imprecise manual segmentation, which defines the area of the image where the groove is located, renders the Threshold and Sigmoid + Threshold methods ineffective. However, if the manual segmentation is more precise and follows the shape of the groove, these methods provide satisfactory results. The Snake method, on the other hand, is observed to be unaffected by the way in which segmentation is performed, and it provides satisfactory results in both cases of precise and imprecise manual segmentation.
5. Conclusions
During the third trimester of pregnancy, from week 24 to 40, the human brain undergoes significant morphological changes, including an increase in brain surface area as sulci and gyri develop. However, in the case of preterm newborns, these changes occur outside the uterus, which can negatively impact brain maturation when assessed at term equivalent age. To overcome this challenge, this paper proposes the utilization of a normalized atlas of brain maturation based on cerebral ultrasound. This atlas enables clinicians to evaluate these developmental changes on a weekly basis, starting from birth until the baby reaches term equivalent age.
The main goal of this study is to develop a user-friendly GUI application that simplifies the segmentation process of major cerebral sulci in acquired images. The application serves as a platform for visualizing and organizing a curated atlas of validated cases by medical experts. It provides multiple segmentation methods, pre-processing tools, and an intuitive interface for executing and visualizing experimental use cases. The paper also includes a detailed analysis of the results, comparing them with existing methods and discussing the clinical implications. Additionally, the work provides a foundation of segmented images for AI learning and the development of an automatic segmentation tool.
Overall, this work provides a valuable tool for assessing brain maturation in preterm newborns using cerebral ultrasound images. The GUI application and accompanying results contribute to advance our understanding of brain development in this population and may have important implications for clinical decision-making and patient care.
Author Contributions
Conceptualization, T.A, N.C, R.B, C.M; software, D.R, S.R, M.R; methodology, all authors; validation, all authors; resources, T.A, N.C. R.B, C.M; data curation, T.A., N.C., and R.B.; writing—original draft preparation, D.R, C.M.; writing—review and editing, all authors; visualization, all authors; supervision, R.B, C.M. All authors have read and agreed to the published version of the manuscript.
Funding
This work was supported by the Spanish Ministry of Economy and Competitiveness [Project PI 18/00110, Proyectos de Investigación en Salud (FIS), diseñado por el Instituto de Salud Carlos III (ISCIII)]. We would like to express our special thanks of gratitude to Thais Agut and Nuria Carreras (Hospital Sant Joan de Déu, Barcelona, Spain) to use a medical database for testing and validation.
References
- Graca, A.M.; Cardoso, K.R.V.; da Costa, J.M.F.P.; Cowan, F.M. Cerebral volume at term age: comparison between preterm and term-born infants using cranial ultrasound. Early Human Development 2013, 89, 643–648. [Google Scholar] [CrossRef] [PubMed]
- Dubois, J.; Benders, M.; Borradori-Tolsa, C.; Cachia, A.; Lazeyras, F.; Ha-Vinh Leuchter, R.; Sizonenko, S.v.; Warfield, S.K.; Mangin, J.F.; Hüppi, P.S. Primary cortical folding in the human newborn: An early marker of later functional development. Brain 2008, 131, 2028–2041. [Google Scholar] [CrossRef] [PubMed]
- Recio, M.; Martínez, V. Resonancia magnética fetal cerebral. Anales de Pediatría Continuada 2010, 8, 41–44. [Google Scholar] [CrossRef]
- el Marroun, H.; Zou, R.; Leeuwenburg, M.F.; Steegers, E.A.P.; Reiss, I.K.M.; Muetzel, R.L.; Kushner, S.A.; Tiemeier, H. Association of Gestational Age at Birth With Brain Morphometry. JAMA Pediatrics 2020, 174, 1149–1158. [Google Scholar] [CrossRef] [PubMed]
- Poonguzhali, P.; Ravindran, G. A complete automatic region growing method for segmentation of masses on ultrasound images. IEEE International Conference on Biomedical and Pharmaceutical Engineering, Singapore 2006, 88–92. https://ieeexplore.ieee.org/document/4155869.
- Kuo, J.; Mamou, J.; Aristizábal, O.; Zhao, X.; Ketterling, J.A.; Wang, Y. Nested Graph Cut for Automatic Segmentation of High-Frequency Ultrasound Images of the Mouse Embryo. IEEE Transactions on Medical Imaging 2016, 35, 427–441. [Google Scholar] [CrossRef] [PubMed]
- Milletari, F.; Ahmadi, S.; Kroll, C.; Plate, A.; Rozanski, V.; Maiostre, J.; Levin, J.; Dietrich, O.; Ertl-Wagner, B.; Bötzel, K. Navab, N. Hough-CNN: Deep learning for segmentation of deep brain regions in MRI and ultrasound. Computer Vision and Image Understanding 2017, 164, 92–102. [Google Scholar] [CrossRef]
- Valanarasu, J.M.; Yasarla, R.; Wang, P.; Hacihaliloglu, I. and Patel. V.M. Learning to Segment Brain Anatomy From 2D Ultrasound With Less Data. IEEE Journal of Selected Topics in Signal Processing 2020, 14, 1221–1234. [Google Scholar] [CrossRef]
- Mortada, M.J.; Tomassini, S.; Anbar, H.; Morettini, M.; Burattini, L.; and Sbrollini, A. Segmentation of anatomical structures of the left heart from echocardiographic images using Deep Learning. Diagnostics 2023, 13, 1683. [Google Scholar] [CrossRef]
- Xu, Y.; Wang, Y.; Yuan, J.; Cheng, Q.; Wang, X.; Carson, P. . Medical breast ultrasound image segmentation by machine learning. Ultrasonics 2019, 91, 1–9. [Google Scholar] [CrossRef]
- Griffiths, P.D.; Naidich, T.P.; Fowkes, M.; Jarvis, D. Sulcation and Gyration Patterns of the Fetal Brain Mapped by Surface Models Constructed de 3D MR Image Datasets. Neurographics 2018, 8, 124–129. [Google Scholar] [CrossRef]
- Mata, C.; Munuera, J.; Lalande, A.; Ochoa-Ruiz, G.; Benitez, R. MedicalSeg: A Medical GUI Application for Image Segmentation Management. MedicalSeg: A Medical GUI Application for Image Segmentation Management. Algorithms 2022, 15, 200. [Google Scholar] [CrossRef]
- Mata, C.; Walker, P.; Oliver, A.; Martí, J.; Lalande, A. Usefulness of Collaborative Work in the Evaluation of Prostate Cancer from MRI. Clin. Pract. 2022, 12, 350–362. [Google Scholar] [CrossRef] [PubMed]
- Guzman, P.; Ros, R.; Ros, E. Artery segmentation in ultrasound images based on an evolutionary scheme. Informatics 2014, 1, 52–71. [Google Scholar] [CrossRef]
- Rodríguez, J.; Ochoa-Ruiz, G.; Mata, C. A Prostate MRI Segmentation Tool Based on Active Contour Models Using a Gradient Vector Flow. Appl. Sci. 2020, 10, 6163. [Google Scholar] [CrossRef]
- Yang, X.; Yu, L.; Li, S.; Wen, H.; Luo, D.; Bian, C.; Qin, J.; Ni, D.; Heng, P. Towards Automated Semantic Segmentation in Prenatal Volumetric Ultrasound. IEEE Transactions on Medical Imaging 2019, 38, 180–19. [Google Scholar] [CrossRef]
- Thomas, T.G.; Peters, R.A.; Jeanty, P. Automatic segmentation of ultrasound images using morphological operators. IEEE Transactions on Medical Imaging 1991, 10, 180–186. [Google Scholar] [CrossRef]
- Menchón-Lara, R.; Sancho-Gómez, J. Fully automatic segmentation of ultrasound common carotid artery images based on machine learning. Neurocomputing 2015, 151, 161–167. [Google Scholar] [CrossRef]
- Cunningham, R.; Harding, P.; Loram, I. Real-Time Ultrasound Segmentation, Analysis and Visualisation of Deep Cervical Muscle Structure. IEEE Trans Med Imaging 2017, 36, 653–667. [Google Scholar] [CrossRef]
- Lefèvre, J.; Germanaud, D.; Dubois, J.; Rousseau, F.; de Macedo Santos, I.; Angleys, H.; Mangin, J.F.; Hüppi, P.S.; Girard, N.; de Guio, F. Are Developmental Trajectories of Cortical Folding Comparable Between Cross-sectional Datasets of Fetuses and Preterm Newborns? Cerebral Cortex 2016, 26, 3023–3035. [Google Scholar] [CrossRef]
- Dubois, J.; Lefèvre, J.; Angleys, H.; Leroy, F.; Fischer, C.; Lebenberg, J.; Dehaene-Lambertz, G.; Borradori-Tolsa, C.; Lazeyras, F.; Hertz-Pannier, L.; Mangin, J.F.; Hüppi, P.S.; Germanaud, D. The dynamics of cortical folding waves and prematurity-related deviations revealed by spatial and spectral analysis of gyrification. NeuroImage 2019, 185, 934–946. [Google Scholar] [CrossRef]
- Gholipour, A.; Rollins, C.; Velasco-Annis, C.; Ouaalam, A.; Akhondi-Asl, A.; Afacan, O.; Ortinau, C.; Clancy, S.; Limperopoulos, C.; Yang, E.; Estroff, J.; Warfield, S. A normative spatiotemporal MRI atlas of the fetal brain for automatic segmentation and analysis of early brain growth. Sci Rep. 2017, 7, 476. [Google Scholar] [CrossRef] [PubMed]
- Spreafico, R.; Tassi, L. Cortical malformations. Handbook of Clinical Neurology 2012, 108, 535–557. [Google Scholar] [CrossRef] [PubMed]
- Faculty of Washington. Neuroscience for Kids - Directions/Planes. https://faculty.washington.edu/chudler/slice.
- Márquez-Neila, P.; Baumela, L. and Alvarez, L. A Morphological Approach to Curvature-based Evolution of Curves and Surfaces. IEEE Transactions on Pattern Analysis and Machine Intelligence (PAMI) 2014, 36, 2–17. [Google Scholar] [CrossRef] [PubMed]
Figure 1.
Atlas of the brain of a premature baby using magnetic resonance imaging at weeks 22, 25, 28, 31, 34 and 37 weeks. It corresponds to axial, coronal and sagittal views for each week [
22].
Figure 1.
Atlas of the brain of a premature baby using magnetic resonance imaging at weeks 22, 25, 28, 31, 34 and 37 weeks. It corresponds to axial, coronal and sagittal views for each week [
22].
Figure 2.
Plans used in the study of a premature baby. For the coronal plane and following the alphabetical order from a to f, we have the planes of c1, c2, c3, c4, c5 and c6; and following the same order but starting with g and ending with m, the sagittal planes s1, s2l, s2r, s3l, s3r, s4l and s4r.
Figure 3.
Semi-automatic GUI platform design.
Figure 3.
Semi-automatic GUI platform design.
Figure 4.
Block diagram of the functionalities and interactions of the proposed application.
Figure 4.
Block diagram of the functionalities and interactions of the proposed application.
Figure 5.
Local Filter has been applied to an ultrasound image (Original) with different surface sizes for analysis. As shown in the figure, the resulting images obtained using Mean 3x3, 9x9, 27x27, 55x55, and 81x81 pixels are presented from left to right as an example.
Figure 5.
Local Filter has been applied to an ultrasound image (Original) with different surface sizes for analysis. As shown in the figure, the resulting images obtained using Mean 3x3, 9x9, 27x27, 55x55, and 81x81 pixels are presented from left to right as an example.
Figure 6.
Preprocessing of an image with the objective of scaling the values between the maximum and minimum values of the image.
Figure 6.
Preprocessing of an image with the objective of scaling the values between the maximum and minimum values of the image.
Figure 7.
Comparison between the original image and the one obtained after applying the sigmoid function with a cutoff value of 0.5 and a gain value of 10.
Figure 7.
Comparison between the original image and the one obtained after applying the sigmoid function with a cutoff value of 0.5 and a gain value of 10.
Figure 8.
Example of an original image and the resulting image after applying a threshold and closure function for comparison.
Figure 8.
Example of an original image and the resulting image after applying a threshold and closure function for comparison.
Figure 9.
A histogram is used to determine the number of structures based on their area. Structures with an area below the reference value (indicated by the red line) are eliminated. This process generates a new image (third column) containing only the structures that meet the specified condition.
Figure 9.
A histogram is used to determine the number of structures based on their area. Structures with an area below the reference value (indicated by the red line) are eliminated. This process generates a new image (third column) containing only the structures that meet the specified condition.
Figure 10.
Mask obtained from the morphological_chan_vese function of a groove to be segmented and its corresponding inversion because the number of pixels with value 1 was greater than 50%.
Figure 10.
Mask obtained from the morphological_chan_vese function of a groove to be segmented and its corresponding inversion because the number of pixels with value 1 was greater than 50%.
Figure 13.
Diagram illustrating the semi-automatic groove detection process within the GUI platform.
Figure 13.
Diagram illustrating the semi-automatic groove detection process within the GUI platform.
Figure 14.
An example illustrating the behavior of the segment vertices defined by the algorithm and the corresponding changes in the coordinates of the corresponding slot in the table.
Figure 14.
An example illustrating the behavior of the segment vertices defined by the algorithm and the corresponding changes in the coordinates of the corresponding slot in the table.
Figure 15.
Segmentation examples for the sylvian sulcus (Manual segmentation), carried out between weeks 24 and 32 of gestation of a mime baby applying the different segmentation methods (Threshold, Sigmoid + Threshold and Snakes)
Figure 15.
Segmentation examples for the sylvian sulcus (Manual segmentation), carried out between weeks 24 and 32 of gestation of a mime baby applying the different segmentation methods (Threshold, Sigmoid + Threshold and Snakes)
Figure 16.
Examples of segmentation of different grooves in an ultrasound scan of a baby at week 29 of gestation and c4 coronal section
Figure 16.
Examples of segmentation of different grooves in an ultrasound scan of a baby at week 29 of gestation and c4 coronal section
Figure 17.
Segmentation of the sylvian sulcus applying the three defined segmentation methods (Threshold, Sigmoid + Threshold and Sankes) for differents babies and weeks
Figure 17.
Segmentation of the sylvian sulcus applying the three defined segmentation methods (Threshold, Sigmoid + Threshold and Sankes) for differents babies and weeks
Figure 18.
Example of how the segmentation results vary with different methods depending on the accuracy of the manual segmentation, with the first row showing more precise manual segmentation and the second row showing less precise manual segmentation.
Figure 18.
Example of how the segmentation results vary with different methods depending on the accuracy of the manual segmentation, with the first row showing more precise manual segmentation and the second row showing less precise manual segmentation.
Table 1.
List of Python libraries used to develop the GUI platform.
Table 1.
List of Python libraries used to develop the GUI platform.
| Library |
Definition and functions |
| matplotlib |
Mathematical extension library used to generate graphs from data stored in lists or arrays. |
| scikit-image |
Library that comprises a collection of algorithms designed for image processing tasks. |
| OpenCV |
Library for computer vision and machine learning. |
| NumPy |
Library designed to facilitate the creation of large multidimensional arrays and vectors. It offers a wide range of high-level mathematical functions that enable efficient operations on these arrays and vectors. |
| PIL |
Library that supports various image file formats for opening, editing, and saving images. pandas is a Python library that extends NumPy and provides data manipulation and analysis capabilities, specifically for working with numerical tables and time series data. |
| keras |
Library for Neural Networks that is open-source and specifically designed to enable quick experimentation with Deep Learning networks. |
| Scikit-learn |
Machine learning library that provides algorithms for classification, regression, and group analysis. It includes support for popular algorithms such as support vector machines, random forests, gradient boosting, K-means, and DBSCAN. |
| scipy |
Library offers modules for optimization, linear algebra, integration, interpolation, special functions, FFT, signal and image processing, solving ODEs, and other scientific and engineering tasks. |
| Dash |
Framework that enables the creation of web analytic platforms in Python, allowing non-programmers to perform predefined tasks through interactive buttons or sliders.1
|
|
Disclaimer/Publisher’s Note: The statements, opinions and data contained in all publications are solely those of the individual author(s) and contributor(s) and not of MDPI and/or the editor(s). MDPI and/or the editor(s) disclaim responsibility for any injury to people or property resulting from any ideas, methods, instructions or products referred to in the content. |
© 2023 by the authors. Licensee MDPI, Basel, Switzerland. This article is an open access article distributed under the terms and conditions of the Creative Commons Attribution (CC BY) license (http://creativecommons.org/licenses/by/4.0/).

