
Submitted:
15 May 2023
Posted:
16 May 2023
You are already at the latest version
Abstract
The influence of pH, temperature, biopolymer ratio, total concentration, and ionic concentration on the interaction between egg white protein (EWP) and chitosan (CS) was investigated through turbidity, zeta potential, and state diagram in our research. In addition, phase behavior was observed under various conditions. The turbidity of EWP remained low (turbidity<0.03) and basically unchanged at a wide range of pH (4.0-8.0), while the turbidity of CS was slightly higher (turbidity<0.2) after pH 7.0 than before. Moreover, under the same conditions, a sharply rising peak pattern was observed for the complex between EWP and CS. The maximum turbidity value was observed at 55°C, and the temperature had a mild effect on turbidity. The optimum EWP to CS ratio was found to be 12:1 based on the experiment of the turbidity curves and state diagrams influenced by different biopolymer mixing ratios. With the enhanced concentrations of total biopolymer, the maximum turbidity rose insignificantly above 0.1%.
Keywords:
Egg white protein
; chitosan
; complex coacervates
; turbidity
; phase diagram
1. Introduction
In the food industry, interactions between polysaccharides and proteins are employed to regulate the structure, texture, and stability of food systems [1,2,3,4]. Indeed, aside from their applications in food, protein-polysaccharide interactions are extensively utilized in the microencapsulation of ingredients, cosmetics, and pharmaceutical products [5,6,7,8]. Furthermore, single components rarely exist in isolation, and interactions between proteins and polysaccharides are more commonly found in complex production systems [9,10,11].
Given the growing number of uses for polysaccharide-protein complexes, it is important to study the factors that affect how polysaccharides and proteins work together [12]. To the best of our knowledge, two types of phase behavior, segregative and associative, may be formed when proteins and polysaccharides are mixed together, depending on the charge properties of both biopolymers [13,14,15,16]. Studies have indicated that electrostatic, steric exclusion, hydrogen bonding, and hydrophobic interactions are the main noncovalent interactions between polysaccharides and proteins [17].
More recently, numerous in-depth evaluations of various protein-polysaccharide complex coacervates affected by external variables, including temperature, pH, and ionic strength, have become readily available. In particular, studies conducted by Wang et al. [18] revealed that the depolymerization of κ-carrageenan could influence its interaction with β-lactoglobulin using ultrasound. Cao et al. [19] presented a detailed phase diagram for an aqueous mixture of type B gelatin, κ-carrageenan, and gelling biopolymers with opposing charges at pH 7.0. It was also noted that the pH level could influence the charge and interaction of aggregates of gum arabic and chitosan [20]. Zhong and Li [21] pointed out that the gelation characteristics of pectin and whey protein could be affected by the composition and biopolymer ratio of mixtures in pH ranges of 1.0 to 4.0. The inclusion of xanthan gum or guar gum could impact the continuous phase viscosity and oxidative stability of soy-soluble polysaccharide stabilized oil-in-water emulsions [22,23]. Among all factors, the pH level can affect the number of charges carried by different types of polysaccharide-protein complex coacervates [24,25]. Furthermore, the electrostatic interaction between proteins and polysaccharides, which is strongly related to the coacervates’ structure, can be utilized to estimate the degree of charge dependency in protein-polysaccharide complex coacervates [6]. Overall, these findings have significant implications for research into how proteins and polysaccharides interact with each other.
As a significant food ingredient, EWP provides a variety of functional qualities, including foam stability and emulsifying capabilities. Moreover, the interactions between proteins and polysaccharides play a crucial role in several processing sectors, such as the food, cosmetics, and pharmaceutical industries. Unfortunately, little information is available regarding the conjugates of egg white protein with polysaccharides, let alone egg white protein-chitosan complex coacervates [26]. In other words, systematic research on the interactions between egg white protein and chitosan (CS) affected by pH, temperature, salt, biopolymer ratio, etc., is still lacking. Furthermore, Morin-Crini et al. (2019) reported that chitosan has received approval from the US Food and Drug Administration as a safe dietary fiber, food additive, and functional ingredient [27]. However, to the best of our knowledge, many researchers have focused on the capabilities and film-forming properties of chitosan, without considering the interactions between EWP and CS in past research. Therefore, in this study, we investigated the behavior and interactions in EWP-CS aqueous systems under a wide range of pH (4.0-8.0) and other conditions, including temperature, NaCl concentration, total concentration, and EWP:CS ratio.
2. Materials and Methods
2.1. Materials
Fresh eggs were supplied by Rongda Co., Ltd. (Xuan-cheng, Anhui, China). The chitosan (molecular weight about 100 kDa; degree of deacetylation of 95%; moisture 8.0%; ash content 0.7%) used for this experiment was obtained from Sinopharm Chemical Reagent Co., Ltd. (Shanghai, China). The use of other compounds, all of which were of reagent grade, was done without additional purification.
2.2. Preparation of Egg White Protein
After being removed from washed eggs (weight 61.43±2.77, Haugh unit 95.36±4.12, grade AA), the egg white (pH 9.15±0.10, protein concentration 12.50±0.19%) was then adjusted to pH 5.0 using 0.5 M HCl. The suspension was centrifuged at 5500 g for 15 minutes at 25°C after 30 minutes of stirring (500 r/min). The supernatant (protein concentration: 9.86±0.24%) was gathered, freeze-dried, and then kept as EWP in desiccators for future use.
2.3. Sample Preparation
In order to obtain the protein-polysaccharide mixture, stock solutions of EWP and CS solutions were prepared respectively in advance by dissolving EWP power in deionized water (2%, w/w) and CS power in acetate buffer (pH=3.0, 2%, w/w) under gentle stirring (500 r/min at 25°C) for 3 h and then kept at 4°C for more than 12 h to ensure biopolymer dissolution [28,29]. The stirring process was then conducted to adjust the EWP solution’s pH to 8.0 using 0.1 M NaOH. The concentration of EWP and CS was then raised in the solution by adding the stock solutions. After that, a solution of sodium azide was added to prevent microbial growth while the samples were prepared and stored. After that, appropriate masses of stock solutions were mixed in order to obtain different concentrations of EWP and CS mixtures. Then, to prevent microbial growth, sodium azide (0.02%, w/w) was added during sample preparation and storage.
2.4. Turbidimetric Analysis
A UV-visible spectrophotometer (WFJ 2000, UNICO, St. Louis, USA) operating at 600 nm was used to measure the turbidity of the EWP-CS mixture. The turbidity was measured under various conditions, and all measurements were taken at 25℃. After one hour, the samples were removed from the treatment.
2.5. Zeta Potential Measurement
To obtain the overall surface charge of the protein-polysaccharide complexes for a ratio of 12:1 and its corresponding homogeneous EWP and CS solutions during an acid titration from 8.0 to 4.0, the samples’ zeta potential was evaluated using a Zetasizer 2000 and photon correlation spectroscopy (Brookhaven Instruments Ltd., New York, USA). All measurements were conducted in triplicate.
3. Results and Discussion
3.1. Effect of pH
In protein-polysaccharide solutions, pH significantly impacts the phase conditions. Therefore, a diagrammatic sketch of the preparation and interactions between EWP (pI=4.5) and CS (pKa=6.3) was presented in this research (Figure 1). With pH ranging from 8.0 to 4.0, the EWP-CS solutions exhibited four different types of behaviors, including transparent, translucent, turbid, and phase separation.
Zeta potential, a measure of the stability of colloidal systems [30], is influenced by the composition of the medium in which the particle is suspended, the adsorption layer at the interface, and the surface charges on the particle. At a ratio of 12:1 EWP:CS, without NaCl, and a constant total biopolymer concentration (0.05%, w/w), the effects of pH on the creation of complex mixtures were examined. The fluctuation in the zeta potential values of egg white protein, chitosan, and the solution of the complex coacervation within the pH range (4.0-8.0) was depicted in Figure 2.
The results show that the zeta potential of the homogeneous solutions of EWP, CS, and EWP-CS decreased with increasing pH values. The EWP dispersion remained negatively charged at pH >5.4, while the CS dispersion maintained a positive charge in the pH range of 4.0-7.1. These findings are consistent with other studies on chitosan solutions, which have reported positive zeta potential values ranging between +31.6 mV and +63.5 mV at pH 2.5-3.5 [31]. Chitosan becomes positively charged due to its solubilization in acidic conditions, which is facilitated by the protonation of NH3+. At pH >7.1, chitosan may become deprotonated and the chitosan molecules may also aggregate [32,33]. In comparison to the two monodisperse systems, the homogeneous EWP-CS solutions exhibited negative charges at pH >6.3
In addition, Figure 3 shows the turbidity curves of the homogeneous and EWP-CS mixtures. In the pH range of 4.0 to 8.0, the EWP solutions maintained a close-to-zero level of turbidity. On the other hand, the curves for total and partial turbidity of the CS solution changed as the pH value increased. The turbidity curve for the CS solution showed a minor rising trend when the pH value rose from 6.8 to 8.0 due to the deprotonation and aggregation of the CS molecules [34], which was consistent with the results of Figure 2. Furthermore, the opposite charges between solutions of EWP and CS from pH 5.4 to pH 7.1, as revealed by Figure 2, may have contributed to the peak observed in the turbidity curve of the EWP-CS mixture. Dropwise addition of NaOH protonated the reactive sites throughout the CS chains, leading to a decrease in net positive charges and weakening of the EWP-CS interaction, as also reported by Daniele R. Nogueira-Librelotto et al. [35]. When pH was above 7.0, both the chitosan and EWP solutions remained negatively charged, and the mixture system became transparent. This significantly reduced the overall turbidity value. Therefore, Figure 2 and Figure 3 confirmed each other’s results. Eric Dickinson [36] studied the effect of pH on the stability of a diagram of sodium caseinate-stabilized emulsions and found that acidification significantly affected the emulsions’ stability. Researchers [37] found that coacervation occurred between pH 2.6 and 4.0. From their results, we can see that different proteins and polysaccharides may have different effects.
3.2. Effect of Biopolymer Mixing Ratio
It is well known that proteins and polysaccharides can interact electrostatically, leading to the formation of complicated coacervation. The protein-to-polysaccharide ratio can affect the equilibrium of the surface charge on biopolymers [38]. In this study, various ratios of EWP-CS (EWP:CS=1:2, 1:1, 2:1, 4:1, 6:1, 8:1, 10:1, 12:1, 15:1, 20:1) were analyzed to determine how they affected complex formation as a function of pH, at a constant total biopolymer concentration of 0.05%. The data were then analyzed by a turbidimetric method. The researchers found that the EWP-CS ratio had a significant effect on complex coacervation in these mixtures. Figure 4a shows that the maximum turbidity level shifted to a lower value point when the EWP-CS ratio was increased up to 10:1. After that, there was no significant increase from 12:1 to 15:1, indicating that the electrostatic interaction achieved a maximum at a certain ratio (EWP:CS=12:1). Therefore, the ratio of 12:1 (EWP:CS) was chosen to study the impact of various variables on EWP-CS mixture formation, except for the biopolymer mixing ratio. The findings showed that the number of protein molecules that could bind with the polysaccharide chains increased with the protein-polysaccharide ratio [39,40,41]. Furthermore, the study found that higher protein-polysaccharide ratios significantly affected overall turbidity when biopolymers were included in the mixtures.
In the meantime, Figure 4b shows how pH and the biopolymer mixing ratio of EWP:CS affect the phase behavior of complex coacervations (0.05%). It exhibited a different profile when the ratio of EWP:CS was greater than 10:1, with no phase separation occurring after that. It must be caused by the increase of concentration of EWP which arose the interaction of protein-protein. Turbidity increased from pH 6.0 to pH 6.8 at the ratio 12:1(EWP:CS). Generally, the phenomenon of complex coacervation was observed for the EWP:CS ratio of 12:1, which corresponds to their opposite net charge range, where EWP has negative charges and CS has positive charges. But it was interesting that phase separation did not occur after the ratio of 10:1 in the range of 4.0 to 8.0. In another word, there was an appropriate ratio for the protein-polysaccharide system with no precipitation at the whole pH range with the increasing protein-polysaccharide ratio [42]. In Figure 4b, phase separation was visible for ratios ranging from 1:2 to 10:1. It means that at these ratios, the electrostatic interaction between egg white protein and chitosan was strong enough to form precipitate. A complex of EWP-CS with no precipitation was formed at 12:1,15:1 and 20:1 over the wide pH range 4.0-8.0. In addition, the transparent appearance of EWP-CS mixture under acidic conditions to some extent related to electrostatic repulsion between the high positive charges of polysaccharide [43]. It could be seen from the pH value of the translucent state in various proportions of EWP and CS that it shifted to a lower pH when the ratios were larger. It yielded a similar result to the changing trend of turbidity shown in Figure 4a. In fact, the ratios played an important role in the interaction between the biopolymers of EWP and CS, as shown in Figure 4. However, Hoda Khalesi, et al. [28] found that no phase separation was observed in the range of WPI-PG concentration studied even 48 h after centrifugation. In other words, the WPI-PG mixtures tended to be aqueous single homogeneous phases. According to the interesting results, the interactions between different proteins and polysaccharides were quite different. And Miri Klein, et al. [44] investigated and found that the greatest opacity was made with 2:1 wt. the ratio of whey protein isolate: gum arabic. The turbidity was smaller when the ratio was larger.
3.3. Effect of Total Biopolymer Concentration
The study was conducted to analyze the effects of the total biopolymer concentration (0.05-2%, w/w) on the turbidity of EWP-CS mixtures at a 12:1 ratio without NaCl. As seen in Figure 5a, the highest level of turbidity significantly increased when the biopolymer concentration was raised from 0.05% to 1%. However, the maximum degree of turbidity did not significantly increase from 0.1% to 2% as a result of the rise in total concentration. The researchers [41] noted that the increasing number of counterions in the biopolymer mixtures of protein-polysaccharide caused by the higher concentrations of these substances inhibited coacervation. A higher concentration of biopolymers could also cause a higher level of turbidity in the pH range of 7.0 to 8.0. Moreover, there was an abrupt decrease point in the interval (from 7.0 to 8.0). This might be caused by the net charge carried by CS at an alkaline pH range, as well as the electrostatic repulsion and hydrophobic interactions through which both EWP and CS obtain negative charge.
Figure 5b showed that phase separation occurred when total biopolymer concentrations were above 0.05%(w/w). The mixture became increasingly translucent or turbid as the total biopolymer concentration increased, and the pH value where phase separation was present tended to decrease. However, the mixtures containing 0.1% and 0.5% EWP-CS showed only slight changes in response to pH changes. The biopolymers phase separated at pH 5.6 when the total concentration reached 2%; the region of phase separation was wider at this concentration than at other concentrations. This suggests that only when the concentration of certain biopolymers reached 0.1% could soluble biopolymer complexes be formed between a single polysaccharide and a specific number of proteins. A similar pattern was noted when ovalbumin and gum arabic were combined at pH ranges of 1.0 to 7.0 [1]. Actually, Polydisperse polysaccharides can react differently to segregation with other components, and their phase behavior can be much more complex than that of monodisperse systems [45].
3.4. Effect of Temperature
Temperature has a significant impact on molecular interactions in many scientific problems [46,47,48]. The interactions between different groups of biopolymers can also be affected by a change in temperature [49]. For instance, the Flory-Huggin interaction energy can be affected if the temperature changes. To analyze this effect, the turbidity values at critical temperatures (4 ℃, 25 ℃, 35 ℃, 45 ℃, and 55 ℃) as a function of pH were compared in Figure 6a. The temperature variations in the sample range affected the complex chemical composition. Unexpectedly, a wide range of high turbidity was produced at high temperatures when pH was established at 6.2. At higher temperatures, hydrogen bonding had a greater impact on complex formation than hydrophobic interactions. The complex development of CS and EWP at a lower pH value may also be a result of the change in the net charge between CS and EWP. This conclusion is supported by the way in which researchers have studied how additional proteins interacted with polysaccharides [50,51].
The results presented in Figure 6b show that precipitation began to form at pH ranges 5.8-6.6 at both 4 ℃ and 25 ℃, and occurred from 5.6 to 6.4 at both 35 ℃ and 45 ℃. At 55 ℃, precipitation occurred from pH 5.4 to 6.4. As can be observed from Figure 6b, no phase separation was observed at 4 ℃ and 25 ℃, while it appeared at 35 ℃, indicating that complex formation was determined by hydrophobic interactions with increasing temperature [52]. It is clear from Figure 6 that the effect of temperature was not significant enough to cause a considerable change in the complex coacervation of egg white protein and chitosan. Previous studies have reported that emulsions made of whey protein isolate and gum arabic were stable at a wide range of temperatures (30 ℃-90 ℃) [53]. Thus, the phase states differed for various types of proteins and polysaccharides.
3.5. Effect of Ionic Concentration
It has previously been reported that the presence of ion particles in the solution may affect the development of biopolymer complexes by separating the charge from the polymer [54]. Therefore, acid titration was done on mixes of EWP/CS with a total biopolymer content of 0.05% and an EWP:CS ratio of 12:1 for NaCl in the ionic strength range of 0-50 mM in Figure 7a. As the NaCl content grew from 0 to 50 mM, the maximum level of turbidity was seen to decrease from 1.121 to 0.055. As a result, the Na+ and the NaCl-based biopolymer chains competed with each other to maintain a negative charge when NaCl was added to the EWP-CS solutions.
The peak curves of the turpitude decreased as the NaCl concentration dropped to around 10 mM. This suggested that the number of biopolymer complexes decreased. Due to the competition between Na+ and the ionic particles, the addition of NaCl to the solution increased the number of biopolymer complexes, although this effect was weaker than expected. In the range of 20 to 50 mM, the NaCl concentration’s influence on the complexation was not favorable. When the concentration of NaCl was less than 10 mM, the peak curves migrated toward lower pH values, and as the concentration of NaCl rose, the maximum turbidity gradually reduced, suggesting a decrease in the number and/or size of the biopolymer complexes. Thus, a small addition of NaCl seemed to enhance the formation of the complexes. And this phenomenon was deemed to be a weaker trend for the ability of competitive adsorption between Na+ and Cl- with decreasing NaCl concentration. Electrostatic interactions were reduced as a result of NaCl’s unfavorable effects at 20 to 50 mM on the complexation and ionic strength of mixtures. Within this range, the maximum turbidity values shifted to lower levels. According to Bo Wang, et al. [55], Additionally, for emulsions stabilized by soybean protein, turbidity decreased as ionic strength increased.
The small ions are then used to screen the biopolymers to remove their negative constituents, which helps reduce the repulsion between the different complexes and allows for effective phase separation [56]. However, as shown in Figure 7b, phase separation did not occur at the whole range of pH values, which might be caused by the low total biopolymer concentrations. At NaCl<40 mM, the translucent states occurred at pH about 5.4 while the turbid states occurred at pH about 5.8, as can be seen in Figure 2, where the changing charge point of egg white protein from positive to negative was at pH 5.4 to 5.6. At NaCl=50 mM, the solution maintained its transparent status except at pH 7.0 in the investigated range of pH. NaCl ≥5 mM did not lead to effective biopolymer interactions. As demonstrated in Figure 7a, a portion of the charge groups on the surfaces of EWP and CS were screened by NaCl. Only when the net charges picked up by the NaCl solution were able to expand the range of the surface as pH declined did the insoluble complex formation between the biopolymers take place. This study also demonstrated that the interaction between the two biopolymers could be significantly influenced by the NaCl content.
Table 1 was summarized in order to make the stability of the solutions under different conditions clear enough to understand, including pH values, temperature, biopolymer mixing ratio, total biopolymer concentration, and ionic concentration. The EWP-CS complex solutions were found to be stable under most conditions at pH 4.0 to 6.0, but relatively unstable at higher total concentrations and temperatures when pH > 6.8, as well as at lower ratios of EWP.
4. Conclusions
The interactions between biopolymers have become an increasingly interesting field of study. The combination of chitosan, which has noticeable functional properties, and EWP, which is a commonly used food ingredient, could be considered as a novel system for the improvement of products. Based on the analysis results of this comprehensive experimental study of the turbidity and phase behavior of the complex coacervation of egg white protein and chitosan impacted by various factors (pH, temperature, biopolymer mixing ratio, total biopolymer concentration and ionic concentration), the interaction of the complex coacervation can be attributed to the pH levels, which also changed the condition of the mixtures. The optimum ratio of EWP to chitosan was 12:1 for research. Due to the charges on the biopolymer molecules, it displayed a weaker contact intensity when NaCl was present. Temperatures had the least effect on complex formation compared to other factors, as seen in the turbidity and state diagram of EWP-CS complex coacervation. The behavior of EWP/CS combination system can affect the functionalities of these proteins and hydrocolloids. The results can be applied to designing microstructure, emulsion and texture according to phase behavior, electrostatic interactions, or hydrophobic interactions between polysaccharides and proteins. However, further research will be conducted to shed more light on EWP-CS interactions.
Author Contributions
Conceptualization, Y.-M. W. and X. L.; methodology, Y.-M. W. and N. G.; software, Y.-M. W. and N. G.; validation, Y.-M. W., N. G. and X.-J. W.; formal analysis, N. G. and X.-J. W.; investigation, Y.-M. W.; resources, N. G. and X.-J. W.; data curation, Y.-M. W.; writing—original draft preparation, Y.-M. W.; writing—review and editing, Y.-M. W., X. L. and S.-Q. S.; visualization, Y.-M. W.; supervision, X. L. and S.-Q. S; project administration, X. L. and S.-Q. S; funding acquisition, X. L. and S.-Q. S. All authors have read and agreed to the published version of the manuscript.”
Funding
This research was funded by Yantai Science and Technology Bureau Support Grant/Science and Technology Innovation Development Project (2022XDRH034) and the Youth Fund of Shandong Natural Science Foundation (ZR2021QC065).
Data Availability Statement
The data presented in this study are available on request from the corresponding author.
Conflicts of Interest
The authors declare no conflict of interest.
References
- Schmidt, T.F.; Pavinatto, F.J.; Caseli, L.; Gonzaga, M.L.C.; Soares, S.A.; Ricardo, N.M.P.S.; Oliveira, O.N. Interaction of polysaccharide–protein complex from Agaricus blazei with Langmuir and Langmuir–Blodgett films of phospholipids. Journal of Colloid and Interface Science 2009, 330, 84–89. [Google Scholar] [CrossRef] [PubMed]
- Li, L.-Y.; Easa, A.M.; Liong, M.-T.; Tan, T.-C.; Foo, W.-T. The use of microbial transglutaminase and soy protein isolate to enhance retention of capsaicin in capsaicin-enriched layered noodles. Food Hydrocolloids 2013, 30, 495–503. [Google Scholar] [CrossRef]
- Singh, A.; Vanga, S.K.; Nair, G.R.; Gariepy, Y.; Orsat, V.; Raghavan, V. Electrohydrodynamic drying (EHD) of wheat and its effect on wheat protein conformation. LWT - Food Science and Technology 2015, 64, 750–758. [Google Scholar] [CrossRef]
- Arvanitoyannis, I.; Biliaderis, C.G.; Ogawa, H.; Kawasaki, N. Biodegradable films made from low-density polyethylene (LDPE), rice starch and potato starch for food packaging applications: Part 1. Carbohydrate Polymers 1998, 36, 89–104. [Google Scholar] [CrossRef]
- Kaushik, P.; Dowling, K.; Barrow, C.J.; Adhikari, B. Complex coacervation between flaxseed protein isolate and flaxseed gum. Food Research International 2015, 72, 91–97. [Google Scholar] [CrossRef]
- Li, Y.; Shi, T.; An, L.; Huang, Q. Monte Carlo Simulation on Complex Formation of Proteins and Polysaccharides. The Journal of Physical Chemistry B 2012, 116, 3045–3053. [Google Scholar] [CrossRef]
- Bharmoria, P.; Singh, T.; Kumar, A. Complexation of chitosan with surfactant like ionic liquids: Molecular interactions and preparation of chitosan nanoparticles. Journal of Colloid and Interface Science 2013, 407, 361–369. [Google Scholar] [CrossRef]
- Zhang, Y.; Guo, Y.; Liu, F.; Luo, Y. Recent development of egg protein fractions and individual proteins as encapsulant materials for delivery of bioactives. Food Chemistry 2023, 403, 134353. [Google Scholar] [CrossRef]
- Jaeckels, N.; Meier, M.; Dietrich, H.; Will, F.; Decker, H.; Fronk, P. Influence of polysaccharides on wine protein aggregation. Food Chemistry 2016, 200, 38–45. [Google Scholar] [CrossRef]
- Spada, J.C.; Marczak, L.D.F.; Tessaro, I.C.; Cardozo, N.S.M. Interactions between soy protein from water-soluble soy extract and polysaccharides in solutions with polydextrose. Carbohydrate Polymers 2015, 134, 119–127. [Google Scholar] [CrossRef]
- Hadidi, M.; Buckley, J.J.; Zydney, A.L. Effects of solution conditions on characteristics and size exclusion chromatography of pneumococcal polysaccharides and conjugate vaccines. Carbohydrate Polymers 2016, 152, 12–18. [Google Scholar] [CrossRef] [PubMed]
- Ettelaie, R.; Akinshina, A. Colloidal interactions induced by overlap of mixed protein+polysaccharide interfacial layers. Food Hydrocolloids 2014, 42, 106–117. [Google Scholar] [CrossRef]
- Bouyer, E.; Mekhloufi, G.; Potier, I.L.; Kerdaniel, T.d.F.d.; Grossiord, J.-L.; Rosilio, V.; Agnely, F. Stabilization mechanism of oil-in-water emulsions by β-lactoglobulin and gum arabic. Journal of Colloid and Interface Science 2011, 354, 467–477. [Google Scholar] [CrossRef] [PubMed]
- Kakehashi, R.; Karlsson, G.; Almgren, M. Stomatosomes, blastula vesicles and bilayer disks: Morphological richness of structures formed in dilute aqueous mixtures of a cationic and an anionic surfactant. Journal of Colloid and Interface Science 2009, 331, 484–493. [Google Scholar] [CrossRef]
- Cortez-Trejo, M.C.; Figueroa-Cárdenas, J.D.; Quintanar-Guerrero, D.; Baigts-Allende, D.K.; Manríquez, J.; Mendoza, S. Effect of pH and protein-polysaccharide ratio on the intermolecular interactions between amaranth proteins and xanthan gum to produce electrostatic hydrogels. Food Hydrocolloids 2022, 129, 107648. [Google Scholar] [CrossRef]
- Syed, R.; Ding, H.H.; Hui, D.; Wu, Y. Physicochemical and functional properties of pigeon pea (Cajanus cajan) protein and non-starch polysaccharides. Bioactive Carbohydrates and Dietary Fibre 2022, 28, 100317. [Google Scholar] [CrossRef]
- McClements, D.J. Non-covalent interactions between proteins and polysaccharides. Biotechnology Advances 2006, 24, 621–625. [Google Scholar] [CrossRef]
- Wang, W.; Liu, F.; Gao, Y. Quercetagetin loaded in soy protein isolate–κ-carrageenan complex: Fabrication mechanism and protective effect. Food Research International 2016, 83, 31–40. [Google Scholar] [CrossRef]
- Cao, Y.; Wang, L.; Zhang, K.; Fang, Y.; Nishinari, K.; Phillips, G.O. Mapping the Complex Phase Behaviors of Aqueous Mixtures of κ-Carrageenan and Type B Gelatin. The Journal of Physical Chemistry B 2015, 119, 9982–9992. [Google Scholar] [CrossRef]
- Quintanilha, R.C.; Orth, E.S.; Grein-Iankovski, A.; Riegel-Vidotti, I.C.; Vidotti, M. The use of gum Arabic as “Green” stabilizer of poly(aniline) nanocomposites: A comprehensive study of spectroscopic, morphological and electrochemical properties. Journal of Colloid and Interface Science 2014, 434, 18–27. [Google Scholar] [CrossRef]
- Li, K.; Zhong, Q. Aggregation and gelation properties of preheated whey protein and pectin mixtures at pH 1.0–4.0. Food Hydrocolloids 2016, 60, 11–20. [Google Scholar] [CrossRef]
- Du, F.; Qi, Y.; Huang, H.; Wang, P.; Xu, X.; Yang, Z. Stabilization of O/W emulsions via interfacial protein concentrating induced by thermodynamic incompatibility between sarcoplasmic proteins and xanthan gum. Food Hydrocolloids 2022, 124, 107242. [Google Scholar] [CrossRef]
- Farooq, S.; Ahmad, M.I.; Abdullah. Interfacial rheology of sodium caseinate/high acyl gellan gum complexes: Stabilizing oil-in-water emulsions. Current Research in Food Science 2022, 5, 234–242. [Google Scholar] [CrossRef] [PubMed]
- Timilsena, Y.P.; Wang, B.; Adhikari, R.; Adhikari, B. Preparation and characterization of chia seed protein isolate–chia seed gum complex coacervates. Food Hydrocolloids 2016, 52, 554–563. [Google Scholar] [CrossRef]
- Falsafi, S.R.; Rostamabadi, H.; Samborska, K.; Mirarab, S.; Rashidinejhad, A.; Jafari, S.M. Protein-polysaccharide interactions for the fabrication of bioactive-loaded nanocarriers: Chemical conjugates and physical complexes. Pharmacological Research 2022, 178, 106164. [Google Scholar] [CrossRef] [PubMed]
- Zou, W.; Mourad, F.K.; Zhang, X.; Ahn, D.U.; Cai, Z.; Jin, Y. Phase separation behavior and characterization of ovalbumin and propylene glycol alginate complex coacervates. Food Hydrocolloids 2020, 108, 105978. [Google Scholar] [CrossRef]
- Morin-Crini, N.; Lichtfouse, E.; Torri, G.; Crini, G. Fundamentals and Applications of Chitosan. In Sustainable Agriculture Reviews 35: Chitin and Chitosan: History, Fundamentals and Innovations; Crini, G., Lichtfouse, E., Eds.; Springer International Publishing, 2019; pp. 49–123. [Google Scholar] [CrossRef]
- Khalesi, H.; Emadzadeh, B.; Kadkhodaee, R.; Fang, Y. Whey protein isolate-Persian gum interaction at neutral pH. Food Hydrocolloids 2016, 59, 45–49. [Google Scholar] [CrossRef]
- Ferreira, D.P.; Conceição, D.S.; Calhelha, R.C.; Sousa, T.; Socoteanu, R.; Ferreira, I.C.F.R.; Vieira Ferreira, L.F. Porphyrin dye into biopolymeric chitosan films for localized photodynamic therapy of cancer. Carbohydrate Polymers 2016, 151, 160–171. [Google Scholar] [CrossRef]
- Liao, L.; Wang, Q.; Zhao, M.-m. Functional, conformational and topographical changes of succinic acid deamidated wheat gluten upon freeze- and spray-drying: A comparative study. LWT - Food Science and Technology 2013, 50, 177–184. [Google Scholar] [CrossRef]
- Carneiro-da-Cunha, M.G.; Cerqueira, M.A.; Souza, B.W.S.; Teixeira, J.A.; Vicente, A.A. Influence of concentration, ionic strength and pH on zeta potential and mean hydrodynamic diameter of edible polysaccharide solutions envisaged for multinanolayered films production. Carbohydrate Polymers 2011, 85, 522–528. [Google Scholar] [CrossRef]
- Chang, P.G.; Gupta, R.; Timilsena, Y.P.; Adhikari, B. Optimisation of the complex coacervation between canola protein isolate and chitosan. Journal of Food Engineering 2016, 191, 58–66. [Google Scholar] [CrossRef]
- Rinaudo, M.; Pavlov, G.; Desbrières, J. Influence of acetic acid concentration on the solubilization of chitosan. Polymer 1999, 40, 7029–7032. [Google Scholar] [CrossRef]
- Yuan, Y.; Wan, Z.-L.; Yin, S.-W.; Yang, X.-Q.; Qi, J.-R.; Liu, G.-Q.; Zhang, Y. Characterization of complexes of soy protein and chitosan heated at low pH. LWT - Food Science and Technology 2013, 50, 657–664. [Google Scholar] [CrossRef]
- Nogueira-Librelotto, D.R.; Scheeren, L.E.; Vinardell, M.P.; Mitjans, M.; Rolim, C.M.B. Chitosan-tripolyphosphate nanoparticles functionalized with a pH-responsive amphiphile improved the in vitro antineoplastic effects of doxorubicin. Colloids and Surfaces B: Biointerfaces 2016, 147, 326–335. [Google Scholar] [CrossRef] [PubMed]
- Yuan, Z.; Hao, J.; Hoffmann, H. A promising system of mixed single- and double-short-tailed PEO ether phosphate esters: Phase behavior and vesicle formation. Journal of Colloid and Interface Science 2006, 302, 673–681. [Google Scholar] [CrossRef]
- Niu, F.; Dong, Y.; Shen, F.; Wang, J.; Liu, Y.; Su, Y.; Xu, R.; Wang, J.; Yang, Y. Phase separation behavior and structural analysis of ovalbumin–gum arabic complex coacervation. Food Hydrocolloids 2015, 43, 1–7. [Google Scholar] [CrossRef]
- Cortés-Morales, E.A.; Mendez-Montealvo, G.; Velazquez, G. Interactions of the molecular assembly of polysaccharide-protein systems as encapsulation materials. A review. Advances in Colloid and Interface Science 2021, 295, 102398. [Google Scholar] [CrossRef]
- Mishchuk, N. Electric double layer and electrostatic interaction of hydrophobic particles. Journal of Colloid and Interface Science 2008, 320, 599–607. [Google Scholar] [CrossRef]
- Lou, S.-F.; Zhang, H.; Williams, G.R.; Branford-White, C.; Nie, H.-L.; Quan, J.; Zhu, L.-M. Fabrication and aggregation of thermoresponsive glucose-functionalized double hydrophilic copolymers. Colloids and Surfaces B: Biointerfaces 2013, 105, 180–186. [Google Scholar] [CrossRef]
- Niu, F.; Su, Y.; Liu, Y.; Wang, G.; Zhang, Y.; Yang, Y. Ovalbumin–gum arabic interactions: Effect of pH, temperature, salt, biopolymers ratio and total concentration. Colloids and Surfaces B: Biointerfaces 2014, 113, 477–482. [Google Scholar] [CrossRef]
- Azarikia, F.; Abbasi, S. Mechanism of soluble complex formation of milk proteins with native gums (tragacanth and Persian gum). Food Hydrocolloids 2016, 59, 35–44. [Google Scholar] [CrossRef]
- De Miguel, G.; Hosomizu, K.; Umeyama, T.; Matano, Y.; Imahori, H.; Pérez-Morales, M.; Martín-Romero, M.T.; Camacho, L. J-aggregation of a sulfonated amphiphilic porphyrin at the air–water interface as a function of pH. Journal of Colloid and Interface Science 2011, 356, 775–782. [Google Scholar] [CrossRef] [PubMed]
- Klein, M.; Aserin, A.; Svitov, I.; Garti, N. Enhanced stabilization of cloudy emulsions with gum Arabic and whey protein isolate. Colloids and Surfaces B: Biointerfaces 2010, 77, 75–81. [Google Scholar] [CrossRef] [PubMed]
- Chang, C.; Niu, F.; Gu, L.; Li, X.; Yang, H.; Zhou, B.; Wang, J.; Su, Y.; Yang, Y. Formation of fibrous or granular egg white protein microparticles and properties of the integrated emulsions. Food Hydrocolloids 2016, 61, 477–486. [Google Scholar] [CrossRef]
- Ghosh, B.; Sinha, A.; Roy, N.; Rajbanshi, B.; Mondal, M.; Roy, D.; Das, A.; Ghosh, N.N.; Dakua, V.K.; Roy, M.N. Molecular Interactions of Some Bioactive Molecules Prevalent in Aqueous Ionic Liquid Solutions at Different Temperatures Investigated by Experimental and Computational Contrivance. Fluid Phase Equilibria 2022, 557, 113415. [Google Scholar] [CrossRef]
- Yakunchikov, A.; Kosyanchuk, V.; Kroupnov, A.; Pogosbekian, M.; Bryukhanov, I.; Iuldasheva, A. Potential energy surface of interaction of two diatomic molecules for air flows simulation at intermediate temperatures. Chemical Physics 2020, 536, 110850. [Google Scholar] [CrossRef]
- Mondal, M.; Basak, S.; Rajbanshi, B.; Choudhury, S.; Ghosh, N.N.; Roy, M.N. Subsistence of diverse interactions of some biologically important molecules in aqueous ionic liquid solutions at various temperatures by experimental and theoretical investigation. Journal of Molecular Structure 2022, 1257, 132571. [Google Scholar] [CrossRef]
- Song, Y.; Zhang, D.; Lv, Y.; Guo, X.; Lou, R.; Wang, S.; Wang, X.; Yu, W.; Ma, X. Microfabrication of a tunable collagen/alginate-chitosan hydrogel membrane for controlling cell–cell interactions. Carbohydrate Polymers 2016, 153, 652–662. [Google Scholar] [CrossRef]
- Carpentier, J.; Conforto, E.; Chaigneau, C.; Vendeville, J.-E.; Maugard, T. Complex coacervation of pea protein isolate and tragacanth gum: Comparative study with commercial polysaccharides. Innovative Food Science & Emerging Technologies 2021, 69, 102641. [Google Scholar] [CrossRef]
- Li, G.-Y.; Chen, Q.-H.; Su, C.-R.; Wang, H.; He, S.; Liu, J.; Nag, A.; Yuan, Y. Soy protein-polysaccharide complex coacervate under physical treatment: Effects of pH, ionic strength and polysaccharide type. Innovative Food Science & Emerging Technologies 2021, 68, 102612. [Google Scholar] [CrossRef]
- Patel, R.; Mir, M.U.H.; Singh, U.K.; Beg, I.; Islam, A.; Khan, A.B. Refolding of urea denatured cytochrome c: Role of hydrophobic tail of the cationic gemini surfactants. Journal of Colloid and Interface Science 2016, 484, 205–212. [Google Scholar] [CrossRef] [PubMed]
- Ozturk, B.; Argin, S.; Ozilgen, M.; McClements, D.J. Formation and stabilization of nanoemulsion-based vitamin E delivery systems using natural biopolymers: Whey protein isolate and gum arabic. Food Chemistry 2015, 188, 256–263. [Google Scholar] [CrossRef] [PubMed]
- Weinbreck, F.; Nieuwenhuijse, H.; Robijn, G.W.; de Kruif, C.G. Complexation of Whey Proteins with Carrageenan. Journal of Agricultural and Food Chemistry 2004, 52, 3550–3555. [Google Scholar] [CrossRef] [PubMed]
- Wang, B.; Li, D.; Wang, L.-J.; Adhikari, B.; Shi, J. Ability of flaxseed and soybean protein concentrates to stabilize oil-in-water emulsions. Journal of Food Engineering 2010, 100, 417–426. [Google Scholar] [CrossRef]
- Ding, L.; Yu, D.; Zhou, Y.; Han, Z.; Liu, L.; Huo, L.; Jin, G.; Guo, Z. Evaluation and application of a positively-charged phenylaminopropyl bonded stationary phase for separation of basic compounds. Journal of Chromatography A 2021, 1660, 462674. [Google Scholar] [CrossRef]
Figure 1.
The diagrammatic sketch of the preparation and phase situations of EWP-CS system with different pH values.
Figure 1.
The diagrammatic sketch of the preparation and phase situations of EWP-CS system with different pH values.
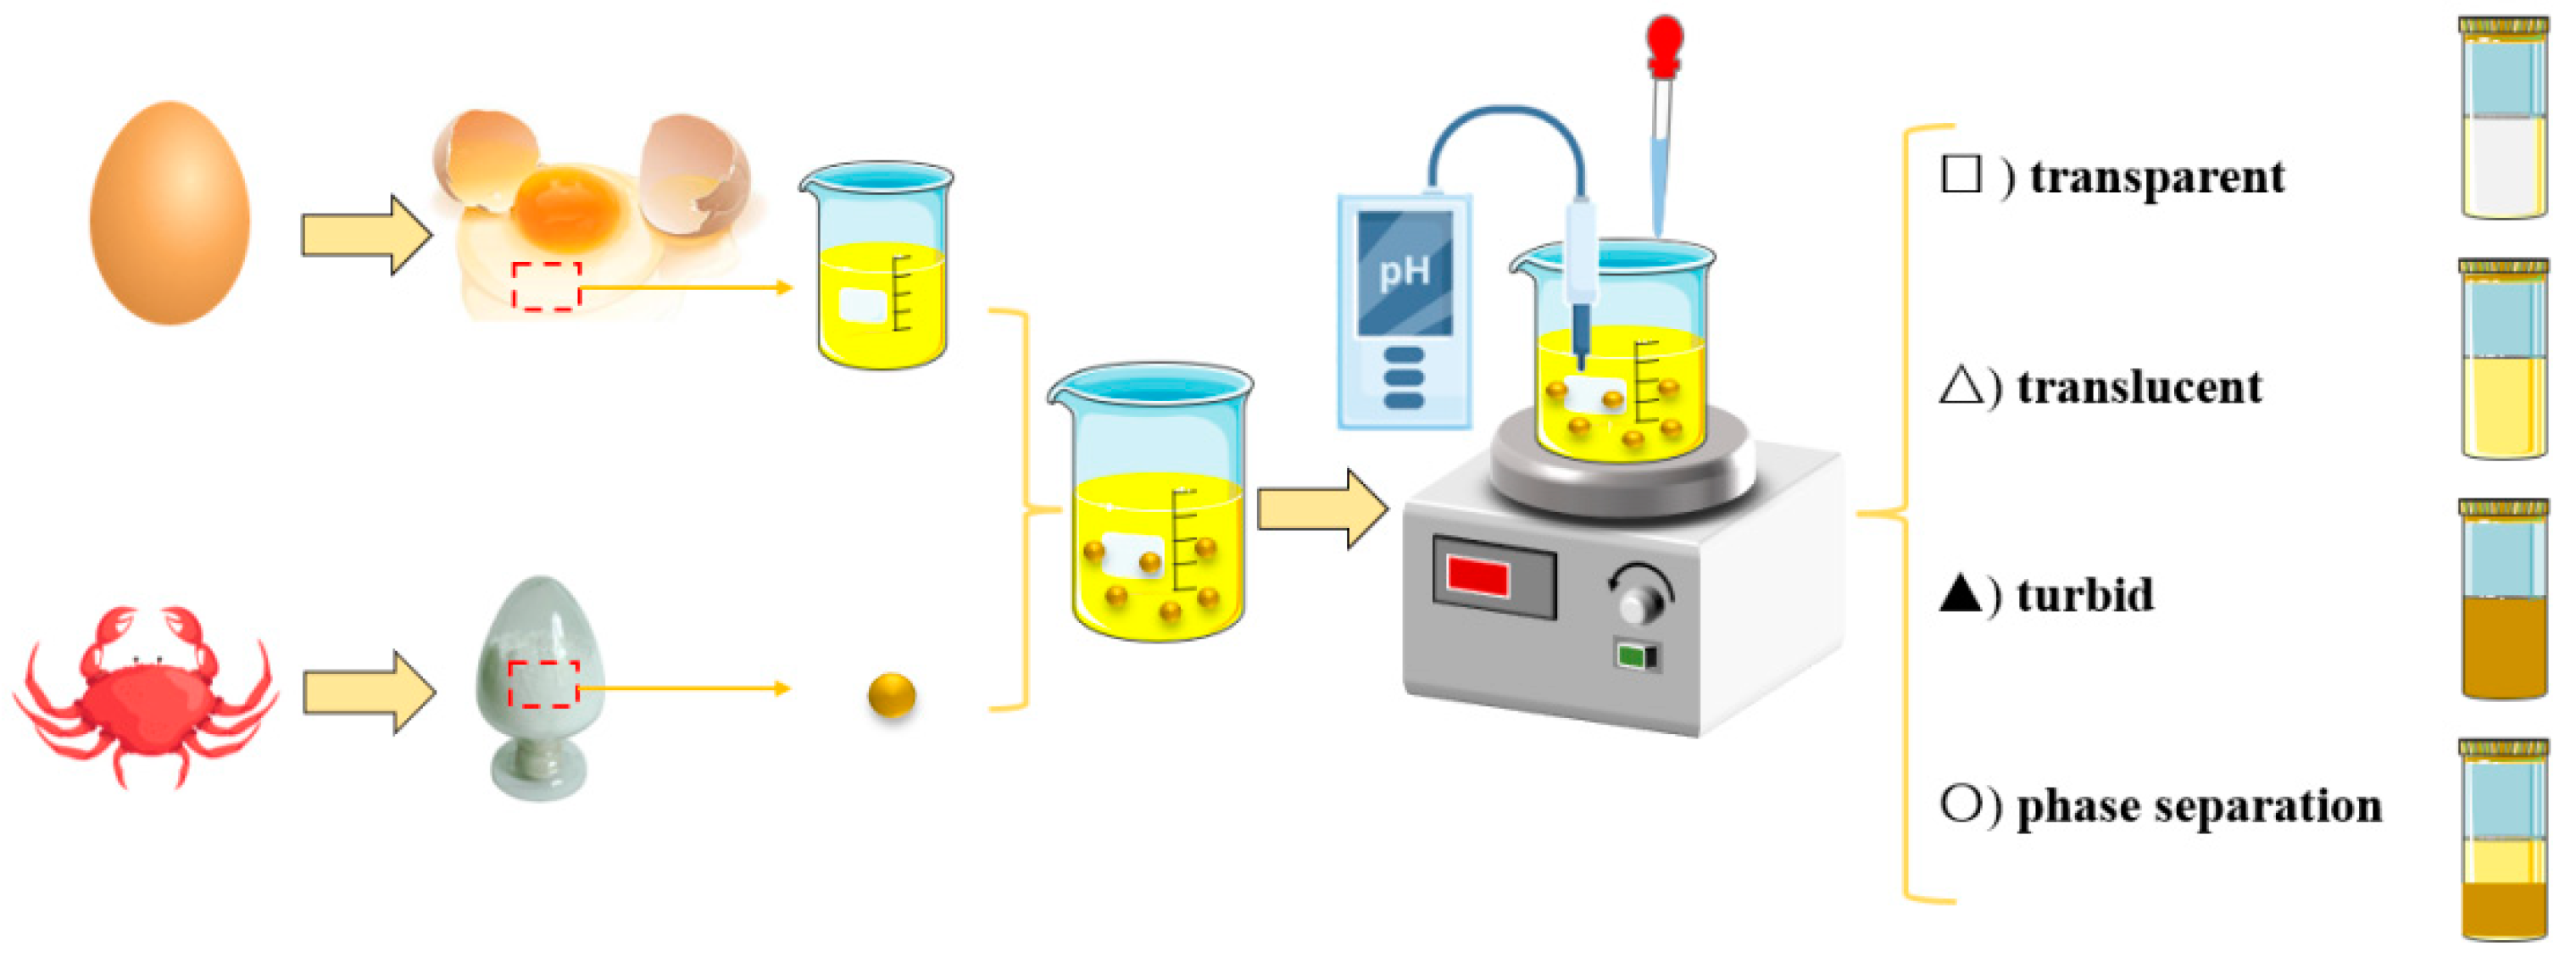
Figure 2.
Zeta potential (mV) values for the EWP, CS, and mixed EWP-CS systems in relation to pH (12:1, 0 mM NaCl, and 0.05% total biopolymer concentration).
Figure 2.
Zeta potential (mV) values for the EWP, CS, and mixed EWP-CS systems in relation to pH (12:1, 0 mM NaCl, and 0.05% total biopolymer concentration).
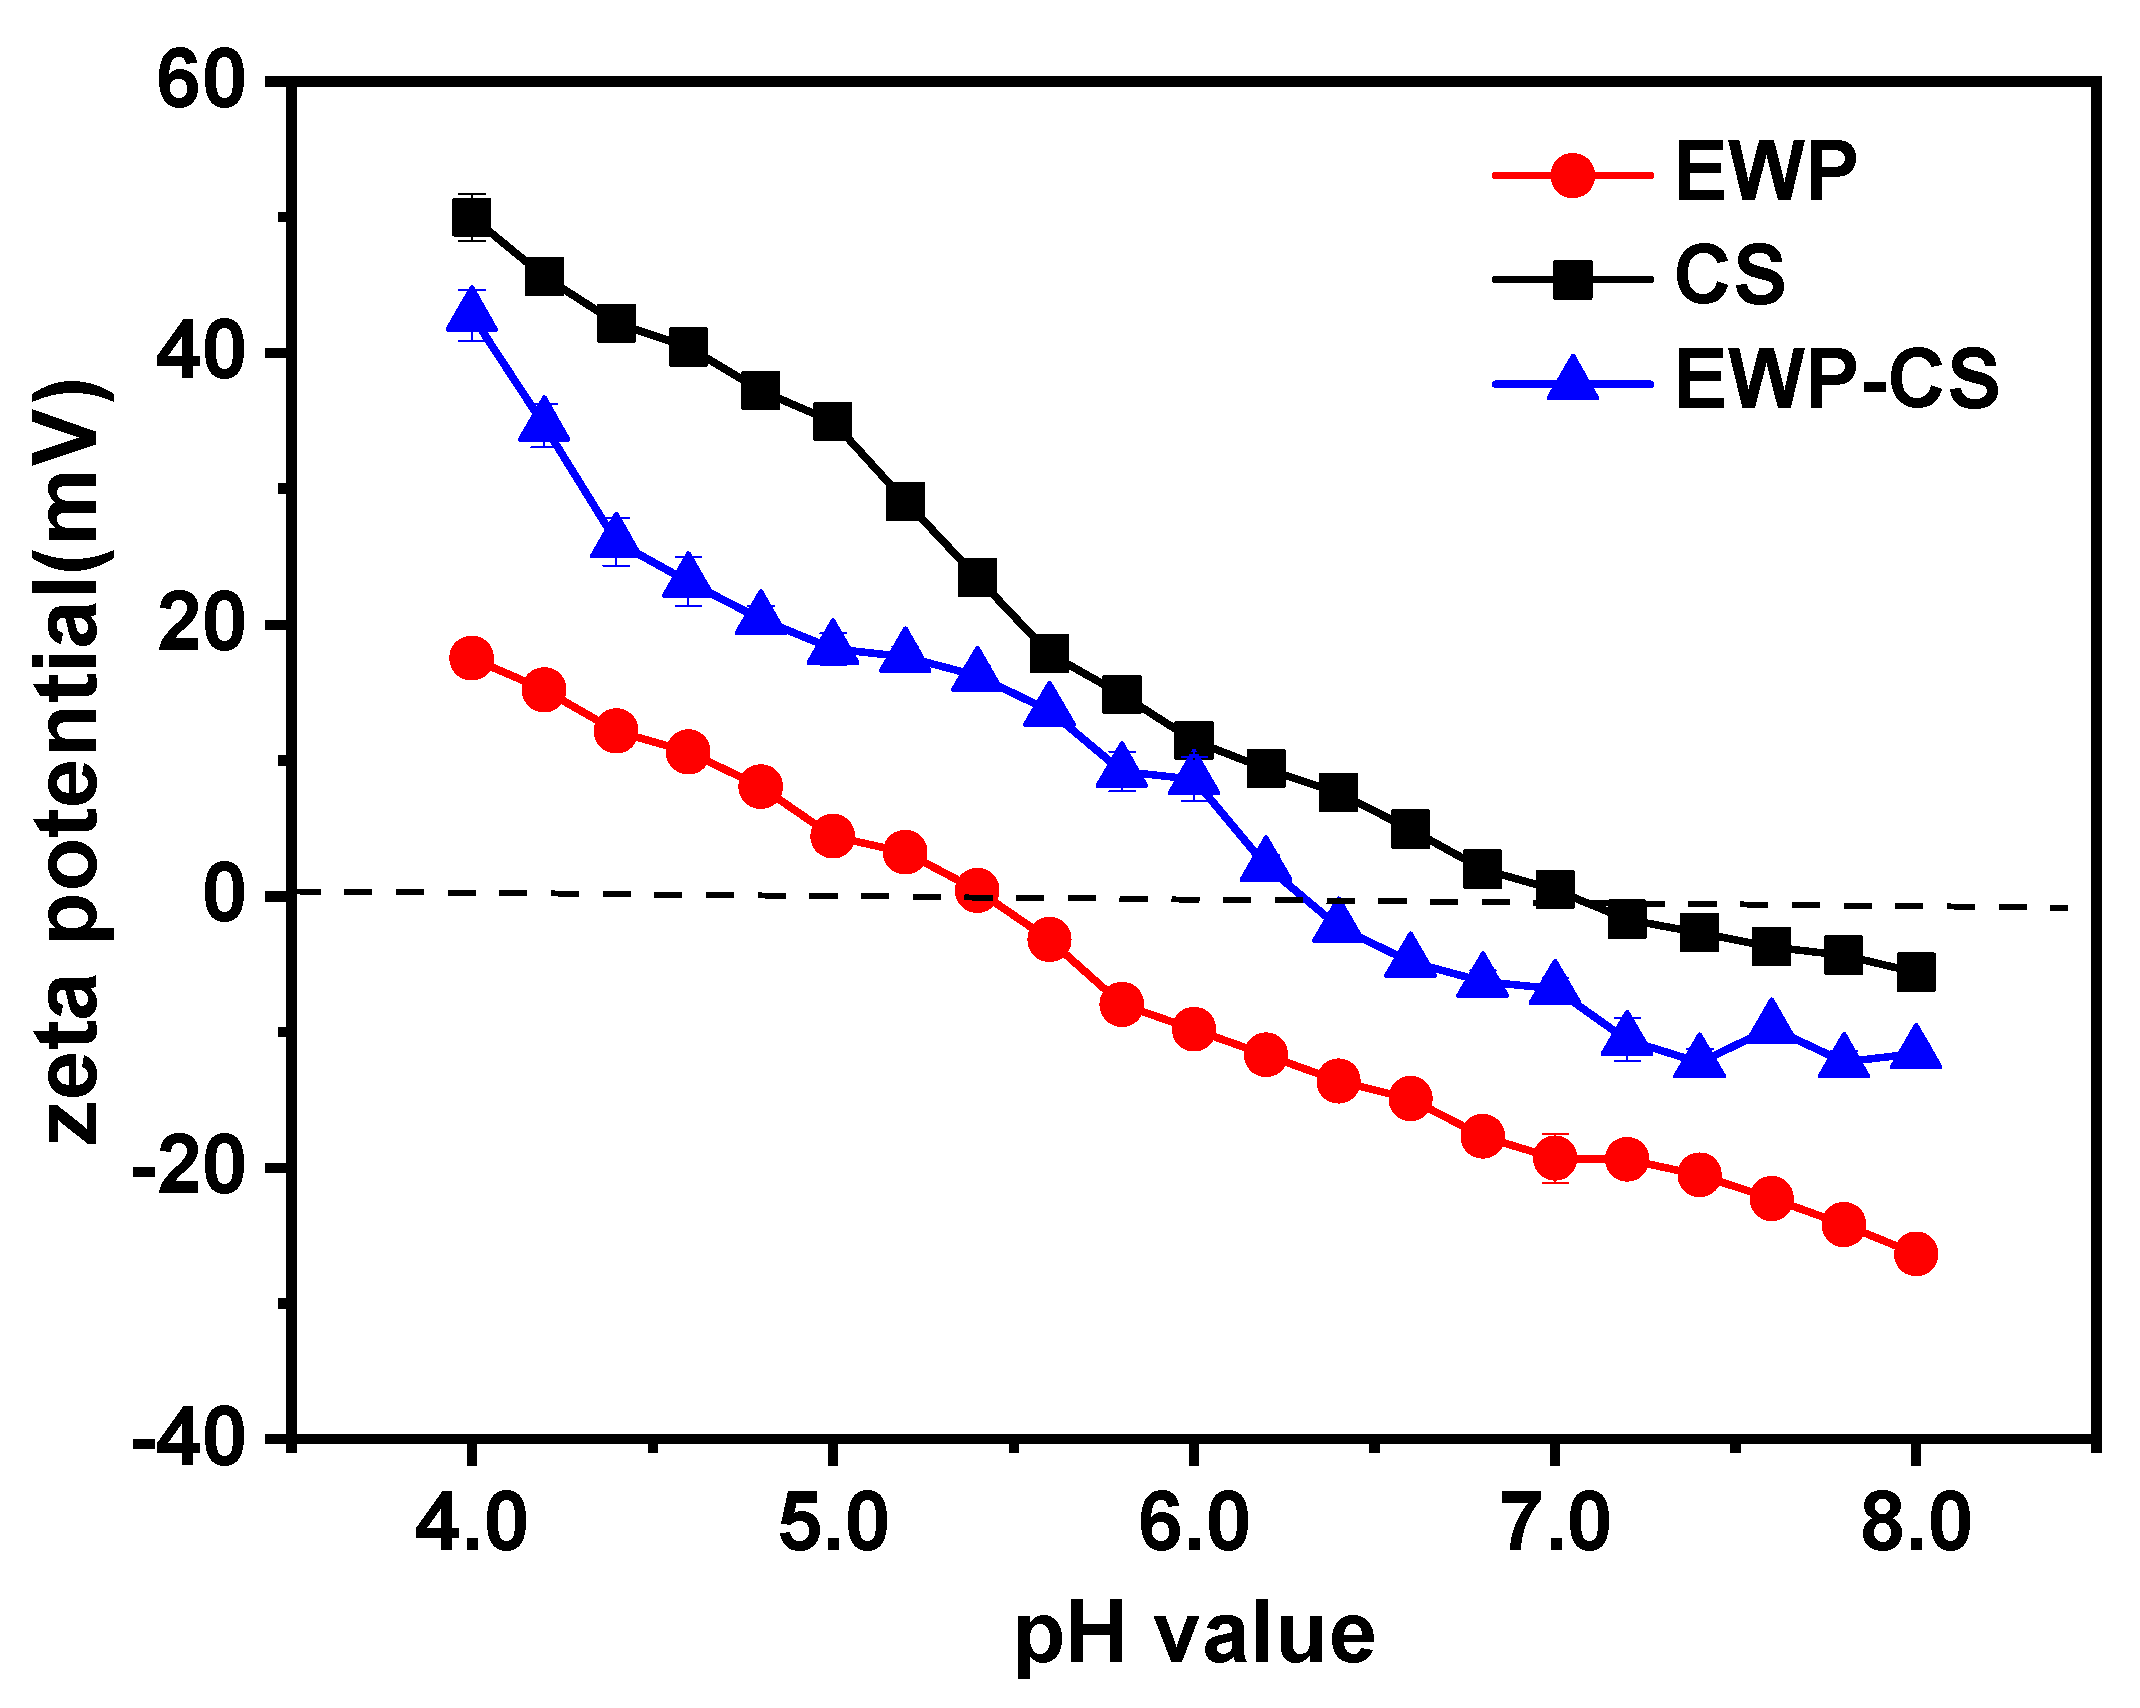
Figure 3.
Turbidity curves for the EWP, CS, and mixed EWP-CS systems in relation to pH (12:1, 0 mM NaCl, and 0.05% total biopolymer concentration).
Figure 3.
Turbidity curves for the EWP, CS, and mixed EWP-CS systems in relation to pH (12:1, 0 mM NaCl, and 0.05% total biopolymer concentration).
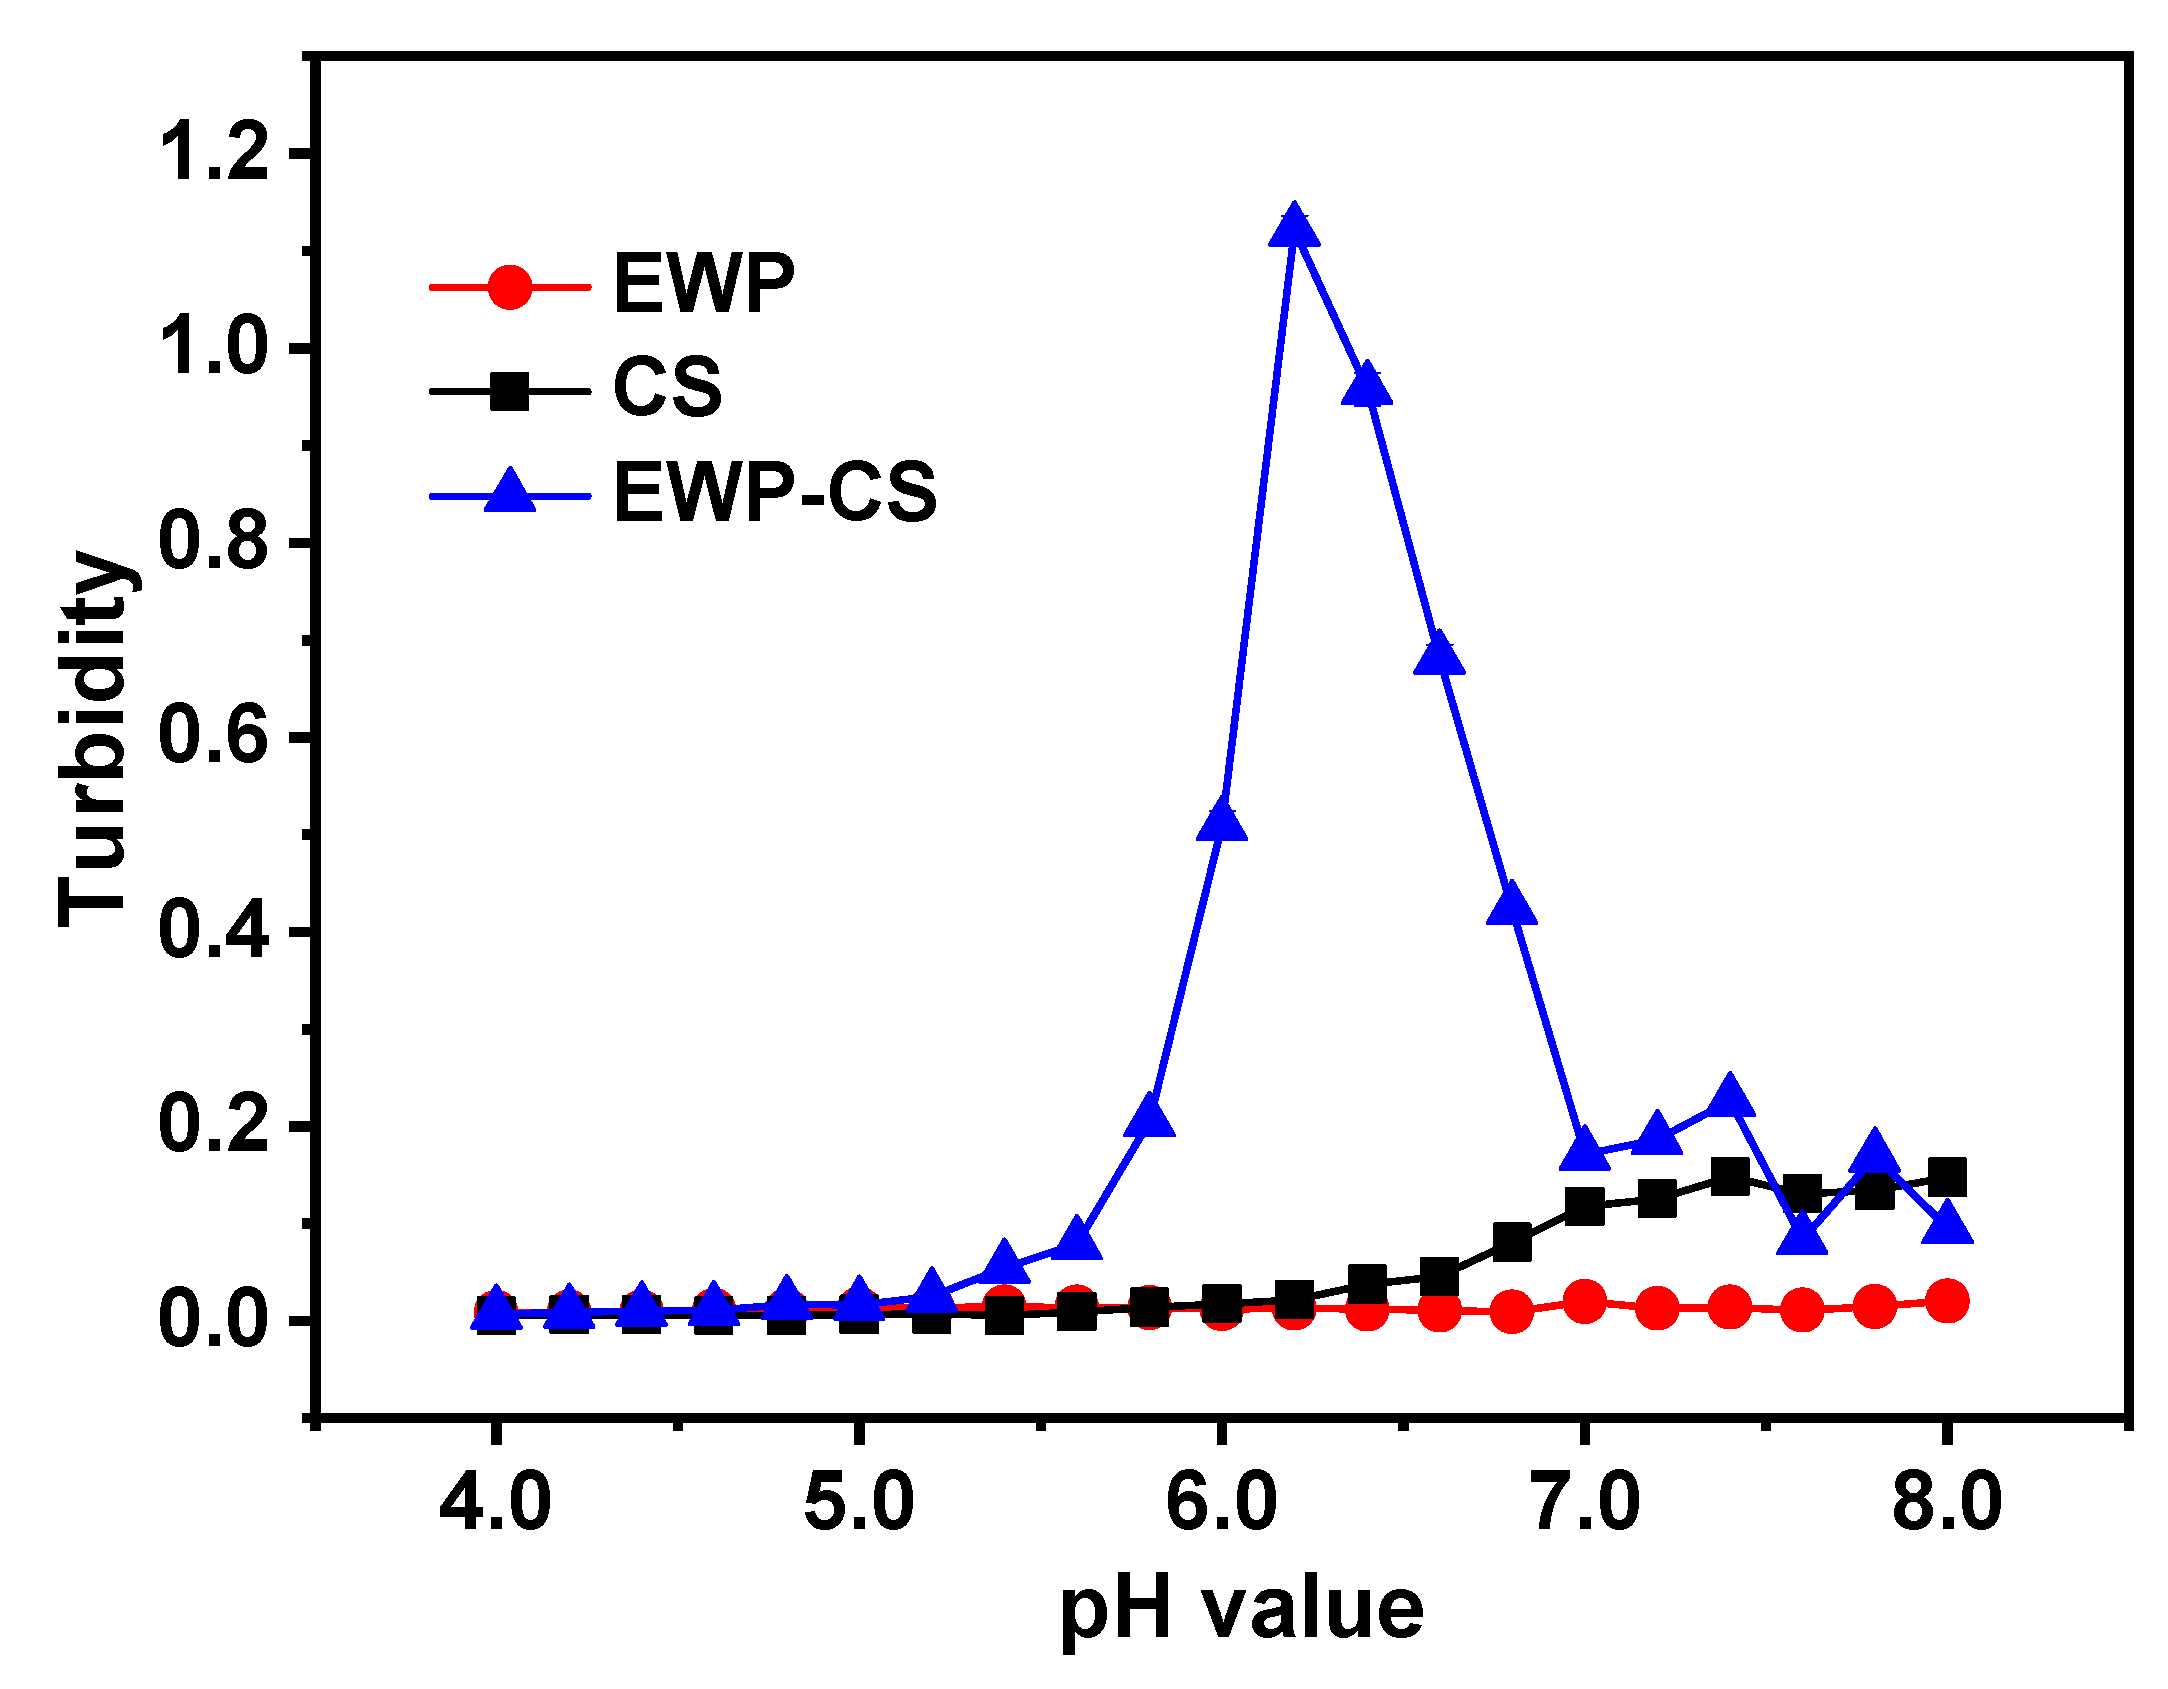
Figure 4.
Turbidity curves (a) and state diagram (b) of EWP-CS mixtures (different biopolymer mixing ratio, 0 mM NaCl and total biopolymer concentration 0.05%) in relation to pH (The solubility/insolubility was evaluated by visual observation: □) transparent; △) translucent; ▲) turbid; and ○) phase separation).
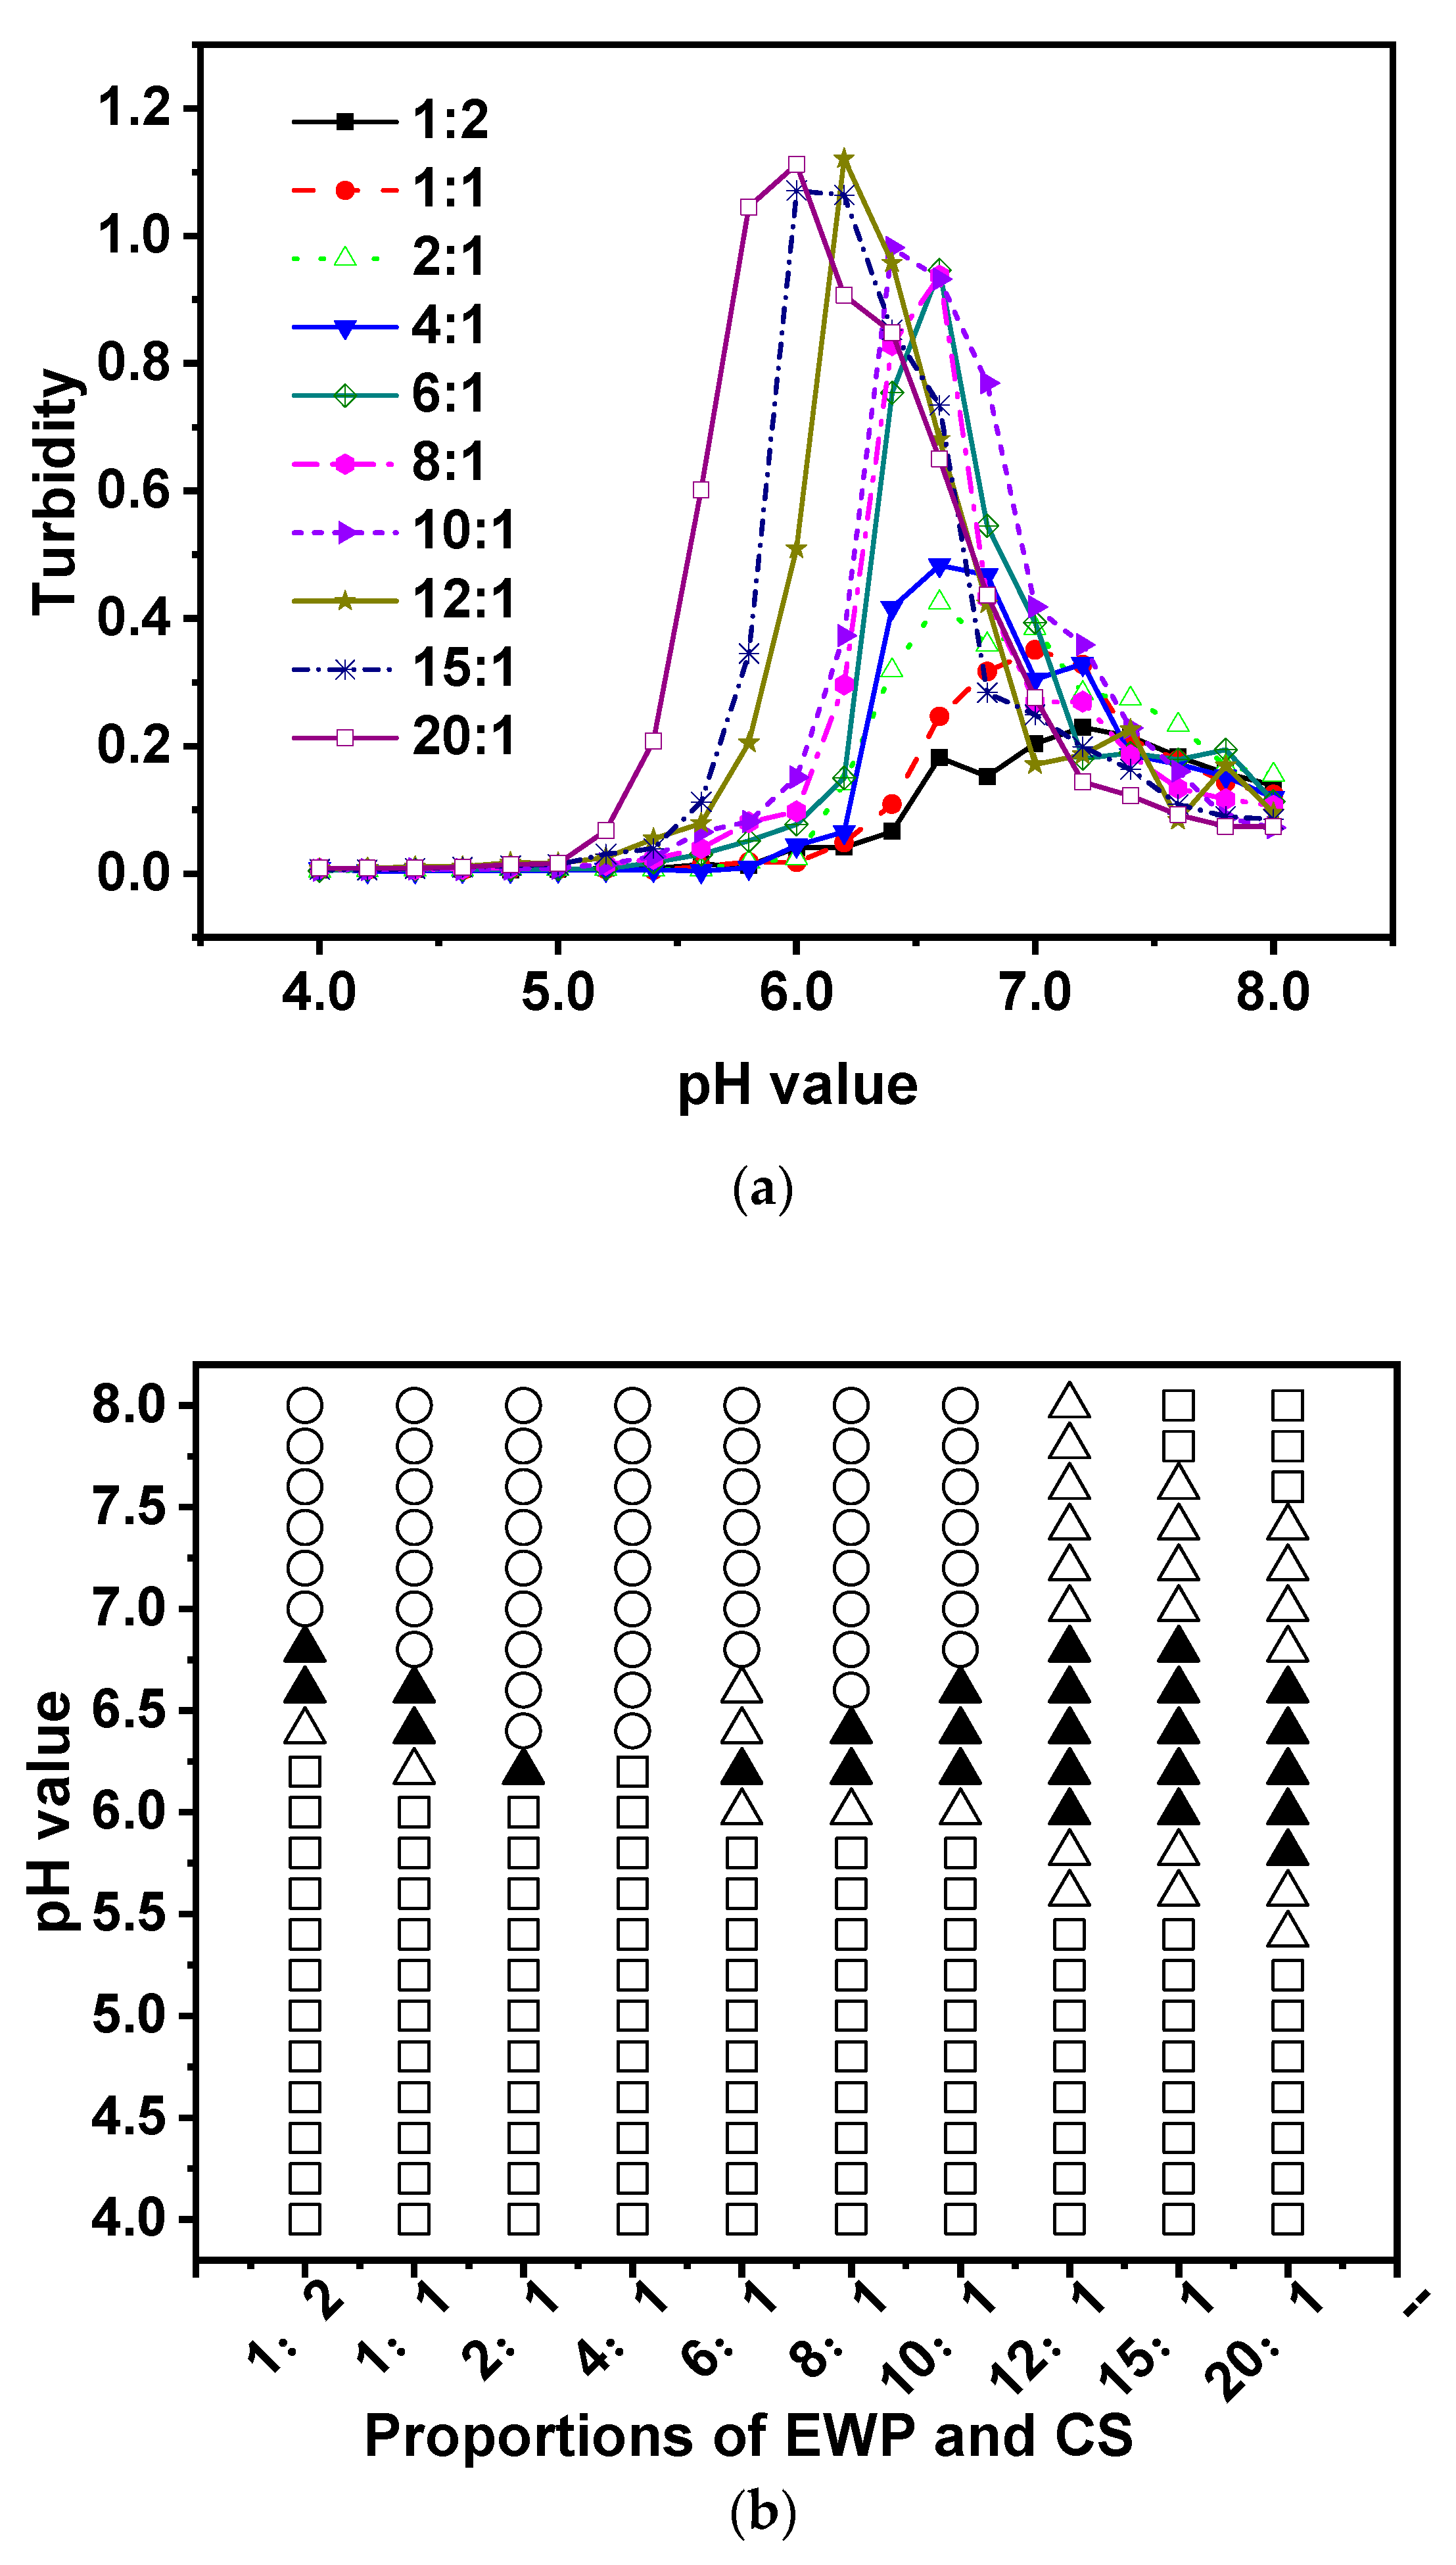
Figure 5.
Turbidity curves (a) and state diagram (b) of EWP-CS mixtures (different total biopolymer concentration, 0 mM NaCl and 12:1 ratio) in relation to pH (The solubility/insolubility was evaluated by visual observation: □) transparent; △) translucent; ▲) turbid; and ○) phase separation).
Figure 5.
Turbidity curves (a) and state diagram (b) of EWP-CS mixtures (different total biopolymer concentration, 0 mM NaCl and 12:1 ratio) in relation to pH (The solubility/insolubility was evaluated by visual observation: □) transparent; △) translucent; ▲) turbid; and ○) phase separation).
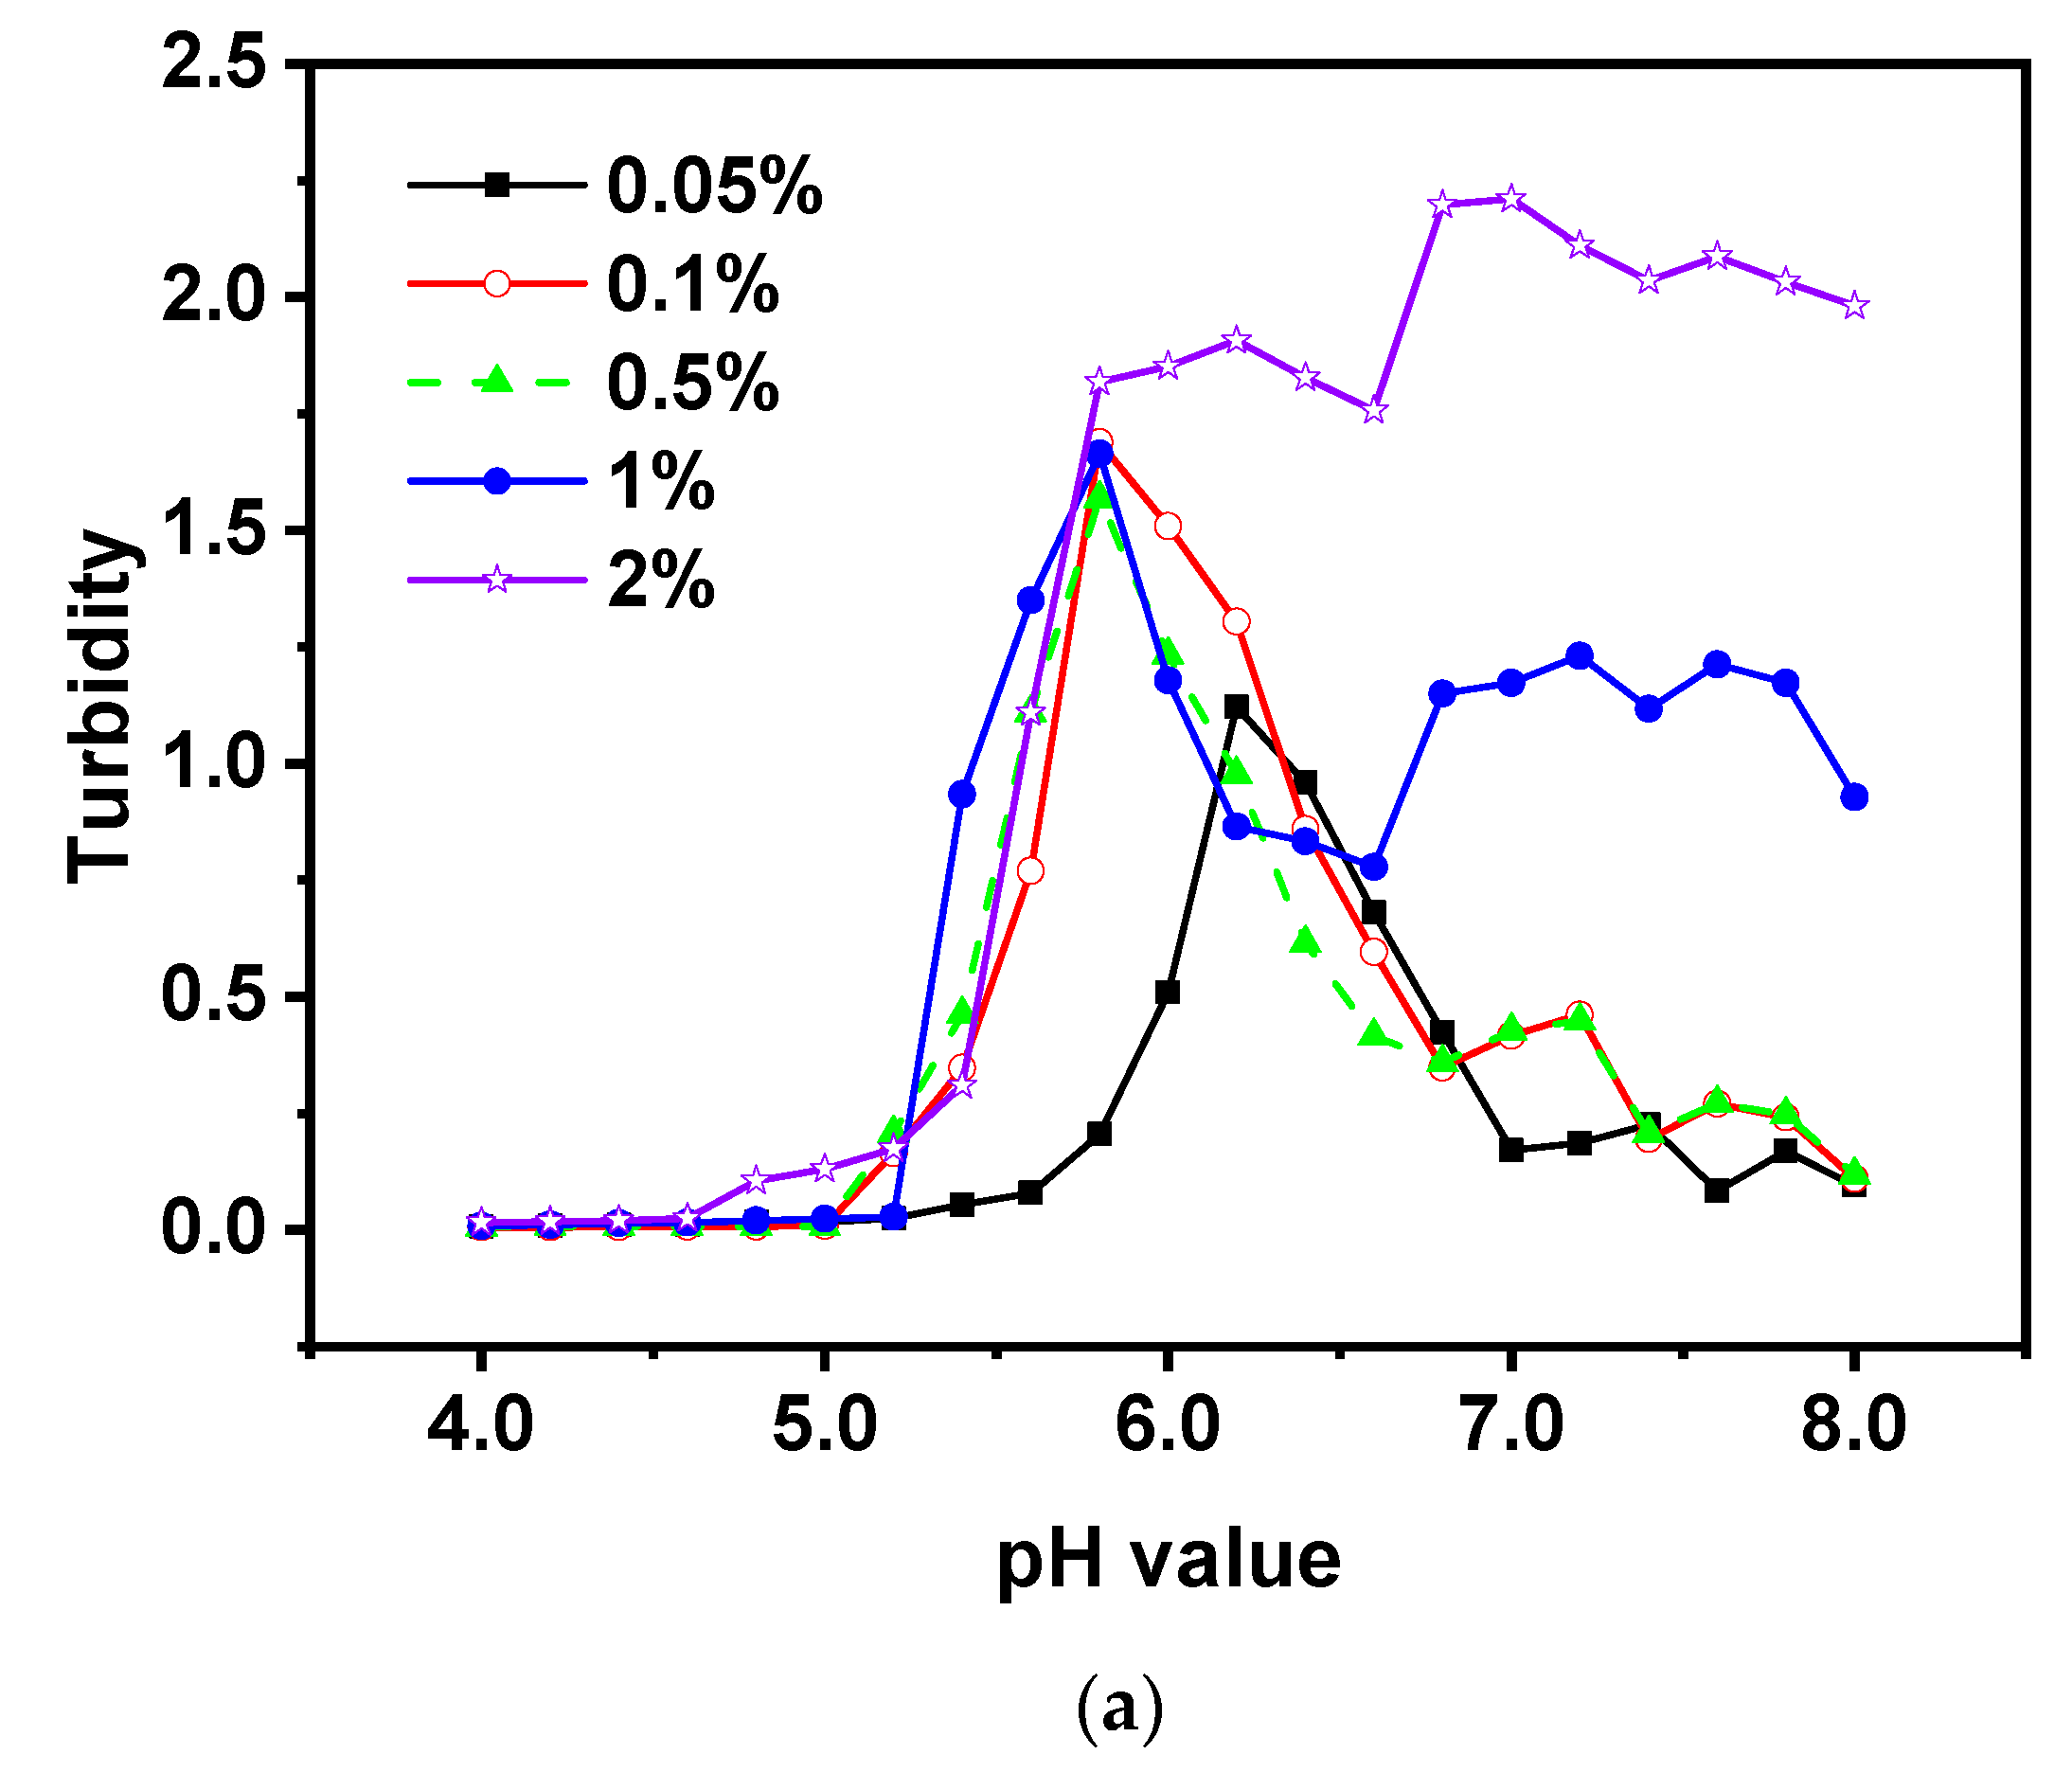
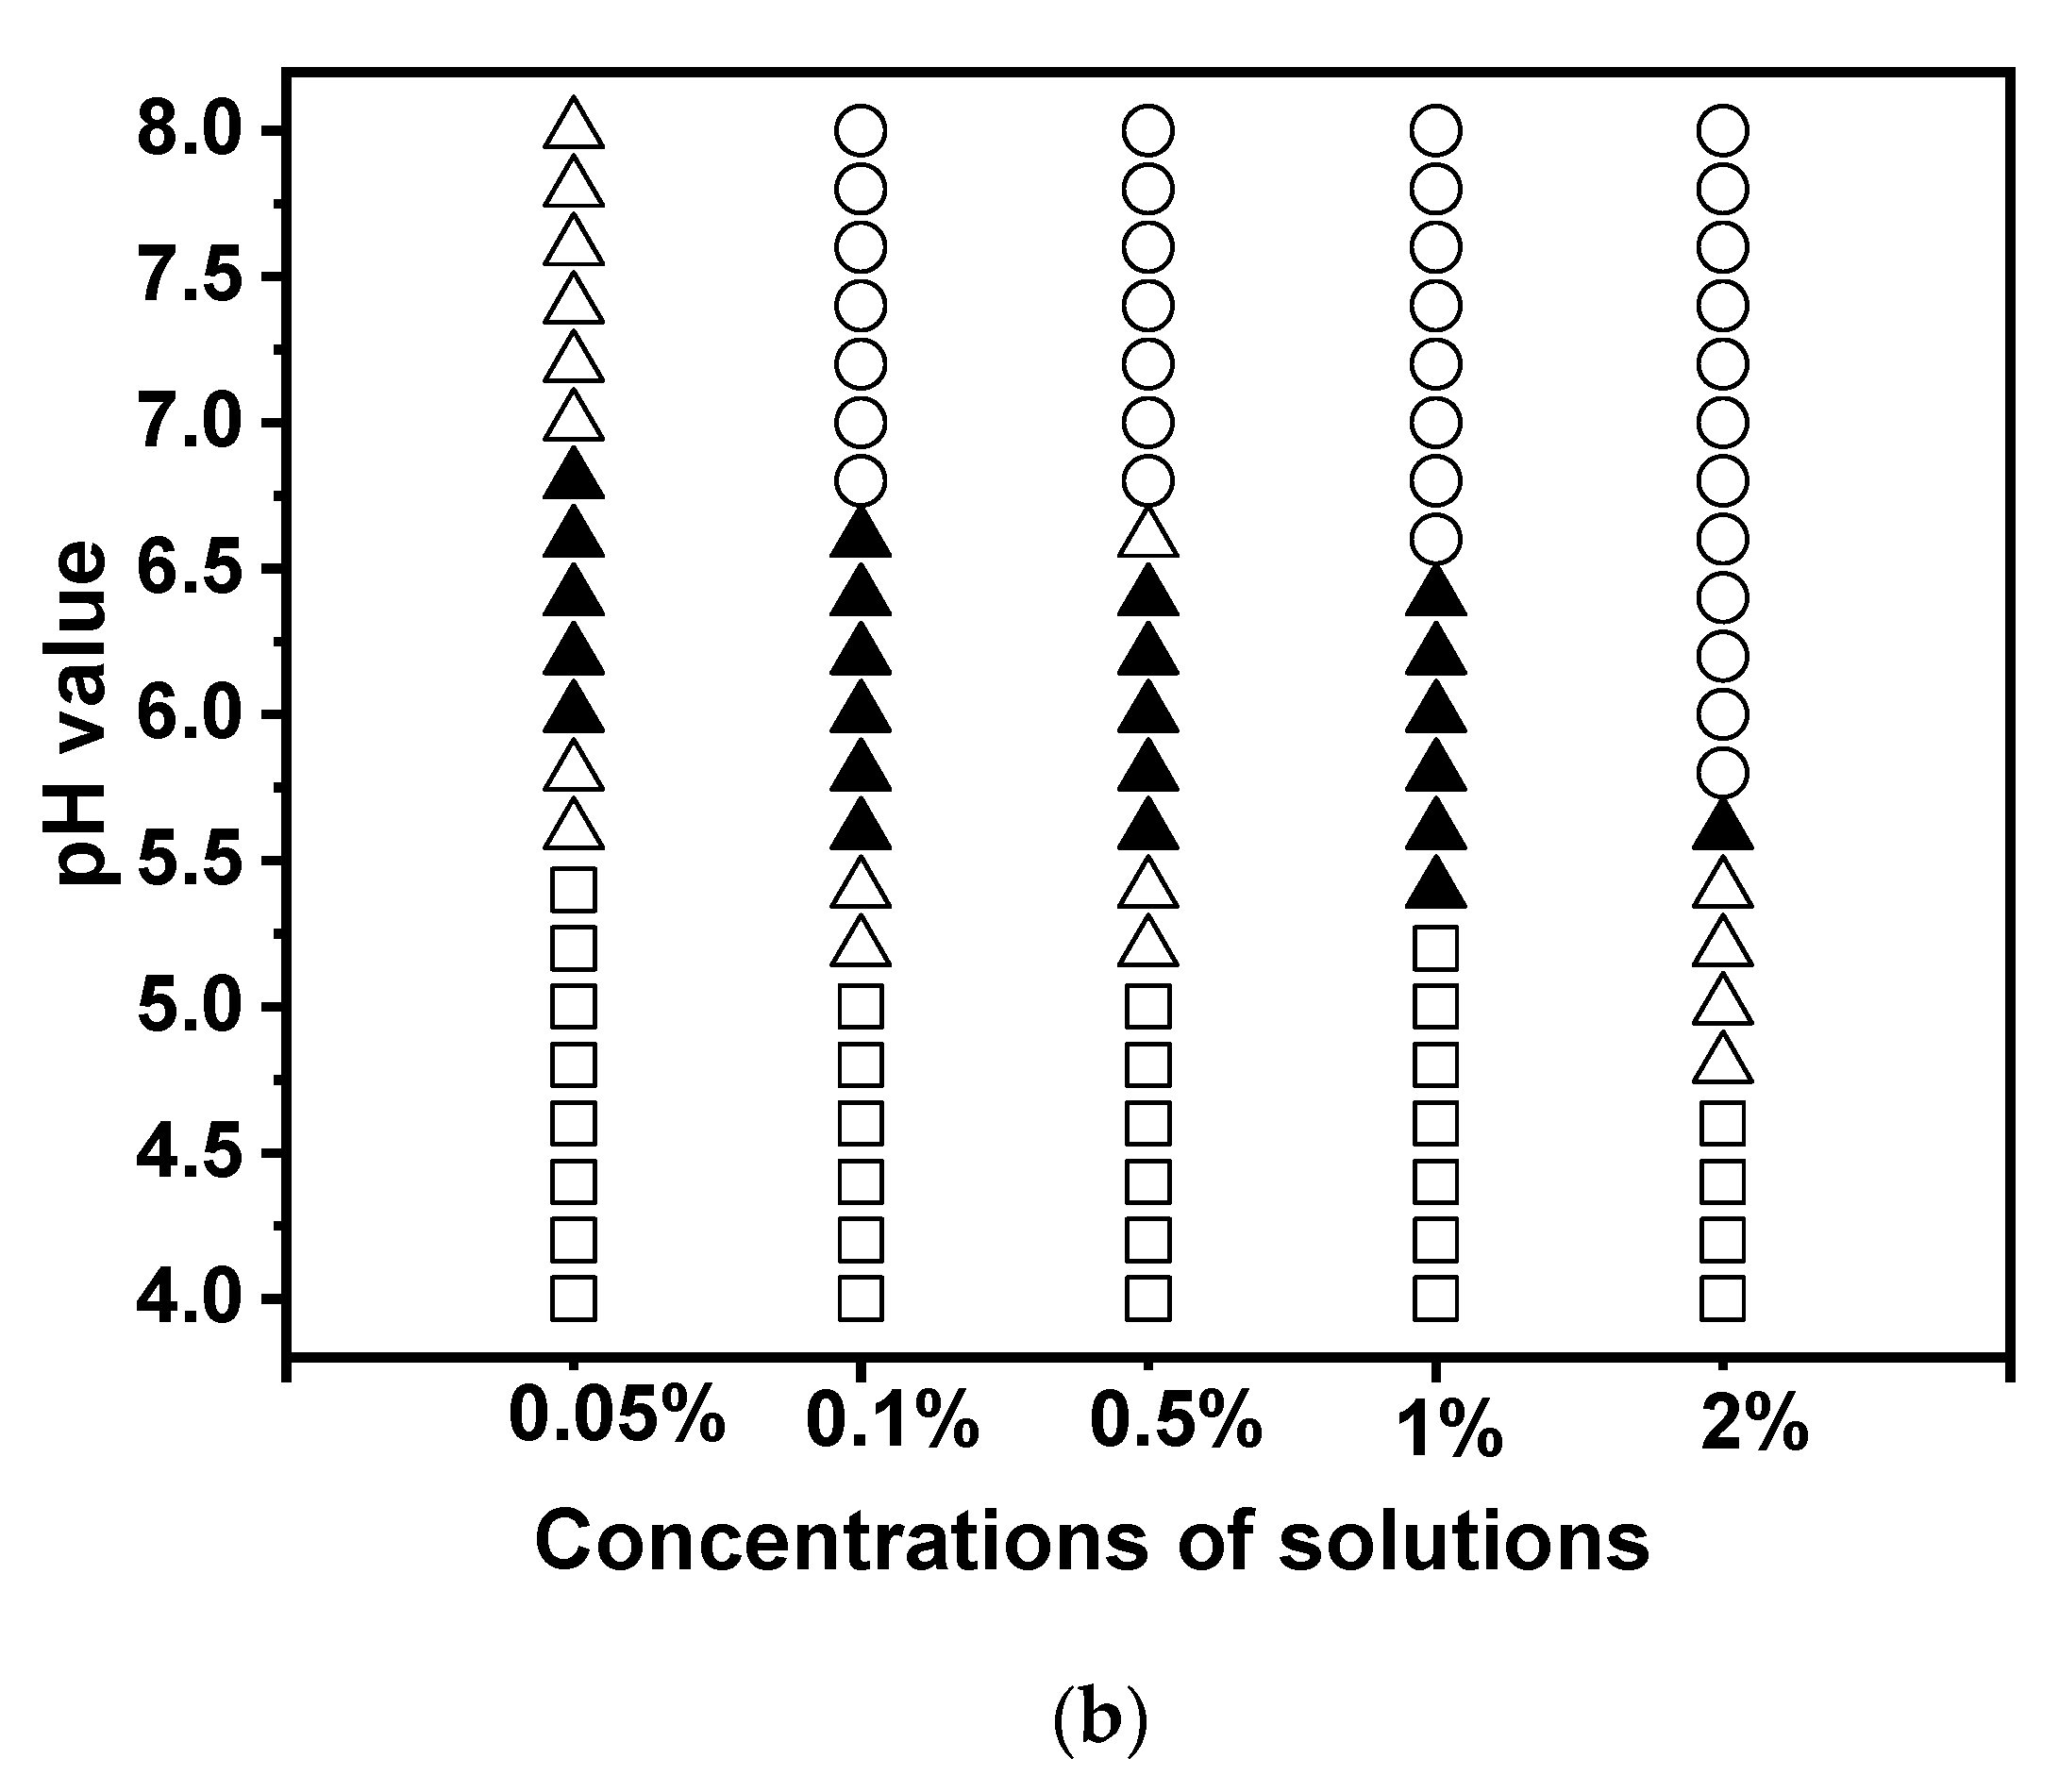
Figure 6.
Turbidity curves (a) and state diagram (b) of EWP-CS mixtures (different temperature, total biopolymer concentration 0.05%, 0 mM NaCl and 12:1 ratio) in relation to pH (The solubility/insolubility was evaluated by visual observation: □) transparent; △) translucent; ▲) turbid; and ○) phase separation).
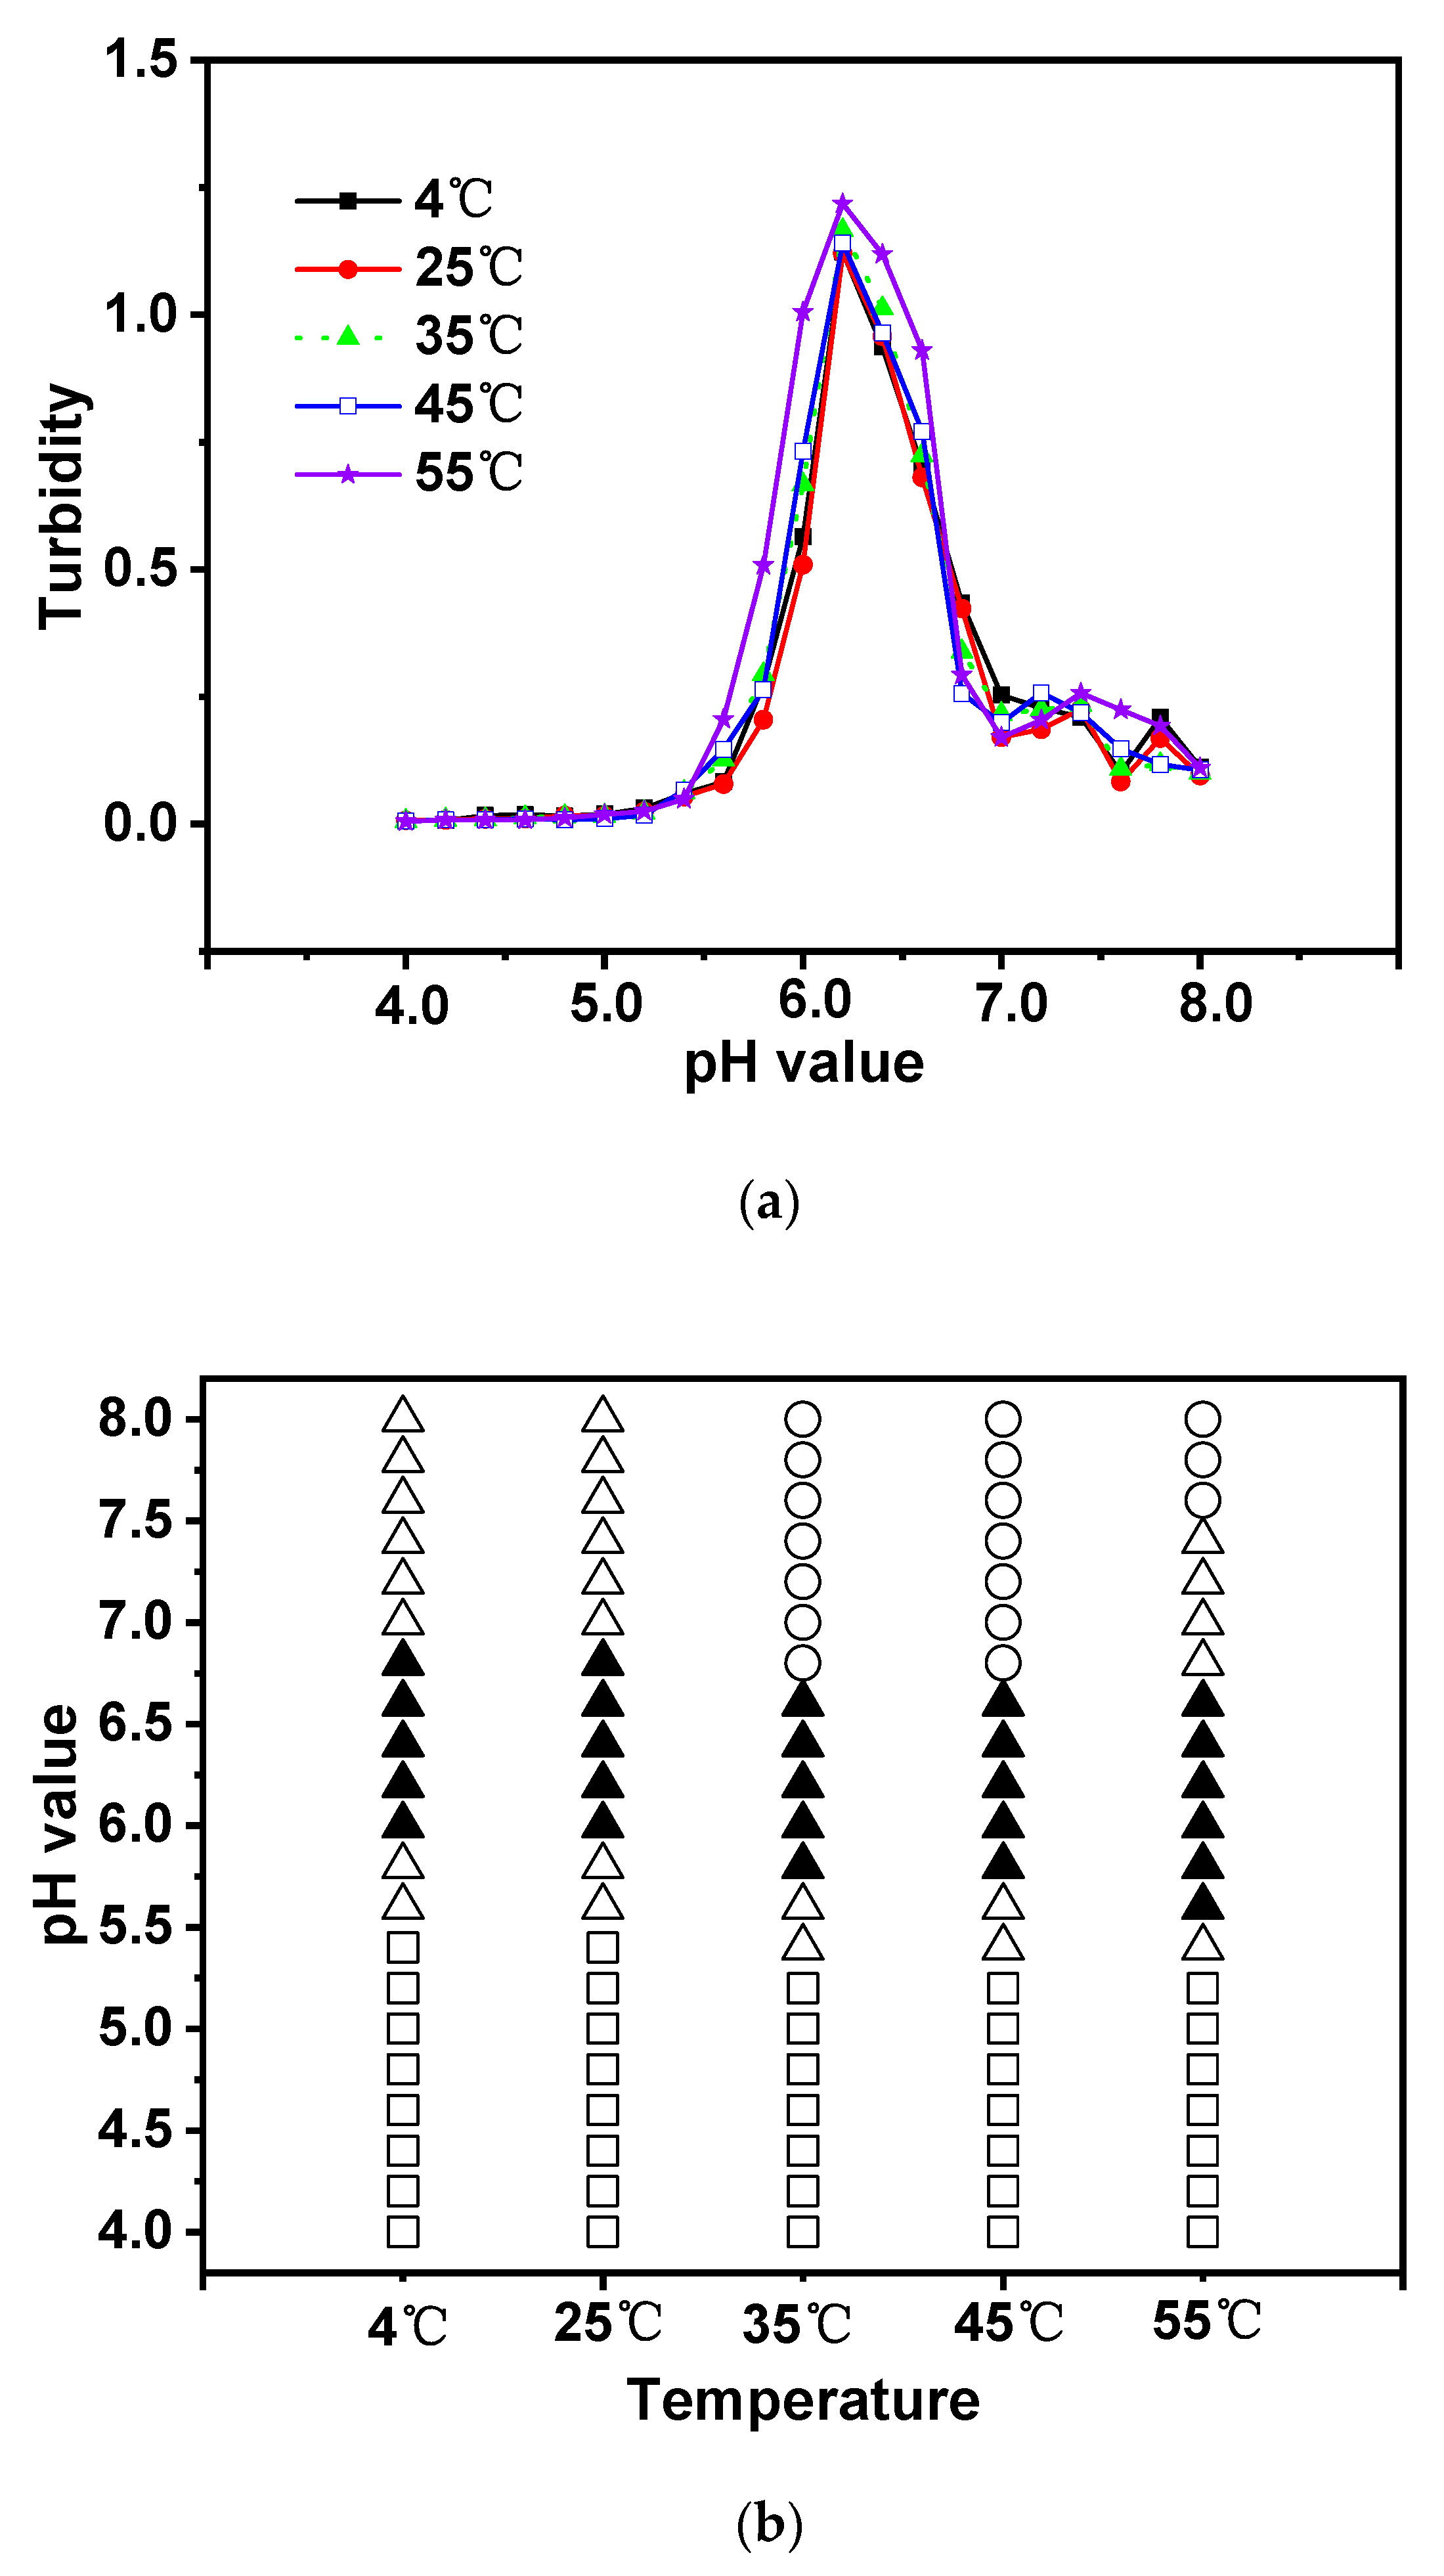
Figure 7.
Turbidity curves (a) and state diagram (b) of EWP-CS mixtures (different NaCl concentration, total biopolymer concentration 0.05%, 12:1 ratio) in relation to pH (The solubility/insolubility was evaluated by visual observation: □) transparent; △) translucent; ▲) turbid; and ○) phase separation).
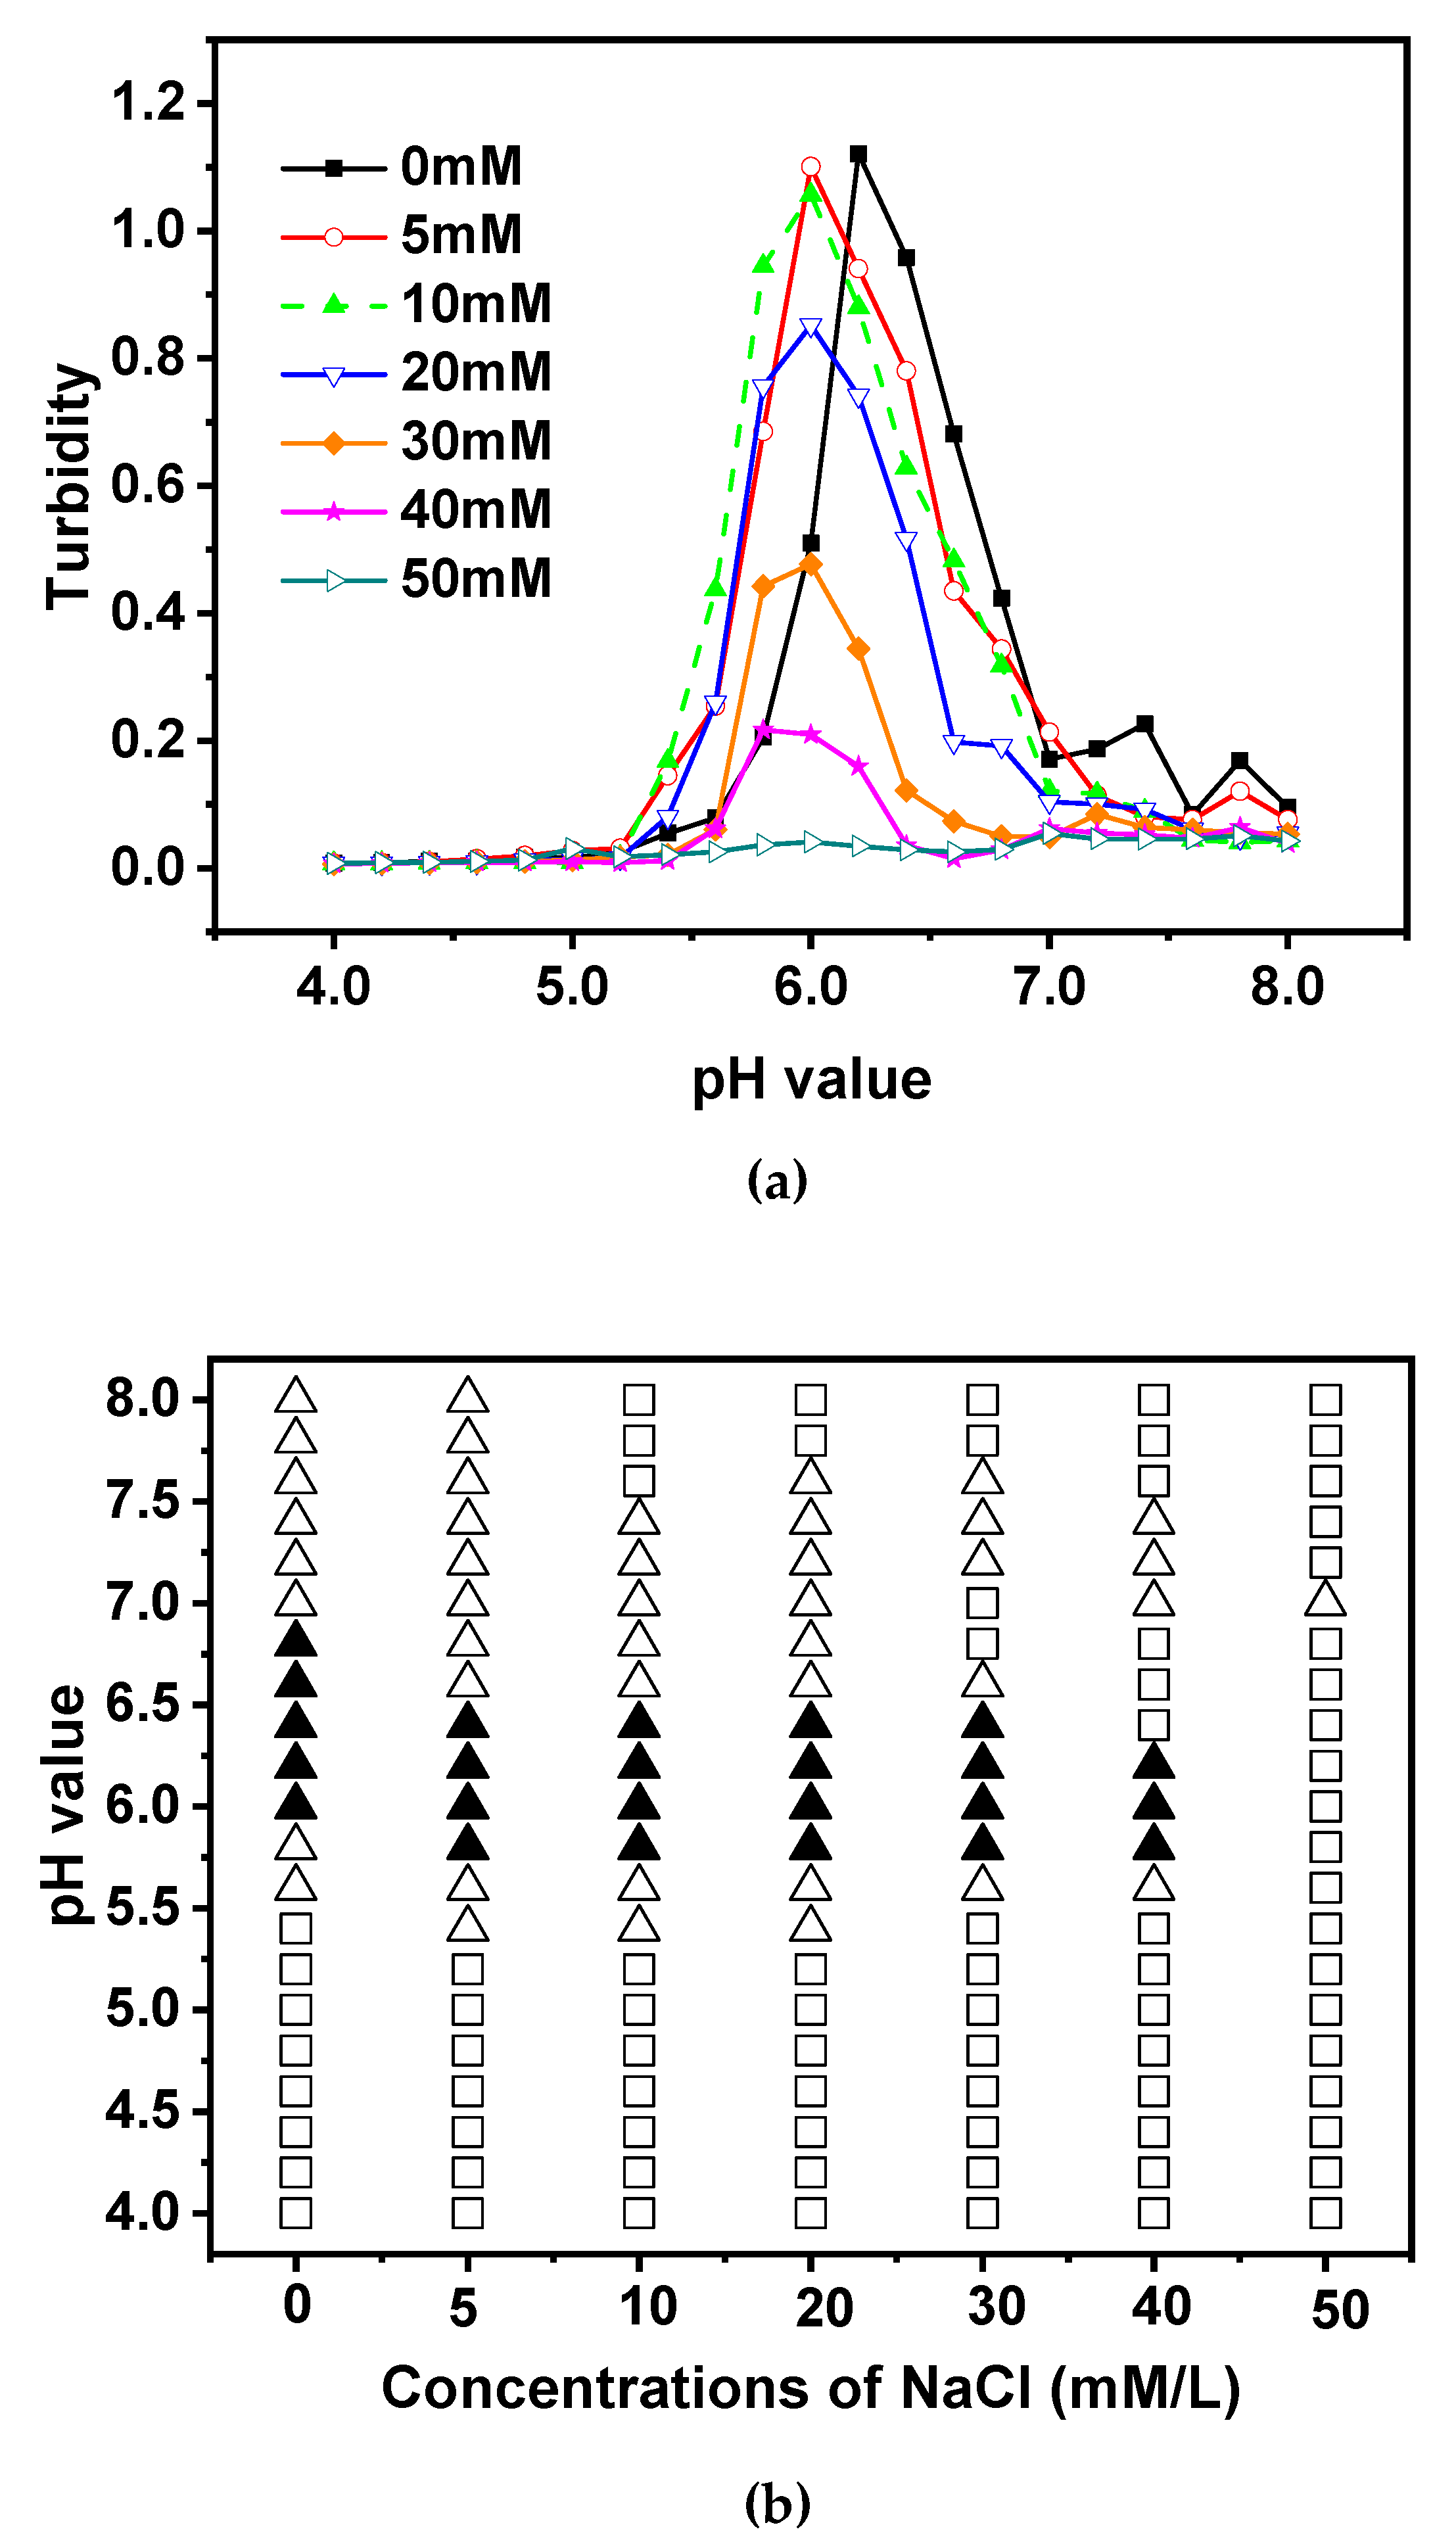

Table 1.
The detail conditions (“√” means stable; “×” means unstable) of different EWP-CS complex solutions at different pH values, temperature, biopolymer mixing ratio, total biopolymer concentration and ionic concentration (12:1 ratio of EWP:CS, 0.05% of the total biopolymer concentration, 0 mM/L NaCl or 25 ℃ was applicable if the condition was not defined).
| pH values | 4.0 | 4.2 | 4.4 | 4.6 | 4.8 | 5.0 | 5.2 | 5.4 | 5.6 | 5.8 | 6.0 | 6.2 | 6.4 | 6.6 | 6.8 | 7.0 | 7.2 | 7.4 | 7.6 | 7.8 | 8.0 | |
| Different conditions | ||||||||||||||||||||||
| EWP:CS | 1:2 | √ | √ | √ | √ | √ | √ | √ | √ | √ | √ | √ | √ | √ | √ | √ | × | × | × | × | × | × |
| 1:1 | √ | √ | √ | √ | √ | √ | √ | √ | √ | √ | √ | √ | √ | √ | × | × | × | × | × | × | × | |
| 2:1 | √ | √ | √ | √ | √ | √ | √ | √ | √ | √ | √ | √ | × | × | × | × | × | × | × | × | × | |
| 4:1 | √ | √ | √ | √ | √ | √ | √ | √ | √ | √ | √ | √ | × | × | × | × | × | × | × | × | × | |
| 6:1 | √ | √ | √ | √ | √ | √ | √ | √ | √ | √ | √ | √ | √ | √ | × | × | × | × | × | × | × | |
| 8:1 | √ | √ | √ | √ | √ | √ | √ | √ | √ | √ | √ | √ | √ | × | × | × | × | × | × | × | × | |
| 10:1 | √ | √ | √ | √ | √ | √ | √ | √ | √ | √ | √ | √ | √ | √ | × | × | × | × | × | × | × | |
| 12:1 | √ | √ | √ | √ | √ | √ | √ | √ | √ | √ | √ | √ | √ | √ | √ | √ | √ | √ | √ | √ | √ | |
| 15:1 | √ | √ | √ | √ | √ | √ | √ | √ | √ | √ | √ | √ | √ | √ | √ | √ | √ | √ | √ | √ | √ | |
| 20:1 | √ | √ | √ | √ | √ | √ | √ | √ | √ | √ | √ | √ | √ | √ | √ | √ | √ | √ | √ | √ | √ | |
| Total biopolymer concentrations(%) | 0.05 | √ | √ | √ | √ | √ | √ | √ | √ | √ | √ | √ | √ | √ | √ | √ | √ | √ | √ | √ | √ | √ |
| 0.1 | √ | √ | √ | √ | √ | √ | √ | √ | √ | √ | √ | √ | √ | √ | × | × | × | × | × | × | × | |
| 0.5 | √ | √ | √ | √ | √ | √ | √ | √ | √ | √ | √ | √ | √ | √ | × | × | × | × | × | × | × | |
| 1 | √ | √ | √ | √ | √ | √ | √ | √ | √ | √ | √ | √ | √ | × | × | × | × | × | × | × | × | |
| 2 | √ | √ | √ | √ | √ | √ | √ | √ | √ | × | × | × | × | × | × | × | × | × | × | × | × | |
| T (℃) | 4 | √ | √ | √ | √ | √ | √ | √ | √ | √ | √ | √ | √ | √ | √ | √ | √ | √ | √ | √ | √ | √ |
| 25 | √ | √ | √ | √ | √ | √ | √ | √ | √ | √ | √ | √ | √ | √ | √ | √ | √ | √ | √ | √ | √ | |
| 35 | √ | √ | √ | √ | √ | √ | √ | √ | √ | √ | √ | √ | √ | √ | × | × | × | × | × | × | × | |
| 45 | √ | √ | √ | √ | √ | √ | √ | √ | √ | √ | √ | √ | √ | √ | × | × | × | × | × | × | × | |
| 55 | √ | √ | √ | √ | √ | √ | √ | √ | √ | √ | √ | √ | √ | √ | √ | √ | √ | √ | × | × | × | |
| NaCl concentration(mM/L) | 0 | √ | √ | √ | √ | √ | √ | √ | √ | √ | √ | √ | √ | √ | √ | √ | √ | √ | √ | √ | √ | √ |
| 5 | √ | √ | √ | √ | √ | √ | √ | √ | √ | √ | √ | √ | √ | √ | √ | √ | √ | √ | √ | √ | √ | |
| 10 | √ | √ | √ | √ | √ | √ | √ | √ | √ | √ | √ | √ | √ | √ | √ | √ | √ | √ | √ | √ | √ | |
| 20 | √ | √ | √ | √ | √ | √ | √ | √ | √ | √ | √ | √ | √ | √ | √ | √ | √ | √ | √ | √ | √ | |
| 30 | √ | √ | √ | √ | √ | √ | √ | √ | √ | √ | √ | √ | √ | √ | √ | √ | √ | √ | √ | √ | √ | |
| 40 | √ | √ | √ | √ | √ | √ | √ | √ | √ | √ | √ | √ | √ | √ | √ | √ | √ | √ | √ | √ | √ | |
| 50 | √ | √ | √ | √ | √ | √ | √ | √ | √ | √ | √ | √ | √ | √ | √ | √ | √ | √ | √ | √ | √ |
Disclaimer/Publisher’s Note: The statements, opinions and data contained in all publications are solely those of the individual author(s) and contributor(s) and not of MDPI and/or the editor(s). MDPI and/or the editor(s) disclaim responsibility for any injury to people or property resulting from any ideas, methods, instructions or products referred to in the content. |
© 2023 by the authors. Licensee MDPI, Basel, Switzerland. This article is an open access article distributed under the terms and conditions of the Creative Commons Attribution (CC BY) license (http://creativecommons.org/licenses/by/4.0/).
Copyright: This open access article is published under a Creative Commons CC BY 4.0 license, which permit the free download, distribution, and reuse, provided that the author and preprint are cited in any reuse.


