Submitted:
12 May 2023
Posted:
15 May 2023
You are already at the latest version
Abstract
Different toll collection types of vehicles and different distribution of tollbooths lead to the toll plaza diverging area becoming a typical vehicle weaving area with frequent crossing behaviors and conflicts on highways. This study aims to identify contributing factors to conflict risks of four vehicle-following patterns in a toll plaza diverging area by developing random parameters ordered logit models with heterogeneity in means and variances. The model can flexibly capture the unobserved heterogeneity of the contributing factors in different vehicle-following patterns. Real-world vehicle trajectory data obtained from the toll plaza diverging area in Nanjing, China, are used for model estimation. The results show that vehicle-following patterns with the same toll collection types have higher percentage of severe conflict risks. The average acceleration of the following vehicles, lane marking indicator, the initial lanes and lane-changes of vehicles are significantly associated with the collision risk levels. The standard deviation of surrogate safety measures of all vehicles in sub-segments are found differ significantly between vehicle-following patterns. Furthermore, a series of likelihood ratio tests are adopted to test the spatial dependence in sub-segments of the diverging area. The findings of this study could provide valuable information for safety improvement in toll plazas.
Keywords:
collision risk
; trajectory data
; toll plaza diverging area
; random parameters ordered logit model
1. Introduction
Toll roads provide the great convenience in the road transportation system. Since the toll collection mainly relies on the toll plazas, they are a crucial component of toll roads. By the end of 2021, the quantity of toll plazas in China has increased to 972 [1]. Since the electronic payments has not been fully popularized yet, the majority of toll plazas in China is traditional mainline toll plaza (TMTP), which are consisted of both electronic toll collection (ETC) and manual toll collection (MTC) methods.
In TMTP, drivers using electronic payment can pass through the ETC lanes at low speeds (20 km/h in China), but those paying with cash must stop at MTC lanes to finish the payment. Previous research has shown that there is a considerable speed differential between ETC and MTC vehicles in the diverging area of toll plazas [2]. However, vehicles with different toll collection types are not restricted by lane markings or separation facilities in the diverging area of TMTP. Vehicles need to complete the diversion and select their matching toll collection lanes within a limited distance. Complex distribution of toll collection lanes and different speed limitation of ETC and MTC vehicles result in diverging area becoming a hot spot of frequent crossing behaviors and rapid decelerations [3,4,5,6]. These aggressive driving behaviors caused a large number of conflicts [2,7]. There is an urgent need to explore the conflict mechanism in the diverging area of toll plazas so the corresponding effective policy can be developed.
Modeling the relationship between traffic conflict risk and contributing factors can help us understand how these factors cause conflict risks [8,9,10]. Numerous robust econometric models have been employed to investigate the possible association between conflict risk and influencing factors. Nevertheless, there may be some unobserved and unmeasured heterogeneity variables that make the existing factors less effective in explaining the observed results [11,12]. Especially on complex road nodes like toll plazas, drivers need to process more information simultaneously than on the road sections, such as choosing a matching toll lane with shorter waiting time. Ignoring such heterogeneity and assuming the effect of a contributing factor across all observations as the same will lead to biased and incorrect parameter estimation [13]. The random parameter approach is applied to solve the problem of unobserved heterogeneity. As one of the random parameter approaches, the heterogeneity in the means and variances of the random parameters has been used to explore the mechanism of crash frequency and severity and obtained remarkable results [14,15,16,17].
In previous studies, the safety analysis in toll plazas is mainly based on historical crash data [18,19]. However, due to its insufficient quantity, crash data need to be collected for a long time before they can be used for analysis. Meanwhile, since most traffic conflicts have not further developed to crashes, it is not comprehensive to judge the traffic safety status of a region only based on crash data. With the development of information techniques, a growing number of devices are used to record vehicle traveling information, such as GPS, high-definition camera, and unmanned aerial vehicles (UAVs). Vehicles’ high-precision trajectory data is extracted in large quantities and is being utilized more frequently to analyze traffic safety. Potential conflicts captured from trajectory data overcomes the limitation of insufficient quantity and incomplete assessment of historical crash data. This study analyzes the characteristics of conflicts in toll plaza diverging area based on the trajectory data collected by UVA.
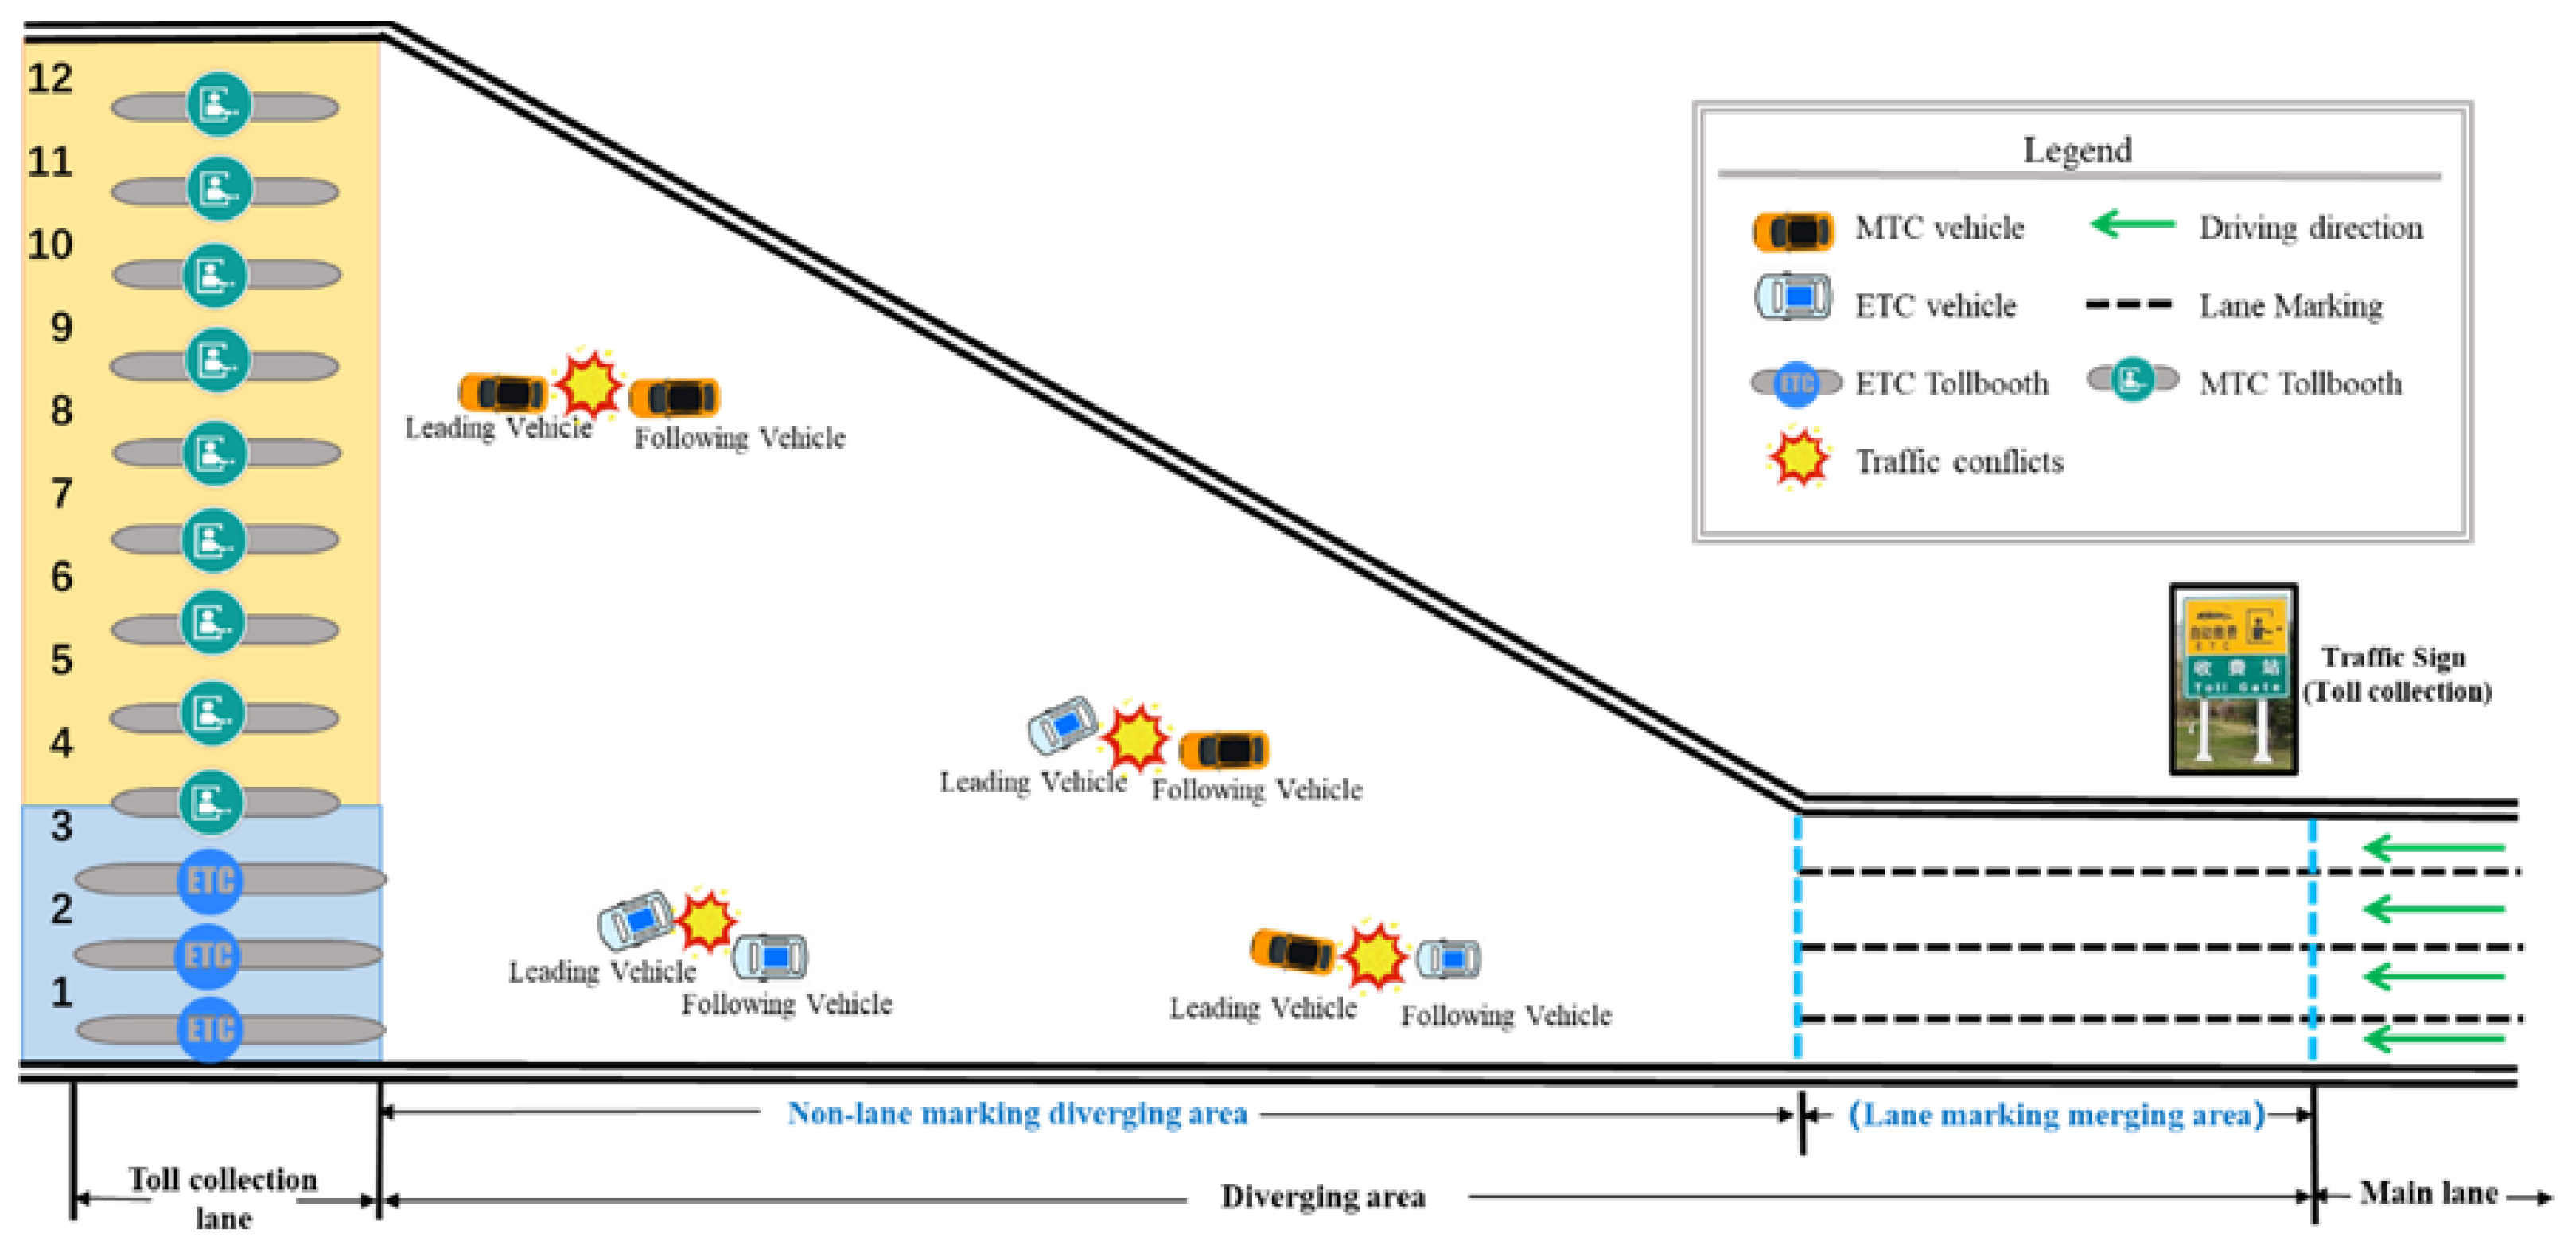
Although several studies have assessed toll plaza conflict risks based on trajectory data [2,5,7], they have not explicitly considered the impact of vehicle-following patterns on conflict risk assessment. Considering that frequent crossing behaviors of vehicles with different payment methods is one of the most important causes of vehicle conflicts in TMTP diverging area, the conflicts between two vehicles are divided into four categories: (1) ETC-ETC, (2) ETC-MTC, (3) MTC-MTC and (4) MTC-ETC, as shown in Figure 1. Each pair of vehicles has a first vehicle that represents the kind of toll collection for the leading vehicle and a second vehicle that represents the type of toll collection for the following vehicle. This study examines the factors influencing conflict risks in the toll plaza diverging area from the perspective of different vehicle-following patterns. The random parameters ordered logit models with heterogeneity are applied by considering the ordered characteristic of conflict risk. This study contributes to prior research from two aspects: (1) conflict risks are examined in the diverging area of toll plazas using trajectory data; and (2) four different ETC and MTC vehicle-following patterns are compared by taking microscopic interactions of driving behaviors into account.
The remainder of the paper is organized as follows. Section 2 review studies about conflict risk modeling. In Section 3 and Section 4, major methodologies and data description are presented, respectively, followed by Likelihood ratio tests in Section 5. The results and discussion are presented in Section 6. The paper ends up with conclusion in Section 7.
Figure 1.
Different collision categories in traditional mainline toll plaza diverging area.
2. Literature Review
2.1. Trajectory Data Used for Conflict Risk Analysis in Toll Plazas
Conflict data can more comprehensively represent the safety status that it gradually replaces historical crash data for traffic safety assessment. Compared to historical crash data, traffic conflict data have four advantages [13,20,21]. First, compared with crash data, conflict data can better evaluate traffic safety from a micro perspective. Second, the quality of vehicle trajectory data is typically better than that of historical crash data, because traffic conflict data may contain more details such as various vehicle-following patterns. Third, traffic conflict data are abundant and inexpensive to acquire in comparison to historical crash data. Finally, many crashes may be not reported due to a variety of non-random factors (such as the willingness to report the crashes to police), leading to selection bias in the reported crashes [22]. Arun et al. [23] pointed out that the use of actual crash data may result in the overrepresentation of risky drivers in crash data, whereas conflict-based measures are much less likely to suffer such potential data problems.
High-resolution trajectory data can be used to capture the movement characteristics of vehicles from a microscopic perspective that has been widely used for microscopic conflict-based analysis. For example, Chen et al. [24] investigated the factors affecting the potential conflict risks during the lane change process and analyzed its unobserved heterogeneity based on the NGSIM trajectory dataset. Based on the HighD trajectory dataset, Hu et al. [25] proposed a real-time evaluation method for vehicle conflicts at a lane level. Li et al. [26] evaluated the transition durations of rear-end collision risks based on real trajectory data. Xing et al. [2] used time-varying mixed logit models to explore the traffic conflict risks in toll plaza diverging area based on the trajectory data collected by UVA. Nevertheless, the contributing factors to vehicle conflict risk in complex road nodes have not been fully explored from the perspective of different vehicle-following patterns.
2.2. Studies Accounting for Heterogeneity
As determined by Mannering et al. [27], heterogeneous impacts may permeate all human, vehicle, traffic, and environmental characteristics that influence the possibility of crashes. While traffic conflicts and crashes share the similar failure mechanism in the driving process, modeling traffic conflicts remains to be a formidable challenge, especially under the complex traffic conditions.
Traffic conflicts data may offer more specific factors associated with conflict risks than conventional traffic crash data. However, there are still a great number of unobserved variables. Ignoring such unobserved heterogeneity may result in misjudgment on the severity of traffic conflicts, mis-specified traffic conflicts models, biased and inefficient model parameter estimations, and ultimately erroneous inferences [21,27]. In recent years, therefore, the random parameters approach with heterogeneity in means and variances has dominated many econometric methods [15,17]. For instance, Yan et al. [19] utilized a random parameters logit model with heterogeneity in means and variances to investigate the contributing factors that affect the injury severity involving driver’s gender. Alnawmasi and Mannering [28] investigated the factors affecting motorcyclist injury severities by employing a random parameters multinomial logit model. Such method has been confirmed to improve the effect of parameter estimations compared to other random parameter models, but only few studies have focused on conflict risk of vehicle-following groups conflict and their contributing factors [13,24]. To address the research gaps, the current study utilizes a random parameter ordered logit model with heterogeneity in means and variances to explore conflict risks of different vehicle-following patterns in the toll plaza diverging area, aiming to reveal the interaction mechanism between various ETC and MTC vehicle-following patterns.
3. Methodology
3.1. Surrogate Safety Measure
Among all traffic conflict indicators, the time-to-collision (TTC) has been commonly used to estimate individual vehicle collision risk [29,30,31]. Hayward [32] defined TTC as “the time that remains until a collision between two vehicles would have occurred if the collision course and speed difference are maintained”. It could both identify the safety conditions and assess the severity of vehicle conflicts [33].
The TTC of vehicle at time step with a leading vehicle can be expressed as:
where denotes the vehicle position at time , is the vehicle speed at time , and is the length of vehicle . According to the definition in Equation (1), the larger the TTC is, the more time drivers could use to avoid a crash and thus safer [34,35].
However, in most studies, the calculation of conventional TTC assumes that the two vehicles are in the same lane [36,37,38]. This assumption would result in errors in the vehicle collision risk calculation when two vehicles approach to each other at other angles. To overcome this limitation, the extended TTC (ETTC) is applied for evaluating the vehicles’ collision risk in the diverging area. The ETTC can capture the two-dimensional conflict which is more available for traffic areas without lane markings [10,39]. The ETTC can be expressed as follows:
where and are the length of vehicle and , respectively; is the distance between two vehicles’ centroids; is the distance between two closest points of vehicles; and are two-dimensional coordinates and speed vectors of vehicle’s centroid, as shown in Figure 2. More detailed information about ETTC can be referred in our previous studies [7,10].
3.2. The Random Parameter Ordered logit (RPOL) Model
As mentioned above, the random parameters ordered logit models with heterogeneity in means and variances are widely applied to explore the accident mechanism as it can flexibly capture the unobserved heterogeneity. Thus, the model is employed in this study to investigate factors contributing to conflict risks. The typical form of the utility function is defined as follows:
where is the function determining the probability of conflict severity in sample , represents a vector of the estimated parameters, is the vector of explanatory variables affecting conflict-severity . is a stochastic error term accounting for unobserved effects and assumed to follow the generalized extreme value distribution yielding a standard multinomial logit model:
where denotes the probability of risk level in sample , is the density function of vector and is the predefined parameter vectors of the density function. is a vector of estimable parameters to capture the heterogeneity in the mean and variance, which is defined as:
where represents the mean parameters, is the estimable parameters, is the vector of collision-specific variables with the heterogeneity in the mean, is another vector of explanatory variables that explain the standard heterogeneity in the standard deviation , with the corresponding parameter vector , and is an error term.
The potential conflict risk propensity function for vehicle-following pair is determined by Equation (6):
where in Equation (7) denotes the most severe, medium, and lowest collision risk level, respectively. and are the estimated thresholds.
The probability of vehicle group to be collision risk level is shown in Equation (8):
where denotes the standard normal cumulative distribution function, y = 0 indicates the lowest conflict level, y = 1 indicates the medium conflict risk level, and y = 2 indicates the highest conflict risk level.
The random parameter models are estimated with 500 Halton draws as past research [19,40] have found 500 Halton draws could provide stable parameters. The stepwise process is also conducted for the parameter selection. The Akaike Information Criterion (AIC) and McFadden Pseudo R-squared are used to evaluate the performances of the fitted models [41], which are formulated as:
4. Data Description
4.1. Data Collection
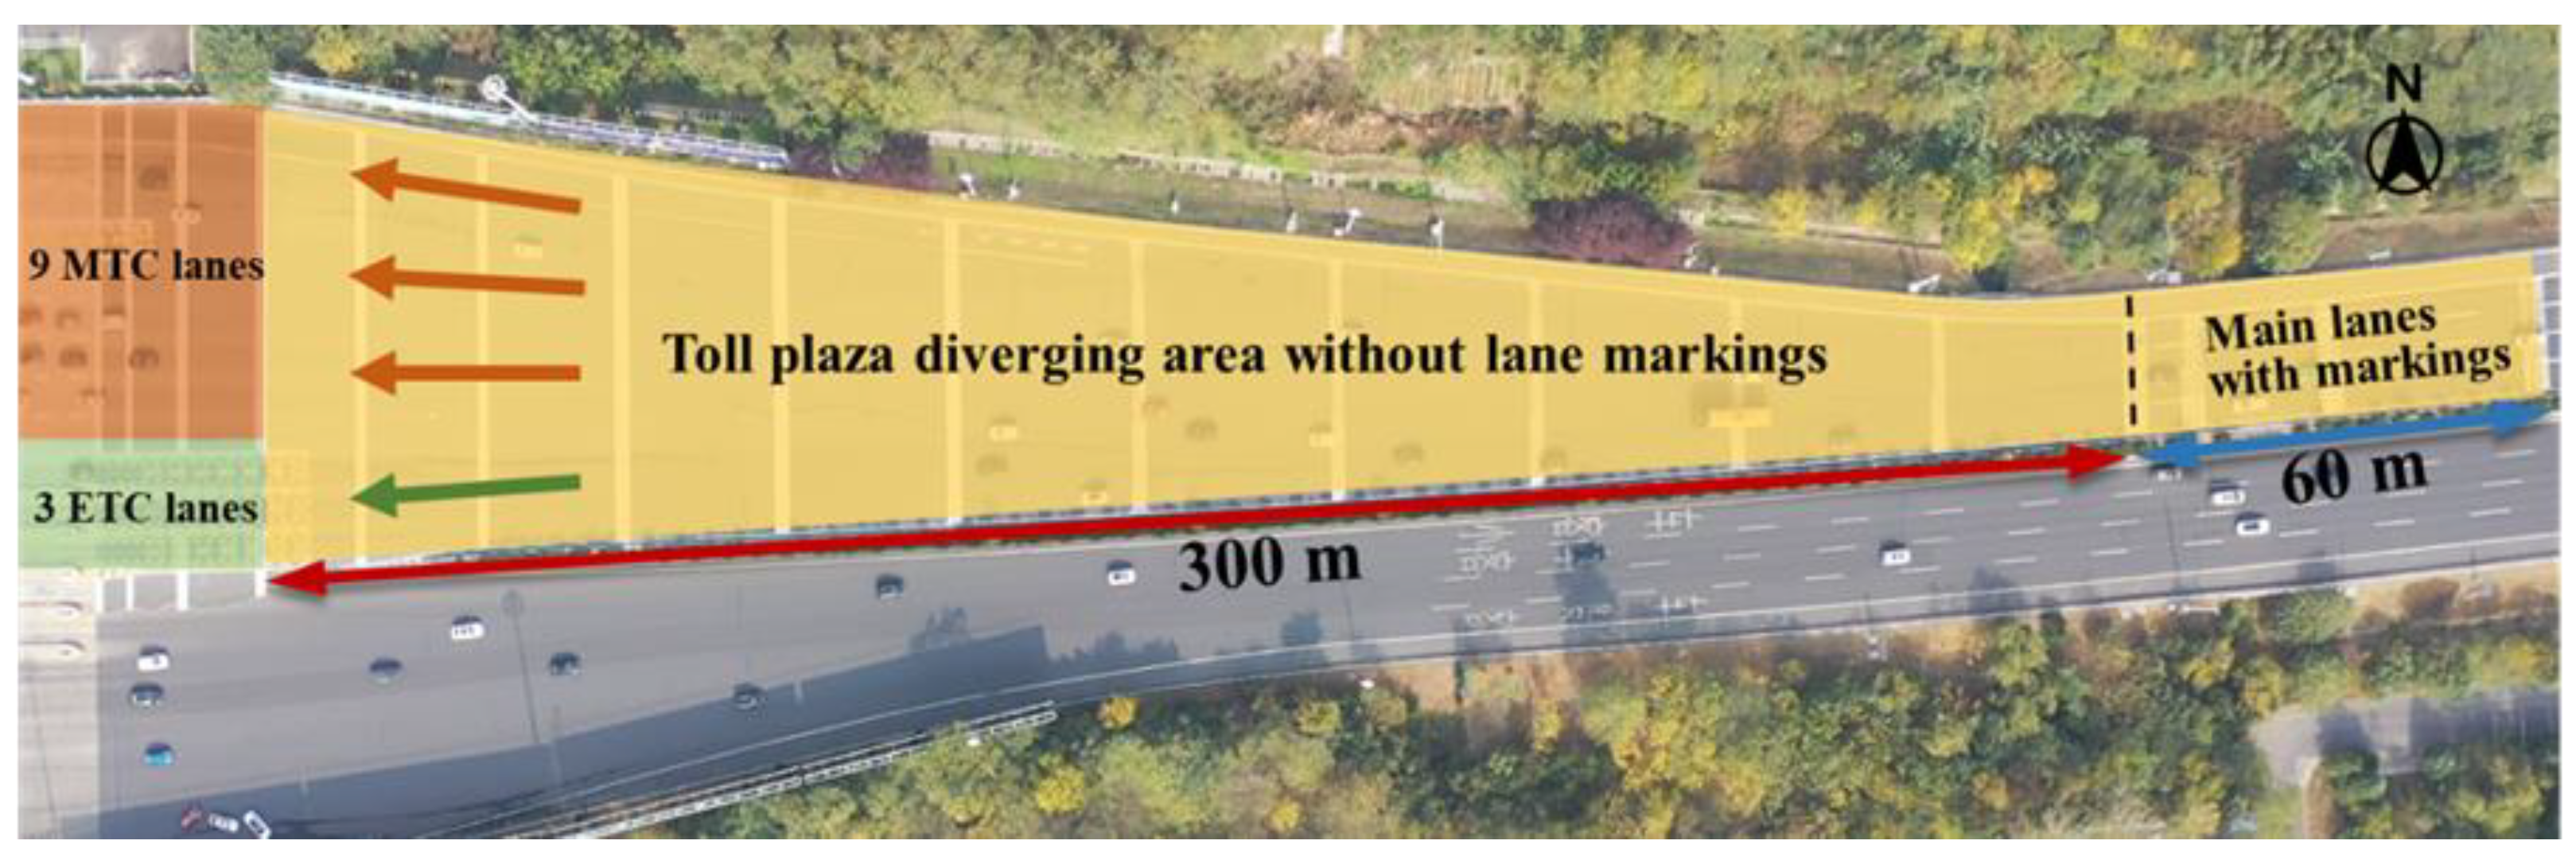
To explore the formation mechanism of conflict risk in the diverging area of toll plaza, trajectory data were collected at the toll plaza located on G42 freeway in northeast area of Nanjing, China. G42 is an east-west major corridor from Shanghai to Chengdu, with four main lanes for each direction. This study site focused on the eastbound diverging area of the toll plaza. Figure 3 depicts the layout of the diverging area. The diverging area is approximately 360 meters in length, including 60-meter main lanes and a 300-meter non-marked diverging area. Over 300 meters, the width of the diverging area without lane markings is increased from 15 meters to 65 meters along the driving direction of vehicles. There are totally 12 toll lanes, including 3 ETC lanes on the leftmost side and 9 MTC lanes on the right side. Note that MTC trucks can only use the two rightmost MTC lanes.
As mentioned above, trajectory data contains abundant traffic information, which formed the basis for the microscopic study of conflict risk. In this study, the unmanned aerial vehicle (UAV), which could provide 4K ultra-high quality and 30 frames per second (fps) video, was utilized to record vehicle movements in the diverging area. The data was collected during peak periods on March 17th, 2018, a sunny and windless day, to ensure that the UAV can hover steadily and capture clear videos. The UAV flew at an altitude of around 200 meters. A total of 1.5 h videos were recorded, and 50 min videos were finally selected for analysis.
The video data was processed by the video analytics system named Automated Roadway Conflicts Identification System (ARCIS), developed by the University of Central Florida Smart and Safe Transportation (UCF SST) team [42,43]. The system contains video data stabilization, features detection and tracking, coordinate transformation and error elimination. The ARCIS has higher vehicle detecting and tracking accuracy than traditional video analysis system. More detailed data processing could see our previous study [10]. The trajectory of 1,152 vehicles were obtained after data processing, including 1031 cars, 30 buses and 42 trucks. The hourly traffic flow rate ranged from 1,050 vph to 1,740 vph (calculated 6 times of the 10-min volume).
Figure 3.
Layout of the toll plaza diverging area and toll collection lanes.
4.2. Descriptive Statistics
The threshold of TTC usually ranges from 2 s to 4 s in previous studies [9,44]. Considering that the ETTC is an extension of the conventional TTC, so the threshold of TTC also applies to ETTC. In this study, 4 s is selected as the threshold for ETTC as it could contains more potential risky cases.
Dividing the safety status of vehicles only into conflict and non-conflict may ignore the severity of the conflict, which leads to the safety analysis lack of details. Classifying the severity of traffic conflicts between vehicles could assess state of traffic safety status more accurately. Conflict severity is often divided into multiple categories with an intrinsically ordinal structure, and thus the ordered-response model may be a promising alternative to account for this characteristic [40,45,46].
Therefore, in this study, the conflict risks of different ETC and MTC vehicle-following patterns are divided into three levels: (1) The most severe conflict risk level, indicating a high possibility of collision (ETTC less than 2.5 seconds). This risk level applies to situations in which a collision will occur if the driver does not take prompt action immediately; (2) The medium risk level, which represents the two vehicles have the potential collision but drivers have sufficient reaction time to avoid the collision (ETTC between 2.5–4 seconds); and (3) The lowest risk level (ETTC larger than 4 seconds), which represents the distance between the two vehicles is large enough so that it is nearly impossible to collide. Figure 4 depicts the frequency and proportion of observations for each level of conflict risk. Vehicle-following patterns with the same toll collection types (ETC-ETC, MTC-MTC) have higher percentage of most severe conflict risk. The MTC-ETC vehicle-following pattern has the highest percentage of slightest conflict risk and the lowest percentage of the most severe and medium risk level.
To fully explore the differences of conflict risk among different parts of the diverging area, the diverging area is divided into 12 sub-segments. As depicted in Figure 5, the length of each sub-segment is 30 meters, the first two sub-segments are in the lane marked diverging area, and the remaining 10 sub-segments are in the non-lane marked area.
The candidate variables used in this study are listed in Table 1. The variables considered in the model can be categorized into three groups: (1) location-related variables, mainly including the position features of the following vehicle during the whole diverging process at each time step; (2) speed-related variables, the average speed and acceleration of the following vehicle in each sub-segment and the whole diverging process at each time step; (3) traffic environmental variables, mainly including the conflict risks of vehicles around the following vehicle in the same sub-segment at each time step.
Specifically, in traffic environmental variables, considering the mixed travel of MTC and ETC vehicles is the main feature of TMTP, the entropy index was developed to assess the mixed degree of MTC and ETC vehicles in each sub-segment. Moreover, the length of conflict duration has been proven to be an essential index for analyzing the safety state of a vehicle as the start and end of a collision is a continuous process [26]. Thus, this study applies the time exposed to collision () to the candidate variables.
Figure 5.
Layout of diverging area segments.
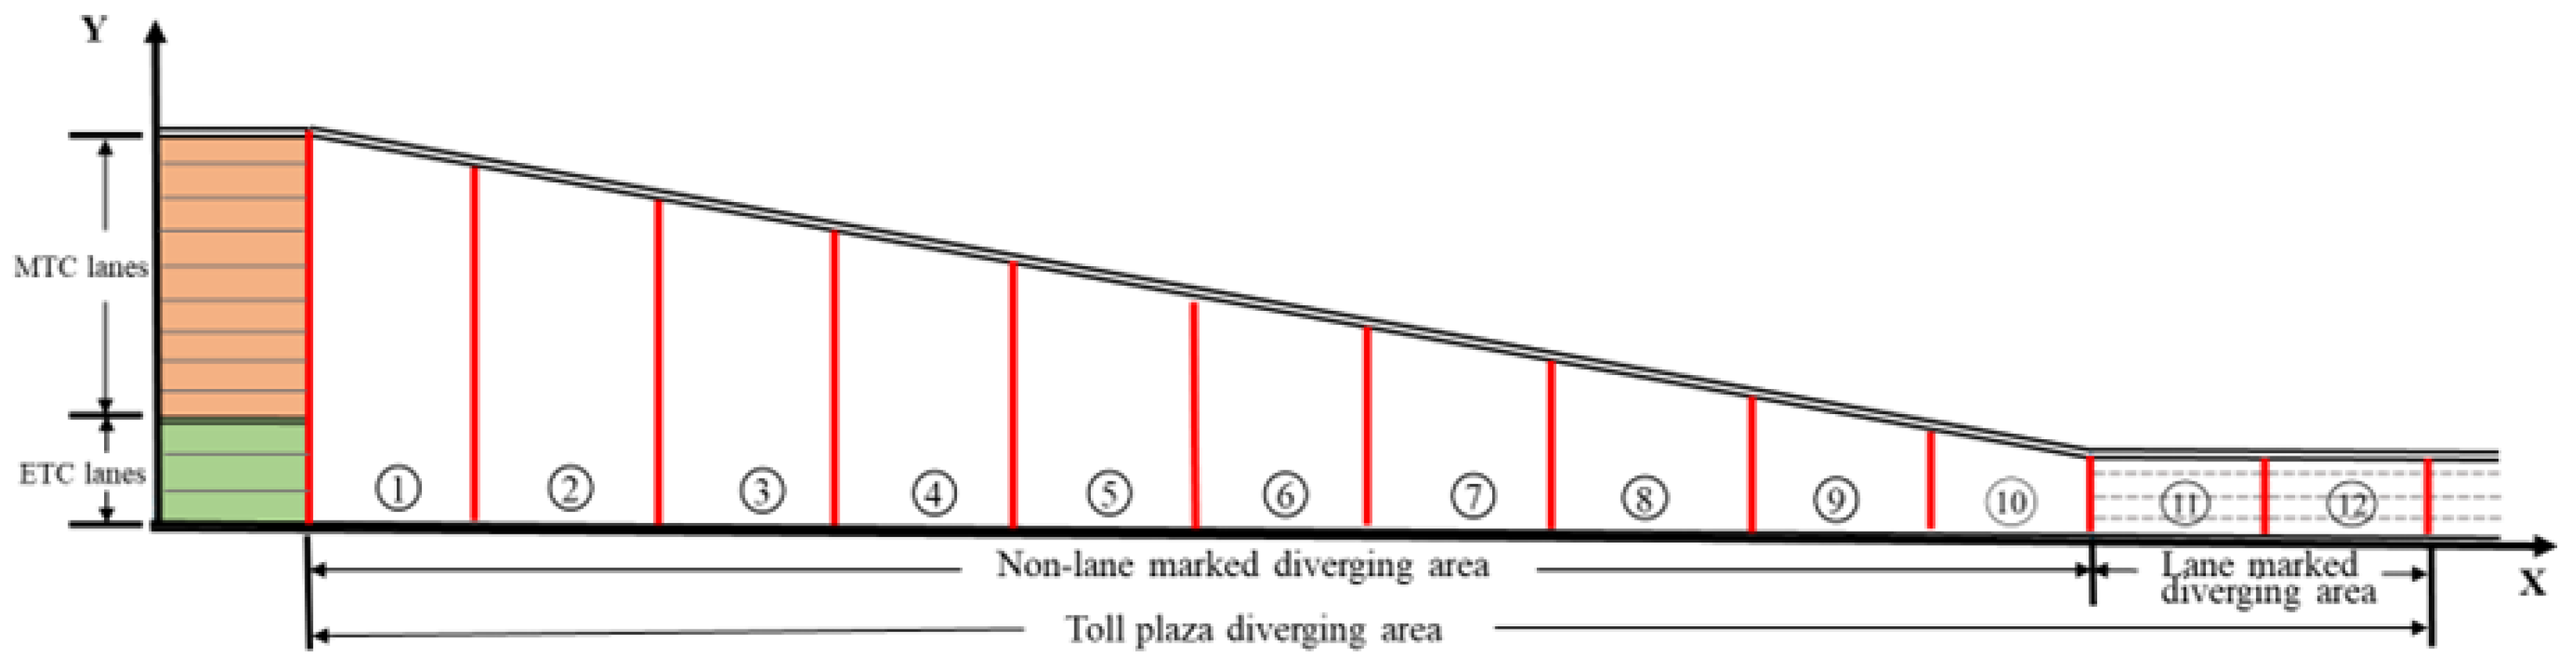

Table 1.
Statistics of candidate variables.
| Variable category | Variable | Variable Description | Mean Value | Standard Deviation |
|---|---|---|---|---|
| Location-related variables of the following vehicle | The initial lane of the following vehicle, LINIT (1–4) is numbered from left to right of vehicles’ driving direction. | 1.909 | 0.943 | |
| An indicator variable for lane marking features of the sub-segment, 0 if non-lane marked, 1 if lane marked. | 0.101 | 0.301 | ||
| The average width of the sub-segment where the vehicle is located, m. | 37.769 | 15.236 | ||
| An indicator variable for the number of lanes vehicle changes to the left, NLLC = 1 for less than 2 lanes, NRLC = 2 for more than 2 lanes. | 2.031 | 1.532 | ||
| An indicator variable for the number of lanes vehicle changes to the right, NRLC = 1 for less than 2 lanes, NRLC = 2 for more than 2 lanes. | 2.892 | 1.673 | ||
| Speed-related variables of the following vehicle | Average speed in whole toll plaza diverging area, m/s2. | 17.150 | 4.275 | |
| Average acceleration in whole toll plaza diverging area, m/s2. | 0.429 | 0.387 | ||
| Average deceleration in whole toll plaza diverging area, m/s2. | -0.390 | 0.533 | ||
| The standard deviation of vehicle acceleration in whole toll plaza diverging area, m/s2. | 0.755 | 0.497 | ||
| The maximum vehicle acceleration in whole toll plaza diverging area, m/s2. | 2.474 | 1.917 | ||
| The average speed within 3 seconds. | 17.248 | 4.250 | ||
| The speed standard deviation of the following vehicle within 3 seconds, m/s. | 0.422 | 0.370 | ||
| The average acceleration within 3 seconds. | -0.388 | 0.541 | ||
| Traffic condition variables related to the area around the following vehicle | The average traffic volume of the sub-segment, vph. | 6389.150 | 2926.179 | |
| The average speed of all vehicles in sub-segment. | 17.030 | 2.676 | ||
| The standard deviation of speed of all vehicles in sub-segment. | 3.475 | 1.619 | ||
| Average deceleration of all vehicles in sub-segment., m/s2. | 3.154 | 0.970 | ||
| The number of vehicles with ETTC less than 4 seconds in sub-segment. | 1.114 | 1.109 | ||
| The percentage of vehicles with ETTC less than 4 seconds in sub-segment. | 0.343 | 0.301 | ||
| The average ETTC value of all vehicles in sub-segment. | 1.556 | 1.296 | ||
| The standard deviation of ETTC of all vehicles in sub-segment. | 1.195 | 0.479 | ||
| The time exposed to collision of the following vehicle, s. | 1.195 | 0.478 | ||
| The percentage of ETC vehicles in sub-segment. | 0.441 | 0.355 | ||
| The mix measure of MTC and ETC vehicles in sub-segment. | 0.491 | 0.468 |
5. Likelihood Ratio Tests
To examine the differences in conflict severity outcomes between different ETC and MTC vehicle-following patterns and the spatial dependence in sub-segments, four groups of likelihood ratio tests were conducted.
To compare the models developed for four different vehicle-following patterns between MTC and ETC vehicles, the first series of likelihood ratio tests were conducted, which can be expressed as follows [19,28]:
where is the log-likelihood at the convergence of the model estimated with all data, , , and represent the log-likelihood values at the convergence of the estimated models using different ETC and MTC vehicle-following patterns.
Besides, to investigate the spatial stability of variables between different sub-segments of the diverging area, 3 sub-models were developed for 3 parts of the diverging area (denoted as D1, D2, and D3, D1 represents the downstream of the diverging area, including sub-segment 1–4; D2 represents the midstream of the diverging area, including sub-segment 5–8; D3 represents the upstream of the diverging area, including sub-segment 9–12, as shown in Figure 4). The second series of likelihood ratio tests were utilized [11]:
where is the log-likelihood at convergence of a model containing parameters from y2 while using data subset y1, and is the log-likelihood at convergence of the model using data subset y1.
Table 2, Table 3, Table 4 and Table 5 present whether the null hypothesis that the parameters are stable in the three parts of the diverging area can be rejected based on the results. For example, as shown in Table 2, using the converged parameters of the D2 model (y2) as the initial values and applying them to the D1 data (y1) yields with 9 degrees of freedom, indicating that the null hypothesis that the two parts of the diverging area are the same can be rejected at a 99.88% confidence level. Likewise, using the converged parameters of the D1 model as the starting values and applying them to the D2 data gave with 8 degrees of freedom, demonstrating that the null hypothesis that the parts of the diverging area are the same can be rejected at a 99.65% confidence level. Other subsections have the similar results that the null hypotheses can be rejected at a high confidence level.
6. Results and Discussions
A total of 24 variables are considered. All dummy variables are transformed to binary indicator variables, and numbers are appended to the variable names to distinguish the indicator variables (e.g., , ). Prior to modeling, the correlations between the variables are analyzed, and those with high correlations are removed. In addition, Z-score is used to standardize continuous data in order to eliminate the effects of dimension and make them comparable with other variables.
The results of the best-fitted random parameters ordered logit (RPOL) models and RPOL models with heterogeneity in means (RPOLMH) are shown in Table 6, Table 7, Table 8, Table 9 and Table 10, as the variance heterogeneity is not statistically significant. These results consist of the estimation of parameter, t-statistics, and goodness-of-fit statistics (simulated log-likelihood at convergence, restricted log-likelihood, McFadden’s pseudo R2, and AIC). On the basis of the RPOLMH models, likelihood ratio tests show that the null hypothesis of the performance of four models (Table 7, Table 8, Table 9 and Table 10) are the same with that of the combined model (Table 6) is rejected with over 99.9% confidence, indicating the separation of different vehicle-following patterns is reasonable.
For four vehicle-following patterns, the AIC values of the RPOL models are larger than those of RPOLMH, which demonstrates the RPOLMH models have better performance. The values of the McFadden’s pseudo R2 of four RPOLMH models also indicate the same result. The number of significant variables is almost same in models for different vehicle-following patterns (Table 7, Table 8, Table 9 and Table 10). Specifically, nine variables, including the average traffic volume of the sub-segment (), overall acceleration standard deviation (), lane marking indicator (), the average acceleration within 3 seconds (), the average speed within 3 seconds (), the speed standard deviation of the following vehicle within 3 seconds (), the standard deviation of ETTC of all vehicles in sub-segment (), the mix measure of MTC and ETC vehicles (), the percentage of vehicles with ETTC less than 4 seconds in sub-segment () are significantly associated with risk status in the toll plaza diverging area. Moreover, three variables are identified to be random parameters with heterogeneous in means (, and ).
6.1. Traffic Condition Related Characteristics
According to the results of four RPOLMH models in presented Table 7, Table 8, Table 9 and Table 10, the coefficients of the proportion of risky vehicles around the vehicles () are positive, indicating that an increase in has significant positive effects on the conflict risk for all vehicle-following patterns. One possible reason might be that when approaching to the toll collection lanes, vehicles usually have an increase in lane-changing behaviors and acceleration and deceleration due to the toll booth restriction and speed limitation [47].
According to a significant body of studies, the collision risk level increases as traffic volume rises. In our investigation, the coefficient of the average traffic volume of the diverging area () is found to be random parameter with heterogeneous in means in all vehicle-following patterns, indicating that, in some cases, the collision risk level increases with low traffic volume. Such result is reasonable since drivers are more likely to compensate for the increased traffic volume with a more cautious behavior in toll plaza diverging area. Similarly, another possible explanation for this outcome is that vehicles must wait in line to pass the toll lane when the traffic volume is high, thereby reducing the conflict risk.
6.2. Driving Behavior Related Characteristics
In terms of the variables related to initial lane and vehicle lane-changes, interesting results have been found from the model estimation. Only have significant effects on conflict risk level in ETC-MTC (Table 8) and MTC-MTC models (Table 9). However, the results are significantly different when the following is an ETC vehicle (Table 7 and Table 10). In ETC-ETC and MTC-ETC models, all effects of variables associated with the initial lane (, , ) are significant. When the initial lanes of the following ETC vehicles are , or , the conflict risk increases because ETC vehicles from initial lane 2 may intersect with vehicles coming from inside the diverging area. This implies that different initial lanes chosen by vehicles can result in differences in four vehicle-following patterns.
The average acceleration of the following vehicle within 3 seconds () is found to be a fixed parameter with significantly negative effect on the conflict risk level, indicating that traffic safety status improves as the average acceleration of the following vehicles increases. It is likely because the following vehicle would take an acceleration maneuver only when the driver perceives no collision risk around, and thus the collision risk level between the leading vehicle and following vehicle would decrease. Furthermore, the maximum acceleration in whole diverging area of the following vehicle () also significantly increases the collision risk level of ETC-MTC (Table 8) pattern, while decreasing the collision risk level of other patterns.
6.3. Random Parameters with Heterogeneity in Means
Except for the MTC-MTC pattern, the speed standard deviation of the following vehicle within 3 seconds () and the standard deviation of ETTC of all vehicles in sub-segment () have random effects on collision risk level. According to Table 7, Table 8, Table 9 and Table 10, both the means and standard deviations of the two variables are statistically significant, indicating that the effects of the factors vary across different vehicle-following patterns.
Specifically, is identified as statistically significant random parameters in all RPOL models with heterogeneity in means for all vehicle-following patterns, indicating that the effect of has considerable variations across all observations. Overall, the coefficients of are positive, indicating that larger speed changes will result in higher levels of conflict risk. Regarding the standard deviation of ETTC of vehicles in sub-segment (), it produced significant random parameters among models for ETC-ETC, MTC-ETC and ETC-MTC patterns. The effects of differ greatly across three patterns. To some extent, the lager standard deviation of ETTC reflects the fluctuation of traffic flow near the following vehicle, which may increase the conflict risk level. Nevertheless, random parameter is not observed in the RPOLMH model for MTC-MTC vehicle-following pattern. The possible reason is that MTC vehicles are required to stop before toll collection lanes and wait in queues, so the conflict risk of vehicles in MTC-MTC pattern is quite different from that of other patterns.
Theoretically, vehicles choosing the toll lanes corresponding to their initial lanes directly do not need to change lanes, resulting in fewer conflicts. Interestingly, changing lanes to the left (1) has significant effects on collision risk level in the RPOLMH models for ETC-ETC and MTC-ETC patterns. It indicates that the lane change operation directly affects the collision risk level. If ETC vehicles change to the inner side of the main-line road in advance, there will be less interweaving between ETC and MTC vehicles in the diverging area. The coefficients of variable changing lanes to the right () are significant in the models for ETC-MTC, MTC-ETC and MTC-MTC patterns. According to the layout of ETC and MTC lanes, MTC vehicles need to operate more lane changes to pass through the diverging area. Therefore, more vehicle-to-vehicle interactions may increase the conflict risk when MTC vehicles are involved in the vehicle-following groups.
Another important issue cannot be overlooked is that some random parameters are not sufficient in measuring conflict risk alone, and should be considered together with the other variables. In Table 7, Table 8, Table 9 and Table 10, the means of the random parameter for and are associated with lane marking indicator () and the percentage of vehicles with ETTC less than 4 s in sub-segment (). It is noteworthy that can be regarded as a primary contributor to collision risk level. For example, in the model for ETC-ETC pattern in Table 7, when is involved with , the mean of the random parameter is 0.165 (0.404 − 0.239 = 0.165). Such result indicates that the effects of on the conflict risk level will greatly differ in sub-segments with and without lane-markings to a large extent. One possible reason is that the psychology and behaviors of drivers change with the absence of lane-markings. Apart from lane marking indicator, are also found to have an effect on the mean of the random parameter for TVSTD in the ETC-ETC pattern.
Table 6.
Parameter estimation results for all vehicle-following patterns.
| Variables | RPOL | RPOLMH | ||
| Coefficient | t-stat | Coefficient | t-stat | |
| Nonrandom parameters | ||||
| Threshold parameters for probabilities | 3.345*** | 67.06 | 3.478*** | 66.63 |
| Constant | -4.448*** | -19.48 | -4.583*** | -15.87 |
| -0.285*** | -3.83 | -0.606*** | -3.29 | |
| -0.709*** | -9.34 | -0.365** | -2.00 | |
| -0.813*** | -9.4 | -0.255*** | -2.411 | |
| -0.178*** | -7.14 | -0.176*** | -3.14 | |
| -0.176*** | -7.08 | -0.448*** | -6.80 | |
| -0.144** | -6.24 | -0.246*** | -4.54 | |
| 0.176*** | 6.35 | 2.146*** | 6.05 | |
| -0.396*** | -14.64 | 1.488*** | 46.53 | |
| 0.545*** | 21.20 | 0.5543*** | 21.15 | |
| 0.352** | 4.70 | 0..315*** | 4.12 | |
| 0.146*** | 6.05 | 2.146*** | 6.05 | |
| Random parameters | ||||
| -0.446*** | -14.61 | -0.476*** | -5.03 | |
| Standard deviation for the random parameter () | 0.906*** | 17.18 | 0.968*** | 59.12 |
| -0.286*** | -4.12 | -0.674*** | -6.00 | |
| Standard deviation for the random parameter () | 0.903*** | 46.43 | 0.368*** | 21.49 |
| Heterogeneity in the means of random parameters | ||||
| : | -0.156* | -1.86 | ||
| : | -0.272** | -2.93 | ||
| : | 0.106*** | 3.83 | ||
| 0.214*** | 2.66 | |||
| 0.193*** | 3.68 | |||
| 0.059*** | 2.29 | |||
| 0.048* | 1.88 | |||
| Number of parameters | 17 | 24 | ||
| Number of observations | 11306 | 11306 | ||
| Log likelihood with constants only | -11214.896 | -11214.896 | ||
| Log likelihood at convergence | -9828.941 | -9786.598 | ||
| Akaike information criterion (AIC) | 19697.9 | 19635.2 | ||
Notes: *, **, and *** denote the statistical significance at 0.1, 0.05 and 0.01 levels, respectively.
Table 7.
Parameter estimation results for ETC-ETC vehicle-following pattern.
| Variables | RPOL | RPOLMH | ||
| Coefficient | t-stat | Coefficient | t-stat | |
| Nonrandom parameters | ||||
| Threshold parameters for probabilities | 3.381*** | 29.69 | 4.366*** | 28.18 |
| Constant | -5.576*** | -10.37 | -5.408*** | -8.160 |
| 0.657*** | 4.97 | 0.817*** | 5.520 | |
| 1.600*** | 10.36 | 2.019*** | 11.460 | |
| 1.943*** | 7.67 | 2.339*** | 8.320 | |
| 0.211*** | 3.19 | -0.5679* | -0.260 | |
| -0.268*** | -4.82 | -0.294** | -2.220 | |
| -0.122** | -2.34 | -0.164*** | -2.830 | |
| L | 1.707*** | 22.03 | 2.122*** | 22.440 |
| -0.572*** | -9.36 | -0.747*** | -10.720 | |
| 0.789*** | 13.18 | 0.332* | 1.910 | |
| 0.319** | 2.37 | 0.417*** | 2.780 | |
| Random parameters | ||||
| 0.184*** | 2.69 | 0.404*** | 2.910 | |
| Standard deviation for the random parameter () | 0.674*** | 17.18 | 1.013*** | 20.310 |
| -0.286*** | -4.12 | -1.290*** | -9.340 | |
| Standard deviation for the random parameter () | 0.903*** | 26.85 | 1.381*** | 28.010 |
| 0.262*** | 4.62 | 0.382*** | 3.80 | |
| Standard deviation for the random parameter () | 0.975*** | 23.14 | 1.086*** | 22.490 |
| Heterogeneity in the means of random parameters | ||||
| : | 0.895* | 1.420 | ||
| : | -0.239** | -2.110 | ||
| : | -0.149** | -2.540 | ||
| : | 0.937* | 1.270 | ||
| : | 0.613*** | 8.270 | ||
| : | 0.107* | 1.800 | ||
| : | -0.144** | -2.410 | ||
| Number of parameters | 18 | 25 | ||
| Number of observations | 2466 | 2466 | ||
| Log likelihood with constants only | -3000.274 | -3000.274 | ||
| Log likelihood at convergence | -2308.335 | -2294.59157 | ||
| Akaike information criterion (AIC) | 4652.7 | 4639.2 | ||
| McFadden Pseudo R-squared | 0.230 | 0.235 | ||
Notes: *, **, and *** denote the statistical significance at 0.1, 0.05 and 0.01 levels, respectively.
Table 8.
Parameter estimation results for ETC-MTC vehicle-following pattern.
| Variables | RPOL | RPOLMH | ||
| Coefficient | t-stat | Coefficient | t-stat | |
| Nonrandom parameters | ||||
| Threshold parameters for probabilities | 3.565*** | 27.37 | 3.869*** | 26.88 |
| Constant | -7.383*** | -11.32 | -7.475*** | -10.41 |
| -1.140*** | -8.85 | -1.141*** | -8.46 | |
| -0.130* | -1.81 | -0.420 | -2.2 | |
| 0.075* | 2.59 | -0.395** | -2.53 | |
| 0.184*** | 3.29 | 0.244*** | 4.17 | |
| 1.903*** | 23.28 | 2.077** | 23.57 | |
| -0.447*** | -5.85 | -0.453*** | -5.67 | |
| 0.694*** | 10.81 | 0.224 | 1.27 | |
| -0.224*** | -3.5 | -0.270*** | -4.05 | |
| 0.983*** | 8.8 | 1.095*** | 9.37 | |
| Random parameters | ||||
| -0.799*** | -10.33 | -1.746*** | -9.57 | |
| Standard deviation for the random parameter () | 0.641*** | 21.28 | 0.744*** | 22.33 |
| 0.192*** | 3.07 | .0402*** | 3.13 | |
| Standard deviation for the random parameter () | 0.577*** | 14.45 | 0.520*** | 12.95 |
| -0.518* | -72 | 0.990* | 6.60 | |
| Standard deviation for the random parameter () | 0.815*** | 17.24 | 0.977*** | 18.68 |
| Heterogeneity in the means of random parameters | ||||
| : | 0.151*** | 0.052 | ||
| : | 0.197** | 0.094 | ||
| : | 0.380*** | 0.076 | ||
| : | 0.186** | 0.072 | ||
| : | -0.416*** | 0.066 | ||
| : | 0.019* | 0.106 | ||
| : | -0.405*** | 0.074 | ||
| : | 0.272*** | 0.065 | ||
| Number of parameters | 17 | 25 | ||
| Number of observations | 2561 | 2561 | ||
| Log likelihood with constants only | -2402.155 | -2402.155 | ||
| Log likelihood at convergence | -1776.738 | -1751.157 | ||
| Akaike information criterion (AIC) | 3587.5 | 3552.3 | ||
| McFadden Pseudo R-squared | 0.260 | 0.271 | ||
Notes: *, **, and *** denote the statistical significance at 0.1, 0.05 and 0.01 levels, respectively.
Table 9.
Parameter estimation results for MTC-MTC vehicle-following pattern.
| Variables | RPOL | RPOLMH | ||
| Coefficient | t-stat | Coefficient | t-stat | |
| Nonrandom parameters | ||||
| Threshold parameters for probabilities | 3.613*** | 40.07 | 3.597*** | 40.1 |
| Constant | -5.793*** | -14.85 | -6.211*** | -12.86 |
| -0.167* | 1.82 | 0.211** | 2.28 | |
| -0.249*** | -5.55 | -0.558*** | -4.85 | |
| -0.147*** | -3.5 | -0.180 | -1.60 | |
| 0.179*** | 4.51 | 0.176*** | 4.40 | |
| 0.58* | 11.4 | 0.242* | 1.82 | |
| 1.624*** | 29.14 | 1.656*** | 29.34 | |
| -0.395*** | -7.84 | -0.331*** | -6.39 | |
| 0.420*** | 9.47 | 0.264** | 2.44 | |
| 0.385*** | 8.41 | 0.359*** | 7.74 | |
| 0.266*** | 3.45 | 0.239*** | 3.09 | |
| Random parameters | ||||
| -0.672*** | -12.08 | -1.100*** | -9.81 | |
| Standard deviation for the random parameter () | 0.920*** | 34.14 | 0.916*** | 34.10 |
| 0.331*** | 6.4 | 0.954*** | 8.58 | |
| Standard deviation for the random parameter () | 0.597*** | 20.02 | 0.526*** | 18.26 |
| Heterogeneity in the means of random parameters | ||||
| : | 0.157*** | 3.47 | ||
| : | 0.177*** | 3.76 | ||
| : | -0.090* | -1.69 | ||
| : | 0.155*** | 3.31 | ||
| : | -0.241*** | -7.02 | ||
| : | -0.912** | -2.24 | ||
| Number of parameters | 17 | 22 | ||
| Number of observations | 3817 | 3817 | ||
| Log likelihood with constants only | -4259.636 | -4259.636 | ||
| Log likelihood at convergence | -3400.384 | -3229.269 | ||
| Akaike information criterion (AIC) | 6834.8 | 6502.5` | ||
| McFadden Pseudo R-squared | 0.202 | 0.242 | ||
Notes: *, **, and *** denote the statistical significance at 0.1, 0.05 and 0.01 levels, respectively.
Table 10.
Parameter estimation results for MTC-ETC vehicle-following pattern.
| Variables | RPOL | RPOLMH | ||
| Coefficient | t-stat | Coefficient | t-stat | |
| Nonrandom parameters | ||||
| Threshold parameters for probabilities | 9.666*** | 24.17 | 12.017*** | 21.79 |
| Constant | -15.119*** | -16.04 | -18.890*** | -15.86 |
| 0.730*** | 3.35 | 0.820*** | 3.35 | |
| 0.231* | 8.9 | 0.541* | 1.84 | |
| 1.382*** | 3.54 | 1.564*** | 3.56 | |
| -0.682*** | -6.45 | -0.814*** | -4.55 | |
| -0.319*** | -4.36 | -1.367*** | -5.54 | |
| -0.380*** | -5.11 | -0.425*** | -5.05 | |
| 3.653*** | 21.47 | 4.587*** | 20.13 | |
| -0.501*** | -6.06 | -0.561*** | -5.99 | |
| 1.176*** | 10.24 | 1.356*** | 10.24 | |
| 0.592*** | 5.42 | 0.812*** | 6.5 | |
| 0.944*** | 4.48 | 1.083*** | 4.56 | |
| 0.756*** | 3.64 | 0.695*** | 2.98 | |
| Random parameters | ||||
| -1.531*** | -12.79 | -2.236*** | -14.28 | |
| Standard deviation for the random parameter () | 2.337*** | 23.37 | 3.014*** | 21.36 |
| 0.335*** | 3.88 | -0.228 | -1.31 | |
| Standard deviation for the random parameter () | 2.090*** | 21.03 | 2.122*** | 19.06 |
| 0.454*** | 4.97 | 1.077*** | 7.1 | |
| Standard deviation for the random parameter () | 0.925*** | 15.04 | 1.541*** | 17.2 |
| Heterogeneity in the means of random parameters | ||||
| 0.730*** | 0.094 | |||
| : | 0.560*** | 0.102 | ||
| : | -0.157* | 0.087 | ||
| : | -0.348*** | 0.087 | ||
| : | -0.614*** | 0.136 | ||
| Number of parameters | 20 | 25 | ||
| Number of observations | 2462 | 2462 | ||
| Log likelihood with constants only | -2597.626 | -2597.626 | ||
| Log likelihood at convergence | -1971.890 | -1959.918 | ||
| Akaike information criterion (AIC) | 3983.780 | 3969.836 | ||
| McFadden Pseudo R-squared | 0.241 | 0.246 | ||
Notes: *, **, and *** denote the statistical significance at 0.1, 0.05 and 0.01 levels, respectively.
7. Conclusion
This study explored the conflict risk in the diverging area of toll plaza for different ETC and MTC vehicle-following patterns. Four patterns were compared according to the combination of vehicle toll collection types: ETC-ETC, ETC-MTC, MTC-MTC and MTC-ETC. The extended time to collision (ETTC) was used to measure the conflict risk for each vehicle-following pattern. Using random parameters ordered logit models with heterogeneous means, the effects of traffic condition characteristics, driving behavior characteristics, and roadway characteristics were evaluated using vehicle trajectory data obtained from a toll plaza diverging area in Nanjing, China. The major conclusions are concluded as follows:
(1) Vehicle-following patterns with the same toll collection types (ETC-ETC, MTC-MTC) have higher percentage of severe conflict risk, while the MTC-ETC vehicle-following pattern has the highest percentage of slightest conflict risk. ETC vehicles are more cautious when their preceding vehicle is an MTC vehicle.
(2) The random parameters ordered logit models with heterogeneity in means outperform the conventional random parameters ordered logit models and produce more insightful results.
(3) Interesting results are observed in the coefficients of driving behavior related characteristics. A larger value of average acceleration within 3 seconds (TAMEAN) may result in a safer status. Meanwhile, all the variables related to the initial lane of the following vehicle (LINIT2, LINIT3, LINIT4) are significant in ETC-ETC and MTC-ETC patterns.
(4) The effects of the speed standard deviation of the following vehicle within 3 seconds (TVSTD), the standard deviation of ETTC of all vehicles in sub-segment (ZESTD), and the average traffic volume of the sub-segment (ZVOL) on the conflict risks considerably vary across vehicle-following patterns. In addition, lane-marking indicator (LM), the number of vehicles with ETTC less than 4 seconds in sub-segment (ZNPETTC) and the mix measure of MTC and ETC vehicles in sub-segment (ZMIX) are associated with the means and the variances of these random parameters.
Nonetheless, this study could be improved in a few ways. First, the scope of the study is restricted to a single toll plaza in Nanjing, China. Additionally, the weather is limited to sunny days with clear vision. More scenarios such as rainy days or foggy days should be considered. Additionally, how the characteristics of driver, such as age, gender, interacting with other contributing factors which may have significant effects on conflict risks should be further explored. The authors suggest further research on these topics.
Author Contributions
Conceptualization, Lu Xing and Daoxing Zou; methodology, Lu Xing and Yi Fei; software, Daoxing Zou; validation, Lu Xing, Daoxing Zou and Yi Fei; formal analysis, Lu Xing, Daoxing Zou and Kejun Long; resources, Lu Xing; data curation, Lu Xing and Daoxing Zou; writing—original draft preparation, Lu Xing, Daoxing Zou and Yi Fei; writing—review and editing, Kejun Long and Jie Wang; visualization, Lu Xing and Yi Fei; supervision, Kejun Long and Jie Wang; funding acquisition, Lu Xing. All authors have read and agreed to the published version of the manuscript.
Funding
This research was funded by National Natural Science Foundation of China (52102405), Natural Science Foundation of Hunan Province (2021JJ40603), Scientific Research Program of the Education Department of Hunan Province (21B0335), Key Laboratory of Highway Engineering of Ministry of Education (kfj220203).
Data Availability Statement
The data used in this study are not publicly available due to confidentiality and privacy concerns. Access to the data can only be granted upon request and with the permission of the appropriate parties. Please contact the corresponding author for further information.
Acknowledgments
Thanks to the Automated Roadway Conflicts Identification System (ARCIS) which was developed by the University of Central Florida Smart and Safe Transportation (UCF SST) team.
Conflicts of Interest
The authors declare no conflict of interest.
References
- China Ministry of Transport (MOT). National Toll Road Statistics Bulletin of 2021; 2022. [Google Scholar]
- Xing, L.; He, J.; Abdel-Aty, M.; Wu, Y.; Yuan, J. Time-varying Analysis of Traffic Conflicts at the Upstream Approach of Toll Plaza. Accid. Anal. Prev. 2020, 141, 105539. [Google Scholar] [CrossRef] [PubMed]
- Hajiseyedjavadi, F.; McKinnon, I.; Fitzpatrick, C.; Knodler, M.A., Jr. Application of Microsimulation to Model the Safety of Varied Lane Configurations at Toll Plazas. In Proceedings of the Transportation Research Board 94th Annual Meeting, Washington, DC, USA, 11–15 January 2015. [Google Scholar]
- Abuzwidah, M.; Abdel-Aty, M. Safety assessment of the conversion of toll plazas to all-electronic toll collection system. Accid. Anal. Prev. 2015, 80. [Google Scholar] [CrossRef] [PubMed]
- Xing, L.; Yu, L.; Zheng, O.; Abdel-Aty, M. Explore traffic conflict risks considering motion constraint degree in the diverging area of toll plazas. Accid. Anal. Prev. 2023, 185, 107011. [Google Scholar] [CrossRef] [PubMed]
- Xing, L.; Zhong, S.; Yan, X.; Wu, W.; Tang, Y. A temporal analysis of crash injury severities in multivehicle crashes involving distracted and non-distracted driving on tollways. Accid. Anal. Prev. 2023, 184, 107008. [Google Scholar] [CrossRef]
- Xing, L.; He, J.; Li, Y.; Wu, Y.; Yuan, J.; Gu, X. Comparison of different models for evaluating vehicle collision risks at upstream diverging area of toll plaza. Accid. Anal. Prev. 2020, 135, 105343. [Google Scholar] [CrossRef] [PubMed]
- Zheng, L.; Ismail, K.; Meng, X. Traffic conflict techniques for road safety analysis: Open questions and some insights. Can. J. Civ. Eng. 2014, 41. [Google Scholar] [CrossRef]
- Guo, Y.; Sayed, T.; Zaki, M.H.; Liu, P. Safety evaluation of unconventional outside left-turn lane using automated traffic conflict techniques. Can. J. Civ. Eng. 2016, 43, 631–642. [Google Scholar] [CrossRef]
- Xing, L.; He, J.; Abdel-Aty, M.; Cai, Q.; Li, Y.; Zheng, O. Examining traffic conflicts of up stream toll plaza area using vehicles’ trajectory data. Accid. Anal. Prev. 2019, 125, 174–187. [Google Scholar] [CrossRef] [PubMed]
- Islam, M.; Alnawmasi, N.; Mannering, F. Unobserved heterogeneity and temporal instability in the analysis of work-zone crash-injury severities. Analytic Methods in Accident Research 2020, 28, 100130. [Google Scholar] [CrossRef]
- Tang, J.; Gao, F.; Liu, F.; Han, C.; Lee, J. Spatial heterogeneity analysis of macro-level crashes using geographically weighted Poisson quantile regression. Accid. Anal. Prev. 2020, 148, 105833. [Google Scholar] [CrossRef]
- Weng, J.; Meng, Q.; Yan, X. Analysis of work zone rear-end crash risk for different vehicle-following patterns. Accid. Anal. Prev. 2014, 72, 449–457. [Google Scholar] [CrossRef] [PubMed]
- Fountas, G.; Anastasopoulos, P.C. A random thresholds random parameters hierarchical ordered probit analysis of highway accident injury-severities. Analytic Methods in Accident Research 2017, 15, 1–16. [Google Scholar] [CrossRef]
- Seraneeprakarn, P.; Huang, S.; Shankar, V.; Mannering, F.; Venkataraman, N.; Milton, J. Occupant injury severities in hybrid-vehicle involved crashes: A random parameters approach with heterogeneity in means and variances. Analytic Methods in Accident Research 2017, 15, 41–55. [Google Scholar] [CrossRef]
- Azimi, G.; Rahimi, A.; Asgari, H.; Jin, X. Severity analysis for large truck rollover crashes using a random parameter ordered logit model. Accid. Anal. Prev. 2020, 135, 105355. [Google Scholar] [CrossRef] [PubMed]
- Intini, P.; Berloco, N.; Fonzone, A.; Fountas, G.; Ranieri, V. The influence of traffic, geometric and context variables on urban crash types: A grouped random parameter multinomial logit approach. Analytic Methods in Accident Research 2020, 28, 100141. [Google Scholar] [CrossRef]
- Choudhary, P.; Pawar, N.M.; Velaga, N.R.; Pawar, D.S. Overall performance impairment and crash risk due to distracted driving: A comprehensive analysis using structural equation modelling. Transp. Res. Part F Psychol. Behav. 2020, 74, 120–138. [Google Scholar] [CrossRef]
- Yan, X.; He, J.; Zhang, C.; Liu, Z.; Qiao, B. Spatiotemporal instability analysis considering unobserved heterogeneity of crash-injury severities in adverse weather. Analytic Methods in Accident Research 2021, 32, 100182. [Google Scholar] [CrossRef]
- Li, Y.; Gu, R.; Lee, J.; Yang, M.; Chen, Q.; Zhang, Y. The dynamic tradeoff between safety and efficiency in discretionary lane-changing behavior: A random parameters logit approach with heterogeneity in means and variances. Accid. Anal. Prev. 2021, 153, 106036. [Google Scholar] [CrossRef]
- Zheng, L.; Sayed, T.; Mannering, F. Modeling traffic conflicts for use in road safety analysis: A review of analytic methods and future directions. Analytic Methods in Accident Research 2021, 29, 100142. [Google Scholar] [CrossRef]
- Wood, J.S.; Donnell, E.T.; Fariss, C.J. A method to account for and estimate underreporting in crash frequency research. Accid. Anal. Prev. 2016, 95, 57–66. [Google Scholar] [CrossRef]
- Arun, A.; Haque, M.M.; Bhaskar, A.; Washington, S.; Sayed, T. A systematic mapping review of surrogate safety assessment using traffic conflict techniques. Accid. Anal. Prev. 2021, 153, 106016. [Google Scholar] [CrossRef] [PubMed]
- Chen, Q.; Gu, R.; Huang, H.; Lee, J.; Zhai, X.; Li, Y. Using vehicular trajectory data to explore risky factors and unobserved heterogeneity during lane-changing. Accid. Anal. Prev. 2021, 151, 105871. [Google Scholar] [CrossRef]
- Hu, Y.; Li, Y.; Huang, H.; Lee, J.; Yuan, C.; Zou, G. A high-resolution trajectory data driven method for real-time evaluation of traffic safety. Accid. Anal. Prev. 2022, 165, 106503. [Google Scholar] [CrossRef] [PubMed]
- Li, Y.; Wu, D.; Chen, Q.; Lee, J.; Long, K. Exploring transition durations of rear-end collisions based on vehicle trajectory data: A survival modeling approach. Accid. Anal. Prev. 2021, 159, 106271. [Google Scholar] [CrossRef] [PubMed]
- Mannering, F.L.; Shankar, V.; Bhat, C.R. Unobserved heterogeneity and the statistical analysis of highway accident data. Analytic Methods in Accident Research 2016, 11, 1–16. [Google Scholar] [CrossRef]
- Alnawmasi, N.; Mannering, F. A statistical assessment of temporal instability in the factors determining motorcyclist injury severities. Analytic Methods in Accident Research 2019, 22, 100090. [Google Scholar] [CrossRef]
- Cai, Q.; Saad, M.; Abdel-Aty, M.; Yuan, J. Safety Impact of Weaving Distance on Freeway Facilities with Managed Lanes using Both Microscopic Traffic and Driving Simulations. Transportation Research Record Journal of the Transportation Research Board 2018, 2672. [Google Scholar] [CrossRef]
- Weng, J.; Xue, S.; Yang, Y.; Yan, X.; Qu, X. In-depth analysis of drivers’ merging behavior and rear-end crash risks in work zone merging areas. Accid. Anal. Prev. 2015, 77, 51–61. [Google Scholar] [CrossRef]
- Li, Y.; Xu, C.; Xing, L.; Wang, W. Integrated Cooperative Adaptive Cruise and Variable Speed Limit Controls for Reducing Rear-End Collision Risks Near Freeway Bottlenecks Based on Micro-Simulations. IEEE Trans. Intell. Transp. Syst. 2017, 18, 3157–3167. [Google Scholar] [CrossRef]
- Hayward, J.C. Near-miss determination through use of a scale of danger. Highway Research Record 1972, 384, 24–34. [Google Scholar]
- Sayed, T.; Zaki, M.H.; Autey, J. Automated safety diagnosis of vehicle–bicycle interactions using computer vision analysis. Saf. Sci. 2013, 59, 163–172. [Google Scholar] [CrossRef]
- Li, Y.; Wang, H.; Wang, W.; Liu, S.; Xiang, Y. Reducing the risk of rear-end collisions with infrastructure-to-vehicle (I2V) integration of variable speed limit control and adaptive cruise control system. Traffic Inj. Prev. 2016, 17, 597–603. [Google Scholar] [CrossRef] [PubMed]
- Li, Y.; Li, Z.; Wang, H.; Wang, W.; Xing, L. Evaluating the safety impact of adaptive cruise control in traffic oscillations on freeways. Accid. Anal. Prev. 2017, 104, 137–145. [Google Scholar] [CrossRef] [PubMed]
- Behbahani, H.; Nadimi, N. A framework for applying surrogate safety measures for sideswipe conflicts. International Journal for Traffic and Transport Engineering 2015, 5, 371–383. [Google Scholar] [CrossRef] [PubMed]
- Mahmud, S.M.S.; Ferreira, L.; Hoque, M.S.; Tavassoli, A. Application of proximal surrogate indicators for safety evaluation: A review of recent developments and research needs. IATSS Res. 2017, 41, 153–163. [Google Scholar] [CrossRef]
- Laureshyn, A.; Svensson, Å.; Hydén, C. Evaluation of traffic safety, based on micro-level behavioural data: Theoretical framework and first implementation. Accid. Anal. Prev. 2010, 42, 1637–1646. [Google Scholar] [CrossRef]
- Ward, J.R.; Agamennoni, G.; Worrall, S.; Bender, A.; Nebot, E. Extending Time to Collision for probabilistic reasoning in general traffic scenarios. Transp. Res. Part C Emerging Technol. 2015, 51, 66–82. [Google Scholar] [CrossRef]
- Washington, S.; Karlaftis, M.; Mannering, F.; Anastasopoulos, P. Statistical and Econometric Methods for Transportation Data Analysis; Chapman and Hall: New York, USA, 2020. [Google Scholar]
- Anastasopoulos, P.C. Random parameters multivariate tobit and zero-inflated count data models: Addressing unobserved and zero-state heterogeneity in accident injury-severity rate and frequency analysis. Analytic Methods in Accident Research 2016, 11, 17–32. [Google Scholar] [CrossRef]
- Zheng, O. Developing a traffic safety diagnostics system for unmanned aerial vehicles usingdeep learning algorithms. University of Central Florida, 2019. [Google Scholar]
- Zheng, O.; Abdel-Aty, M.; Yue, L.; Abdelraouf, A.; Wang, Z.; Nada, M. CitySim: A Drone-Based Vehicle Trajectory Dataset for Safety Oriented Research and Digital Twins. 2022. [Google Scholar] [CrossRef]
- Osama, A.; Sayed, T.; Zaki, M.; Shaaban, K. Automated Approach for a Comprehensive Safety Assessment of Roundabouts. In Proceedings of the The 94th Annual Meeting of the Transportation Research Board, Washington, DC, USA, 11–15 January 2015. [Google Scholar]
- Guo, Y.; Sayed, T.; Zaki, M.H.; Liu, P. Safety Evaluation of Unconventional Outside Left-Turn Lane Using Automated Traffic Conflict Techniques. Can. J. Civ. Eng. 2016, 43. [Google Scholar] [CrossRef]
- Jalayer, M.; Shabanpour, R.; Pour-Rouholamin, M.; Golshani, N.; Zhou, H. Wrong-way driving crashes: A random-parameters ordered probit analysis of injury severity. Accid. Anal. Prev. 2018, 117, 128–135. [Google Scholar] [CrossRef] [PubMed]
- Christoforou, Z.; Cohen, S.; Karlaftis, M.G. Vehicle occupant injury severity on highways: An empirical investigation. Accid. Anal. Prev. 2010, 42, 1606–1620. [Google Scholar] [CrossRef] [PubMed]
Figure 2.
The position of two approaching vehicles in coordinate system.
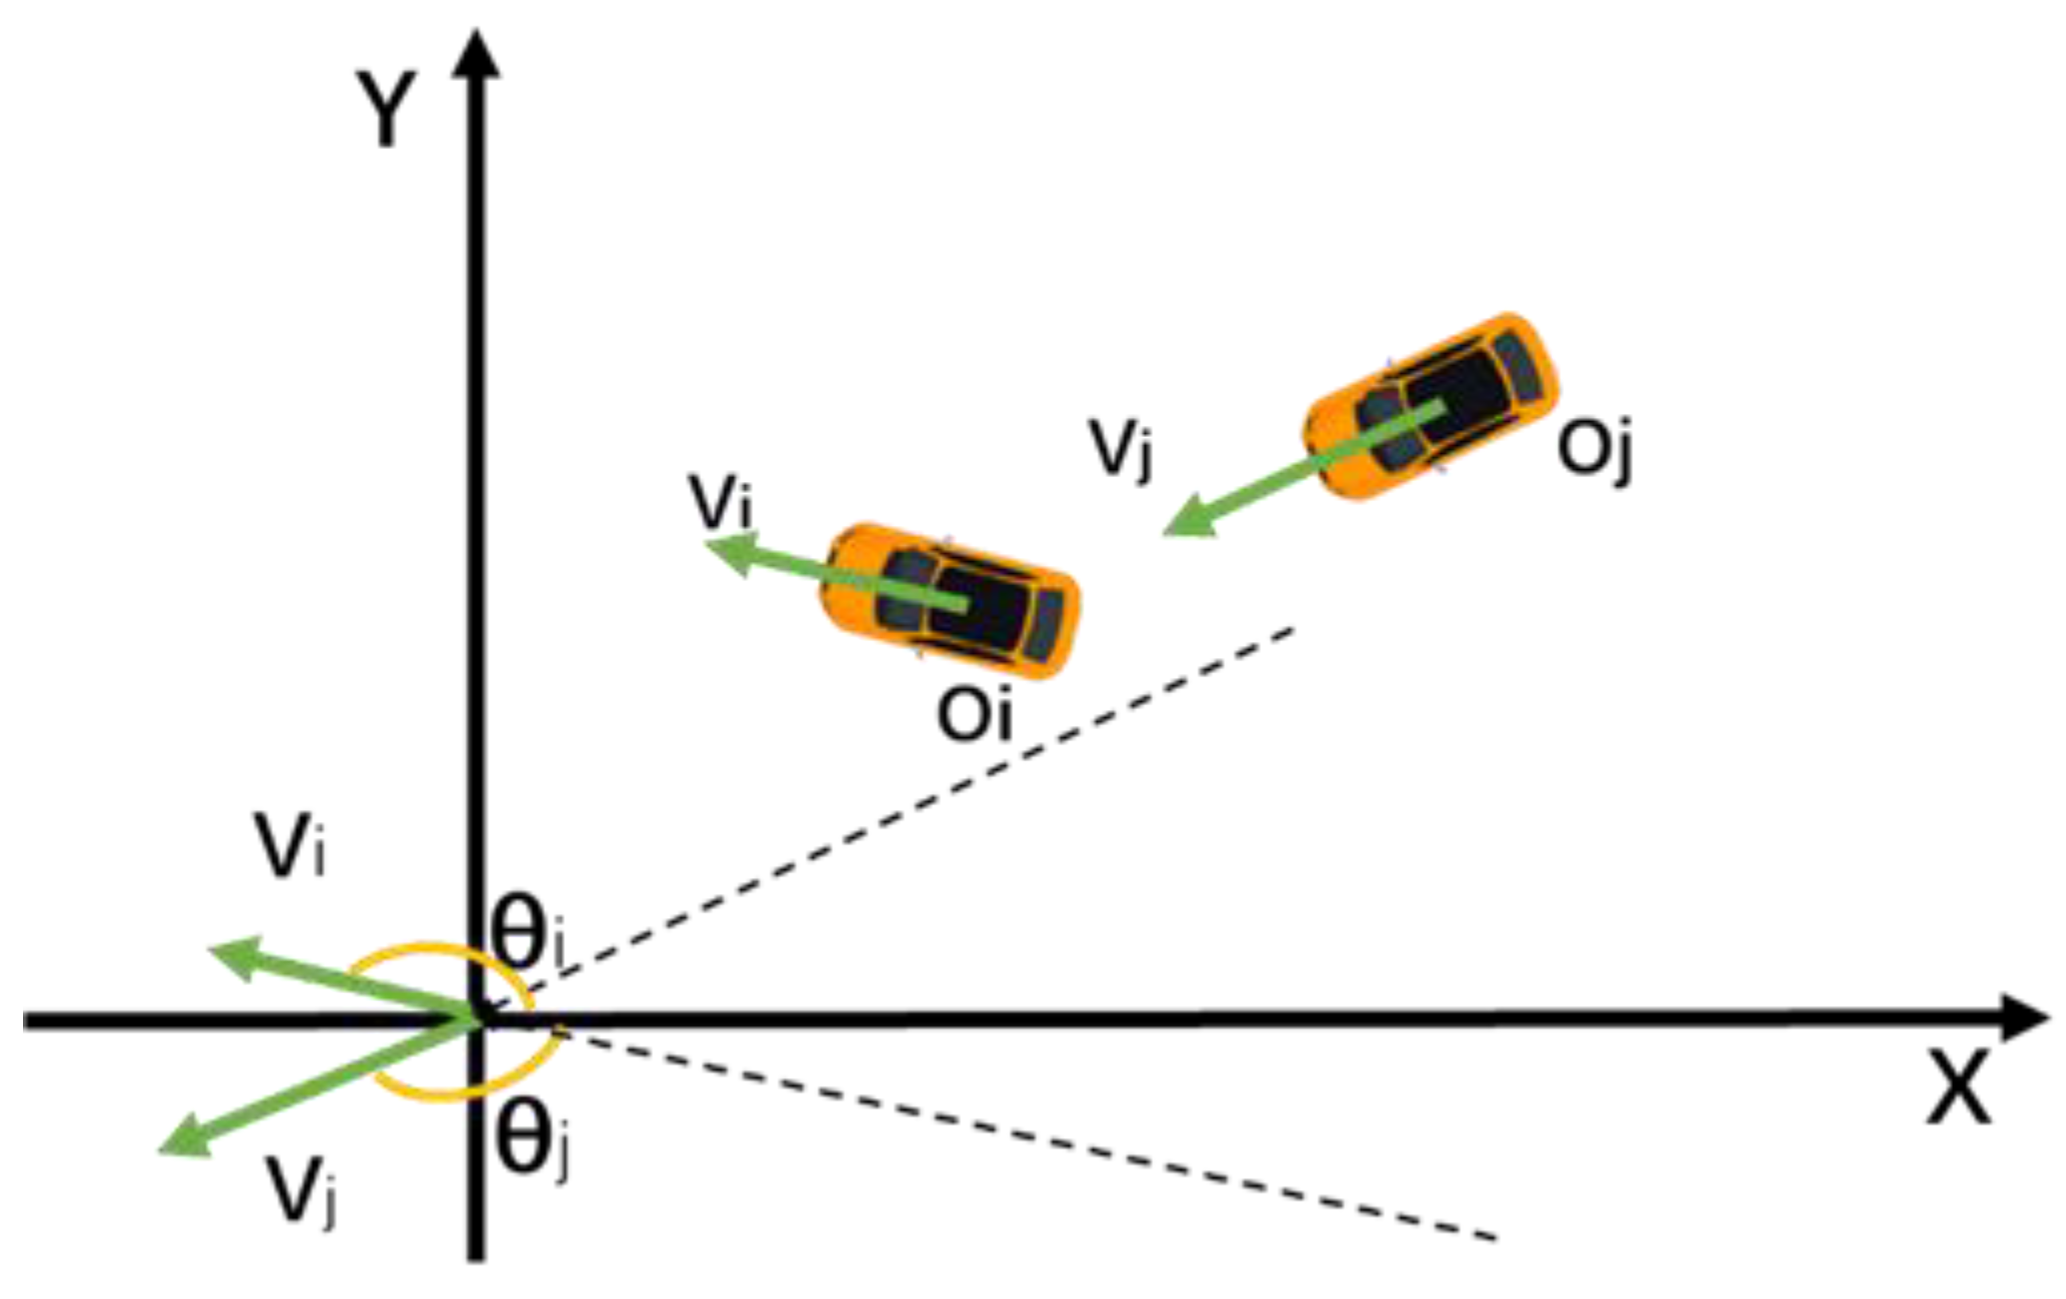
Figure 4.
Histogram of conflict risk levels identified by ETTC.
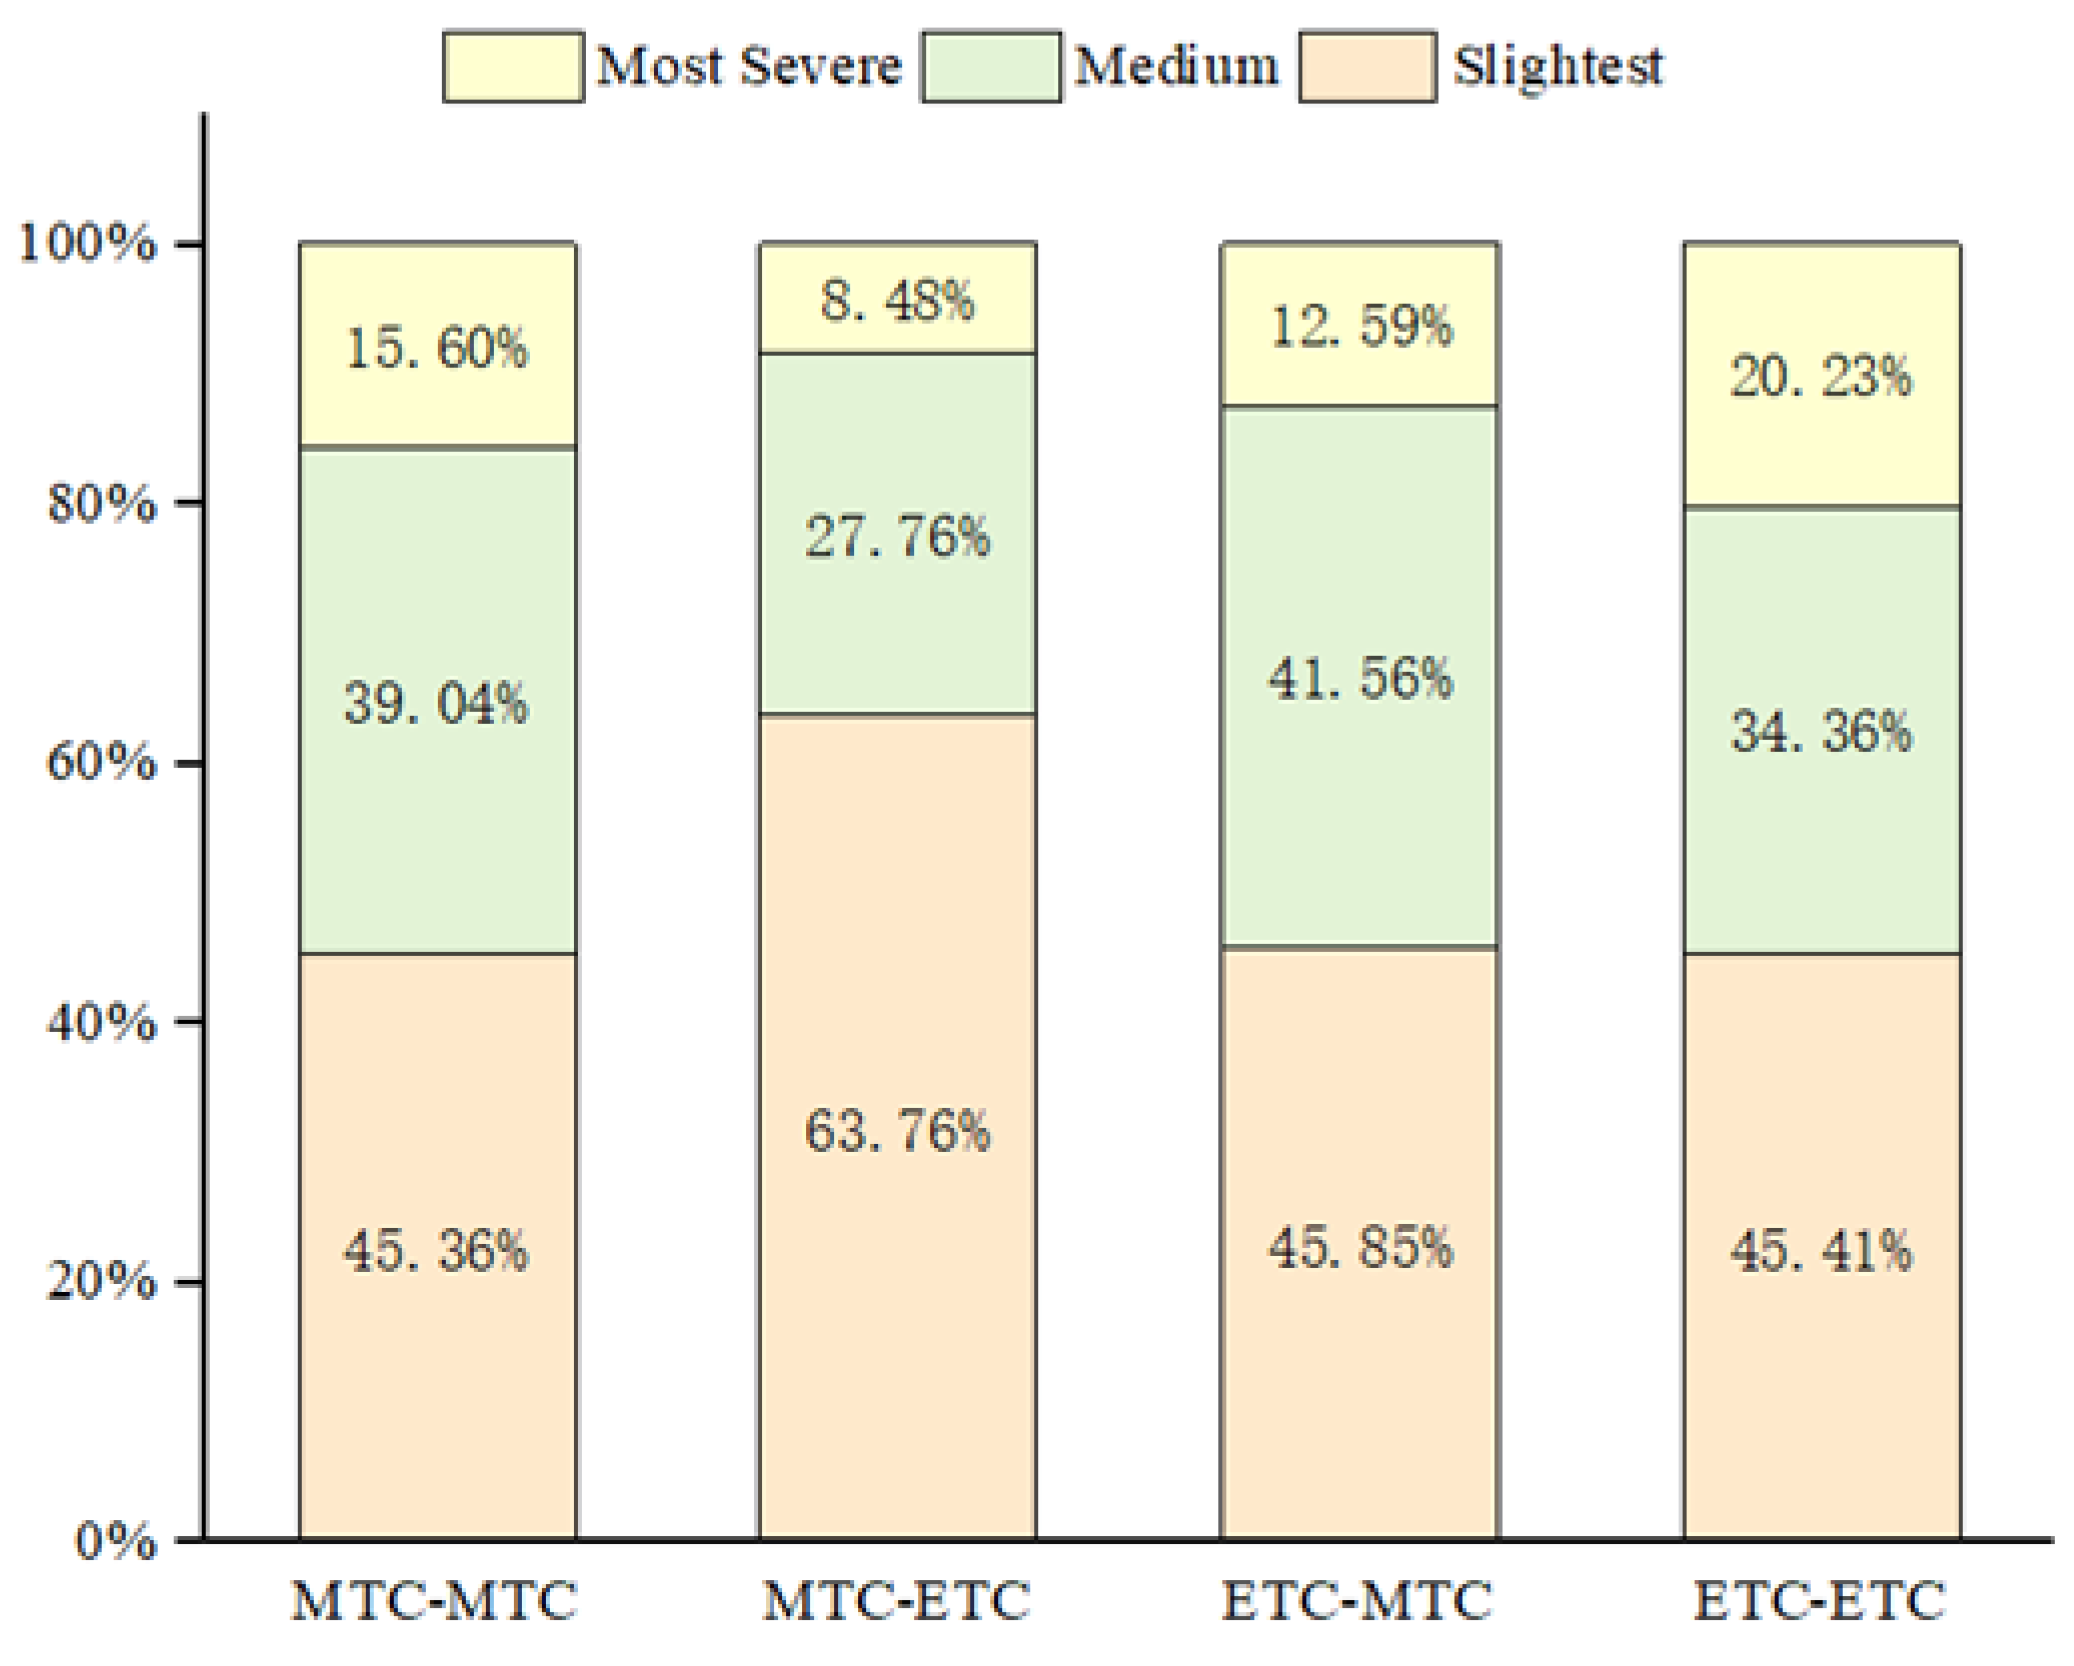
Table 2.
Likelihood ratio test results between different diverging areas (ETC-ETC model).
| y1 | y2 | ||
| D1(0-120m) | D2(120-240m) | D3(240-360m) | |
| D1(0-120m) | – | 22.918(8) | 27.420(14) |
| [99.65%] | [98.30%] | ||
| D2(120-240m) | 27.428(9) | – | 28.678(14) |
| [99.88%] | [98.85%] | ||
| D3(240-360m) | 23.748(9) | 25.475(8) | – |
| [99.53%] | [99.87%] |
Table 3.
Likelihood ratio test results between different diverging areas (ETC-MTC model).
| y1 | y2 | ||
| D1(0-120m) | D2(120-240m) | D3(240-360m) | |
| D1(0-120m) | – | 50.473(13) | 102.1(14) |
| [>99.99%] | [>99.99%] | ||
| D2(120-240m) | 25.011(11) | – | 40.862(14) |
| [99.09%] | [99.98%] | ||
| D3(240-360m) | 23.345(11) | 38.282(13) | – |
| [98.42%] | [99.97%] |
Table 4.
Likelihood ratio test results between different diverging areas (MTC-MTC model).
| y1 | y2 | ||
| D1(0-120m) | D2(120-240m) | D3(240-360m) | |
| D1(0-120m) | – | 36.378(14) | 30.849(15) |
| [99.90%] | [99.08%] | ||
| D2(120-240m) | 30.608(13) | – | 38.868(15) |
| [99.61%] | [99.93%] | ||
| D3(240-360m) | 37.190(13) | 54.555(14) | – |
| [99.96%] | [>99.99%] |
Table 5.
Likelihood ratio test results between different diverging areas (MTC-ETC model).
| y1 | y2 | ||
| D1(0-120m) | D2(120-240m) | D3(240-360m) | |
| D1(0-120m) | – | 36.236(13) | 41.594(14) |
| [99.95%] | [99.99%] | ||
| D2(120-240m) | 43.114(12) | – | 41.666(14) |
| [>99.99%] | [99.99%] | ||
| D3(240-360m) | 64.023(12) | 38.314(13) | – |
| [>99.99%] | [99.97%] |
Disclaimer/Publisher’s Note: The statements, opinions and data contained in all publications are solely those of the individual author(s) and contributor(s) and not of MDPI and/or the editor(s). MDPI and/or the editor(s) disclaim responsibility for any injury to people or property resulting from any ideas, methods, instructions or products referred to in the content. |
© 2023 by the authors. Licensee MDPI, Basel, Switzerland. This article is an open access article distributed under the terms and conditions of the Creative Commons Attribution (CC BY) license (http://creativecommons.org/licenses/by/4.0/).
Copyright: This open access article is published under a Creative Commons CC BY 4.0 license, which permit the free download, distribution, and reuse, provided that the author and preprint are cited in any reuse.


