
Submitted:
12 May 2023
Posted:
15 May 2023
You are already at the latest version
Abstract
Hydrogeological maps must synthesize the scientific knowledge about the hydraulic features and the hydrogeological behavior of a specific area, and, at the same time, they must meet the expectations of land planners and administrators. Thus, especially in complex interconnected systems, hydrogeological maps can be fully effective when they are purpose-designed. In these contexts, usual graphical approaches in creating hydrogeological maps could result uncomplete and/or ineffective. Therefore, in case of complex systems and/or specific management/protection aims, new and purpose-designed graphical solutions must be applied to enhance the maps effectiveness. In the case study, these solutions show and emphasize all the hydraulic interconnections playing significant roles in recharging the multilayered alluvial aquifer, where the majority of wells have been drilled for drinking/industrial/agricultural purposes, artificial channels are used for agricultural purposes, and the shallow groundwater feeds protected groundwater-dependent-ecosystems. The hydrogeological map was then designed to be the synthesis of three different and hydraulically interconnected main contexts: (i) the main heterogeneous alluvial aquifer (the main target of the purpose-designed map), (ii) the hydrographic basin of a losing river that feeds the main alluvial aquifer, and (iii) those hard-rock aquifers (mainly turbiditic and ophiolitic) whose springs feed the same river.
Keywords:
hydrogeological map
; interconnected surface-groundwater systems
; water resources management
1. Introduction
The natural aquifer recharge is potentially made of three different components: (i) the direct recharge, coinciding with the effective infiltration of local precipitation, (ii) indirect recharge, due to losing streams (or occasionally floods from rivers), (iii) indirect recharge, due to lateral inflow from adjacent upgradient aquifers. The existence of one or more of these components, as well as their proportions where they coexist, depend on (hydro)geological, hydrological and geomorphological features. When studying interconnected surface- and ground-water systems in wide areas, the groundwater availability in the downgradient aquifer is the net balance between the total input coming from all the components and the total output from each portion of the interconnected system. As a consequence, in agreement with the general suggestions of Struckmeier and Margat [1], when making hydrogeological maps in these hydraulically interconnected systems, graphic solutions must be used to allow “scientists” and “non-scientists users” (planners and administrators) to find the information they need to solve problems (applied science) or make decisions (planning and administration), taking also into account the possible cause-effect relationships at system scale. In synthesis, hydrogeological maps must synthesize the scientific knowledge about the hydraulic features and the hydrogeological behavior of a specific area, and, at the same time, they must meet the expectations of the map users, who must find (fast and easy enough) the particular information they need to avoid experiencing negative domino effects when managing water resources in this sort of “basin-in-series” systems. Thus, especially in complex interconnected systems, hydrogeological maps can be really and completely effective when they are purpose-designed. This approach in designing hydrogeological maps is of utmost importance in areas where the same water resources have an ecological relevance (e.g., in case of groundwater-dependent-ecosystems [GDEs]) and are utilized for human purposes.
Based on these considerations, the main aim of the present work was to find solutions for reconstructing purpose-designed hydrogeological maps involving complex surface-groundwater systems, were multiple uses and values are associated to water resources. The choice of the test area felt on the wide system belonging to the Parma alluvial aquifer and the Taro River basin. From the hydrogeological point of view, it is characterized by several hard-rock mountain aquifers and a flat heterogeneous alluvial aquifer, as well as a losing river. On the other hand, at this site water resources flowing within the heterogeneous alluvial aquifer feeds GDEs and are utilized for drinking, industrial and agricultural purposes. In agriculture, intensive models prevail in the flat areas, while organic techniques and protected areas, regional and national parks are prevalent within the mountainous Apennines (e.g., [2]). Some mountainous agri-food products (e.g., Parma Ham, Parmigiano Reggiano cheese; mushrooms from Borgotaro) have Designation of Origin (PDO) and Protected Geographical Indication (PGI) labels (e.g., [3]), while others are traditional products linked to ancient varieties of animals and plants for which there is an increasing interest in the specific market [4,5]. Industrial activity in Parma is strongly oriented towards the agro-alimentary sector (e.g., large-scale pasta and baked goods, and dairy manufacturers which are world leaders in their sectors). The leading role of Parma industry is also linked to the production of food machinery, packaging and preservation machines and equipment. Other industrial sectors belong to personal care and well-being, such as for example pharmaceuticals and perfumery [6].
2. Study Area
The research was carried out in the hydrogeological basin of the Taro River and in the connected alluvial aquifer developing from the northern Apennine margin to the Parma plain (Northern Italy; Figure 1). The Northern Apennines are a fold-and-thrust belt composed of a pile of NE-verging tectonic units that developed as a consequence of Cenozoic collision between the European plate (Corso–Sardinian block) and the Adria plate. The tectonic units belong to the Ligurian, Tuscan and Umbria-Romagna domains. The Ligurian units represent the uppermost tectonic units in the Apennine nappe pile and correspond to allochthonous terrains originally deposited in an oceanic realm (the Ligurian–Piedmontese sector of the Alpine Tethyan ocean) composed of ophiolites and their Jurassic to Eocene sedimentary cover. These units tectonically overlie the Tuscan and Umbria-Romagna units, originally deposited on the passive margin of the Adria Plate since the middle Triassic to early Cretaceous and on convergent to collisional margin since middle Cretaceous till present, consist of a lower succession of carbonate rocks of Mesozoic–Cenozoic age and an upper thick succession of siliciclastic foredeep sediments of Oligocene–Miocene age [7,8]. During orogenetic uplift from the Eocene to the Messinian, episutural and wedge-top basins were set on top of the Ligurian units, giving rise to the Epiligurian Succession.
From the Messinian to the present, at the front of the chain, the Po Basin represents the northern Apennines foredeep, nowadays filled by Plio-Pleistocene turbidite and deltaic syntectonic marine-regressive sequences, heavily influenced by the uplifts of the several thrust fronts buried under the plain [7,9,10]. As well as the upper Emilia-Romagna plain and Apennine foothills, Parma plain is mostly characterized by this marine-to-continental regressive sedimentary succession. The sequence of units (or synthems sensu [11]) is characterized at the base by hectometric thicknesses of Pliocene clay marine sediments above which, progressively more continental deposits from shallow marine and fan-deltas to today’s plains and foothill alluvial fans, discordantly overlapped during Pleistocene till the present (Figure 2).
Due to their different lithological composition, geological units of the study area may have different hydrogeological behaviors, studied by several works over the entire Apennines and Po Plain as extensively reported in the specific sections below.
3. Hydrogeological sub-systems
The main sub-systems within the study area are several hard-rock aquifers and one large heterogeneous alluvial aquifer. Hard-rock aquifers are made mainly of ophiolitic rocks or turbiditic (carbonate and siliciclastic) successions. From the hydrogeological point of view, the alluvial aquifer is downstream with reference to the hard-rock aquifers. Nevertheless, there is no direct groundwater inflow from ophiolitic or turbiditic aquifers towards the alluvial one, due to the interposition of Pliocene clay marine sediments (Figure 2 and Figure 6). The alluvial aquifer is recharged directly, through the effective infiltration of local precipitation, and indirectly, through the Taro losing river.
Ophiolitic aquifers in the Italian Apennine chain are characterized by ([13,14,15]; Figure 3] hydraulic compartmentalization due to one or more of these factors: (i) low-permeability fault cores, that partially or totally impede groundwater flow, (ii) displacement of the aquifer bottom, due to faulting. In some cases, ophiolitic rocks are characterized by vertical heterogeneity, therefore causing the coexistence of shallow perched temporary groundwater and deeper groundwater [13,16].
Turbiditic aquifers of the Italian Apennine chain are mainly or exclusively made of sandstones and/or marls. From the hydrogeological point of view, they belong to three main conceptual models.
In some cases, they are characterized by significant vertical heterogeneity, due to stress release fracturing and/or weathering that enhance rock permeability in the near-surface bedrock ([17,18]; Figure 4). In this case, the upper bedrock is characterized by relatively high hydraulic conductivity (in the order of 10-6 m/s; [18]) that allows significant groundwater recharge and flow. Differently, the deeper bedrock is characterized by very low hydraulic conductivity (in the order of 10-8 m/s; [18]) and groundwater flow is more significant within possible networks of damage zones associated to faults.
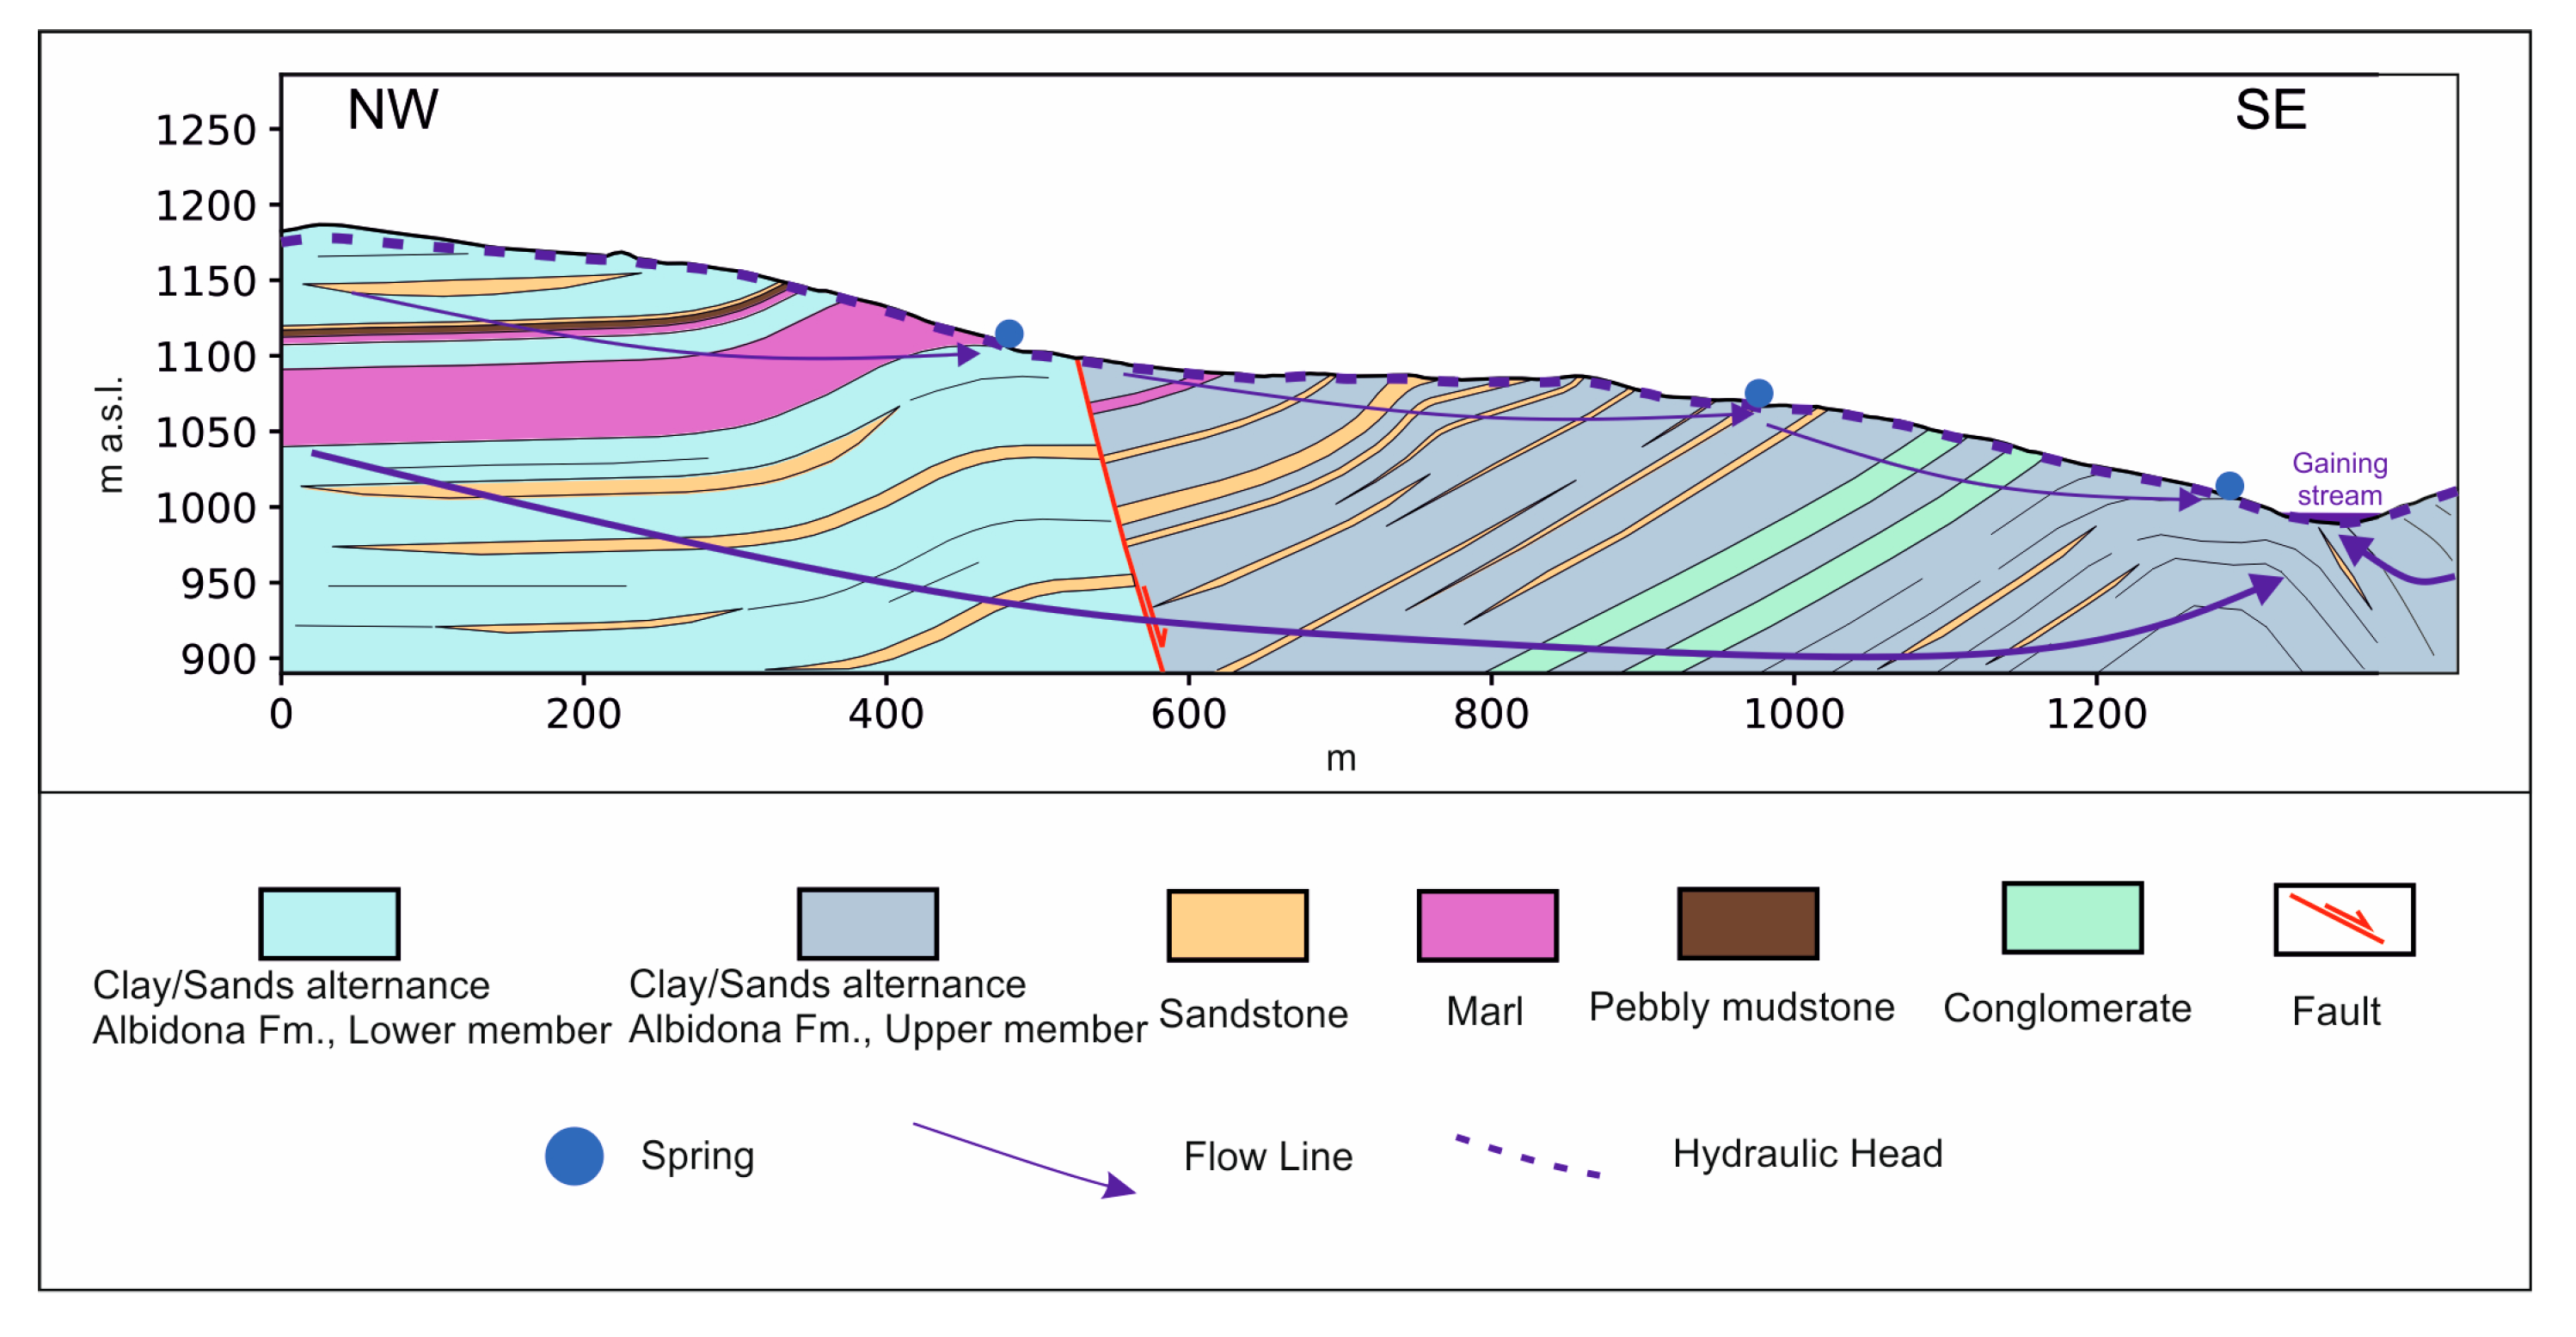
In other contexts, post-depositional processes increased rock permeability of larger volumes, due to fracture development in the competent layers. Within these successions, there is no contrast in permeability with depth, between a shallower and a deeper bedrock, and a unique groundwater flows in a low-permeability continuum at basin scale. Despite the significant heterogeneity of the medium, the basin scale hydraulic continuity is probably due to fracture networks associated to folds and faults, that break the lower-permeability layers, therefore minimizing the aquiclude role potentially played by each one of these layers ([19]; Figure 5).
The main features of the two models described above sometimes coexist and are further complicated by landslide processes, converging in a third conceptual model. In that case, a unique groundwater flows in a low-permeability continuum at basin scale, but significant layered heterogeneity causes the whole system to be characterized by the coexistence of fast and shallow pathways, and deeper and more prolonged ones [20]. As demonstrated merging hydrogeological, microbial and zoological data in a test site [21,22], rapid percolation is observed in the near-surface unsaturated zone, and fast groundwater flow is observed in the shallow bedrock. Differently, within the deeper bedrock, heterogeneities can cause a significant variation of the hydraulic head with depth [23], and the lower permeability causes the slowdown of groundwater flow. The variation in flow velocities and residence times within the whole heterogeneous system can be further emphasized by very low permeability slip surfaces of landslides, that sometimes act as permeability barriers, as demonstrated by Petrella et al. [24] within the study area.
In the wider context of all the hard-rock aquifers, significant groundwater exchange is then possible between adjacent aquifers of the Apennine chain. However, at this stage, no detailed studies have been carried out on this topic, and purpose-designed investigations must be developed in the near future.
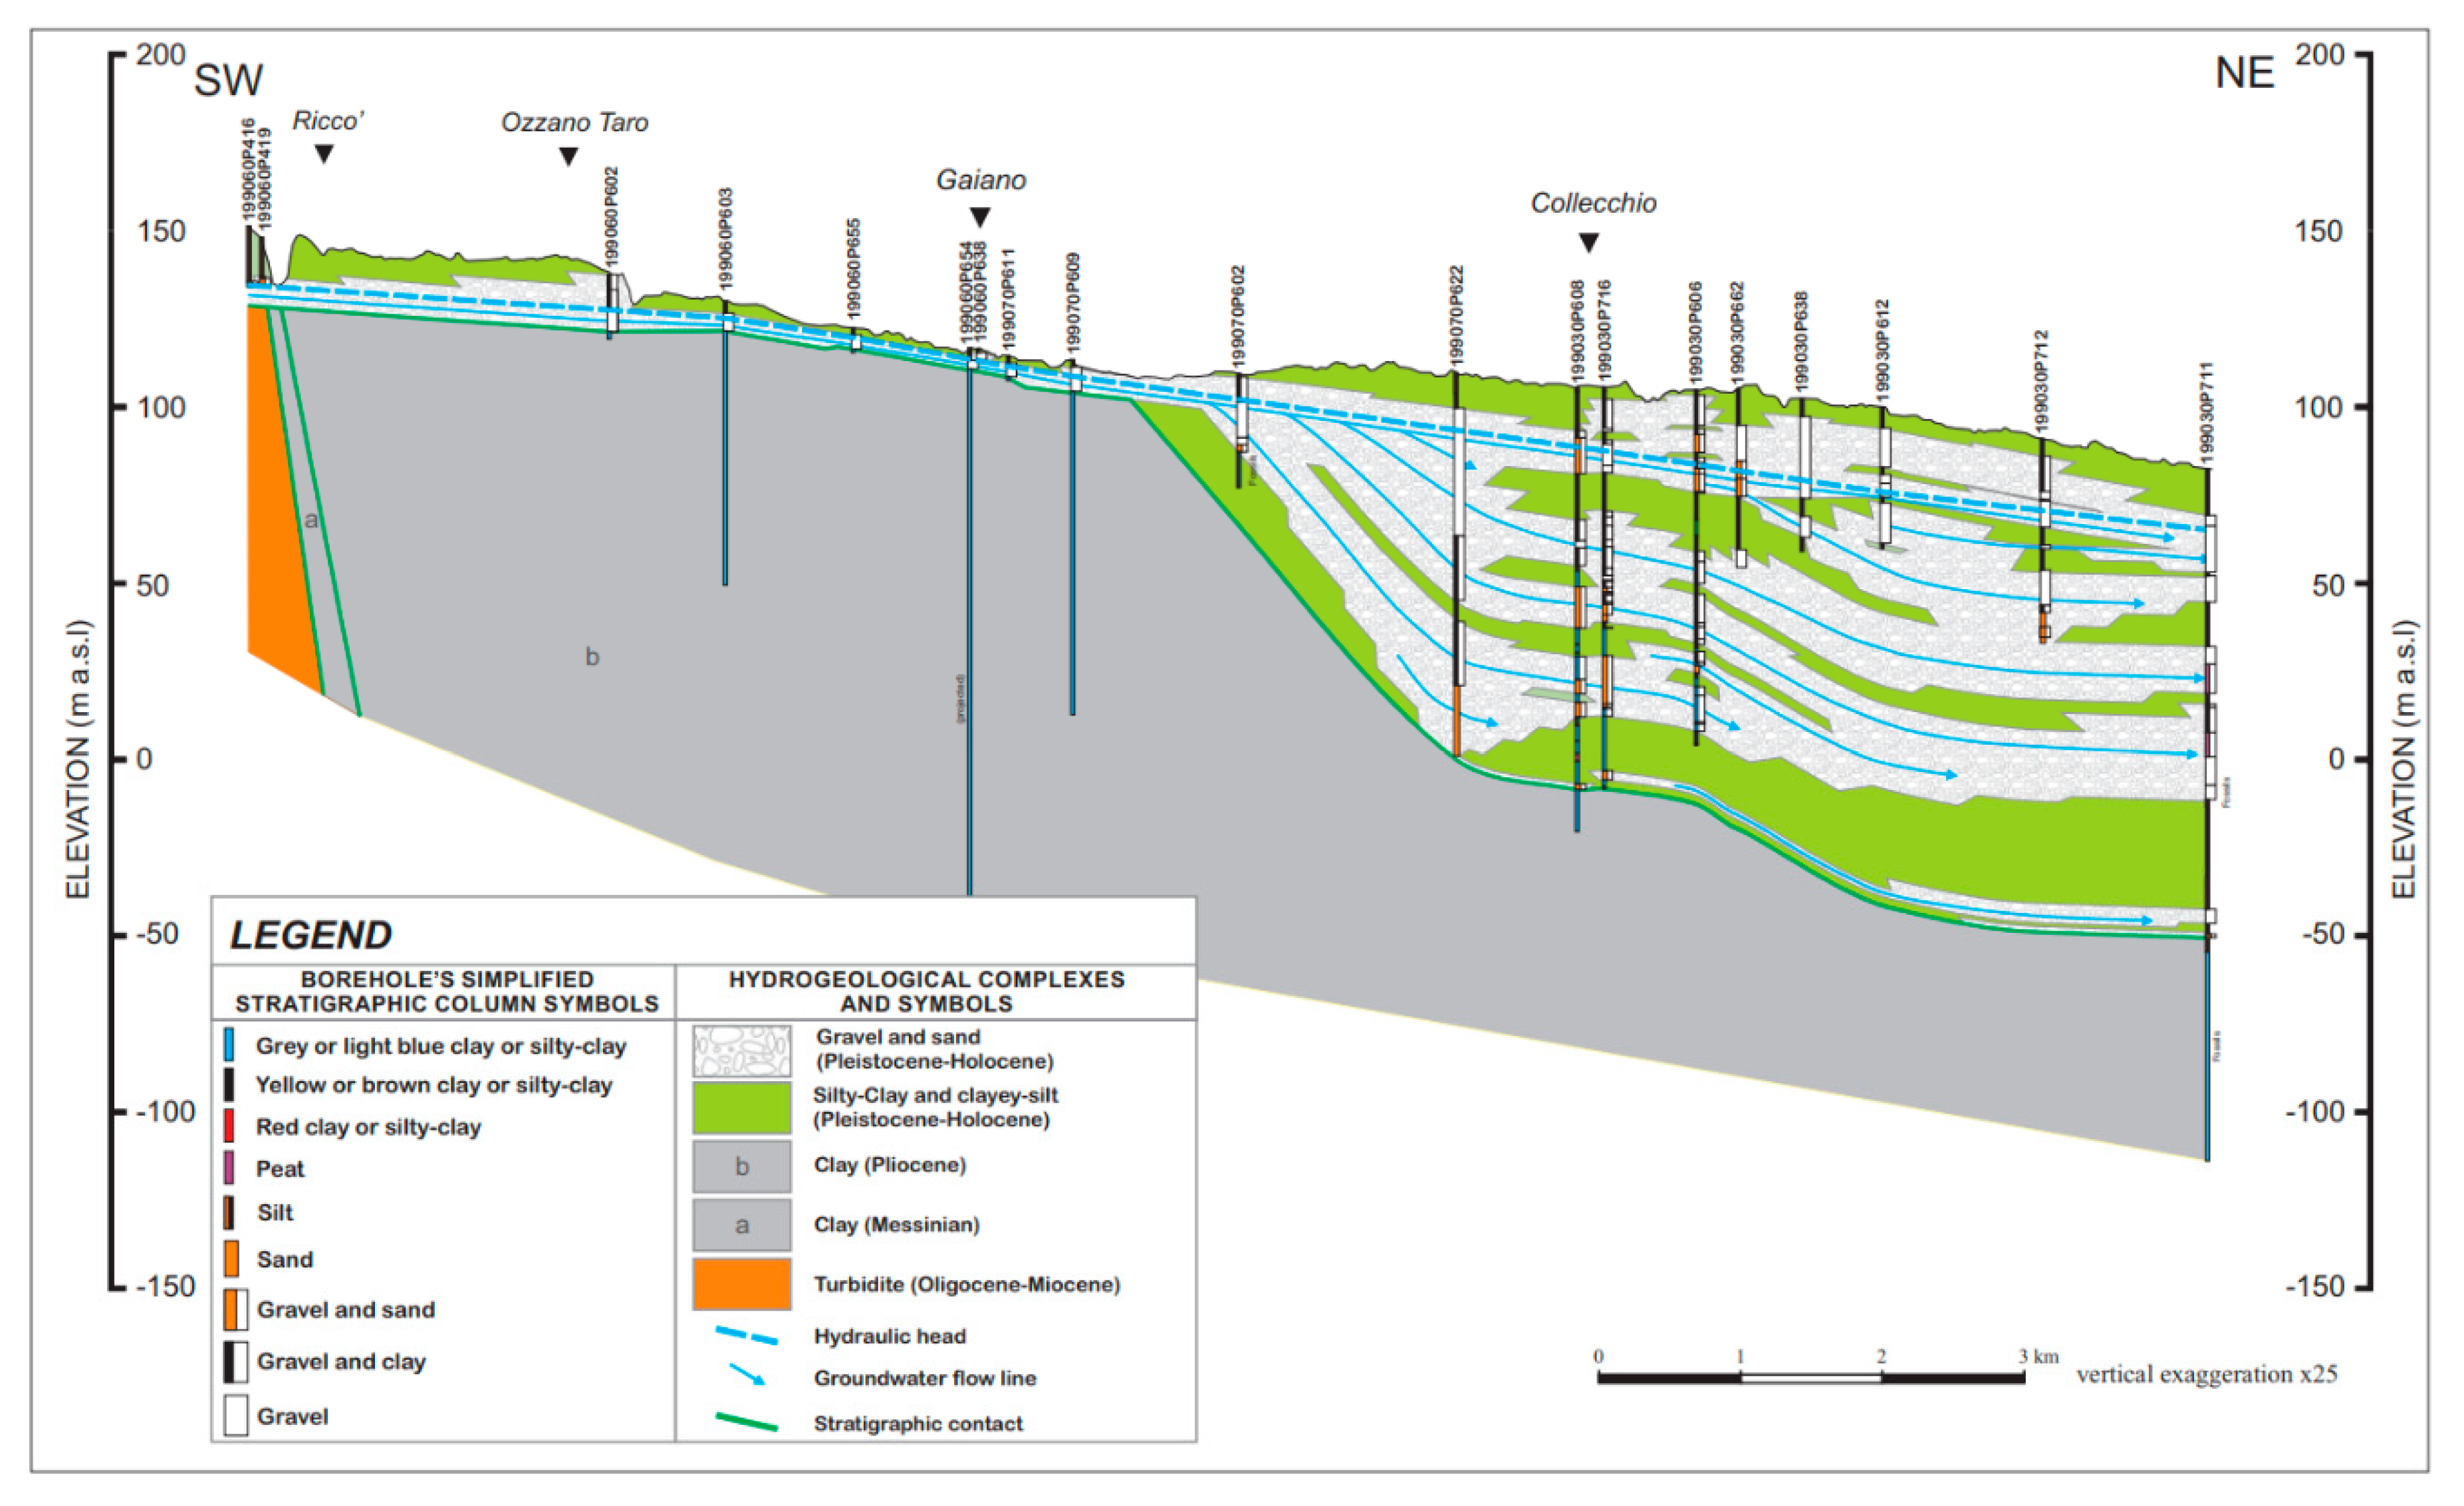
The alluvial aquifer corresponds to the Pleistocene alluvial synthem, lithologically defined by alternating gravels, sands, silts, and silty clays, and generated in the area by the depositional dynamics of the ancient Taro River. At the bottom of the succession, the high thickness of Pliocene marine clays is considered as an extensive regional-scale aquiclude [25]. The contact between the heterogeneous aquifer and bottom aquiclude corresponds to the Pliocene-Pleistocene boundary and is characterized by several undulations, due to Apennine tectonic compressive action and subsequent erosion. In the southern end of this aquifer, the alluvial terrace of the Taro River (most recent unit in the area) is settled with a stratification parallel to the topographic plane. Moving towards the valley (to the north), a fan of gravel-sand-silt strata opens in depth, with gradually smaller angles of inclination as the more recent depositions originated it. The resulted geometric and physical feature of the aquifer arrangement validated its syntectonic nature, contemporaneous with the Apenninic tectonics activations (Figure 6). The groundwater flows from southwest to northeast at a basin scale (e.g., [26]) and is recharged by the local effective infiltration and the Taro river waters [26,27,28,29,30]. Concerning the hydraulic properties of the system, Zanini et al. [26,29] calculated a hydraulic conductivity varying from 1.2 x 10⁻⁵ to 4.9 x 10⁻⁵ m/s (mean 2.3 x 10⁻⁵ m/s; median 1.7 x 10⁻⁵ m/s) in coarse-grained horizons, and from 9.3 x 10⁻⁹ to 1.3 x 10⁻⁷ m/s (mean 1.6 x 10⁻⁷ m/s; median 9.7 x 10⁻⁸ m/s) in fine-grained layers. The abundance of silt and fine sands, instead of clay, in the outcropping fine-grained layers [30] causes the groundwater to be semi-confined in some sub-areas.
In the Northern end of the study area, the shallow groundwater feeds the so-called fontanili [26,32,33], that are small, semi-artificial, aquatic ecosystems (sensu [34]). These GDEs are typical of the whole Po River basin, which is the largest Italian watershed. As demonstrated by Severini et al. [30], they are indirectly recharged also by the losing Taro river.
In the wide context of the whole interconnected system, the losing river causes the heterogeneous alluvial aquifer to be indirectly recharged by the whole hydrographic basin of the Taro, including surface runoff and groundwater of those hard-rock aquifers whose springs flow out into the Taro river basin. The influence of Taro surface waters on the recharge of the alluvial aquifer is further emphasized by a network of losing artificial open channels used for agricultural purposes (Figure S1).
Figure 6.
Hydrogeological section showing arrangement of hydrogeological sub-systems at the contact between Apennines chain and Parma plain.
Figure 6.
Hydrogeological section showing arrangement of hydrogeological sub-systems at the contact between Apennines chain and Parma plain.
4. Materials and Methods
Starting from the lithological composition of geological units composing this sector of Apennines and Plains, four hydrogeological sub-systems were divided at the basin scale. Official geological mapping (from ISPRA, Regione Emilia-Romagna and Provincia di Parma), supplemented by outcrop inspections and related scientific literature, have formed the main basis for the distinction. To each single geological unit an expected hydraulic behavior was attributed and (i) ophiolitic, (ii) turbiditic, (iii) alluvial and (iv) pelitic sub-systems were defined as the main hydrogeological domains at the study area scale.
After the initial conceptual subdivision, the hydrogeological map was produced in order to spatialize these different sub-systems identified in the Taro River hydrographic (and hydrogeological) basin area. Mapping was executed with Corel Draw graphic software and the combination of multiple geological units has necessitated constant comparison with official geological cartography to accurately represent the contacts between the defined hydrogeological sub-systems. Topographic chart has been used as the geographical reference base of the map so as to locate major population centers and anthropogenic structures potentially sources of impact. Geomorphological landforms (landslides, debris, colluvium, etc.) were mostly incorporated to the unit on which they were formed.
The boundary of the Taro River hydrogeological basin has been defined according to topography, surface drainage network and extension of aquifer hydrogeological sub-systems.
Once the representation of subsystems was completed, all the symbols capable of providing hydrogeological insights on the large scale were included in the map.
To improve subsurface information, a section (Figure 6) reconstructed during the present research was based on a re-interpretation (in a hydrogeological perspective) of stratigraphic profiles derived from the published database by Regione Emilia-Romagna. At first, after an accurate selection of the aforementioned subsurface data, the stratigraphic section was constructed having orthogonal direction to the Apennine front (SW-NE), in order to obtain a self-constructed perspective of the geological (and hydrogeological) context at the regional scale, considering the nodal zone of the Apennine to Parma Plain transition.
5. Hydrogeological mapping strategy and solutions
Usual graphical approaches in creating hydrogeological maps could result uncomplete and/or ineffective when working on interconnected aquifer systems, where the groundwater pumped for human purposes and feeding GDEs is recharged through direct (local effective infiltration) and indirect processes (losing streams, lateral underground inflow from upgradient aquifers). Therefore, according to other authors (e.g., [14]), in case of complex systems and/or specific management/protection aims, new and purpose-designed graphical solutions must be applied to enhance the maps effectiveness. In the case study, these solutions show and emphasize all the hydraulic interconnections playing significant roles in recharging the multilayered alluvial aquifer, where the majority of wells have been drilled for drinking/industrial/agricultural purposes, artificial channels are used for agricultural purposes, and the shallow groundwater feeds protected GDEs. The hydrogeological map was then designed to be the synthesis of three different and hydraulically interconnected main contexts: (i) the main heterogeneous alluvial aquifer (the main target of the purpose-designed map), (ii) the hydrographic basin of the Taro river (the losing river that feeds the main alluvial aquifer), and (iii) those hard-rock aquifers (mainly turbiditic and ophiolitic), within the Apennine chain, whose springs feed the Taro river. As per the interconnection between surface- and ground-waters within the alluvial plain, a dedicated sketch was added to the main map in order to clearly show the network of artificial channels utilized for agricultural purposes.
Since numerical models are increasingly implemented in hydrogeological studies finalized to protect, use and manage water resources, the map was also designed to be easily used for modelling purposes, by emphasizing also (through a second dedicated sketch) the “no-flow boundary” and the “aquifer bottom”, both corresponding to the Pliocene clay marine sediments that act as (i) hydraulic barrier between the hard-rock aquifers and the alluvial aquifer, and (ii) the base of the whole heterogeneous alluvial succession.
In light of the multiple hydraulic interconnections existing within the whole test system and the significant layered heterogeneity of the main alluvial aquifer, the hydrogeological map must be linked to one hydrogeological section, at least. This section was reconstructed so as to be able to (i) show the main heterogeneities within the aquifer system (both layered and discontinuous), (ii) visualize the coexistence of shallower and deeper groundwater, (iii) emphasize the hydraulic interconnections between sub-systems, and (iv) suggest the coexistence of groundwater pathways with different mean residence time.
6. Discussion and Conclusions
The purpose-designed hydrogeological map tested at the study area (i) provides effective and partially new graphical solutions to describe the main hydrogeological features and processes characterizing a complex surface-groundwater interconnected system and (ii) points out several important aspects that meet the needs of the hydrogeologists and the expectations of the map users (with emphasis on planners and administrators).
In the latter case, this type of map can be used, for example, as a basis for reconstructing reliable vulnerability maps, in the perspective of groundwater and GDEs protection against pollution (taking into consideration both direct and indirect contamination sources). As a matter of fact, the test study highlights that the large alluvial aquifer (whose groundwater feeds GDEs and is used to support the economic growth of one of the most important industrial areas in Italy and Europe) is vulnerable to contaminants coming also from the wider upgradient Apennine chain, due to the indirect hydraulic connection via Taro river. Even if the Parma Apennines are mainly characterized by organic agriculture and protected areas, they could be also of interest for a new mining exploitation, taking into consideration the progressive increase of metals and minerals demand from lithium-ion batteries. This is the case, for example, of the abandoned Corchia mining district, that can be defined as mixed sulphides (mostly Cu-bearing) ore deposit set into ophiolitic aquifers. As a matter of fact, mining activities can produce several types of wastes, such as wastewaters, and have long-lasting and profound negative effects on the downstream receiving aquatic environments (e.g., [35,36,37,38,39,40,41,42]). Therefore, there is the urgent need to learn from historical mine pollution issues in order to avoid the negative environmental impacts of new mining activities in the future. This goal can be achieved by understanding how potential mine pollution could be transported from its source through a downstream catchment, and purpose-designed hydrogeological maps give this information to planners and administrators. In this vulnerability perspective, the hydrogeological mapping strategy and solutions here proposed are able to suggest, for example, that Corchia mine reactivation would cause serious environmental damages in the wide interconnected aquatic ecosystem (to groundwater and GDEs), in case of contaminants release. At the same time, this map will be used to plan and carry out more detailed studies that can help understanding and estimating (i) the magnitude of expected impact of the possible Corchia mine reactivation, (ii) the transport time between the potential contamination source and each of the subsystems coexisting at the system scale, (iii) the influence of pumping activities within the heterogeneous alluvial aquifer on the underground contaminant migration pathways.
On the other hand, the same mapping strategy and solutions are of utmost importance (i) in managing and optimizing water resources abstraction for human purposes (as obvious), as well as (ii) when carrying out effective water-energy-food-land-climate nexus studies (WqEFLC nexus, sensu [43]), for sustainable development goals. For example, an effective WqEFLC nexus study must take into consideration also the layered heterogeneity of an alluvial aquifer. In fact, in that scenario, the groundwater can be pumped through wells drilled and screened at different depths, therefore requiring lower or higher energy demand. As per climate change, in particular, showing graphically the hydraulic interconnections between different sub-systems that coexist in a wide area, allows understanding (in a rapid and easy way) that water availability, as well as the integrity of specific GDEs, in a specific subsystem are both influenced also by climate modifications circumscribed to upstream sub-basins. Therefore, in hydrogeological settings where a changing climate has been already verified at regional scale (e.g., [44,45] at the study area), more detailed climate studies should be planned in order to refine this type of cause-effect relationship.
Even in terms of sustainable development goals, this type of hydrogeological map can be utilized to measure the gross ecosystem product (GEP), which summarizes the value of the contribution of an ecosystem to the economic activity of an area, by evaluating the ecosystem services in a single monetary metric [46]. As known, this approach can take into consideration the contribution of Nature to economic growth and human well-being, differently from the conventional gross domestic product (GDP).
In a wider context, the approach here proposed can be applied worldwide, also in hydrogeological settings made of different lithologies. As a matter of fact, the solutions tested with this map can be used in an easy way in those systems where different factors cause a large aquifer system to be hydraulically interconnected.
Supplementary Materials
The following supporting information can be downloaded at the website of this paper posted on Preprints.org., Figure S1: Hydrogeological Map of the Interconnected Surface-Groundwater System of Parma Alluvial Aquifer and Taro River Basin;
Author Contributions
Conceptualization, R.P., A.F., A.R. and F.C.; methodology, R.P., A.F. and F.C.; software, R.P, A.F and F.C., validation, R.P., A.F., A.R. and F.C.; writing and reviewing the draft, R.P., A.F., A.R. and F.C. All authors have read and agreed to the published version of the manuscript.
Funding
This research received external funding from Provincia di Parma.
Data Availability Statement
“Regione Emilia Romagna Borehole’s Database” at https://servizimoka.regione.emilia-romagna.it/mokaApp/apps/geg/index.html; “Regione Emilia Romagna Water Springs” at https://servizimoka.regione.emilia-romagna.it/mokaApp/apps/rocce_magazzino/index.html. “Regione Emilia Romagna Geological Cartography - Webgis” at https://ambiente.regione.emilia-romagna.it/it/geologia/cartografia/webgis-banchedati/webgis; “ISPRA Geological Cartography at a scale of 1:50.000” at https://www.isprambiente.gov.it/Media/carg/; “Provincia di Parma PIAE” at http://www.provincia.parma.it/provincia/servizi-e-uffici/servizio-pianificazione-territoriale/ufficio-attivit%C3%A0-estrattive-0; “Consorzio Bonifica Parmense irrigation canal network” at https://portale.bonifica.pr.it/map/lizmap/www/index.php/view/map/?repository=pubblica&project=web
Acknowledgments
This research benefited from the equipment and framework of the COMP-R Initiative, funded by the ‘Departments of Excellence’ program of the Italian Ministry for University and Research (MUR, 2023–2027).
Conflicts of Interest
The authors declare no conflict of interest.
References
- Stuckmeier, W.F.; Margat, J. Hydrogeological Maps. A Guide and a Standard Legend. 1995. Intemational Association of Hydrogeoiogist, Contributions to Hydrogeology, Cerlag Heinz Heisse. Hannover. Vol.17, 170p.
- Mancini, M.C.; Arfini, F.; Guareschi, M. When Higher Education Meets Sustainable Development of Rural Areas: Lessons Learned from a Community–University Partnership. Soc. Sci. 2022, 11, 338. [Google Scholar] [CrossRef]
- Arfini, F.; Cozzi, E.; Mancini, M.C.; Ferrer-Perez, H.; Gil, J.M. Are Geographical Indication Products Fostering Public Goods? Some Evidence from Europe. Sustainability 2019, 11, 272. [Google Scholar] [CrossRef]
- Mancini, M.C.; Donati, M. Local Agri-Food Systems in a Global World: Market, Social and Environmental Challenges; Cambridge Scholars Publishing: Cambridge, UK, 2012. [Google Scholar]
- Mancini, M.C.; Consiglieri, C. Innovation and marketing strategies for PDO products: The case of “Parmigiano Reggiano” as an ingredient. Bio-Based Appl. Econ. J. 2016, 5, 153–174. [Google Scholar]
- Parma Manifactures Associations, 2020. Parma and its Enterprises. www.upi.pr.it.
- Conti, P.; Cornamusini, G.; Carmignani, L. An outline of the geology of the Northern Apennines (Italy), with geological map at 1:250,000 scale. Ital. J. Geosci. 2020, 139, 149–194. [Google Scholar] [CrossRef]
- Boccaletti, M.; Corti, G.; Martelli, L. Recent and active tectonics of the external zone of the Northern Apennines (Italy). Int. J. Earth Sci. 2010, 100, 1331–1348. [Google Scholar] [CrossRef]
- Fantoni, R.; Franciosi, R. Tectono-sedimentary setting of the Po Plain and Adriatic foreland. Rendiconti Lince- Sci. Fis. e Nat. 2010, 21, 197–209. [Google Scholar] [CrossRef]
- Livani, M.; Scrocca, D.; Arecco, P.; Doglioni, C. Structural and Stratigraphic Control on Salient and Recess Development Along a Thrust Belt Front: The Northern Apennines (Po Plain, Italy). J. Geophys. Res. Solid Earth 2018, 123, 4360–4387. [Google Scholar] [CrossRef]
- Salvador, A. International stratigraphic guide: A guide to stratigraphic classification, terminology, and procedure; (No. 30); Geological Society of America: Boulder, CO, USA, 1994. [Google Scholar]
- Martelli, L.; Calabrese, L.; Ercolessi, G.; Molinari, F.C.; Severi, P.; Bonini, M. The New Seismotectonic Map of the Emilia-Romagna Region and Surrounding Areas. 2017. Atti del 36° Congresso del Gruppo Nazionale di Geofisicxa della Terra Solida, 14-16.
- Segadelli, S.; Vescovi, P.; Ogata, K.; Chelli, A.; Zanini, A.; Boschetti, T.; Petrella, E.; Toscani, L.; Gargini, A.; Celico, F. A conceptual hydrogeological model of ophiolitic aquifers (serpentinised peridotite): The test example of Mt. Prinzera (Northern Italy). Hydrol. Process. 2016, 31, 1058–1073. [Google Scholar] [CrossRef]
- Segadelli, S.; Vescovi, P.; Chelli, A.; Petrella, E.; De Nardo, M.T.; Gargini, A.; Celico, F. Hydrogeological mapping of heterogeneous and multi-layered ophiolitic aquifers (Mountain Prinzera, northern Apennines, Italy). J. Maps 2017, 13, 737–746. [Google Scholar] [CrossRef]
- Segadelli, S.; Filippini, M.; Monti, A.; Celico, F.; Gargini, A. Estimation of recharge in mountain hard-rock aquifers based on discrete spring discharge monitoring during base-flow recession. Hydrogeol. J. 2021, 29, 949–961. [Google Scholar] [CrossRef]
- Segadelli, S.; Adorni, M.; Carbognani, M.; Celico, F.; Tomaselli, M. Combining biological and hydrogeological approaches: The grass Molinia arundinacea as a possible bioindicator of temporary perched aquifers in ophiolitic systems. CATENA 2022, 217, 106448. [Google Scholar] [CrossRef]
- Gargini, A.; Vincenzi, V.; Piccinini, L.; Zuppi, G.M.; Canuti, P. Groundwater flow systems in turbidites of the Northern Apennines (Italy): Natural discharge and high speed railway tunnel drainage. Hydrogeol. J. 2008, 16, 1577–1599. [Google Scholar] [CrossRef]
- Petrella, E.; Celico, F. Heterogeneous aquitard properties in sedimentary successions in the Apennine chain: Case studies in southern Italy. Hydrol. Process. 2009, 23, 3365–3371. [Google Scholar] [CrossRef]
- Rizzo, P.; Severini, E.; Bucci, A.; Bocchia, F.; Palladino, G.; Riboni, N.; Sanangelantoni, A.M.; Francese, R.; Giorgi, M.; Iacumin, P.; et al. How do turbidite systems behave from the hydrogeological point of view? New insights and open questions coming from an interdisciplinary work in southern Italy. PLoS ONE 2022, 17, e0268252. [Google Scholar] [CrossRef] [PubMed]
- Deiana, M.; Cervi, F.; Pennisi, M.; Mussi, M.; Bertrand, C.; Tazioli, A.; Ronchetti, F. . Chemical and isotopic investigations (δ 18 O, δ 2 H, 3 H, 87 Sr/86 Sr) to define groundwater processes occurring in a deep-seated landslide in flysch. Hydrogeol. J. 2018, 26, 2669–2691. [Google Scholar] [CrossRef]
- Remelli, S.; Petrella, E.; Chelli, A.; Conti, F.D.; Fondón, C.L.; Celico, F.; Francese, R.; Menta, C. Hydrodynamic and Soil Biodiversity Characterization in an Active Landslide. Water 2019, 11, 1882. [Google Scholar] [CrossRef]
- Rizzo, P.; Petrella, E.; Bucci, A.; Salvioli-Mariani, E.; Chelli, A.; Sanangelantoni, A.M.; Raimondo, M.; Quagliarini, A.; Celico, F. Studying Hydraulic Interconnections in Low-Permeability Media by Using Bacterial Communities as Natural Tracers. Water 2020, 12, 1795. [Google Scholar] [CrossRef]
- Chelli, A.; Francese, R.; Petrella, E.; Carri, A.; Quagliarini, A.; Segalini, A.; Caporicci, M.P.; Diena, M.; Giorgi, M.; Celico, F. A multi-parameter field monitoring system to investigate the dynamics of large earth slides–earth flows in the Northern Apennines, Italy. Eng. Geol. 2020, 275, 105780. [Google Scholar] [CrossRef]
- Petrella, E.; Raimondo, M.; Chelli, A.; Valentino, R.; Severini, E.; Diena, M.; Celico, F. Processes and factors controlling the groundwater flow in a complex landslide: A case study in the northern Italy. Hydrol. Process. 2023, 37. [Google Scholar] [CrossRef]
- Regione Emilia-Romagna; ENI-AGIP. Riserve idriche sotterranee della Regione Emilia-Romagna. A cura di G.M. Di Dio. 1998. Regione Emilia-Romagna, ENI Agip Divisione Esplorazione e Produzione. S.EL.CA., Firenze,120.
- Zanini, A.; Petrella, E.; Sanangelantoni, A.M.; Angelo, L.; Ventosi, B.; Viani, L.; Rizzo, P.; Remelli, S.; Bartoli, M.; Bolpagni, R.; et al. Groundwater characterization from an ecological and human perspective: An interdisciplinary approach in the Functional Urban Area of Parma, Italy. Rendiconti Lince-Sci. Fis. Nat. 2018, 30, 93–108. [Google Scholar] [CrossRef]
- Di Dio, G.; Martini, A.; Lasagna, S.; Zanzucchi, G. Explanatory notes of the Geologic Map of Italy at the scale 1: 50,000, Sheet no. 199 Parma Sud-Ovest. 2005. Servizio Geologico della Regione Emilia-Romagna, Servizio Geologico Nazionale, ISPRA, Rome.
- Iacumin, P.; Venturelli, G.; Selmo, E. Isotopic features of rivers and groundwater of the Parma Province (Northern Italy) and their relationships with precipitation. J. Geochem. Explor. 2009, 102, 56–62. [Google Scholar] [CrossRef]
- Zanini, A.; Ghirardi, M.; Emiliani, R. A Multidisciplinary Approach to Evaluate the Effectiveness of Natural Attenuation at a Contaminated Site. Hydrology 2021, 8, 101. [Google Scholar] [CrossRef]
- Severini, E.; Ducci, L.; Sutti, A.; Robottom, S.; Sutti, S.; Celico, F. River–Groundwater Interaction and Recharge Effects on Microplastics Contamination of Groundwater in Confined Alluvial Aquifers. Water 2022, 14, 1913. [Google Scholar] [CrossRef]
- Ducci, L.; Rizzo, P.; Pinardi, R.; Solfrini, A.; Maggiali, A.; Pizzati, M.; Balsamo, F.; Celico, F. What Is the Impact of Leaky Sewers on Groundwater Contamination in Urban Semi-Confined Aquifers? A Test Study Related to Fecal Matter and Personal Care Products (PCPs). Hydrology 2022, 10, 3. [Google Scholar] [CrossRef]
- Rossetti, G.; Pieri, V.; Martens, K. Recent ostracods (Crustacea, Ostracoda) found in lowland springs of the provinces of Piacenza and Parma (Northern Italy). Hydrobiologia 2005, 542, 287–296. [Google Scholar] [CrossRef]
- Bonaposta, D., Segadelli, S., De Nardo, M.T., Alessandrini, A., & Pezzoli, S. Le potenzialità geologiche dei dati storici ambientali: Il caso delle sorgenti e dei fontanili in Emilia-Romagna. 2011. Il Geologo dell’Emilia Romagna, 19-34.
- Kløve, B.; Ala-Aho, P.; Bertrand, G.; Boukalova, Z.; Ertürk, A.; Goldscheider, N.; Ilmonen, J.; Karakaya, N.; Kupfersberger, H.; Kvœrner, J.; et al. Groundwater dependent ecosystems. Part I: Hydroecological status and trends. Environ. Sci. Policy 2011, 14, 770–781. [Google Scholar] [CrossRef]
- Song, Y.; Ji, J.; Mao, C.; Yang, Z.; Yuan, X.; Ayoko, G.A.; Frost, R.L. Heavy metal contamination in suspended solids of Changjiang River—environmental implications. Geoderma 2010, 159, 286–295. [Google Scholar] [CrossRef]
- Thorslund, J.; Jarsjö, J.; Chalov, S.R.; Belozerova, E.V. Gold mining impact on riverine heavy metal transport in a sparsely monitored region: The upper Lake Baikal Basin case. J. Environ. Monit. 2012, 14, 2780–2792. [Google Scholar] [CrossRef]
- Hu, B.; Li, J.; Bi, N.; Wang, H.; Yang, J.; Wei, H.; Zhao, J.; Li, G.; Yin, X.; Liu, M.; et al. Seasonal variability and flux of patticulate trace elements from the Yellow River: Impacts of the anthropogenic flood event. Mar. Pollut. Bull. 2015, 91, 35–44. [Google Scholar] [CrossRef]
- Oberholster, P.; Botha, A.-M.; Hill, L.; Strydom, W. River catchment responses to anthropogenic acidification in relationship with sewage effluent: An ecotoxicology screening application. Chemosphere 2017, 189, 407–417. [Google Scholar] [CrossRef]
- Zhou, Q.; Yang, N.; Li, Y.; Ren, B.; Ding, X.; Bian, H.; Yao, X. Total concentrations and sources of heavy metal pollution in global river and lake water bodies from 1972 to 2017. Glob. Ecol. Conserv. 2020, 22, e00925. [Google Scholar] [CrossRef]
- Atangana, E.; Oberholster, P.J. Using heavy metal pollution indices to assess water quality of surface and groundwater on catchment levels in South Africa. J. Afr. Earth Sci. 2021, 182, 104254. [Google Scholar] [CrossRef]
- Sui, C.; Fatichi, S.; Burlando, P.; Weber, E.; Battista, G. Modeling distributed metal pollution transport in a mine impacted catchment: Short and long-term effects. Sci. Total. Environ. 2021, 812, 151473. [Google Scholar] [CrossRef] [PubMed]
- Owens, P.; Petticrew, E.; Albers, S.; French, T.; Granger, B.; Laval, B.; Lindgren, J.; Sussbauer, R.; Vagle, S. Annual pulses of copper-enriched sediment in a North American river downstream of a large lake following the catastrophic failure of a mine tailings storage facility. Sci. Total. Environ. 2023, 856, 158927. [Google Scholar] [CrossRef] [PubMed]
- Rezaei Kalvani, S.; Celico, F. The Water–Energy–Food Nexus in European Countries: A Review and Future Perspectives. Sustainability 2023, 15, 4960. [Google Scholar] [CrossRef]
- D’Oria, M.; Cozzi, C.; Tanda, M.G. Future precipitation and temperature changes over the Taro, Parma and Enza River Basins in Northern Italy. 2018. Italian J Eng Geol Environ (Special Issue), 49-63.
- Todaro, V.; D’oria, M.; Secci, D.; Zanini, A.; Tanda, M.G. Climate Change over the Mediterranean Region: Local Temperature and Precipitation Variations at Five Pilot Sites. Water 2022, 14, 2499. [Google Scholar] [CrossRef]
- Ouyang, Z.; Song, C.; Zheng, H.; Polasky, S.; Xiao, Y.; Bateman, I.J.; Liu, J.; Ruckelshaus, M.; Shi, F.; Xiao, Y.; et al. Using gross ecosystem product (GEP) to value nature in decision making. Proc. Natl. Acad. Sci. USA 2020, 117, 14593–14601. [Google Scholar] [CrossRef]
Figure 1.
Tectonic map of the Northern Apennines (from [7], modified).
Figure 1.
Tectonic map of the Northern Apennines (from [7], modified).
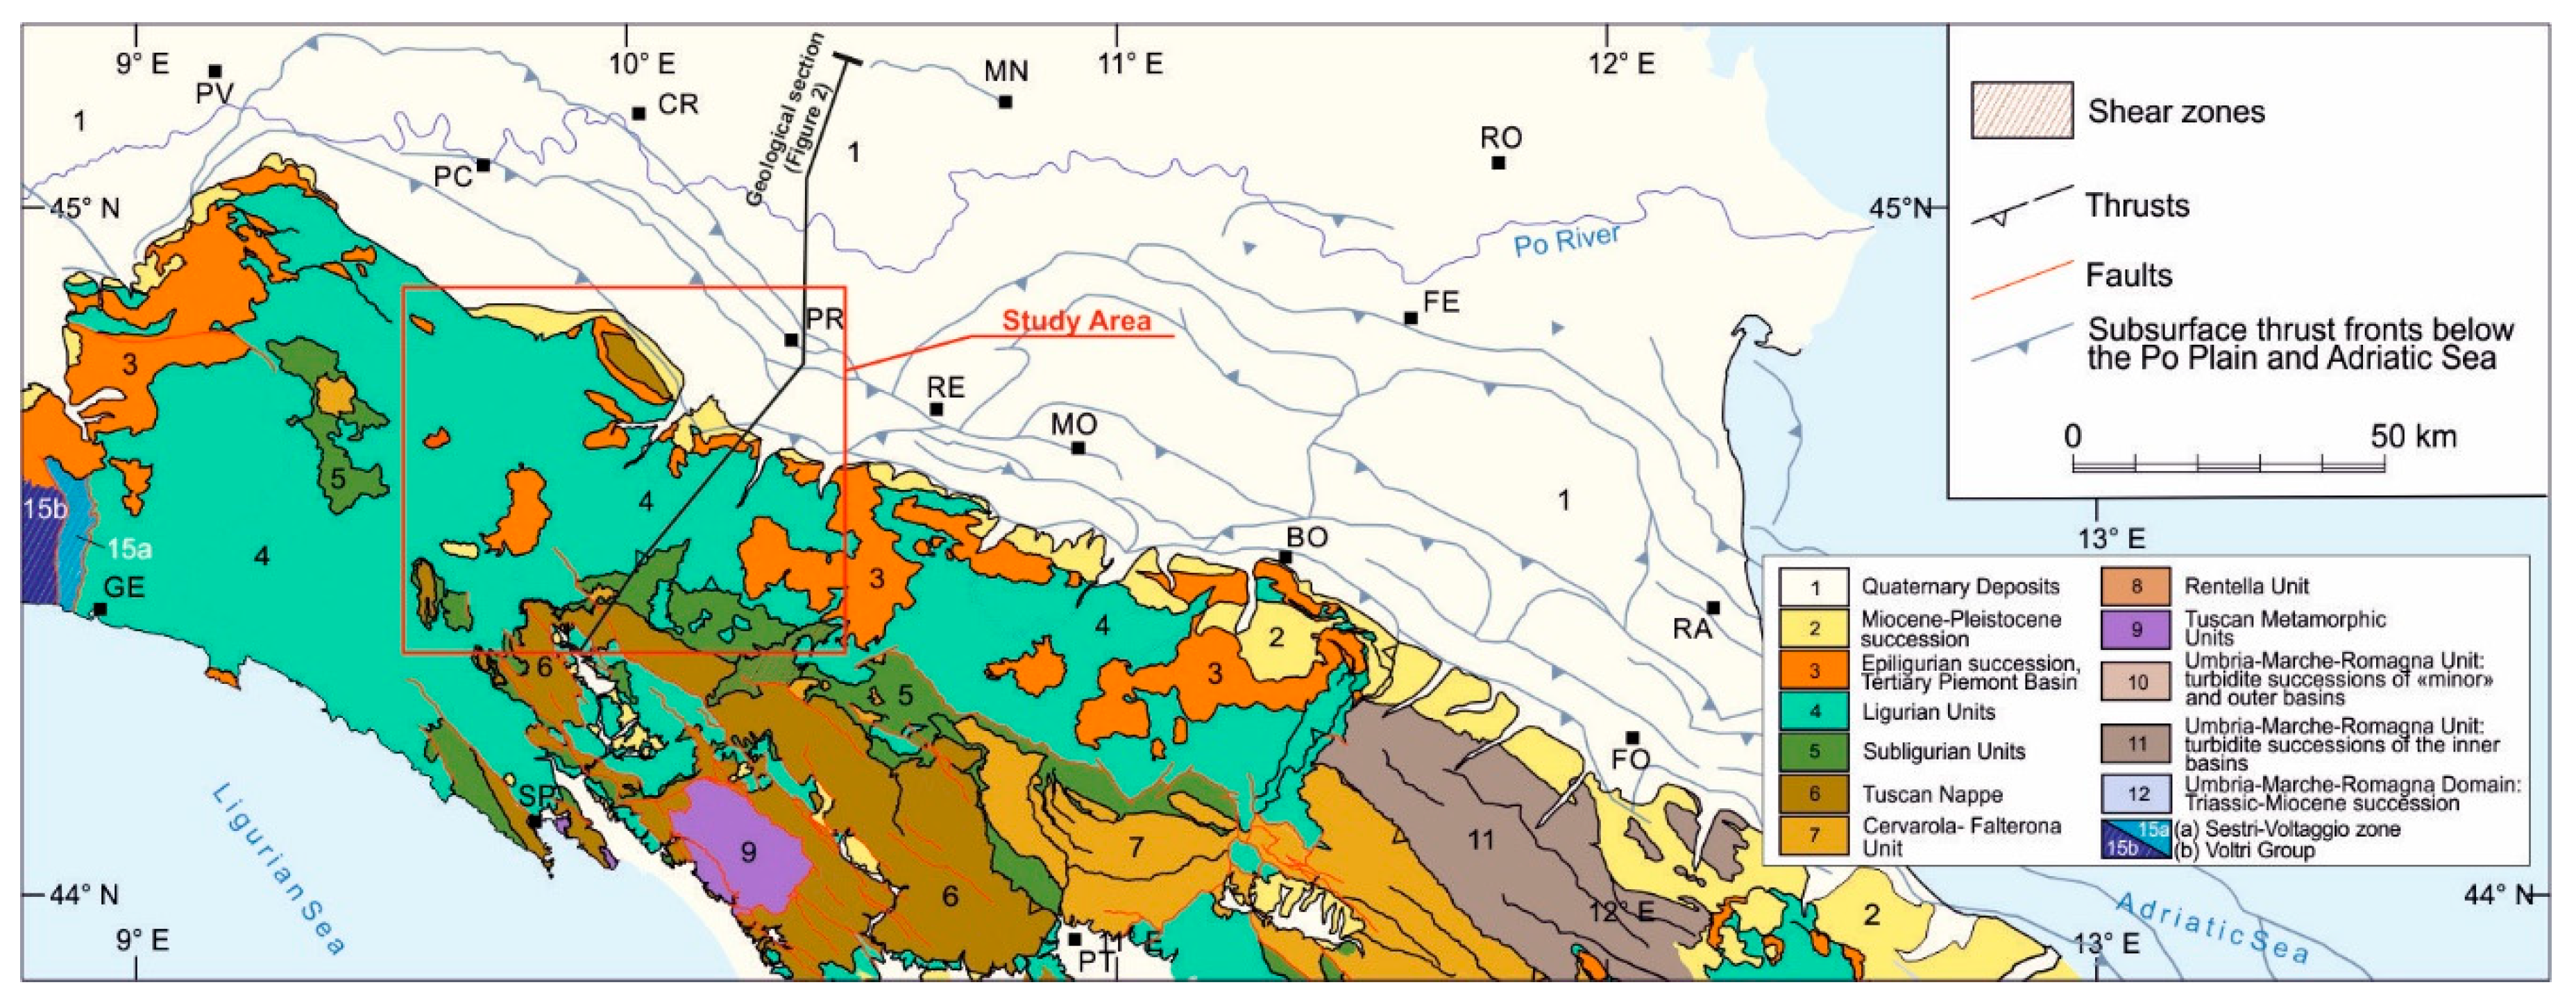
Figure 2.
Geological Section (from [12], modified).
Figure 2.
Geological Section (from [12], modified).
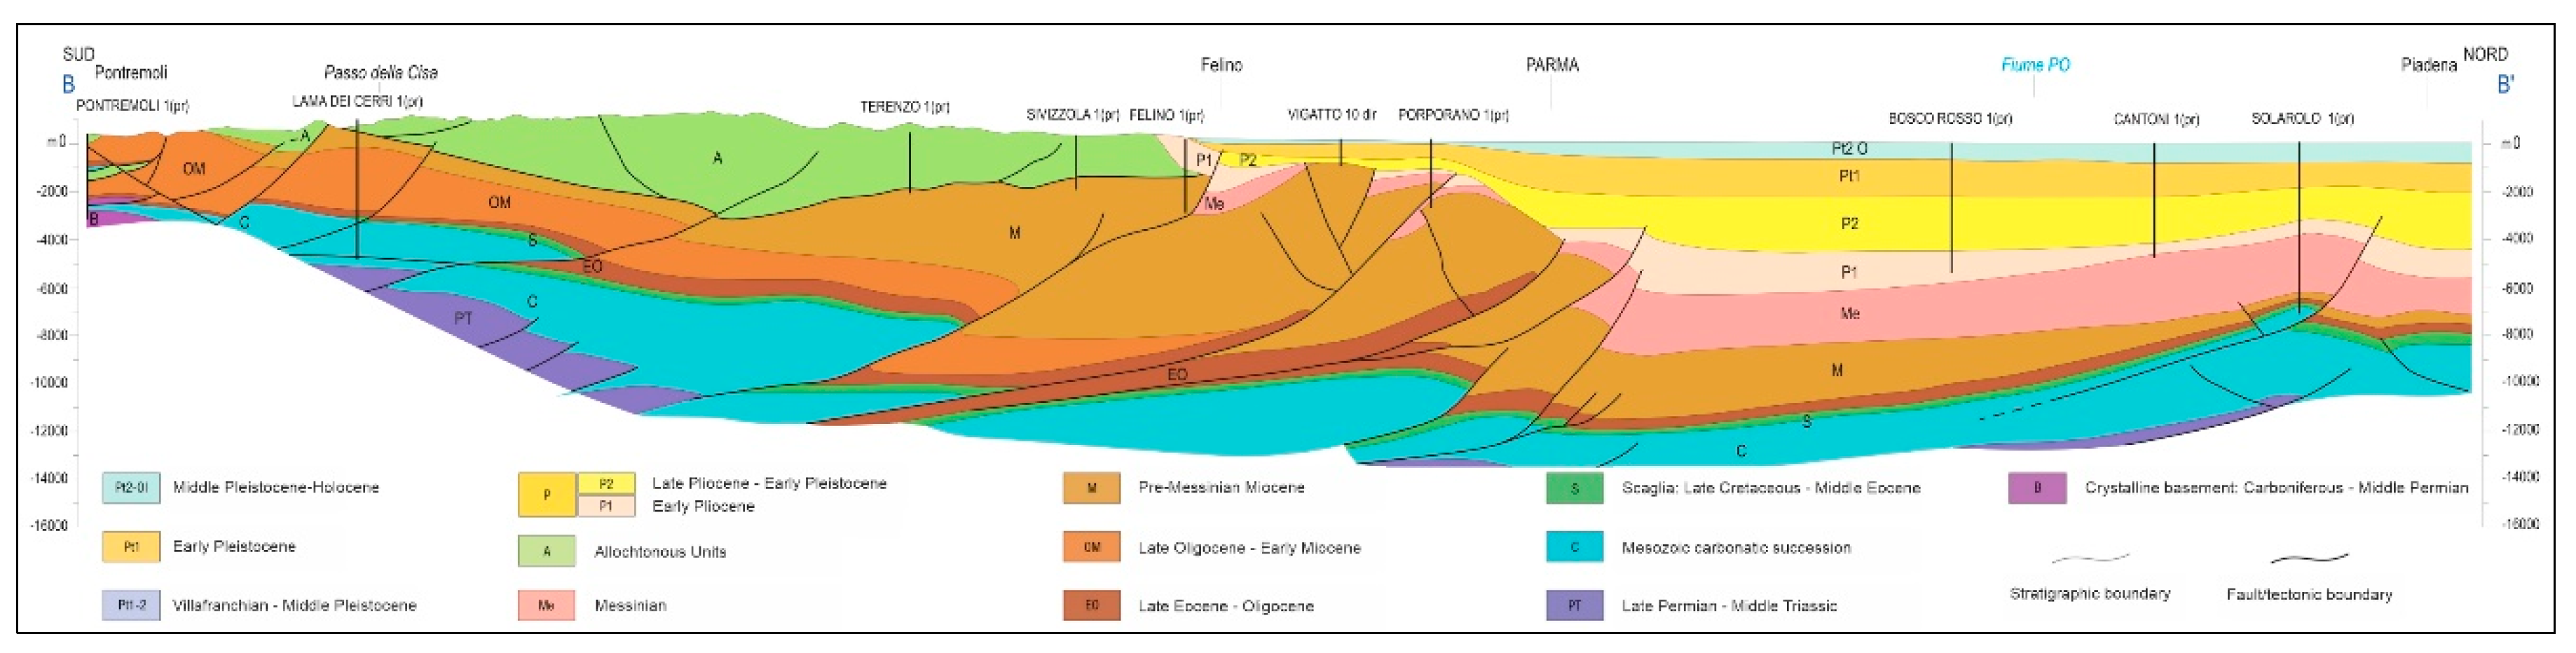
Figure 3.
Hydrogeologic conceptual model of the Mt Prinzera aquifer system. Legend – 1: ultramafic aquifer; 2: aquiclude; 3: discontinuous aquitard; 4: fault; 5: fracture; 6: perched groundwater phreatic surface; 7: basal groundwater piezometric surface; 8: flowline of the perched groundwater; 9: flow line of the basal groundwater; 10: springs and their code; 11: infiltration within the unsaturated ultramafic medium. (from [13], modified).
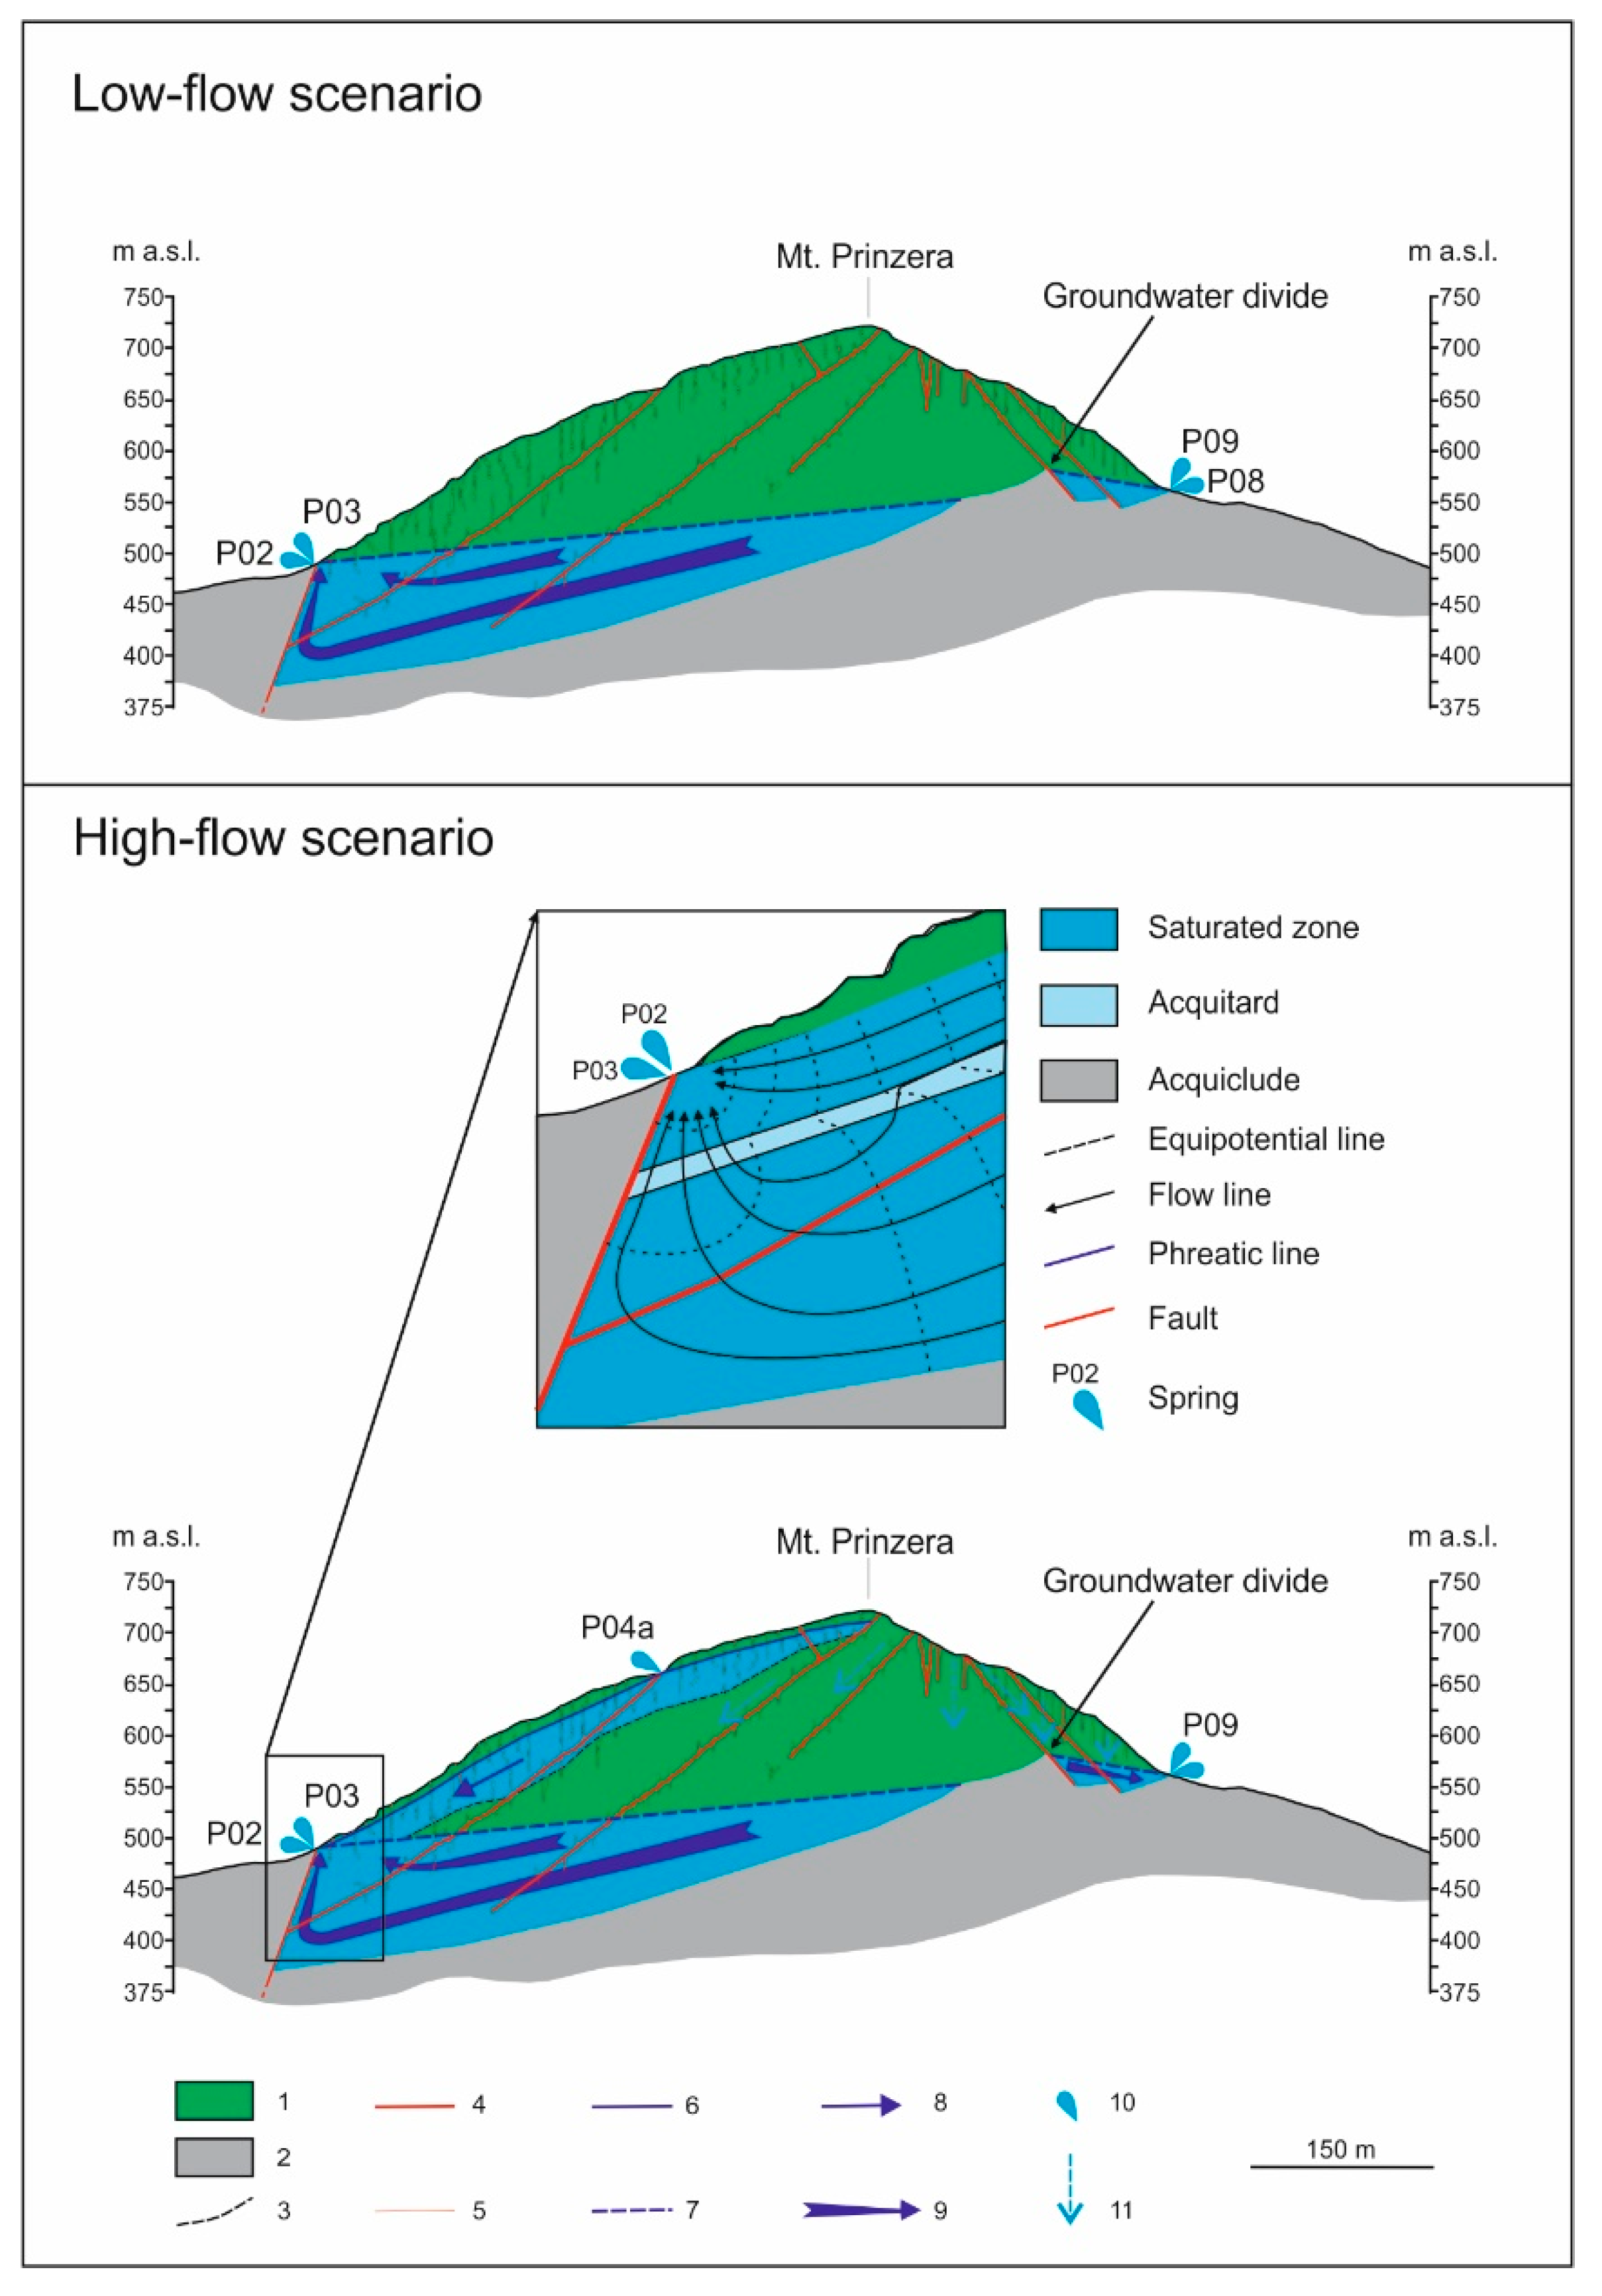
Figure 4.
Variation of hydraulic conductivity (k) with depth in a turbiditic aquifer (from [18], modified).
Figure 4.
Variation of hydraulic conductivity (k) with depth in a turbiditic aquifer (from [18], modified).
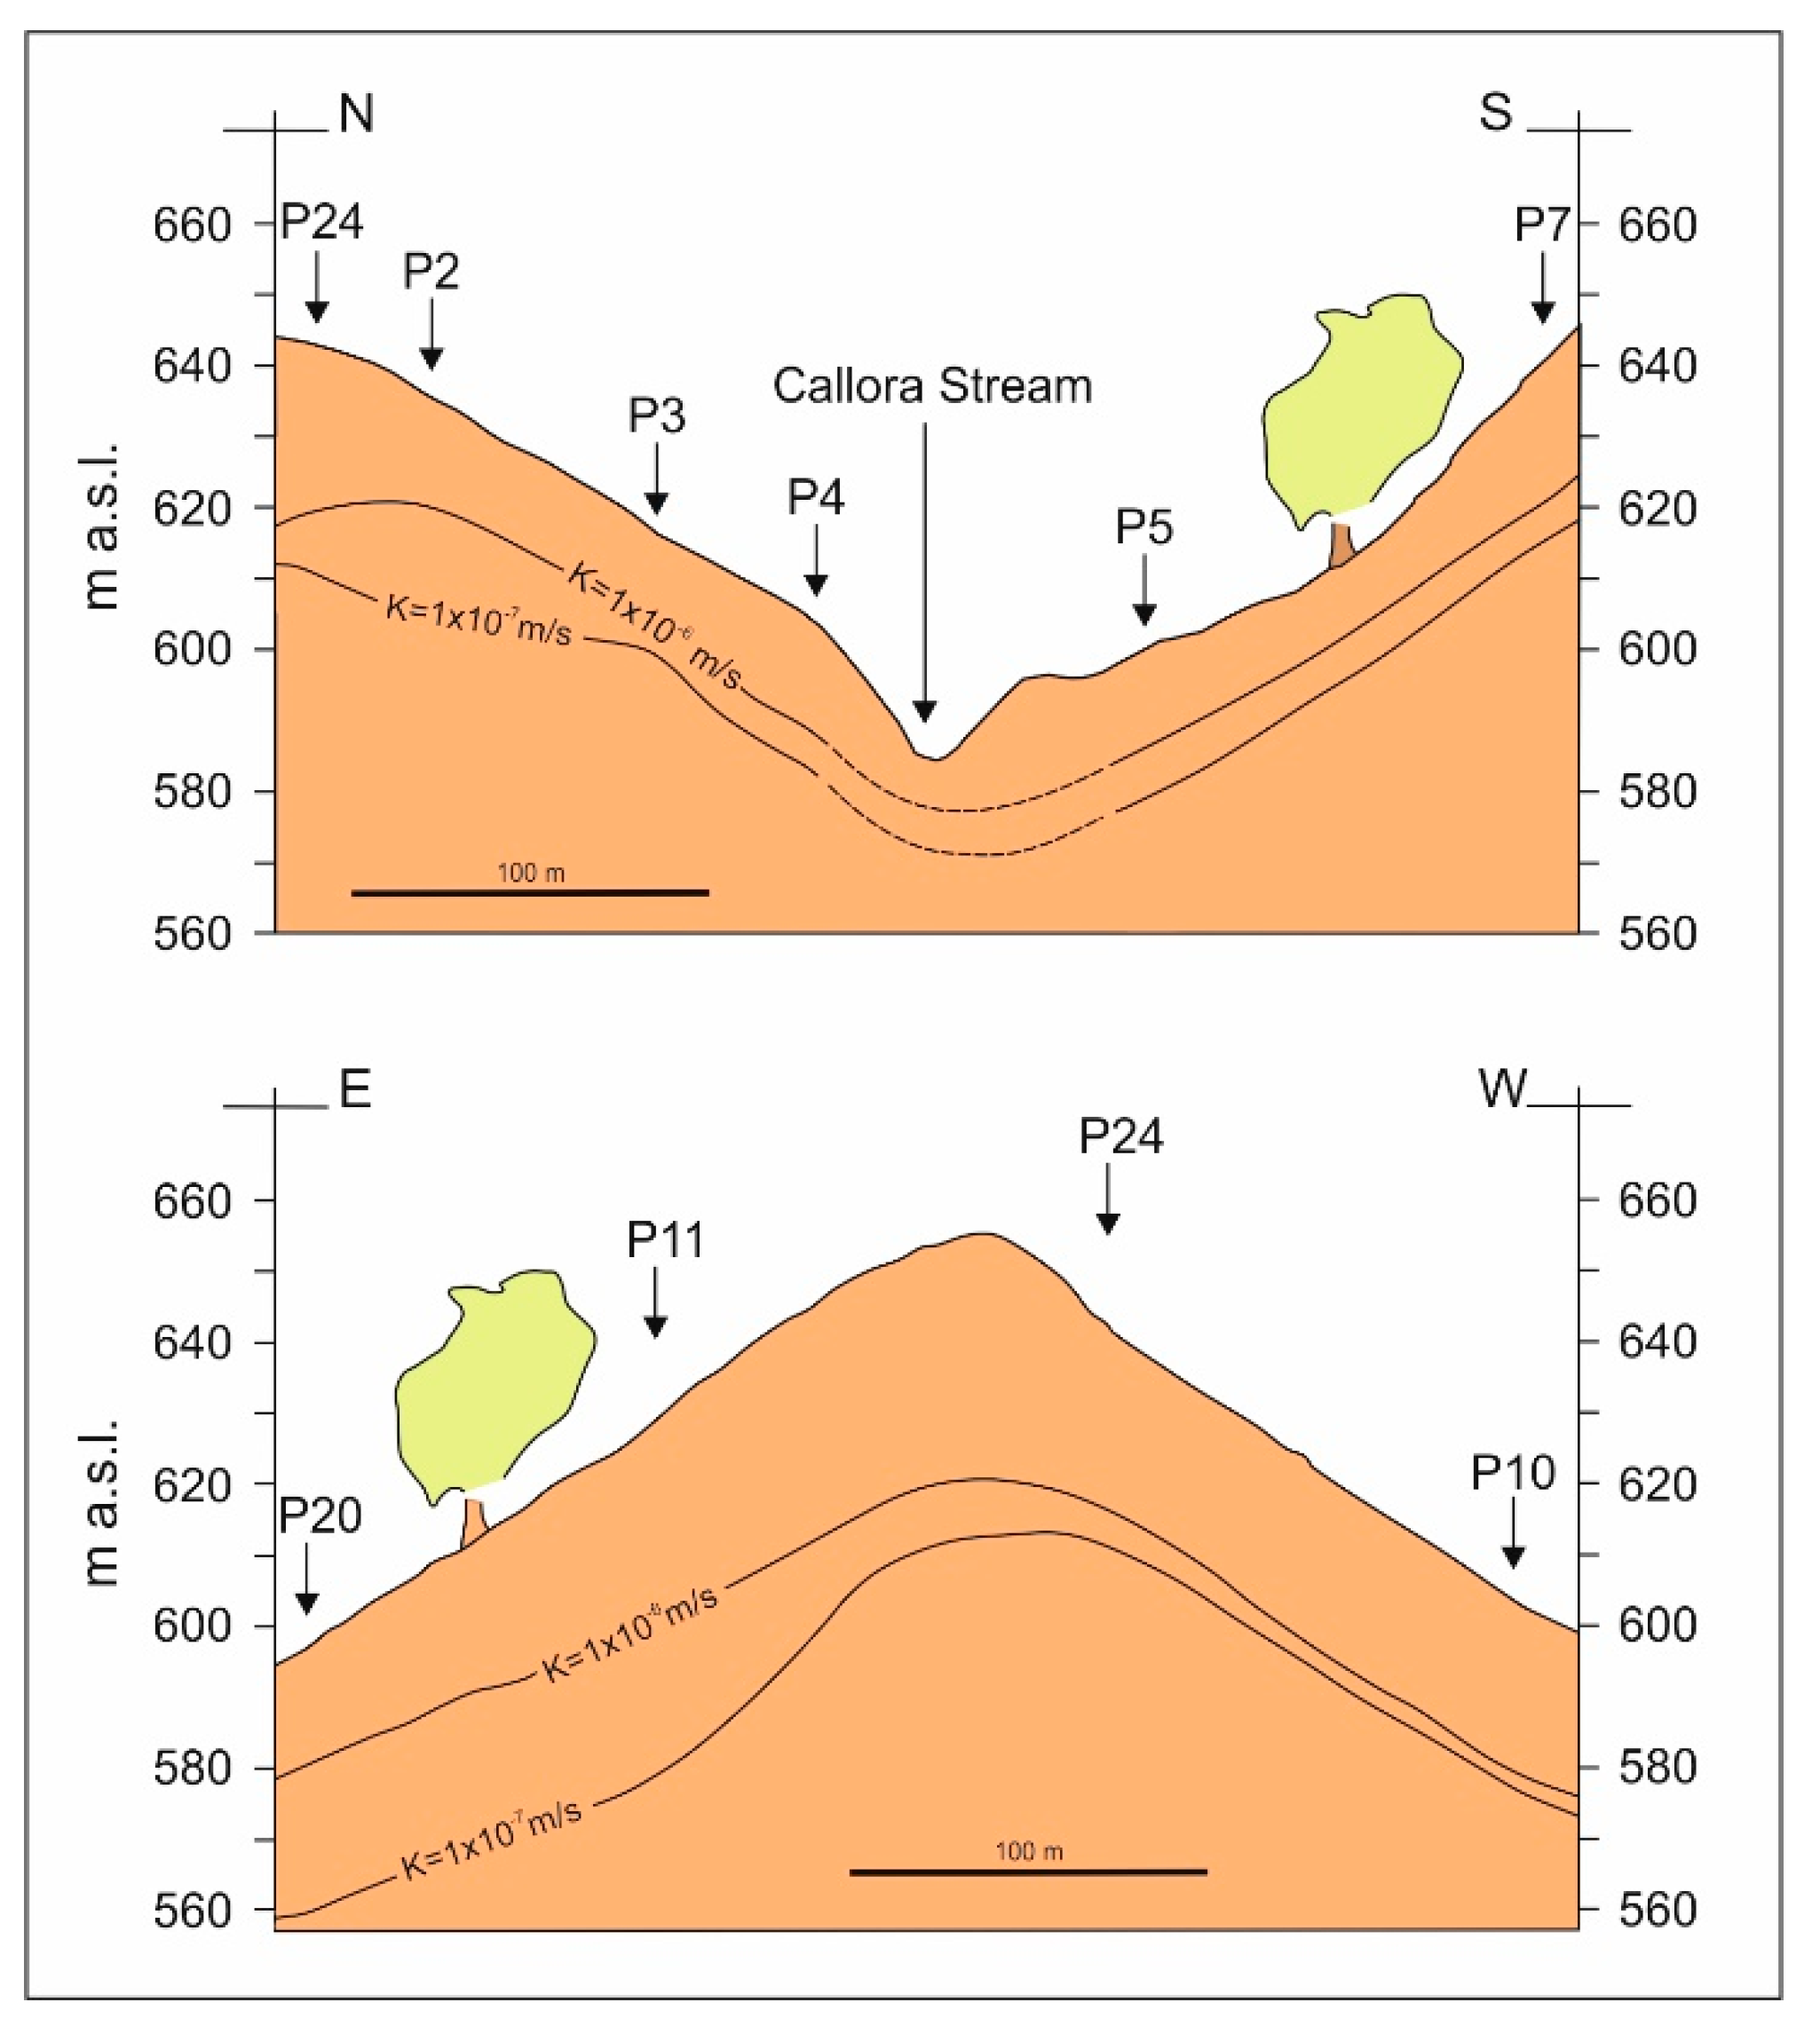
Figure 5.
Hydrogeological model of a turbiditic aquifer (from [19], modified).
Figure 5.
Hydrogeological model of a turbiditic aquifer (from [19], modified).
Disclaimer/Publisher’s Note: The statements, opinions and data contained in all publications are solely those of the individual author(s) and contributor(s) and not of MDPI and/or the editor(s). MDPI and/or the editor(s) disclaim responsibility for any injury to people or property resulting from any ideas, methods, instructions or products referred to in the content. |
© 2023 by the authors. Licensee MDPI, Basel, Switzerland. This article is an open access article distributed under the terms and conditions of the Creative Commons Attribution (CC BY) license (http://creativecommons.org/licenses/by/4.0/).
Copyright: This open access article is published under a Creative Commons CC BY 4.0 license, which permit the free download, distribution, and reuse, provided that the author and preprint are cited in any reuse.


