Submitted:
11 May 2023
Posted:
12 May 2023
Read the latest preprint version here
Abstract
Falls are extremely damaging to the elderly. The number of elderly who have experienced falls has increased over the years, several of the elderly stay alone or in in badly maintained elderly homes. This makes a low-cost fall detection system a necessity. There has been huge improvements in terms of IoT systems, ML algorithms. Varied data sets have been collected across the world for fall detection. These data sets have a very little in common among them, in terms of user demographics, sensors used, the ADL and Fall activities Hence in this paper we present a data set that has wide user demographics, we used various sensors – such as accelerometer, gyroscope, magnetometer and hear rate. We used wrist worn sensors to collect data. In this paper we present a detailed analysis of the data set we collected using common ML algorithms such as – Naïve Bayes (NB), K Nearest Neighbor (KNN), Logistic Regression (LR), Random Forest (RF) and Support Vector Machines (SVM). We analyzed the performance of these algorithms for variations in accuracy with respect to age, gender, height, weight and health issues and we have identified outliers by analyzing each incorrect prediction. This paper provides the complete details of the data collection methodology, The methods used for analysis and presents the results of analysis in complete detail.
Keywords:
Machine learning
; Geriartic fall detection
; Dataset
; K Nearest Neighbours
; Naive Bayes
; Logistic Regression
; Random Forest
; Support Vector Machine
1. Introduction
According to WHO statistics [1], people are living longer, and the current population is expected to live well into their sixties. Current statistics (1st October 2022) state the following.
- The speed of aging is increasing;
- In the year 2020, people aged more than sixty years outnumbered young kids under the age of five;
- By 2050 the population of geriatrics is expected to double from 12% to 22%. People over 60 are expected to be around 2.1 billion, and the number of people above 80 is expected to reach 426 million.
- Two-thirds of the aging population is expected to be in the low- and middle-income range.
The process of aging causes a decrease in physical and mental capacity, other than biological variations, that are a natural part of aging comes retirement and relocation. The elderly are generally considered frail and dependent and hence are shunned. Many of them are forced to live in a low-income retirement home. The changes in their health, financial and social conditions expose them to health risks; especially they become more prone to accidents, including falls.
United Nations has declared 2021 to 2030 as the “UN Decade of healthy aging” and are supporting the use of technology that can improve the quality of life of the elderly.
With recent advances in healthcare systems, specifically with the integration of Internet of Things (IoT) and medical applications, there has been a huge boost in research in medical sensors and machine learning algorithms.
Machine learning and Deep Learning are widely investigated topics in the case of geriatric fall detection to train the ML/DL algorithms, a large amount of data related to fall and non-fall activities is required. Several public datasets for fall are available. The public datasets vary in terms of (a) Sensors used (b) the number of volunteers (c) demographics such as age, gender, and existing health conditions (d) activities performed (e) data gathering techniques. Several researchers [2] have brought out the difficulty of comparing datasets. Therefore, it is also difficult to conclude why certain ML/DL algorithms perform better when compared to others. Most public datasets do not provide the details of data collection. The datasets used for fall detection have a set of daily activities (ADLs) and a set of fall data. Public datasets do not always list the ADL activities, the type of falls, how many times these activities were performed and how long each activity lasted.
Two types of sensing methods are associated with fall detection (a) wearable (b) environmental sensors. The classification is based on the placement of the sensor. The sensors can be placed on the body of the elderly or maybe placed in the environment around them. Body worn sensors usually are accelerometers, gyroscopes, and biometric sensors. Environmental sensors include image, vibration, and audio sensors.
There are several public datasets such as Mobi Fall, K Fall, SiS Fall, and SmartFall, that use body worn sensors that primarily use accelerometer-based sensors. This paper concentrates on data collection using wearable sensors specifically IMU (Inertial Measurement Unit) sensors, gyroscopes, magnetometers. Even with body-worn sensors, there is a considerable variation in the data collected. This is due to the positioning of the sensor on the body. The sensors maybe placed on the torso, thigh, or waist. Based on the placement of the sensors, the data collected, and the performance of the ML algorithms vary.
Raw sensor data is not directly fed to the ML algorithms; sensor data is processed to extract the relevant features; in the case of wearable sensors, these are usually statistical parameters – such as average, mean, maximum, minimum, standard deviation, kurtosis, skew, etc. Public datasets only have the extracted features available. Some of them have only raw accelerometer values; each public dataset produces different accuracies when ML algorithms are applied. This makes it difficult to recommend a single ML algorithm for fall detection. Also, the accuracy of the ML algorithm cannot be coordinated with the data points as no information regarding the volunteers and their individual characteristics are available. Therefore, while using public datasets the following question remains to be answered (A) What is the reason for varying accuracies in ML algorithms (B) Are the volunteered demographics related to varying accuracies, and if so, how? (C) How much data is required to train the algorithms to obtain good accuracies especially since DL algorithms require a large amount of data to converge (D) Can different datasets be used for training and testing and how will the accuracies of the ML algorithms will be affected (E) What will be the actual accuracy obtained when the system is used on the actual target users (i.e.) the elderly. The volunteers cannot be drawn from the geriatric populations due to the health risk involved.
The primary aim of our research work is to build an end device that will be a part of a larger IoT system. The end device will not only collect data but also execute the ML/DL algorithms to detect falls and alert healthcare professionals. The ML algorithms are run on the end device to eliminate network latency and connectivity-related issues. Only long-term health monitoring and analysis will be done on the cloud. The architecture of the proposed system is shown in Figure 1.
Such a system would have end devices built around powerful SoCs. The SoC we are using is Snapdragon Qualcomm 820c [3]. The 820c chip has been developed specifically for wearable and IoT applications.In IoT this is termed as Dew Computing.
This device needs to be trained with a large dataset so that we can run compressed ML/DL algorithms on it. The need for compressed algorithms is because running a full-scale algorithm will require a large amount of memory that is not available on SoCs [4]. shows the high latency incurred when running ML algorithms on SoCs. In order to train the system, we started with data collection, cleaning and analysis. This paper elaborates on the process we have used for data collection, cleaning, feature extraction and analysis of the data collected. Various ML algorithms were run on the data collected and analysis was done on various factors and their impact on the ML models. Some of the features considered were (a) Separate test and train data (b) age (c) gender (d) physical condition such as height, weight, and any pore-existing health condition. This paper provides the result of the analysis and also addresses the issue of data collection and the impact of characteristics of the data collected on the performance of the ML algorithms.
2. Background of Work
“Inadvertently coming to rest on the ground, floor, or other lower levels, excluding intentional change in position to rest in furniture, wall or objects”, is defined as a fall by WHO [1]. Falls can be detected using multiple mechanisms and methods. This section gives a brief review of the research done in terms of data collection and analysis done for fall detection in the elderly.
2.1. Sensors
The sensors that are used for fall detection can be classified into two categories (a) ambient sensors (b) wearable. The classification is based on the position of the sensor with respect to the user.
2.1.1. Ambient Sensors
Image, Audio and Vibration sensors are the major sensors are the major sensors that fall under this category. Fall detection using vibration sensors [5] is detailed. [6] describes a fall detection system that uses sound sensors. Vibration sensors are usually piezo-electric based and pick up vibrations caused by the fall of a person. The issue with using ambient sensors to detect vibration or audio samples is the large amount of noise present that requires pre-processing of signals using appropriate filters. If the fall detection system is part of the IoT system, then the complexity of the end device will be extremely high. Also, there is a possibility that soft falls may go undetected. Image Sensors [7] analyse images captured efvery few seconds to find if any person has fallen, in most cases multiple camera frames will be required. Multiple cameras can be placed in a single room and falls can be detected. Using multiple cameras in every room where the elderly live, is not feasible; especially considering that most elderly live on a restricted income.
All these sensors; vibration, acoustic and image are placed in and around the area where the elderly live and hence, they are termed ambient sensors.
2.1.2. Wearable Sensors
Wearable sensors are primarily IMU sensors such as accelerometers, gyroscopes and magnetometers. In some research work [8], GPS has also been used, while in the case of some, biometric parameters such as heart rates, and skin temperature, etc were used.
In many cases, smartphones that already have an IMU sensor or smartwatches equipped with IMU sensors are used. GPS or biometric-based sensors in these devices are generally used for validations.
IMU sensors are made up of three different sensors (a) Accelerometers (b) Gyroscopes (c) Magnetometers.
The accelerometers will experience sudden changes in value during a fall. Based on the position of the sensors, in some cases wrist-worn, thigh-worn or torso worn; The amount of acceleration along the 3 axes will vary. The gyroscope measures the angular velocity along with the 3 axes. The integral gives the angle of the person with respect to the ground. The third part of the IMU sensor, that is the magnetometer provides the orientation with respect to the Earth’s magnetic field. In case of falls, there will be a significant change in all these parameters. In some cases, heart rate sensors and skin temperature sensors are used as they may supplement the IMU data. Heart rate may increase in case of a fall, so may the skin temperature. Wearable sensors are preferred over ambient sensors since they can move with the elderly also now IMU sensors are an integral part of smartphones and smartwatches which makes them an ideal choice; they are already available and will cost lesser even if a new system was to be built around them.
2.2. Data-Sets
Generally, to train and test the ML/DL algorithms large amount of data is required. There are multiple datasets available online, but they vary in terms of the type of sensors, manufacturer of the sensors, demographics of the train and test volunteers, the types of ADLs and Falls monitor, Sampling rate, duration of the data collected, number of volunteers and hence the number of data samples. The format of the data may be in terms of simple digital data from sensors, acoustic signals, or images. In the case of some datasets, raw data is available and in the case of some datasets, the features extracted are available. The feature extraction technique may also differ. Different datasets give different accuracies with different ML algorithms. Very little information is provided on why there are variations in accuracies. Does variation in gender, age, height, weight, and previous health issues affect accuracy is something that has not been analysed. Even when we run the ML/DL algorithms it is very difficult to analyse the ac curacies as very little information is provided about the volunteers due to privacy issues. A table analysing various public datasets collected over the last few years is provided in Table 1.
3. Data Collection Methodology
There are multiple datasets available as described in the background section. There are multiple issues with the datasets:
- Very few public datasets available that have readings from multiple sensors. Most public datasets only have the linear acceleration data.
- Very few datasets available that have wide diversity in terms of age, gender, height, weight and health issues
- Even in datasets where there is diversity, no information is available on the ratio of gender, age, height or weight
- The number of volunteers are usually less. In most cases less than 20.
- The list of ADLs and falls are not completely provided
- The details of how long each activities lasted is not available.
- The data collection methodology is not described
- The details of the sensors used is not provided, hence using multiple datasets becomes a major issue as they cannot be fused together.
Though attempts have been made to compare datasets, not more than three or four [2] datasets are compared and only certain statistical parameters are analysed. Besides all these comparisons are done based only on accelerometer data. Due to these existing issues, we have collected our own data, this section gives the details of the volunteers diversity, the sensors and the data collection methodology. We also provide the details of the features extracted that are to be used by the various ML algorithms. The datasets are available at "https://shamanx86.github.io/fall_detection_data/".
3.1. Volunteers statistics
- No of volunteers: 41
- Age range: 18-50
- Number of female volunteers: 14.
- Weight: 50 Kg – 120 Kg.
- Height: 4ft 11 inches – 6ft 4 inches.
Existing Health issues: High blood pressure, Diabetes, Hypertension Claustrophobia, there were some volunteers who were prone to panic attacks, sinusitis, sinus tachycardia, thyroid, malnutrition, hypochondria, extreme anxiety, low blood pressure, prostate, and early sign of arthritis. The data was collected using a Samsung Galaxy Watch (Series 5) worn by all users on their left wrist. Samsung Galaxy (Series 5) was released in August 2020.
The dimensions of the watch are as follows: 44.4 X 42.3 X 9.8 mm. The watch weighs about 33.5 grams, the processor is a dual-core 1.18 GHz Cortex A55 and the GPU on the watch is Mali-G68.The sensors available on the watch are: Accelerometer, Gyroscope, Magnetometer and Heart-Rate. The Heart-Rate sensor is extremely accurate and comparable to medical grade sensor [52]. IMU sensors are already pre-calibrated for wrist-worn positions and are extremely accurate. Each volunteer was asked to wear the watch on the left wrist while performing the following ADL and Fall activity:
3.1.1. ADL
- Walking Slowly (2 min)
- Walking Quickly (2 mins)
- Jogging (2 min)
- Jogging (2 min)
- Climbing up slowly (2 mins)
- Climbing down slowly (2 mins)
- Climbing up normal (2 mins)
- Climbing down normal (2 mins)
- Slowly sitting on a chair (nil)
- Rapidly sitting down on a chair (na(not applicable))
- Nearly Sitting on the chair getting up (na)
- Swinging Hands (2 mins)
- Lying on the bed (2 min)
- Lying on the back and getting up slowly (na)
- Lying on the back and getting up quickly (na)
- Transition from sideways to one’s back while lying down (na)
3.1.2. Fall
- Forward fall landing on the knees (30 secs on the ground)
- Right fall (30 secs on the ground)
- Left fall (30 secs on the ground)
- Forward fall (30 secs on the ground)
- Seated on the bed and falling on the ground (30 secs on the ground)
- Forward fall body weight on the hand (30 secs on the ground)
- Backward fall from seated position (30 secs on the ground)
- Grabbing while falling (30 secs on the ground)

Table 2.
Summary of the volunteer statistics.
| Sr no. | Parameter | Values and Nos |
|---|---|---|
| 1 | Gender | Male = 27 Female = 14 |
| 2 | Age-range | 20-30 years = 29 30-40 years = 6 >40 years = 6 |
| 3 | Weight-range | 50 Kg – 65 Kg = 21 65 Kg – 80 Kg = 16 80 Kg – 100 Kg = 3 100 Kg – 120 Kg = 1 |
| 4 | Height Range | 5ft – 5ft 5in = 23 5ft 5in – 6ft = 16 >6ft = 2 |
| 5 | Health Issues | No. of subjects with health issues = 17 No. of subjects without health issues = 24 Health Conditions of subjects: Sinus Tachycardia, High Blood Pressure, Overweight, Folic acid allergy, Obese, Thyroid, Hypochondria, extreme anxiety Low Blood Pressure, Prostrate, Sinusitis and Genetic Diabetes |
The data was collected by asking the volunteers to perform the falls within an anechoic chamber. As the anechoic chamber is padded with a thick sponge, during the falls, the volunteers landed on the soft material, and hence they were not injured. As a result, all falls ended up being soft falls. Using 41 volunteers about 1.9 million data points were collected. The features were then extracted from the data. The features were statistical in nature. The statistical parameters derived were mean, standard deviation, variance, minimum, maximum, skew and kurtosis. After feature extraction, we had 100,208 data points that were used for training and testing.
4. Experimental methodology
In order to analyse the data we collected, for efficiency in fall detection, we used five common ML algorithms. (a) Naïve Bayes [53] (b) KNN [54] (c) Logistic regression [55] (d) Random Forest [56] (e)SVM(Suppport vector machine) [57]. To understand the variations in accuracies we used various combinations of the user demographics. This was done to understand the effect of user parameters such as gender, age, height, weight and health issues on the accuracies. We also analysed which of the ADLs and Falls were incorrectly detected with respect to the user parameters. We used a combination of user demographics to understand the behaviour of the algorithm and why there were variations in Accuracies, Sensitivity, Specificity and False Negative rates. We used a combination of varying user parameters for training and testing. For example, to understand the effect of gender on the test accuracies we first ran the ML algorithms separately for male volunteers using their data for both training and testing. We repeated the same for the female volunteers. Then we used the data of the female volunteers for training and the male volunteers for testing and vice-versa. Many of the existing public datasets which are used for training the ML algorithms have similar user demographics. In most cases the volunteers are male and in the age between 20 and 30 years with no known health issues. The actual users of the end product will be people above 60 years, both male and female with several pre-existing health conditions. Under these circumstances, whether the fall prediction algorithms will work accurately needs to be analysed. Hence in this paper, we have tried to analyse the behaviour of the algorithms with varying user demographics. The combinations that we used for testing and training are given in Table 3.
We ran the algorithms with and without the data from heart rate sensors to understand the effects of biometric parameters during falls. In the next section, we give the complete results and the analytics.
We also analysed the behaviour of the algorithms with respect to the ideal “k” value in the case of KNN and found out that it was equal to 9 where we achieved the maximum accuracies, also it was “Minkowski” distance metrics that gave us the highest accuracies at lower “k” values. In the case of Random Forest, we had to find the optimal number of decision trees which yielded the best results which in our case was 170. The results remained the same for with, as well as without heart rate, in the case of Random Forest with 170 decision trees.
5. Results and Discussion
5.1. Overall Performance Analysis for various ML algorithms with varying data sizes
We initially analysed the effect of varying data sizes on the performance of ML algorithms before analysing the effect of user demographics on the performance of the algorithms. As mentioned in earlier sections we have used the common ML models (a) Naïve Bayes (b) KNN (c) Logistic Regression (d) SVM (e) Random Forest.
The accuracy, specificity and sensitivity of various algorithms with (a) 41 users (b) 35 users (c) 30 users (d) 25 users (e) 20 users and (f) 10 users is shown in Figure 2, Figure 3, Figure 4, Figure 5, Figure 6 and Figure 7.
The best results among all the algorithms were obtained when heart rate was included, as can be seen in Figure 2 and Figure 5. The best result was obtained for 30 users for all algorithms, except for random forest (where the best result was obtained at 10 users), with heart rate the peak accuracy was 98.5% obtained by SVM and 96.5% without heart rate again in SVM. For all user combinations, with and without heart rate the sensitivities were higher than the specificity. This is as per the requirement for Fall detection. Since we are dealing with geriatrics a false positive is better than a false negative. The main activities that were incorrectly detected were those of User-1 as the subject had an erratic heart rate due to a medical condition known as Sinus Tachycardia. In the case of other users, very few ADL or Fall activities failed since we had selected the 10, 20, 25, 30 and 35 users randomly out of the total 41 users. Wherever user 1 was not selected we had better results. When heart rate was ignored several of the ADL activities which were related to “lying on the bed” or “getting up slowly/quickly from the bed” were incorrectly detected as falls depending purely on the IMU sensor’s values. Also “backward falls and falls from the bed” were incorrectly detected as ADL activities for several users. When heart rate was ignored more of User – 1 activities were incorrectly detected especially since several of the ADLs were construed as false positives. This included “lying on the bed”, “lying on the back and getting up slowly/quickly” and “transitioning sideways to one’s back while lying down”. This caused a drop in accuracy from 99% to 98%. Especially due to a drop in specificity values from 0.99 to 0.98. It can be concluded from the results that when we use the heart rate of a volunteer with severe health conditions the accuracies obtained are better especially since there will not be a huge spike in heart rate while performing Fall activities as against performing ADL activities. The sensitivity was higher by almost 1.5% when heart rate was used and the specificity was high when heart rate was ignored.
Table 4 and Table 5 show the accuracy, sensitivity and specificity for the various age groups “under 30”, “30-40” and “40-50” for individual algorithms with and without heart rate. As usual, Naïve Bayes gives the lowest accuracy and SVM gives the highest accuracy. When training and testing were done with the same age group, it can be observed from the table that the impact of accuracy is not much. The accuracies have dropped in the case of all the algorithms as the size of the dataset would have been reduced as we only considered volunteers under the age of 30. While the accuracies of SVM with the whole dataset went up to 98.5%, here the highest accuracy again being produced by SVM is 95.10% for the age group of >30, in the case of 30-40 it drops to 87.50% as the number of volunteers in this age group was lesser. At 40-50 it was higher at 90.91%. In the case of 40-50, Random Forest and Logistic Regression gave the highest accuracies at 93.18%. Random Forest’s Decision trees work equally well with large as well as smaller data sets. When the simulations were run with volunteers being under 30, heart rate had a huge impact for the higher age range which is 40-50 with Random Forest giving an accuracy of 99.31%. But in the case of 30-40, the IMU sensors had the higher impact. Since in most scenarios in practical life, volunteers would be in the age group of below 30 and users will be in the range of 50 and above; The impact of heart-rate is very significant. When we analysed which of the users were causing a fall in accuracy, they were primarily users in the age range of 30-40 but though they were physically fit, they had pre-existing health conditions and were on medications. Primarily user 30 with the pre-existing prostate condition and user 35 with a pre-existing diabetic condition.
Table 6 and Table 7 show the accuracy, sensitivity and specificity of the male and female participants for individual ML algorithms with and without heart rate. From the table, it can be seen that we get better accuracies with heart rate in the case of male but in the case of female the accuracies fall with heart rate. In case of females, the accuracies seems to increase or drop erratically because the number of female were only little more than 1/3rd of the entire set of volunteers. When trained with the Male data set and tested with the Female, we got better results both in case of With and Without heart rate, because the training was done with a larger population than the number of test subjects. This shows that the size of the data set has a huge impact while the gender does not have a large impact in accuracy. So its very important to train the models with large datasets with the gender being insignificant. The train set must be larger than the test set.
Table 8 and Table 9 show the accuracy, sensitivity and specificity for subjects with pre-existing health conditions and subjects who did not have any health conditions were used as participants. Table 8 shows the result with heart rate whereas Table 9 shows the result without heart rate.
Of the 41 volunteers, 12 of them had pre-existing health conditions that varied from high blood pressure, diabetes, claustrophobia, vertigo, sinus trachardia, prostate and obesity, etc. To study the effect of health conditions on the prediction we ran the algorithm separately for the volunteers with health issues and without health issues. Performance of the algorithms was better when heart rate was associated with people who did not have any pre-existing health issues. When we tried training the algorithm using people with health issues and testing them with volunteers who did not have any health issues and vice-versa, the heart rate had no such impact in the first case however in the second case there was a slight improvement in accuracies as can be seen in Table 8 and Table 9.
Based on this we can come to a conclusion that the presence of health issues does affect the accuracy of fall detection and since erratic heart rate is usually associated with health issues, there is more possibility of errors when heart rate is used as one of the features to detect falls. This will prove to be a major hurdle as we move forward in our research since there are very few elderly who do not have any pre-existing health conditions, in fact in our 40-50 age group only one volunteer had no health issue or was not under any form of medication.
Table 10 and Table 11 show the accuracy, sensitivity and specificity for the subjects having height below 5ft 5in and subjects having height above 5ft 5in for data with and without heart rate respectively. The behaviour of the model would definitely be impacted by the height of the person as the amount of change in IMU values would be dependent on the person’s height. For a person whose height is above 5ft 5in, which is also the average height of a person of Indian origin, there is no effect of heart rate on the accuracy and the accuracy is completely dependent on the values derived from the IMU sensors. For people who are lesser than 5ft 5in the accuracy drops when heart rate is used. Even otherwise accuracies for people of height more than 5ft 5in are slightly higher than the volunteers whose height is lesser than 5ft 5in. With progression in age, the skeletal structure of a person may change introducing conditions such as hunchbacks which may cause a reduction in height, and hence the accuracies will be affected. When we trained using volunteers of height greater than 5ft5in and tested with volunteers with height less than 5ft 5in, there was a definite drop in accuracy both with and without heart rate. Whereas when we trained with people of height less than 5ft5in and tested using volunteers of height greater than 5ft5in, in the case of some of the ML models, there was a slight increase in accuracy with and without heart rate. This shows that the IMU sensors produce drastically different values that varies with the height of the person. Though we are extracting statistical parameters, the height of the person has a huge impact on the accuracy of the model. Hence, if we use volunteers who are young and in good physical condition and having an above average height to train the ML models and use it on elderly who will have pre-existing health issues, weakening of the muscular structure and reduced height, several of the ADLs may be misinterpreted as falls because the drop in accuracy here is due to the drop in specificity rather than sensitivity. This might be acceptable because in the case of the elderly, it is better to err on the side of caution.
Table 12 and Table 13 show the accuracy, sensitivity and specificity for the subjects having weight in the range of 50-65 kgs, subjects having weight in the range of 65 to 80, subjects having weight in the range of 80 to 120 Kgs with and without heart rates respectively. The impact of the weight of the subject on accuracies is very high, with accuracies for lower weight range i.e 50-65 Kgs and accuracy drops with an increase in weight. Also, the impact of heart rate on accuracy is visible only in the weight ranges of 80-120 kgs. As the weight of the person will have an impact on the heart rate as he/she performs stressful activities. Again cross-testing and training have the least impact on the weight ranges of 50-65 Kgs. When trained on the weight range of 50-65 Kgs and tested against ranges 65-80 and 80-120, the accuracies are not severely affected. But training with other weight ranges affects the accuracy as can be seen in the table. The drop in the accuracies in the weight range 65-80 is mainly due to the drop in specificity rather than sensitivity. When the weight is in the range of 50-65 which is usually below the Indian average or 80-120 which is above the Indian average, most of the ADL activities are detected correctly except in the case of Naïve Bayes where the sensitivity is better than specificity, but NB is more of a threshold based algorithm and its accuracies are generally very low. Again the elderly are prone to be frail with their weight being less than the average. Hence, we can get better accuracies irrespective of the age group used for training and testing.
6. Conclusion
Though there a multiple data sets available, and we have used them in our previous works, we were unable to interpret the reasons for the rise or fall in accuracy. Hence we collected our own data and analyzed it. In this paper, we have attempted to analyze the effect of various characteristics such as age, height, weight, gender and health issues on the accuracy of the various well-known ML algorithms. In geriatric fall detection, it is a given that the test volunteers and the actual users will belong to different categories. While the test subjects are usually in the age range of 20-35 in most data sets, we stretched the age range between 20-50, but the actual users would be the elderly or the super elderly. While we did have some users who had serious existing health conditions and were on medication and we did find a fall in accuracy when we trained using healthy volunteers and tested the accuracy for volunteers with health issues. The loss in accuracy was primarily due to a drop in specificity hence some of the ADLs were being incorrectly interpreted. In some cases, the use of heart rate helped improve the accuracy in some cases the impact of heart rate caused a drop in accuracy. But we still recommend the use of heart rate as one of the parameters as any changes in heart rate in the elderly supported by the data from IMU sensors may be indicative of a fall.
The problem with multiple datasets is also that the demographics of the users tend to change with countries. In countries with a good health infrastructure and where healthy living is promoted, the ageing process is more graceful. The average height and weight also vary across countries. In India, healthy living and exercising are new concepts, overindulgence is a norm here; hence most elderly India suffer from various health conditions, and very few of them have access to good healthcare services due to the cost. Falls may times go undetected, repeated falls in the elderly are also very common in India. We need data sets that represent the Indian demographics. We have attempted to create such a database and we have analyzed the database in detail for various user parameters such as age, gender, health issues, height and weight.
The number of features we have is 100,208 after feature extraction, we also plan to add certain parameters such as height and weight that have a huge impact on the accuracy as part of the features. We were also able to identify certain users who were outliers, this could be used to clean the data set further, we have currently retained the outliers as there may be final users who may have similar characteristics.
We plan to run the ML algorithms on the end device built around Qualcomm Snapdragon 820c. This means features have to be pruned and the ML algorithms compressed so that the latency in obtaining the prediction will be much lesser than the sampling rate and timely alerts can be issued.
Understanding the impact of features and user characteristics is the first step to pruning of features which is what we have attempted in this paper. We collected data that is specific to the local user demographics, extracted relevant features and analysed the performance of the ML algorithms on the collected data.
A perfect data set would be one where the demographics are uniform and similar to the end user demographics. While some public data sets have attempted to use the elderly to do a limited number of ADLs, they have not been able to show a significant improvement in accuracy. Hence, we have to proceed with skewed data sets. The application of ranking and pruning of features gains importance, this is the next step in our work. This is required as we plan to use Dew computing IoT model.
References
- United Nations, Department of Economic and Social Affairs, World Population Ageing 2020. https://www.un.org/development/desa/pd/sites/www.un.org.development.desa.pd/files/undesa_pd-2020_world_population_ageing_highlights.pdf. [Accessed 31-Mar-2023].
- Nandi, P.; Bajaj, A.; Anupama, K.R. Application of KNN for Fall Detection on Qualcomm SoCs. IoT Technologies for HealthCare; Spinsante, S., Iadarola, G., Paglialonga, A., Tramarin, F., Eds.; Springer Nature Switzerland: Cham, 2023; pp. 148–169. [Google Scholar] [CrossRef]
- Snapdragon 820c Development Board | Qualcomm — qualcomm.com. https://developer.qualcomm.com/hardware/dragonboard-820c. [Accessed 31-Mar-2023].
- Nandi, P.; Anupama, K.; Bajaj, A.; Shukla, S.; Musale, T.; Kachadiya, S. Performance evaluation of Machine Learning algorithms on System on Chips in Wearables for Healthcare Monitoring. Procedia Computer Science 2023, 218, 2755–2766. International Conference on Machine Learning and Data Engineering. [Google Scholar] [CrossRef]
- Liu, C.; Jiang, Z.; Su, X.; Benzoni, S.; Maxwell, A. Detection of Human Fall Using Floor Vibration and Multi-Features Semi-Supervised SVM. Sensors 2019, 19. [Google Scholar] [CrossRef] [PubMed]
- Salman Khan, M.; Yu, M.; Feng, P.; Wang, L.; Chambers, J. An unsupervised acoustic fall detection system using source separation for sound interference suppression. Signal Processing 2015, 110, 199–210. Machine learning and signal processing for human pose recovery and behavior analysis. [Google Scholar] [CrossRef]
- Lu, K.L.; Chu, E.T.H. An Image-Based Fall Detection System for the Elderly. Applied Sciences 2018, 8. [Google Scholar] [CrossRef]
- Luque, R.; Casilari, E.; Morón, M.J.; Redondo, G. Comparison and Characterization of Android-Based Fall Detection Systems. Sensors 2014, 14, 18543–18574. [Google Scholar] [CrossRef] [PubMed]
- Choi, Y.; Ralhan, A.S.; Ko, S. A Study on Machine Learning Algorithms for Fall Detection and Movement Classification. 2011 International Conference on Information Science and Applications, 2011, pp. 1–8. [CrossRef]
- Albert, M.V.; Kording, K.; Herrmann, M.; Jayaraman, A. Fall Classification by Machine Learning Using Mobile Phones. PLOS ONE 2012, 7, 1–6. [Google Scholar] [CrossRef]
- Özdemir, A.T.; Barshan, B. Detecting Falls with Wearable Sensors Using Machine Learning Techniques. Sensors 2014, 14, 10691–10708. [Google Scholar] [CrossRef]
- Koshmak, G.; Linden, M.; Loutfi, A. Dynamic Bayesian Networks for Context-Aware Fall Risk Assessment. Sensors 2014, 14, 9330–9348. [Google Scholar] [CrossRef]
- Chetty, G.; White, M.; Akther, F. Smart phone based data mining for human activity recognition. Proceedings of the International Conference on Information and Communication Technologies, ICICT 2014; Samuel, P., Ed.; Elsevier: Netherlands, 2015; Vol. 46, Procedia Computer Science, pp. 1181–1187. International Conference on Information and Communication Technologies : ICICT 2014 ; Conference date: 03-12-2014 Through 05-12-2014. [CrossRef]
- Genoud, D.; Cuendet, V.; Torrent, J. Soft Fall Detection Using Machine Learning in Wearable Devices. 2016 IEEE 30th International Conference on Advanced Information Networking and Applications (AINA), 2016, pp. 501–505. [CrossRef]
- Vallabh, P.; Malekian, R.; Ye, N.; Bogatinoska, D.C. Fall detection using machine learning algorithms. 2016 24th International Conference on Software, Telecommunications and Computer Networks (SoftCOM), 2016, pp. 1–9. [CrossRef]
- Kostopoulos, P.; Nunes, T.; Salvi, K.; Deriaz, M.; Torrent, J. F2D: A fall detection system tested with real data from daily life of elderly people. 2015. [CrossRef]
- Wang, H.; Li, M.; Li, J.; Cao, J.; Wang, Z. An improved fall detection approach for elderly people based on feature weight and Bayesian classification. 2016, pp. 471–476. [CrossRef]
- He, J.; Bai, S.; Wang, X. An Unobtrusive Fall Detection and Alerting System Based on Kalman Filter and Bayes Network Classifier. Sensors 2017, 17. [Google Scholar] [CrossRef]
- Guvensan, M.A.; Kansiz, A.O.; Camgoz, N.C.; Turkmen, H.I.; Yavuz, A.G.; Karsligil, M.E. An Energy-Efficient Multi-Tier Architecture for Fall Detection on Smartphones. Sensors 2017, 17. [Google Scholar] [CrossRef]
- Hsieh, C.Y.; Liu, K.C.; Huang, C.N.; Chu, W.C.; Chan, C.T. Novel Hierarchical Fall Detection Algorithm Using a Multiphase Fall Model. Sensors 2017, 17. [Google Scholar] [CrossRef] [PubMed]
- Jahanjoo, A.; Tahan, M.N.; Rashti, M.J. Accurate fall detection using 3-axis accelerometer sensor and MLF algorithm. 2017 3rd International Conference on Pattern Recognition and Image Analysis (IPRIA), 2017, pp. 90–95. [CrossRef]
- Yu, S.; Chen, H.; Brown, R.A. Hidden Markov Model-Based Fall Detection With Motion Sensor Orientation Calibration: A Case for Real-Life Home Monitoring. IEEE Journal of Biomedical and Health Informatics 2018, 22, 1847–1853. [Google Scholar] [CrossRef] [PubMed]
- Liang, H.; Usaha, W. Fall detection using lifting wavelet transform and support vector machine. 2017 Federated Conference on Computer Science and Information Systems (FedCSIS), 2017, pp. 877–883. [CrossRef]
- Jefiza, A.; Pramunanto, E.; Boedinoegroho, H.; Purnomo, M.H. Fall detection based on accelerometer and gyroscope using back propagation. 2017 4th International Conference on Electrical Engineering, Computer Science and Informatics (EECSI), 2017, pp. 1–6. [CrossRef]
- Kao, H.C.; Hung, J.C.; Huang, C.P. GA-SVM applied to the fall detection system. 2017 International Conference on Applied System Innovation (ICASI), 2017, pp. 436–439. [CrossRef]
- Li, H.; Shrestha, A.; Fioranelli, F.; Le Kernec, J.; Heidari, H.; Pepa, M.; Cippitelli, E.; Gambi, E.; Spinsante, S. Multisensor data fusion for human activities classification and fall detection. 2017 IEEE SENSORS, 2017, pp. 1–3. [CrossRef]
- Fakhrulddin, A.H.; Fei, X.; Li, H. Convolutional neural networks (CNN) based human fall detection on Body Sensor Networks (BSN) sensor data. 2017 4th International Conference on Systems and Informatics (ICSAI), 2017, pp. 1461–1465. [CrossRef]
- Hakim, A.; Huq, M.S.; Shanta, S.; Ibrahim, B. Smartphone Based Data Mining for Fall Detection: Analysis and Design. Procedia Computer Science 2017, 105, 46–51. 2016 IEEE International Symposium on Robotics and Intelligent Sensors, IRIS 2016, 17-20 December 2016, Tokyo, Japan. [Google Scholar] [CrossRef]
- Yang, X.; Dinh, A.; Chen, L. A wearable real-time fall detector based on Naive Bayes classifier. CCECE 2010, 2010, pp. 1–4. [Google Scholar] [CrossRef]
- Tsinganos, P.; Skodras, A. A smartphone-based fall detection system for the elderly. Proceedings of the 10th International Symposium on Image and Signal Processing and Analysis, 2017, pp. 53–58. [CrossRef]
- Zhao, S.; Li, W.; Niu, W.; Gravina, R.; Fortino, G. Recognition of human fall events based on single tri-axial gyroscope. 2018, pp. 1–6. [CrossRef]
- Putra, I.P.E.S.; Brusey, J.; Gaura, E.; Vesilo, R. An Event-Triggered Machine Learning Approach for Accelerometer-Based Fall Detection. Sensors 2018, 18. [Google Scholar] [CrossRef]
- Liu, K.C.; Hsieh, C.Y.; Hsu, S.; Chan, C.T. Impact of Sampling Rate on Wearable-Based Fall Detection Systems Based on Machine Learning Models. IEEE Sensors Journal 2018, PP, 1–1. [Google Scholar] [CrossRef]
- Ramachandran, A.; Adarsh, R.; Pahwa, P.; Anupama, K.R. Machine Learning-based Fall Detection in Geriatric Healthcare Systems. 2018 IEEE International Conference on Advanced Networks and Telecommunications Systems (ANTS), 2018, pp. 1–6. [CrossRef]
- Torti, E.; Fontanella, A.; Musci, M.; Blago, N.; Pau, D.; Leporati, F.; Piastra, M. Embedded Real-Time Fall Detection with Deep Learning on Wearable Devices. 2018 21st Euromicro Conference on Digital System Design (DSD), 2018, pp. 405–412. [CrossRef]
- Rodrigues, T.B.; Salgado, D.P.; Cordeiro, M.C.; Osterwald, K.M.; Filho, T.F.; de Lucena, V.F.; Naves, E.L.; Murray, N. Fall Detection System by Machine Learning Framework for Public Health. Procedia Computer Science 2018, 141, 358–365. The 9th International Conference on Emerging Ubiquitous Systems and Pervasive Networks (EUSPN-2018) / The 8th International Conference on Current and Future Trends of Information and Communication Technologies in Healthcare (ICTH-2018) / Affiliated Workshops. [Google Scholar] [CrossRef]
- Yacchirema, D.; de Puga, J.S.; Palau, C.; Esteve, M. Fall detection system for elderly people using IoT and Big Data. Procedia Computer Science 2018, 130, 603–610. The 9th International Conference on Ambient Systems, Networks and Technologies (ANT 2018) / The 8th International Conference on Sustainable Energy Information Technology (SEIT-2018) / Affiliated Workshops. [Google Scholar] [CrossRef]
- Musci, M.; De Martini, D.; Blago, N.; Facchinetti, T.; Piastra, M. Online Fall Detection Using Recurrent Neural Networks on Smart Wearable Devices. IEEE Transactions on Emerging Topics in Computing 2021, 9, 1276–1289. [Google Scholar] [CrossRef]
- Dawar, N.; Kehtarnavaz, N. A Convolutional Neural Network-Based Sensor Fusion System for Monitoring Transition Movements in Healthcare Applications. 2018 IEEE 14th International Conference on Control and Automation (ICCA), 2018, pp. 482–485. [CrossRef]
- Nguyen, T.L.; Le, T.A.; Pham, C. The Internet-of-Things based Fall Detection Using Fusion Feature. 2018 10th International Conference on Knowledge and Systems Engineering (KSE), 2018, pp. 129–134. [CrossRef]
- Chelli, A.; Pätzold, M. A Machine Learning Approach for Fall Detection and Daily Living Activity Recognition. IEEE Access 2019, 7, 38670–38687. [Google Scholar] [CrossRef]
- Hussain, F.; Hussain, F.; Ehatisham-ul Haq, M.; Azam, M.A. Activity-Aware Fall Detection and Recognition Based on Wearable Sensors. IEEE Sensors Journal 2019, 19, 4528–4536. [Google Scholar] [CrossRef]
- Santos, G.L.; Endo, P.T.; Monteiro, K.H.d.C.; Rocha, E.d.S.; Silva, I.; Lynn, T. Accelerometer-Based Human Fall Detection Using Convolutional Neural Networks. Sensors 2019, 19. [Google Scholar] [CrossRef] [PubMed]
- Cahoolessur, D.; Rajkumarsingh, B. Fall Detection System using XGBoost and IoT. R and D Journal 2020, 36, 8–18. [Google Scholar] [CrossRef]
- Mrozek, D.; Koczur, A.; Małysiak-Mrozek, B. Fall detection in older adults with mobile IoT devices and machine learning in the cloud and on the edge. Information Sciences 2020, 537, 132–147. [Google Scholar] [CrossRef]
- Ramachandran, A.; Ramesh, A.; Karuppiah, A. Evaluation of Feature Engineering on Wearable Sensor-based Fall Detection. 2020 International Conference on Information Networking (ICOIN), 2020, pp. 110–114. [CrossRef]
- Usmani, S.; Saboor, A.; Haris, M.; Khan, M.A.; Park, H. Latest Research Trends in Fall Detection and Prevention Using Machine Learning: A Systematic Review. Sensors 2021, 21. [Google Scholar] [CrossRef]
- Nahian, M.J.A.; Ghosh, T.; Banna, M.H.A.; Aseeri, M.A.; Uddin, M.N.; Ahmed, M.R.; Mahmud, M.; Kaiser, M.S. Towards an Accelerometer-Based Elderly Fall Detection System Using Cross-Disciplinary Time Series Features. IEEE Access 2021, 9, 39413–39431. [Google Scholar] [CrossRef]
- Şengül, G.; Karakaya, M.; Misra, S.; Abayomi-Alli, O.O.; Damaševičius, R. Deep learning based fall detection using smartwatches for healthcare applications. Biomedical Signal Processing and Control 2022, 71, 103242. [Google Scholar] [CrossRef]
- Mansoor, M.; Amin, R.; Mustafa, Z.; Sengan, S.; Aldabbas, H.; Alharbi, M.T. A machine learning approach for non-invasive fall detection using Kinect. Multimedia Tools and Applications 2022, 81, 15491–15519. [Google Scholar] [CrossRef]
- Karar, M.E.; Shehata, H.I.; Reyad, O. A Survey of IoT-Based Fall Detection for Aiding Elderly Care: Sensors, Methods, Challenges and Future Trends. Applied Sciences 2022, 12. [Google Scholar] [CrossRef]
- New Galaxy Watch 5 Smartwatch | Specs | Samsung UK — samsung.com. https://www.samsung.com/uk/watches/galaxy-watch/galaxy-watch5-44mm-sapphire-bt-sm-r910nzbaeua/. [Accessed 31-Mar-2023].
- Vembandasamy, K.; Sasipriya, R.; Deepa, E. Heart diseases detection using Naive Bayes. IJISET - Int. J. Innov. Sci. Eng. Tech 2015, 2. [Google Scholar]
- Alpaydin, E. Voting over Multiple Condensed Nearest Neighbors. Artificial Intelligence Review 1997, 11, 115–132. [Google Scholar] [CrossRef]
- Hosmer, D.W.; Lemeshow, S. Applied Logistic Regression, 2nd edn. Wiley-Interscience; Wiley-Interscience: Hoboken, NJ, 2000. [Google Scholar]
- Breiman, L. Classification and Regression Trees (1st ed.); Routledge, 1984. [Google Scholar] [CrossRef]
- Liu, S.H.; Cheng, W.C. Fall detection with the support vector machine during scripted and continuous unscripted activities. Sensors (Basel) 2012, 12, 12301–12316. [Google Scholar] [CrossRef] [PubMed]
Figure 1.
Architectural model of wearable fall detection system.
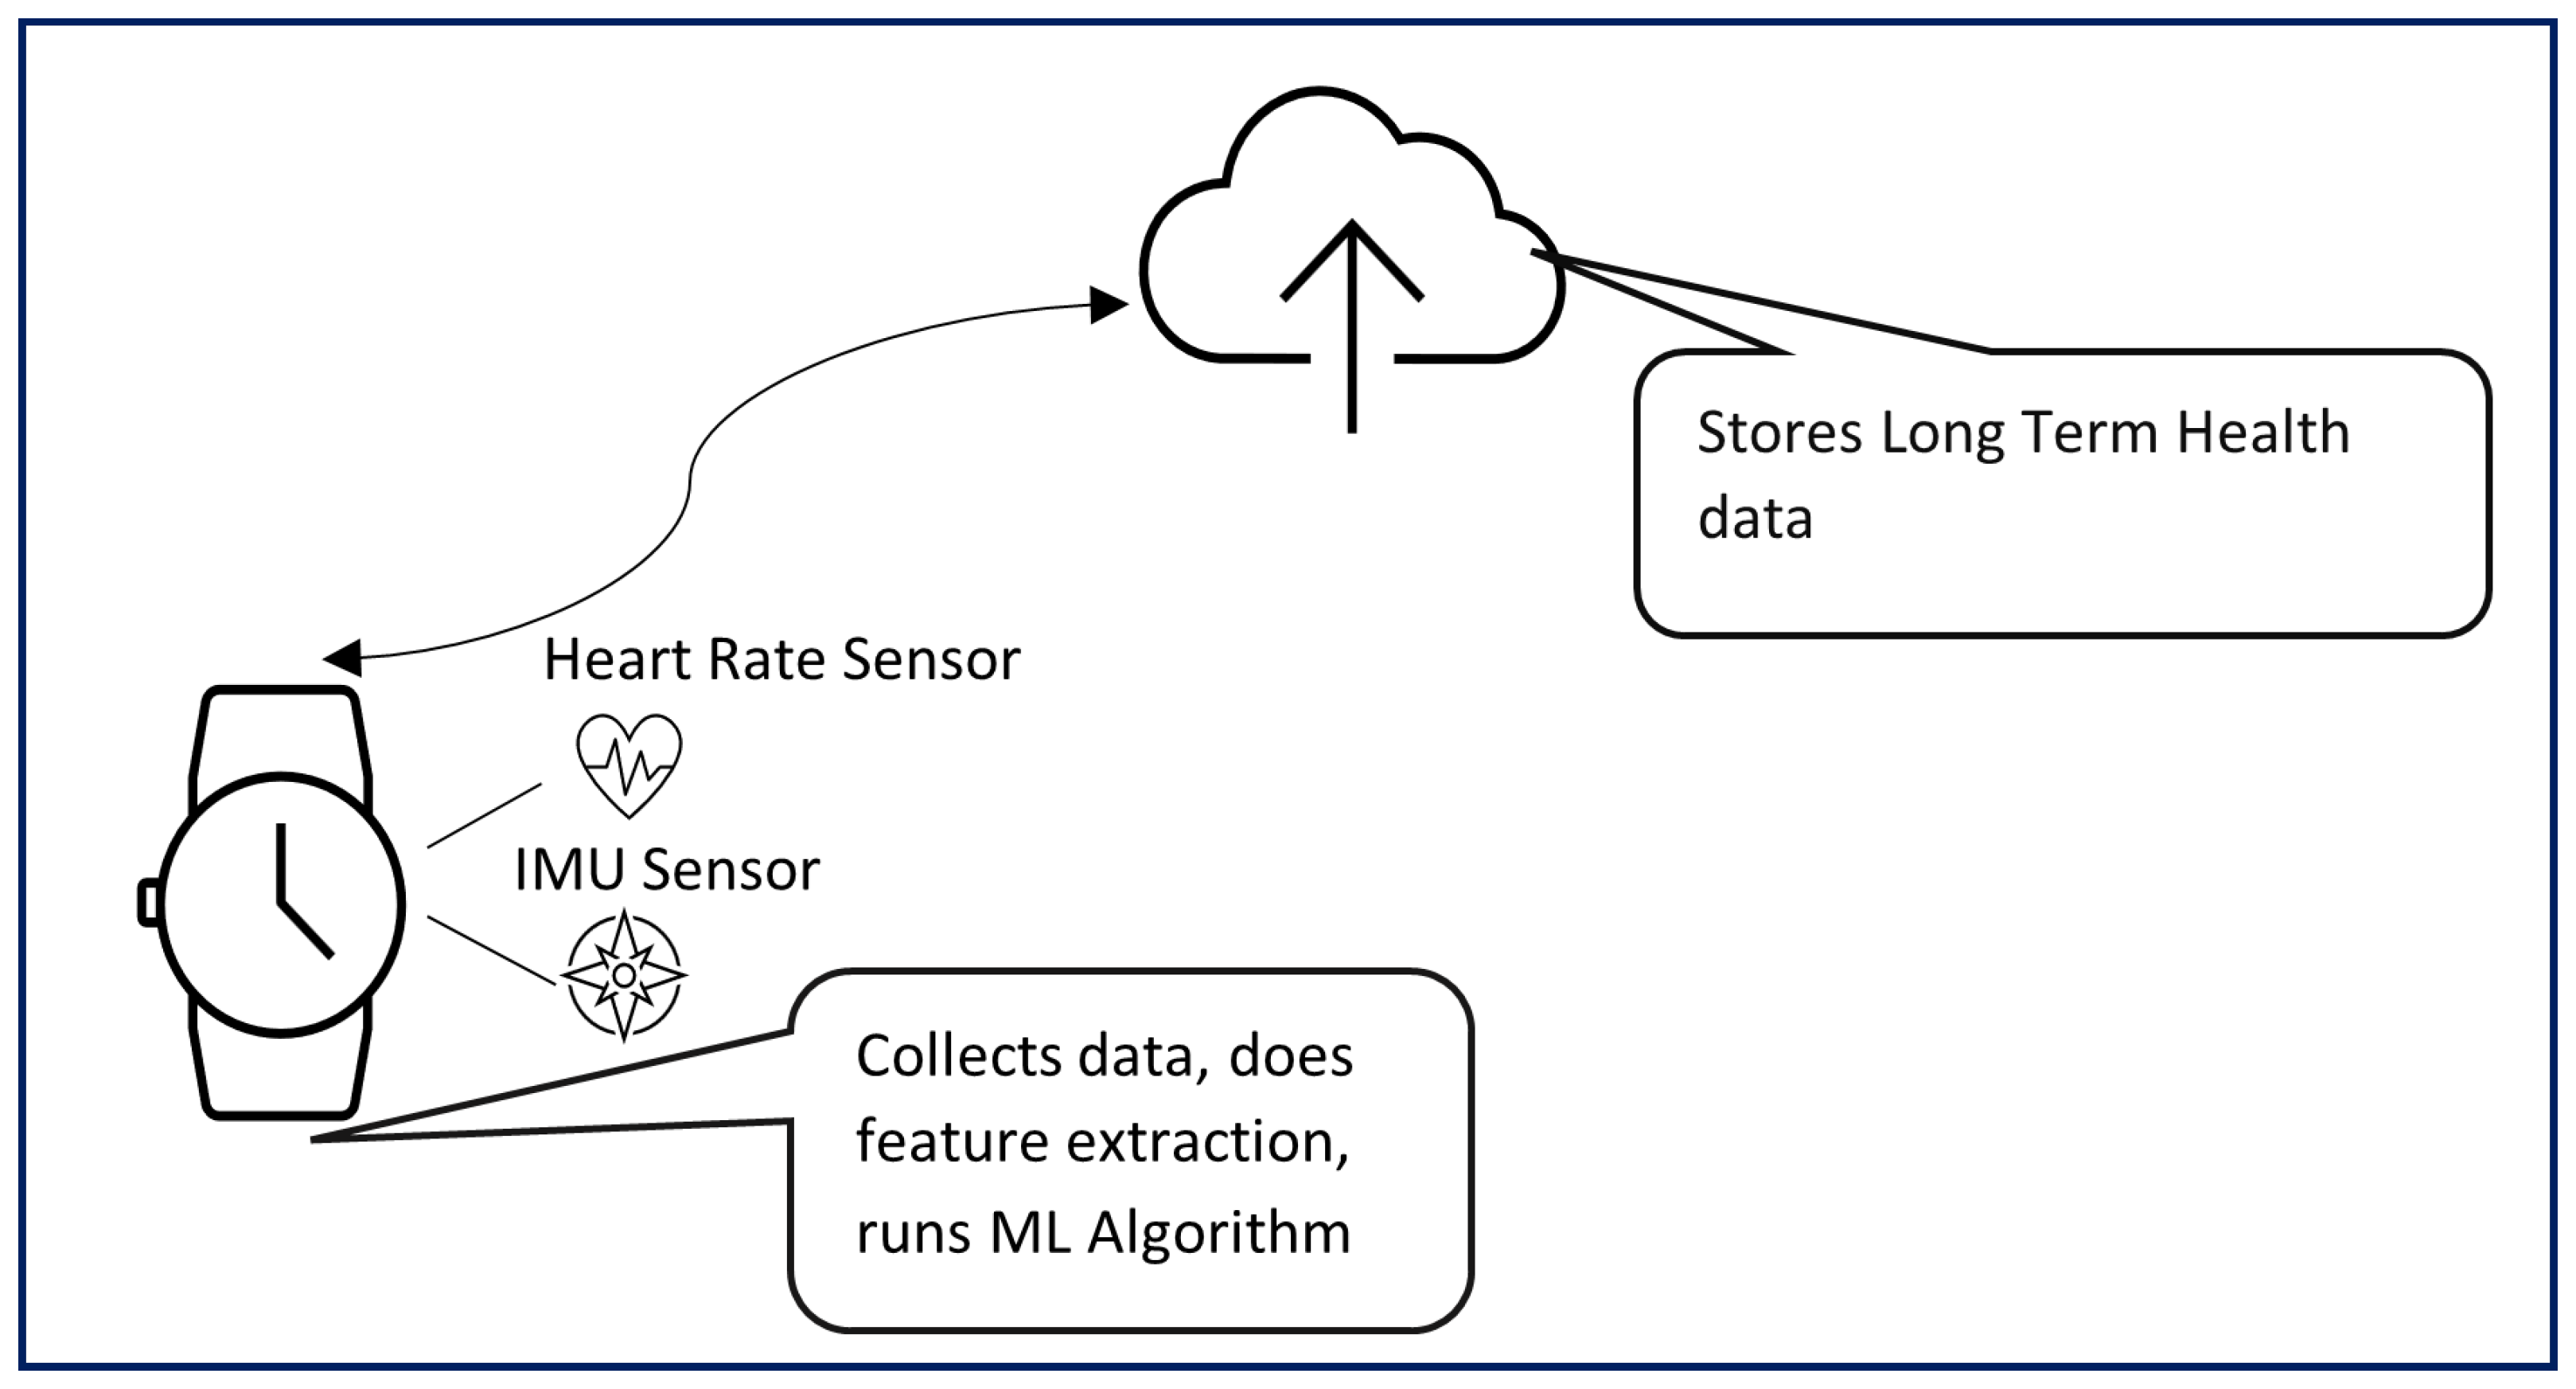
Figure 2.
Accuracy vs number of users (without heart rate).
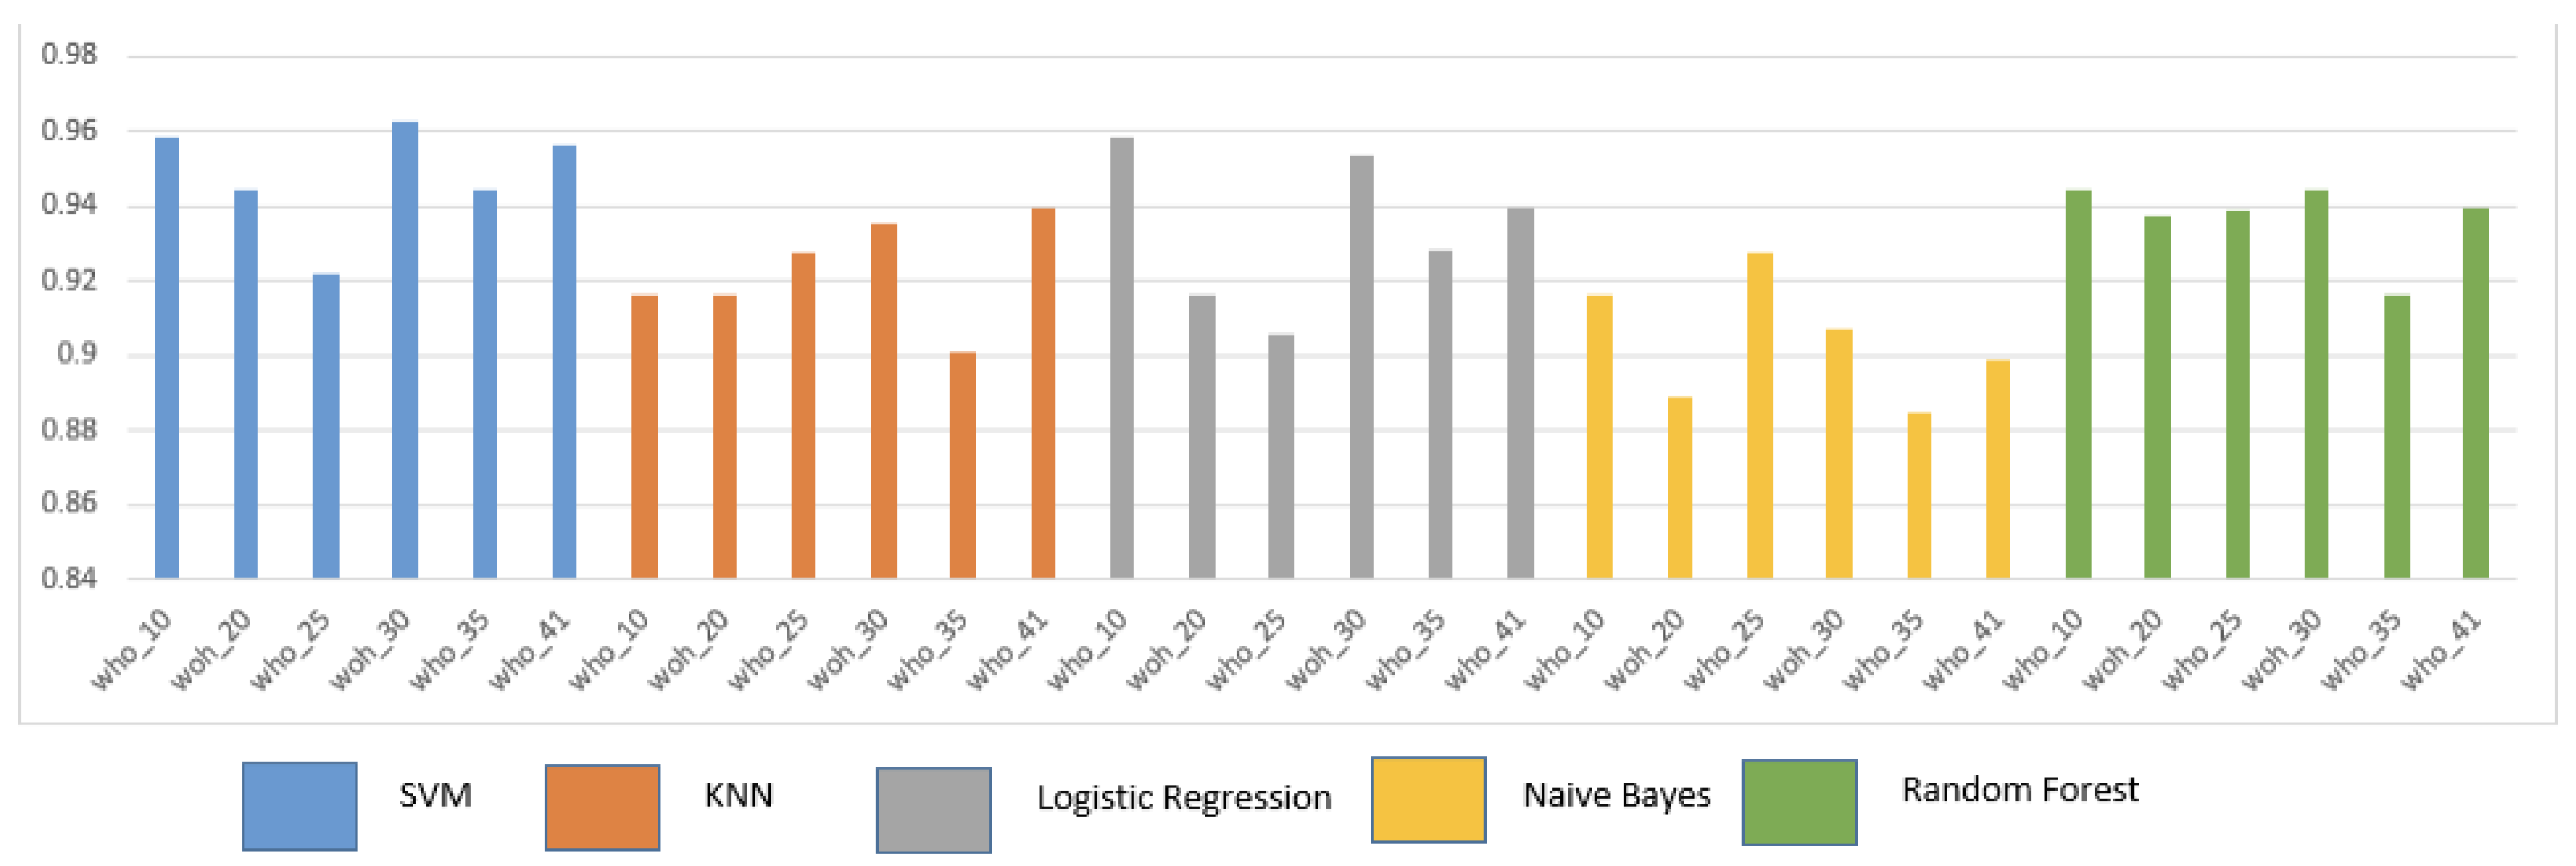
Figure 3.
Specificity vs number of users (without heart rate).
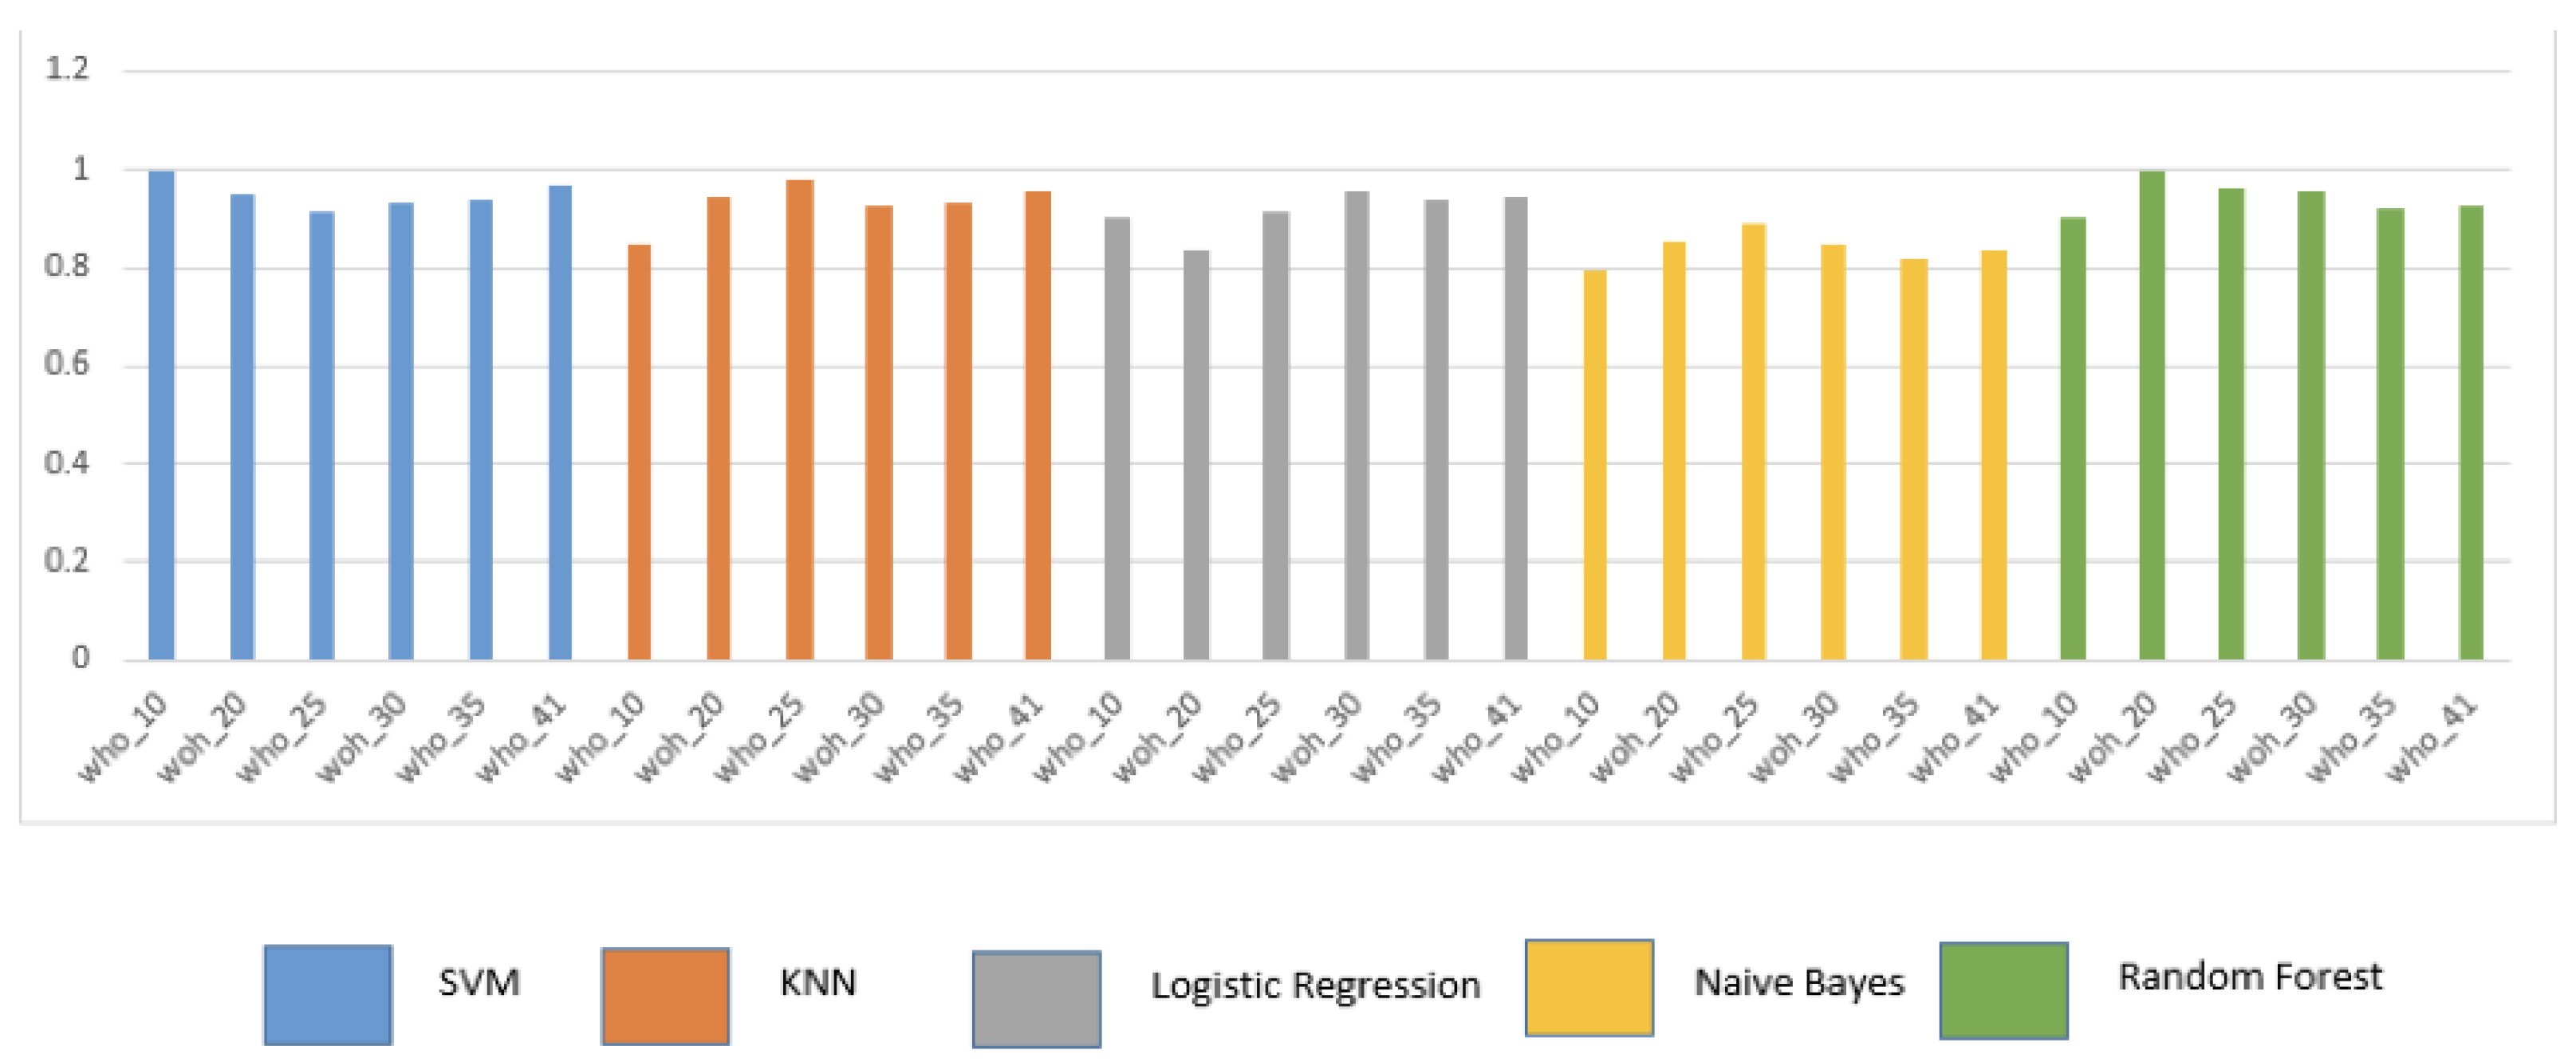
Figure 4.
Sensitivity vs number of users (without heart rate).
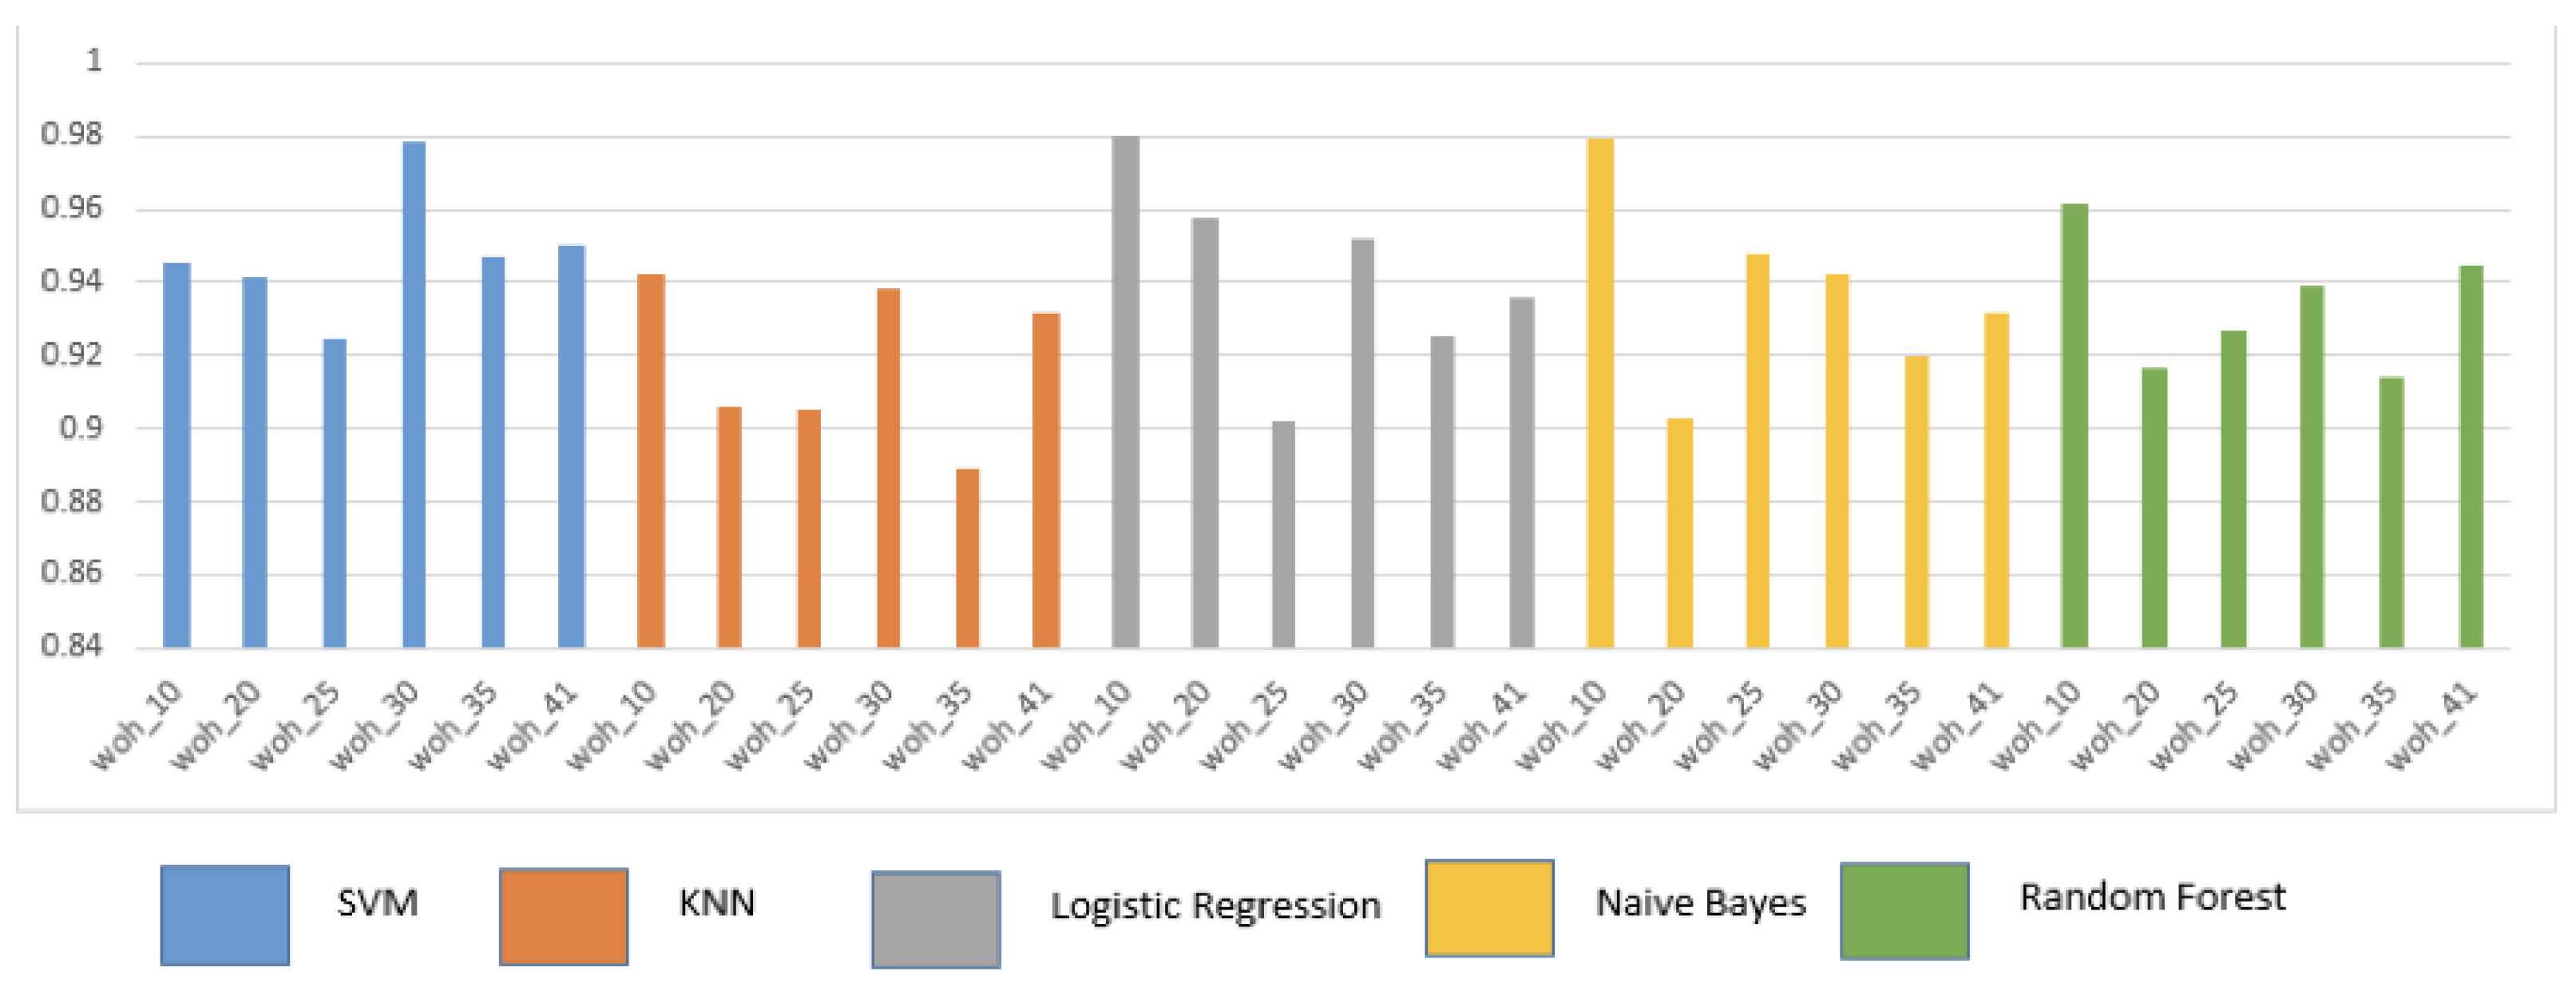
Figure 5.
Accuracy vs number of users (with heart rate).
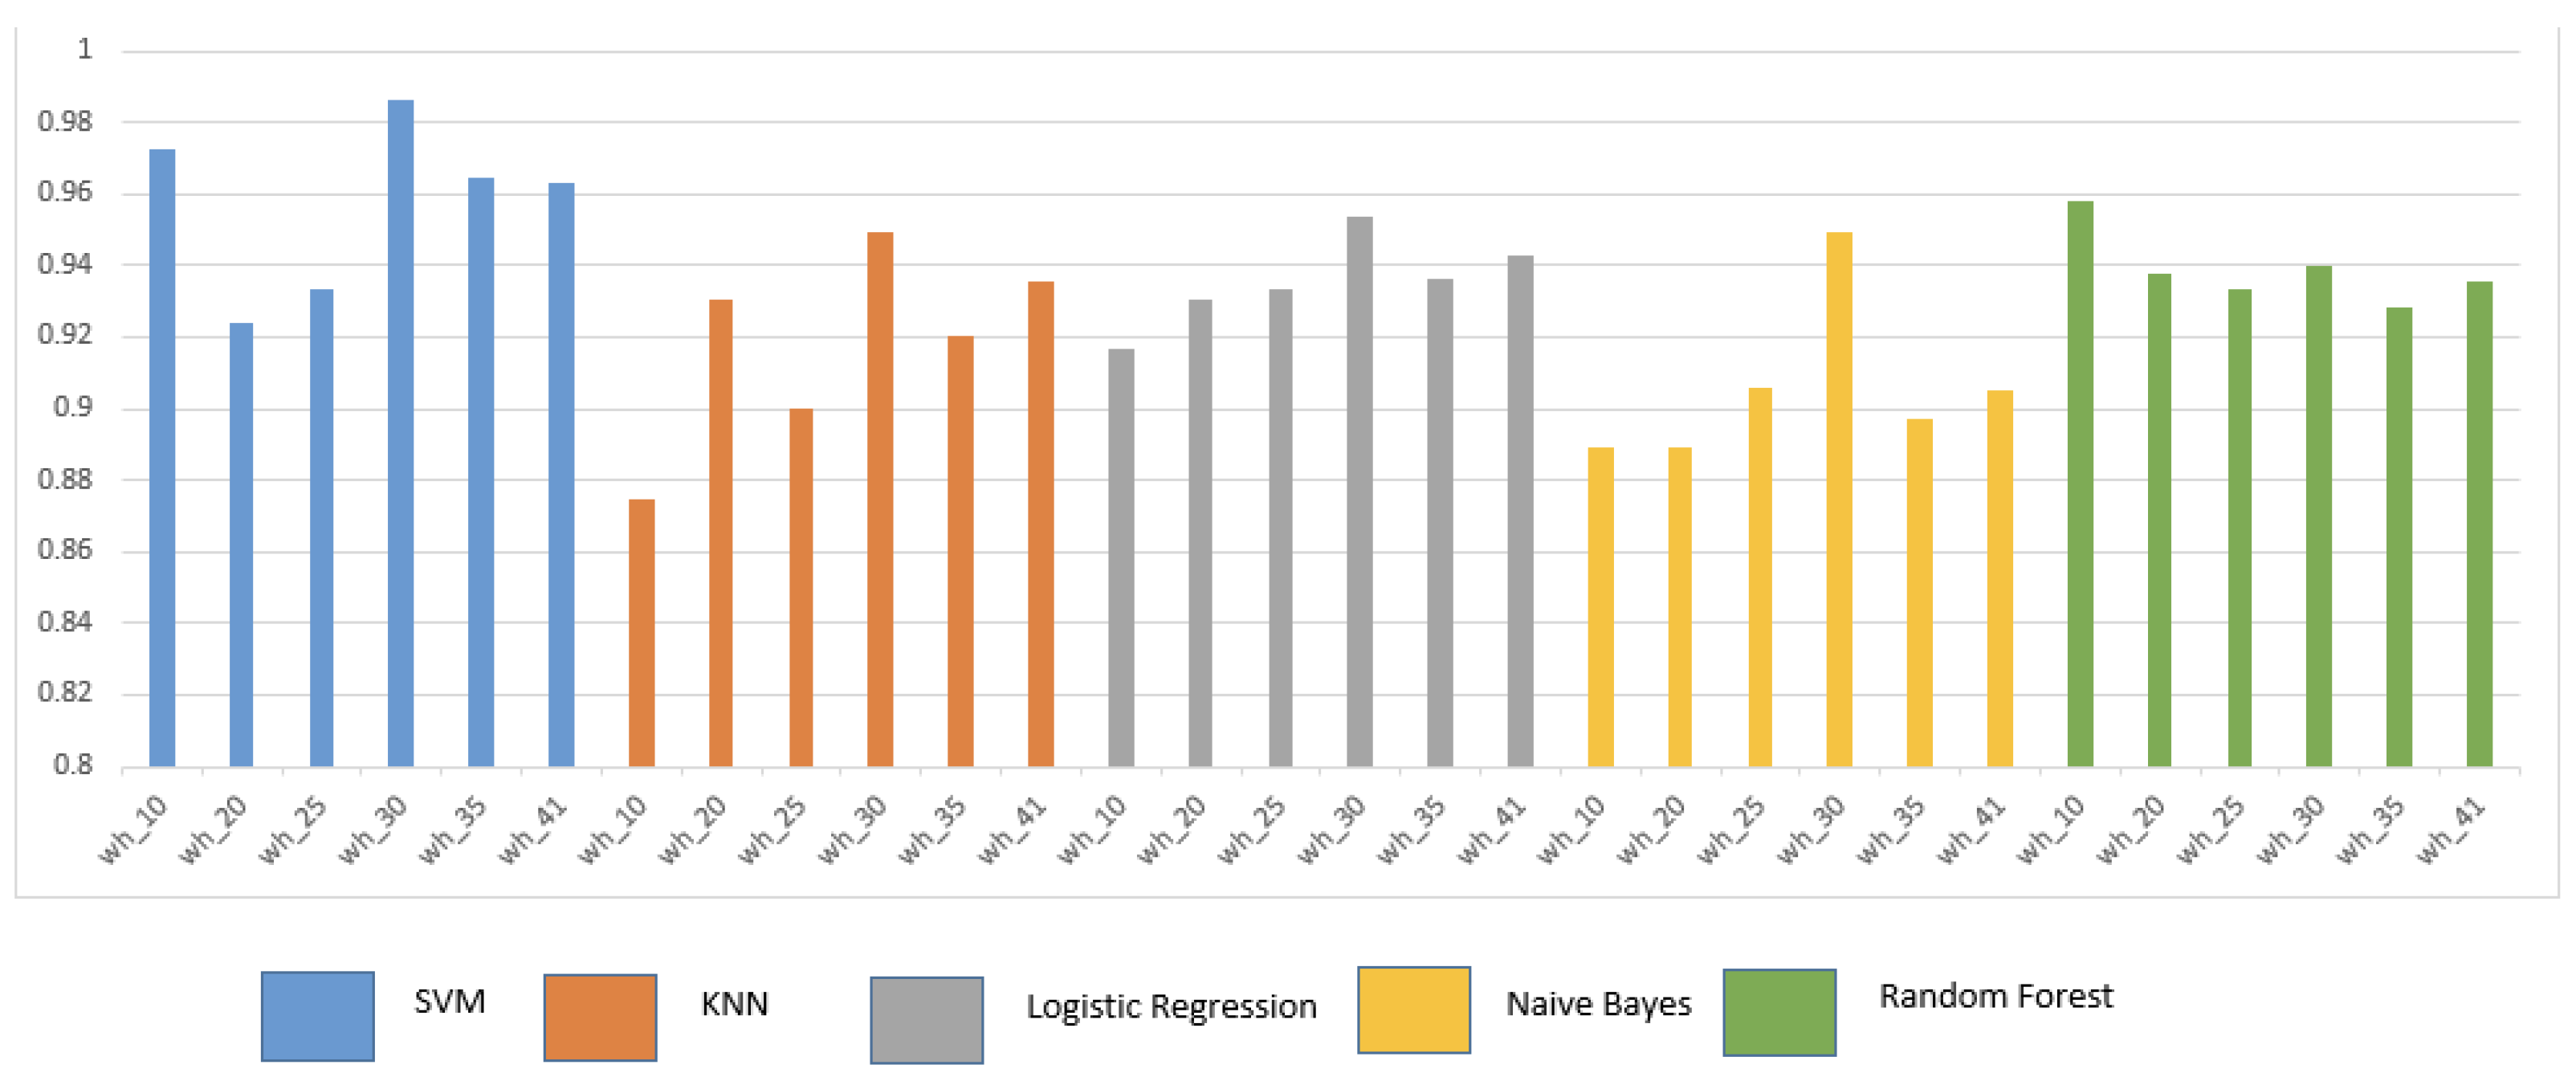
Figure 6.
Specificity vs number of users (with heart rate).
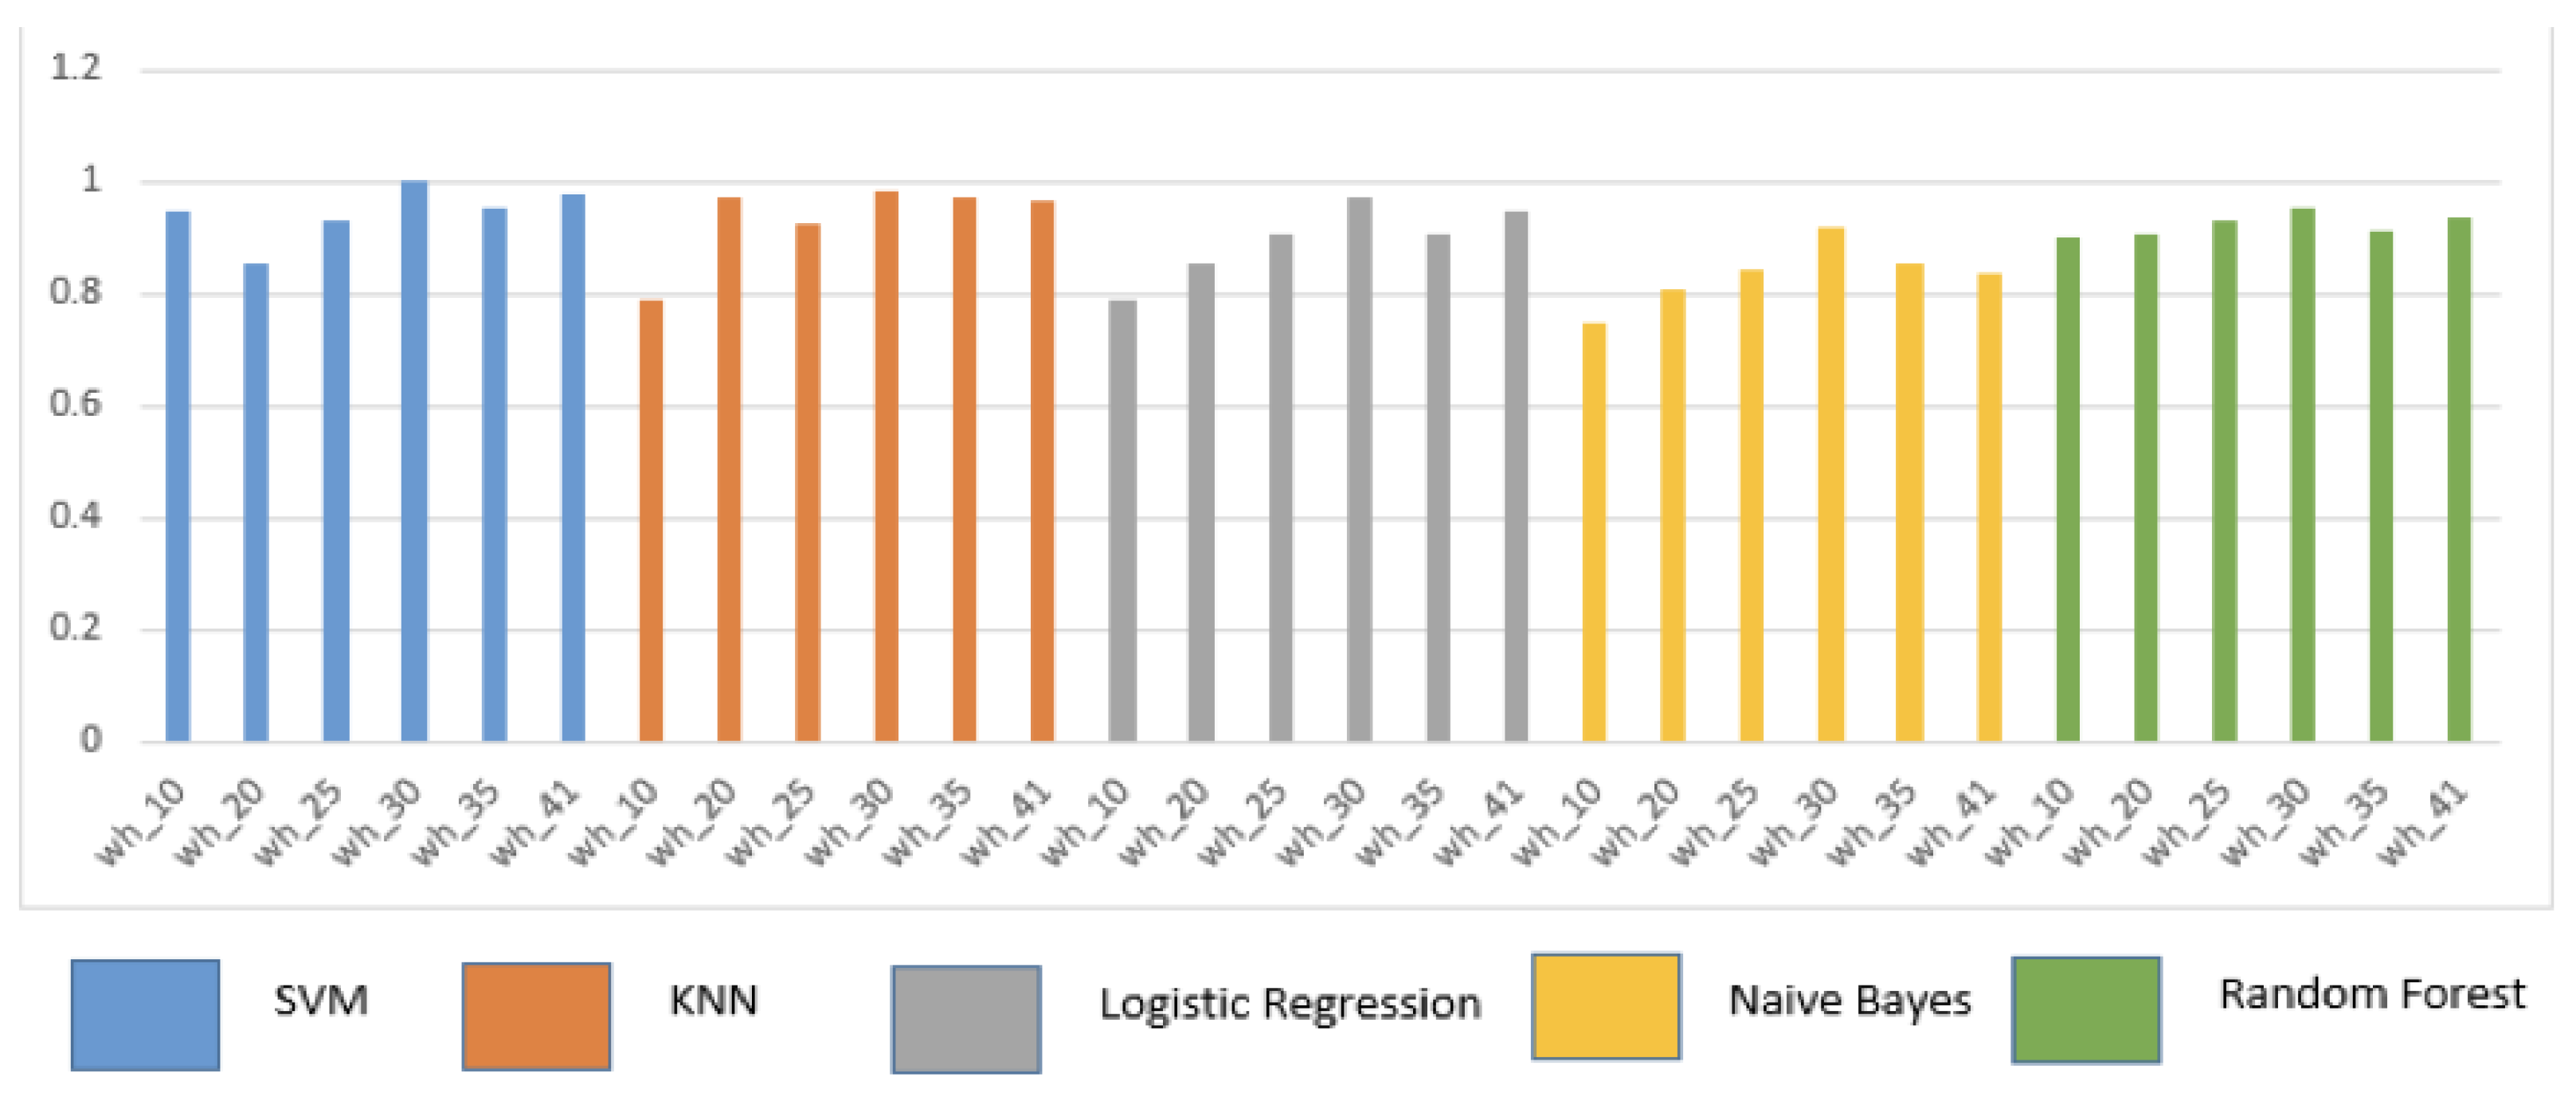
Figure 7.
Sensitivity vs number of users (with heart rate).
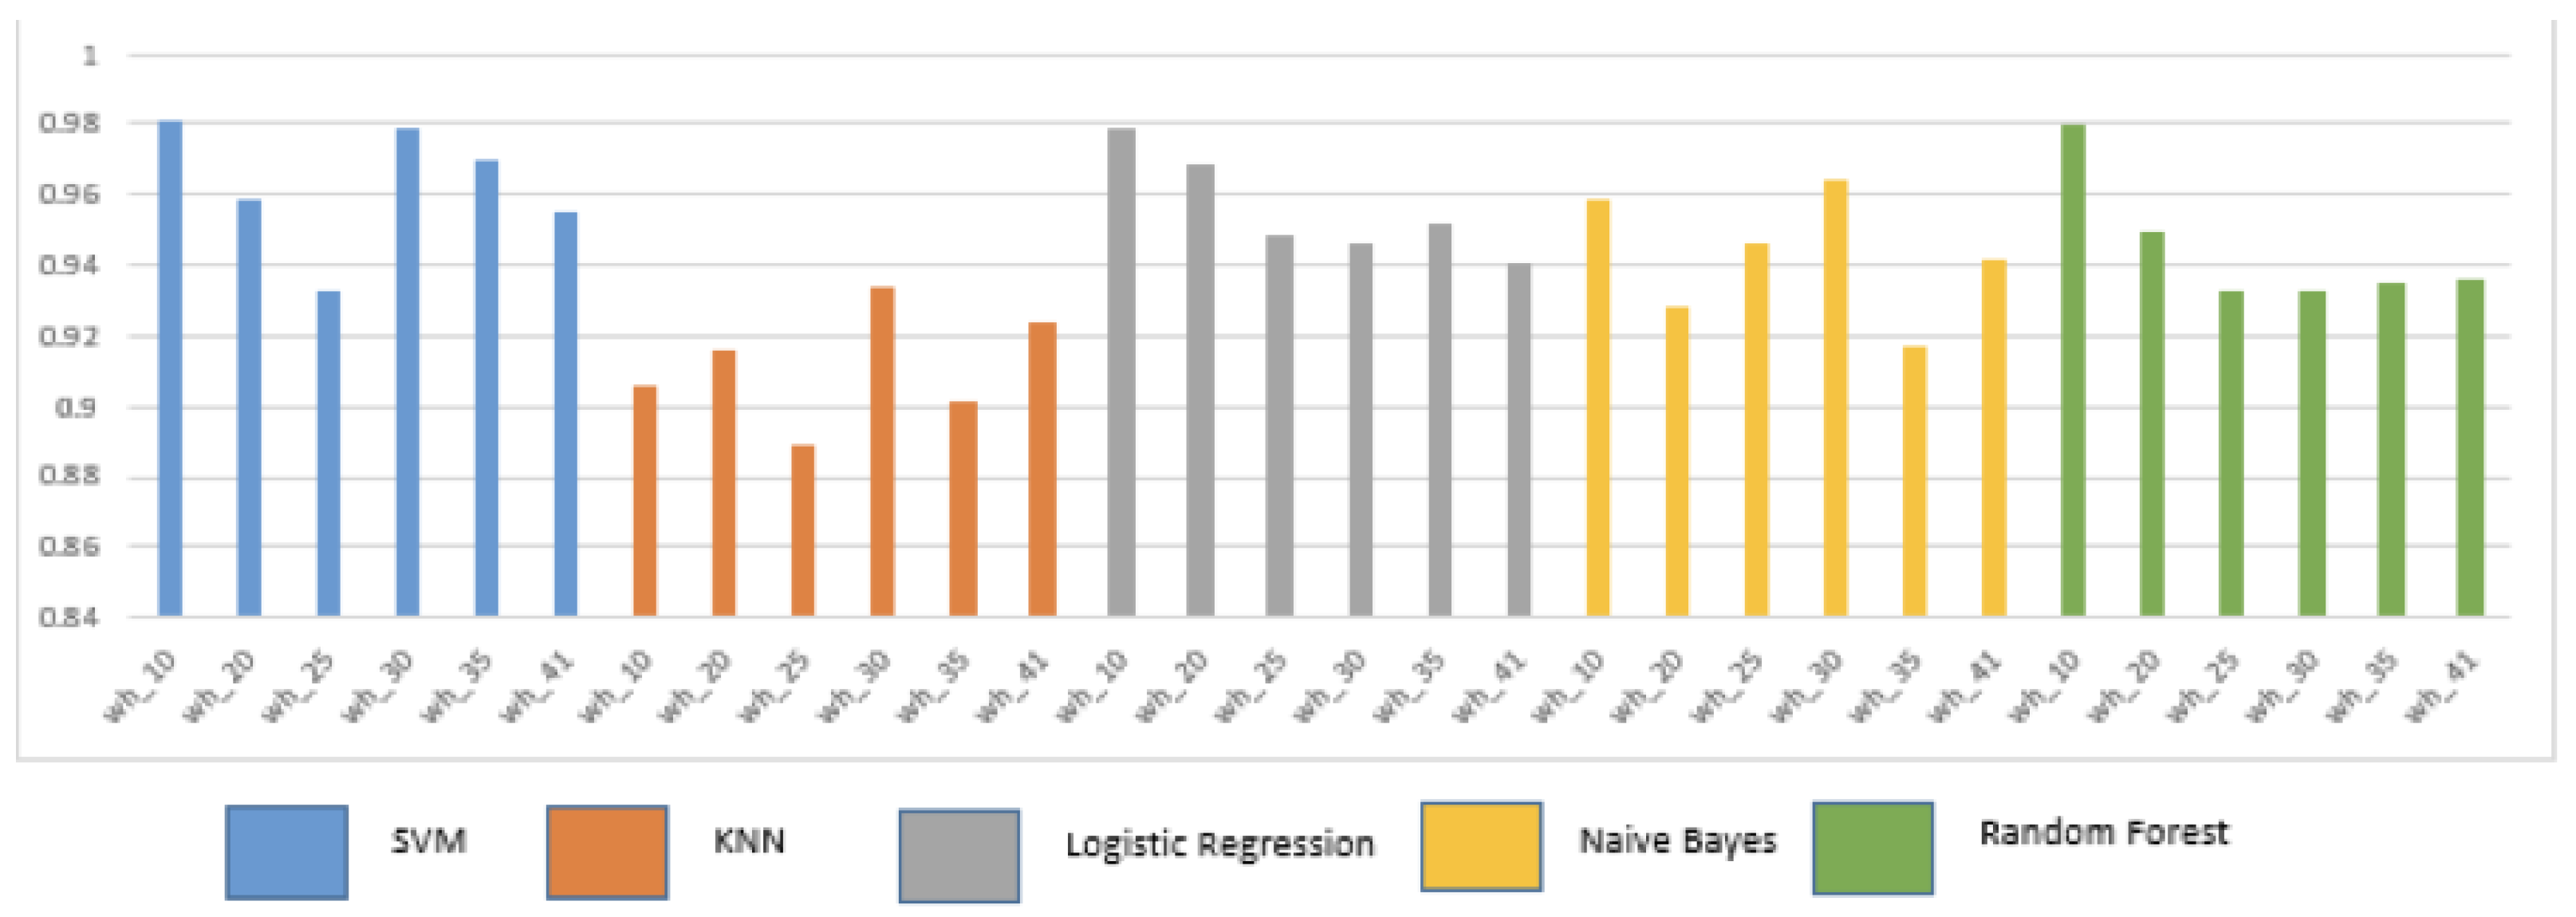
Table 1.
An analysis of various public datasets collected over the past few years.
| Ref | Year | Dataset used | Sensor used | Sensor placement | Methodology | Performance parameter and details |
|---|---|---|---|---|---|---|
| [9] | 2011 | UCI dataset | 3-Axes accelerometer, 2-axis gyroscope | Chest, thigh | Comparison of ML algorithms for fall detection using single node and two nodes | Accuracy of classification = 99.8% with two nodes(one on waist and one on knee). Naïve Bayes gaves the worst result, others gave comparable |
| [10] | 2012 | Generated from experiments | Accelerometer | Smartphones carried along with the user | Comparison of SVM, SMLR, Naive Bayes, decision trees, kNN, and regularized logistic regression for fall detection | Support vector machines and regularized logistic regression were able to identify a fall with 98% accuracy and classify the type of fall (trips, left lateral, slips, right lateral) with 99% accuracy. Naïve Bayes reported least accuracy |
| [11] | 2014 | Generated from experiments | Accelerometer gyroscope and magnetometers | 6 different positions on the body | Comparison of k-NN, classifier, LSM, SVM,BDM, DTW and ANN algorithms | k-NN classifier and LSM gave above 99% for sensitivity, specificity, and accuracy |
| [12] | 2014 | Generated from experiments | Accelerometer | Smartphones carried along with the user | Accelerometer data from wearable sensors to generate alarms for falls, combined with context recognition using sensors in an apartment, for inferring regular ADLs, using Bayesian networks | Provides statistical information regarding the fall risk probability for a subject |
| [13] | 2015 | Publicly available activity recognition dataset | Accelerometer, gyroscope | Smartphone | Comparison of Naive Bayes classifier, decision trees, random forests, classifiers based on ensemble learning (random committee), and lazy learning (IBk) algorithms for activity detection carried along with the user | Naive Bayes classifier performs reasonably well for a large dataset, with 79% accuracy, and it is fastest in terms of building the model taking only 5.76 seconds Random forests are better in terms of both accuracy and model building time, with 96.3% accuracy and 14.65 seconds model building time. k-Means clustering performs poorly with 60% classification accuracy and 582 seconds model building time |
| [14] | 2016 | Generated from experiments | 3-Axis Accelerometer | Not specified | Comparison of decision tree, decision tree ensemble, kNN, neural networks, MLP algorithms for soft fall detection | Decision tree ensemble was able to detect soft falls at more than 0.9 AUC |
| [15] | 2016 | MobiFall dataset | Accelerometer, gyroscope | User’s trouser pocket | Comparison of Naive Bayes, LSM, ANN, SVM, kNN algorithms for fall detection | k-NN, ANN, SVM had the best accuracy—results for kNN: Accuracy = 87.5% Sensitivity = 90.70% Specificity = 83.78% |
| [16,17] | 2016 | Generated from experiments | 3-Axis Accelerometer | Smartwatch | Threshold-based analysis of acceleration | Accuracy = 96.01% |
| [17] | 2016 | Generated from experiments | 3-Axis Accelerometer | Different parts of the body | Bayesian framework for feature selection, Naive-Bayes, C4.5 | Better accuracy with improved classification than Naive-Bayes and C4.5 |
| [18] | 2017 | Generated from experiments | Accelerometer gyroscope | Smart - Vest | Kalman filter for noise reduction, sliding window, and Bayes network classifier for fall detection | With Kalman filter Accuracy = 95.67%, Sensitivity = 99.0% Specificity = 95.0% |
| [19] | 2017 | Generated from experiments | 3-Axis Accelerometer | Smartphone | Combination of threshold-based and ML-based algorithms—K-Star, Naive Bayes, J48 | Energy saving = 62% compared with(ML only) techniques Sensitivity =77% (thresholding only), 82% (ML only), 86% (hybrid) Specificity = 99.8% (thresholding only), 98% (ML only), 99.5% (hybrid) Accuracy = 88.4% (thresholding only), 90% (ML only), 92.75% (hybrid) |
| [20] | 2017 | Generated from experiments | 3-Axis Accelerometer | Waist | Combination of threshold-based and knowledge-based approach based on SVM to detect a fall event | Using a knowledge based algorithm: Sensitivity = 99.79% Specificity = 98.74% Precision = 99.05% Accuracy = 99.33% |
| [21] | 2017 | MobiFall dataset | 3-Axis Accelerometer | Not specified | Comparison of multilevel fuzzy minmax neural network, MLP, KNN, SVM, PCA for fall detection | Multilevel fuzzy min-max neural network gave best results: Sensitivity = 97.29% Specificity = 98.70% |
| [22] | 2017 | FARSEEING dataset | 3-Axis Accelerometer | 5 locations on the upper body, neck, chest, waist, right side, and left side | Sensor orientation calibration algorithm to resolve issues arising out of misplaced sensor locations and misaligned sensor orientations, HMM classifiers | Sensitivity = 99.2% (experimental dataset), 100% (real-world fall dataset) |
| [23,24] | 2017 | Generated from experiments | 3-Axis Accelerometer | Chest | LWT based frequency domain analysis and SVM-based time domain analysis of RMS of acceleration | Accuracy = 100% Sensitivity = 100% Specificity = 100% |
| [25] | 2017 | Generated from experiments | 3-Axis accelerometer, 3-axis gyroscope | Waist | Back propagation neural network (BPNN) for fall detection | Accuracy = 98.2% Precision = 98.3% Sensitivity= 95.1% Specificity= 99.4% |
| [26] | 2017 | Generated from experiments | Accelerometer, radar, depth camera | Wrist | Ensemble subspace discriminant, linear discriminant, kNN, SVM | Overall accuracy of ensemble classifier was the highest, after fusion of radar, accelerometer, and camera = 91.3%. This is an improvement of 11.2% compared to radar-only and 16.9% compared to accelerometer-only results |
| [27] | 2017 | Public datasets | 3-Axis accelerometer | Not specified | CNN-based analysis on time series accelerometer data converted to images | Accuracy = 92.3% |
| [28] | 2017 | Generated from experiments | Accelerometer, gyroscope, proximity sensor and compass | Right, left, and front pockets | SVM, decision tree, kNN, discriminant analysis | Highest accuracy = 99% for SVM |
| [29] | 2010 | Generated from experiments | 3-Axis accelerometer | Chest, thigh | Naive-Bayes, SVM, OneR, C4.5 (J48), neural networks | Naive-Bayes gave best results Accuracy = 100% |
| [30] | 2017 | Generated from experiments | Accelerometer (MobiAct dataset) | Not applicable | ENN+ kNN (where ENN was applied to remove outliers), ANN, SVM, and J48 | For ENN+ kNN: Sensitivity = 95.52% Specificity = 97.07% Precision = 91.83% |
| [31] | 2018 | Generated from experiments | Triaxial gyroscope | Waist | Decision tree | Accuracy = 99.52% Precision = 99.3% Recall = 99.5% |
| [32] | 2018 | Cogent dataset, SisFall dataset | 3D accelerometer , 3D gyroscope- Cogent dataset Accelerometer, gyroscope (SisFall) dataset | Chest, waist | Event-ML, classification and regression tree (CART), kNN, logistic regression, SVM | Better precision and F-scores with Event-ML than FOSW and FNSW-based approaches |
| [33] | 2018 | SisFall dataset, generated from experiments | 3-Axis accelerometer | Chest/thigh, waist | SVM, kNN, Naïve- Bayes, decision tree | Accuracy and sensitivity of SVM were the highest (97.6% and 98.3%, respectively) for both datasets. |
| [34] | 2018 | UMA Datasheet | Accelerometer, gyroscope, magnetometer | Wrist, waist, chest, ankle | kNN, Naive-Bayes, SVM, ANN, decision tree | Without risk categorization: 81% for decision tree With risk categorization: 85% for decision tree |
| [35] | 2018 | SisFall dataset original and manually labelled | 3-Axis accelerometer | Not specified | RNN | Highest accuracy reported for fall detection: 83.68% (before manual labelling), 98.33% (after manual labelling) |
| [36] | 2018 | Generated from experiments | Accelerometer, gyroscope, magnetometer | Near the waist | kNN | Accuracy = 99.4% |
| [37] | 2018 | Generated from Experiments | 3-Axis accelerometer | Waist | Decision tree | Accuracy = 91.67% Precision = 93.75% |
| [38] | 2018 | SiSFall dataset | 3-Axis accelerometer | Waist | RNN with LSTM | Highest accuracy after hyperparameter Optimization (97.16%) |
| [39] | 2018 | Generated from experiments | Depth camera, accelerometer | Waist | CNN | Accuracy of fall detection = 100% |
| [40] | 2018 | Generated from experiments | Accelerometer, gyroscope, magnetometer | Hip | SVM, random forest | Without sensor fusion: Accelerometer |
| [41] | 2019 | Public datasets | Accelerometer, gyroscope | Chest, thigh | ANN, kNN, QSVM, ensemble bagged tree (EBT) | Extraction of new features from acceleration and angular velocity improved the accuracy of all 4 classifiers. Accuracy of EBT was highest (97.7%) |
| [42] | 2019 | SisFall dataset | Accelerometer, gyroscope | Waist | kNN, SVM, random forest | Accuracy for fall detection was the highest for kNN (99.8%). Accuracy for recognizing fall activities was the highest for random forest (96.82%) |
| [43] | 2019 | Public datasets | Accelerometer | Not specified | CNN-based models for feature extraction | Highest accuracy reported = 99.86% |
| [44] | 2020 | SiSfall dataset | Two triaxle accelrometers and gyroscope | Wrist | The XGBoost was implemented on spyder software with a 75-25 train-test split | Overall accuracy using XGBoost = 94.6% |
| [45] | 2020 | SiSFall dataset | Accelerometer and Gyroscope sensors inbuilt with Smartphone | Carrying smartphone on hand or pockets | Features were extracted from raw data and person’s correlation was implemented, on the features RF,ANN, SVM and Boosted decision tree was implemented | Accuracies Random Forest = 99.7% ANN = 99.2% SVM = 98.5% Boosted decision tree = 99.9%. |
| [46] | 2020 | Generated from experimentation | All IMU sensors and heart-rate sensor | Wrist | Mean and median was calculated from Raw dataset and ANN, KNN, XGB, NB and Random Forest | Accuracy on mean and median ANN = 85.69% KNN = 94.3% XGB = 85.3% NV = 66% Random Forest = 99.7% |
| [47] | 2021 | Combination of experimentally Generated and publicly available datset | IMU Based sensor on wristwatch and smartphones | Wrist, waist pelvis | SVM,KNN and ANN was implemented | SVM (wrist placement) = 91.3% (waist placement) = 98% KNN (Wrist placement) = 99% (waist placement) = 99.8% ANN (Wrist placement) = 95.25% (Waist placement) = 92.96% |
| [48] | 2021 | UR Fall, MOBIFALL, UP Fall | Accelerometer, magnetometer, gyroscope, ECG sensor | MOBIFALL = trouser, pocket Up Fall = wrist, ankle Ur Fall = pelvis | Feature extraction was performed on the raw dataset and basic ML methods like RF,SVM,KNN, LR,BB and DT were implemented | UR Fall dataset = 99%(RF) UP Fall dataset = 99%(LR) MOBIFALL dataset = 99%(for nearly all mentioned algorithm) |
| [49] | 2022 | Generated from experiments | Accelerometer and gyroscope sensor | Wrist | Data augmentation to solve the imbalance of data set, classification was done by BiLSTM model | Combined sensor accuracy KNN = 74.70% RF = 75.64% SVM = 73.74% BiLSTM = 97.35% |
| [50] | 2022 | Generated from experiments | Image based, External placement | Camera based | Multiple images were captured of the subject’s skeletal orientation, Standard deviation was calculated and fed into KNN based classifier | Overall accuracy of 95% was obtained |
| [51] | 2022 | SisFall, DaLiaC, UMAFall and Epilepsy | IMU based sensors | Wrist and Waist placement | Multiple algorithms were run like ANN, SVM, Decision Trees, Naïve Bayes and Deep learning based | Overall accuracy obtained by the classifier was 92.5% |
Table 3.
Train and Test Combinations.
| Sr no. | User Demographics | Range | Train | Test |
|---|---|---|---|---|
| 1 | Age | <30 30-40 40-50 |
<30 (70% Train) <30 <30 30-40 30-40 40-50 |
<30 (30% test) 30 -40 40 - 50 30 - 40 40 - 50 40 - 50 |
| 2 | Gender | Male Female |
Female Male Male Female |
Female Male Female Male |
| 3 | Health Issues | With Without |
Without With With Without |
Without With Without With |
| 4 | Height | <5.5ft >5.5ft |
<5.5ft >5.5ft <5.5ft >5.5ft |
<5.5ft >5.5ft <5.5ft >5.5ft |
| 5 | Weight | 50-65 65-80 80-120 |
50-65 65-80 80-120 50-65 50-65 65-80 65-80 80-120 80-120 |
50-65 65-80 80-120 65-80 80-120 50-65 80-120 50-65 65-80 |
Table 4.
Analysis of the impact of age on accuracies.
| Train | Test | Accuracy (%) | Sensitivity (%) | Specificity (%) | ||||||||||||
|---|---|---|---|---|---|---|---|---|---|---|---|---|---|---|---|---|
| SVM | KNN | LR | NV | RF | SVM | KNN | LR | NV | RF | SVM | KNN | LR | NV | RF | ||
| < 30 | < 30 | 94.60 | 92.15 | 92.64 | 86.76 | 92.15 | 93.38 | 89.51 | 93.18 | 91.80 | 91.24 | 97.06 | 98.36 | 91.67 | 79.27 | 94.03 |
| < 30 | 30-40 | 92.50 | 90.00 | 89.38 | 87.50 | 90.63 | 92.37 | 89.34 | 90.60 | 89.66 | 90.76 | 92.86 | 92.11 | 86.05 | 81.82 | 90.24 |
| < 30 | 40-50 | 96.53 | 95.14 | 95.83 | 93.75 | 99.31 | 95.96 | 93.20 | 95.92 | 93.94 | 98.97 | 97.78 | 100 | 95.65 | 93.33 | 100 |
| 30-40 | 30-40 | 85.42 | 81.25 | 83.33 | 72.92 | 87.50 | 84.21 | 78.57 | 83.78 | 85.71 | 84.62 | 90.00 | 100 | 81.82 | 55 | 100 |
| 30-40 | 40-50 | 90.28 | 89.58 | 90.97 | 88.89 | 95.83 | 91.84 | 86.49 | 91.92 | 97.62 | 94.12 | 86.96 | 100 | 88.89 | 76.67 | 100 |
| 40-50 | 40-50 | 93.18 | 88.64 | 93.18 | 84.09 | 90.91 | 90.32 | 84.85 | 93.10 | 92.00 | 92.86 | 100 | 100 | 93.33 | 73.68 | 87.50 |
* With Heartrate
Table 5.
Analysis of the impact of age on accuracies.
| Train | Test | Accuracy (%) | Sensitivity (%) | Specificity (%) | ||||||||||||
|---|---|---|---|---|---|---|---|---|---|---|---|---|---|---|---|---|
| SVM | KNN | LR | NV | RF | SVM | KNN | LR | NV | RF | SVM | KNN | LR | NV | RF | ||
| < 30 | < 30 | 95.10 | 91.67 | 93.14 | 87.25 | 92.16 | 92.81 | 89.44 | 93.23 | 93.28 | 90.07 | 100 | 96.77 | 92.96 | 78.82 | 96.83 |
| < 30 | 30-40 | 92.50 | 90.52 | 89.38 | 87.50 | 90.63 | 92.37 | 90.08 | 90.60 | 89.66 | 89.43 | 92.86 | 92.31 | 86.05 | 81.82 | 94.60 |
| < 30 | 40-50 | 95.83 | 95.14 | 95.14 | 94.44 | 99.31 | 95.92 | 93.20 | 94.95 | 96.81 | 98.97 | 95.65 | 100 | 95.56 | 90 | 100 |
| 30-40 | 30-40 | 87.50 | 81.25 | 79.17 | 72.92 | 87.50 | 86.49 | 78.57 | 82.86 | 85.71 | 84.62 | 90.91 | 100 | 69.23 | 55 | 100 |
| 30-40 | 40-50 | 90.97 | 88.89 | 90.28 | 88.19 | 93.75 | 91.09 | 85.71 | 91.84 | 98.77 | 92.23 | 90.70 | 100 | 86.96 | 74.60 | 97.56 |
| 40-50 | 40-50 | 90.91 | 86.36 | 93.18 | 84.09 | 93.18 | 90 | 82.35 | 93.10 | 88.89 | 93.10 | 92.86 | 100 | 93.33 | 76.47 | 93.33 |
* Without Heartrate
Table 6.
Analysis of the impact of gender on accuracies.
| Train | Test | Accuracy (%) | Sensitivity (%) | Specificity (%) | ||||||||||||
|---|---|---|---|---|---|---|---|---|---|---|---|---|---|---|---|---|
| SVM | KNN | LR | NV | RF | SVM | KNN | LR | NV | RF | SVM | KNN | LR | NV | RF | ||
| Female | Female | 93.07 | 86.14 | 88.12 | 84.16 | 93.07 | 96.92 | 92.19 | 95.16 | 94.83 | 95.52 | 86.11 | 75.68 | 76.92 | 69.77 | 88.24 |
| Male | Male | 93.33 | 92.82 | 95.90 | 89.23 | 92.82 | 93.13 | 90.00 | 94.70 | 91.34 | 91.79 | 93.75 | 100.00 | 98.41 | 85.29 | 95.08 |
| Male | Female | 94.35 | 90.48 | 94.35 | 89.58 | 93.45 | 94.37 | 88.40 | 94.76 | 89.21 | 93.16 | 94.29 | 96.51 | 93.46 | 90.53 | 94.12 |
| Female | Male | 91.82 | 92.59 | 92.90 | 91.05 | 93.83 | 90.58 | 91.20 | 93.47 | 93.29 | 92.79 | 95.03 | 96.15 | 91.67 | 86.57 | 96.32 |
*With heart rate gender
Table 7.
Analysis of the impact of gender on accuracies.
| Train | Test | Accuracy (%) | Sensitivity (%) | Specificity (%) | ||||||||||||
|---|---|---|---|---|---|---|---|---|---|---|---|---|---|---|---|---|
| SVM | KNN | LR | NV | RF | SVM | KNN | LR | NV | RF | SVM | KNN | LR | NV | RF | ||
| Female | Female | 95.04 | 89.10 | 89.10 | 85.14 | 93.06 | 98.46 | 93.84 | 95.23 | 94.91 | 95.52 | 88.88 | 80.55 | 78.94 | 71.42 | 88.23 |
| Male | Male | 92.30 | 92.82 | 95.38 | 88.71 | 92.82 | 93.02 | 90.57 | 94.65 | 91.26 | 92.42 | 90.90 | 98.24 | 96.87 | 84.05 | 93.65 |
| Male | Female | 93.75 | 92.26 | 94.05 | 89.29 | 92.56 | 93.94 | 91.25 | 94.74 | 89.17 | 92.34 | 93.33 | 94.79 | 92.59 | 89.58 | 93.07 |
| Female | Male | 92.44 | 92.28 | 92.44 | 90.43 | 94.14 | 90.83 | 90.81 | 93.03 | 93.43 | 93.20 | 96.56 | 96.11 | 91.13 | 84.68 | 96.35 |
*Without heart rate gender
Table 8.
Analysis of the impact of Pre-existing health on accuracies.
| Train | Test | Accuracy (%) | Sensitivity (%) | Specificity (%) | ||||||||||||
|---|---|---|---|---|---|---|---|---|---|---|---|---|---|---|---|---|
| SVM | KNN | LR | NV | RF | SVM | KNN | LR | NV | RF | SVM | KNN | LR | NV | RF | ||
| Without | Without | 96.11 | 93.33 | 93.89 | 92.22 | 95.56 | 95.80 | 93.33 | 94.12 | 95.54 | 95.00 | 96.72 | 93.33 | 93.44 | 86.76 | 96.67 |
| With | With | 91.38 | 83.62 | 90.52 | 84.48 | 91.38 | 93.75 | 82.80 | 93.67 | 86.90 | 91.67 | 86.11 | 86.96 | 83.78 | 78.13 | 90.63 |
| With | Without | 95.00 | 91.50 | 94.17 | 90.83 | 94.00 | 95.12 | 89.21 | 95.06 | 91.17 | 94.17 | 94.74 | 98.06 | 92.31 | 90.06 | 93.62 |
| Without | With | 94.27 | 92.19 | 92.71 | 89.06 | 94.53 | 94.32 | 91.85 | 92.54 | 91.80 | 93.04 | 94.17 | 92.98 | 93.10 | 83.59 | 98.20 |
*With heart-rate health issues
Table 9.
Analysis of the impact of Pre existing health on accuracies.
| Train | Test | Accuracy (%) | Sensitivity (%) | Specificity (%) | ||||||||||||
|---|---|---|---|---|---|---|---|---|---|---|---|---|---|---|---|---|
| SVM | KNN | LR | NV | RF | SVM | KNN | LR | NV | RF | SVM | KNN | LR | NV | RF | ||
| Without | Without | 93.33 | 92.22 | 93.89 | 94.44 | 96.11 | 93.33 | 91.13 | 94.87 | 95.69 | 95.80 | 93.33 | 94.64 | 92.06 | 92.19 | 96.72 |
| With | With | 90.52 | 85.34 | 88.79 | 83.62 | 92.24 | 93.67 | 83.87 | 92.41 | 86.75 | 91.76 | 83.78 | 91.30 | 81.08 | 75.76 | 93.55 |
| With | Without | 96.50 | 92.00 | 94.50 | 90.00 | 93.83 | 97.73 | 90.18 | 95.76 | 90.67 | 94.38 | 94.09 | 96.91 | 91.96 | 88.46 | 92.67 |
| Without | With | 93.49 | 92.45 | 92.71 | 88.80 | 93.75 | 94.25 | 92.19 | 92.54 | 91.44 | 92.65 | 91.87 | 93.04 | 93.10 | 83.46 | 96.43 |
*Without heart rate health issues
Table 10.
Analysis of the impact of varying heights on accuracies.
| Train | Test | Accuracy (%) | Sensitivity (%) | Specificity (%) | ||||||||||||
|---|---|---|---|---|---|---|---|---|---|---|---|---|---|---|---|---|
| SVM | KNN | LR | NV | RF | SVM | KNN | LR | NV | RF | SVM | KNN | LR | NV | RF | ||
| < 5.5 | < 5.5 | 92.77 | 91.57 | 91.57 | 89.76 | 91.57 | 93.69 | 90.60 | 92.79 | 91.82 | 90.60 | 90.91 | 93.88 | 89.09 | 85.71 | 93.88 |
| > 5.5 | > 5.5 | 93.85 | 90.77 | 91.54 | 86.15 | 93.08 | 97.56 | 89.36 | 97.47 | 91.46 | 93.26 | 87.50 | 94.44 | 82.35 | 77.08 | 92.68 |
| > 5.5 | < 5.5 | 93.12 | 90.40 | 92.93 | 90.76 | 91.85 | 93.19 | 87.77 | 92.51 | 89.92 | 90.27 | 92.94 | 98.52 | 93.94 | 92.90 | 96.03 |
| < 5.5 | > 5.5 | 94.91 | 92.82 | 94.68 | 89.81 | 93.75 | 94.93 | 91.05 | 95.22 | 92.36 | 93.94 | 94.85 | 97.48 | 93.53 | 84.72 | 93.33 |
*With heart rate height
Table 11.
Analysis of the impact of varying heights on accuracies.
| Train | Test | Accuracy (%) | Sensitivity (%) | Specificity (%) | ||||||||||||
|---|---|---|---|---|---|---|---|---|---|---|---|---|---|---|---|---|
| SVM | KNN | LR | NV | RF | SVM | KNN | LR | NV | RF | SVM | KNN | LR | NV | RF | ||
| < 5.5 | < 5.5 | 95.18 | 93.98 | 92.17 | 90.36 | 91.57 | 97.20 | 93.04 | 93.64 | 92.66 | 90.60 | 91.53 | 96.08 | 89.29 | 85.96 | 93.88 |
| > 5.5 | > 5.5 | 94.62 | 90.77 | 90.00 | 83.85 | 93.08 | 96.47 | 89.36 | 96.20 | 89.16 | 93.26 | 91.11 | 94.44 | 80.39 | 74.47 | 92.68 |
| > 5.5 | < 5.5 | 92.93 | 90.40 | 93.12 | 90.40 | 93.30 | 92.73 | 88.14 | 92.53 | 90.28 | 91.69 | 93.41 | 97.12 | 94.51 | 90.68 | 97.42 |
| < 5.5 | > 5.5 | 95.14 | 93.06 | 94.68 | 89.35 | 93.98 | 94.95 | 91.35 | 95.22 | 92.01 | 94.26 | 95.56 | 97.50 | 93.53 | 84.03 | 93.38 |
*Without heart-rate height
Table 12.
Analysis of the impact of varying weight on accuracies.
| Train | Test | Accuracy (%) | Sensitivity (%) | Specificity (%) | ||||||||||||
|---|---|---|---|---|---|---|---|---|---|---|---|---|---|---|---|---|
| SVM | KNN | LR | NV | RF | SVM | KNN | LR | NV | RF | SVM | KNN | LR | NV | RF | ||
| 50-65 | 50-65 | 96.35 | 94.89 | 94.89 | 89.78 | 93.43 | 94.68 | 93.62 | 94.57 | 95.18 | 92.55 | 100.00 | 97.67 | 95.56 | 81.48 | 95.35 |
| 65-80 | 65-80 | 91.67 | 87.96 | 88.89 | 84.26 | 92.59 | 93.75 | 87.50 | 95.89 | 91.89 | 94.94 | 85.71 | 90.00 | 74.29 | 67.65 | 86.21 |
| 80-120 | 80-120 | 94.12 | 90.20 | 90.20 | 90.20 | 92.16 | 92.11 | 91.67 | 91.67 | 96.88 | 91.89 | 100.00 | 86.67 | 86.67 | 78.95 | 92.86 |
| 50-65 | 65-80 | 93.89 | 94.17 | 92.78 | 91.39 | 93.61 | 93.60 | 92.94 | 94.21 | 92.65 | 92.22 | 94.55 | 97.14 | 89.83 | 88.70 | 97.09 |
| 50-65 | 80-120 | 89.29 | 90.48 | 86.90 | 86.90 | 88.69 | 91.23 | 89.34 | 88.79 | 90.91 | 89.74 | 85.19 | 93.48 | 82.69 | 79.31 | 86.27 |
| 65-80 | 50-65 | 94.74 | 91.01 | 93.64 | 91.45 | 93.42 | 95.45 | 89.25 | 94.50 | 92.88 | 93.35 | 93.24 | 95.87 | 91.84 | 88.44 | 93.57 |
| 65-80 | 80-120 | 94.64 | 89.29 | 91.07 | 88.69 | 90.48 | 94.78 | 87.30 | 93.69 | 91.15 | 90.00 | 94.34 | 95.24 | 85.96 | 83.64 | 91.67 |
| 80-120 | 50-65 | 88.60 | 87.06 | 92.54 | 90.57 | 92.76 | 88.41 | 85.30 | 93.27 | 92.23 | 91.44 | 89.06 | 92.66 | 90.97 | 87.07 | 96.12 |
| 80-120 | 65-80 | 91.94 | 88.06 | 92.50 | 90.00 | 93.06 | 92.37 | 86.08 | 92.77 | 92.50 | 91.19 | 90.99 | 94.25 | 91.89 | 85.00 | 97.98 |
*With heart rate on weight
Table 13.
Analysis of the impact of varying weight on accuracies.
| Train | Test | Accuracy (%) | Sensitivity (%) | Specificity (%) | ||||||||||||
|---|---|---|---|---|---|---|---|---|---|---|---|---|---|---|---|---|
| SVM | KNN | LR | NV | RF | SVM | KNN | LR | NV | RF | SVM | KNN | LR | NV | RF | ||
| 50-65 | 50-65 | 94.89 | 95.62 | 94.89 | 89.78 | 93.43 | 93.62 | 94.62 | 95.56 | 95.18 | 92.55 | 97.67 | 97.73 | 93.62 | 81.48 | 95.35 |
| 65-80 | 65-80 | 92.59 | 87.04 | 91.67 | 83.33 | 92.59 | 94.94 | 85.71 | 96.05 | 90.67 | 94.94 | 86.21 | 94.12 | 81.25 | 66.67 | 86.21 |
| 80-120 | 80-120 | 90.20 | 88.24 | 92.16 | 90.20 | 92.16 | 89.47 | 87.18 | 94.29 | 96.88 | 91.89 | 92.31 | 91.67 | 87.50 | 78.95 | 92.86 |
| 50-65 | 65-80 | 94.44 | 94.44 | 93.06 | 91.11 | 93.06 | 94.72 | 92.97 | 94.61 | 91.60 | 91.19 | 93.86 | 98.08 | 89.92 | 90.00 | 97.98 |
| 50-65 | 80-120 | 90.48 | 90.48 | 89.29 | 87.50 | 89.29 | 92.11 | 90.00 | 90.52 | 89.57 | 89.83 | 87.04 | 91.67 | 86.54 | 83.02 | 88.00 |
| 65-80 | 50-65 | 95.18 | 92.11 | 94.30 | 91.45 | 93.64 | 96.08 | 90.61 | 94.84 | 93.44 | 93.93 | 93.33 | 96.03 | 93.15 | 87.42 | 93.01 |
| 65-80 | 80-120 | 93.45 | 89.29 | 89.88 | 87.50 | 90.48 | 93.91 | 87.30 | 91.30 | 89.57 | 90.00 | 92.45 | 95.24 | 86.79 | 83.02 | 91.67 |
| 80-120 | 50-65 | 90.35 | 87.72 | 92.54 | 89.47 | 92.54 | 91.67 | 86.05 | 94.41 | 92.11 | 91.41 | 87.50 | 92.86 | 88.82 | 84.21 | 95.38 |
| 80-120 | 65-80 | 91.94 | 86.11 | 92.50 | 89.44 | 92.22 | 92.37 | 84.17 | 92.77 | 91.74 | 90.46 | 90.99 | 92.68 | 91.89 | 84.75 | 96.94 |
*Without heart rate on weight
Disclaimer/Publisher’s Note: The statements, opinions and data contained in all publications are solely those of the individual author(s) and contributor(s) and not of MDPI and/or the editor(s). MDPI and/or the editor(s) disclaim responsibility for any injury to people or property resulting from any ideas, methods, instructions or products referred to in the content. |
© 2023 by the authors. Licensee MDPI, Basel, Switzerland. This article is an open access article distributed under the terms and conditions of the Creative Commons Attribution (CC BY) license (http://creativecommons.org/licenses/by/4.0/).
Copyright: This open access article is published under a Creative Commons CC BY 4.0 license, which permit the free download, distribution, and reuse, provided that the author and preprint are cited in any reuse.


