Submitted:
11 May 2023
Posted:
12 May 2023
You are already at the latest version
Abstract
Developing new energy is critical to China's green and low-carbon development. And the New Energy Demonstration City Policy (NEDCP) is a vital innovation policy that inspires the development of new energy. Is the NEDCP facilitating green and low-carbon development, if so, how? Employing unbalanced panel data from 2003 to 2017, the impact of NEDCP on green and low-carbon development was studied by using the "difference in difference" (DID) model. We find that this policy can take significantly role. After various robustness tests, our results are still valid. According to the heterogeneity analysis, non-resource and non-old industrial base cities have a greater positive impact from this policy. The mechanism analysis denotes that the positive policy effect works through upgrading the industrial structure and stimulating urban innovation. The substantial empirical evidence presented in this article supports the continued promotion and implementation of new energy demonstration cities.
Keywords:
Green development
; Low-carbon development
; Difference-in-difference method
; New Energy Demonstration City Policy
; City heterogeneity
1. Introduction
China has been developing rapidly in the past 40 years, and its economic strength has increased dramatically. At present, China is rated number two among the world's major economies, attracting worldwide attention. In just over 40 years, China's GDP has soared nearly 300-fold. However, China's economic miracle leads to tremendous pressures for energy consumption (Lin and Zhu, 2016; Li and Wei, 2021). Total energy consumption of China was 4980 million tons (Mt) of standard coal in 2019. Specifically, the share of coal consumption were 56.8%, whereas the share of clean energy consumption were only 24.3%. This high-carbon energy structure not only stimulates Chinese booming economic development but also makes China the biggest carbon emitter of the world (Matthews et al., 2009; IEA, 2012). With continuously increasing emissions, the issue of global climate change is becoming increasingly prominent. And the call for emissions reduction has become increasingly apparent. Countries worldwide actively adopt various measures to reduce carbon emissions, which naturally puts China facing tremendous international pressure (Zhou et al., 2017). In addition, due to the non-renewability and the vast consumption of traditional fossil energy, the risk of traditional energy depletion continues to increase. China is facing severe energy security issues (Zhao et al., 2020).
To decrease carbon emissions and ensure national energy security, China has turned its attention to new energy. The Chinese authority hopes to change its high-carbon energy structure by vigorously developing new energy (Yu et al., 2020). In 2016, China became the biggest new energy producer and consumer as a result of the fast advancement of new energy. (Neij et al., 2017). However, on account of coal-rich energy endowment as well as the considerable consumption of traditional energy in China, the development of new energy still cannot transform Chinese consumption pattern of high-carbon energy in the short run (Ji and Zhang, 2019). To promote the new energy development and accelerate the energy transition in China, the authority has proposed many new energy-related plans and regulations. In 2014, the Chinese government announced the list of NEDCs. There are 81 cities and 8 industrial parks on this list. In order to promote local sustainable development, the NEDCP aims to actively boost the popularity of new energy-related technologies in daily economic activity and increase new energy consumption. As an essential pilot measure of new energy progress for China, whether the NEDCP can significantly promote sustainable development is crucial for China to adjust its energy development strategy.
The major aims of the research are as followings. Firstly, extant studies on green and low-carbon development mainly put their eyes on the national or provincial level, with little attention paid to the prefecture level indicators. Compared with national and provincial-level carbon emission intensity indicators, this paper adopts the prefecture-level carbon emission intensity indicator, which could more precisely reflect the NEDCP's impact on green and low-carbon policy. Secondly, the environmental effect of new energy consumption, such as reductions in SO2 and NOx emissions, are the primary concentrate on the related studies (Dai et al., 2016). By contrast, considering both the environmental and economic effects of new energy promotion is the highlight of this paper. Moreover, to better address potential endogeneity issues, this article employs DID approach to examine how the NEDCP affects green and low-carbon development. And we also employ multiple methods to perform the robustness tests, making the research results more convincing. Thirdly, we take the heterogeneity of cities into account and verify the promotion role of the NEDCP in green and low-carbon development, which could provide an empirical basis and theoretical guidance to improve and promote the NEDCP in the future.
The followings form the structure of the remainder of this study. Section II summarizes related research. Mechanisms and hypotheses are proposed in Section III. Datas and methods are introduced briefly in Section IV. The empirical findings are reported and discussed in Section V. The last section provide summarizes and implications.
2. Literature Review
2.1. Background
The NEDCP is primarily designed to improve and highlight new energy in adjusting the energy structure and protecting the environment. In 2014, the Chinese government issued the NEDCP. The pilot area includes 8 industrial parks and 81 cities. The spatial distribution of NEDCs is depicted in Figure 1. It is obvious that most selected cities are situated at east of the Hu Line1.
To accelerate the construction of the NEDCs, the Chinese government ordered local governments to make accompanying development plans for the NEDCs. First, to achieve specific obligatory goals, local governments must incorporate NEDCs into economic and social development programs. For example, optimize industrial structure of target cities to make their energy intensity lower than the provincial average. The industrial structure of the target city should be optimized so that the energy intensity is below the average level of their provinces. Second, local governments should strengthen protections and support innovative activities. Technological advancements should reinforce the progress and application of new energy to realize the comprehensive utilization of both new and traditional energy, and reduce carbon emissions from production and consumption.
2.2. Literature Review
We focus on whether this pilot policy could spur green and low-carbon development. Although very few previous researches have focused on the relationship between them, we can better investigate the NEDCP's effects on green and low-carbon development by using the previous literature on economic effects of new energy.
Some researchers believe that new energy can significantly uplift the economy. Apergis and Payne (2011) investigate the connection between the consumption of renewable energy and economic growth by employing the heterogeneous panel cointegration method. They claim that renewable energy use could have sparked an expansion of economy in the sample countries between 1980 and 2006. Similarly, the correlation between Brazil's actual GDP and various forms of energy consumption from 1980 to 2006 was examined by Pao and Hu (2013). They confirm that renewable energy consumption could slow environmental degradation, improve national competitiveness and promote the economic growth of Brazil. Dai et al. (2016) investigate the influence of renewable energy use on economy by employing the computable general dynamic equilibrium method. They report that new energy use would have a significant green growth effect and can significantly reduce air pollutants, such as CO2, NOx as well as SO2, improve the atmospheric environment substantially, and promote local green growth in China. Using data of Turkey from 1980-2017, Sohag et al. (2019) employs the autoregressive distribution lags (ARDL) method to analyze the linkage between technological innovation, militarization, clean energy and green economic growth. They conclude that clean energy and technological innovation could effectively promote green development in Turkey, and the long-term relationship between them is asymmetric. Using data from the seven major industrialized countries during 1991-2014, Destek and Aslan (2020) study the linkage of renewable energy, economic growth, and environmental pollution. They find that the biomass power, hydropower and wind energy could significantly reduce carbon emissions in these target countries.
However, some studies have reached different conclusions. Ocal and Aslan (2013) use the ARDL method to investigate the economic impact of clean energy in Turkey during 1990-2010.They think that clean energy is an expensive energy resource for Turkey, and its consumption would be detrimental to the economic growth in Turkey. Similarly, Destek (2016) performs asymmetric causality tests to study this problem in six emerging industrialized countries from 1971 to 2011. According to the findings of the study, the renewable energy use will show a negative impact on India's economic growth in these sample countries. Chen et al. (2020) analyzes the influence of clean energy use on economic development in 103 countries during 1995-2015. They find that the new energy consumption cannot achieve economic growth in developed countries. In contrast, in developing countries, the utilization of renewable energy is bad news for the booming of economy. Xie et al. (2020) analyzes this topic using annual panel data from the 27 EU member nations during 2008-2017. They confirm that limited by the current technological level, renewable energy consumption is relatively low or high, and it is bad for green economic booming. We are curious about whether the NEDCP can encourage low-carbon development due to the unstable link between new energy development and green development.
In addition, policies related to new energy have begun to attract some research interest. Related policy research focuses primarily on policies like pilot plans for low-carbon city plans and carbon trading. The policy effects of the NEDCs, which are essential comprehensive policies for developing new energy, have received little attention (Zhang et al., 2019). Khanna et al. (2014) conducted a pre-comparative evaluation of the plans for low-carbon and complementary measures of eight pilot cities in China by reviewing the historical development and background of low-carbon cities. They believe that the release of low-carbon city policy (LCCP) and the vague definition of low-carbon cities, interference with related policies, and insufficient policy and market support will affect urban development. Cheng et al. (2019) investigate the influence of LCCP on sustainable growth by employing panel data from 194 prefecture-level cities during 2007-2016. They reach an inference that this strategy has further developed the green total factor productivity (TFP) in low-carbon cities with technological progress. In addition, they confirm that this kind of promotion is more evident in larger scales cities, better infrastructure and better technical foundations. Similarly, Yu and Zhang (2020) use 251 cities during 2003-2018 in China to investigate the effects of LCCP on carbon efficiency. They find that it has significantly increased emission efficiency and promoted green development. In addition, this effect also has an obvious positive effect on spatial spillover, enhancing the emission efficiency in the surrounding area.
As a major pilot policy to promote new energy development, it is essential to analyze the policy effects of the NEDCP. First, it provides the government with a crucial point of reference for adjusting its energy development strategy and spreading the use of new energy. Second, it can also provide guidance for other countries to formulate development strategies of reasonable new energy. We look forward to seeing how the NEDCP affects green development.
3. Mechanism and Hypothesis
The construction of NEDCs is based on the idea of 'new city, new energy, and new life', aiming to spur urban sustainable development. The primary purpose of the NEDCP is to promote the technologies application for new energy in urban areas. In the selected cities, the new energy use should either exceed 100,000 tons per year or the proportion of total energy use exceed 3%. To achieve this, the local government will formulate appropriate new energy development strategies, and introduce policies conducive to new energy industry development. All these measures are beneficial to the energy transition and subsequently encourage low carbon development. Accordingly, we propose the hypothesis as shown below:
H1: The NEDCP can effectively promote urban green and low-carbon development.
3.1. Industrial Structure Effects of the NEDCs
The unreasonable industrial structure is a key culprit for high carbon emissions in cities. And adjusting the industrial structure is considered to be a necessary way to make urban green and low-carbon development happen (Feng and Wang, 2019; Zhu et al., 2019). One of the targets of NEDCs is to optimize the urban energy mix, boost the new energy consumption, and achieve industrial structure upgrading (Yang et al., 2021). In this context, the local government will issue a series of related incentive policies. For example, supporting the low-carbon tertiary industry to raise the share of the high-end service industry by giving preferential treatment to land, taxation, and credit resources (Chen et al., 2019). Furthermore, the local authorities will also strengthen environmental regulations, set higher entry barriers for industries that produce a lot of pollution and use a lot of energy, and reduce the living space of heavily polluting enterprises (Cheng et al., 2019). Increasingly stringent environmental regulations have significantly inhibited the growth of industrial enterprises. With the limited use of fossil energy and rising operating costs of industrial companies, some companies will choose to transform from high- emission to low-emission industries with comparative advantages (Liu et al., 2021). Furthermore, the public authority will also adopt green credit policies to reduce the financial backing for energy-intensive industries, limit the reckless expansion of industrial enterprises' production scale, and alter industrial structure (Wen et al., 2021). Accordingly, we propose the hypothesis as shown below:
H2: By upgrading the industrial structure, the NEDCP will achieve urban green and low-carbon development.
3.2. Technological Effects of the NEDCs
Technological progress is the primary driver for achieving green development in cities (Yu et al., 2021). Therefore, to achieve the stated goals of the NEDCP and reduce fossil energy consumption as soon as possible, local governments will inevitably support technological innovation and provide new path options for urban energy utilization (Khan et al., 2020). Specifically, the NEDCP can promote technical innovation through the following two channels. First, NEDCs have increased the application requirements for green technologies. To spread the popularity of new energy, local governments will provide subsidies to the new energy industry, reduce the pressure of insufficient R&D funds for new energy-related companies, and encourage corporate innovation (Cheng et al., 2019). Second, the NEDCP has raised the environmental regulatory requirements. When faced with strict environmental regulations, companies will adjust their business strategies, update green production technologies, increase technological innovations to enhance environmental performance, resource utilization, emission reduction, and utilization efficiency (Wen and Lee, 2020). As a result, our hypothesis is as follows:
H3: The NEDCP realizes urban green and low-carbon development through technological progress.
4. Variables, Methods and Data
4.1. New Energy Demonstration Cities
The list of NEDCs was issued by the Chinese government in 2014. The pilot area includes 8 industrial parks and 81 cities. Among the 286 sample cities in this study, 57 cities are NEDPCs. In this article, we take the NEDCs as treatment group, and the others serve as control group.
4.2. Green Development
Green and low-carbon development generally refer to a long-term growth pattern marked by low emissions, low pollution, and low energy use. Suppose a region’s economy is growing while the carbon emissions intensity is declining. That indicates that this region has developed a low-carbon and environmentally friendly development model (Li et al., 2019; Cheng et al., 2022). As a result, we estimate green and low-carbon development (CARGDP) by utilizing the carbon emission intensity at the city level in this article. Emissions of carbon dioxide per unit of GDP serve as the representation for this indicator.
4.3. Control Variables
According to relevant studies (Bai et al., 2019; Wang et al., 2021; Yang et al., 2021), this paper also takes these indicators as control variables, which are used to control other possible factors influencing green and low-carbon development. (1) Population density (POP) is denoted as the ratio of city’s total population to its administrative region at the end of year; (2) Per capita real GDP is used to represent the level of economic development (PGDP), taking 2003 as the base year; (3) The proportion of added value of secondary industry to GDP is referred to as industrial structure (IND); (4) The city's innovation capability (INCA) is expressed by the quantity of green patents; (5) The rate of foreign direct investment (FDI) to GDP demonstrates openness (OPEN); (6) Fiscal pressure (PRES) is calculated as the ratio of fiscal surplus to fiscal revenue. Except for industrial structure, openness, and fiscal pressure, all variables are in logarithmic form.
4.4. Empirical Method
4.5. Data
The impact of the NEDCP on green development is examined using unbalanced panel data from 286 cities during 2003-2017 in this paper. We calculate the city-level intensity of carbon emissions in accordance with Chen et al. (2021). In addition, the initial data of the rest variables selected in the article are obtained from the official Statistical Yearbook of China, provinces and cities, as well as the China Energy Statistical Yearbook and the CNRDS databases. The description of each variable are presented in Table 1.
5. Empirical Results
5.1. Parallel Trend Test
Before using the DID method, a relatively stable trend in the carbon intensity of the two groups needs to be confirmed before the establishment of the NEDCs. Therefore, according to Yang et al. (2021), we conducted the parallel trend testing. The following are the specific model settings:
Among them, Yit expresses city i's carbon emission intensity in year t. The definition of Treat in Equation (2) is the same as that in Equation (1). Postt+j is a time dummy variable. For example, Postt-5 represents the seventh year before the policy is implemented, and Postt+3 represents the third year after policy implementation.
This article focuses on , which measures the policy effect. Parallel trends hold when no obvious difference are shown between the two groups before policy implementation. In contrast, there should be a considerable difference after the policy is put into action. The parallel trend test's results are depicted in Figure 2. The X-axis denotes the year relative to the implementation of NEDCP, and the interaction term's coefficient is shown on the Y-axis. It can be found that in the years before the establishment of the NEDCs, these coefficients are not significant. The coefficients remain significantly negative after the first year of this policy, denoting that the parallel trend assumption holds. In addition, these coefficients also confirm that the NEDCP can substantially reduce the carbon emission intensity.
5.2. Baseline Regression
The coefficient of Treat×Post is -0.0248 at the significant level of 5% without the control variables as shown in column (1). From column (2) to column (7), we add all the control variables one by one. Column (7) indicates that when all the control variables are included, the factor of Treat×Post is -0.0344 at the significant level of 1%. It can be preliminarily noted that the establishment of the NEDCs help reduce the carbon intensity significantly and support urban green and low-carbon development. In column (7), we use population density, economic development level, industrial structure (where IND2 represents the square term of industrial structure), innovation capability, openness and fiscal pressure as control variables. We confirm that the intensity of carbon emissions can be significantly reduced by increasing population density. In general, as the urban population increases, various urban infrastructures improve gradually, especially public transportation and other public systems. Furthermore, it has the potential to facilitate urban sustainable development and increase energy use efficiency (Fang et al., 2020). In addition, we further find that the linkage between carbon intensity and industrial structure shows an obvious inverted U relation. As this ratio increases, the emission intensity presents earlier increasing and later decreasing trends. In the initial stage of industrial development, the secondary industry often adopts a rough development mode, which only focuses on economic benefits and ignores the externalities of the environment. As the proportion of secondary industry increases, it often results in a rapid rise in carbon intensity. With the development of technology and the social attention on environmental pollution issues, energy utilization efficiency has gradually increased, which has resulted in the carbon intensity has decreased as the ratio of secondary industry has increased. Therefore, the relationship between the carbon intensity and the industrial structure shows an inverted U shape (Fan and Zhao, 2019). We also confirm that green patents have positive effects, while the fiscal pressure has a negative effect. Moreover, we find that the degree of openness has no connection with the carbon emission density, which does not support the "pollution halo" or "pollution haven". In general, green patents can promote green production technologies and reduce the emissions intensity. Finally, the authority will expand the industrial scale to alleviate fiscal pressure, which greatly increases carbon emission intensity and will not benefit the low-carbon development (Bai et al., 2019).
5.3. Heterogeneity Analysis
There are significant differences between China's cities. Therefore, the city heterogeneity may affect the policy impacts of the NEDCP. To this end, we analyze the impacts of city heterogeneity from two aspects: resource endowment, industrial characteristics.
5.3.1. Resource Endowment Heterogeneity
Energy is an essential strategic resource and its development and utilization will be restricted by regional resource endowments. With reference to the State Council's classification standards, we classify cities into two categories: cities with and without resources-based2. Table 3 describes the outcomes of applying the DID approach to each kind of city. The NEDCP does not significantly reduce the carbon intensity for resource cities, as shown in columns (1) and (2). At the 1% level, we can observe a negative effect for cities that non-resource-based. Resource cities rely heavily on their owned resources. Under this path dependence, the changes from traditional energy to new energy have the character of slow and high cost. However, the transition of non-resource-based cities is relatively easy. Therefore, under the impetus of the NEDCP, it is possible to foster rapid transactions for green and low-carbon development.
5.3.2. Heterogeneity in Industrial Characteristics
The Plan for Adjusting and Renovating the Old Industrial Bases Throughout the Country (2013-2022) in 2013 identified 120 cities as old industrial bases3. Most of them are experiencing fast economic growth. Nevertheless, their development methods are relatively extensive, with the distinctive features of high energy consumption, which became an obstacle to the switch of the old industrial cities toward sustainable development. Can the carbon intensity from old industrial base cities be decreased by the establishment of NEDCs? To solve this problem, we take cities that belong to the NEDCs and the remaining cities for the old industrial bases. Then, we perform a similar analysis as above in this subsample. Furthermore, for non-old industrial base cities, we classify prefecture-level cities under the NEDCP and the other cities. Then we study the impact of the NEDCP for non-old industrial base cities.
According to columns (3) and (4) in Table 3, the NEDCP has obvious negative influence on emission density of both old and non-old industrial based cities. The horizontal comparison shows that the NEDCP has a greater impact on emission density of non-old industrial base cities than old industrial base cities. This phenomenon may occur for the following reasons: First, the old industrial base has an energy-intensive industrial structure, extensive development pattern. Due to the path dependence of production technology, the carbon emission intensity reduction is slight, making the NEDCs more ineffective. Therefore, the impact of motivating green development is not obvious. Second, northeast China have the majority of the old industrial cities, which have the slowest economic growth and the most serious population loss in China4. As a result, the old industrial base cities lack the necessary funds and talent pool, which are crucial to the accomplishment of the economic transformation, thereby leading to the slower speed of transition to green and low-carbon development processes.
5.4. Robustness Test
5.4.1. Placebo Test
Due to data limitations, some unobservable potential factors may affect the results, leading to estimation bias. Following Chetty et al. (2009), we perform a placebo test to check whether the potential variables influence the results. The estimated coefficient in the baseline model can be obtained as:
where X includes all fixed effects as well as control variables, and denotes the influence of unobservable variables on the independent variable. If , the estimated results will not be affected by unobservable factors. However, cannot be directly verified. Therefore, this article uses the indirect placebo test method. Specifically, we select a variable that does not affect the independent variable theoretically, and then we replace Treat for re-estimation. If , then . This paper randomly generates a list of new energy pilot cities, obtains the estimated coefficient , and repeats this step 500 times. Figure 3 displays the distribution of 500 estimated coefficients. We can find that the mean value of is -0.0016, which is close to 0 and insignificant. And it is far from the coefficient -0.0344 of the baseline regression. Thus, we verify the conclusions' robustness.
5.4.2. Other Policies
We are concerned about how other environmental policies will affect the sample period covered in the research. To alleviate the potential problem, we summarize environmental policies implemented since 2014, such as LCCP. Then, the regression includes an interaction between the time trend item and the policy dummy variable. On the other hand, many provincial-level environmental policies have been implemented in various provinces. However, due to the availability of data, we cannot take all provincial-level environmental policies into consideration. Therefore, referring to Lai et al. (2021), we add an interaction of time trend item and provincial dummy variable into the regression to control the influence of the provincial level factors on the estimated results. Column (1) of Table 5 shows the results. We find that coefficient of Treat × Post is still significantly negative at the statistical level of 1%. It indicated other environmental policies have not caused the bias of the estimated results in this article.
5.4.3. Other Control Variables
In an ideal setting, the DID mandates that the control and treatment group be chosen at random. However, the selection of NEDCs, in fact, is not completely random. In the policy-making process, many external environmental factors, such as the city’s economic and social development level and geographical location, are usually taken into consideration. The above factors may have different effects on a city’s development, thus leading to estimation bias. To alleviate the possible influence of these factors, on the basis of Lu et al. (2017), this research adds the interaction term Zc×Trendt of these factors with the trend term into the regression. Among them, Zc represents the economic and social characteristics as well as the geographical location of the city. Specifically, these factors include whether the city is a provincial capital, a special economic zone, or a northern city. Moreover, we also take the cities’ gradient into consideration. Trendt refers to the time trend. The outcomes are presented in Table 5 in Column (2). The conclusion of this study remains stable after controlling for the aforementioned factors.
5.4.4. Alternative Measure of Green and Low Carbon Development
China's energy structure is leading by fossil energy. The consumption of fossil energy produces large amounts of carbon dioxide while also emitting a large amount of sulfur dioxide. Therefore, we replace the independent variable with SO2 emission intensity, which is represented by SO2 emissions per unit of Gross domestic product, then the regression is performed again. The column (3) in Table 5 shows that the regression factors of Treat×Post are negative at 5% significant level, indicating that the establishment of NEDCs could significantly promote green development. And this further makes our findings more convincing.
5.4.5. PSM-DID
Additionally, we verified the reliability of our findings by employing the PSM-DID strategy. It can overcome the selectivity bias issue of the DID model. Our sample contains 286 prefecture-level cities, and there may be significant economic differences between these cities. Therefore, we utilize the matching approach of propensity score to match the two groups and use the matched sample to perform the DID regression again.
Before executing the PSM-DID procedure, we need to carry out a balance test on the variables to guarantee the precision of the propensity score's matching result. The outcomes of the balance test are shown in Table 4. Significant differences in the industrial structure, innovation ability, openness and financial pressure exist between the two groups before matching. And the two groups' differences in the above variables are eliminated after matching, which indicates that the matching method in this paper is effective. Figure 4 also depicts the propensity score kernel density function curves for the experimental and control groups prior to and following kernel matching. After matching, the propensity scores distribution in two groups is very close, indicating that the quality of the matching is also good.
The column (4) of Table 5 displays the PSM-DID outcomes. The factors of Treat×Post are all negative, indicating that the results are close to the benchmark case, which can be verified again that our benchmark results are robust. The NEDCP has a certain effect of improving the green and low-carbon advancement of cities.
5.5. Mechanism Analysis
To verify the industrial structure upgrading effect of the NEDCP, according to Chen and Zhao (2019), we construct two indicators, High1 and High2, to represent industrial structure upgrading. Specifically, High1 is the number of employees belonging to the high-end service industry5, and High2 is the proportion of employees belonging to the high-end service industry that accounts for the quantity of staffs in the tertiary industry. As observed in columns (1) and (2) in Table 6, the coefficients of Treat×Post are positive significantly, denoting that the establishment of the NEDCs has effectively changed the city's industrial structure.
In the meantime, the Innovation and Entrepreneurship Index of China created by Zhang (2019) is utilized in this article to evaluate cities’ innovation capabilities. Specifically, this article uses the city scores (Scores) and per capita scores (Pscores) as proxy variables for city innovation capacity. The coefficients of Treat×Post are all show significantly positive features. It denoted the NEDCP can greatly improve the innovation capabilities of the pilot cities.
6. Conclusions and Policy Recommendations
Developing new energy is a pivotal move to promote China's green economy. And the NEDCP is a crucial pilot plan to accelerate the evolution of new energy. The DID method and unbalanced panel data from 286 prefecture-level cities during the period of 2003- 2017 are used in this research to look into the influence of the NEDCP on green and low-carbon development. This article also takes into account the heterogeneity between cities. The conclusions are as follows. At first, the NEDCP can dramatically reduce urban carbon emissions intensity and stimulate urban low-carbon development. We still confirm the positive policy effect of the NEDCP. Furthermore, we find that it can reduce emission intensity by spurring the industrial structure upgrading and urban innovation. At second, after considering the heterogeneity between cities, we confirm that resource endowments and urban industrial characteristics will significantly affect the policy effects. In terms of differences in resource endowment, for non-resource-based cities, the policy can dramatically decrease the local carbon intensity. In general, on account of less dependence on traditional energy, energy structure transformation of non-resource-based cities are relatively easy. Regarding the heterogeneity of industrial characteristics, the NEDCP has more significant policy effects in non-industrial base cities. It happens because the old industrial base has a low industry level, high intensity of energy consumption and emissions. Additionally, because of the path dependence of production technology, the reduction in emission intensity is slight, making the new energy demonstration city less effective.
According to our results, we give the following implications: (1) Expanding the scope of the pilot program of the NEDCs. Their establishment can significantly advance urban green development. The central government should further expand the pilot range of the NEDCs, clarify the selection criteria, formulate a reasonable evaluation system, strengthen supervision of the NEDCs and promote local green development. (2) Upgrading the industrial structure as well as improving the city's innovation ability. The local government should attach more importance to the upgrading effect and innovation effect of NEDCs. Specifically, the local authority should create a good investment environment actively, spur the progress of local high-tech enterprises, stimulate the innovation and application of high-tech. These measures will help enhance energy efficiency so as to cut down carbon emission in China. (3) Considering city heterogeneity when developing relevant policies. For cities with resource endowments, the local government should further strengthen the application of new energy. It can take measures such as subsidies to lower dependencies on traditional fossil energy resources. For cities in the old industrial base, the local government should actively promote industrial transformation.
Figure 1.
The geographical distribution of the samples studied in this paper.
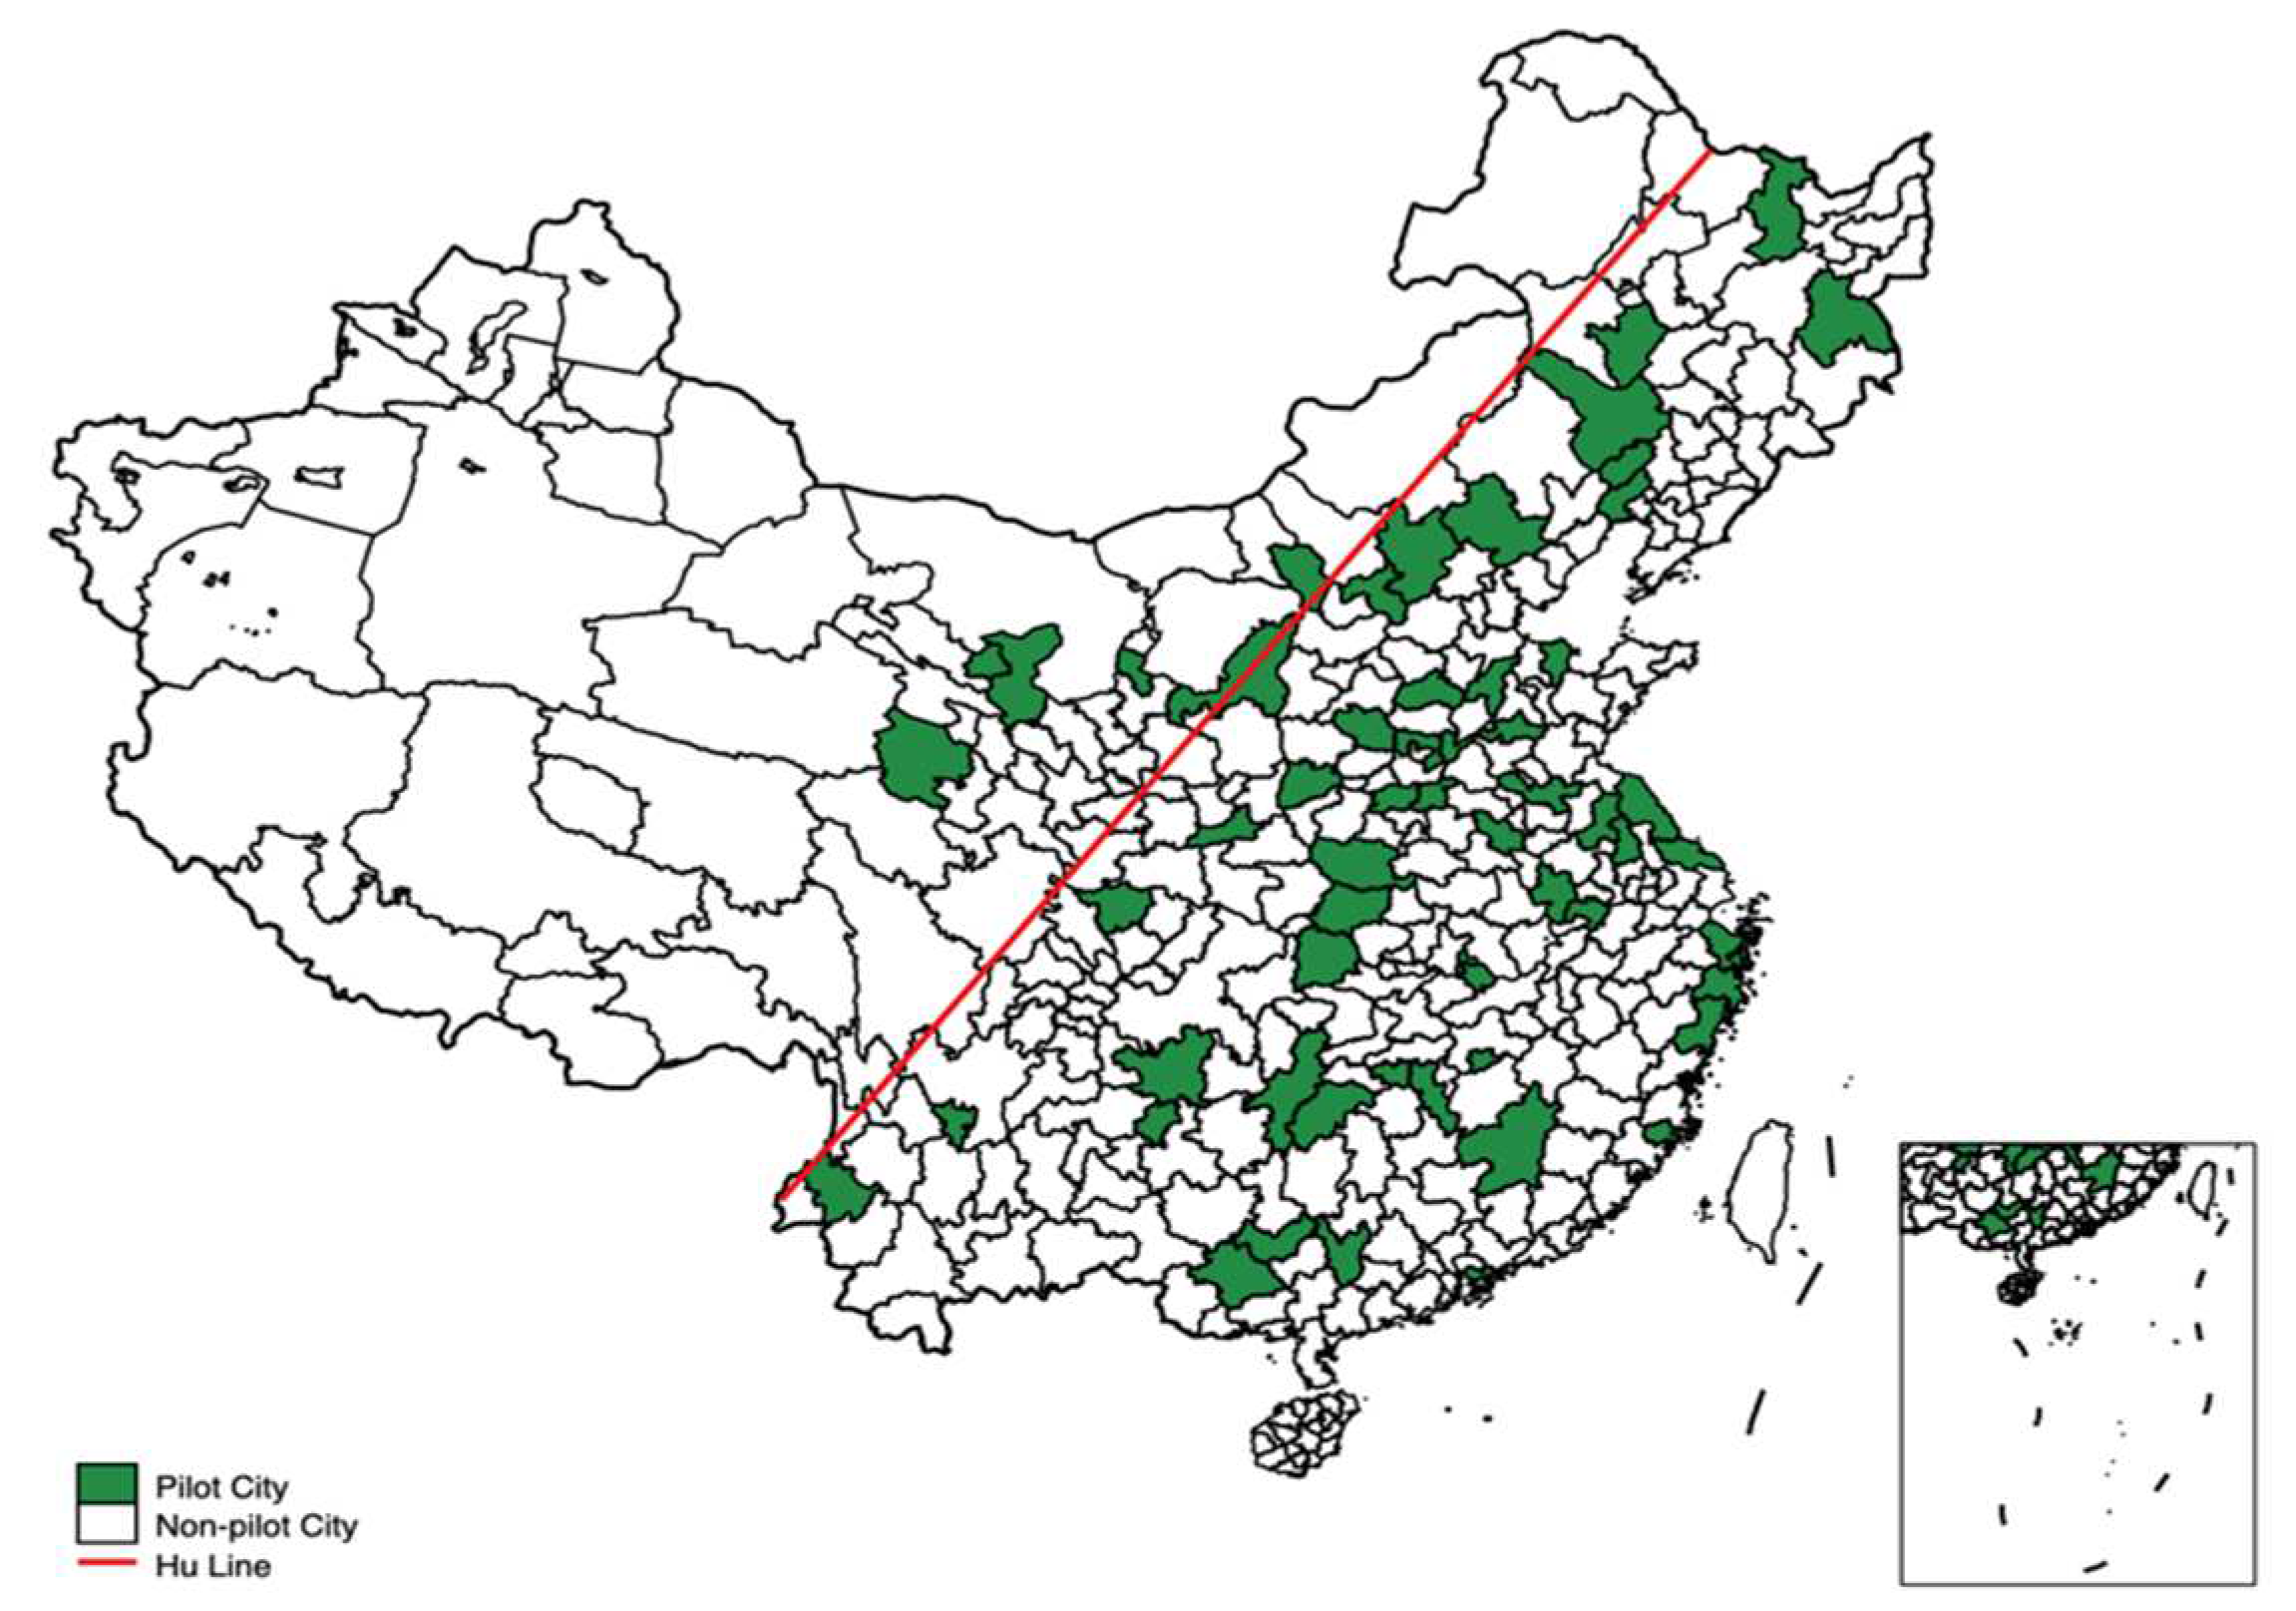
Figure 2.
Results of Parallel trend test.
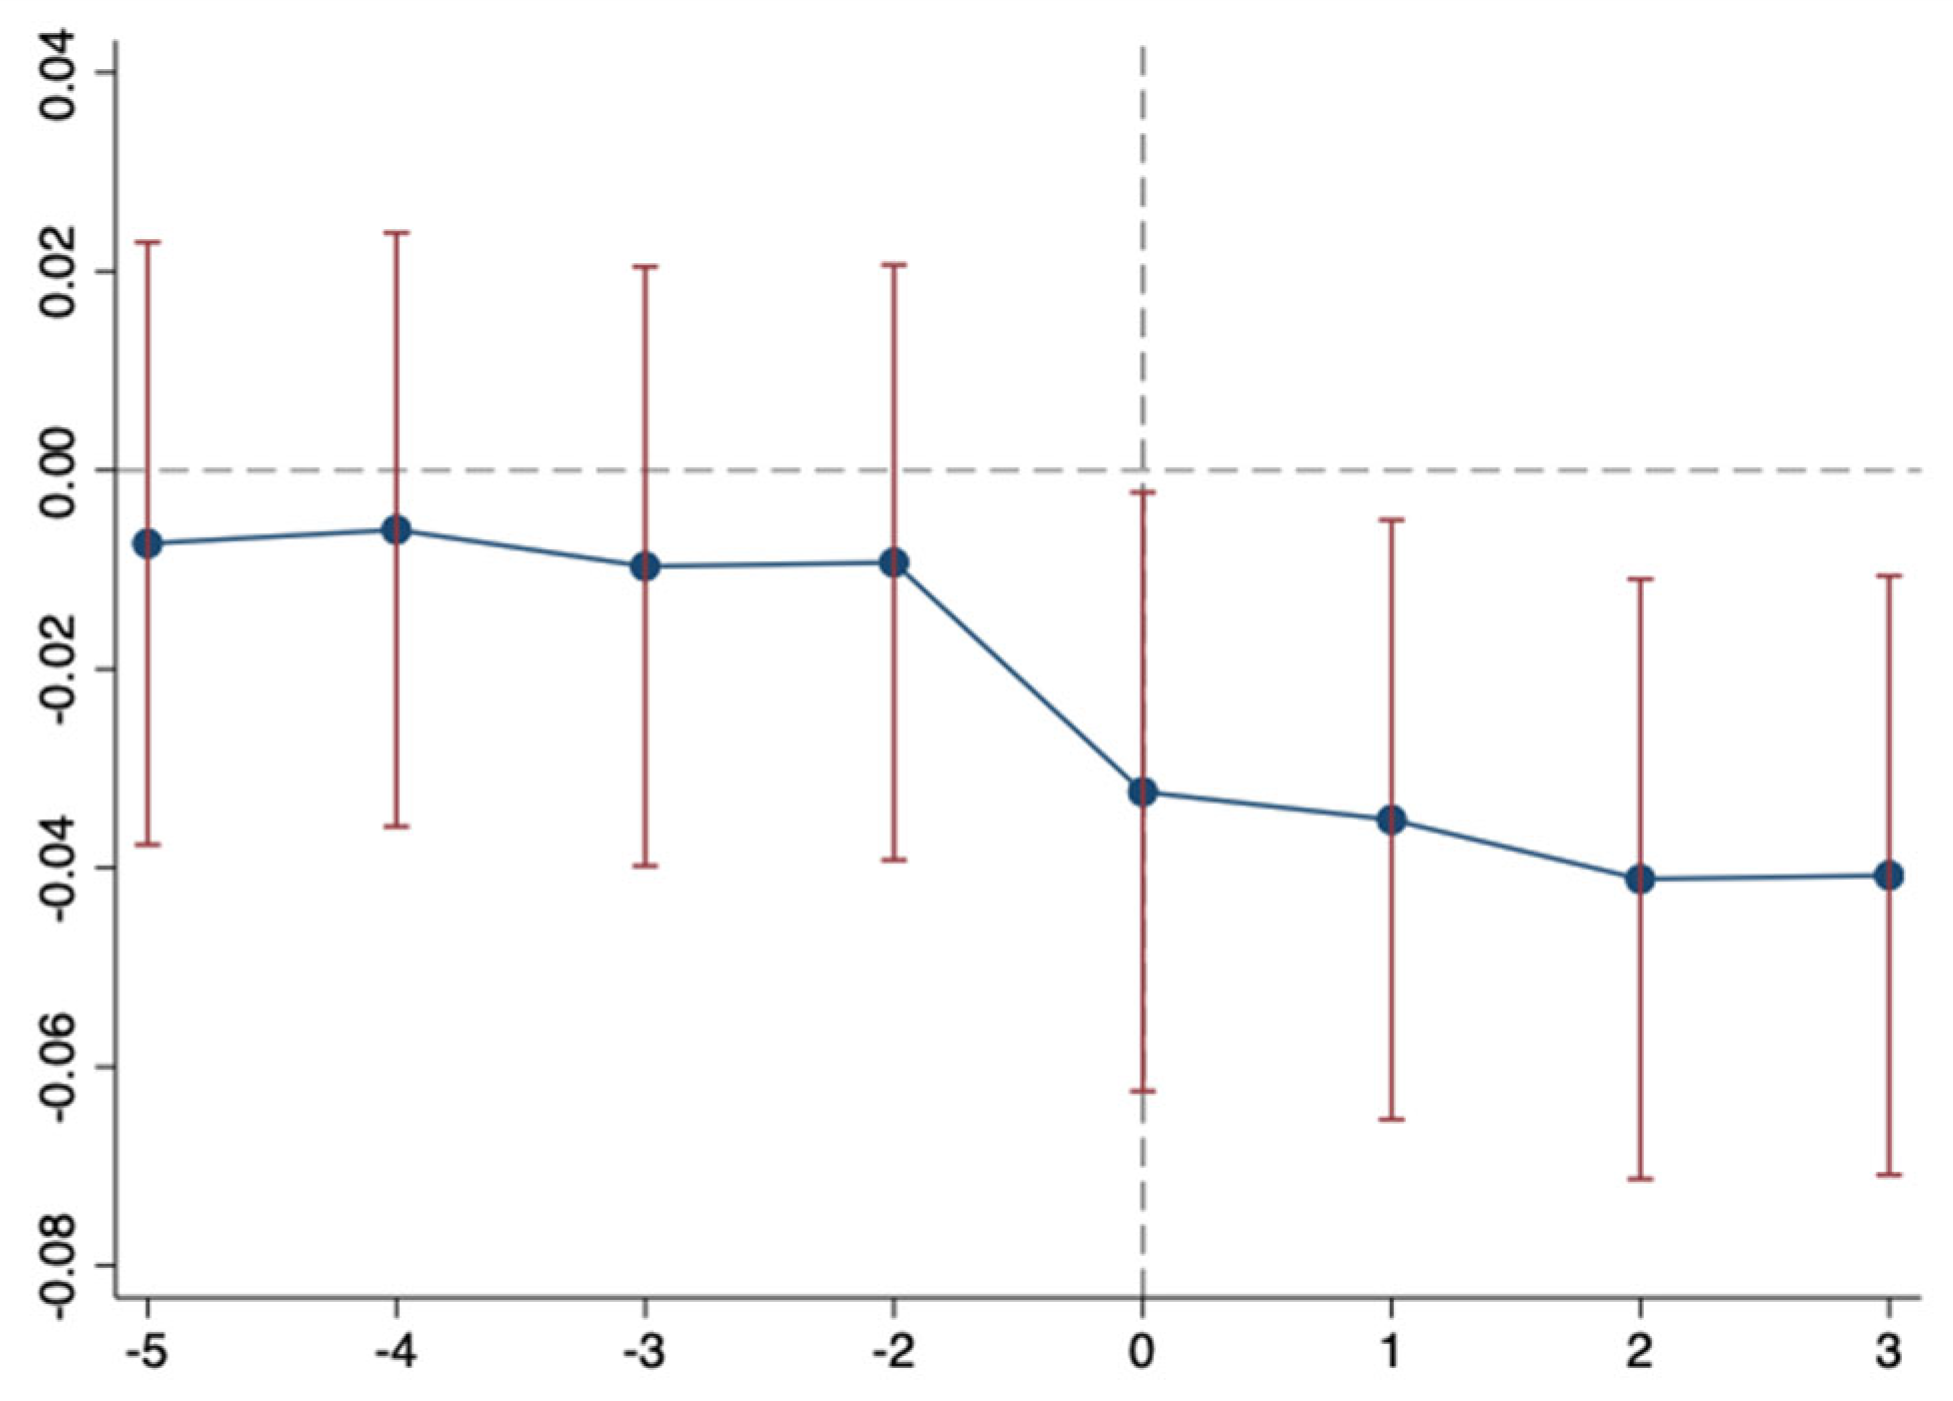
Figure 3.
Results of Placebo test.

Figure 4.
Kernel density function matching.
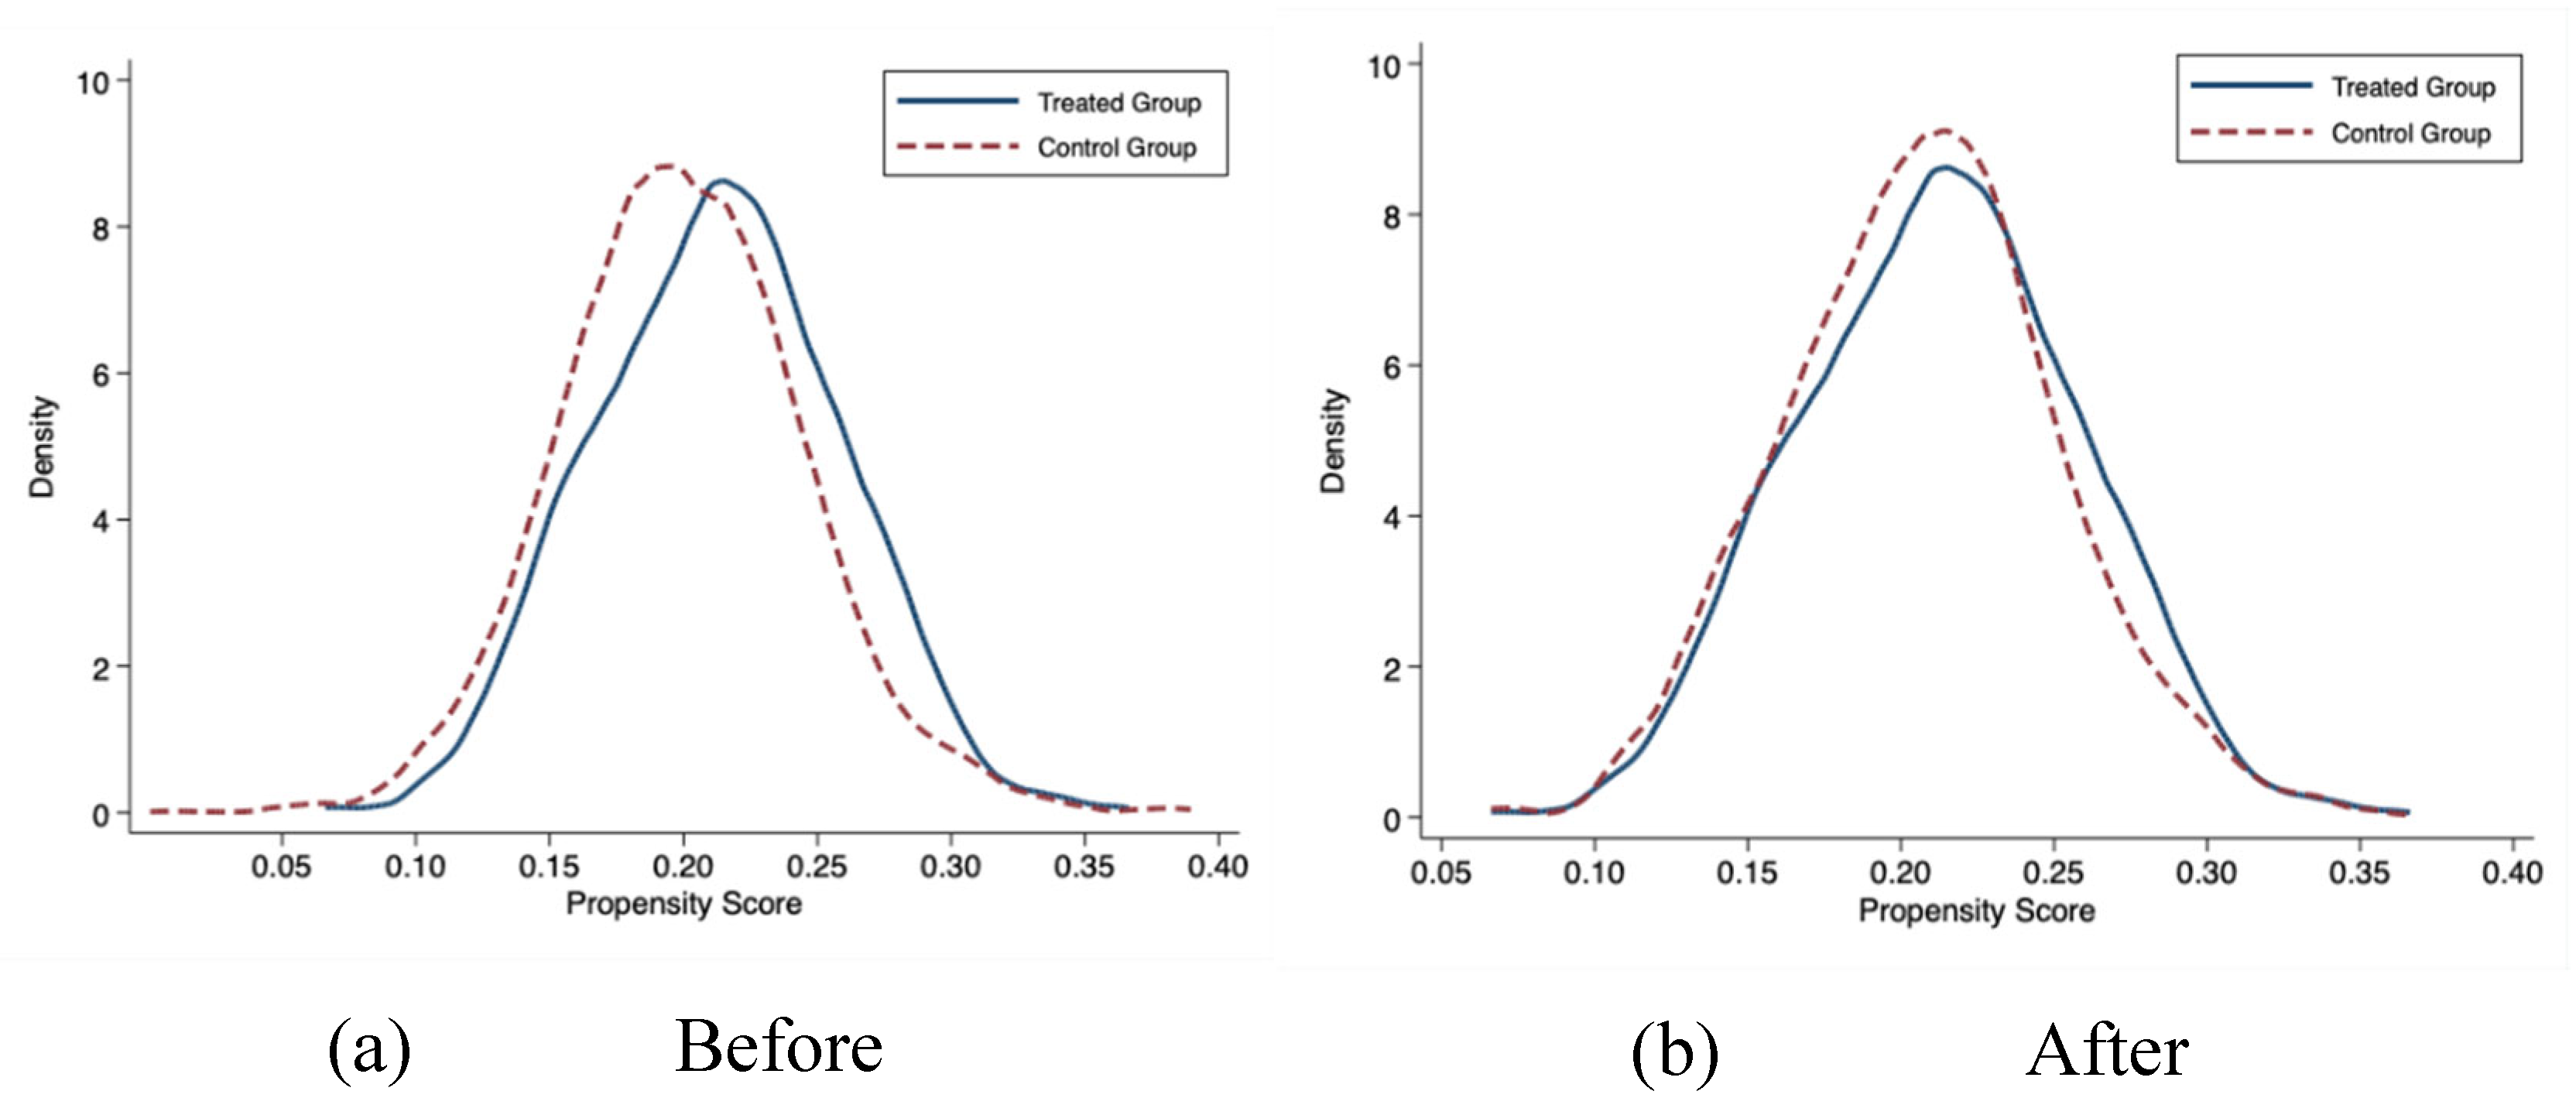

Table 1.
Descriptive statistics of variables.
| Variable | Unit | Obs | Mean | S.D. | Min | Max |
| CARGDP | Tons/104 yuan | 4290 | 0.74 | 0.71 | -1.99 | 3.38 |
| POP | Person/km2 | 4290 | 5.72 | 0.93 | 1.55 | 9.98 |
| PGDP | Yuan/person | 4290 | 9.90 | 0.86 | 6.22 | 12.91 |
| IND | % | 4290 | 2.83 | 1.85 | 0.00 | 9.50 |
| INCA | Number | 4290 | 48.31 | 11.01 | 9.00 | 90.97 |
| OPEN | % | 4170 | 1.98 | 2.61 | 0.00 | 90.51 |
| PRES | % | 4290 | 1.73 | 1.83 | -0.19 | 26.10 |
Table 2.
Baseline regression.
| (1) | (2) | (3) | (4) | (5) | (6) | (7) | |
| CARGDP | CARGDP | CARGDP | CARGDP | CARGDP | CARGDP | CARGDP | |
| Treat×Post | -0.0248** | -0.0247** | -0.0271** | -0.0339*** | -0.0332*** | -0.0362*** | -0.0344*** |
| (0.0115) | (0.0115) | (0.0108) | (0.0101) | (0.0101) | (0.0100) | (0.0100) | |
| POP | -0.0208 | -0.4780*** | -0.3412*** | -0.3408*** | -0.3787*** | -0.3606*** | |
| (0.0131) | (0.0232) | (0.0228) | (0.0227) | (0.0228) | (0.0231) | ||
| PGDP | -0.5152*** | -0.3551*** | -0.3557*** | -0.3952*** | -0.3757*** | ||
| (0.0222) | (0.0222) | (0.0222) | (0.0223) | (0.0226) | |||
| IND | 0.0101*** | 0.0102*** | 0.0064*** | 0.0070*** | |||
| (0.0016) | (0.0016) | (0.0018) | (0.0018) | ||||
| IND2 | -0.0002*** | -0.0002*** | -0.0001*** | -0.0002*** | |||
| (0.0000) | (0.0000) | (0.0000) | (0.0000) | ||||
| INCA | -0.0139*** | -0.0135*** | -0.0128*** | ||||
| (0.0032) | (0.0032) | (0.0032) | |||||
| OPEN | 0.0013 | 0.0013 | |||||
| (0.0010) | (0.0009) | ||||||
| PRES | 0.0122*** | ||||||
| (0.0025) | |||||||
| Constant | 0.7398*** | 0.8591*** | 8.5759*** | 6.2038*** | 6.2419*** | 6.9059*** | 6.5686*** |
| (0.0021) | (0.0749) | (0.3405) | (0.3353) | (0.3347) | (0.3384) | (0.3442) | |
| City effect | Yes | Yes | Yes | Yes | Yes | Yes | Yes |
| Year effect | Yes | Yes | Yes | Yes | Yes | Yes | Yes |
| N | 4290 | 4290 | 4290 | 4290 | 4290 | 4170 | 4170 |
| R2 | 0.9646 | 0.9646 | 0.9688 | 0.9726 | 0.9727 | 0.9733 | 0.9734 |
Notes: *, ** and *** indicate statistical significance at the 10%, 5% and 1% levels, respectively. Standard errors in parentheses. The same below.
Table 3.
Heterogeneity analysis.
| (1) | (2) | (3) | (4) | |
| Resource-based | Non-resource-based | Old industrial base |
Non-old industrial base | |
| Treat×Post | -0.0145 | -0.0523*** | -0.0293* | -0.0441*** |
| (0.0170) | (0.0121) | (0.0159) | (0.0127) | |
| Control | Yes | Yes | Yes | Yes |
| City effect | Yes | Yes | Yes | Yes |
| Year effect | Yes | Yes | Yes | Yes |
| N | 1676 | 2494 | 1387 | 2783 |
| R2 | 0.9649 | 0.9766 | 0.9735 | 0.9742 |
Table 4.
Applicability test of PSM-DID method.
| Unmatched | Mean | %reduct | t-test | ||||
| Variable | Matched | Treated | Control | %bias | bias | t | p>|t| |
| POP | U | 5.7724 | 5.7542 | 2.0 | 0.52 | 0.6050 | |
| M | 5.7724 | 5.7685 | 0.4 | 78.5 | 0.09 | 0.9290 | |
| PGDP | U | 9.9284 | 9.9003 | 3.4 | 0.85 | 0.3930 | |
| M | 9.9284 | 9.9485 | -2.4 | 28.6 | -0.5 | 0.6160 | |
| IND | U | 48.8950 | 48.156 | 6.9 | 1.79 | 0.0730 | |
| M | 48.8950 | 48.853 | 0.4 | 94.3 | 0.08 | 0.9340 | |
| INCA | U | 3.1050 | 2.8111 | 16.1 | 4.13 | 0.0000 | |
| M | 3.1050 | 3.1471 | -2.3 | 85.7 | -0.47 | 0.6400 | |
| OPEN | U | 1.7925 | 2.0215 | -9.8 | -2.27 | 0.0230 | |
| M | 1.7925 | 1.8487 | -2.4 | 75.4 | -0.61 | 0.5410 | |
| PRES | U | 1.5613 | 1.6776 | -6.7 | -1.8 | 0.0720 | |
| M | 1.5613 | 1.5453 | 0.9 | 86.3 | 0.2 | 0.8390 | |
Table 5.
Robustness test.
| (1) | (2) | (3) | (4) | |
| CARGDP | CARGDP | SURGDP | PSM-DID | |
| Treat×Post | -0.0361*** | -0.0390*** | -0.0919** | -0.0350*** |
| (0.0089) | (0.0097) | (0.0423) | (0.0100) | |
| Control | Yes | Yes | Yes | Yes |
| City effect | Yes | Yes | Yes | Yes |
| Year effect | Yes | Yes | Yes | Yes |
| N | 4170 | 4170 | 4090 | 4156 |
| R2 | 0.9799 | 0.9753 | 0.8609 | 0.9735 |
Table 6.
Mechanism analysis.
| (1) | (2) | (3) | (4) | |
| High1 | High2 | Scores | Pscores | |
| Treat×Post | 0.0362*** | 0.4429** | 2.5075*** | 2.3207*** |
| (0.0130) | (0.1847) | (0.8181) | (0.6939) | |
| Control | Yes | Yes | Yes | Yes |
| City effect | Yes | Yes | Yes | Yes |
| Year effect | Yes | Yes | Yes | Yes |
| N | 4170 | 4161 | 4095 | 4095 |
| R2 | 0.9572 | 0.8375 | 0.8864 | 0.9221 |
| 1 | The “Hu Line”, also called Heihe-Tengchong Line, is a geographical line that is frequently used to divide China into two areas with distinct demographic and economic conditions. |
| 2 | The detailed classification standard could be found from http://www.gov.cn/zwgk/2013-12/03/content_2540070.htm. |
| 3 | The list of cities could be found from http://www.gov.cn/gongbao/content/2013/content_2441018.htm
|
| 4 | According to China's Seventh Population Census (2020), the outflow of the population in Northeast China from 2010 to 2020 was as high as 11.01 million, which is more than 10% of the region’s total population. In addition, the three provinces of Liaoning, Jilin, and Heilongjiang in Northeast China are ranked relatively backward in terms of total GDP and GDP growth rate among Chinese provinces. |
| 5 | Specifically, based on the classification standard of Industrial Classification of National Economic Activities, we classify high-end service industry as the following industries: Telecommunications, Financial Intermediation, Computer Services and Software, Scientific Research, Leasing and Business Services, Professional Technical Services and Geological Prospecting. |
References
- Apergis, N and JE Payne The renewable energy consumption–growth nexus in Central America. Applied Energy 2011, 88, 343–347. [CrossRef]
- Bai, J, J Lu and S Li Fiscal pressure, tax competition and environmental pollution. Environmental and resource economics 2019, 73, 431–447. [CrossRef]
- Chen, C, M Pinar and T Stengos Renewable energy consumption and economic growth nexus: Evidence from a threshold model. Energy Policy 2020, 139, 111295. [CrossRef]
- Chen, J, M Gao, S Cheng, X Liu, W Hou, M Song, D Li and W Fan China’s city-level carbon emissions during 1992–2017 based on the inter-calibration of nighttime light data. Scientific reports 2021, 11, 1–13.
- Chen, S, Y Zhang, Y Zhang and Z Liu The relationship between industrial restructuring and China's regional haze pollution: A spatial spillover perspective. Journal of Cleaner Production 2019, 239, 115808. [CrossRef]
- Chen, Y and L Zhao Exploring the relation between the industrial structure and the eco-environment based on an integrated approach: A case study of Beijing, China. Ecological Indicators 2019, 103, 83–93. [CrossRef]
- Cheng, J, J Yi, S Dai and Y Xiong Can low-carbon city construction facilitate green growth? Evidence from China's pilot low-carbon city initiative. Journal of cleaner production 2019, 231, 1158–1170. [CrossRef]
- Cheng, Z., Wang, L., & Zhang, Y. Does smart city policy promote urban green and low-carbon development? Journal of Cleaner Production 2022, 379, 134780.
- Chetty, R, A Looney and K Kroft Salience and taxation: Theory and evidence. American economic review 2009, 99, 1145–77. [CrossRef]
- Dai, H, X Xie, Y Xie, J Liu and T Masui Green growth: The economic impacts of large-scale renewable energy development in China. Applied energy 2016, 162, 435–449. [CrossRef]
- Destek, MA Renewable energy consumption and economic growth in newly industrialized countries: Evidence from asymmetric causality test. Renewable Energy 2016, 95, 478–484. [CrossRef]
- Destek, MA and A Aslan Disaggregated renewable energy consumption and environmental pollution nexus in G-7 countries. Renewable energy 2020, 151, 1298–1306. [CrossRef]
- Fan, Z and R Zhao Does rule of law promote pollution control? Evidence from the establishment of the environmental court. Economic Research Journal 2019, 54, 21–37.
- Fang, Z, X Gao and C Sun Do financial development, urbanization and trade affect environmental quality? Evidence from China. Journal of Cleaner Production 2020, 259, 120892. [CrossRef]
- Feng, C and M Wang Journey for green development transformation of China’s metal industry: A spatial econometric analysis. Journal of Cleaner Production 2019, 225, 1105–1117. [CrossRef]
- Khan, A, F Muhammad, Y Chenggang, J Hussain, S Bano and MA Khan The impression of technological innovations and natural resources in energy-growth-environment nexus: a new look into BRICS economies. Science of the Total Environment 2020, 727, 138265. [CrossRef]
- Khanna, N, D Fridley and L Hong China's pilot low-carbon city initiative: A comparative assessment of national goals and local plans. Sustainable Cities and Society 2014, 12, 110–121. [CrossRef]
- Lai, W, H Song, C Wang and H Wang Air pollution and brain drain: Evidence from college graduates in China. China Economic Review 2021, 68, 101624. [CrossRef]
- Li, G and W Wei Financial development, openness, innovation, carbon emissions, and economic growth in China. Energy Economics 2021, 97, 105194. [CrossRef]
- Li, Y, YH Chiu and LC Lu New energy development and pollution emissions in China. International Journal of Environmental Research and Public Health 2019, 1610, 1764.
- Lin, B and J Zhu The role of renewable energy technological innovation on climate change: empirical evidence from China. Science of the Total Environment 2019, 659, 1505–1512. [CrossRef]
- Liu, L, J Jiang, J Bian, Y Liu, G Lin and Y Yin Are Environmental Regulations Holding Back Industrial Growth? Journal of Cleaner Production 2021, 127007.
- Lu, Y, Z Tao and L Zhu Identifying FDI spillovers. Journal of International Economics 2017, 107, 75–90. [CrossRef]
- Matthews, HD, NP Gillett, PA Stott and K Zickfeld The proportionality of global warming to cumulative carbon emissions. Nature 2009, 4597248, 829–832.
- Neij, L, E Heiskanen and L Strupeit The deployment of new energy technologies and the need for local learning. Energy Policy 2017, 101, 274–283. [CrossRef]
- Ocal, O and A Aslan Renewable energy consumption–economic growth nexus in Turkey. Renewable and sustainable energy reviews 2013, 28, 494–499. [CrossRef]
- Pao, HT and HC Fu Renewable energy, non-renewable energy and economic growth in Brazil. Renewable and Sustainable Energy Reviews 2013, 25, 381–392. [CrossRef]
- Sohag, K, FD Taşkın and MN Malik Green economic growth, cleaner energy and militarization: Evidence from Turkey. Resources Policy 2019, 63, 101407. [CrossRef]
- Wen, H, and CC Lee Impact of environmental labeling certification on firm performance: Empirical evidence from China. Journal of Cleaner Production 2020, 255, 120201. [CrossRef]
- Wen, H, CC Lee and F Zhou Green credit policy, credit allocation efficiency and upgrade of energy-intensive enterprises. Energy Economics 2021, 94, 105099. [CrossRef]
- Xie, F, Y Liu, F Guan and N Wang How to coordinate the relationship between renewable energy consumption and green economic development: from the perspective of technological advancement. Environmental Sciences Europe 2020, 32, 1–15.
- Yu, D, X Li, J Yu and H Li The impact of the spatial agglomeration of foreign direct investment on green total factor productivity of Chinese cities. Journal of Environmental Management 2021, 290, 112666. [CrossRef]
- Yu, S, X Hu, L Li and H Chen Does the development of renewable energy promote carbon reduction? Evidence from Chinese provinces. Journal of Environmental Management 2020, 268, 110634. [CrossRef]
- Zhang, X (2019). China Innovation and Entrepreneurship Index. Peking University Open Research Data Platform.
- Zhao, Y, X Shi and F Song. Has Chinese outward foreign direct investment in energy enhanced China's energy security? Energy Policy 2020, 146, 111803. [Google Scholar] [CrossRef]
- Zhou, X, M Zhang, M Zhou and M Zhou A comparative study on decoupling relationship and influence factors between China's regional economic development and industrial energy–related carbon emissions. Journal of Cleaner Production 2017, 142, 783–800. [CrossRef]
- Zhu, B, M Zhang, Y Zhou, P Wang, J Sheng, K He, YM Wei and R Xie Exploring the effect of industrial structure adjustment on interprovincial green development efficiency in China: a novel integrated approach. Energy Policy 2019, 134, 110946. [CrossRef]
Disclaimer/Publisher’s Note: The statements, opinions and data contained in all publications are solely those of the individual author(s) and contributor(s) and not of MDPI and/or the editor(s). MDPI and/or the editor(s) disclaim responsibility for any injury to people or property resulting from any ideas, methods, instructions or products referred to in the content. |
© 2023 by the authors. Licensee MDPI, Basel, Switzerland. This article is an open access article distributed under the terms and conditions of the Creative Commons Attribution (CC BY) license (http://creativecommons.org/licenses/by/4.0/).
Copyright: This open access article is published under a Creative Commons CC BY 4.0 license, which permit the free download, distribution, and reuse, provided that the author and preprint are cited in any reuse.


