1. Introduction
The elastic properties of alloys are fundamental characteristics associated with the atomic binding energy and are determined for small deviations of the atoms from their equilibrium positions. The modulus of elasticity, or Young’s modulus (E), is related to the alloy’s stiffness and is an intrinsic property of each material. The shear modulus, or modulus of rigidity (G) describes the resistance of the material to a shearing deformation in the elastic regime [
1,
2].
The qualitative methods commonly used to determine elastic properties of metal alloys are destructive, have geometry restrictions,
i.e., need standard samples and qualified staff for subsequent data analysis. A typical example is the widely applied tensile test by the quasi-static loading with a total deformation exceeding 1% [
2].
In contrast to quasi-static methods, the dynamic testing methods for elastic-strength characteristics, such as dynamic Young's modulus (E
d), dynamic shear modulus (G
d), and Poisson's ratio (μ), are determined by means of excitation of atomic vibrations through the propagation of elastic waves and by the determination of the resonant frequencies of lattice vibration of the materials without causing plastic deformation. These methods are of high precision. This explains the use of resonance methods for the study of various types of phase transformations in steels and alloys over a wide temperature range. Electromagnetic, piezoelectric, electrostatic, electrodynamic, mechanical, and other methods can also be used to excite vibrations in the sample for the determination of the dynamic modulus of elasticity [
3]. Nowadays, many researchers are using Ultrasonic and Impulse Excitation Techniques as non-destructive testing to evaluate the mechanical properties of metallic materials [
2,
3,
4,
5,
6,
7,
8,
9,
10].
In particular, the Impulse Excitation Technique (IET) has been highlighted as a straightforward, non-destructive, and fast method for the determination of the elastic constants and damping characteristics of different classes of materials [
5,
6,
7,
8,
9]. The IET is based on the acoustic response in free vibration, after an initial impulse, of the material whose elastic properties are to be determined [
10].
The stability of the elastic properties at different temperatures will affect the application of the material in harsh environments. For example, the natural frequency of some special engineering designs changes with the temperature. Therefore, metals and alloys with much more stable elastic properties are more feasible in engineering applications. On the other hand, sometimes engineers are interested in the elastic constants of a new metal alloy. Especially in reverse engineering, material properties need to be measured without sample destruction. Thus, the non-destructive approach is profitable for material characterization [
11,
12,
13,
14,
15].
The importance of studying the elastic properties became particularly evident when Zener [
16] found that in the ordered body-centered cubic (BCC) phases of the CsCl-type, the shear modulus in the crystallographic systems (110) decreased its value, which lead to the loss of elastic stiffness and subsequent phase transformation. It has been found that in polycrystalline alloys undergoing reversible martensitic transformation (RMT), both E and G decrease and pass through a minimum, indicating a loss of elastic stiffness and rigidity of the martensite lattice upon heating. With the formation of the high-temperature phase (austenite), the elastic stability of the lattice increases,
i.e., its stiffness and rigidity increase, and as a result the E and G increase again.
This drop in the E and G, to a minimum value (softening) has been observed both on heating to A
s (in the reverse martensitic transformation M
A) and on cooling to M
s (in the direct martensitic transformation A
M) in quenched alloys of Au-Cd [
17], In-Tl [
18], Mn-Cu [
19], β-Cu-Au-Zn [
20], TiNi [
21] and other systems. In the critical interval of phase transformations, the Poisson's ratio reaches the highest values [
17,
21,
22]. On completion of the phase transitions, the moduli increase again [
17,
20,
21,
22].
Therefore, measurements of E and G are of great help in studying phase transformations in steels. Anomalous behavior of the elastic properties was also found in Fe-based alloys with RMT: Fe-Cr-Ni, Fe-Mn, Fe-Ni-Co-Ti [
23], carbon steels, and stainless steels [
9,
12,
13,
14,
15,
24].
In their study, Popov and Shitikova [
9] aimed to gain more insights into complex processes that take place in quenched and tempered steels with different chromium contents (3 %, 12 % and 18 % Cr), by measuring the E
d and the hardness. The values of E
d were determined by the dynamic method by comparing the natural frequency of the vibrations with the frequency of a string stretched by a weight. They found that the E
d of high-alloy chromium steels begins to increase after low-temperature quenching and then remains almost constant up to quenching temperatures of 525-550 °C. The higher the chromium content of the steel, the smaller the initial increase and the longer the horizontal part of the curve. It can be seen that a small peak occurs at 150 °C and then the hardness starts to drop. Another peak was observed at 450-500 °C, because of participation of the carbide phase. After quenching and tempering at 525-550 °C the hardness decreases and E
d increases up to 700 °C.
Lindgren and Back [
12], aiming to simulate several thermo-mechanical processes, proposed: “
a model for hypoeutectoid steels that accounts for temperature dependency as well as the influence of alloying. The model consisted of separate parts for the ferrite and austenite phases. The latter also included a specific contribution due to ferromagnetism. The model was calibrated versus iron and evaluated against various low alloy steels”.
In a recent investigation of Tripathy et al. [
15], high temperature E
d of an advanced 18Cr-9Ni-2.95 Cu-0.58 Nb-0.1C austenitic stainless steel were measured during heating to 1000 °C and cooling to RT using the IET. The E
d and G
d values in the heating cycle were found to decrease with increasing temperature with a non-linear behavior. It was also found that during cooling the Cu precipitation from the austenite matrix contributed to the significant moduli variations at 689-477 °C, indicating instability, decomposition, and change in austenite phase composition in this thermal interval.
In the study of Fukuhara and Sanpei [
24], the temperature dependence of the E
d, G
d, and bulk moduli, as well as the Poisson's ratio and Lamé parameter, longitudinal and transverse internal friction values for low carbon steel S10C and stainless steel SUS304 were measured simultaneously over a temperature range of 300-1500 K using an ultrasonic pulse sing-around method. The authors indicate that the E
d and G
d decrease whilst the Poisson's ratio increases with increasing temperature, suggesting activation of the shear mode in the high temperature region. It was found that the internal friction was sensitive to the recrystallization process, to α(ferritic)/γ(austenitic) phase transition, and to the dissolution of precipitated carbide phases into the austenitic matrix, respectively.
Indeed, there is little data on the temperature behavior of the elastic moduli and damping characteristics of the low alloy carbon steels, which are widely used in engineering applications. On the other hand, these steels are sensitive to the heat treatments that are applied and show structures with both stable and metastable phases.
It is well known that tempering of quenched steels is accompanied by the decomposition of the α- and γ-solid solutions and also by carbide transformations. The processes that occur within steels are very complex. Taking into account that the elastic properties are very sensitive to phase composition and to distortions of the crystal lattice, the measurement of the Ed and other properties, with quenching and tempering is useful for the study of structural changes in heat-treated steels.
For scientific and technical purposes, it is important to obtain and compare the values of the Ed, Gd, Q-1 and their changes with temperature, for a low alloy carbon steel with stable and metastable structures as a result of different heat treatments. Consequently, studies on the feasibility of IET to assess the dynamic elastic properties associated with the phase stability of low alloy steels as temperature varies continuously are timely and relevant.
The material used in the current work was a low alloy carbon steel, the AISI 4130, containing chromium and molybdenum as strengthening agents. It is one of the most widely used low alloy steels for various applications due to its improved corrosion and wear resistance, hardenability, and enhanced mechanical strength for high temperature applications [
25,
26,
27,
28,
29]. When designing and selecting low-alloy steels used in various equipment and structures, elastic and damping properties play a key role. Furthermore, understanding the mechanical behavior and the phase stability as a function of temperature is also of critical importance, for science and new engineering projects.
This work is aimed to study the dynamic elastic moduli and damping behavior in a low alloy carbon steel, the AISI 4130, as a function of temperature, and to correlate their changes with the phase transformations that occur in this alloy with different initial structures: stable (annealed) and metastable (tempered), as a result of heat treatment. As the authors are aware, this is the first investigation of AISI 4130 elastic properties and phase stability as a function of temperature carried out by means of IET.
2. Materials and Methods
The AISI 4130 steel was produced in Villares Metals S/A and was supplied by the IST Supply Commercial EIRELI, Brazil.
Table 1 presents the nominal composition of the used specimen.
The AISI 4130 samples for E
d, G
d, μ, and Q
-1 determination were prepared with a thickness of 10 mm, a width of 25 mm, and a length of 150 mm. The dimensions were defined based on the dimensional criteria for IET and in accordance with ASTM E1876-22 standard [
10], which is based on the material’s acoustic response to the impulse excitation. The samples were split into two batches. One batch was annealed, and the other was quenched. Both the annealing and quenching treatments were carried out in a box furnace according to the conditions given in
Table 2.
Microstructural observation by confocal microscopy (CM) was carried out, after a conventional metallographic preparation, in the OLYMPUS LEXT OLS4000 microscope for morphological characterization of the obtained microstructures. Hereafter, scanning electron microscopy (SEM) was carried out in a SHIMADZU SSX-550 microscope for a more detailed microstructural and morphological analysis of the specimens.
X-ray diffraction (XRD) was performed on a Bruker D8 DISCOVER using Cu Kα radiation (= 0,15418nm) to determine the phase composition of the annealed and quenched sample. The data were acquired in the 2θ range from 40° to 100° with a step size of 0.03° and a counting time of 3 seconds per step.
Vickers hardness tests were carried out in a digital microhardness machine (Time Group Inc®) with an applied load of 10 kgf. Ten microhardness measurements were performed in each sample. The results obtained were statistically processed.
Dilatometric analysis was carried out to track critical temperature intervals for phase decomposition and phase transformations. Dilatometric curves were recorded, from room temperature (RT) to 900 °C at a rate of 5 °C.min-1, in a DIL 402C-NETZSCH dilatometer.
During the IET measurements, an impulse excitation was provided by a brief impact on the sample. This impact generates vibrations, that are intrinsic to each material and sample, also known as the natural frequency of vibration, and are temperature dependent. These vibrations are picked up by a microphone. In situ measurements were made during the heating and cooling cycles of the samples at temperatures ranging from RT to 900 °C. In accordance with ASTM E1876-22 [
10], Equations 1 and 2 were used for the determination of E
d and G
d of an excited bar with a rectangular section.
where
Ed is the dynamic Young's modulus [Pa],
Gd is the dynamic shear modulus [Pa],
m is the bar mass [g],
b,
L, and
t are the bar width, length, and thickness [mm] respectively, while
ff is the bar natural resonant frequency in bending [Hz],
ft is the bar natural resonant frequency in torsion [Hz],
T1 and
R, are correction factors.
Damping causes mechanical energy dissipation. In the case of IET, the energy is that of the acoustic wave, generated by the initial pulse, propagating in the analyzed material. Therefore, the damping was evaluated by the internal friction (Q
-1) of the studied steel sample, using the logarithmic decrement method according to Equation 3.
where
is the logarithmic decrement, while
and
are the amplitude of two successive cycles [
10,
30,
31].
The Sonelastic® software, developed by ATCP Physical Engineering, was used to process the obtained data [
10].
3. Results and Discussion
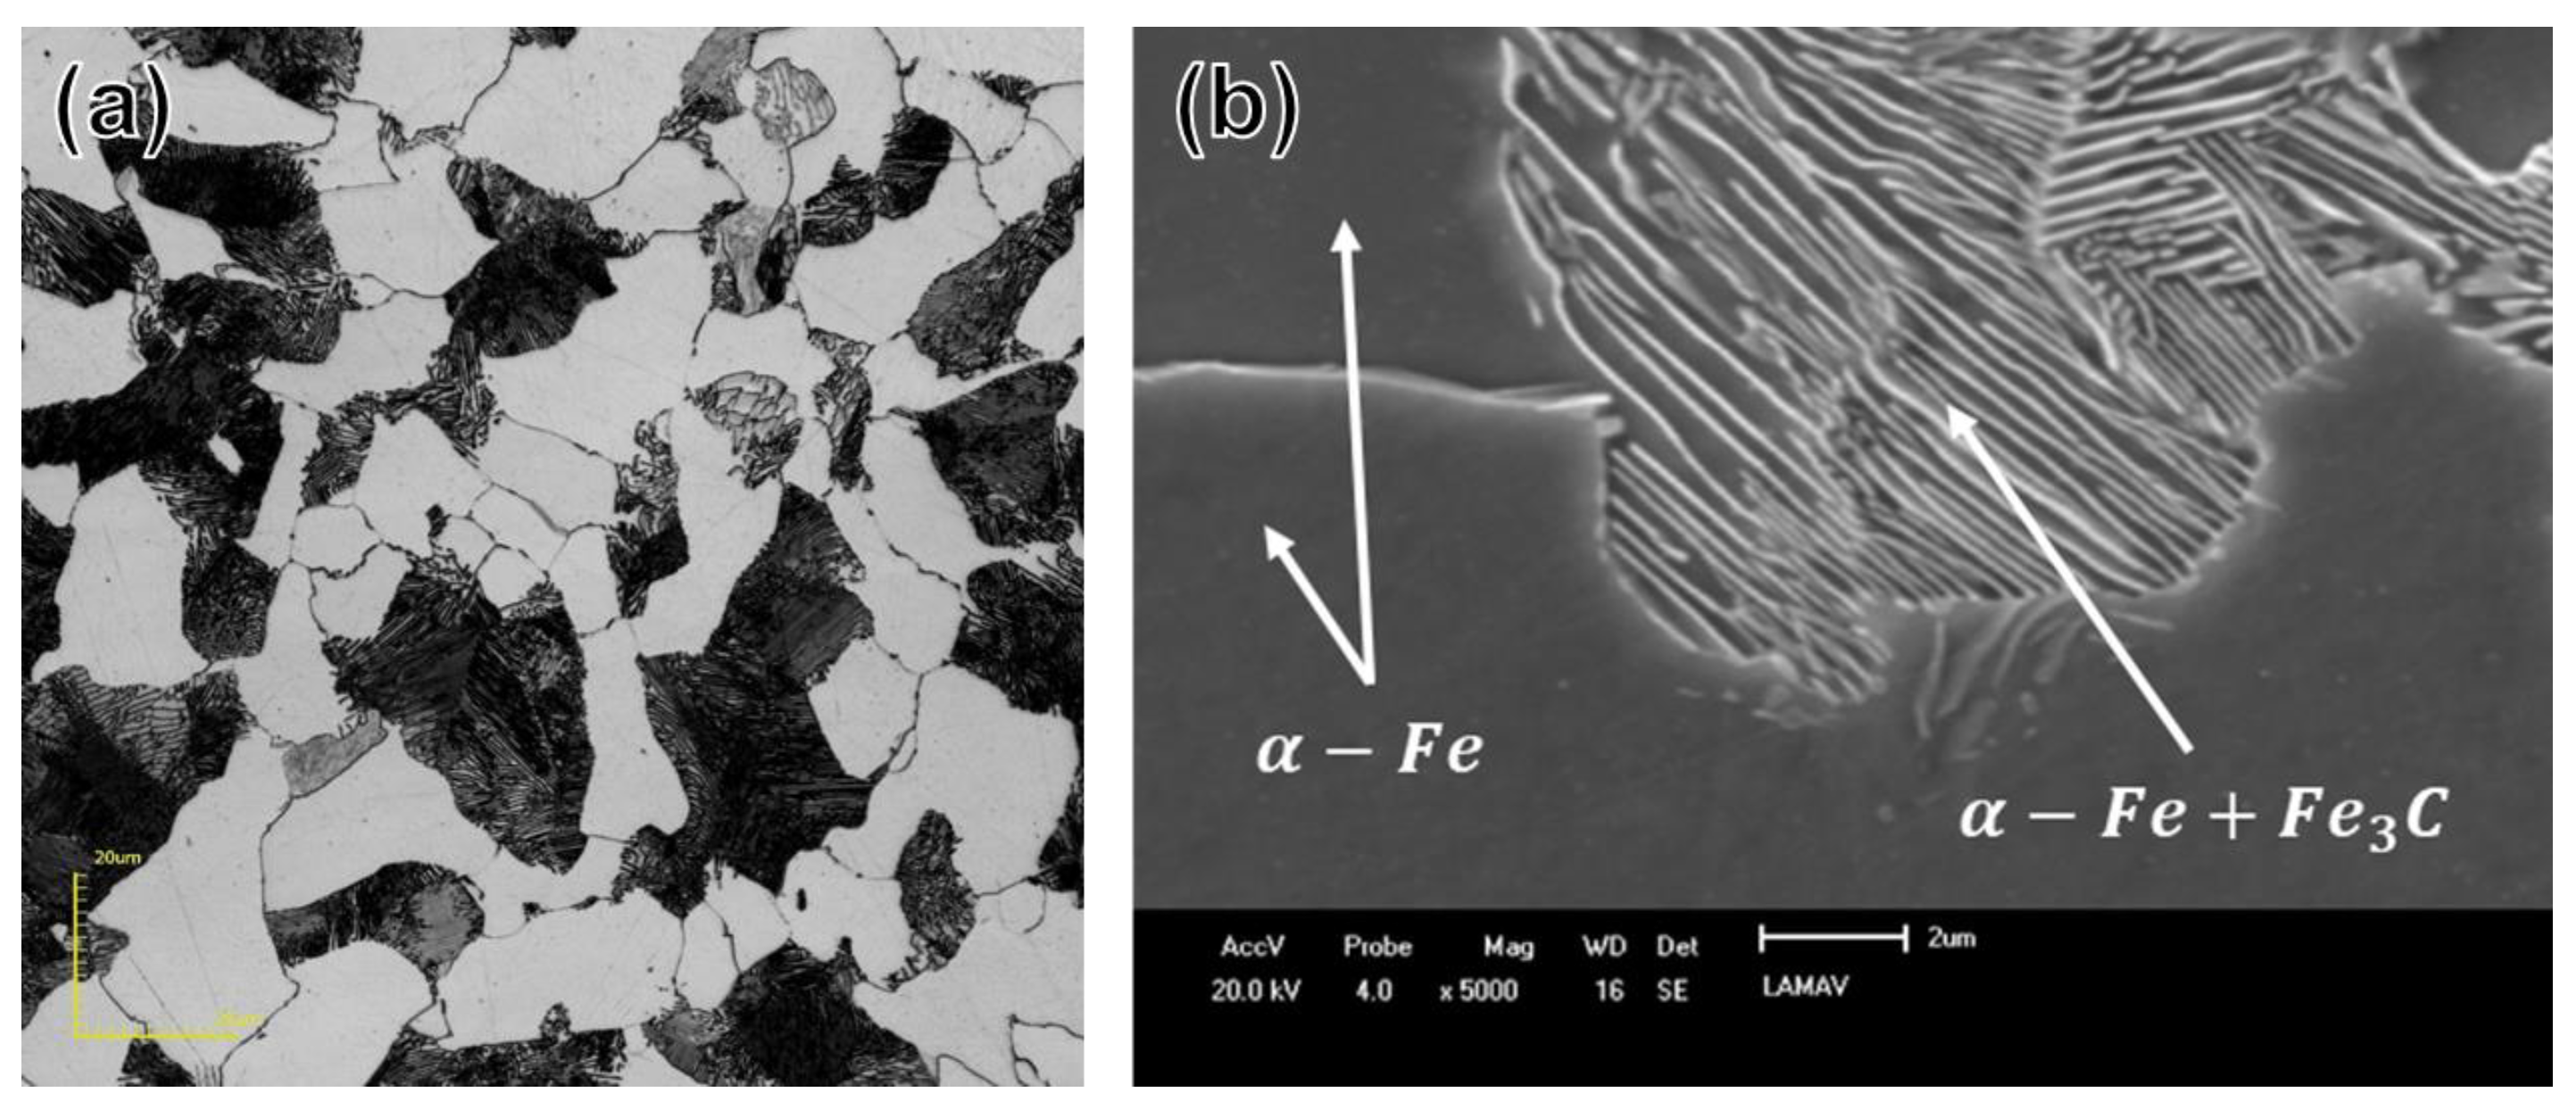
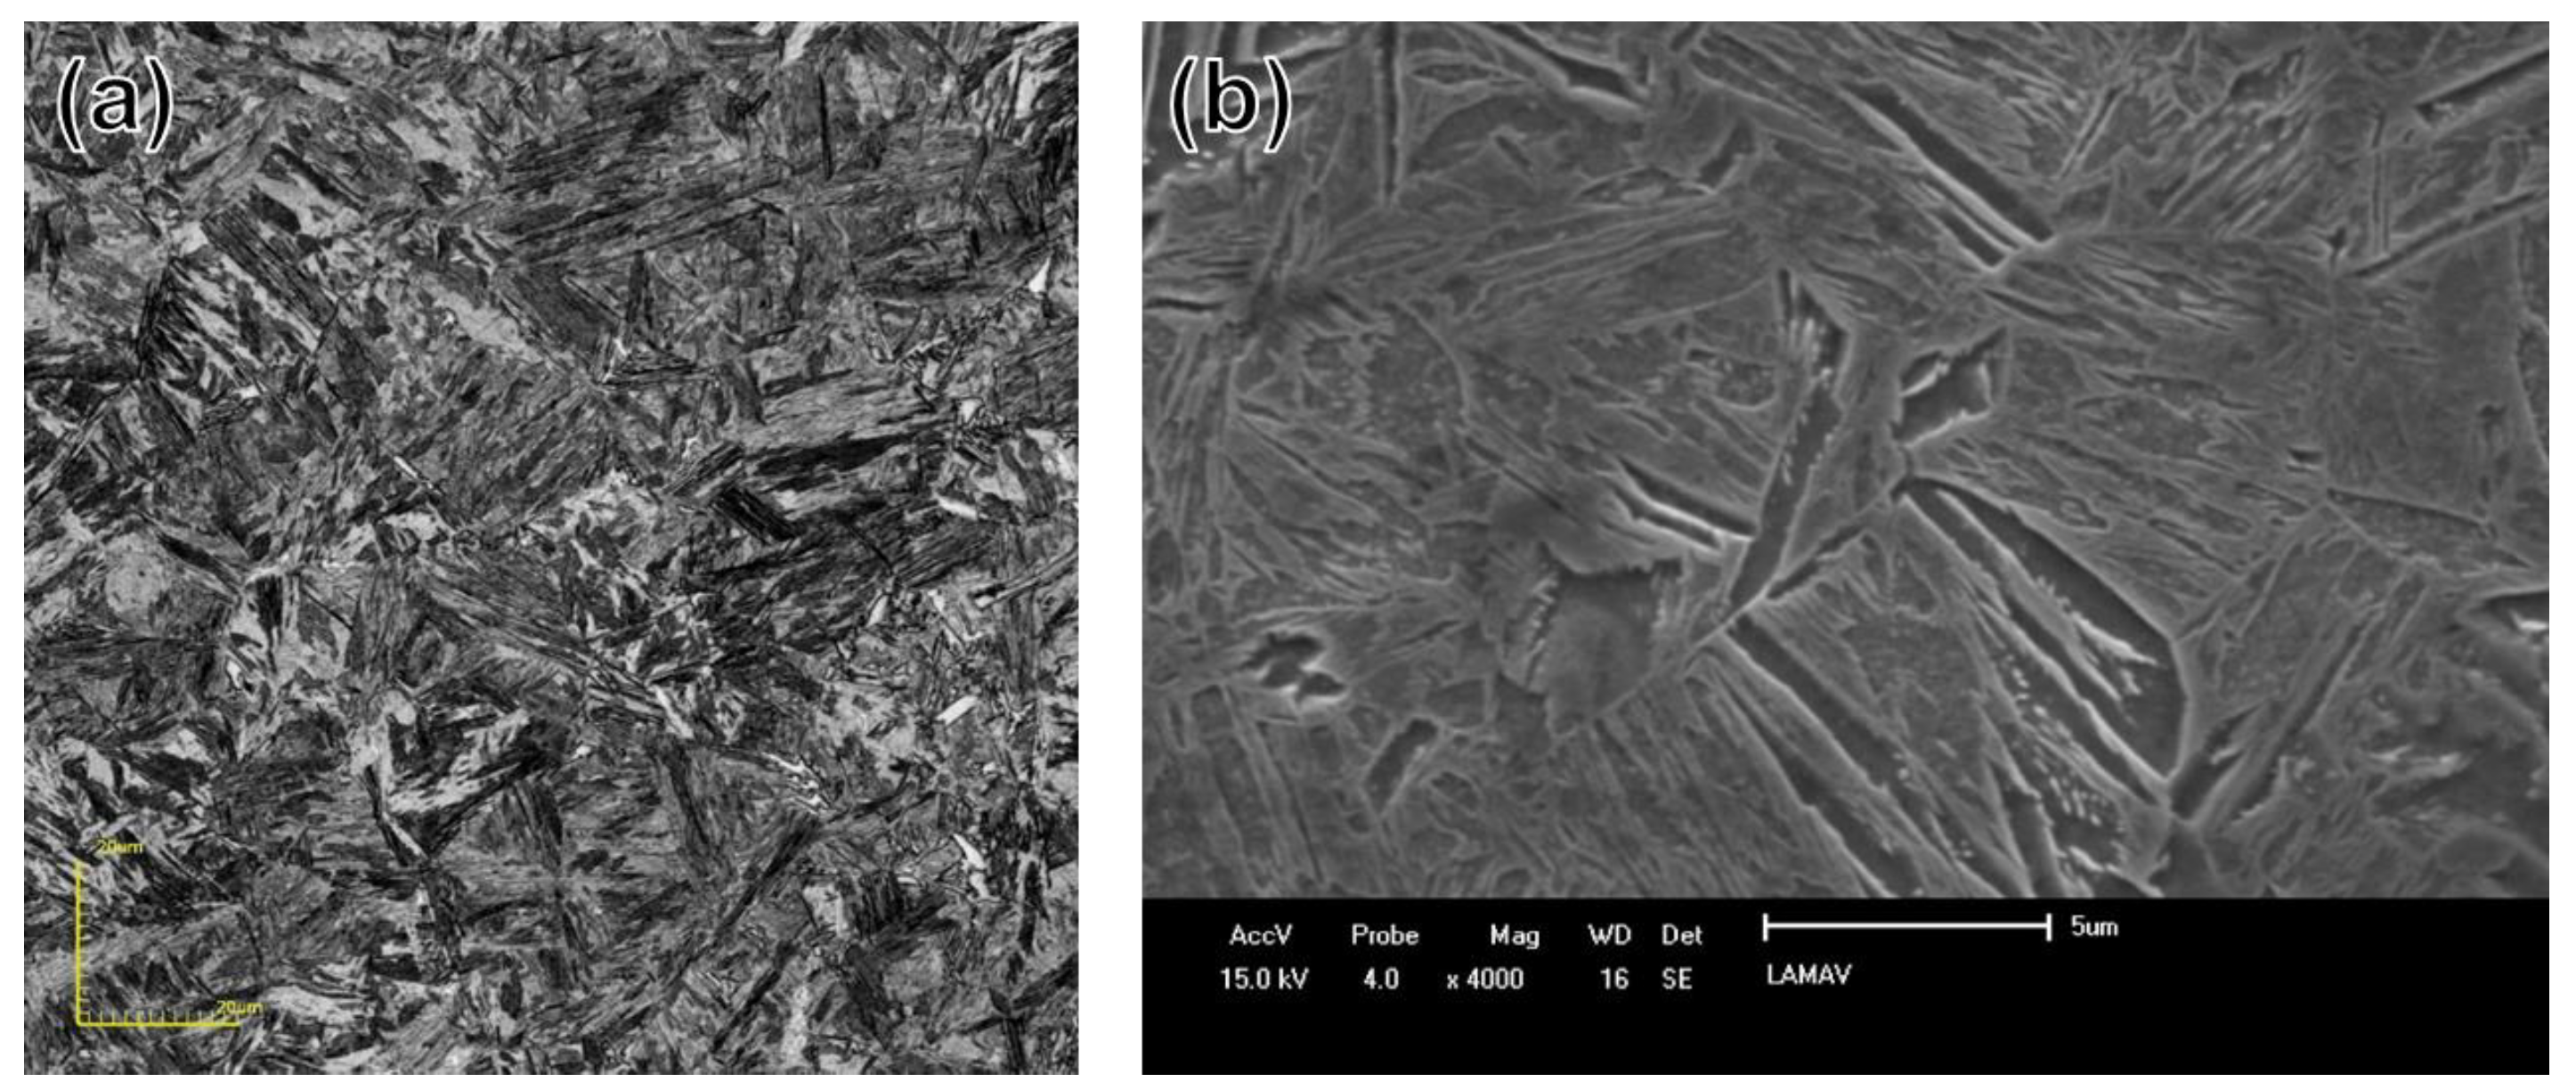
The results of microstructural analyses of AISI4130, by CM and SEM are shown in
Figure 1 and
Figure 2. The microstructure of annealed AISI 4130 (Fig.1) is composed of equiaxed grains of primary ferrite (α-Fe) and of the lamellae component pearlite (α-Fe+Fe
3C). The microstructure of the same quenched alloy is predominantly martensite with characteristic lamellar morphology, but some retained austenite can also be present (lighter areas in Fig.2.a). The microstructures observed are typical for annealed and quenched low-alloyed hypoeutectoid carbon steels [
32,
33,
34].
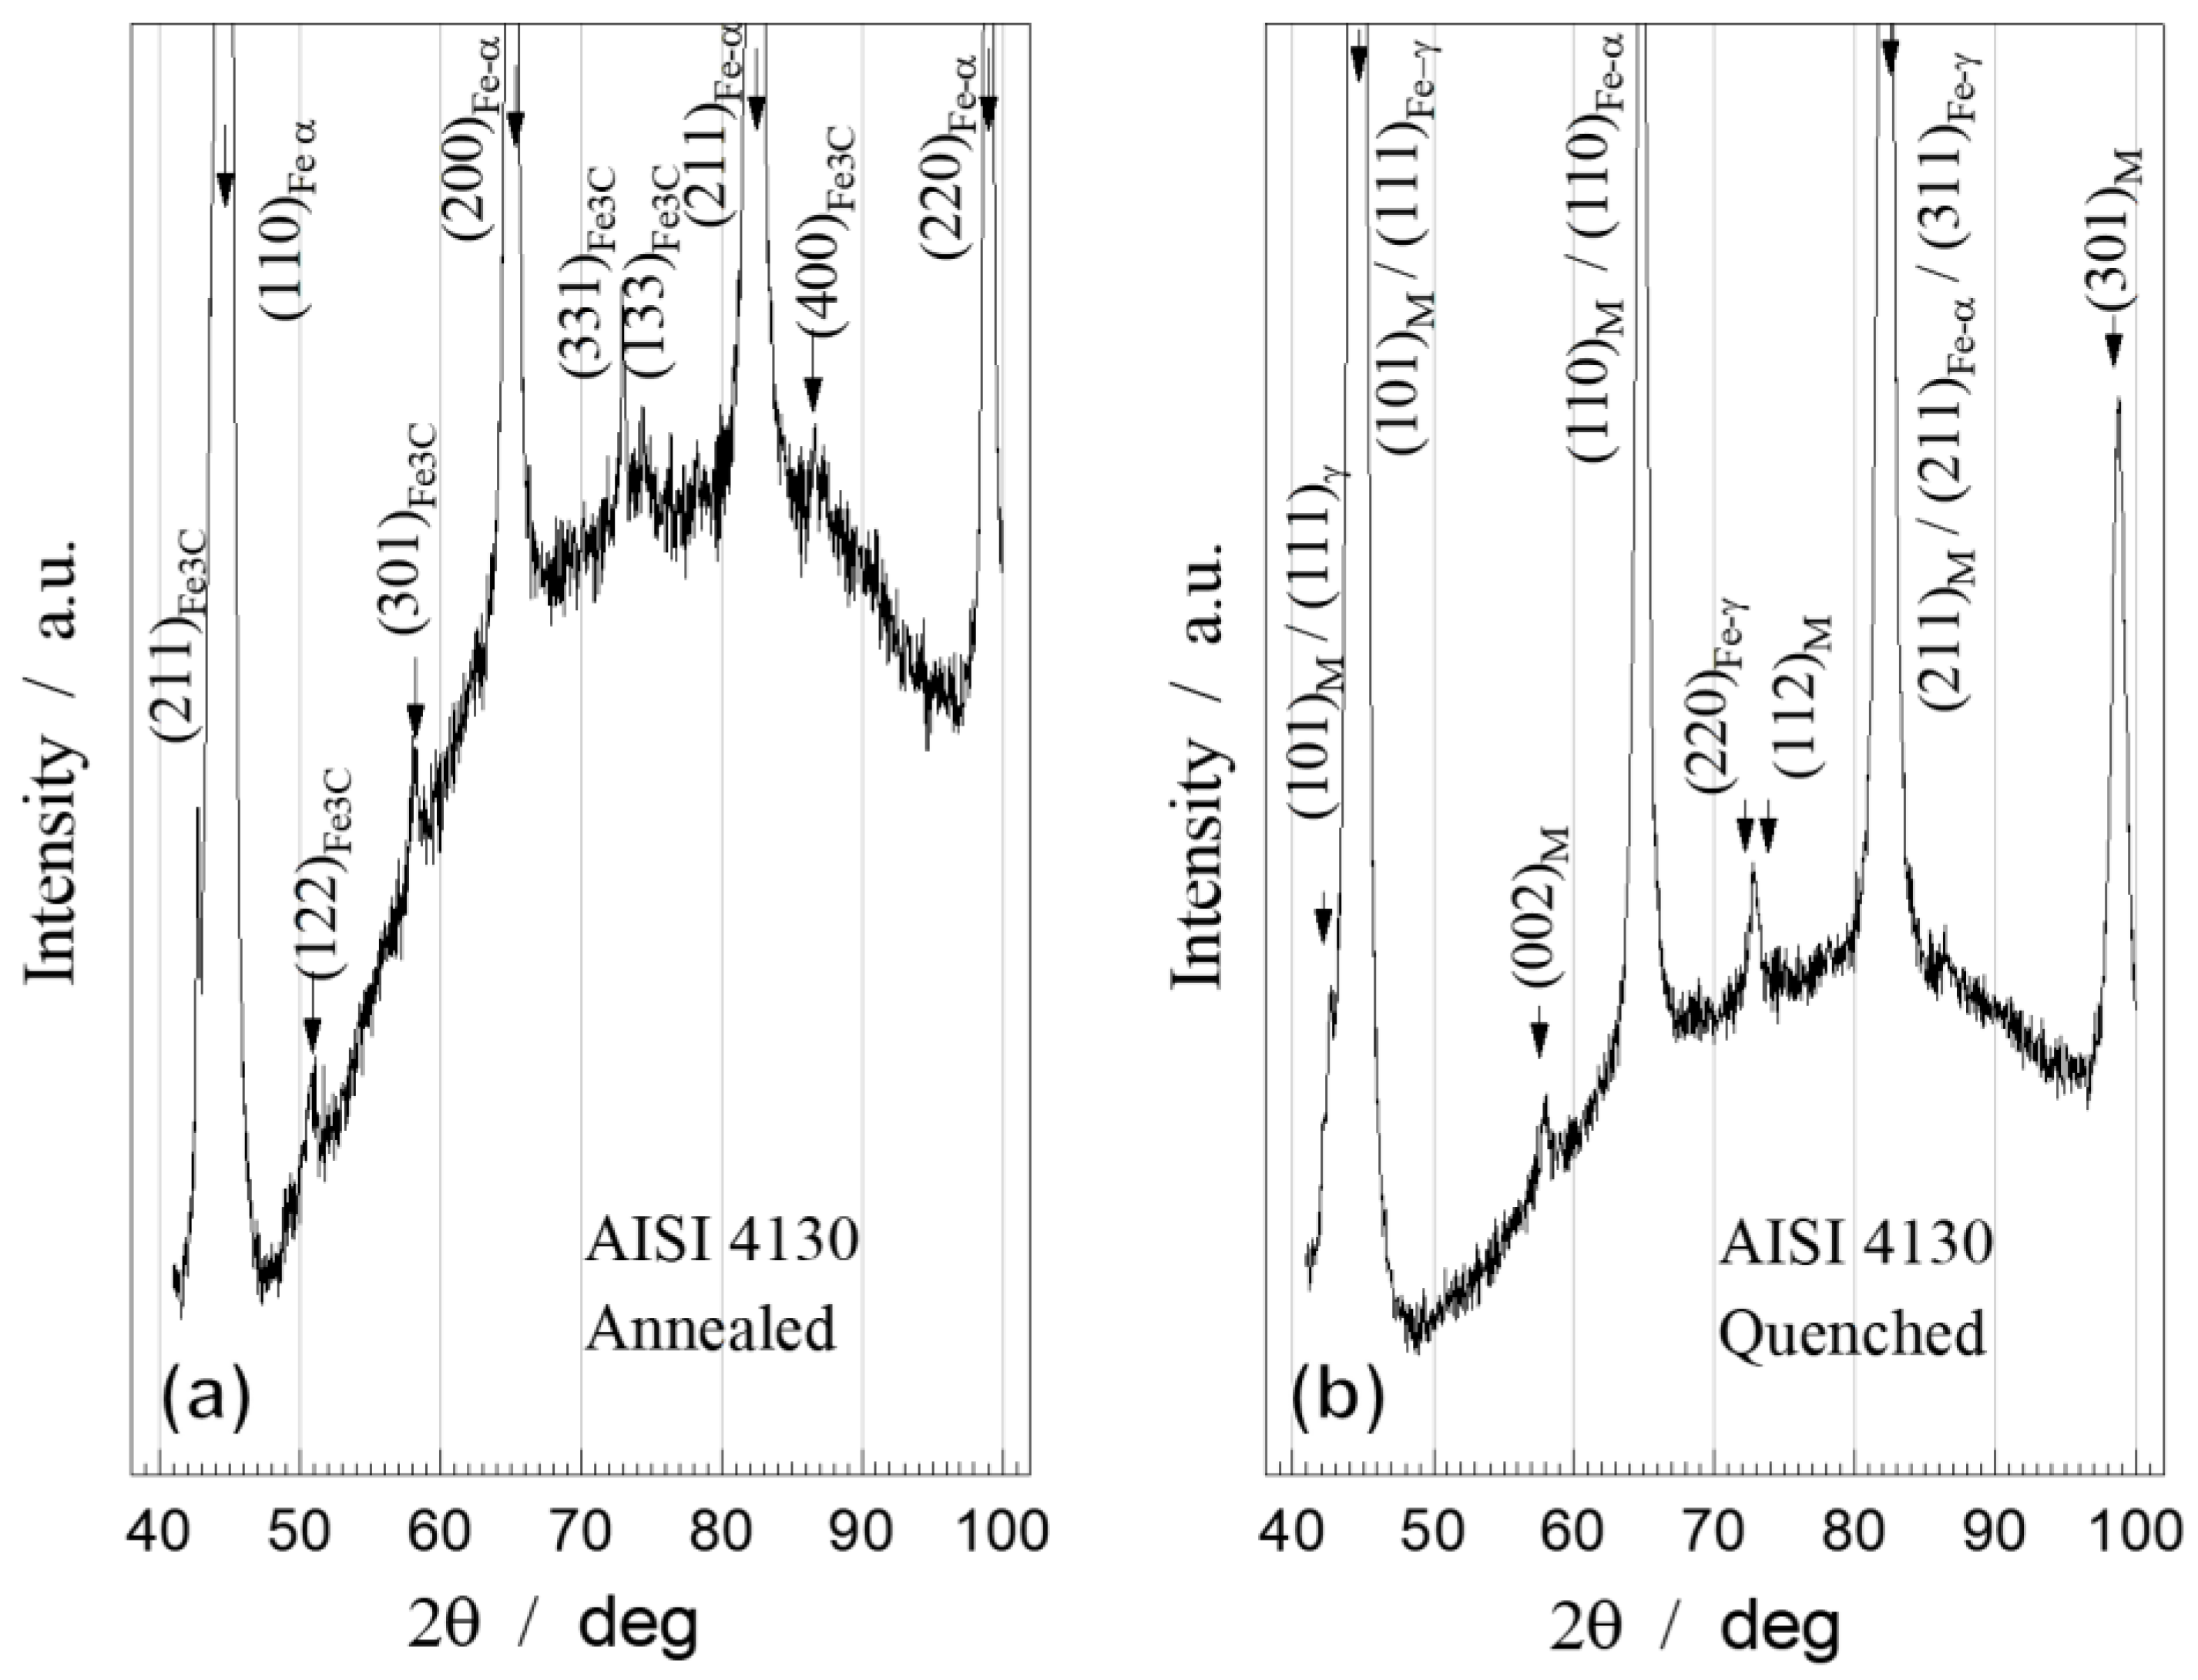
Figure 3 shows the experimental XRD patterns of annealed and quenched AISI 4130. In the annealed state (
Figure 3a) it was possible to determine the body-centered cubic (BCC) ferrite phase by strong diffraction peaks of its crystal planes: (110)
α, (200)
α, (211)
α, and (220)
α, compared with [
35,
36]. The presence of cementite Fe
3C (Rhombohedral, oP16), was detected by diffraction peaks of its crystal planes: (211)
Fe3C, (122)
Fe3C, (301)
Fe3C, (331)
Fe3C, (133)
Fe3C, (400)
Fe3C, compared with the date of [
37].
The XRD pattern of the quenched sample (
Figure 3b) reveals the majority presence of the martensite, with the body-centered tetragonal (BCT) structure, determined by very weak diffraction peaks of its crystal planes: (101)
M, (110)
M, (002)
M, (200)
M, (112)
M, (211)
M, (103)
M, (301)
M, compared with the date of [
38].
A certain shift of the martensite peaks towards lower 2θ angles and larger lattice parameters, as compared to the corresponding peaks of the ferrite structure, indicates a distortion of the cubic lattice towards a tetragonal one. However, this distortion is not very pronounced due to the low carbon content (0.3 wt.%) in the steel. In addition to martensite, the small amount of face-centered cubic (FCC) retained austenite in the quenched steel was identified by very weak peaks of the planes: (111)
γ, (200)
γ, (220)
γ, (311)
γ, (222)
γ [
39]. It is possible to observe that a large part of the austenite has undergone a transformation during the quenching process. The XRD results, for both annealed and quenched samples, are in agreement with the observed microstructures (
Figure 1 and
Figure 2).
The chemical composition and structure are correlated with the hardness of the alloys. The Vickers hardness for AISI4130, after applying heat treatments, was determined to be 160 ±15 kgf/mm
2 for the annealed state and 541 ±46 kgf/mm
2 for the quenched state,
i.e., the hardness in the quenched sample increased more than three-folds comparing to the annealed one (
Table 3). It is important to emphasize that the crystal lattices of the austenite and martensite, which are simultaneously present in the steel microstructure, are interconnected by orientation relationships. Indeed, the lattice planes of austenite and martensite, which have certain crystallographic indices, are parallel to each other. In the transformation
FeFe, the (111)
Fe planes are parallel to the (110)
Fe, where the [110]
Fe directions are parallel to the [111]
Fe. In carbon steel, the habit planes for martensite are the {225}
γ and {259}
γ planes. In carbon steel, the austenite is a solid solution of carbon and alloying elements. During the quenching, the metastable FCC austenite is prone to reject the 0,8 wt% C held in solid solution because of the stable BCC α-Fe solubility limit (0.01 wt% C).
But on the quick cooling, the temperature drops so quickly that the carbon atoms do not have time to diffuse out of the austenite lattice. At a critical temperature interval, the diffuseness process results in a highly strained BCT martensite that is supersaturated with these elements. The presence of intrinsic atoms at levels above the solubility limit of the BCC ferrite determines its BCT distortion. Moreover, the shear deformations that arise produce a large number of dislocations, which is a primary strengthening mechanism of steels. [
40,
41,
42,
43].
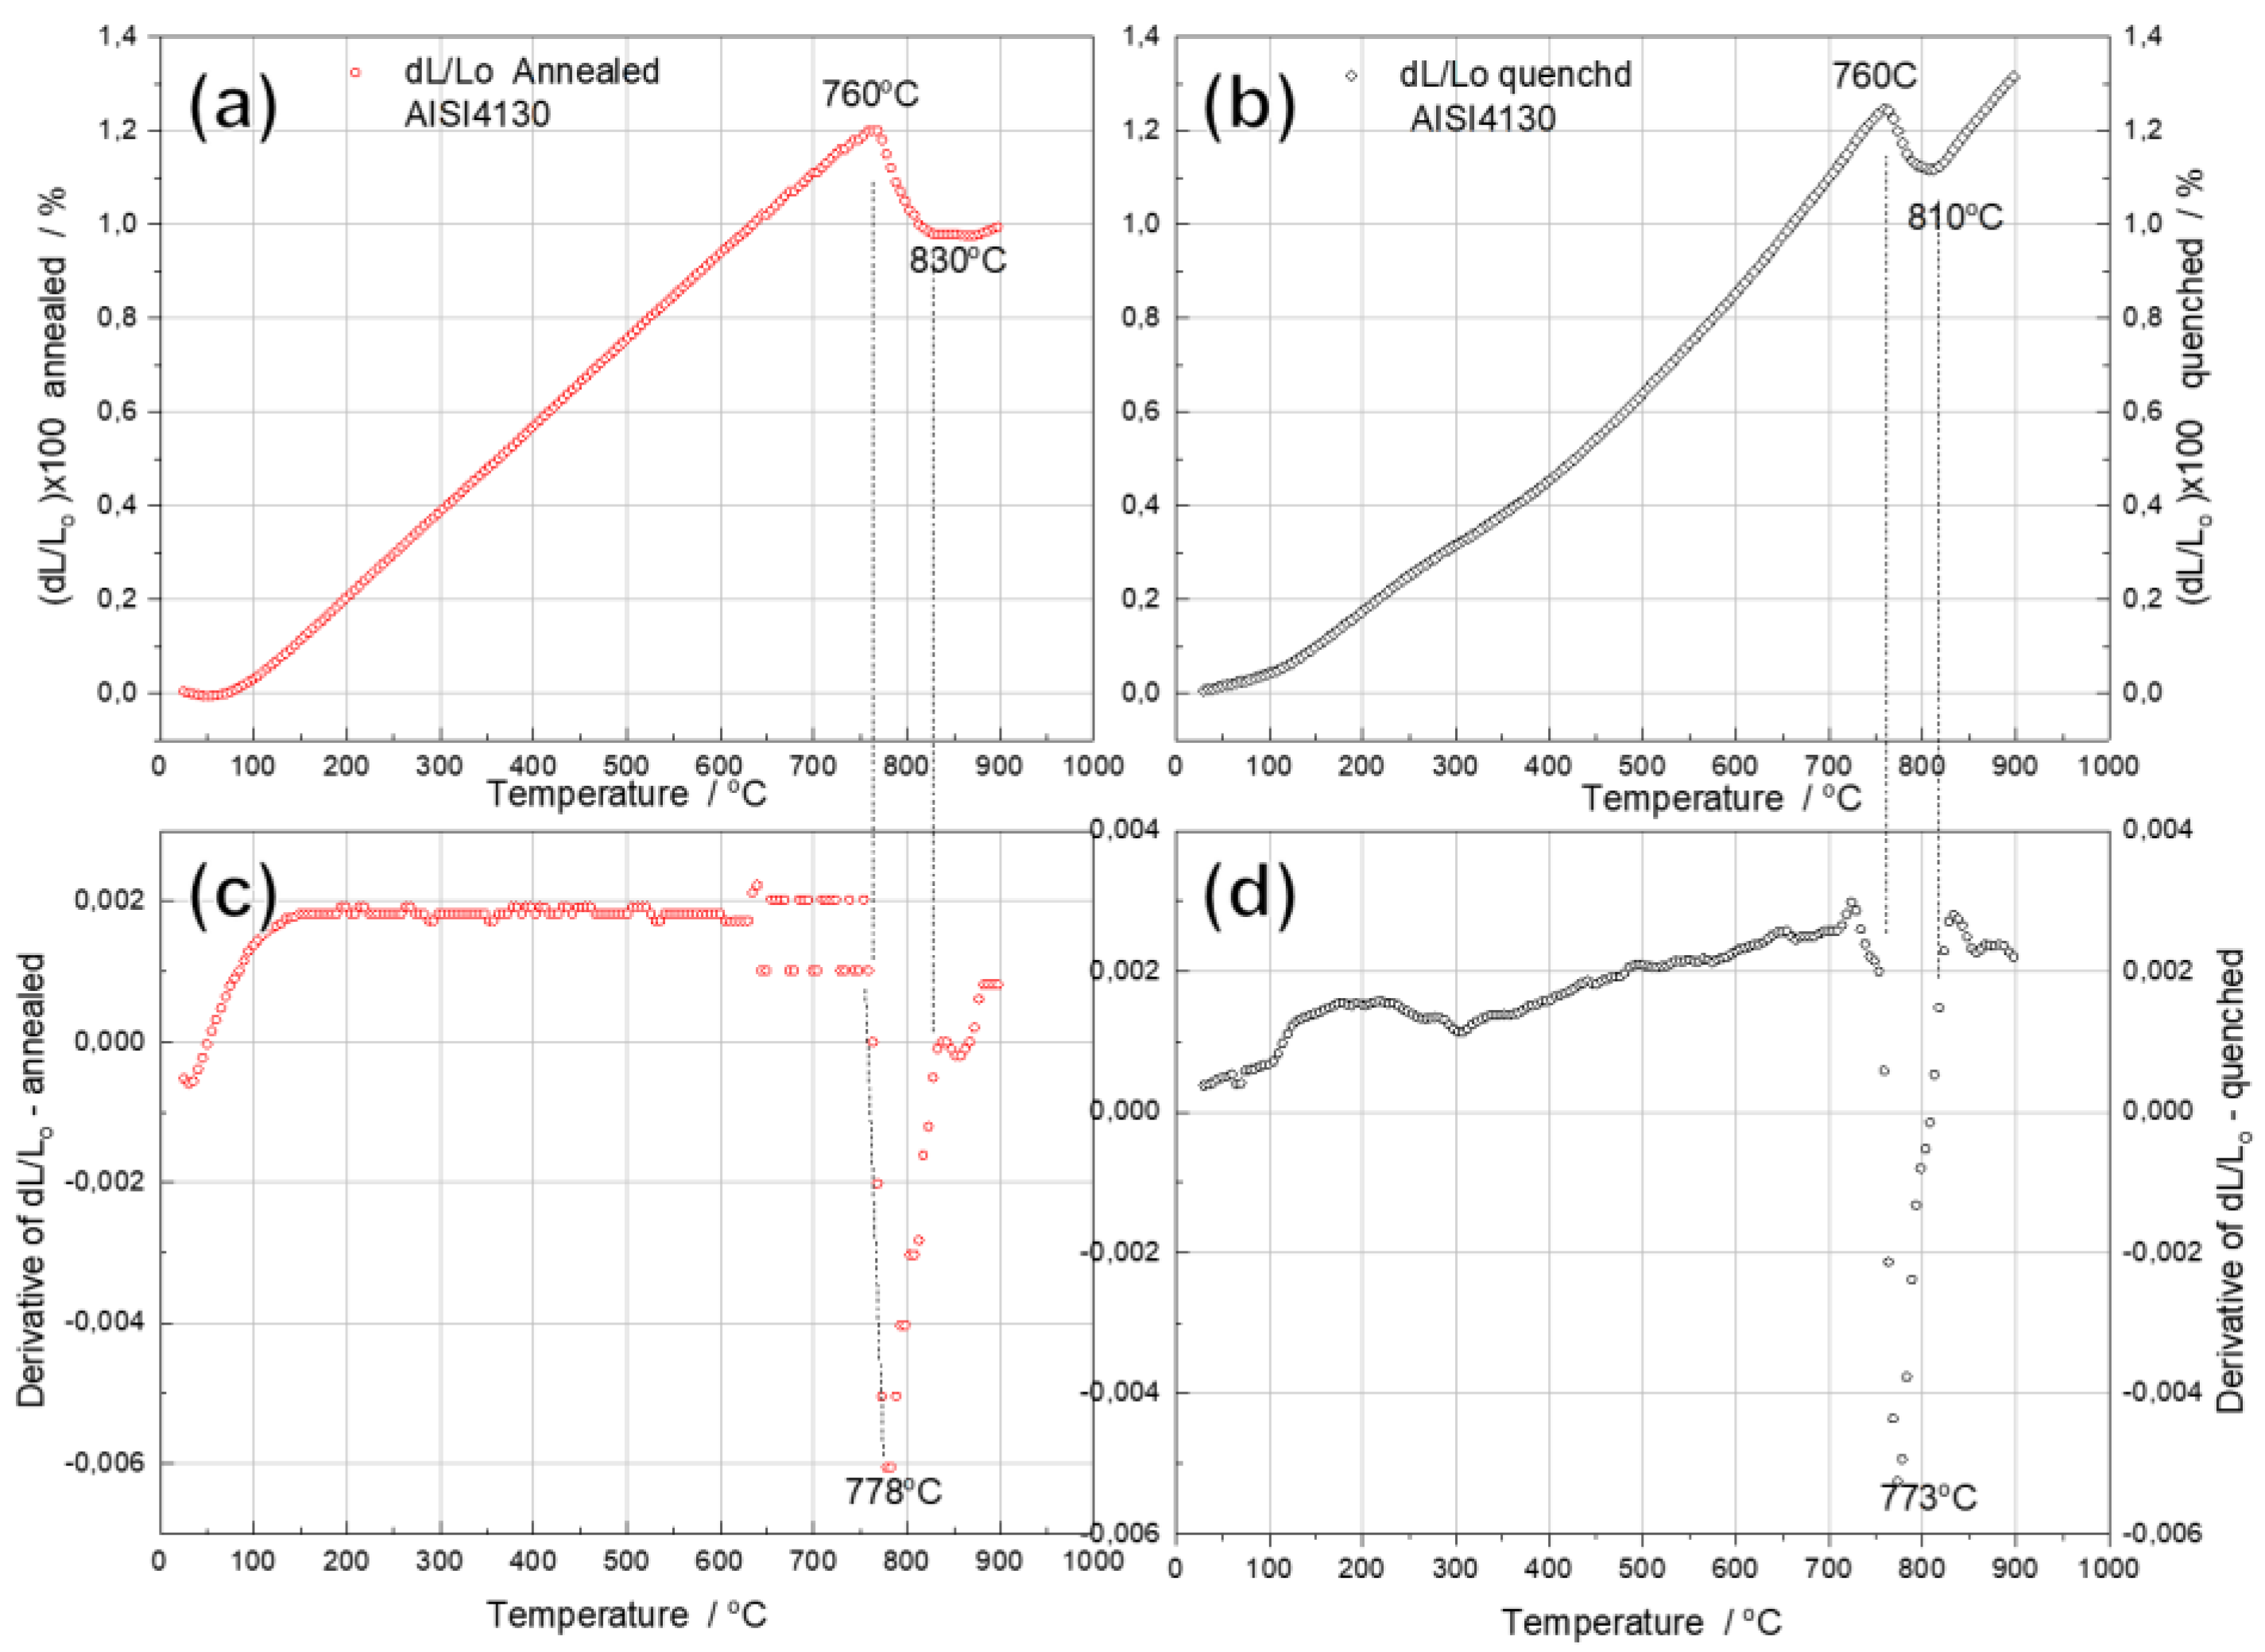
Dilatometric curves for the annealed (
Figure 4a) and quenched (
Figure 4b) samples showed positive extrinsic coefficient of thermal expansion (CTE) up to 760 °C.
However, different trends in the CTE with increasing temperature were observed for each sample. While the CTE for the annealed sample shows a linear behavior up to 760 °C (
Figure 4a,c), which is the expected temperature for the onset of austenite formation from ferrite and cementite [
40,
44,
45,
46,
47,
48,
49,
50], the CTE for quenched sample shows a non-linear behavior in the interval from 100 to 300 °C, where it can be expected the decomposition of martensite, as observed in similar systems [
45,
46], with the formation of ferrite and cementite, and the decomposition of retained austenite, at higher tempering temperatures, accompanied by slight expansion and compression of the sample, as shown in
Figure 4 b,d.
According to the dilatometric curves in
Figure 4, it would be expected that in the annealed sample the composition of the initial phase composition would be stable up to 750 °C. Otherwise, in the quenched sample, the structural stability would only be achieved above 600 °C, with the formation of stable ferritic and cementite phases within the refine sorbite. On further heating, these phases can undergo coalescence, grain growth, and transform into a spherite structure, which persists up to 750 °C.
With respect to temperatures above 760 °C, both samples exhibit a volume contraction, which would be caused by the formation of austenite from ferrite and cementite phases [
47]. Since austenite has a higher atomic packing factor than ferrite [
48], this macroscopic volume contraction is attributed to lattice shrinkage.
During austenitization, complex phase transformations occur in this temperature range, including the phase transformation from ferrite to austenite, the dissolution of cementite (carbide), the diffusion of carbon and alloying elements, and the saturation of the jointly formed austenite [
51,
52]. The diffusion process depends on the temperature, the chemical composition, the alloying elements, and in the same material, the size of the constituents involved.
The evolution of this process is different for the two studied materials. The annealed sample suffered compression from 760 °C up to 820 °C, then keeps roughly constant, and remained unchanged up to 900 °C, showing a plateau on the dilatometer curve. This plateau indicates that the diffusion processes of austenitization do not stop at 830 °C and continue at higher temperatures, compensating for the positive effect of lattice thermal expansion.
On the other hand, in the initially quenched sample, the compression temperature range is narrower. It quickly exhibits a positive and linear extrinsic thermal expansion of the newly formed austenite phase from 810 °C. It is expected that at 830 °C the structure of both alloys consists of an austenite phase. However, in the quenched alloy, the dissolution and homogenization processes seem to be more complete in this interval, due to the faster refined microstructure. Consequently, the austenite is more uniform and more stable. As a result, the austenite formed is more stable, more homogeneous, and exhibits normal thermal expansion on subsequent heating.
The values of Ed, Gd, μ and Q-1, derived from the torsional frequency of annealed and quenched AISI 4130 steels, were determined at RT and during heating and cooling cycles, as a function of temperature.
The results of the RT measurements are given in
Table 3. The values of the dynamic moduli for two alloys in different initial states are very close, but there is a tendency to lower the value for the dynamic elastic properties of the quenched alloy with metastable martensitic structure.
These dynamic moduli results are compatible with other frequency resonance data [
24] obtained on a normalized low carbon steel S10C with 0.12 wt.%C: 206.6 GPa (E
d), and 80.7 GPa (G
d), at RT.
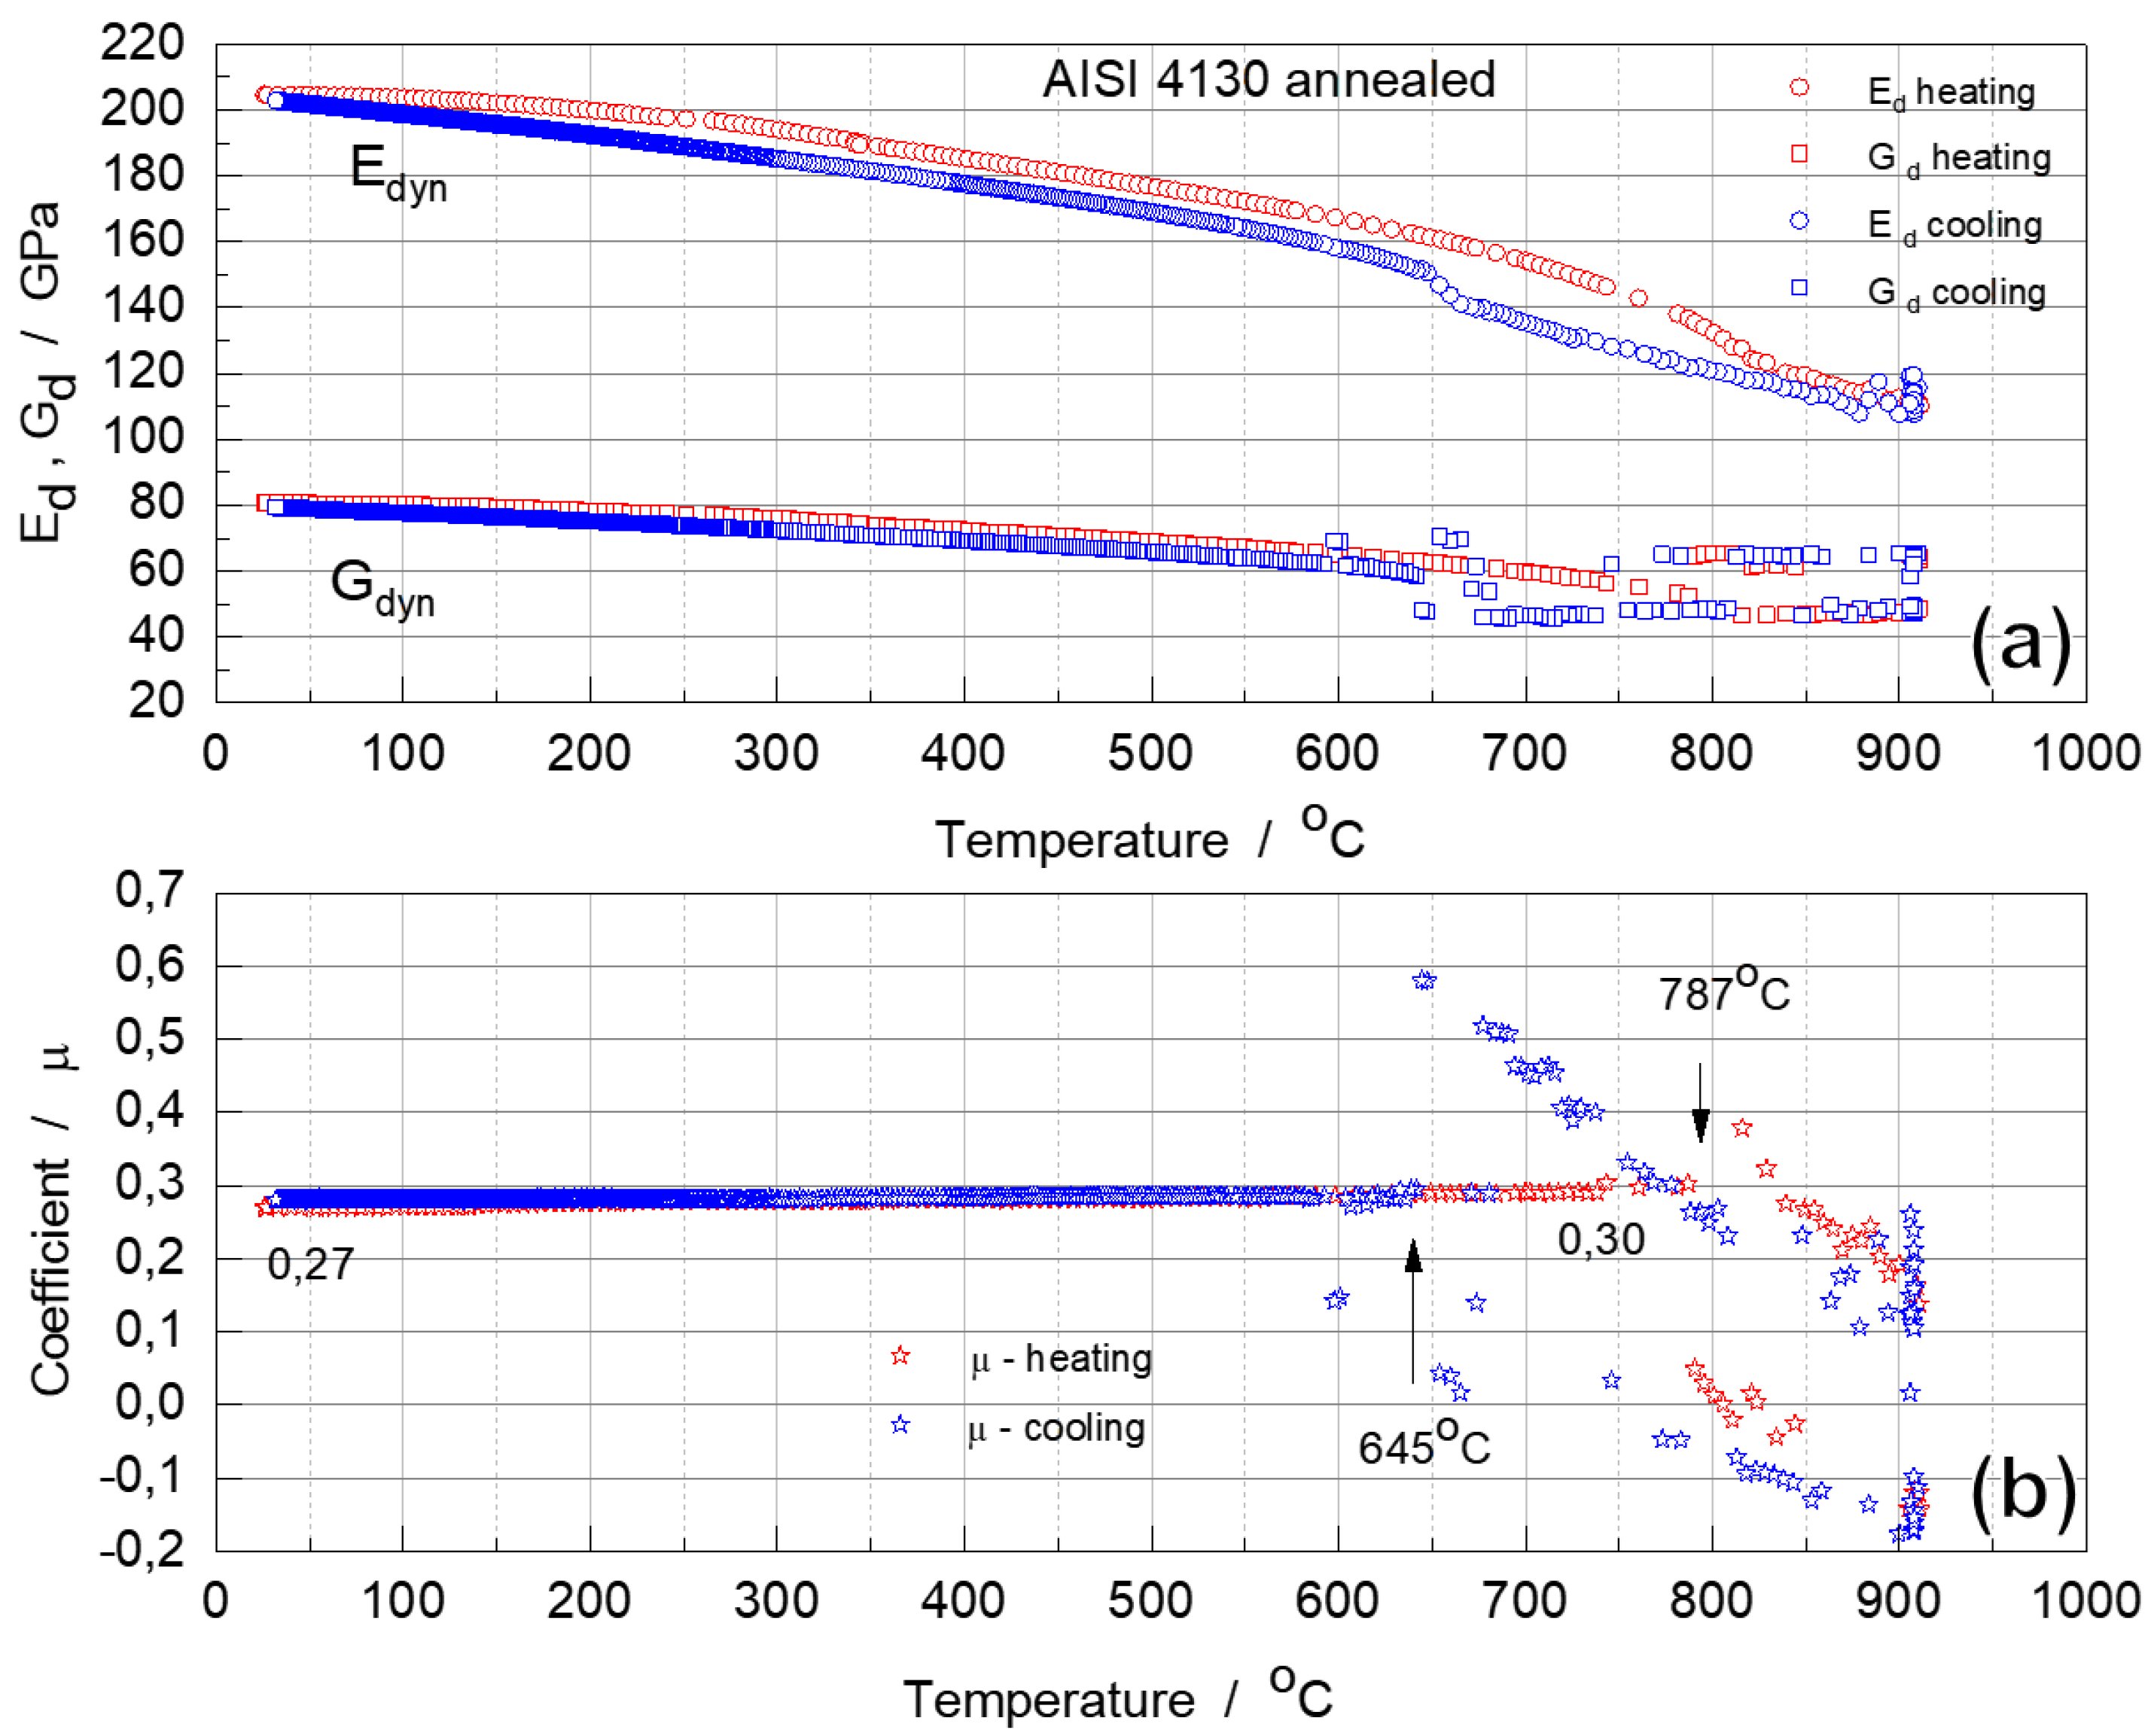
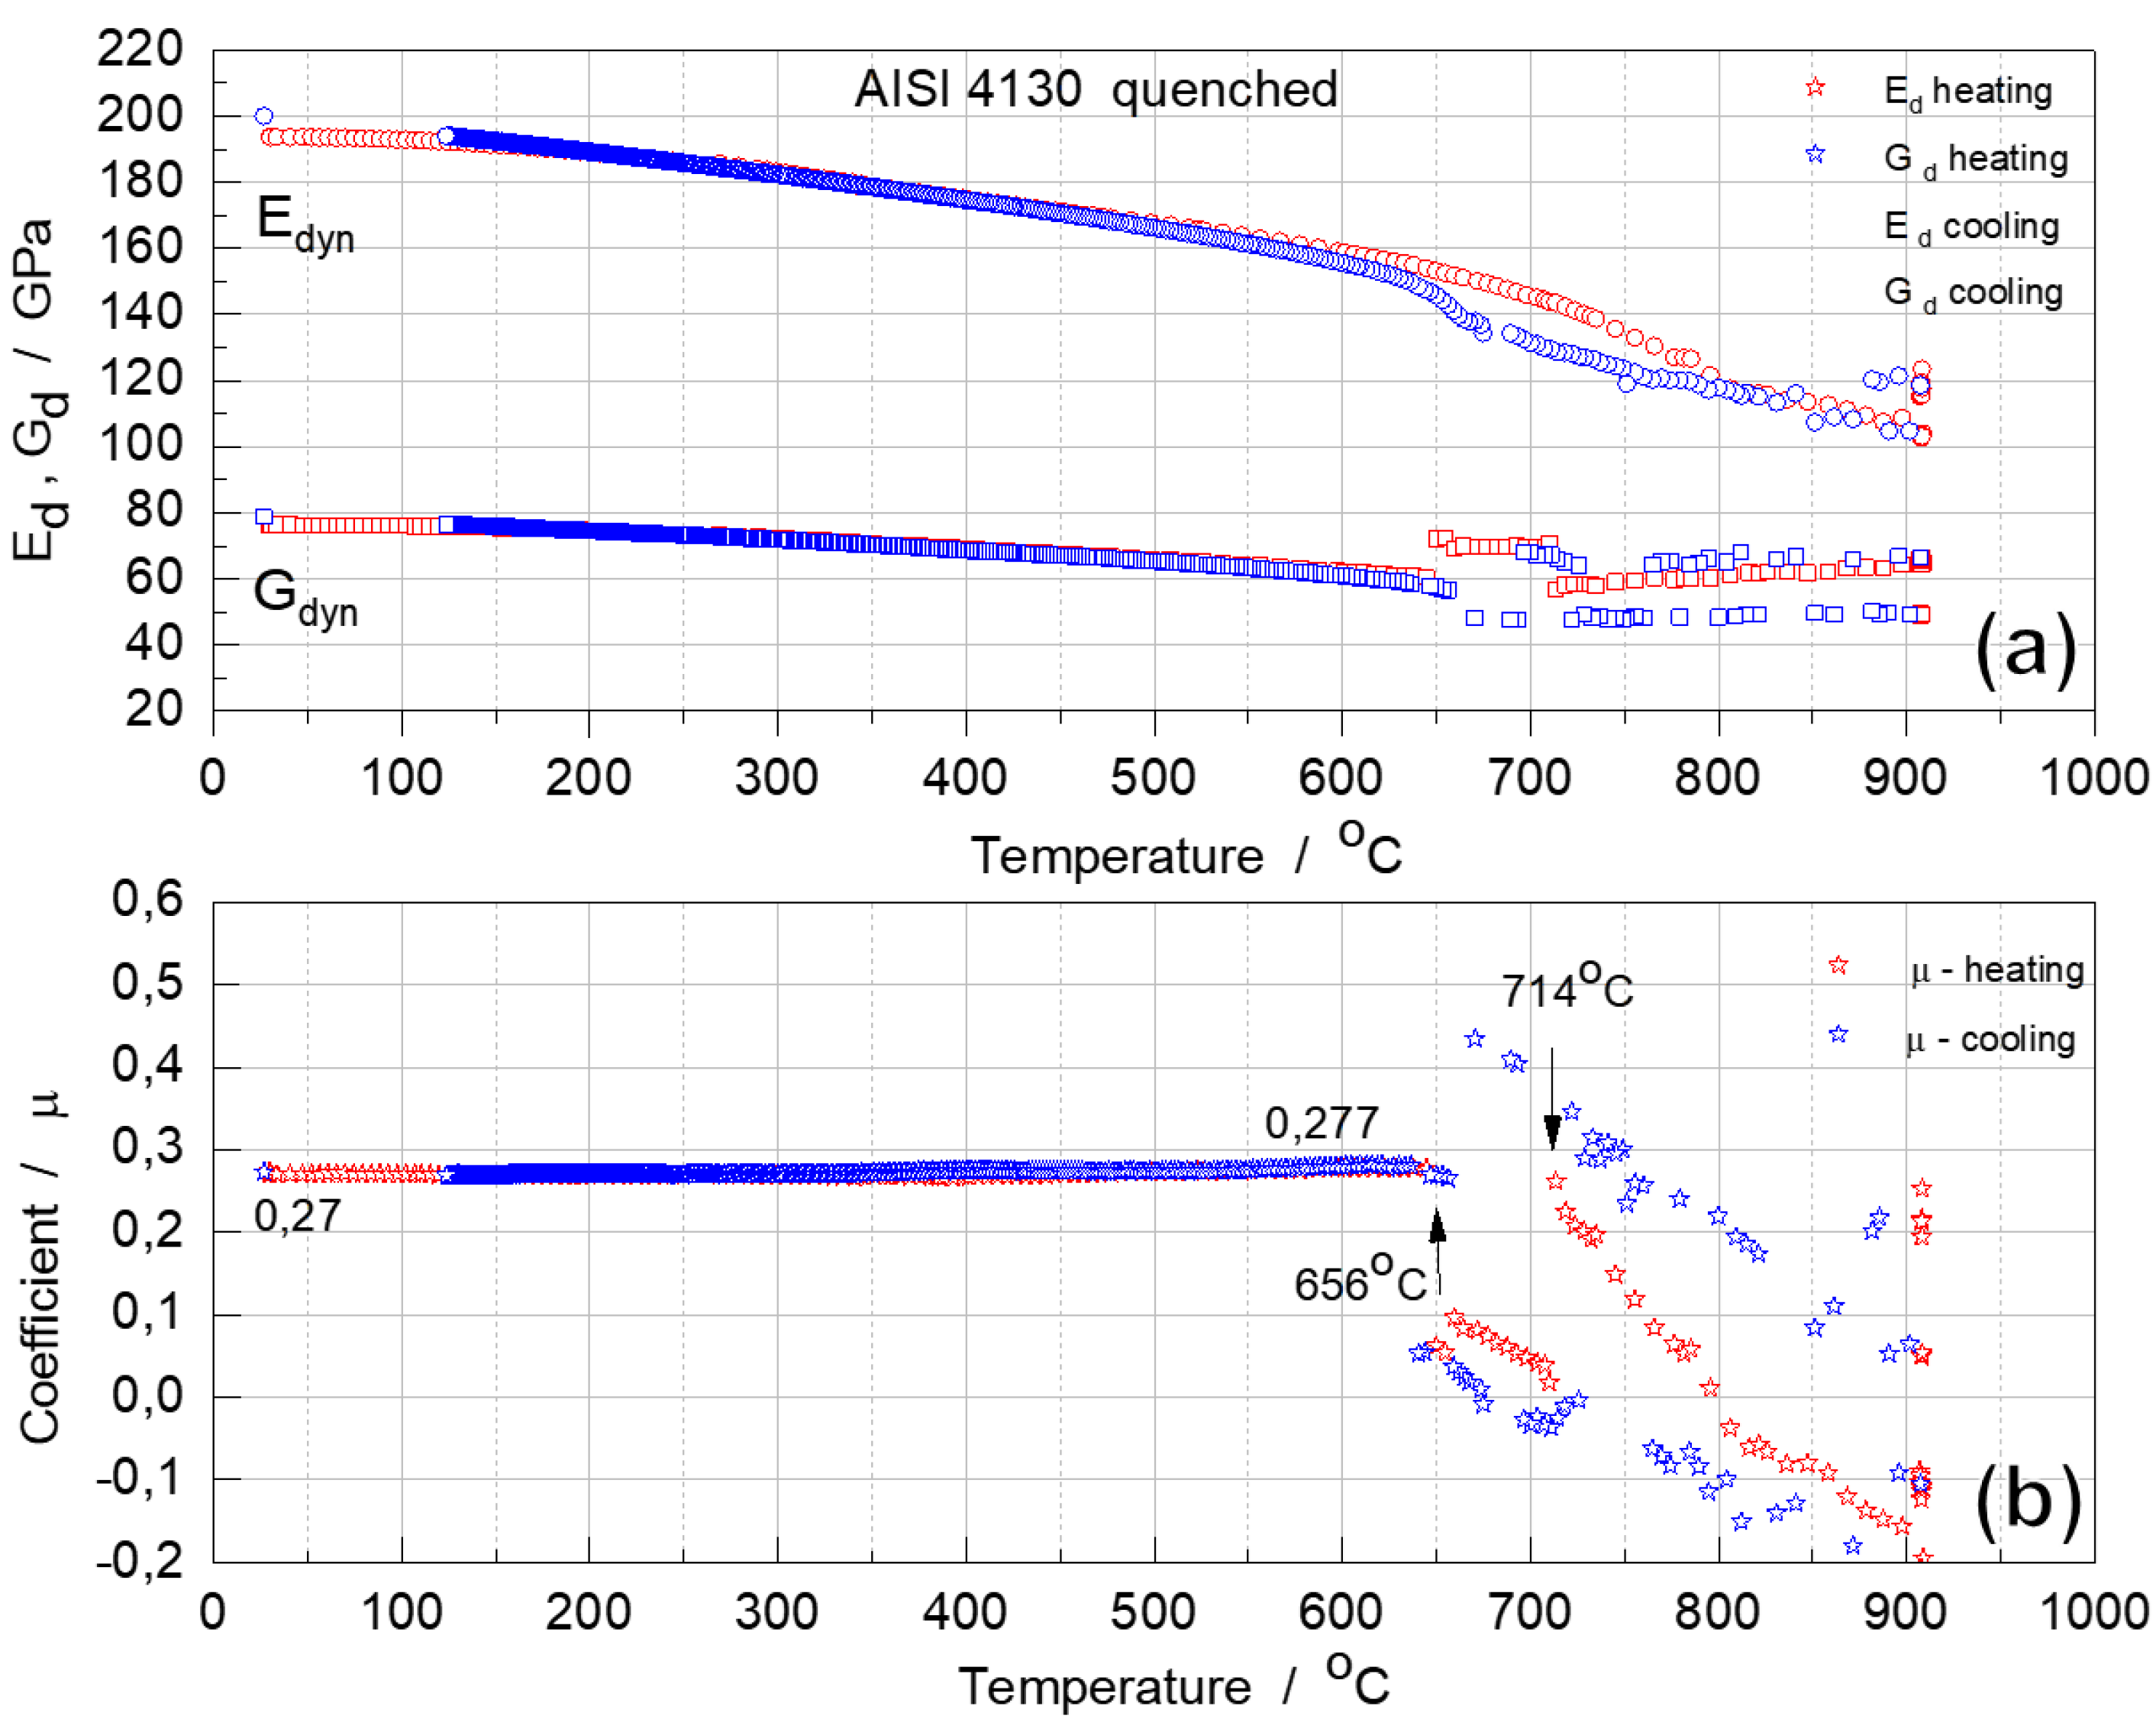
For both annealed and quenched samples, there is an approximately linear decrease from RT to
600 ºC for both E
d and G
d moduli. (
Figure 5 and
Figure 6). Due to the positive coefficient of thermal expansion in this temperature range, the higher the temperature, the higher the atomic bonding vibration amplitude, the greater the atomic distance, and the weaker the interatomic bonds [
53]. Therefore, the decrease in these dynamic moduli can be attributed to the softening of the bonds as a result of the increase in temperature.
In both cases, dynamic moduli E
d and G
d begin to decrease more sharply above 600 °C, dropping rapidly above 750 °C, indicating loss of elastic stability of ferrite and austenite lattices in the transformation interval [
20,
21,
22]. These dynamic moduli changes agree well with dilatometric analysis results (
Figure 4).
It should be noted that in the critical temperature range, when the sample becomes heterogeneous in structure,
i.e., with different parts, the heated part, transforms more rapidly and has a different phase composition than the less heated part. It could explain the reason why the value of G
d begin to overlap. In this case, the impact produces a characteristic heterogeneous structure vibration. This effect, when using the IET technique, has been described in detail in the [
54]. However, the natural vibrations that characterize modulus E
d are less susceptible to this phenomenon.
On cooling, the anomalous change in the dynamic moduli shows an interval of phase transformation from austenite to primary ferrite and eutectoid ferrite+cementite mixture (pearlite). Below 600 °C the modulus changes almost linearly due to the temperature effect of reduction of bond’s vibration amplitude when cooling down.
It can be noted that a hysteresis was observed in both samples,
i.e., the sharp change in E
d was observed around 750 °C during heating and around 650 °C during cooling. This hysteresis would be related to the supercooling required for the phase transformation, which would occur in a time-dependent phase transformation [
55].
The µ of annealed and quenched alloys, 0.27 at RT increased slightly on heating to 750 °C to 0.28 (hardened alloy) and 0.30 (annealed alloy) (
Figure 5 and
Figure 6). This is typical of most steels [
56,
57]. However, when complex phase transformation processes between thermodynamically stable phases start in an alloy, this coefficient changes drastically and becomes negative, which is characteristic of many anisotropic crystals [
31,
58].
In the cooling cycle, starting at 900 °C, coefficient μ increases, reaching critically high values (0.5) at 645 °C, and then drops sharply to 0.29, at the end of the phase transformation. These anomalous changes have been observed for alloys with two different initial states. However, it should be emphasized that the phase composition of these alloys is identical until phase transformation occurs during austenitization.
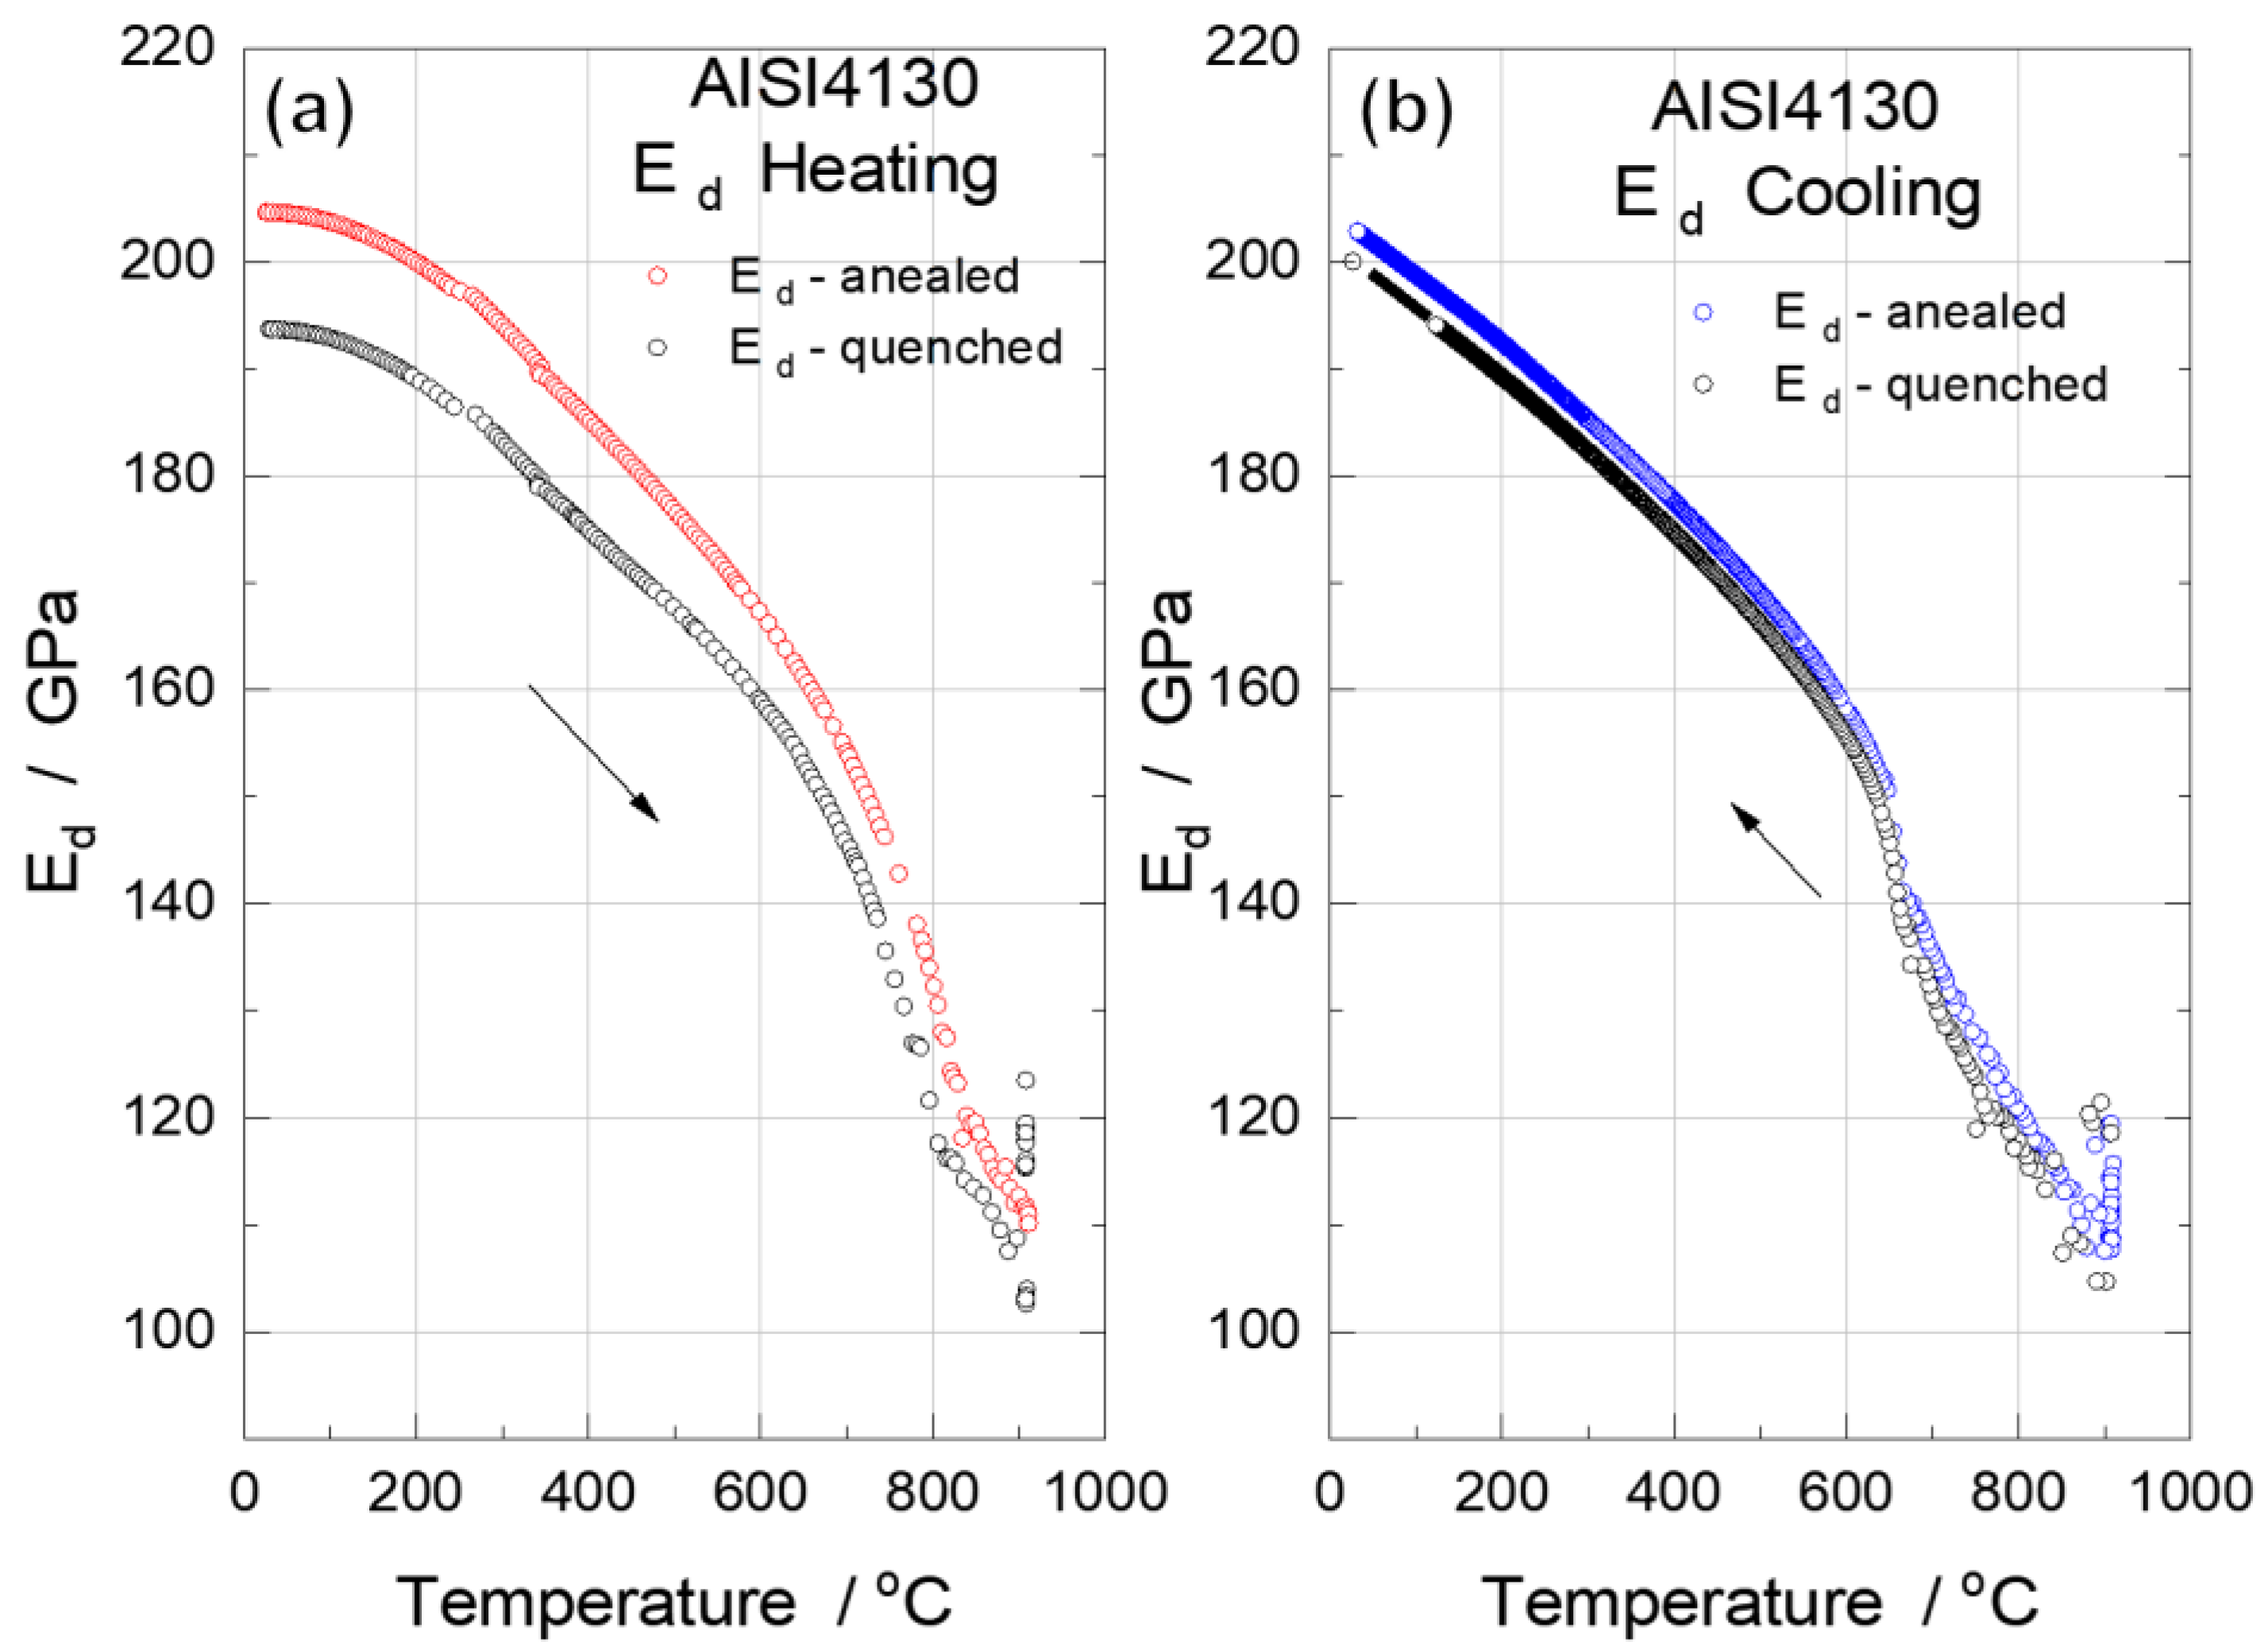
Particular attention has been paid to the temperature variation of E
d of the alloys.
Figure 7 compares the behavior of E
d, of annealed (
Figure 7 a) and quenched (
Figure 7b) samples as a function of temperature, during heating and cooling cycles.
A comparative analysis demonstrates that the behavior of E
d is quite similar for annealed and quenched steels with different initial structures. In the quenched alloy, the process of martensite decomposition and transformation of the residual austenite phase into supersaturated ferrite takes place in the range 200 - 350 °C and is characterized by a slight change in the slope of the monotonic modulus decrease curve. The E
d values converge at higher temperatures, which is an indirect indication of the already identical phase composition of the two samples. Above 650 °C, the E
d of both samples changes the slope of its temperature dependence, dropping almost identically up to 850 °C, reaching 120-130 GPa. It is known that the value of E
d and G
d decreases at the threshold of phase transformation and especially at the time of transformation, indicating a loss of elastic stability of the initial alloyed structure [
20,
21,
22]. Interestingly, the phenomenon of softening and loss of elastic stability in this case occurs in a system where phase transformation between stable phases is expected. The material structure is represented by an austenitic phase above 850 °C. According to the dilatometry results, the change in the slope of E
d between 850 and 900 °C can be explained by the fact that austenite is formed directly from sorbite in the previously quenched alloy over a narrower temperature range. The quenched sample have shown greater homogeneity and greater lattice stability than the annealed sample, where the austenite has not yet reached chemical homogeneity and the stabilization process seems to be lazier. With stabilization, one would expect an increase in the value of E
d as a result of an increase in the elastic stability of the lattice, but the temperature factor is stronger and the process of decreasing the E
d continues, albeit with less intensity. A similar behavior of Ed was obtained by Fukuhara and Sanpei [
24] where 0.12 %C steel was heated between 23-1223 °C after normalization. The authors observed that: “
The moduli of the carbon steel decrease substantially as the temperature increase. The modulus-temperature slope of Young, shear moduli change to more sluggish one at around 725 °C”, and the changing of the slope of the E
d vs. temperature curve, was interpreted as follows “
a possibility that the change is due to α(ferritic)/ γ(austenitic) phase transformation“.
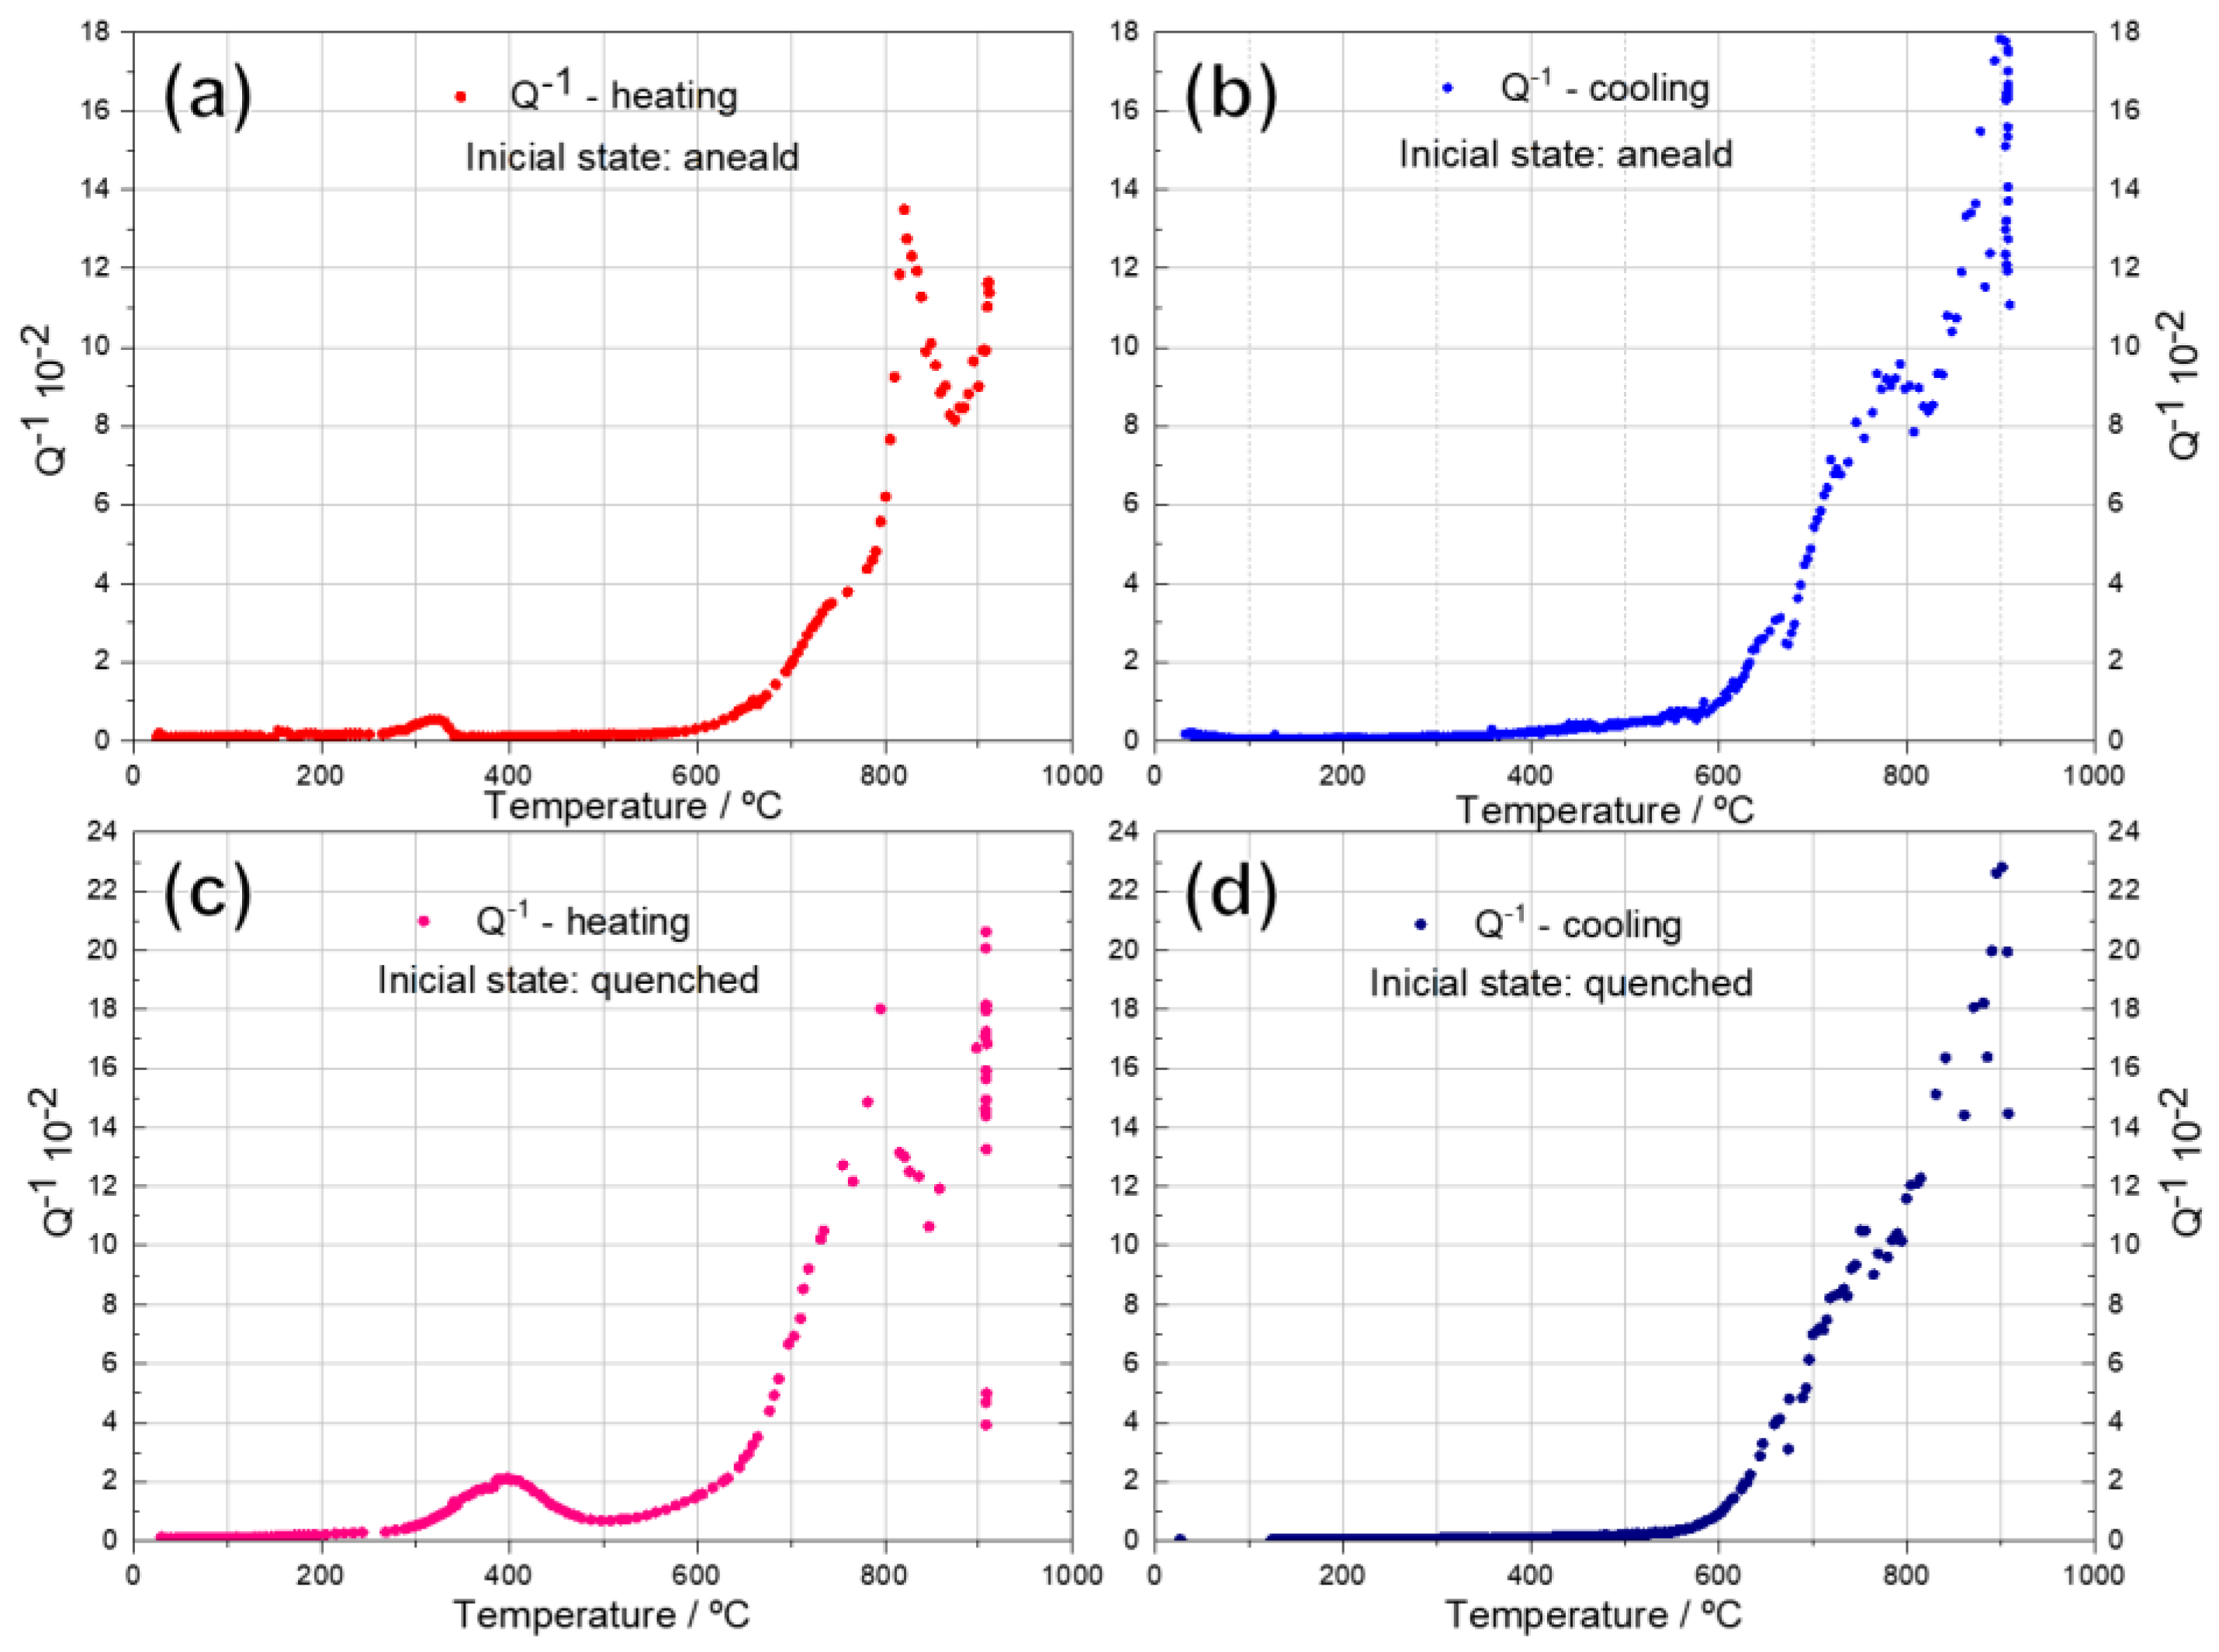
Figure 8 shows the values of internal friction (Q
-1) of initial annealed and quenched AISI 4130 steel as a function of temperature, during heating and cooling cycles. Comparing the behavior of Q
-1 with the elastic moduli of annealed and quenched steel samples, some similarities can be observed, but there are also differences.
The values of internal friction Q
-1 for both materials studied are relatively lower up to 250 °C with small changes in E
d and G
d. This may be due to the thermal stability of the stable and metastable structures in this interval. (
Figure 5,
Figure 6 and
Figure 7). During heating of the annealed steel, the first, very slow peak of Q
-1 appears in the 250-350 °C range, which can be ascribed to the release of internal stresses and appears due to displacements of dislocations, in relaxation processes. [
59]. Hereafter, heating up to 550 °C, Q
-1 retains minor values, as a result of dislocation annihilation. The relaxed structure, with no significant changes, suffers an expansion on heating, and in this interval, the moduli change in a practically linear manner up to 600 °C.
Unlike the annealed state, in the tempered alloy, the first peak of internal friction Q-1 is wider, more intense and appears in the 250-500 °C range, with its maximum at 450 °C.
In this temperature range, complex structural and phase transformation processes are expected to occur, which are characteristic of the tempering of carbon steel after quenching. It includes: (i) interaction of dislocations with atmospheres of interstitial impurities, including carbon atoms; (ii) movement of dislocations to relieve internal stresses, decomposition of martensite with precipitation of metastable carbides (200 °C), their growth and transformation to more stable phase, decomposition (200-300 °C) of residual austenite; and (iii) its transformation to saturated ferrite and cementite (bainite). Above 400 °C, the recovery and recrystallization of stable α ferrite (BBC) and formation of cementite in the form of sorbite and, then, spheroidite, a globular cenementite in ferrite matrix, are expected [
51,
60,
61].
The peak’s intensity is determined by the content of interstitial atoms in the solid solution and by the magnitude of the local internal microstrains in the initial martensite. In addition to the complex structural changes, the magnetoelastic component of the vibrations, which is characteristic of ferromagnetic materials, can be involved in the whole process of the internal friction [
59,62].
However, the higher the internal friction, the higher the absorption capacity was observed in alloys during their heating and cooling in the temperature range of phase transformations. Both, internal friction and the absorption capacity, are sensitive to heterogeneous structure state, when a new crystal lattice grains are forming inside the parent phase, accompanied by the interphase boundaries formation and movement, the atoms displacement, the emergence of elastic deformations due to grains misfit, the movement and generation of dislocations, in the condition of loss of elastic stiffness and rigidity of transformed material [
22,
59].
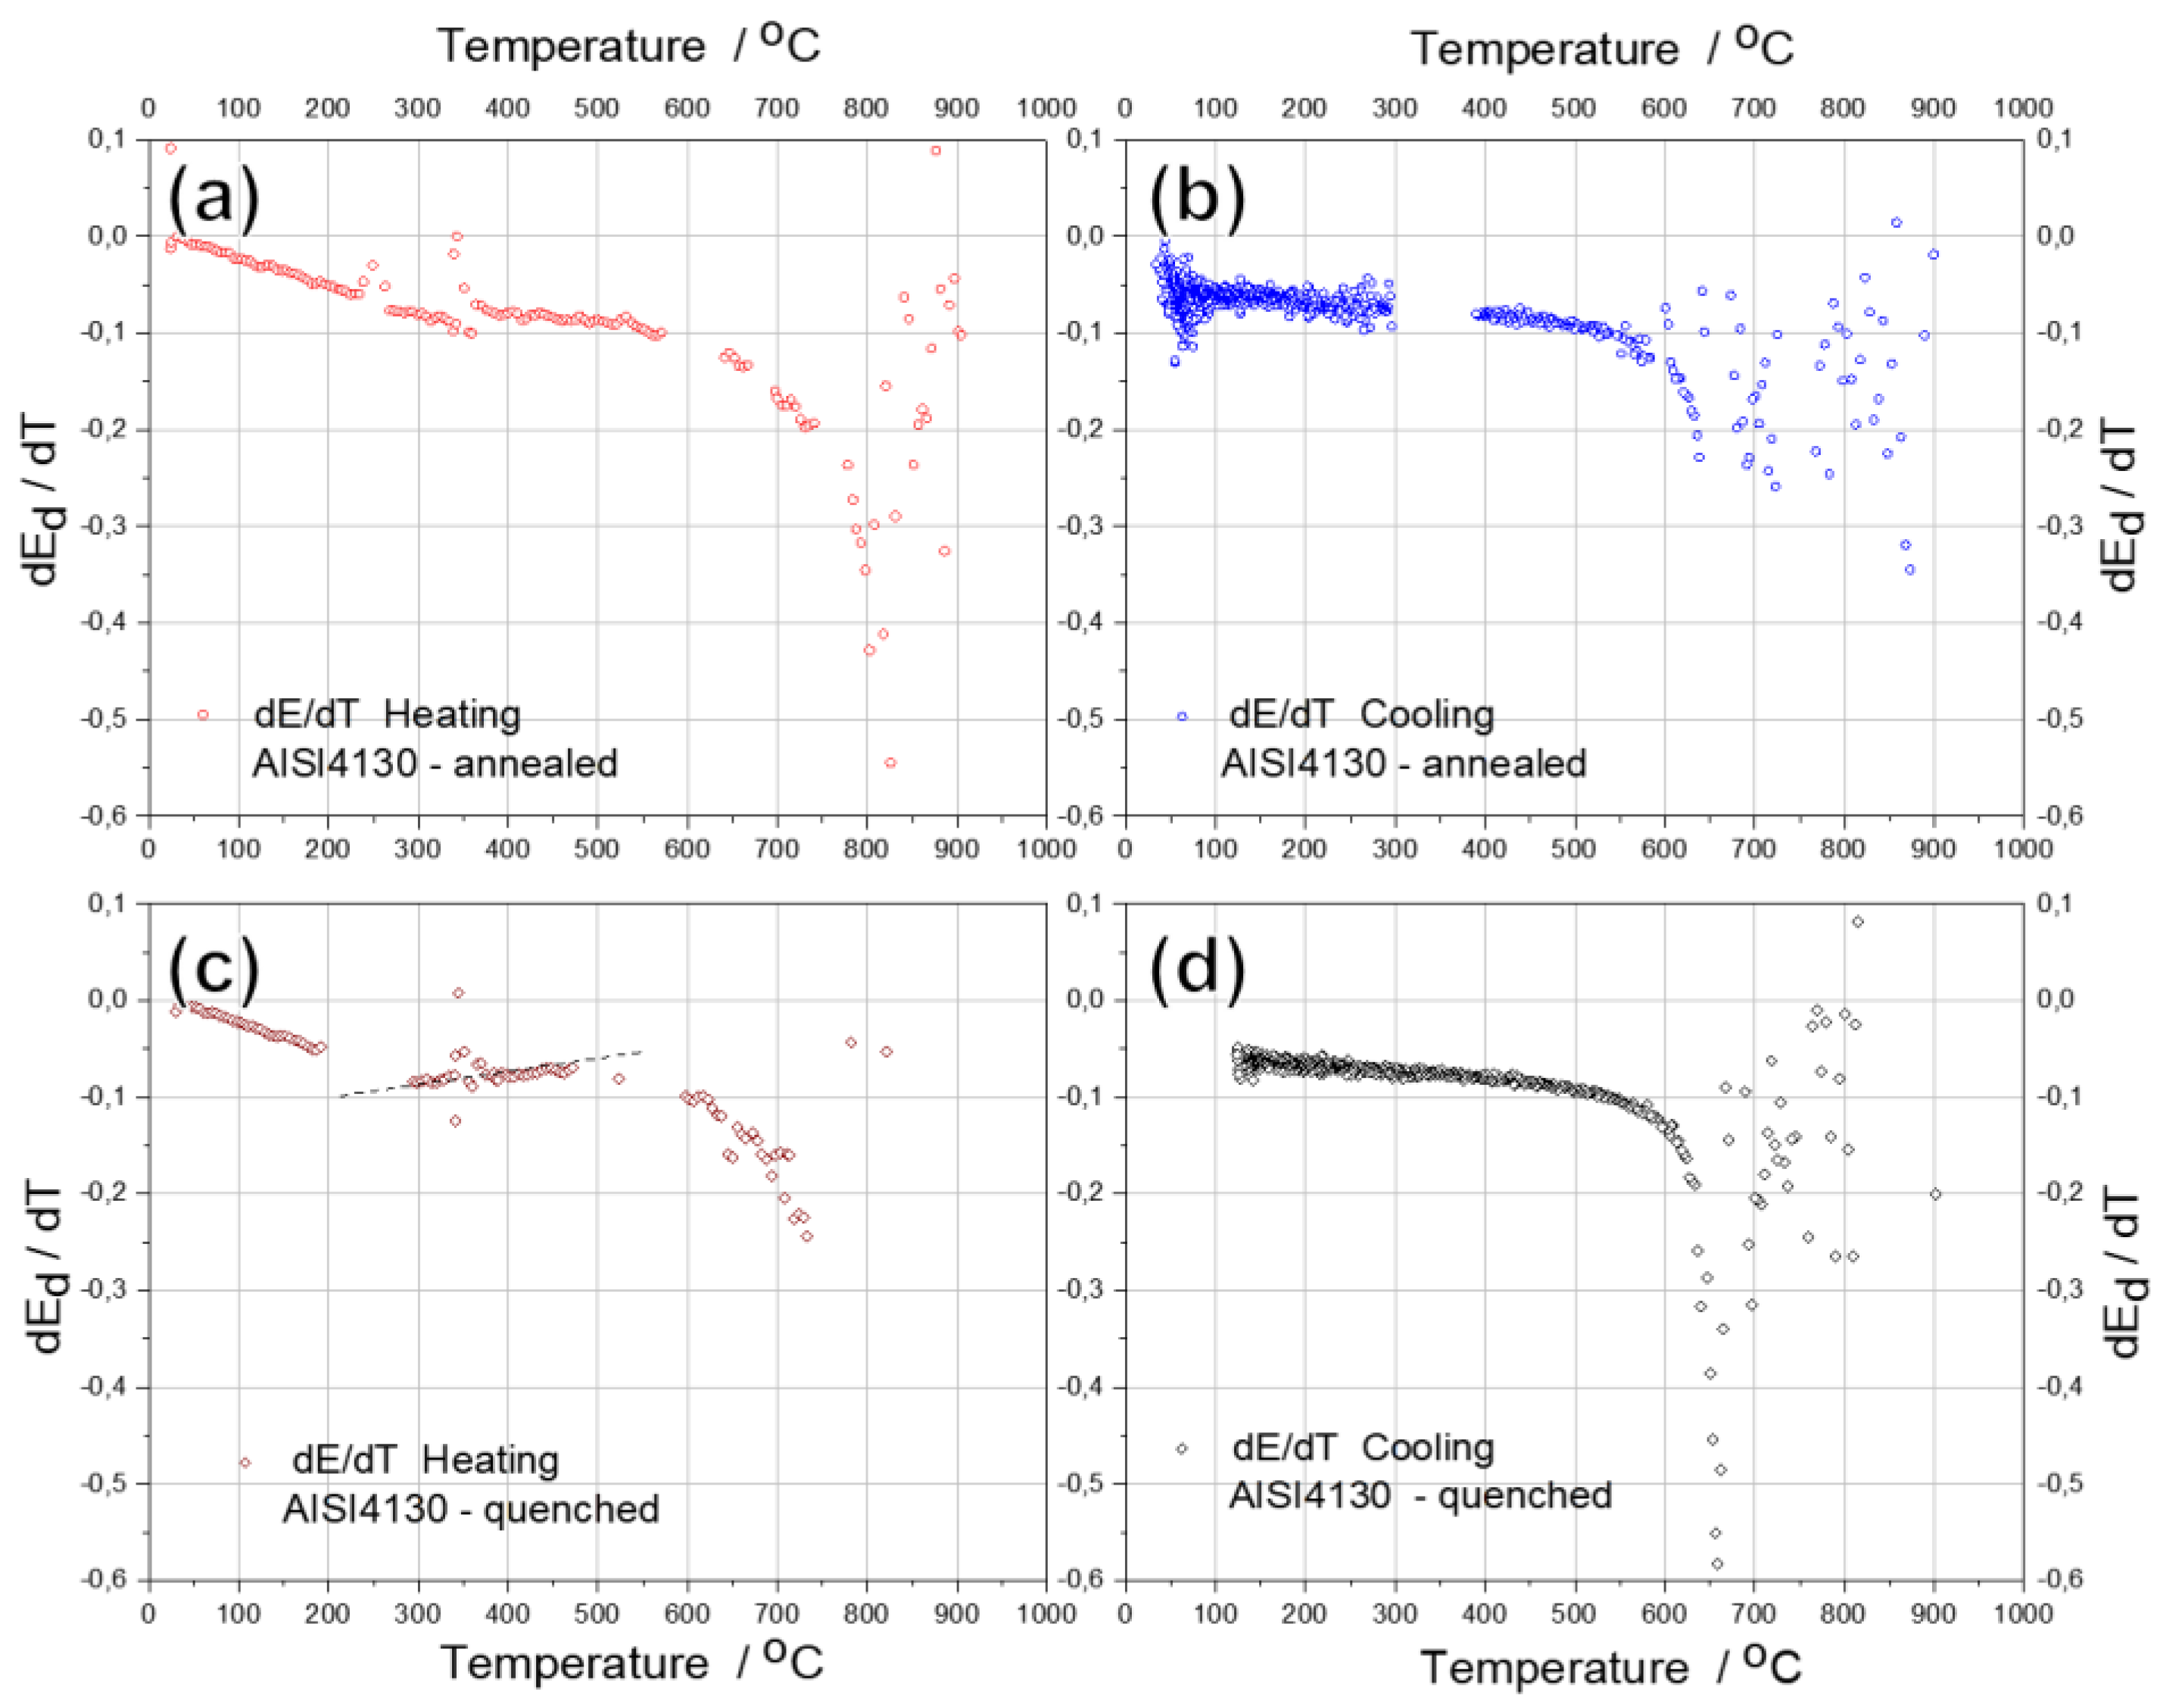
Figure 9 shows the first-order temperature derivative (
dEd/dT) curves of the studied steel in the initial annealed and quenched states during heating and cooling. This practically linear decrease in Ed of the annealed alloy on heating and its increase on cooling in the range from 20 to 600 °C, associated with thermal expansion and contraction of the lattice (
Figure 7), is confirmed by the practically linear course of its first derivatives, with a small deviation in the range from 200 to 300 °C (
Figure 9). The linear course of the derivative curve is abruptly interrupted above 600 °C, when the material softens as it approaches the critical temperature range. It drops sharply to a minimum when heated to
800 °C and then rises sharply.
In contrast to the annealed alloy, when the quenched alloy is heated, the first derivative of E
d in the range 200 – 500 °C (
Figure 9) shows a visible deviation from the linear relationship. Moreover, there is also an increase in the derivative,
i.e., a slight increase in E
d, between 300 and 500 °C, which is hardly noticeable in the temperature change of E
d (
Figure 7a). It should be noted that, in the temperature ranges in which the derivatives deviate from the linear relation E
d, the internal friction Q
-1 shows the first peaks (
Figure 8). The increase in modulus in the quenched alloy, in the range 300-500 °C, proves the phase transformation process, γ-α', when residual austenite reversibly converts to martensite, which itself decomposes by the known mechanisms to form refined sorbite that subsequently suffer spheroidization to form globular cementite distributed in ferrite matrix [
51,
61,62]
On further heating above 600 °C, as in the case of the annealed alloy, the derivative of Ed decreases sharply. As the previously quenched alloy cools from 900 °C, the derivative of Ed drops to its minimum at 650 °C, e, and then rises sharply up to 600 °C. Below 600 °C the first derivative Ed increases almost linearly, consistent with the increase in the value of Ed. The linear course of the derivative on cooling below 600 °C is on evidence that the phase and structural transformations produced by heating are irreversible.
