

Submitted:
10 May 2023
Posted:
11 May 2023
You are already at the latest version
Abstract
The purpose of this project was to demonstrate the potential of converting an existing internal combustion engine for hydrogen operation at relatively low cost and to optimize the combustion process for ultra-low NOx emissions. The conversion has been carried out on a 450cc naturally aspirated single cylinder engine. The first baseline measurements and setup have shown lower NOx emissions than the baseline gasoline engine (without catalytic converter) for similar power output and engine efficiency. Further optimization of the combustion process allowed to achieve Euro VI and (latest European Commission proposal) Euro VII heavy-duty NOx limits without exhaust gas aftertreatment system (EATS) in steady state conditions. The concept is very promising and the knowledge gained should allow for further optimization to achieve near zero NOx emissions at high engine efficiency and power output with supercharging. It should also allow an efficient conversion of other engine types for different applications. In particular, a project with the aim to convert a heavy duty 6 cylinder engine intended for public transport buses has started. It follows a feasibility study which has shown the competitiveness of the hydrogen engine for this application.
Keywords:
H2ICE
; Hydrogen
; Ultra-low NOx
; Engine conversion
1. Introduction
The replacement of fossil fuels in transportation is hampered by economic and environmental difficulties of the technologies currently being developed. On one hand, they require rare and difficult-to-recycle raw materials and, on the other, they lack reliability and remain expensive despite mass production, which limits their progress and widespread adoption. Relatively new energy carriers are under expansion, notably compressed hydrogen. Hydrogen combustion offers multiple benefits, including the potential to reduce ’well-to-wheel’ CO2 emissions to zero depending on hydrogen sourcing. Using hydrogen in combustion engines is of great interest in rapid CO2 reduction, as these are widely available, reliable and proven low-cost technology. Compared to a gasoline engine with Port Fuel Injection (PFI) as baseline, expected power output under stoichiometric combustion of hydrogen is 18% lower for PFI but 17% higher when using Direct Injection (DI) [2].

Table 1.
Gasoline-related power output (Conditions : = 1, n = const., = const., T = const.). [2].
Table 1.
Gasoline-related power output (Conditions : = 1, n = const., = const., T = const.). [2].
| Fuel | Gasoline | Hydrogen | Hydrogen | |
|---|---|---|---|---|
| Concept | Port Injection | Port Injection | Direct Injection | |
| Mixture Calorific Value | MJ/m | 3.9 | 3.2 | 4.5 |
| Power output (compared to gasoline) |
% | 100 | 82 | 117 |
DI hydrogen injection also allows wide AF (air/fuel) ratio variations for a given engine load, enabling increases in engine efficiency [3] while containing low NOx emissions. It is therefore an ideal configuration, which however leads to challenges relative to the cylinder head design for injector integration. Nevertheless, some limiting factors arise when running on H2. Pre-ignition may occur due to several reasons, such as hot spots in the combustion chamber, mostly on the spark plug, exhaust valves or carbon deposit due to pyrolysis of suspended oil in the combustion chamber or in the crevices just above the top piston ring [4]. Combined with the low ignition energy of hydrogen, premature ignition is a potential trouble which is amplified with engine load and/or speed increase [5]. Knocking is also an issue. It happens when the end-gas spontaneously auto-ignites, resulting in high amplitude pressure waves [5]. This can damage the engine due to mechanical and thermal stress increase. Auto-ignition is reduced by applying some of the following techniques: over-expanded cycle, variable valve timing, exhaust gas recirculation, leaning the fuel mixture and cooling the in-cylinder charge [6].
Table 2.
Research engine specifications.
| Displacement | 449,3 | cm3 |
| Bore | 95 | mm |
| Stroke | 63,4 | mm |
| Compression ratio | 12,75 :1 | - |
| Max. speed | 11’500 | rpm |
| Number of valves | 4 | - |
Table 3.
DI injectors sizing.
| Max targeted speed | 6000 | rpm |
| Power @ max. speed | 29.3 | kW |
| Global efficiency | 35 | % |
| Required hydrogen power | 83.7 | kW |
| Injection rate | 3000 | 1/min |
| Injection duration | 60 | °CA |
| H2 mass / event | 13.95 | mg |
| H2 flow during event | 1020 | cm3/s |
| Averaged mass flow | 0.70 | g/s |
| Instantaneous mass flow | 8.4 | g/s |
1.1. Scope of modifications
Focus is placed on a minimal amount of components which provide most of the effect, following Pareto’s 20/80 Principle [7]. Critical systems are injectors and ECU tuning, plus the integration of the sensors required for simulation calibration. Acoustic tuning is part of the specifications in order to increase torque at lower speed (down speeding) as should be representative of a road car operating range (see configuration). Further efficiency enhancements may be achieved by using a passive pre-chamber, supercharging and lean burn or EGR. However, due to the budget constraints, not all those concepts will be investigated.
2. Configuration
2.1. Research engine
The test engine used is a 450cc four-stroke single cylinder from Austrian manufacturer KTM, which is used on their EXC-F enduro motorcycles.
Selected to represent an automotive engine due to its unit capacity, the max. speed for H2 testing will be reduced to 6000rpm.
2.2. Injectors matching
The injection system is crucial for mixture preparation, and must be tailored to hydrogen. Based on performance data received from KTM, hydrogen flow requirements can be defined.
Due to high performance and efficiency potential, Direct Injection has been chosen as already mentioned. Since no manufacturer was offering “of-the-shelf” high pressure hydrogen injectors, nor spray targeting plus nozzle machining upon request at affordable prices, the Bosch HDEV5.2 gasoline injector range was used. Selected model is version number 0 261 500 112, having the largest rated flow. In order to characterise its hydrogen flow capability, measurements were done under various pressure levels on a flow rig.
Table 4.
HDEV5.2 OEM hydrogen measured flow.
| Pressure | 10 | 50 | 100 | bar |
| Volumetric flow rate | 54 | 574 | 1200 | Nl/min |
| Mass flow rate | 0.075 | 0.800 | 1.672 | g/s |
The test highlighted the OEM injector’s insufficient flow, even at the relatively high pressure of 100 bar. Given that fuel pressure on a vehicle is built up only during tank filling, injection pressure condemns a part of the tank to be unused. In consequence, pressures above 100 bar were considered meaningless. Target mass flow of 8.4 g/s is reached by first running dual injectors and reworking nozzle holes. A tomography revealed that the injector’s nozzle has 6 stepped holes, with 210 microns minor diameter and 440 microns major diameter.
Figure 1.
X-Ray analysis of the OEM injector nozzle.
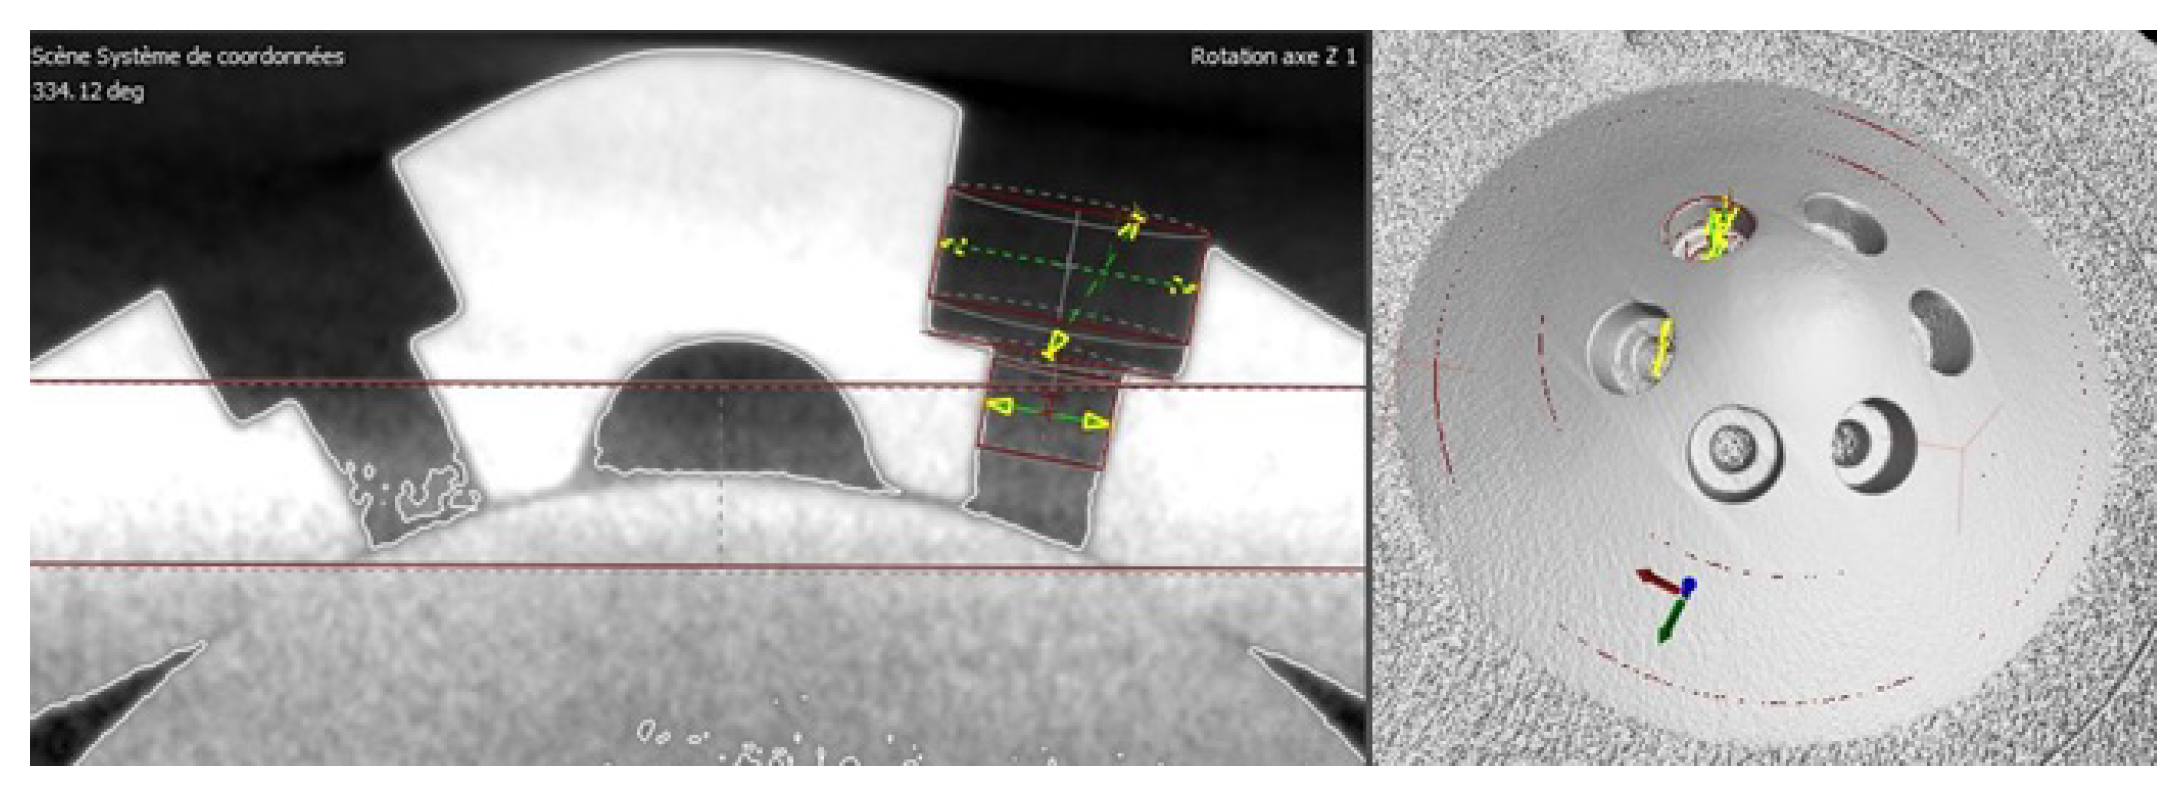
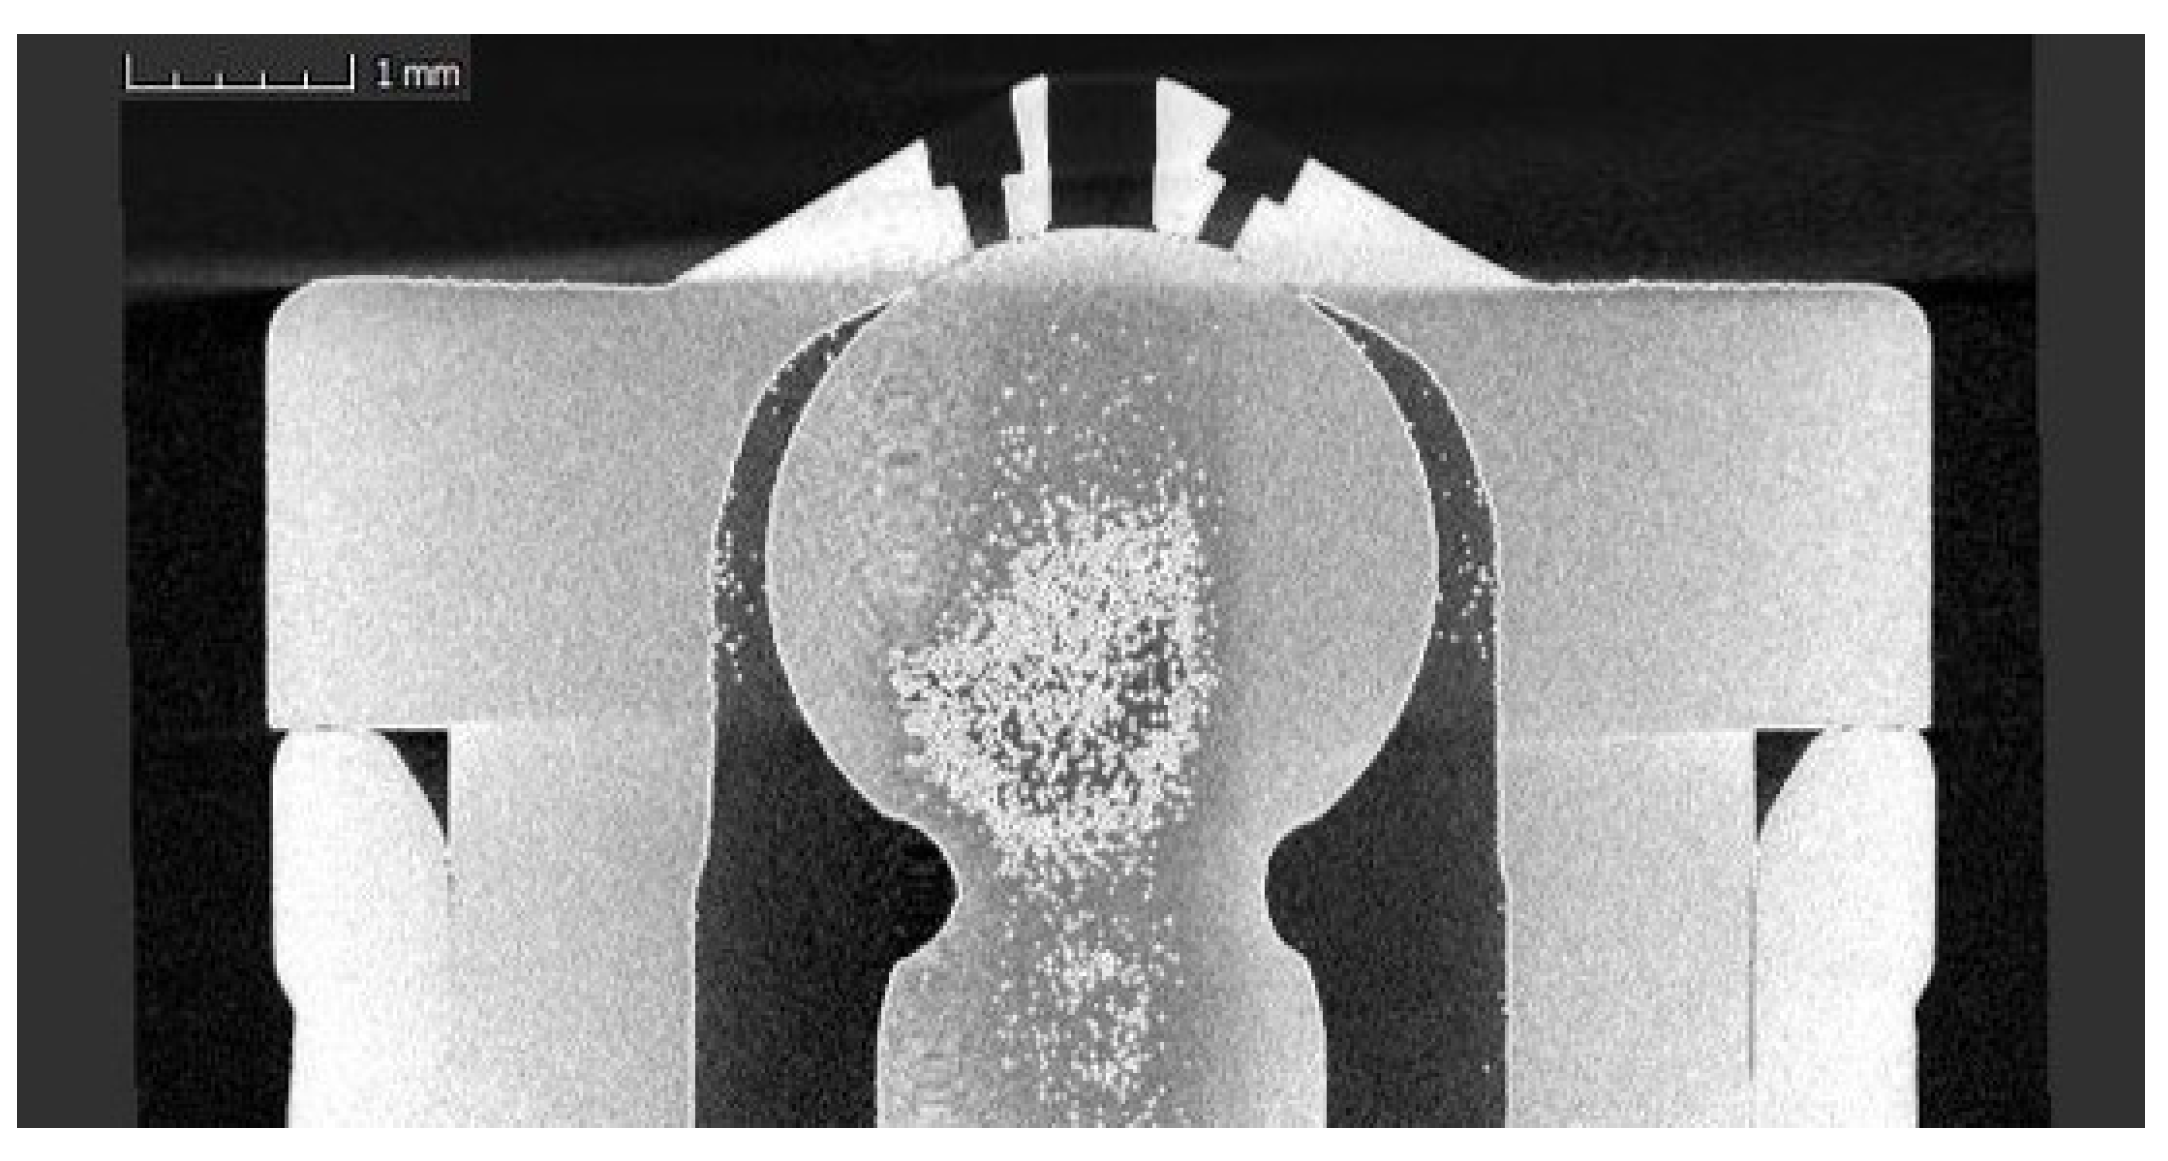
Based on those measurements, dedicated simulations were performed thanks to a 1D software. After model calibration, various alternatives were considered and flow tested. The most promising one is to drill a seventh hole in the blind hole at the centre of the nozzle (at “Sackloch” location), as there is no sealing function in this area. Since the hydrogen molecule is the smallest on earth, closed injector leaks are a serious concern. It is important to avoid injector nose domus distortion and sealing faces alteration while machining. Having that in mind, centre holes up to 0,7mm diameter have been considered, while upsizing existing holes would have been too complicated (holes inclined along 2 axis, leading to potential sealing issues) and difficult to apply on several injectors in a robust way. The initial plan was to rework holes on an activated “open” injector with micro EDM, but the needle has a lift of about 100 microns and the depth of focus of this process is superior to 250 microns. Micro machining therefore became a preferable solution, as depth can be precisely managed. A tomographic inspection after machining of a 0,5mm hole is shown in Figure 2.
Figure 2.
Examination of the 0.5 mm center hole machining.
0.5 and 0.7mm diameter holes were machined, flow tested and compared to the baseline OEM injector. The maximum test pressure is limited to 68 bar due to test flow sensor’s limitation (1400 Nl/min maximal flow).
Flow figures are relatively higher, and it is interesting to notice that the 0.5mm hole provides better flow figures than the 0.7mm one. That can probably be explained first by the fact that the flow restriction is no longer located at the injector hole’s cross section, but at the hollow stem of the needle. Furthermore, the radiused inside edge from original seal machining is possibly removed when increasing the bore diameter from 0.5mm to 0.7mm, thus reducing the discharge coefficient. Considering a 70% increase in flow at 100 bars (Table 5), dual modified injectors would supply only 5.7g/s instead of the required 8.4 g/s (Table 3). This issue is fixed by allowing more than 60 crank degrees for event duration at high loads under high speeds.
Table 5.
Modified injectors flow test.
| Pressure | 10 | 50 | 68 | bar |
| OEM Injector (reference) | 54 | 574 | 799 | Nl/min |
| 0.5mm hole | 78 | 970 | 1378 | Nl/min |
| Increase over OEM | 44% | 69% | 72% | |
| 0.7mm hole | 76 | 870 | 1337 | Nl/min |
| Increase over OEM | 41% | 52% | 67% |
2.3. DI injector integration
After having performed a tomography of the cylinder head, the water jacket is extracted to analyse access to the combustion chamber and used, additionally with reverse engineered airflow paths, to evaluate material thickness at each position.
Figure 3.
Water jacket tomography.
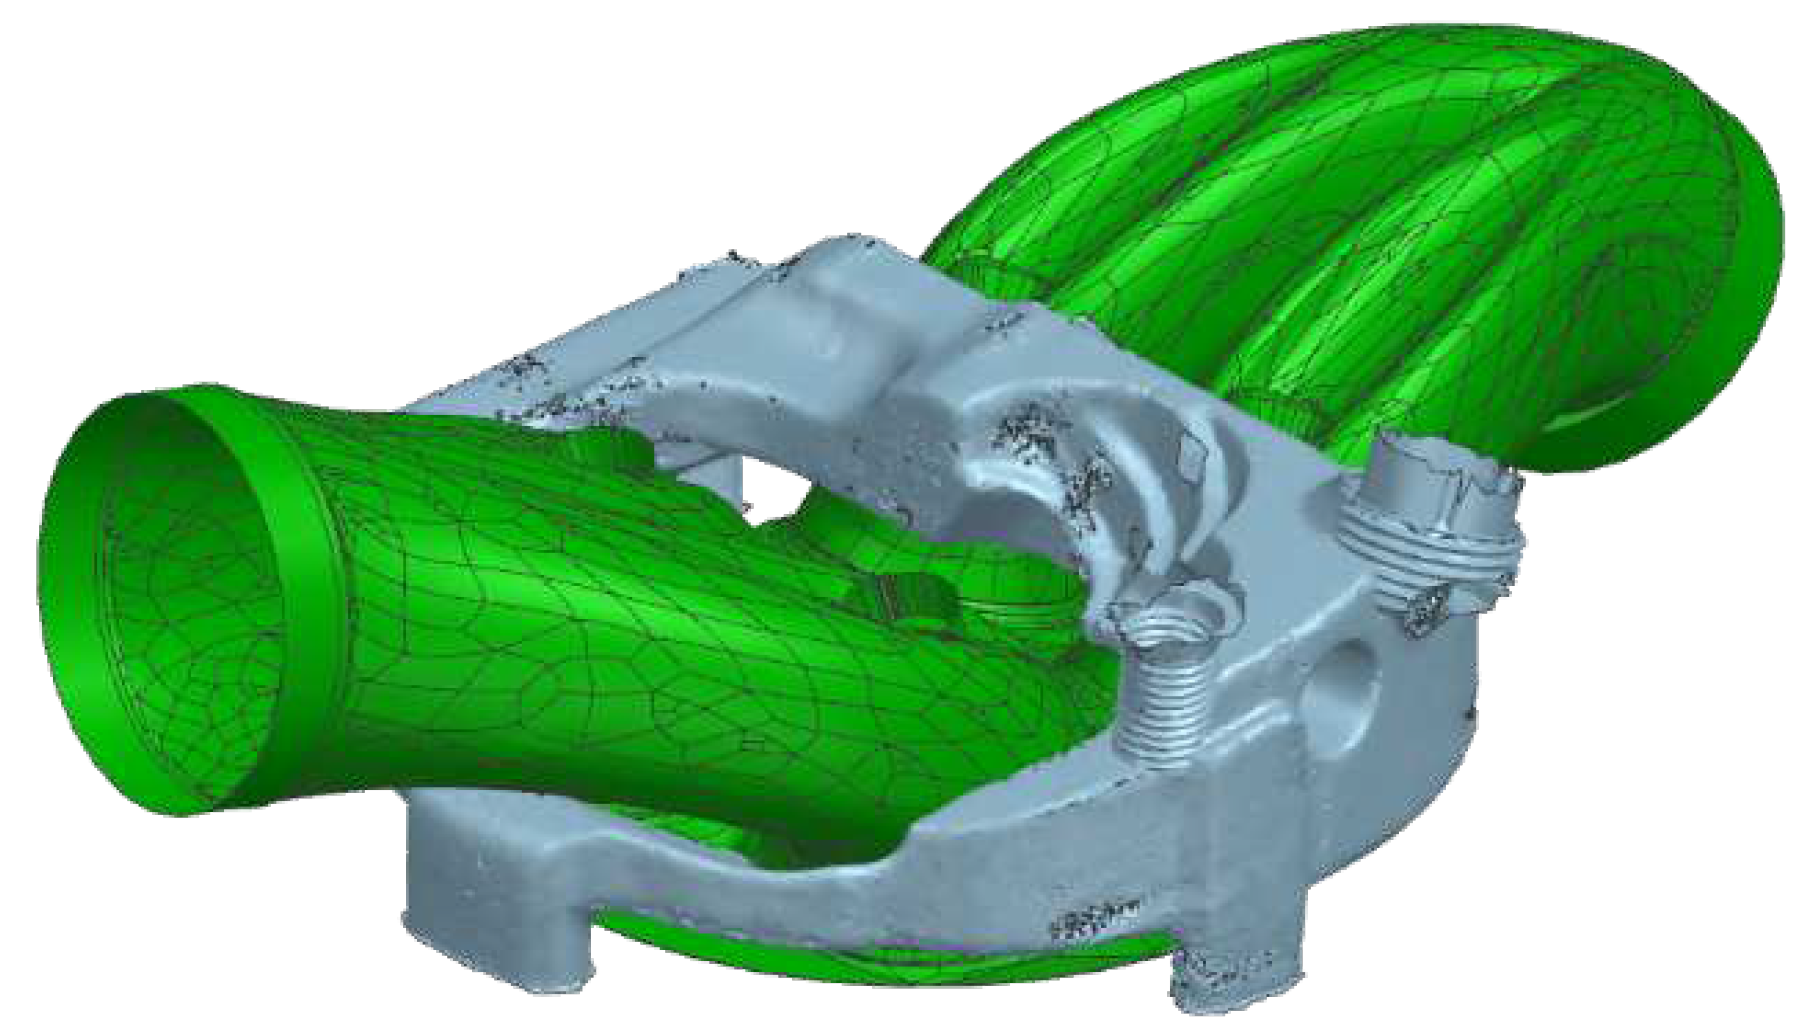
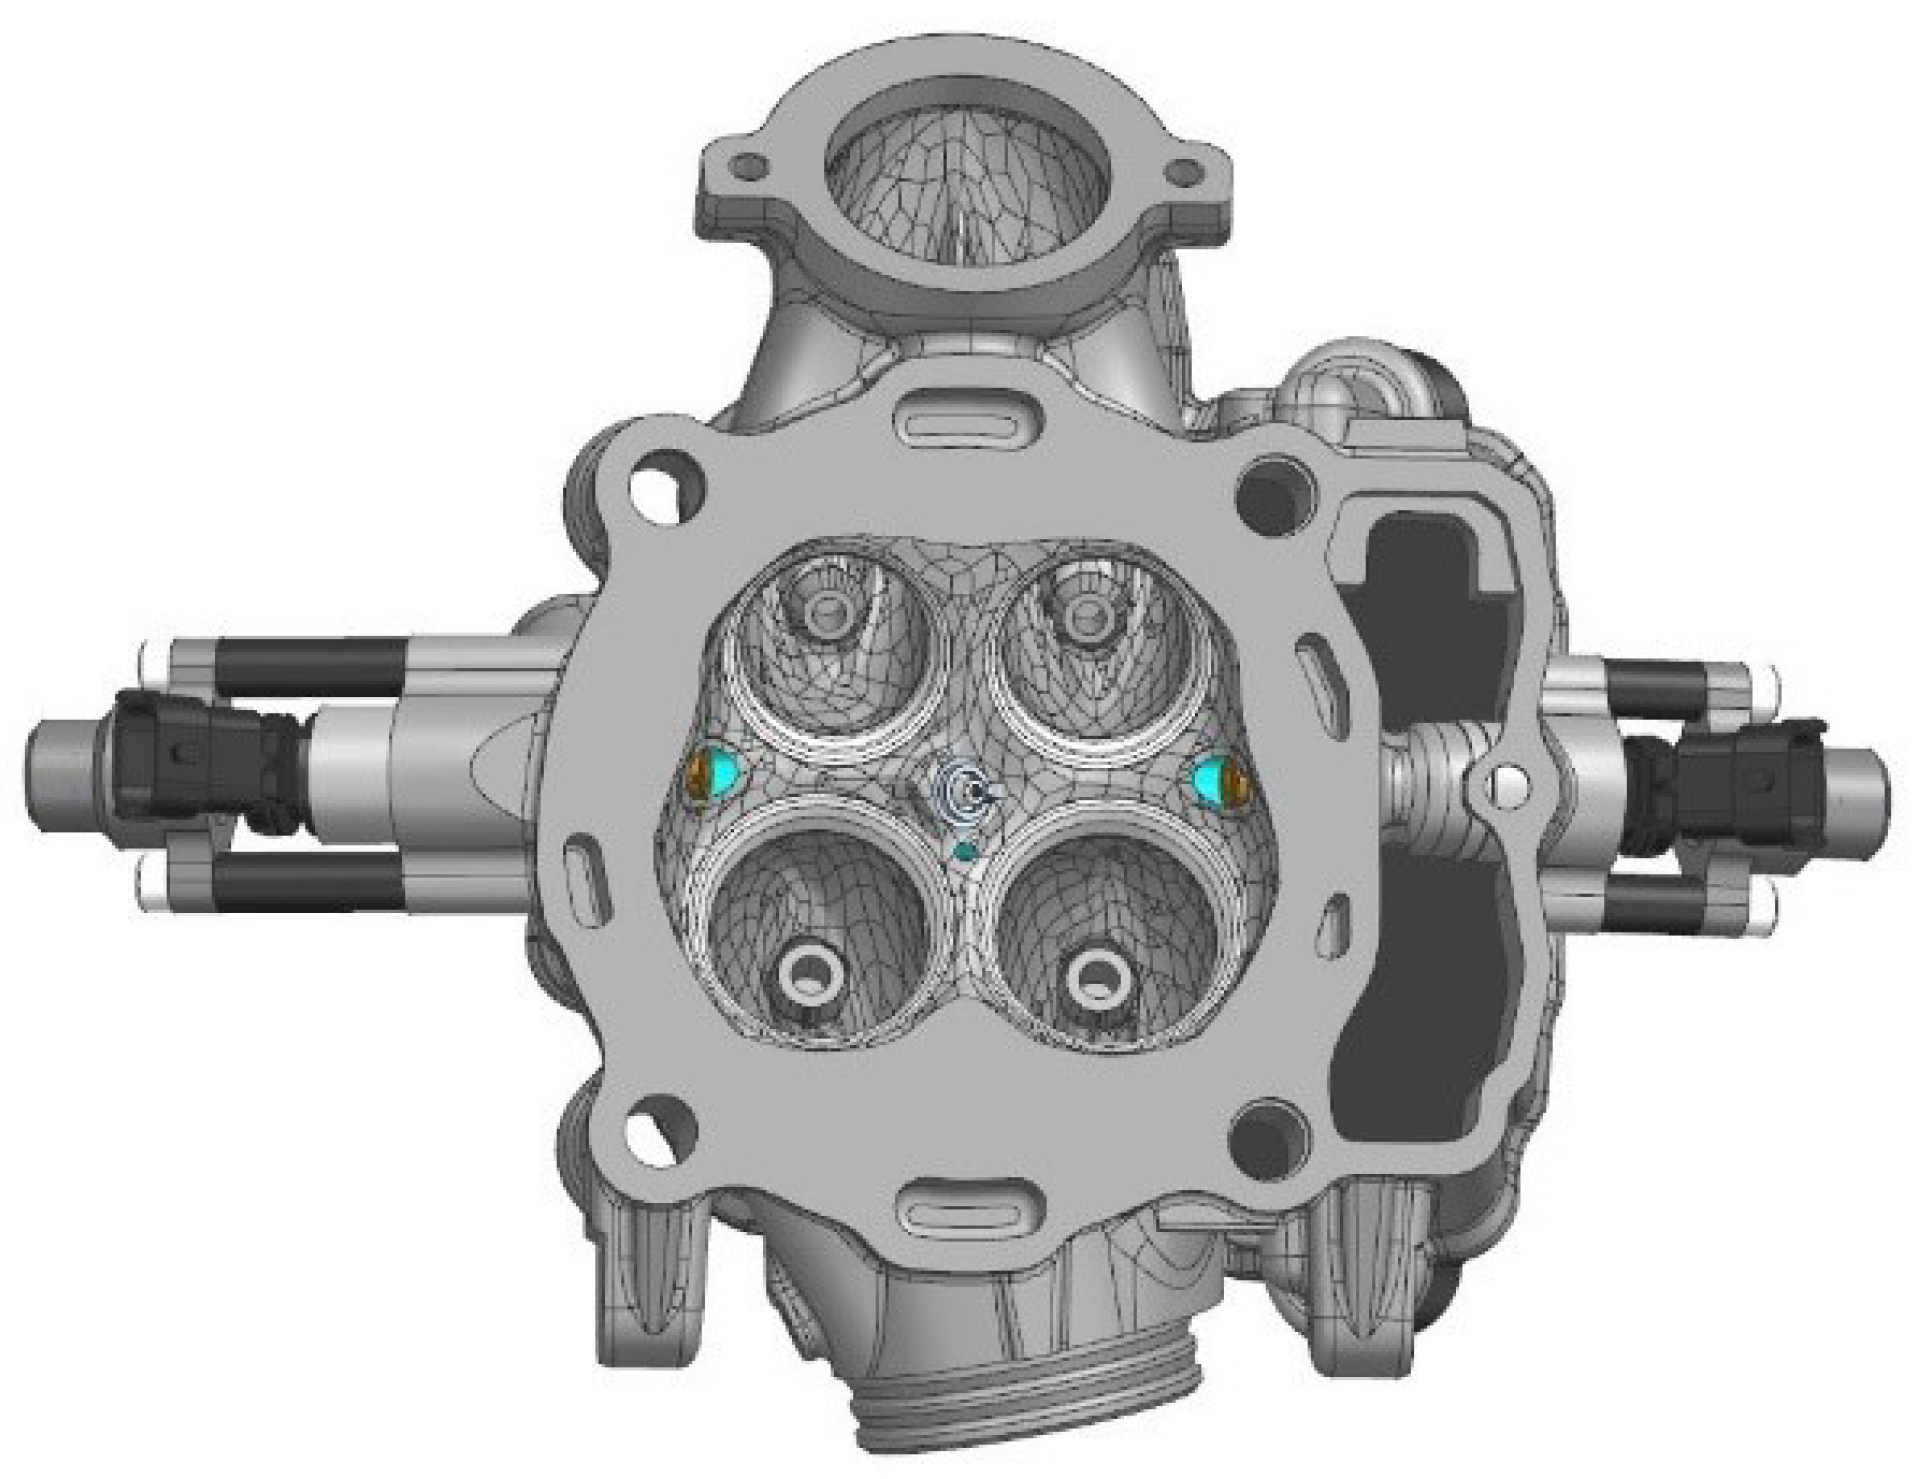
Two locations allow injector integration: sides and centre line of inlet port. As placing the injector nozzle between the inlet valves implies crossing the inlet port and thus generating upstream flow disturbances, sides are considered much better. As the water jacket is crossed, many mounting inserts have been investigated: pressed bungs, screwed bungs and welded bungs. Due to the highly optimized weight and geometry of the head, welding seems the safest. Injectors have been placed face to face, with a relative upward angle of 18° relative to fire face. On the left side, the injector would come inside the distribution chain loop. This location is quite tricky but acceptable.
Figure 4.
Injectors location.
2.4. Head modifications
Several cylinder heads were modified following this process:
- Jig machining
- Head machining – Cylinder pressure sensor mounting and bungs access
- Raw bungs laser welding
- Leak test – Water jacket integrity approbation
- Final machining to tolerances and measurements of fire face
- Assembly
Principal difficulties were found during welding bungs on the head, which is a casting of a slightly modified version of AlSi7MgCu.
Figure 5.
Location of the 5 weld joints.
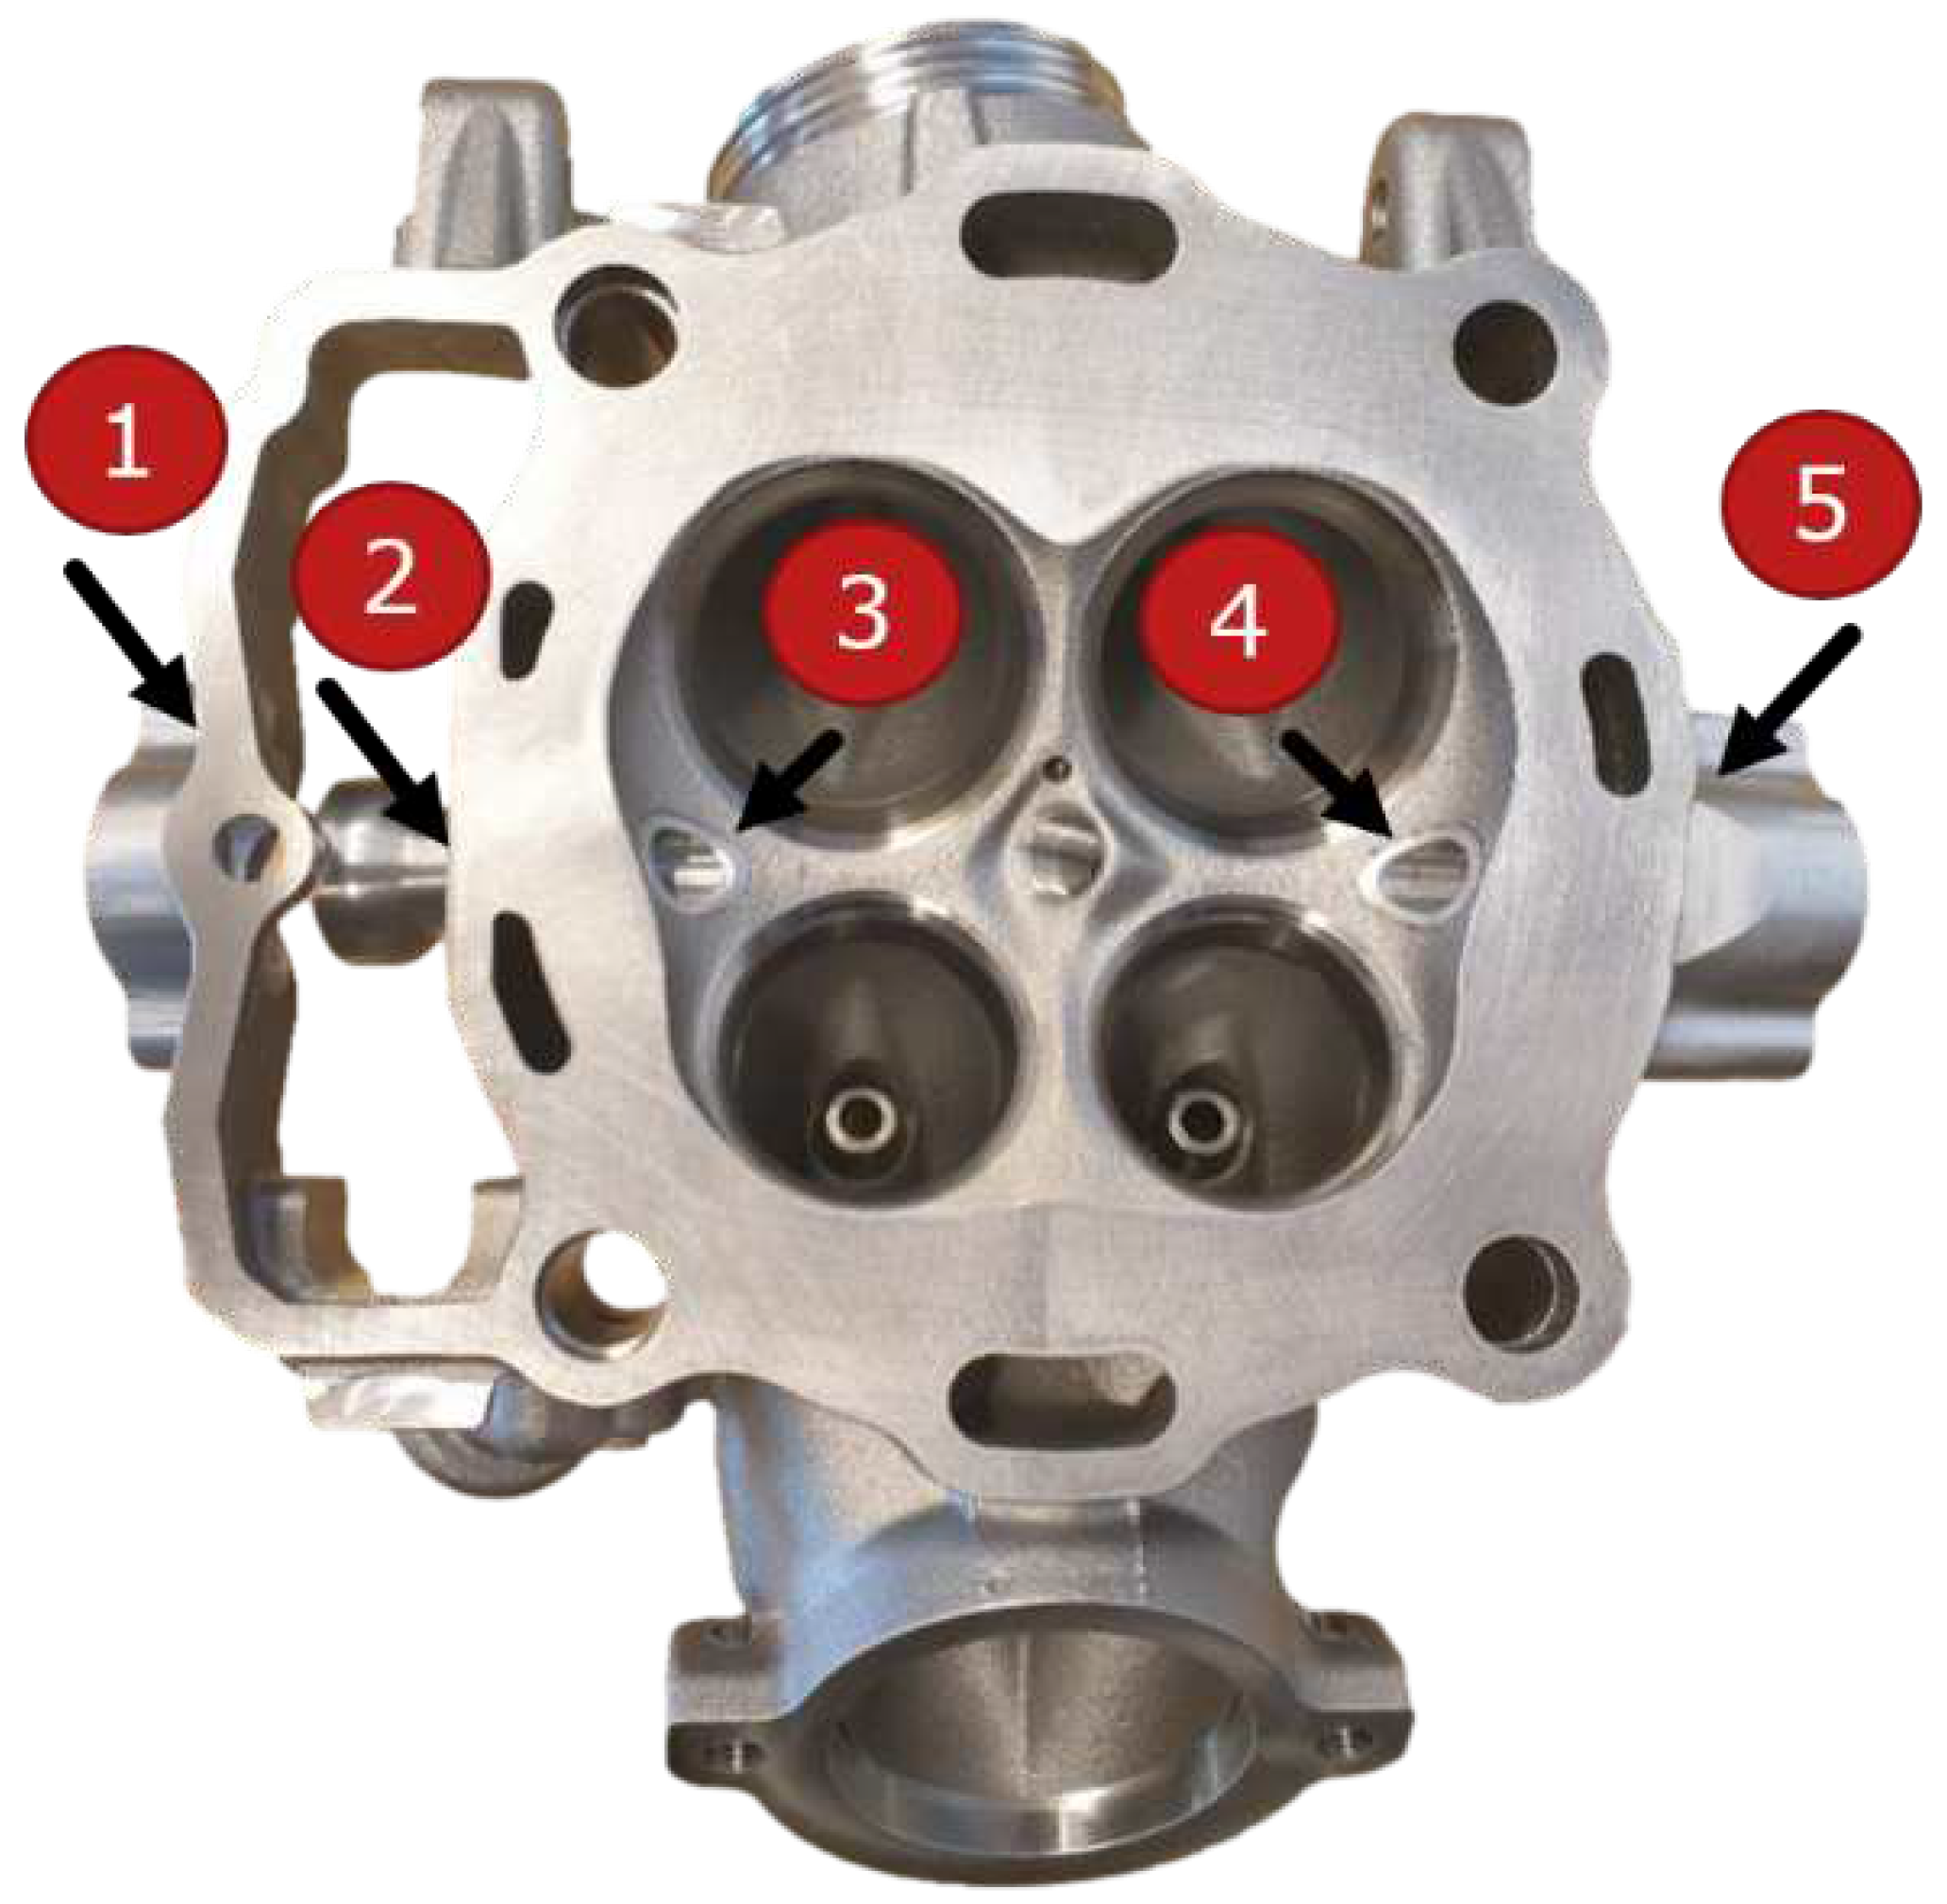
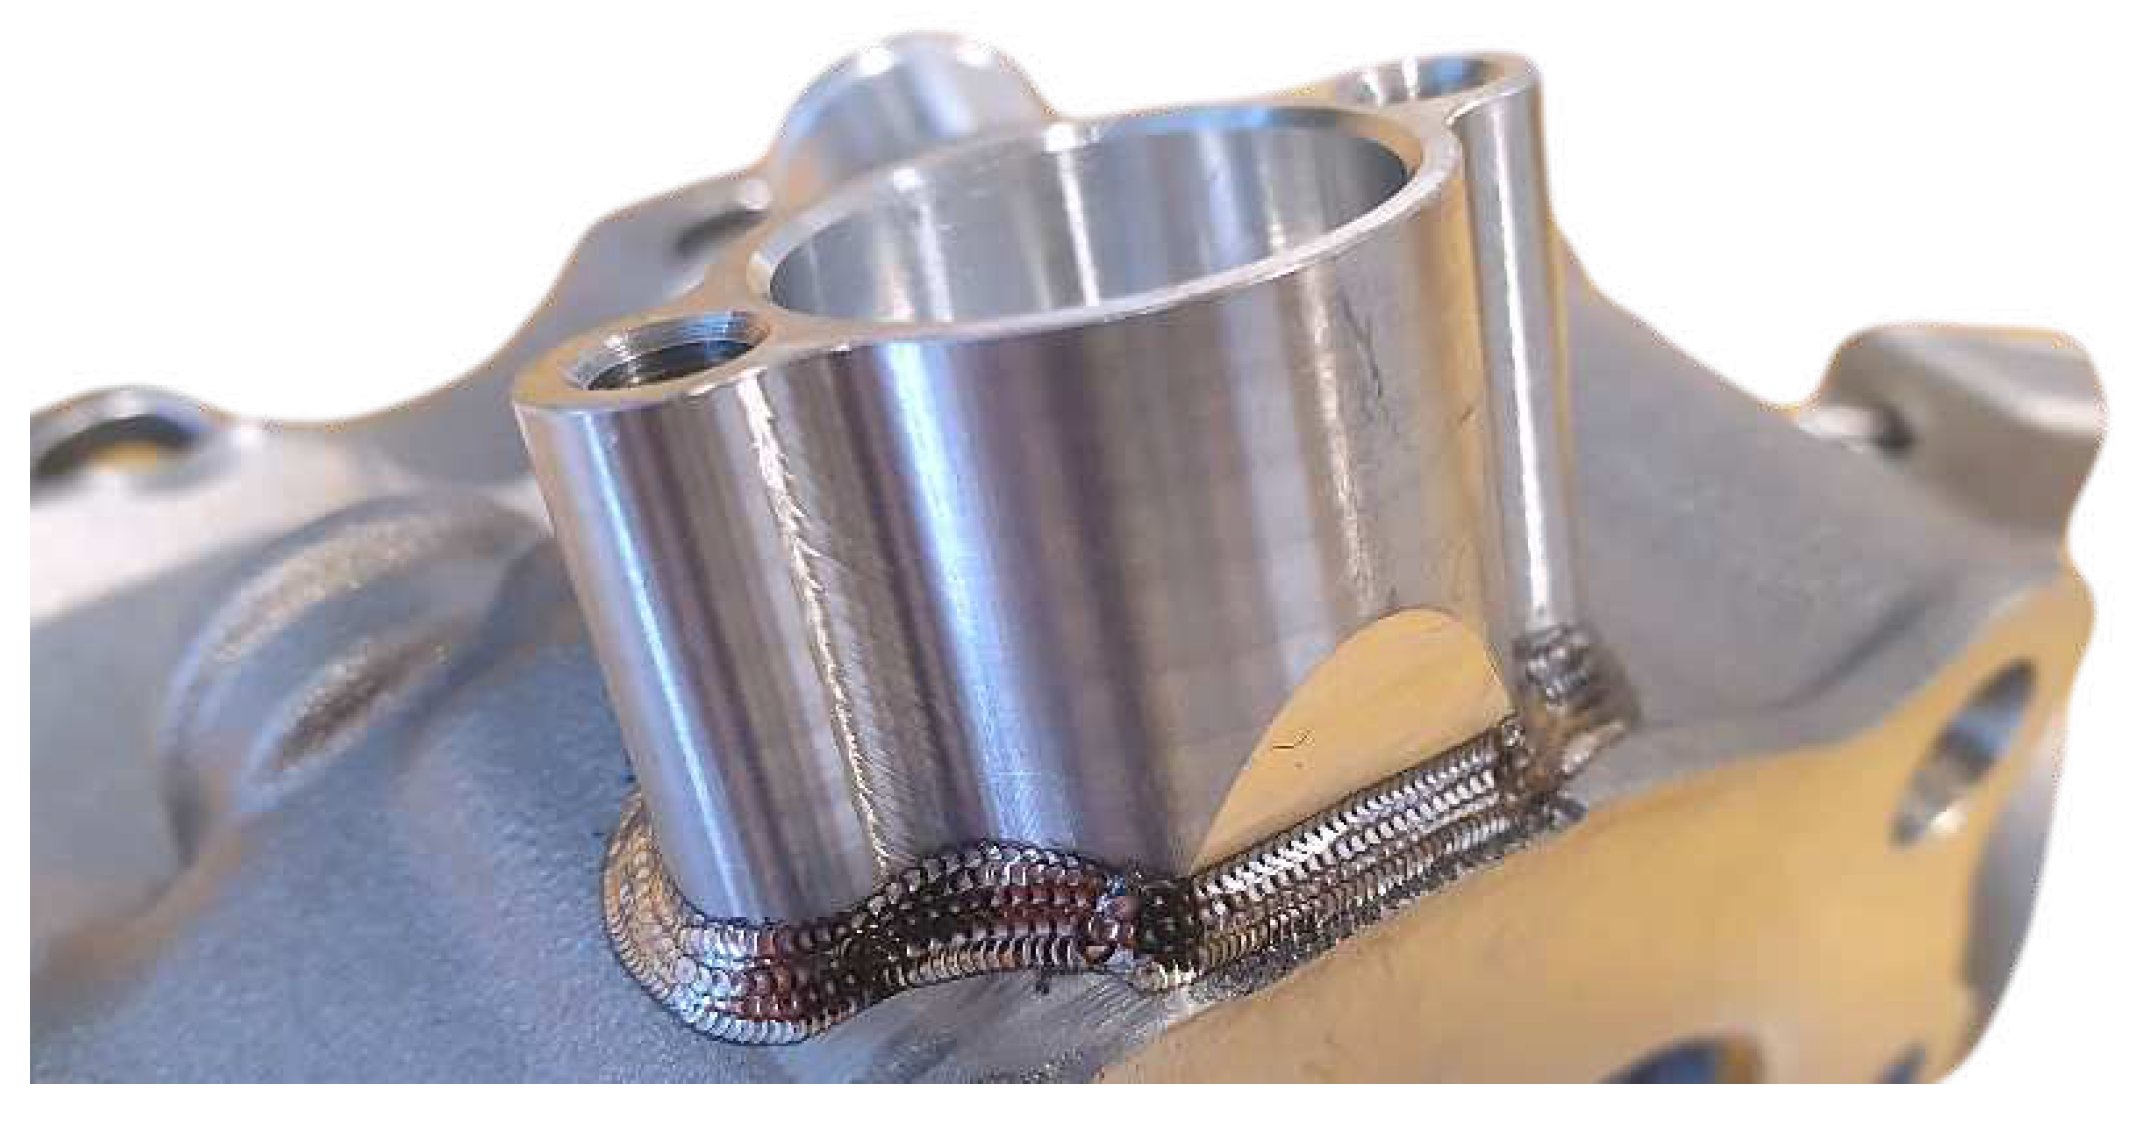
The first TIG welding attempts were not concluding, leading to a damaged head where seats have been replaced and the fire face skimmed. Laser welding is a better solution to minimise heat distortion and control the melt pool size. First trials were made with a 2-axis semi-automated laser welding machine at the Swiss Welding Institute. As no filler material could be added, thin welds eventually crack and cause multiple tiny leaks. Those welds must be airtight to separate the combustion chamber from the water jacket, so the heads were sent to a specialised supplier for laser welding. Multiple layers of laser welds with filler metal is the only solution which complied tests on the water jacket test rig.
Figure 6.
View of a multi-layer laser weld.
2.5. Engine parameters
Through collaboration with KTM’s R&D department, the majority of simulation mandatory parameters have been gathered. However, the remaining few such as camshaft profiles and the head’s discharge coefficients are considered sensitive and were not shared. They have been measured in-house. To characterize camshaft profiles, a special rig has been developed and built.
Figure 7.
Camshaft profile rig.
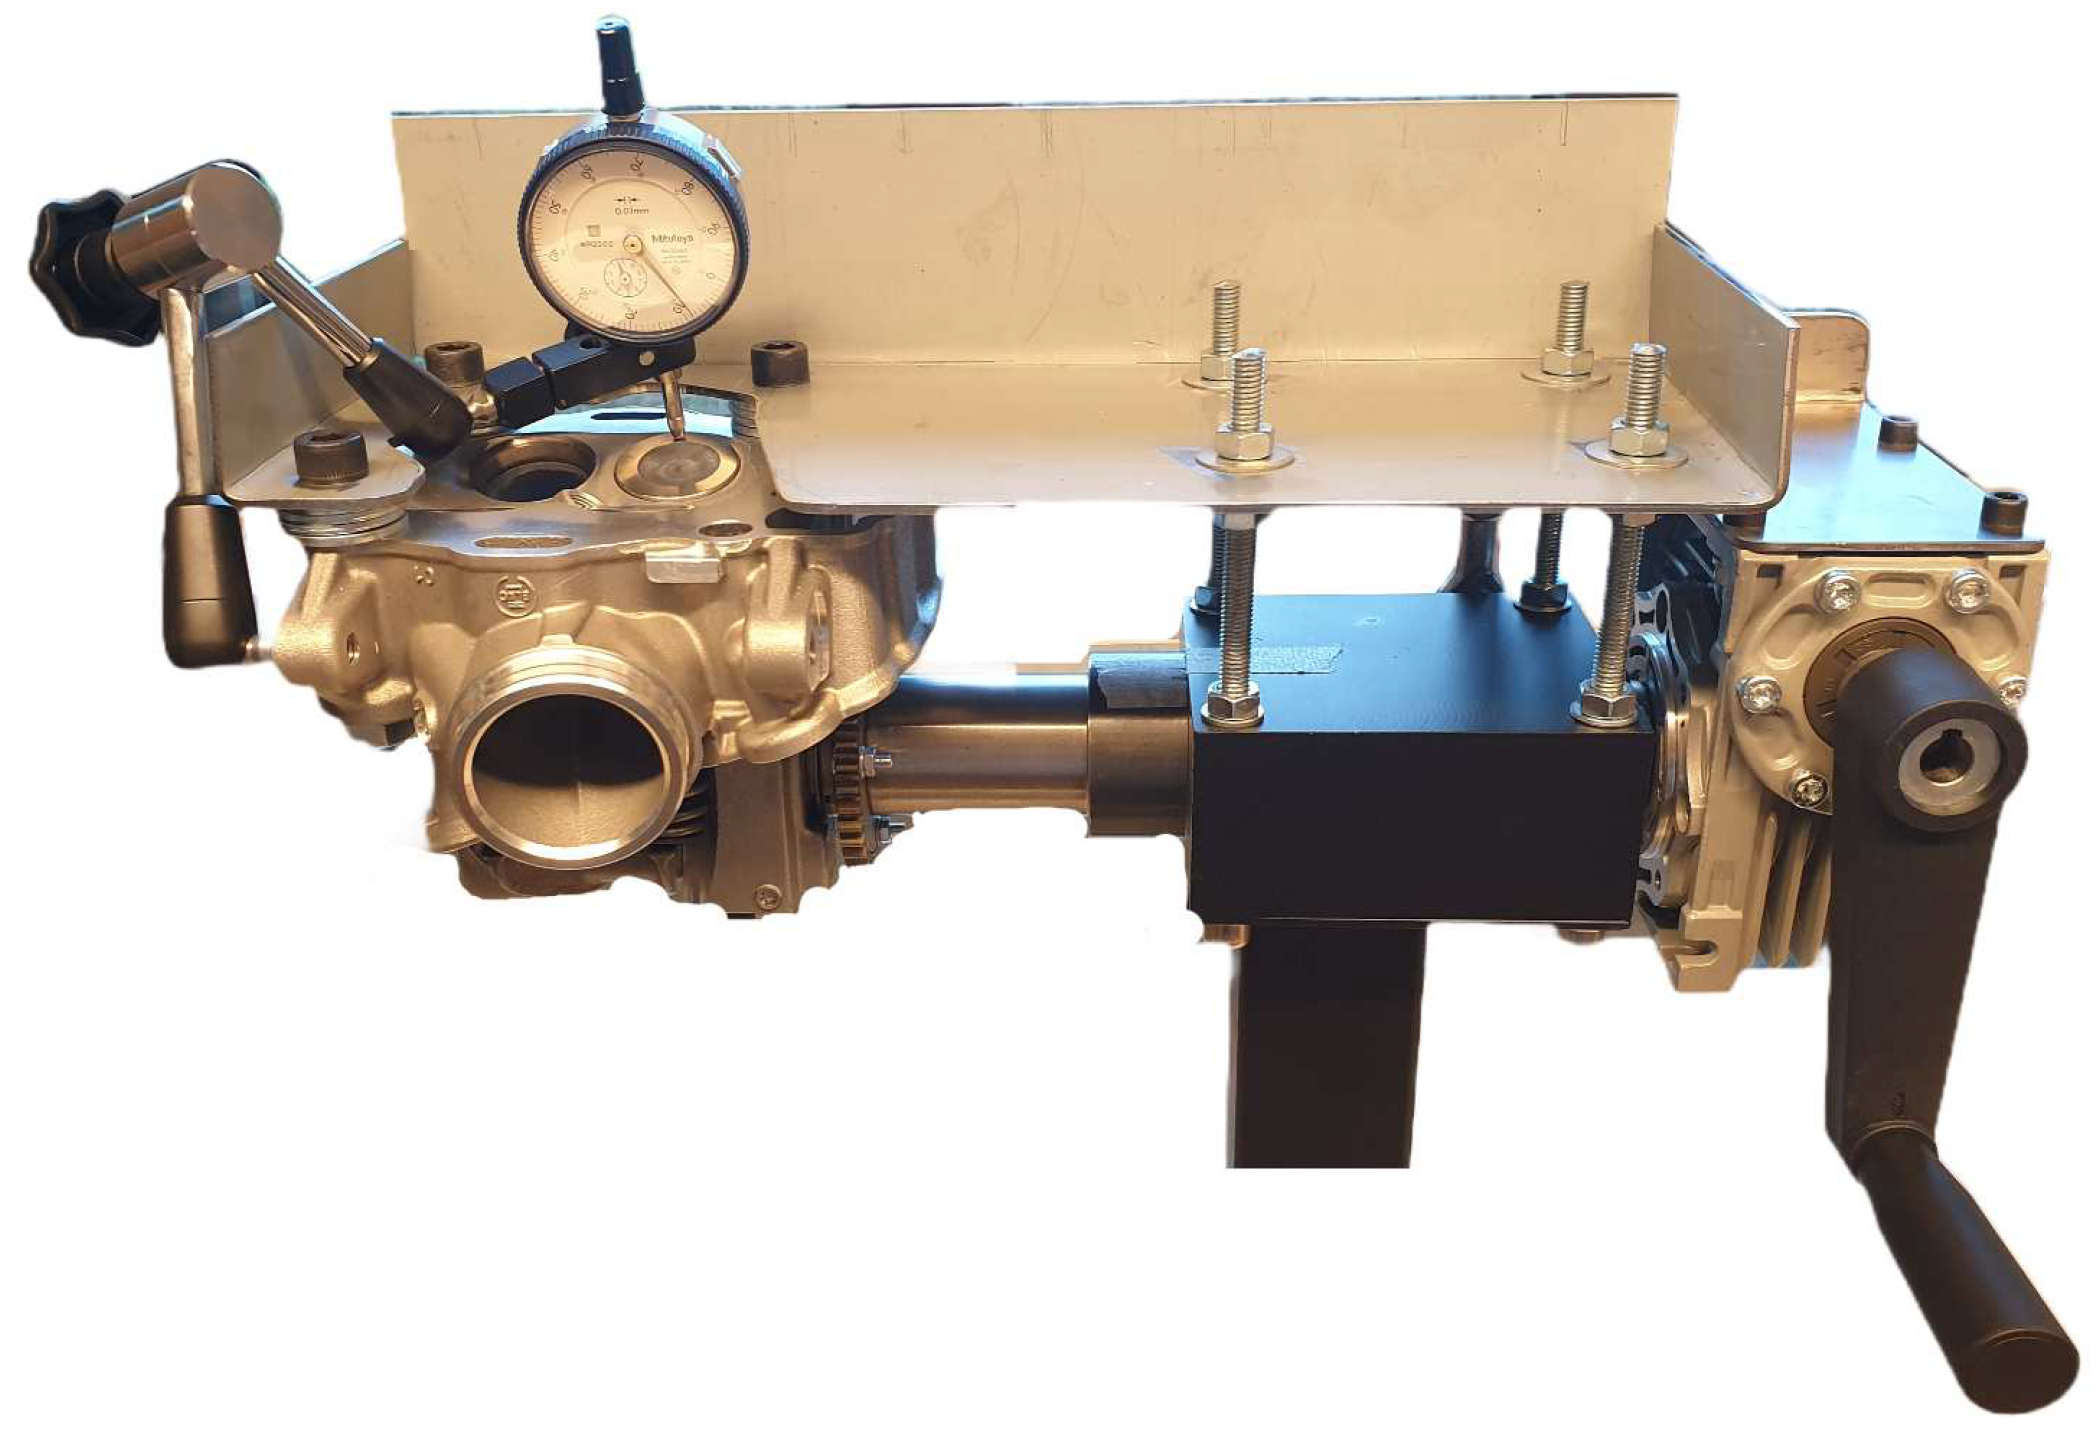
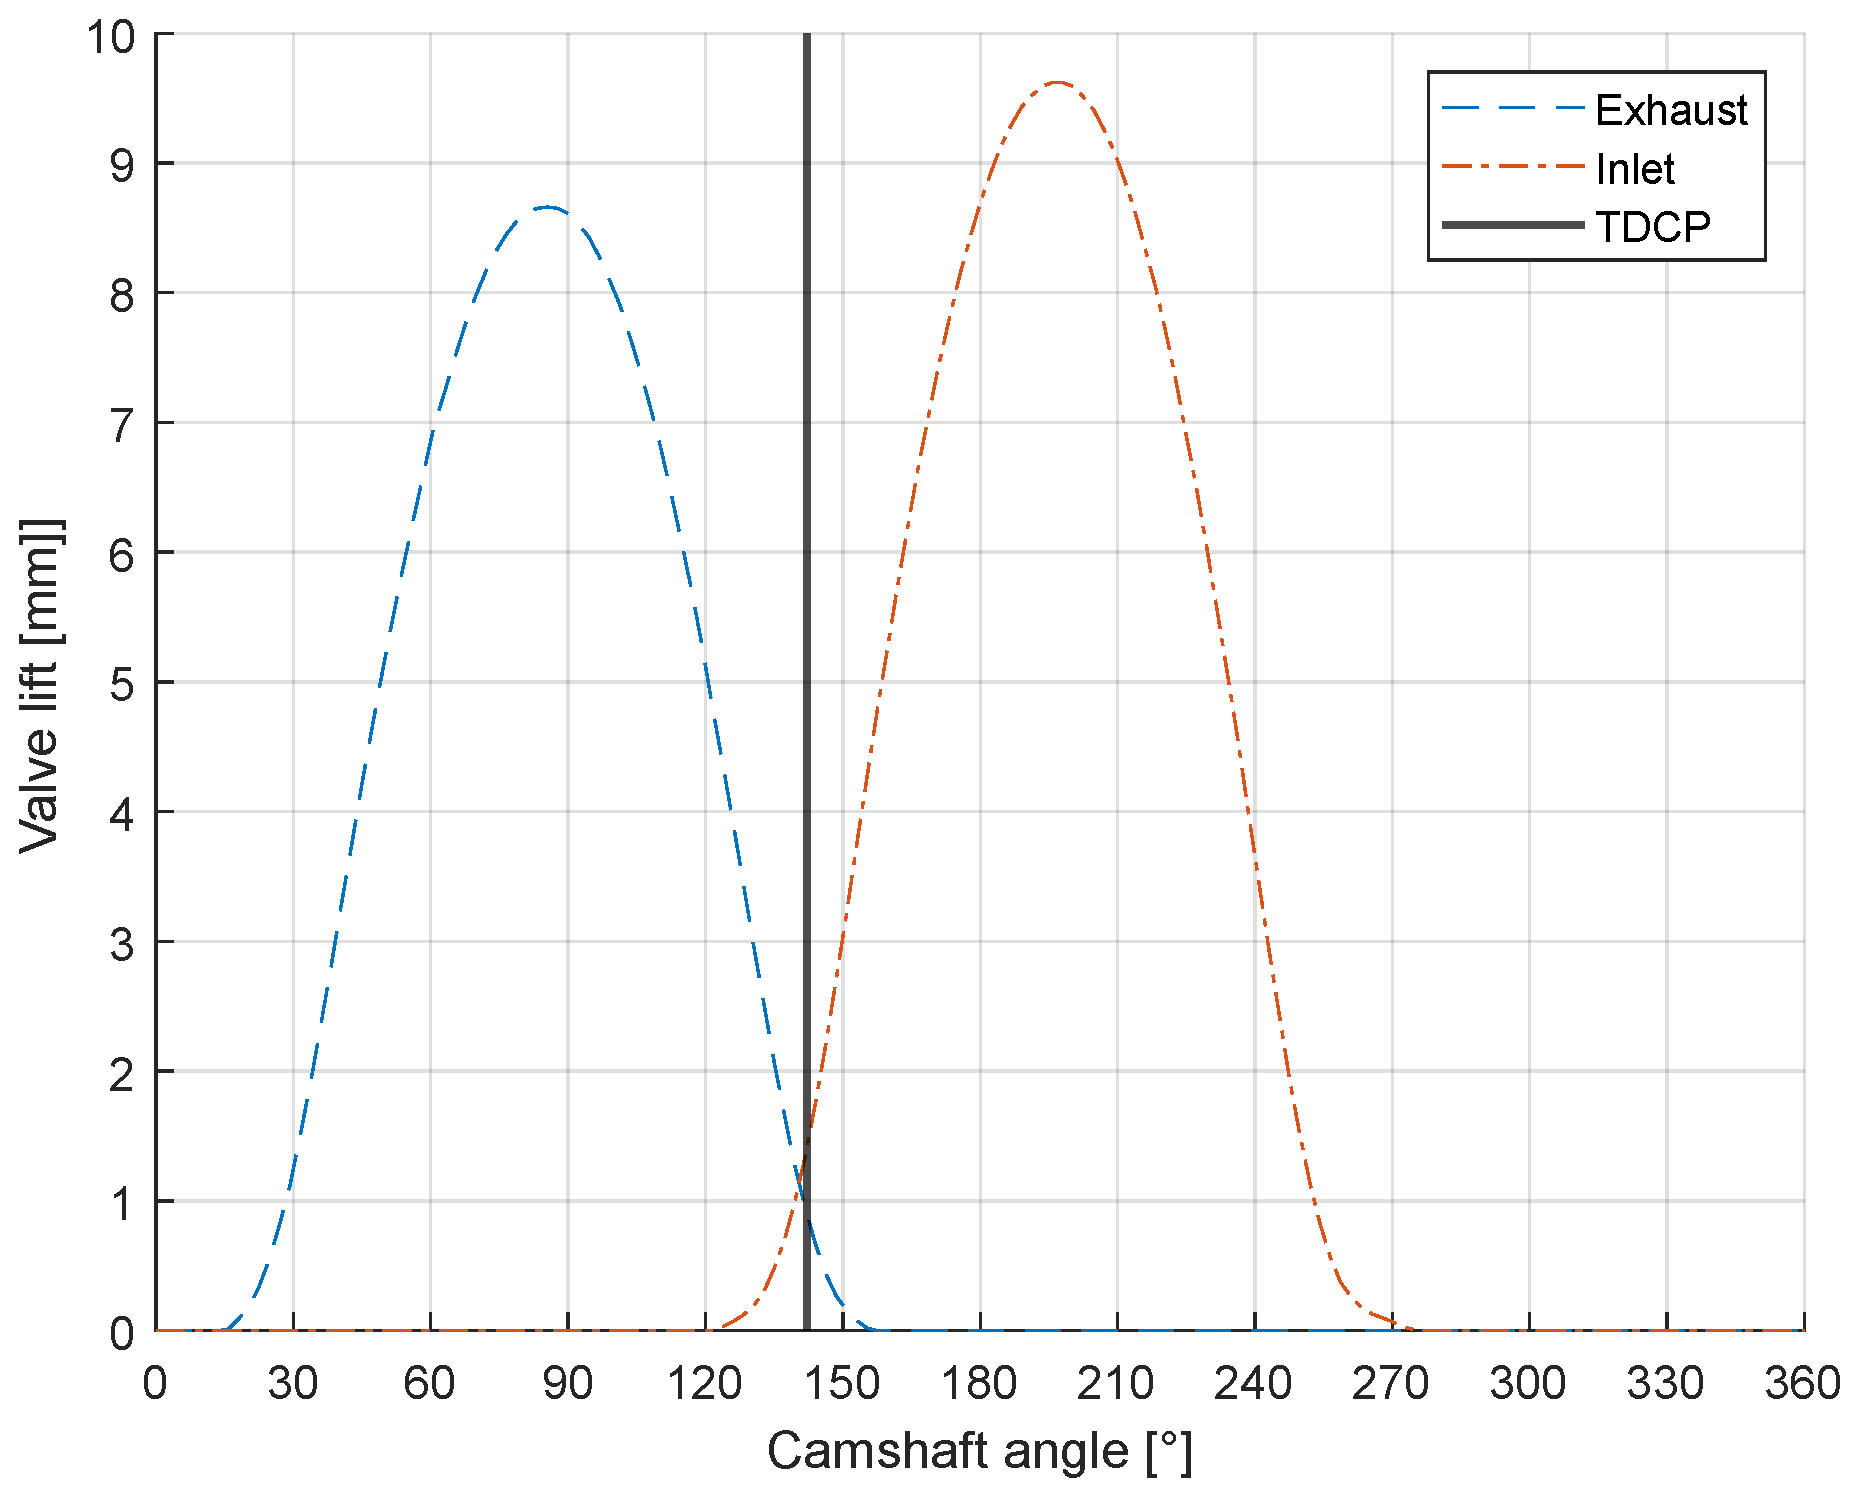
Exhaust and intake cam profiles were measured with a comparator as shown in Figure 7. Furthermore, it has been possible to phase both cams with TDCP. Valvetrain components have been weighed and springs characterized, initially to prepare camshaft profiles for low speed optimization. As camshaft pre-finished blanks were not available from KTM, and machining brand new ones was both expensive and time consuming, the best decision was to stay with OEM camshafts. Below are the measured profiles in function of cam angle:
Figure 8.
Camshaft profiles.
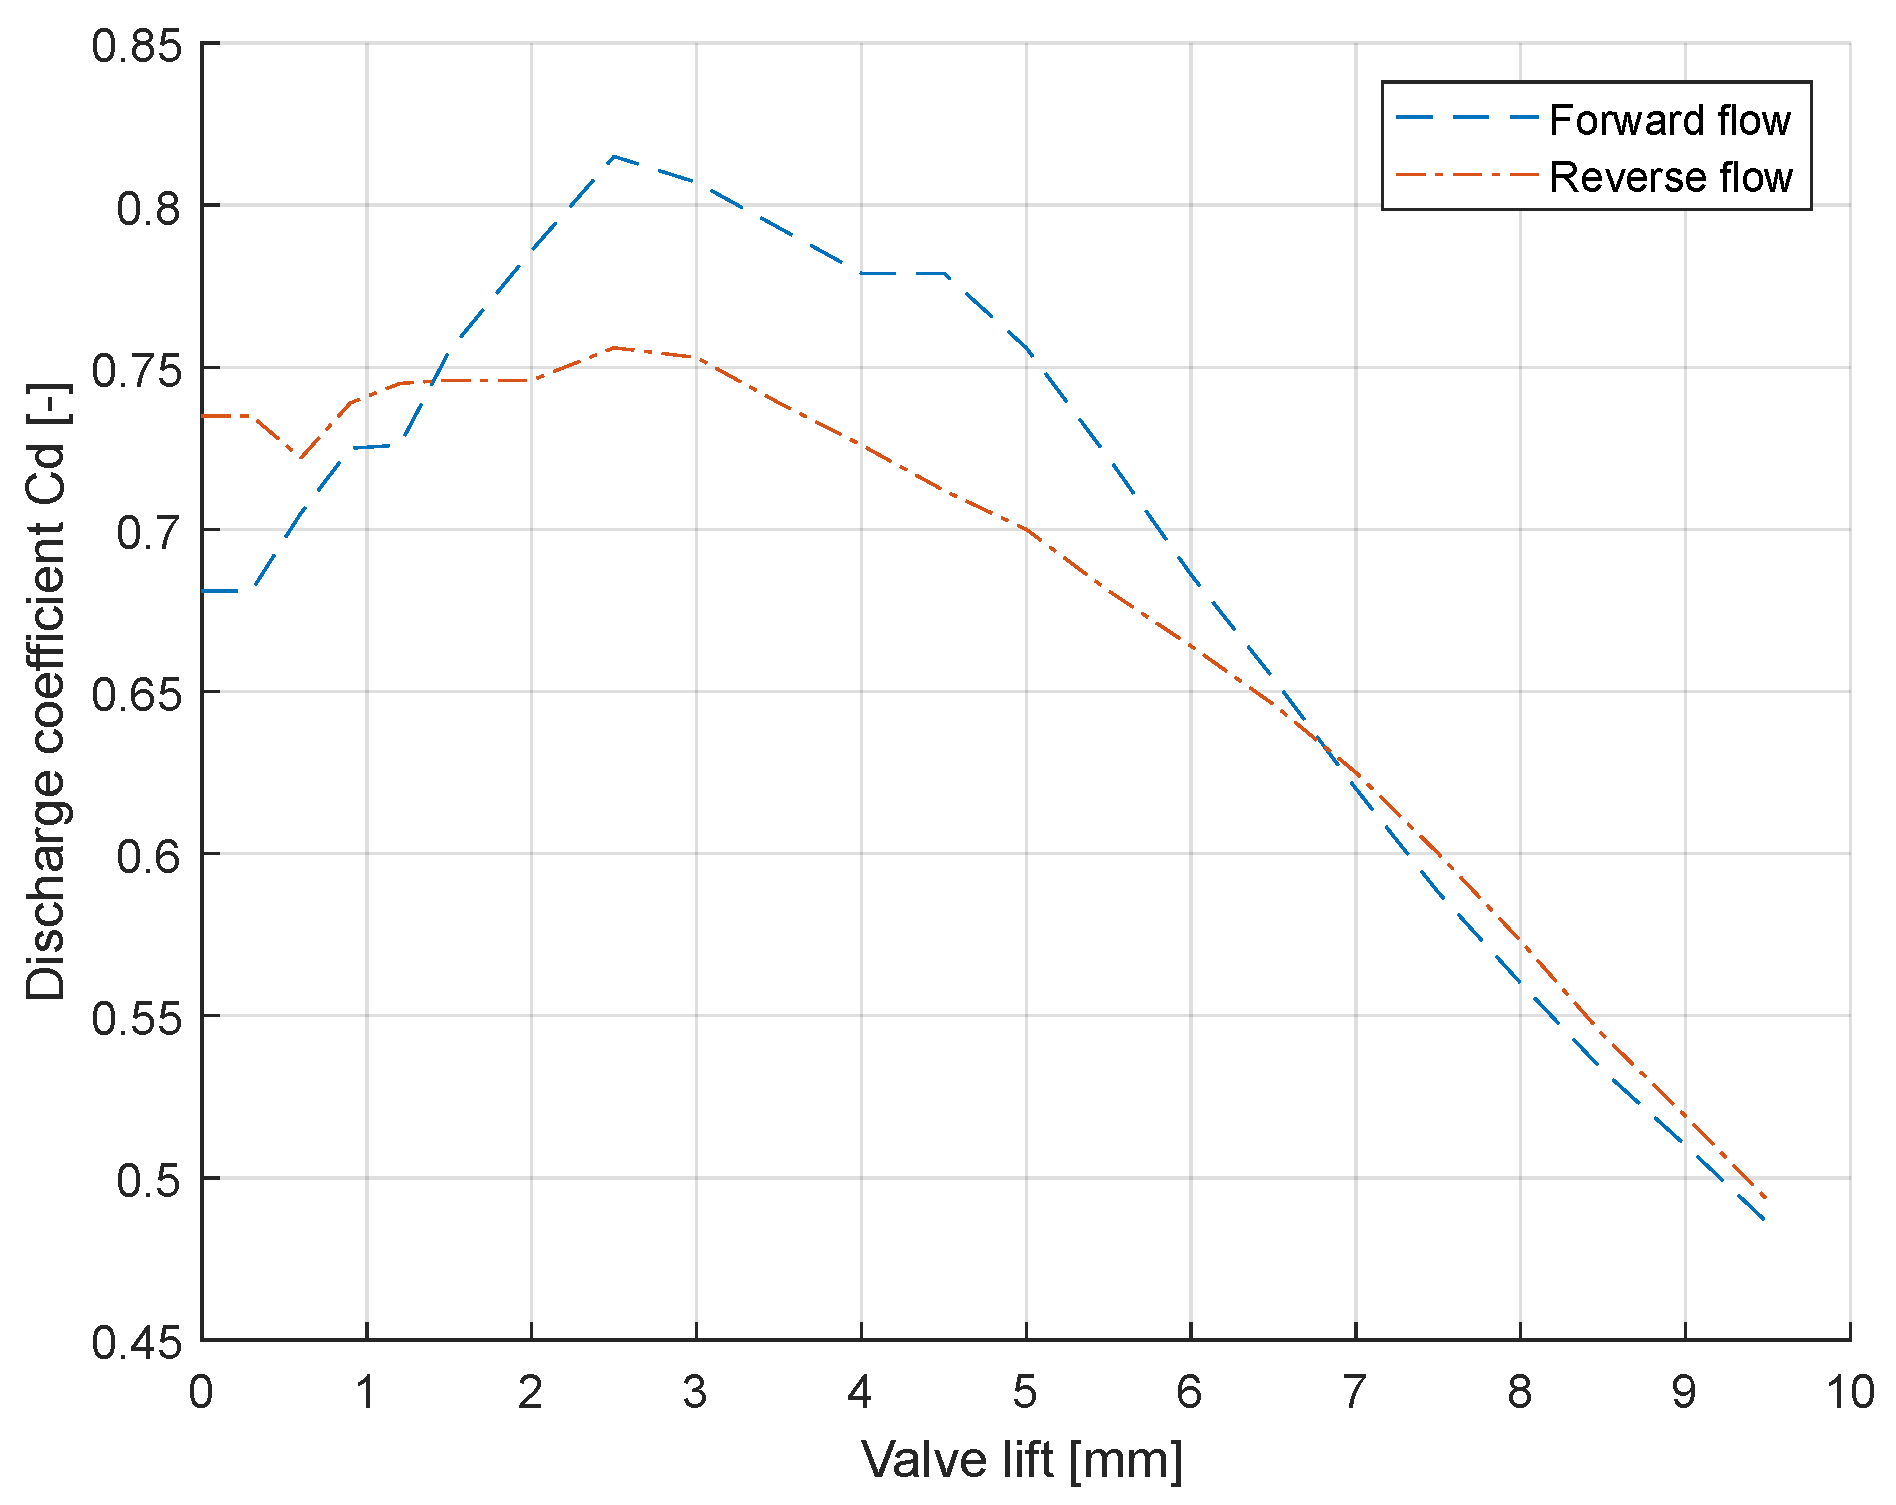
The remaining parameters to be measured, namely the head’s exhaust and intake discharge coefficients have been characterized through tests with a Jaros 24TV AirFlow bench. This system is advantageous thanks to its automatic valve lift setting and test cycle automation.
Heads are flow tested at 2500 Pa pressure drop, both for forward and reverse flow. The discharge coefficient characterizes the vena contracta generated by discontinuous transitions between upstream areas and boundary areas. It is worth mentioning that head flow Cd’s have good figures. Similarly to the previous study regarding camshafts, decision has been taken to stick with OEM ports, valves and seats profiles. Work on cylinder heads is done with consciousness to preserve the original flow properties. Below are the intake and exhaust discharge coefficient figures:
Figure 9.
Intake discharge coefficients.
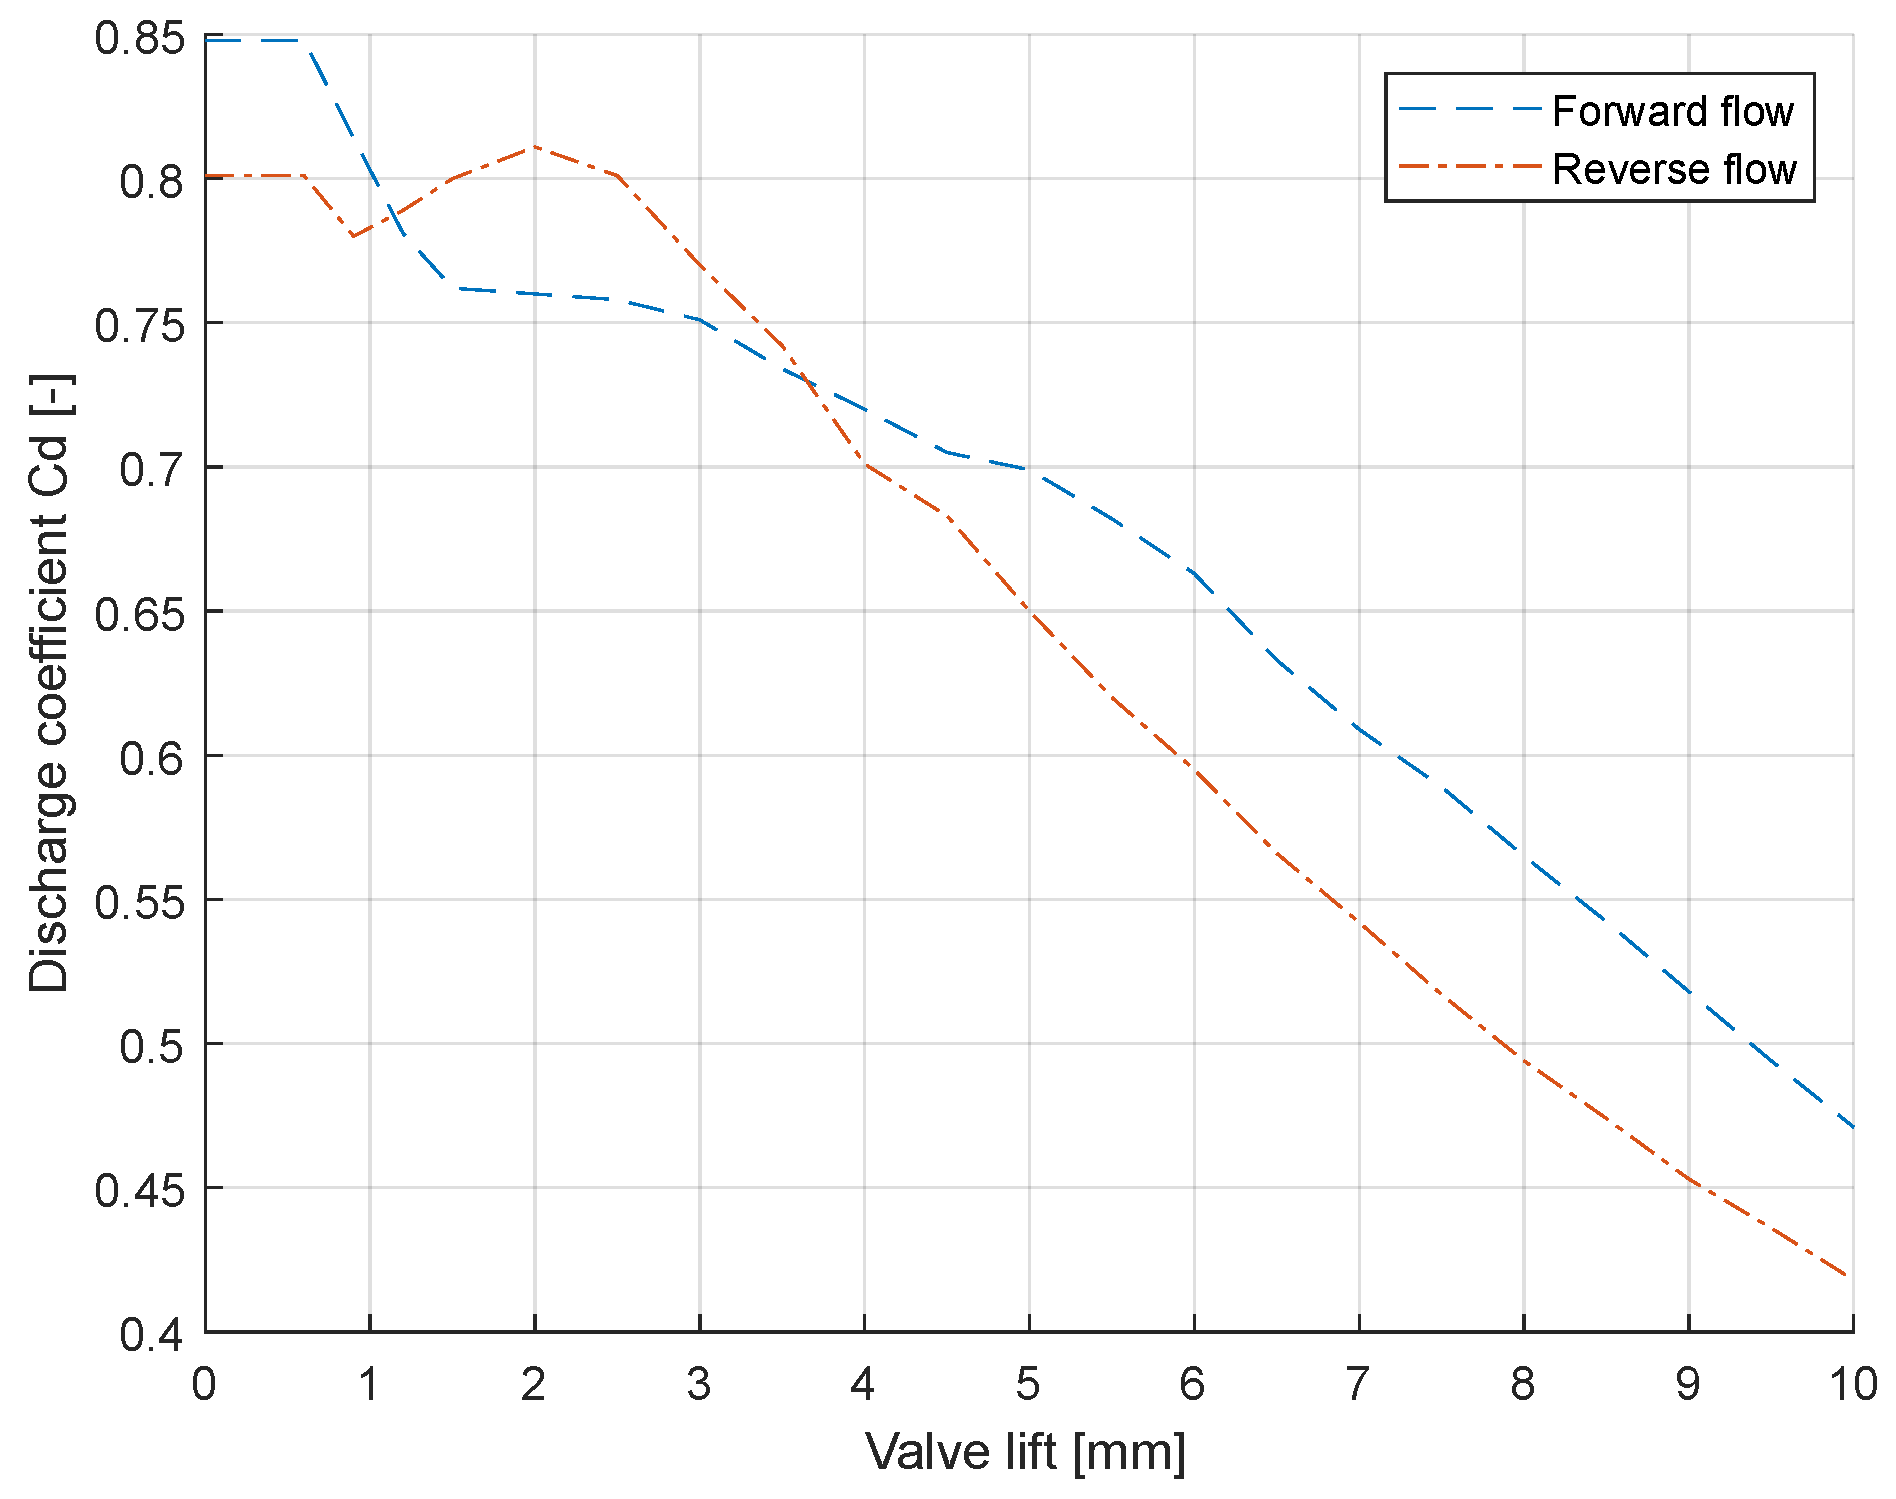
Figure 10.
Exhaust discharge coefficients.
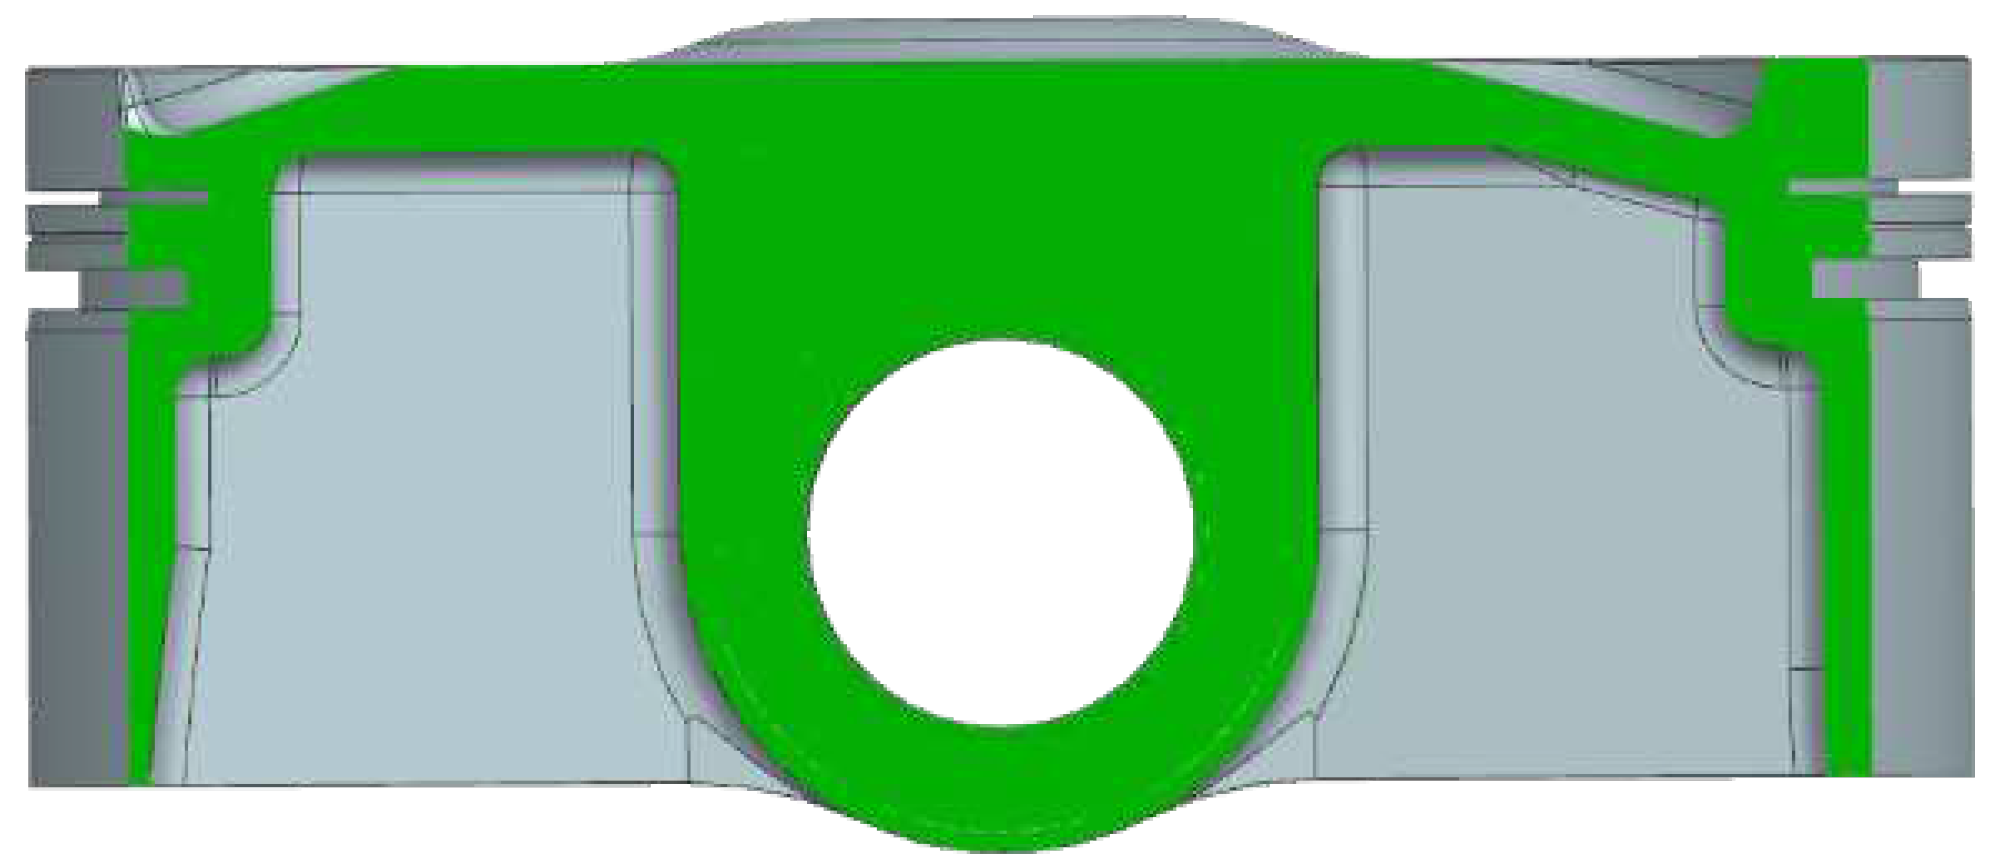
Further study of the piston crown by reverse engineering is made to evaluate possibilities to reduce the original 12,75:1 CR. It dismisses any significant supplementary machining due to the thin crown. Once again, ordering on-purpose manufactured pieces from Carillo Pistons would have been too expensive for this project. A spacer plate is considered too risky, so decision to stick with potentially problematic CR was made. Hereafter, one can see a clip section view of the box-bridged piston.
Figure 11.
Clip section view of the piston, showing the thin wall thickness and thus impossibility to further machine it.
Figure 11.
Clip section view of the piston, showing the thin wall thickness and thus impossibility to further machine it.
2.6. 1D simulation
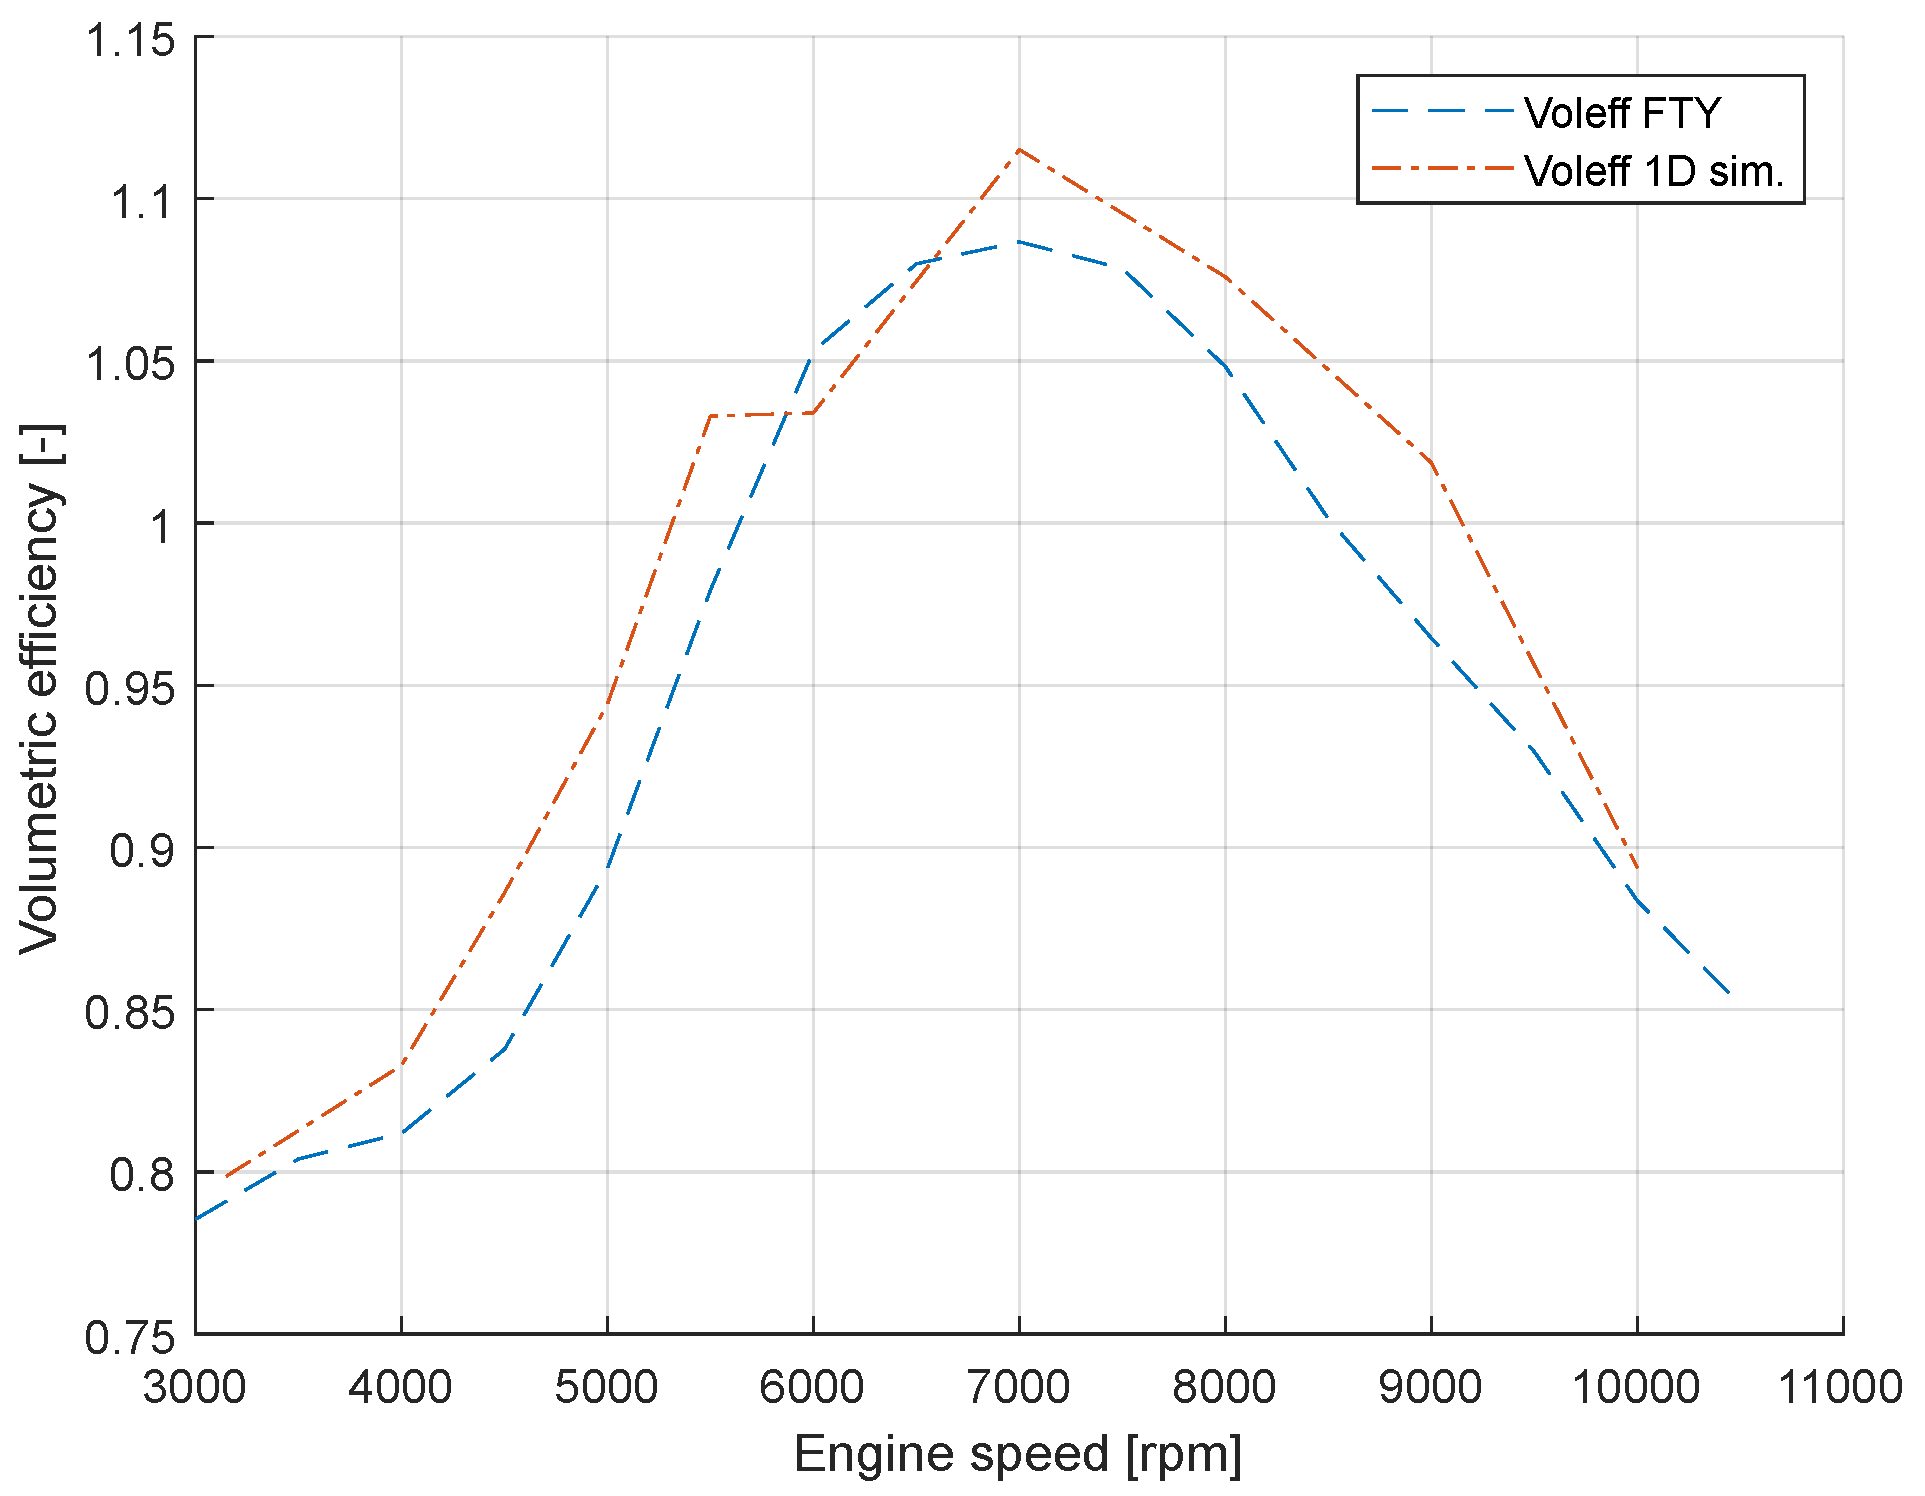
After having gathered the necessary parameters, a 1D simulation model can be built. At this phase of the project, HEIA’s powertrain team was still commissioning test bench facilities, so comparison of simulation results with measurements is made with KTM factory data. First an “as close as on the factory test bench” inlet and exhaust systems geometries were modelled for the simulation.
Correlation process is done following this sequence:
- Engine Friction
- Manifold pressure at highest speed
- Volumetric efficiency
- Cylinder pressure profile
The following figure shows a rather good correlation between the KTM data and the 1D simulation results. Differences are probably due to the missing airbox in the simulation model, thus generating a sharper inlet pressure wave reflection and therefore better volumetric efficiency.
Figure 12.
Correlation of the volumetric efficiency between KTM measurment data and 1D-simulations.
2.7. Acoustic tuning
Even though the engine’s ability to run up to 11’500rpm max engine speed has been set to 6000rpm in order to be representative of a car engine. The minimum engine speed is given by this single-cylinder’s high torsional vibration below 4000rpm. The quality of cylinder charging depends both on the cylinder-duct’s configuration which, when excited at a certain frequency, can resonate and on the gas column in the duct’s vibration mode which, by superimposing on the preceding phenomenon, can increase or reduce the effects of dynamic supercharging [8]. The parameter which influences the duct’s vibration mode is its length. To lower acoustic modes, it must be lengthened. Based on a partially correlated 1D simulation model, DOE is set up. Optimization criteria is set to maximise average power through 4000 and 6000rpm, while varying lengths from 20 to 500mm.The best results are achieved with a 249mm extension pipe placed at the inlet between the airbox and the throttle. On the exhaust side, the primary is extended by 151mm.
3. Tests
3.1. Engine configuration
The project’s scope is to test the engine with gasoline under lambda 1 as a baseline, and then to run lean burn H2 DI with various strategies and compare results. A dedicated engine test bed mounting hardware is built. This installation allows engine position settings in three directions, to set the gearbox’s output aligned with the transmission shaft. The latter was custom-made by Reich Kupplungen. The ECU is changed to fit a MoTeC M142, which has the advantage to be fully programmable and able to run DI and PFI. A new wiring loom is built to fit it. In addition, a Skynam ignition module ensures proper spark control. An enclosed plenum is built to measure airflow, via a damper vessel to which an ultrasonic mass flow sensor is connected. A new exhaust system is made, to free lateral access to the head and incorporate sensors bosses. A resonator is added at exhaust outlet, in order to delimit acoustic length and avoid perturbation from the muffler and a back-pressure flap added to provide engine back pressure during potential future supercharged testing. A modified Jerrycan serves as a fuel buffer tank and incorporates the fuel pump. The coolant circuit is deviated to a wall panoply. Below is a schematic description of the engine configuration.
Figure 13.
Single cylinder engine test bench layout.

3.2. Engine monitoring
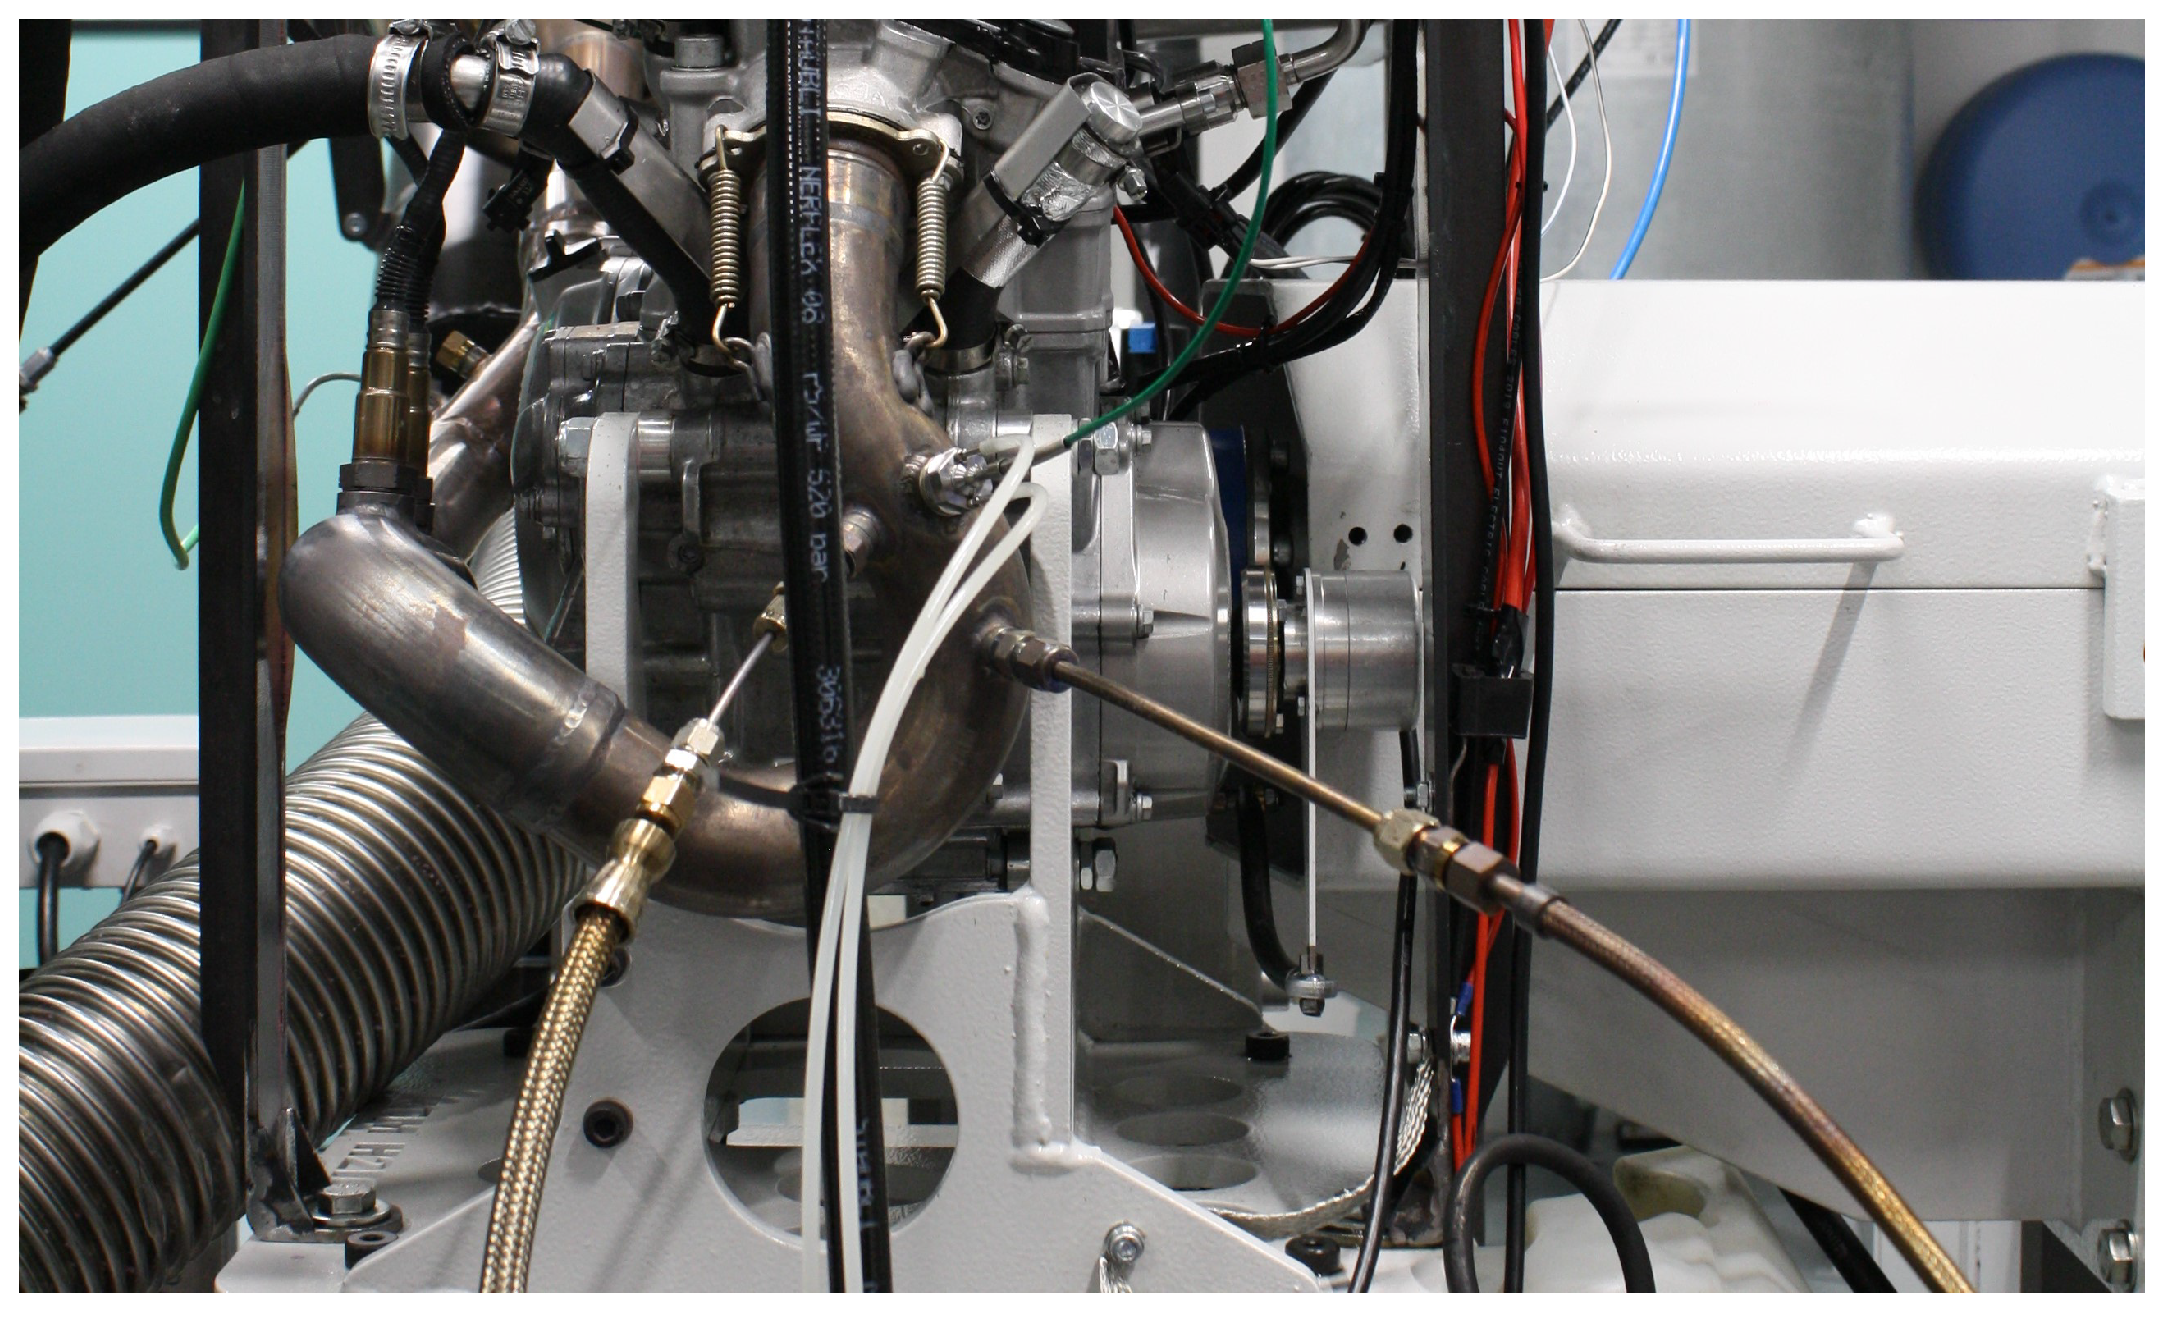
24 additional sensors are fitted on the engine to get the necessary parameters for optimization and model correlation. Several acquisition systems work in parallel. The high frequency acquisition is carried out by a KiBox from Kistler. This system acquires values up to 100kHz. Low frequency measurements are partially made by Kronos via Beckhoff automates from Rotronics (test brake control supplier), LabView via NI automates and MoTeC ECU. Special care is dedicated to HF sensor integration, including the crankshaft encoder as shown in the picture below.
Figure 14.
Engine on the testbench. The encoder is mounted onto the crankshaft thanks to a crank cover modification.
Figure 14.
Engine on the testbench. The encoder is mounted onto the crankshaft thanks to a crank cover modification.
3.3. Testing
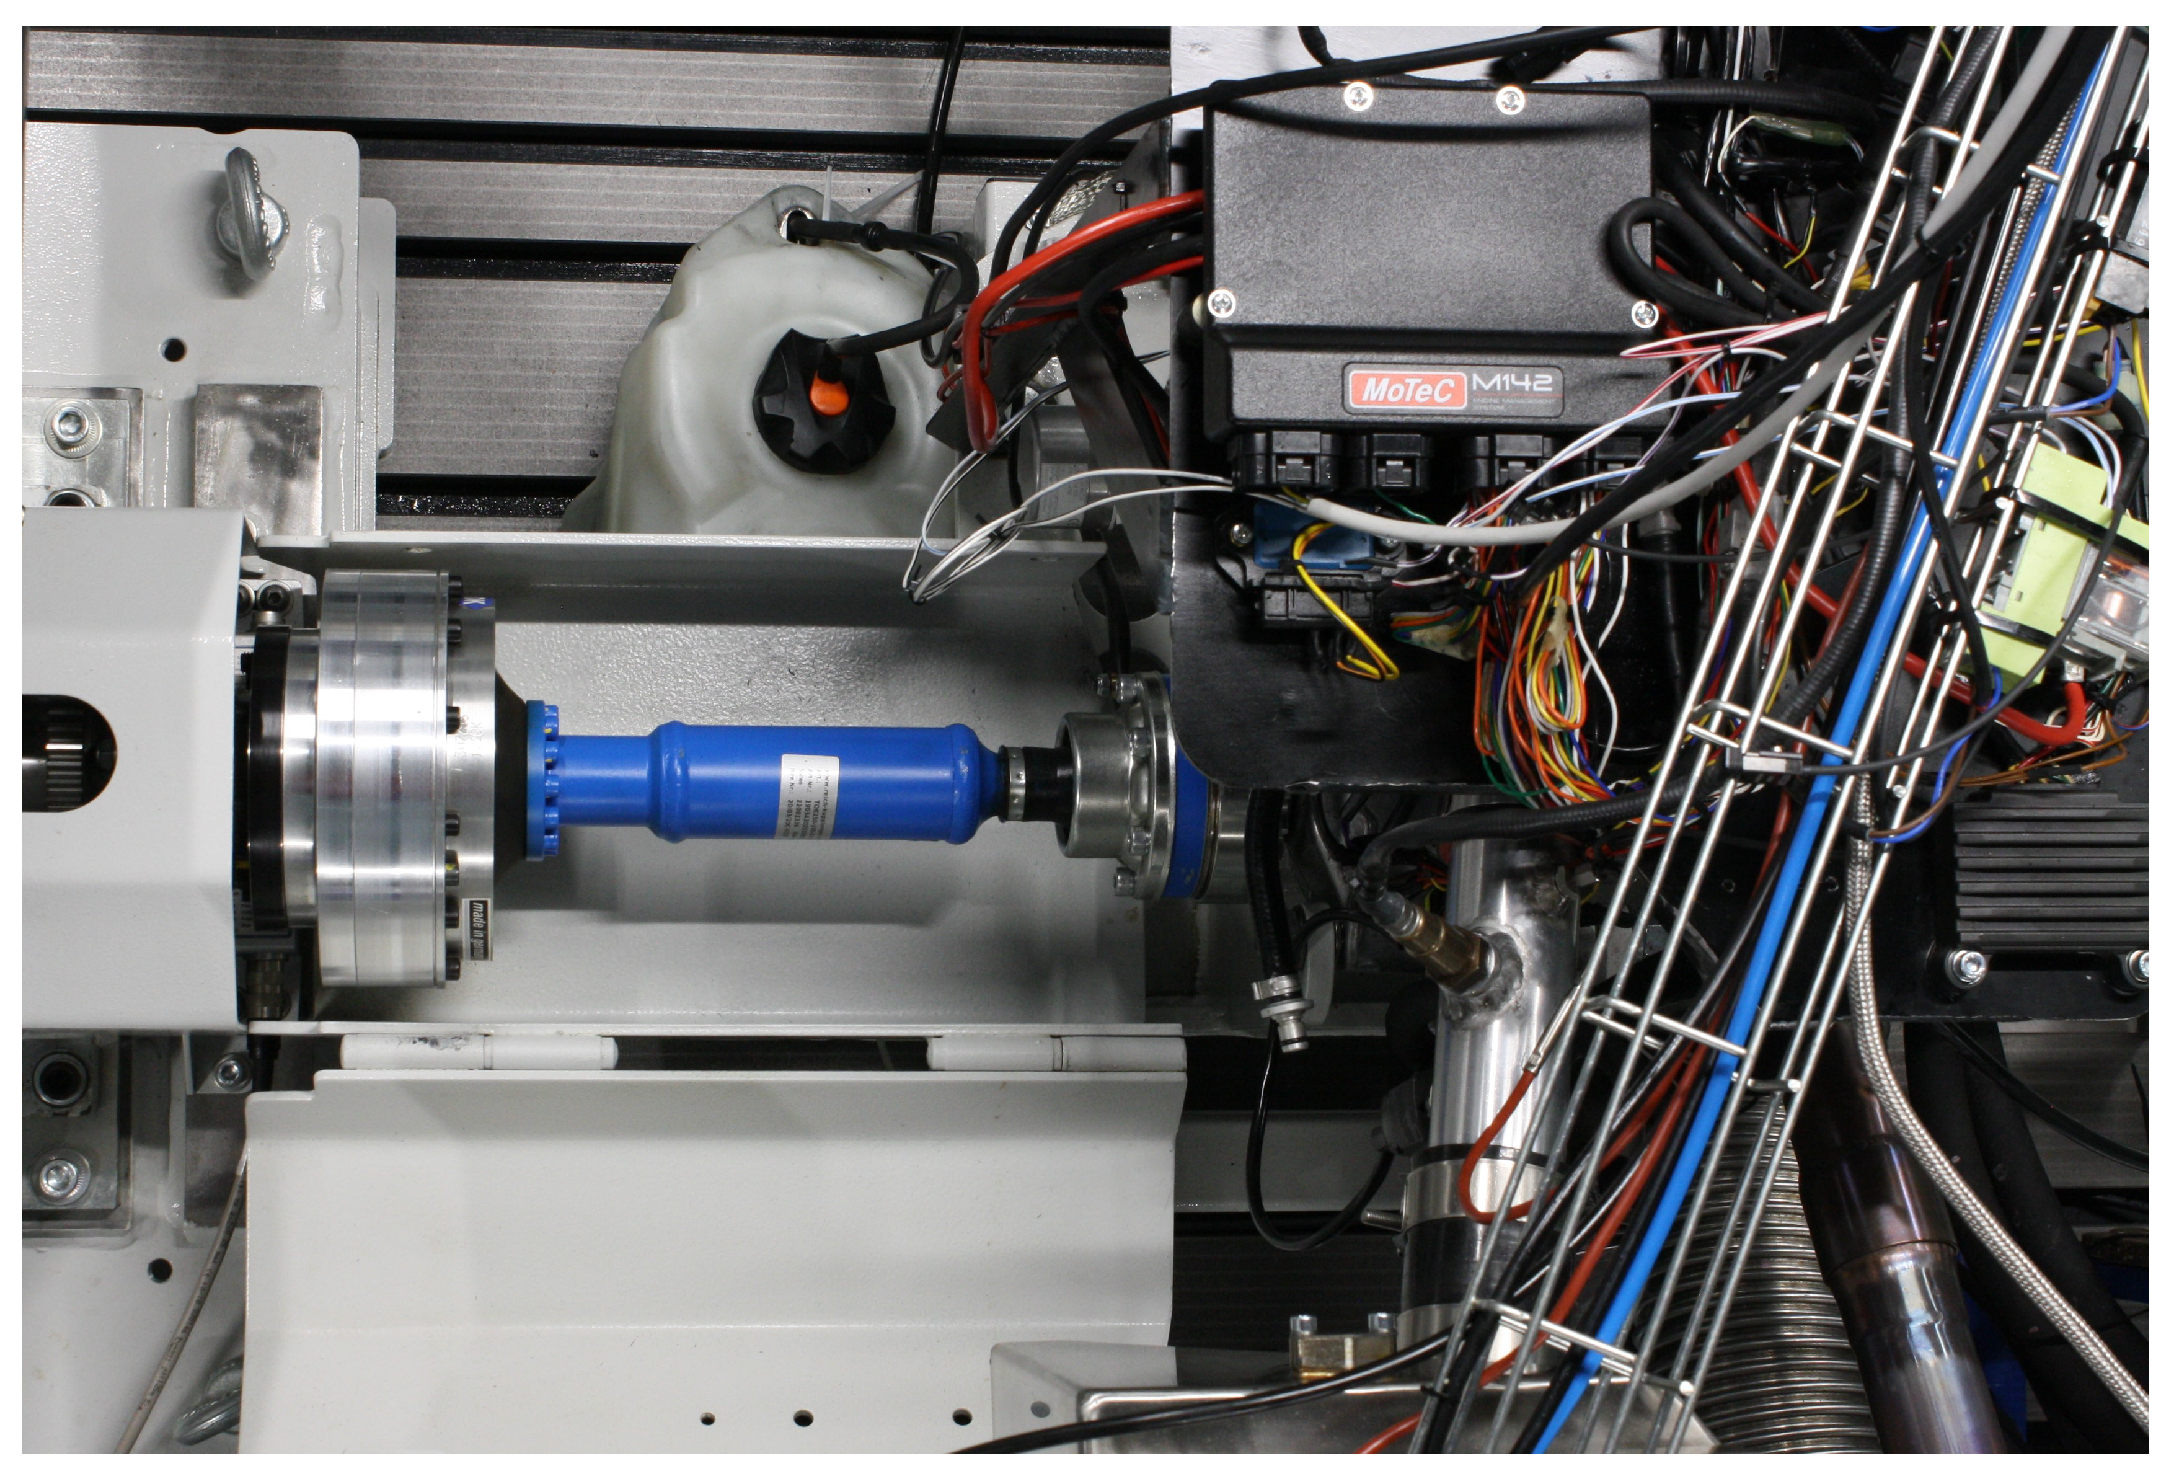
As previously mentioned, the M142 ECU allows to run H2 DI and/or Gasoline PFI injectors by changing the mapping setup.
Figure 15.
Engine on the test bench, with the M142 ECU. The dyno shaft is coupled onto the gearbox (same setup as KTM factory).
Figure 15.
Engine on the test bench, with the M142 ECU. The dyno shaft is coupled onto the gearbox (same setup as KTM factory).
3.4. First runs with hydrogen
As pre-ignition and knocking can occur with hydrogen and inappropriate engine parameters, a rigorous approach is mandatory during initial running with the injection and ignition settings and their optimisation. As the engine is naturally aspirated, the only way to run lean is by reducing the amount of injected fuel (on a supercharged engine it is possible to increase the air mass while keeping the fuel quantity constant). This leads to lower engine power and efficiency as the indicated power to friction power ratio decreases.
3.5. Optimised hydrogen combustion
Different mixture preparation strategies have been tested. Very good results have been achieved with an early start of injection (SOI), enhancing mixture homogenisation, which appears to be better compared to stratification [9] given by a late SOI. The latter seems to generate high NOx emission in the rich areas, which cannot be compensated by the low emissions produced in the lean zones. In parallel, optimisation of the spark plug’s heating value and spark energy have been realised. The final results are shown in the graph below.
Figure 16.
Results after hydrogen combustion optimisation. Engine power and efficiency (relative), NOx emissions (g/kWh) and Euro VI, Euro VII NOx limits.
Figure 16.
Results after hydrogen combustion optimisation. Engine power and efficiency (relative), NOx emissions (g/kWh) and Euro VI, Euro VII NOx limits.

3.6. Comparison with gasoline operation
In order to compare results, baseline gasoline testing have been carried out at the same power level as the one achieved with hydrogen operation. The engine is run with PFI gasoline injection at stoichiometric mixture. For similar power and efficiency levels, the optimised hydrogen operation produces 70 times lower NOx emissions.
4. Conclusions
Two different routes can be taken for hydrogen propulsion. Compared to the fuel cell technology, H2ICE has following advantages :
- Light modifications of existing engines (gasoline or diesel) for hydrogen operation are an interesting route to rapidly decrease the CO2 emissions without high investments, by using standard means of production and already available infrastructures
- Furthermore, as hydrogen with lower purity can be used in an ICE, the fuel cost will be lower. It is worth mentioning that ICE efficiency can match or even be higher than that of the fuel cell at high load [10].
The current work demonstrates the feasibility of converting a gasoline engine into a hydrogen engine and its optimisation potential. Different hydrogen combustion strategies have been tested and optimised. A lean burn mixture with an early start of injection allowed to reach Euro VI and (foreseen) Euro VII emissions level without EATS, while keeping out of pre-ignition and knocking. A comparison with the gasoline baseline engine at similar power and efficiency levels has shown 70 times lower NOx emission for the hydrogen optimised operation. There is a significant further optimization potential which should be investigated during a follow up project. First of all, in addition to further developing the injection and ignition systems, the engine should be supercharged in order to increase power output and thermal efficiency while keeping NOx emissions very low. Other combustion strategies such as EGR should also be investigated. Ignition near flammability limit (with lean mixture or EGR operation) could be improved by using a passive pre-chamber, especially if using a multi-jet configuration. This should also shorten the main combustion duration [11]. The development in these different areas is currently ongoing. Furthermore, the knowledge gained during this project should also allow an efficient conversion of other engine types for different applications.
Author Contributions
Conceptualization, S.G. and C.N.; methodology, S.G. and C.N.; software, N.M.; validation, C.N.,N.M. and L.K.; formal analysis, S.G., N.M. and C.N.; investigation, S.G., N.M. and L.K.; resources, L.K. and N.M.; data curation, S.G., C.N. and N.M.; writing—original draft preparation, S.G.,N.M. and C.N.; writing—review and editing, N.M., L.K. and C.N.; visualization, N.M., L.K. and S.G.; supervision, C.N.; project administration, S.G.; funding acquisition, C.N. All authors have read and agreed to the published version of the manuscript.
Funding
This research project has been funded by the HES-SO University of Applied Sciences and Arts Western
Switzerland (internal project number 94651).
Acknowledgments
We are very grateful to:
- The company KTM AG, which has extensively contributed to this study through sharing of technical information and providing engines and engine parts.
- Prof. Dr. Georg Wälder and his team for the injectors EDM machining and tomography, as well as Prof. Patrick Haas and his team for the injectors flow testing, both from the Institute for Industrial Sciences and Technologies (inSTI) of the HES-SO University of Applied Sciences and Arts Western Switzerland, Geneva.
Conflicts of Interest
The authors declare no conflict of interest.
Abbreviations
The following abbreviations are used in this manuscript:
| Cd | Coefficient of discharge |
| CR | Compression Ratio |
| DI | Direct Injection |
| DOE | Design of experimentation |
| EATS | Exhaust Gas Aftertreatment System |
| ECU | Engine Control Unit |
| FTY | Factory (KTM) |
| H2-DI | Hydrogen Direct Injection |
| HF | High Frequency |
| OEM | Original Equipment Manufacturer |
| PFI | Port Fuel Injection |
| SOI | Start of Injection |
| TDC | Top Dead Center |
| TDCP | Top Dead Center Pumping |
References
- Monney, N.; Andres, L.; Nellen, C. Motorisation à l’Hydrogène des bus de transport public. SFOE project N°155 2022.
- Messner.; Wimmer.; Gerke.; Gerbig, F. Application and Validation of the 3D CFD Method for a Hydrogen Fueled IC Engine with Internal Mixture Formation 2006. [CrossRef]
- Welch, A.; Mumford, D.; Munshi, S.; Holbery, J.; Boyer, B.; Younkins, M.; Jung, H. Challenges in Developing Hydrogen Direct Injection Technology for Internal Combustion Engines; 2008. [CrossRef]
- Lanz, W. Module 3: Hydrogen Use in Internal Combustion Engines. Hydrogen Fuel 2001, p. 29.
- Verhelst, S.; Wallner, T. Hydrogen-Fueled internal combustion engines. Progress in Energy and Combustion Science 2009, 35, 490–527. [CrossRef]
- Szwaja, S. Knock Reduction Measures in the Gas Fuelled Internal Combustion Engine. Science & Technique 2020, 19, 339–348. [CrossRef]
- Grachev, G. Pareto ratio and Pareto principle; 2021. [CrossRef]
- Michel, P. La préparation des moteurs; Auto-Savoir, Editions Techniques pour l’Automobile et l’Industrie (ETAI), 1999.
- Wimmer, A.; Wallner, T.; Ringler, J.; Gerbig, F. H2-Direct Injection – A Highly Promising Combustion Concept; 2005.
- Boretti, A. Hydrogen internal combustion engines to 2030. International Journal of Hydrogen Energy 2020, 45. [CrossRef]
- Biswas, S.; Qiao, L. Ignition of ultra-lean premixed H2/air using multiple hot turbulent jets generated by pre-chamber combustion. Applied Thermal Engineering 2018, 132, 102–114. [CrossRef]
Disclaimer/Publisher’s Note: The statements, opinions and data contained in all publications are solely those of the individual author(s) and contributor(s) and not of MDPI and/or the editor(s). MDPI and/or the editor(s) disclaim responsibility for any injury to people or property resulting from any ideas, methods, instructions or products referred to in the content. |
© 2023 by the authors. Licensee MDPI, Basel, Switzerland. This article is an open access article distributed under the terms and conditions of the Creative Commons Attribution (CC BY) license (http://creativecommons.org/licenses/by/4.0/).
Copyright: This open access article is published under a Creative Commons CC BY 4.0 license, which permit the free download, distribution, and reuse, provided that the author and preprint are cited in any reuse.


