
Submitted:
10 May 2023
Posted:
11 May 2023
You are already at the latest version
Abstract
The Republic of Djibouti is a small country in the Horn of Africa and, as in most developing countries, rain gauges are sparse and data are scarce. This study aims to report on the reliability of gridded precipitation datasets (P datasets) across the Republic of Djibouti through direct comparisons with rain gauge measurements from the annual to the daily time scales. Our specific objective is to be able to use such products in the context of hydrological modeling at a daily time step. Given the scarcity of available data in the Republic of Djibouti, our study was carried out on two time windows (1980-1990 and 2008-2013) and two gauge networks with different spatial resolutions: the southeast of the Republic of Djibouti (5000 km2) and the Ambouli catchment (794 km2), which drains the city of Djibouti. The reliability of these products is analyzed with quantitative metrics and categorical metrics, exclusively at a daily time step for the latter. The performance of the P datasets degrades from the annual time scale to the daily time scale. Even though the same products exhibit the best performance at the various time scales, the performance of most of the products differs from one spatial scale to another. Our results demonstrate the importance of the temporal and spatial windows, as the same products can perform differently according to the scale. For all the spatiotemporal scales, the most reliable product is MSWEP v.2.2. This P dataset is derived from a combination of satellite products (multiple sensors such as infrared and passive microwave), reanalysis products, and rain gauge observations. A strong discrepancy between rain gauge observations and P datasets is revealed according to the categorical metric at a daily time step. The analysis of rainfall events triggering runoff, using a 10 mm rainfall threshold showed that the most efficient products were unable to accurately detect such events at a daily time step, with a significant underestimation of rainfall events higher than 10 mm. None of these products, even the most reliable, can be used for a calibration/validation of a hydrological model at a daily time step.
Keywords:
Djibouti
; rainfall
; precipitation datasets
; categorical metrics
; quantitative metrics
; reliability
; rain gauges
1. Introduction
The Horn of Africa is frequently hit by severe extreme events such as droughts and floods, but its climate remains poorly understood. The plains of Somalia and the Republic of Djibouti are arid, and despite their proximity to the equator, are under a low annual rainfall regime, 60-300mm [1]. Indeed, westerly winds lose most of their moisture after crossing the Sahel and Sudan [2] However, this region presents significant spatial and seasonal contrasts, partly due to its highly varied relief [3].
In the Republic of Djibouti, rainfall events are scarce. These events feed the flow of ephemeral rivers (wadi) and contribute to groundwater recharge but also trigger urban and surface flood hazards (the floods of 2004, 2018, 2019…). More generally, variability in rainfall rate, amount, and distribution substantially determines the Earth’s ecosystem, water cycle, and climate [4]. Therefore, accurate measurement of rainfall is essential to analyze the spatial and temporal patterns of precipitation at different scales and further to understand the impact of rainfall on agriculture, hydrology, and climate.
Conventionally, the ground rain gauge is the most widely used rainfall measurement instrument. This is the most accurate and reliable approach to point measurement of rainfall. However, rain gauge stations in many parts of the world and in most parts of Africa, including the Republic of Djibouti, are scarce and unequally distributed. Therefore, ground rainfall analysis is subject to high uncertainty when based on networks that have a low rain gauge density or are limited to a few isolated rain gauge stations. In this situation, the spatial representativeness of the measurement is closely related to the coverage of the rain gauges.
In this context, gridded precipitation datasets, hereinafter called P datasets, available on the Internet at different spatial/temporal scales offer a convenient alternative [5]. Such products have blossomed since the 1980s and represent a valuable opportunity because they are usually time continuous record, they provide a measurement in any portion of space, and they provide coverage with a daily or even hourly time step.
There are three basics P datasets, defined according to the input data and rainfall data retrieval process: those based on spatial information from rain gauges, those based on reanalysis data derived from physical and dynamic models, and those based on satellite information using passive microwave (PMW) and infrared (IR) information. It should be noted that a lot of P datasets combine the 3 types of data sources to obtain a better assessment.
In many regions of the world such as East Asia [6], South America [7] and West Africa [5,8], P datasets have already shown promising prospects for water resource management by improving the understanding of extreme events (droughts and floods) and of the spatiotemporal variability of precipitation. In East Africa, the use of P datasets has increased in recent years [9,10,11]. In catchments with a limited number of gauges, other studies have reported the need to corroborate the rain gauge measurements with products derived from satellite-based measurements, given their extensive and reliable global coverage [12,13]. Except for large-scale studies that consider the whole of East Africa, there have been very few reports on the spatiotemporal variability of rainfall in the Republic of Djibouti [1,14].
Assowe Dabar [1] provides a description of the spatial and temporal rainfall variability in Djibouti by analyzing monthly and annual rainfall data recorded at 14 stations. Firstly, a regionalization by a Principal Component Analysis is performed in terms of spatial distribution of rainfall, and two zones of seven stations each are identified, located in the west (inland region) and the east (coastal region) of Djibouti, respectively. Secondly, the performance of four gridded datasets of satellite rainfall estimates and of the ERA5 reanalysis data is evaluated on the base of the regionalization in these two zones and at Djibouti-Aerodrome, the longest meteorological record in Djibouti. They conclude that Satellite-based rainfall products with high resolutions and ERA5 reanalysis offer insightful information on the rainfall variations at the spatial scale of Djibouti country.
In semi-arid regions, the relationship between rainfall and runoff is of utmost importance due to the potentially destructive nature of flash floods in these areas. This is especially true in volcanic environments, where the bare surface volcanic soils can exacerbate the effects of flash floods. The scarcity of rainfall events in these regions also means that there are few streamflow events, making it essential to accurately identify and monitor the few events that do occur and provoke significant runoff.
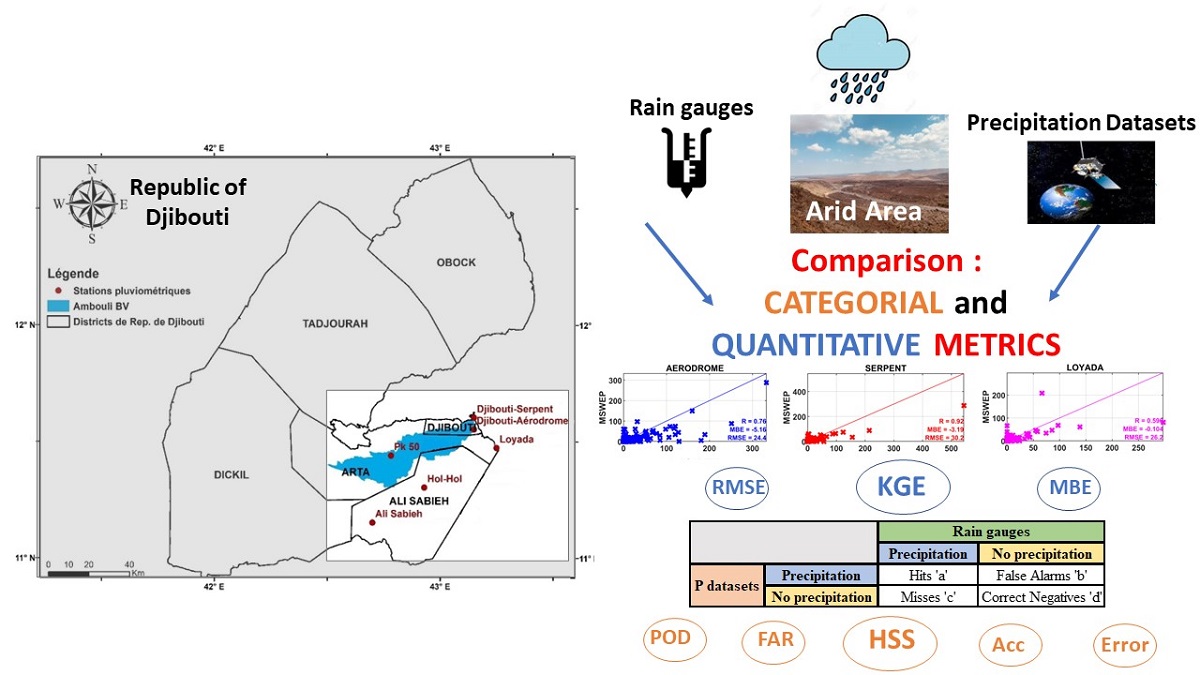
In this study, we aimed to identify the most representative P datasets for hydrological modelling and their usefulness for a specified study area including the Ambouli catchment (794 km2) where pluviometric data are scarce. At the scale of this catchment, some hydrological data have been acquired in the past, but there are no concomitant pluviometric information which does not allow to implement an hydrological model at a daily time step. So, this evaluation will be based on quantitative aspects (quantitative metrics) of rainfall but also on qualitative aspects of rainfall (categorial metrics): detection of days with/without rain. This qualitative aspect of rainfall estimation products is not commonly studied but is important for hydrological modeling of small watersheds that react to rainfall events in a few hours or even days.
2. Study area and Datasets
2.1. Study area
The Republic of Djibouti is located in the Horn of Africa, at the junction of the Gulf of Aden and the Red Sea. The country covers an area of 23,200 km2 and lies between latitudes 10°9’N and 12°7’N and longitudes 41°8’E and 43°5’E. With a geology of volcanic origin, the Republic of Djibouti is characterized by a very steep relief featuring a succession of massifs, plateaus, and plains. The Republic of Djibouti has a semi-arid/arid climate mainly characterized by the irregularity and the weakness of precipitation, the absence of perennial streams, except in the mountainous regions, and a hot temperature year-round: “low” temperatures from October to April (20°C to 30°C) and “high” temperatures from May to September (30°C to 45°C). These climatic conditions are responsible for strong water evaporation of about 2,000 mm/year (potential evapotranspiration), which severely affects both pasture and the soil [15].
2.1.1. Southeast of the Republic of Djibouti
Assowe Dabar [1] regionalized the climate of the Republic of Djibouti on the basis of an analysis of precipitation and obtained two clusters, EAST and WEST (Figure 1a). The EAST zone concentrates most of the population and economic exchanges between Djibouti and its neighboring countries (Figure 1b). Therefore, our study focuses on the southeast part of the country, near Djibouti. Southeast area is about 5000 km2. Its proximity to the Red Sea and Gulf of Aden drives most of the rainfall variability [1].
In the EAST zone, as in most of East Africa, it rains mainly in March-May (MAM) and October-December (OND). There are several hypotheses on the origin of these rains. During the transitional months (January and February), it is thought that these rains are associated with rare occurrences of tropical disturbances from the northwestern Indian Ocean, and in the winter, it is thought that they come from higher altitudes [1,16]
2.1.2. Catchment of the Ambouli Wadi
Inside the southeast region, we focus on the catchment of the Ambouli wadi, which is one of the country’s largest catchments (794 km²) and is of major importance (Figure 1c). The Ambouli aquifer is the main source of drinking water for the city of Djibouti.
Despite the importance of the catchment for the development of Djibouti City, it has been the subject of only a few scientific studies. Moreover, the increase in the population has been accompanied by a greater sprawl of Djibouti City [17]. Urbanization leads to greater sealing of the catchment, which modifies the quality of water seeping into the aquifer and affects aquifer storage, but above all increases the frequency and magnitude of floods. Seyoum [18] have shown these effects in various East African countries such as Kenya and Ethiopia. The frequency of extreme flood events in Djibouti City has been increasing over the last two decades. The events of the years 2004, 2013, and 2018 were responsible for much economic and human damage [14,19].
2.2. Datasets
2.2.1. Rainfall Estimate Products (P Datasets)
The P-dataset products were selected based on their availability in the two study areas and their relevance for operational research focusing on hydrology and/or agronomy [8]. To be relevant for the target application, products need a daily or sub-daily temporal resolution. Table 1 describes the 21 products. It should be noted, however, that the GPCC product has a monthly temporal resolution. Among the 21 products analyzed and compared to the rain gauge data, there are 15 long-term P datasets with more than 30 years of continuous observations and 5 P datasets spanning more than 15 years. For the southeast, the analysis is carried out on 15 long-term P datasets, and for the Ambouli catchment, 11 P datasets (Table 1).
2.2.2. Rain gauges of the National Meteorological Agency
At this scale, we will be working at monthly to annual time steps, except for Djibouti-Aerodrome where we will also be working at the daily time step. There are 14 rain gauge stations located in the southeast of the Republic of Djibouti managed by the Agence Nationale de la Météorologie de Djibouti (ANM). However, the main weakness of the rain data available from this network is the gaps in the time series. Based on the criteria of having more than 10 months of data per year, a total of 5 rain gauges were selected for analysis, namely Djibouti-Serpent, Djibouti-Aerodrome, Ali-Sabieh, Hol-Hol, and Loyada (Figure 1b). These are tipping-bucket rain gauge. For the comparison with the 15 P datasets, the common period of analysis will be 1980-1990. At the daily time step only the Djibouti Aerodrome rain gauge is available for the southeast for the period of analysis (1981-2010).
2.2.3. Rain gauges of the Early Warning System
Following the catastrophic floods in Djibouti City in 1994 and 2004, the government of the Republic of Djibouti has set up protective measures. These measures included the installation of the USAID-funded Wadi Ambouli Flood Monitoring and Alert System (RACA). This system was installed in the Ambouli catchment between February and March 2008. The hydrogeology and hydrology laboratory of the CERD (Centre d’Etudes et de Recherches de Djibouti) managed this network of 7 rain gauge stations (Figure 1c) until 2015. These are tipping bucket rain gauges. For some of them, rainfall is measured at a sub-daily time step with no long periods of missing data (less than ten days per month and less than four months per year missing). For the comparison with the 11 P datasets, the common period is 2008-2013
2.2.4. Selected rain gauges and common periods of study
3. Methodology
3.1. Pre-processing (pre-treatment)
Since the selected P datasets differ in spatial resolution, from 0.0375° for TAMSAT v.3 to 1° for GPCC v.7, all the datasets used in this study were resampled to a spatial resolution of 0.1° by 0.1° for easy comparison. The P datasets with a spatial resolution > 0.1° (PERSIANN-CDR, ERA-5, MERRA-2…) were downscaled to 0.1° using nearest neighbor, while the dataset with a spatial resolution < 0.1° (CHIRPS, TAMSAT…) was uscaled to 0.1° using bilinear interpolation[5,37] Moreover, some of the datasets are at the daily time step, while others are at the sub-daily time step. In order to obtain homogenous data, we aggregated the sub-daily data at the daily time step over the study period.
3.2. Approach
This study assesses the performance of 21 P datasets at different temporal resolutions including daily, monthly, seasonal, and annual time scales as summarized the Figure 2. The evaluation is conducted on two distinct spatial scales and over two time periods: first, the southeast zone of the Republic of Djibouti using 15 long-term P datasets for the common period of 1980-1990, and the Ambouli catchment area using 11 P datasets for the period of 2008-2013. The prerequisite for the choice of comparison period was that the period be common to all the P datasets and all the rain gauge data. It is worth noting that the 5 P datasets used in both analysis areas bring the total number of P datasets to 21. The choice of P datasets for the southeast zone was based on their availability over the selected period, while the selection for the Ambouli catchment was based on their spatial resolution, which needed to be less than or equal to 0.1.
The validation of the P datasets was carried out on two spatially aggregated levels: point-to-pixel and catchment scale. The point-to-pixel scale is a pairwise comparison of the rain gauge data from the ground station with the corresponding gridded precipitation value.
The catchment-scale validation analysis was performed by comparing spatially aggregated P datasets for the catchment to a corresponding interpolated rainfall based on the ground reference rainfall. The catchment spatial unit is particularly relevant for characterizing rainfall because it represents the conventional working unit for hydrological applications. At the same time, and as suggested by Xie and Arkin [38], aggregation on a larger scale enhances the stability of the precipitation validation exercise. For the interpolation of the mean annual rainfall at the catchment scale, we used the Inverse Distance Weighting [39] spatial interpolation method. This is a local deterministic interpolation technique that calculates the value of a point by averaging the values of the neighboring points weighted by the inverse of the distance to the calculated point: the closer the points, the greater the weight assigned.
3.3. Metric validation
To assess the ability of P datasets to estimate the amount of ground reference rainfall, the metric analysis includes detailed quantitative and categorical metrics. Although a wide range of evaluation metrics are available to assess data performance [4,40,41,42], there is no single metric that encapsulates all the aspects of interest. For this reason, it is useful to consider several performance metrics and understand the type of information or insight they might provide [43].
3.3.1. Quantitative metrics
Three quantitative metrics were used for all the time steps (Table 3):
- The Root Mean Square Error (RMSE) is a frequently used measurement of the difference between two variables. It measures the average magnitude of the estimation errors: low RMSE values indicate a low variance in the P datasets. To calculate the RMSE, we used the median value of a P dataset.
- The Mean Bias Error (MBE) is used to estimate the average bias in the P datasets and provides a good indication of the mean under- or overestimation of the predictions. A positive value of MBE means an overestimation. To calculate the MBE of a P dataset, we used the median value.
- There are several indices used to evaluate the performance and reliability of P datasets over time. We used the Kling-Gupta Efficiency (KGE) because water resource management requires reliable representation of precipitation temporal dynamics (measured by r) and volume (measured by and ) [5]. However, for this study we will only analyze the value of the KGE in its totality. Thus, the median value of the KGE is used as a reliability criterion at the scale of the study area.
In Table 3, x corresponds to the ground reference rainfall and y corresponds to the rainfall of the P datasets.
is the Pearson correlation coefficient and is used to evaluate the goodness of fit of the P-dataset estimations to the observed data.
is the ratio between the averages of the P datasets and of the observed data.
is the ratio between the coefficients of variation of the P datasets and of the observed data.
3.3.2. Categorical metrics
The performance of the P datasets was also analyzed using categorical metrics at the daily time step [5]. Five statistical indicators based on a contingency table (Table 4) were computed to constitute the categorical metrics (Table 5):
- The probability of detection (POD) indicates what fraction of the observed events was correctly estimated.
- The false alarm ratio (FAR) corresponds to the proportion of events identified by the P datasets but not confirmed by gauge observations.
- The accuracy measures the proportion of correct decisions.
- The error measures the proportion of incorrect decisions.
- The Heidke skill score (HSS) evaluates the ability of the P datasets to detect precipitation events in comparison to a random prediction. The HSS values range from -∞ to 1, with a perfect score of 1 and negative values indicating that random prediction outperforms the P dataset.
The HSS value was computed at each grid-cell location to observe P-dataset reliability over space.
4. Results
The performance of the P datasets was evaluated using the quantitative metrics (i.e. KGE, RMSE and MBE) and categorical metrics (i.e. POD, FAR, Accuracy, Error, and HSS) at the annual, seasonal, monthly, and daily temporal scales.
4.1. Annual comparison
4.1.1. Southeast of the Republic of Djibouti (1980-1990 / 15 P datasets)
The KGE values reveal strong agreement with the rain gauge data for some of the P datasets (Figure 3). Eight of the P datasets (CPC, ERA5, EWEMBI, GPCC, JRA-55 Adj, MERRA-2 PT, MERRA-2 PTC and WFDEI-GPCC) overestimated rainfall (positive MBE). Five P datasets have high KGE values: EWEMBI, GPCC, JRA_55 Adj, MSWEP v.2.2 and WFDEI-GPCC. These five P datasets also have the lowest RMSE values (between 75 and 100 mm per year). Moreover, WFDEI-GPCC is the best among all the P datasets (using the KGE performance criterion), with the most satisfactory values of MBE and RMSE, while MERRA-2 PTC and ERA 5 have the worst performance. It is worth mentioning that the Loyada rainfall station has the lowest values of KGE except for TAMSAT and WFDEI-CRU (Figure 3).
4.1.2. Ambouli Catchment (2008-2013 / 11 P datasets)
The Figure 4 shows the interpolated average annual precipitation of the 11 P datasets compared to the average annual precipitation of the rain gauge stations. We first notice that the general west-east rainfall gradient, which is characterized by a decrease in mean annual rainfall, was captured by most of the analyzed products. IMERG-LR presents the highest annual average (308 mm year-1, with a standard deviation of 25 mm year-1) and GSMaP-Adj the lowest (79 mm year-1, with a standard deviation of 17 mm year-1), which corresponds to a wide range of annual rainfall from 79 to 308 mm. The average annual rainfall according to the rain gauge stations is 90 mm year-1. We have thus identified the 4 P datasets out of the 11 that present the lowest standard deviation in terms of annual mean (ARC2, CHIRPS, GSMaP-Adj and MSWEP v.2.2), with MSWEP v.2.2 the most reliable product compared to the rain gauge stations (with a slight overestimation of the annual rainfall values by 10%). MSWEP v.2.2 product remains effective at both scales. The least performing products are the IMERG products (ER, FR and LR).
4.2. Seasonal comparison
4.2.1. Southeast of the Republic of Djibouti (1980-1990 / 15 P datasets)
The climate of the country is characterized by two distinct periods:
- a wet period from October to April that is characterized by low but friendly temperatures (between 22 C and 30°C) and a relatively high humidity
- a dry period that results in high temperatures (between 30°C and 40°C) and a sandy wind, dry and hot (locally called the Khamsin) which runs from May to September [44].
Figure 5 presents the metric validation at the seasonal scale. We observe that 80% of the P datasets perform better during the wet season than during the dry season. Like for the annual time step, EWEMBI, GPCC, JRA-55 Adj, MSWEP v.2.2 and WFDEI-GPCC are the best-performing P datasets.
The KGE values of these five P datasets vary considerably, around 0.5 for the wet season and much lower for the dry season. For all the P datasets, the RMSE values for the wet season are on average more than three times higher than for the dry season. The MBE values show that the five P datasets generally overestimate the rainfall (positive MBE values), but we do observe two underestimated values, corresponding to MSWEP v.2.2 (wet season) and WFDEI_GPCC (dry season).
WFDEI-GPCC is the most reliable product at the seasonal scale (wet and dry periods). MERRA-2_PTC is the least accurate product, with high RMSE and MBE values and a KGE value lower than 0.2 (Figure 5).
4.2.2. Ambouli Catchment (2008-2013 / 11 P datasets)
Just like in the seasonal analysis for the southeast of the country, in the Ambouli catchment:
- The P datasets mainly overestimate the seasonal rainfall but perform better in the wet season than in the dry season.
- CHIRP and CHIRPS perform better in the dry season but have a low KGE value around 0.2.
However, contrary to the above seasonal analysis, the RMSE values for the dry season and for the wet season have an almost identical mean, which means that for this period, we have a rainy season spread over both the wet and dry periods.
We also notice that the best performing products at the seasonal time step are GSMAP-RT and MSWEP v.2.2, which are the same as for the annual time step.
4.3. Monthly comparison
4.3.1. Southeast of the Republic of Djibouti (1980-1990 / 15 P datasets)
The metrics are listed in Table 6. Strong agreement with the rain-gauge data is observed for some of the P datasets. At the monthly time step, we observe results similar to those obtained at the previous time step (Figure 3):
- EWEMBI, GPCC, JRA-55_Adj, MSWEP v.2.2 and WFDEI_GPCC, the five most reliable P datasets at the previous time step, show the best statistical scores at the monthly time step (Figure 3).
- WFDEI_GPCC has the best performance (KGE=0.70, RMSE = 19.61 mm month-1 and MBE= 1.27 mm month-1).
- MERRA-2 PTC is the least reliable product.
- Loyada is the rain gauge station that presents the least satisfactory KGE values.
4.3.2. Ambouli Catchment (2008-2013 / 11 P datasets)
Table 7 shows the values obtained for the quantitative metrics at the monthly and daily time steps. MSWEP v.2.2 have the highest KGE (0.32), the lowest RMSE (15.5 mm.month-1) and the lowest MBE (near to 0 mm month-1). This product also has the best performance at the annual and seasonal time steps. On the contrary, the IMERG products (ER, FR and LR) show the least satisfactory results, with a negative KGE value and the highest RMSE and MBE values, like for the previous time step. At the monthly time step, the KGE values obtained for the southeast of the country are higher than those obtained for the Ambouli catchment (0.70 versus 0.35 for the most reliable P datasets).
Only MSWEP v.2.2 remains effective for both spatial resolutions and temporal windows, as well as for the previous time step.
4.4. Daily comparison
4.4.1. Southeast of the Republic of Djibouti: Djibouti-Aerodrome rain gauge (1981-2010 / 15 P datasets)
For the daily time step analyses, we use data from the only Djibouti-Aerodrome rain gauge for the period 1981-2010, which is the common period between the station and all the P datasets. The GPCC product is not present in the analysis of the daily time step data because it has a monthly temporal resolution.
The ability of the P datasets to quantify the amount of daily precipitation is relatively low, with most products having negative KGE values (Table 6). Only the most reliable products at the previous time step, EWEMBI, JRA-55_Adj, MSWEP v.2.2, and WFDEI_GPCC, have positive KGE values. With regard to MBE, the values are relatively homogeneous for all the products (from -0.13 mm to 0.42 mm). The low values of MBE and RMSE are due to the low number of rainy days (i.e. with a rainfall of > 1 mm day-1).
Table 8 shows the results of the POD, FAR, Accuracy, Error and HSS metrics. Some values such as POD, Accuracy and Error give "relatively good" values but are in fact largely skewed due to the very few rain events observed. For the POD, the P datasets MERRA-2 (PT and PTC) and ERA5 (the worst performing products at the previous time steps) detect almost no rainy days, which explains the almost good POD values for these products. EWEMBI, JRA-55 Adj, and WFDEI-GPCC provide a satisfactory POD of > 0.7. For the FAR, we observe relatively high values for the products (FAR > 0.9 except for CHIRPS, which presents a FAR of 0.75). For the Accuracy and Error, the results are moderately satisfactory for most of the products; however, like for the FAR values, the CHIRPS product has the best Accuracy and Error. Indeed, compared to rainfall data, these products detect events rather well when they occur (POD and accuracy) but they detect much more events than in reality (FAR and Error). Compared to the other products, MSWEP has however a poor POD.
The HSS values for all the products are very low (almost zero). The highest HSS score was obtained by CHIRPS (HSS = 0.19). Given the number of non-rainy days, it seems necessary to set a threshold value (rainfall threshold). Thus, several threshold values ranging from 1 mm to 50 mm were applied to the products for the calculation of HSS [5], and the maximum HSS was obtained with a threshold value of 1 mm. After applying the threshold value of 1 mm, we observe that the HSS values are higher, this probably shows that there are more detected rainfall < 1mm and the products with the best performance are the same as at the annual and monthly time steps (EWEMBI, JRA-55 Adj, MSWEP v.2.2 and WFDEI-GPCC), as well as CHIRPS. Therefore, the optimum of the "threshold HSS" is HSS > 1 mm, which probably shows that there is limited concomitance between the P-datasets and the observed data for the extreme rainfall events (this analysis is more detailed in the next paragraph).
With an average annual rainfall of 150 mm at the Djibouti Aerodrome station, the average number of rainy days is 12 days (higher than 1 mm). However, the most efficient products at daily time step, MSWEP, CHIRPS, and JRA-55 give an average of 16, 21, and 24 rainy days respectively (for rainfall higher than 1 mm). In contrast, the other products provide results with an average of more than 40 days (with a maximum of rainy days for the MERRA-2 product with 86 rainy days on average).
To complement this analysis, we also investigated the ability of these P-datasets to detect rainfall events triggering runoff. For this purpose, a threshold of rainfall greater than 10 mm (which corresponds to an average of 3 events per year) was used. The percentage of concomitant rainfall days was calculated for each P dataset, with values ranging from 44% for MSWEP to 80% for EWEMBI for the efficient products.
After obtaining the concomitant day values, we analyzed the concomitance of the rainfall values and observed that, on average, 95% of rainfall events higher than 10 mm are significantly underestimated by the P datasets. There was no concomitance observed between the P datasets and extreme rainfall values (greater than 50 mm). These results highlight the limitations of these P-datasets for rainfall-runoff modeling at a daily time step and underscore the need for further research to develop more accurate and reliable rainfall datasets for high flood forecasting in semi-arid regions.
4.4.2. Ambouli Catchment (2008-2013 / 11 P datasets)
Similarly to the daily analysis in the southeast, the ability of the P datasets to quantify the amount of daily precipitation is relatively low. In terms of the KGE values (Table 7), only GSMaP-RT and MSWEP v.2.2 (the best-performing P datasets at the previous time steps) present values greater than 0.3. These values are homogenous with those obtained at the previous time step. The RMSE and MBE values of these two products are satisfactory, with an MBE close to 0 mm and an RMSE close to 2 mm.
To complement the analysis of the quantitative metrics, we analyzed the selected categorical metrics (Table 9):
- The POD and FAR values are mainly high because a mean of 11 rainy days was recorded per year at the Ambouli catchment (these results are in agreement with the results obtained in the southeast of Djibouti), and rainfall estimation products in general overestimate the number of rainfall event in an arid environment, which results in FAR values close to 1 (optimum 0).
- The Accuracy and Error values for the P datasets (other than the CHIRP product) are respectively on average close to 0.9 and 0.1. These values are satisfactory.
- It is the HSS that allows us to quantify the reliability of the P datasets in reproducing daily rainfall. We note that the values of HSS without a threshold value are almost zero, while the values of HSS with a threshold at 1 mm are higher (for some products values close to 0.3), which agrees with the study conducted by Satge [5] and the point-to-pixel analysis (southeast of the Republic of Djibouti). The highest scores in terms of HSS, with a threshold of > 1 mm, were obtained by GSMaP-RT, MSWEP v.2.2 and CHIRPS. Therefore, the results obtained in the Ambouli catchment, are similar to those obtained in the southeast zone.
5. Discussions
In recent years, the use of P datasets has been increasing in areas with a low rainfall network density due to the ease of access to data and the spatial coverage of these products.
In this study, some P datasets provide good performance at all time steps. For the southeast of the Republic of Djibouti, three out of five of the best-performing products (EWEMBI, JRA-55 Adj and WFDEI-GPCC) are reanalysis products that are merged with gauge-based information. For the Ambouli catchment, the best-performing P datasets are satellite-based products that are merged with gauge-based information (except for GSMaP-RT, which is a pure satellite product). Thus, the best-performing products are those that integrate rain gauge information into their algorithm, which confirms the previous results obtained in Africa [8,45,46] and other regions of the world [37,47,48].
For this study, CHIRPS performs better than CHIRP at all time steps. However, GSMaP-RT outperformed its adjusted version, GSMaP-Adj, at the monthly and daily time steps. This result is consistent with previous observations over the CONUS (CONtiguous US), [5,37] and illustrates the potential limit of P-dataset algorithms to consider the best gauge data. GSMaP-RT v.6 is the only P dataset with no gauge-based information that ranks in the top two monthly and daily at the catchment scale. Therefore, GSMaP-Adj v.6 should be highly effective if it used gauge-based information in the optimal form [5].
Only MSWEP v.2.2 P is reliable at all time steps and for both time periods considered. The strong performance of MSWEP v.2.2 might be due to the integration of daily gauge observations for the calibration of rainfall estimates [11,32,37]. In comparison to the rain gauge of Djibouti-Aerodrome, this product underestimates heavy rainfall and overestimates light rainfall, but still manages to detect the rainy days. CHIRPS is among the best products at the daily time step over the two periods of the study. These results agree with several comparative studies from the East African region [49]. However, for most of the P datasets, there is a degradation in the performance from the annual to the lower time steps.
It is advisable to be attentive to the P-dataset version. Our results show that MSWEP v2.2 has a better performance in terms of rainfall data accuracy. This best identified product MSWEP v2.2 has a newer version, MSWEP v2.8. One could have expected performance increasing with version. But, when analyzing the rainfall distribution, MSWEP v2.2 shows a better fit to the observed data than MSWEP v2.8 [50]. In addition, we find that MSWEP v2.2 provides more consistent data for semi-arid areas exhibiting low rainfall, in contrast to MSWEP v2.8 which shows inconsistencies in these areas. MSWEP v2.2 outperforms the new MSWEP v2.8 version for estimating rainfall data in semi-arid regions. These results highlight the importance of continuous evaluation of rainfall data models to assess their performance and accuracy.
According to Satge [5] and Omonge [11], products dedicated to the African continent (TAMSAT and ARC-2) do not always perform well. For the southeast of the Republic of Djibouti, our results confirm this low performance (KGE and HSS) over the years 1980-1990. However, ARC2 is in the top three over the period 2008-2013 at the catchment scale at the annual and monthly time steps and gives satisfactory results at the daily time step (ranked 4/11 in terms of performance). Therefore, as for most P datasets, the use of a new rainfall estimation algorithm may be advantageous, but it may not be the case depending on each model. It would be recommendable to select a set of fairly well performing models (and not only just the best one), and test the performance of the last two versions of the same models, in order to span the possible optimal point of representativeness of rainfall products. This method should be continued in the future on the region for assessing the progress of models in representing the rainfall variability.
This study focused on long-term P datasets, but also on more recent P datasets (created in the 2000s) at the catchment scale. More recent products perform better than those incorporating historical data into their database (except for MSWEP v.2.2), which is probably due to the fact that the most recent products integrate new innovations (high-definition satellite images, new passive microwave sensors) into their algorithm.
6. Conclusion
Our objective was to determine the best performing rainfall estimation products in the study area for use in supplementing the limited data available for use in hydrologic modeling. To achieve this objective, we compared the performance of different rainfall estimation products using two types of metrics: quantitative (KGE, RMSE and MBE) and categorical metrics (POD, FAR, Accuracy and error). The quantitative metrics measured the accuracy of rainfall estimation in terms of numerical values. The categorical metrics, on the other hand, were used to evaluate the ability of the rainfall estimation products to correctly detect rainfall events. The use of categorical metrics was particularly important in our study, as it allowed us to better evaluate the ability of the different rainfall estimation products to reproduce the temporal variability of rainfall. We compare P datasets to rain-gauge data at two spatial resolutions (southeast of the Republic of Djibouti and the Ambouli catchment) over two temporal windows (1980-1990 / 2008-2013).
For the southeast of the Republic of Djibouti, at the point-to-pixel scale, five P datasets present high KGE values at the annual and monthly time steps: EWEMBI, GPCC, JRA-55 Adj, MSWEP v.2.2 and WFDEI-GPCC. At the seasonal time step, all the P datasets reproduce the seasonality relatively well but overestimate the precipitation amounts. At the daily time step, the five best products in terms of KGE and HSS are CHIRPS, EWEMBI, JRA-55 Adj, MSWEP V.2.2 and WFDEI-GPCC. The least effective products are the MERRA-2 products (PT and PTC) and the IMERG products (ER, FRand LR).
At the scale of the Ambouli catchment, the best products are: At annual and seasonal time scales, in terms of average annual rainfall over the catchment: MSWEP v.2.2, GSMaP-Adj, ARC2, and GSMaP-RT. At monthly time scale, in terms of KGE value: MSWEP v.2.2, GSMaP-RT, ARC2 and GSMaP-Adj. At daily time scale, in terms of the metrics used (KGE and HSS): MSWEP v.2.2, GSMaP-RT, and CHIRPS.
Despite a sparse rainfall measurement network and often discontinuous data, some observations emerge from the analyses. The performance of the P datasets degrades from the annual time scale to the daily time scale. The performance of most of the products also differs from one spatial scale to another. Our results demonstrate the relevance of considering different temporal and spatial windows and illustrates that a given P dataset performs differently according to the spatiotemporal scales.
Strong discrepancies between rain gauge observations and P datasets are illustrated. However, MSWEP v.2.2, GSMaP-RT and CHIRPS products can be used to indicate an order of magnitude of rainfall in the southeast area of Ambouli, especially if we consider long inter-annual series. MSWEP v2.2 outperforms the new MSWEP v2.8 version for estimating rainfall data in semi-arid regions. These results highlight the importance of continuous evaluation of rainfall data models to assess their performance and accuracy.
Nevertheless, even the most effective products are not suitable for flood forecasting using rainfall-runoff models at the daily time step. This is supported by our analysis of categorical metrics and the concomitant rainfall days. While some products, such as CHIRPS and MSWEP v2.2, showed better performance in terms of overall rainfall detection and days of concomitant rainfall, they still fell short in accurately predicting extreme rainfall triggering floods.
While the performance of some of the P-datasets is acceptable at the monthly and annual time steps, the poor performance at the daily time step is a major limitation for our study. This finding highlights the need for developing more accurate and reliable P-datasets that can capture the spatiotemporal variability of daily rainfall in the region and especially the highest events. In addition, further research is needed to investigate the factors that influence the performance of P-datasets in the region, such as the impact of topography, land cover and land use.
Overall, our study provides important insights into the limitations of P-datasets for flood forecasting in the Ambouli catchment and underscores the need for continued efforts to improve the accuracy of rainfall data for hydrological applications. In conclusion, while P-datasets are useful tools for studying precipitation patterns and trends, they should be used with caution for flood forecasting in semi-arid regions. Local data sources and more sophisticated modeling approaches are necessary for accurate and reliable flood prediction in these vulnerable regions.
Author Contributions
GMO did the conceptualization, the methodology, data collection, data analysis, writing and editing. JEP did the methodology, supervision, data analysis, writing/reviewing and editing. CS did the supervision, methodology, data analysis, writing and editing. GM did the supervision, methodology, data analysis, writing and editing. MJ did the resources, the data analysis, review writing and editing. FS did the methodology and data collection. MIN did the data collection. All authors have read and agreed to the published version of the manuscript.
Funding
This research was funded by the Campus France (Bourse doctorale du gouvernement français), the Centre d'Etudes et de Recherches de Djibouti (CERD), and Ecole Doctorale GAIA
Data Availability Statement
The data used are from the databases of the Centre d’Etudes et de Recherches de Djibouti (CERD) and the Agence Météorologique Nationale (ANM) are available on request from these institutions. Concerning the data of the rainfall estimation products, they are available in the official sites of the rainfall products mentioned in Table 1.
Acknowledgments
The authors would like to thank the National Meteorological Agency (ANM) of the Republic of Djibouti for providing the observation data. The authors also thank the Centre d'Etudes et de Recherches de Djibouti (CERD) for its financial support and for the use of the early warning system data.
Conflicts of Interest
The authors declare no conflict of interest.
References
- Assowe Dabar O, Camberlin P, Pohl B, Mohamed Waberi M, Osman Awaleh M, Silah-Eddine S. Spatial and temporal variability of rainfall over the Republic of Djibouti from 1946 to 2017. Int J Climatol, 2021,41, pp. 2729–2748. [CrossRef]
- Djama, M. Trajectoire du pouvoir en pays somali. In: Cahiers d’études africaines. La Corne dans tous ses États, 1997, 37(146), pp. 403-428. [CrossRef]
- Camberlin., P. Les précipitations dans la Corne orientale de l’Afrique: Climatologie, variabilité´ et connexions avec quelques indicateurs oceano–atmospheriques. PhD Thesis. Université de Bourgogne, Dijon, France, 1994.
- Ayehu G.T., Tadesse T, Gessesse B, Dinku T. Validation of new satellite rainfall products over the Upper Blue Nile Basin, Ethiopia. Atmos. Meas. Tech, 2018, 11, pp. 1921–1936. [CrossRef]
- Satge, F., Defrance, D., Sultan, B., Bonnet, M-P., Seyler, F., Rouché, N., Pierron F., Paturel, J-E. Evaluation of 23 gridded precipitation datasets across West Africa, J.Hydrol, 2020, 581,124412. [CrossRef]
- Yuan, W., Yu, R., Zhang, M., Lin, W., Chen, H., and Li, J. Regimes of diurnal variation of summer rainfall over subtropical East Asia. J. Climate, 2012, 25, pp. 3307–3320. [CrossRef]
- Ceccherini, G., Ameztoy I. , Hernández, C.P.R. and Moreno C.C. High-resolution precipitation datasets in South America and West Africa based on satellite-derived rainfall, enhanced vegetation index and digital elevation model. Remote Sens, 2015, 7, pp. 6454–6488. [CrossRef]
- Gosset, M., Viarre, J., Quantin, G., Alcoba, M. Evaluation of several rainfall products used for hydrological applications over West Africa using two high-resolution gauge networks. Q. J. R. Meteorol. Soc, 2013, 139 (673), pp. 923–940. [CrossRef]
- Naschen, ¨ K., Diekkrüger, B., Leemhuis, C., Steinbach, S., Seregina, L.S., Thonfeld, F., Van der Linden, R. Hydrological modeling in data-scarce catchments: the Kilombero floodplain in Tanzania. Water, 2018, 10, 599pp. [CrossRef]
- Pellarin, T., Roman-Cascon, C., Baron, C., Bindlish, R., Brocca, L., Camberlin, P., Fernandez-Prieto, ´ D., Kerr, Y.H., et al. The precipitation inferred from soil moisture (PrISM) near real-time rainfall product: evaluation and comparison. Remote Sens, 2020 12(3), 481. [CrossRef]
- Omonge, P., Feigl, M., Olang, L., Schulz,K., Herrnegger, M. (2022) Evaluation of satellite precipitation products for water allocation studies in the Sio-Malaba-Malakisi river basin of East Africa. J.Hydro.: Reg. Stud, 2022, 39, pp. 2214-5818. [CrossRef]
- Sorooshian, S., Hsu, K.L., Gao, X., Gupta, H.V., Imam, B., Braithwaite, D. Evaluation of PERSIANN system satellite-based estimates of tropical rainfall. Bull. Am. Meteorol. Soc, 2000, 81(9), pp. 2035–2046. [CrossRef]
- Lakew, H.B., Moges, S.A., Asfaw, D.H. Hydrological performance evaluation of multiple satellite precipitation products in the upper Blue Nile basin. Ethiopia. J.Hydro.: Reg.Stud, 2020, 27, 100664. [CrossRef]
- Ozer, P. and Mahamoud, A. Recent extreme precipitation and temperature changes in Djibouti City (1966–2011). Journal of Climatology, 2013, pp 1–8. [CrossRef]
- Daher Aden, A. The making of hazard : of a social-environmental explanation of vulnerability to drought in Djibouti, Phd Thesis, King’s College London, London, England, 2014.
- Beau, A., Bourhis, E. and Berges, R. Aperçu de climatologie dynamique du Territoire Français des Afars et des Issas. La Météorologie, 1976, 6, 63–68.
- Nour Ayeh M. La ville de Djibouti entre intégration aux enjeux mondiaux et fragmentationurbaine. Territoire en mouvement Revue de géographie et aménagement, 2015, 27-28, pp. 19. [CrossRef]
- Seyoum WM, Milewski AM, Durham MC. (2015) Understanding the relative impacts of natural processes and human activities on the hydrology of the Central Rift Valley lakes, East Africa, Hydrological Processes, 2015, 29, pp. 4312–4324. [CrossRef]
- Nour Ayeh, M. La dynamique des températures et ses risques pour les populations de Djibouti dans le contexte du réchauffement global, NAAJ, 2019.
- Xie, P., Yatagai, A., Chen, M., Hayasaka, T., Fukushima, Y., Liu, C., Yang, S. A gauge-based analysis of daily precipitation over East Asia. J. Hydrometeorol, 2007, pp. 607–626. [CrossRef]
- Chen, M., Shi, W., Xie, P., Silva, V.B.S., Kousky, V.E., Higgins, R.W., Janowiak, J.E. Assessing objective techniques for gauge-based analyses of global daily precipitation. J. Geophys. Res, 2008, 113, pp. 1–13. [CrossRef]
- Schneider, U., Becker, A., Finger, P., Meyer-christoffer, A., Ziese, M., Rudolf, B. (2014) GPCC ’s new land surface precipitation climatology based on quality-controlled in situ data and its role in quantifying the global water cycle. Theor and App.Climato, 2014, 1155(1-2), pp. 15–40. [CrossRef]
- Becker, A., Finger, P., Rudolf, B., Schamm, K., Schneider, U., Ziese, M., Precipitation, G., Centre, C. and Wetterdienst, D. A description of the global land-surface precipitation data products of the Global Precipitation Climatology Centre with sample applications including centennial (trend) analysis from 1901–present. Earth Syst. Sci. Data, 2013, 5, pp. 71–99. [CrossRef]
- Dee, D. P. , S. M. Uppalaa, A. J. Simmons ,P.Berrisford ,P.Poli , S. Kobayashi ,U. Andrae, M.A.Balmaseda, G.Balsamo ,P.Bauer, P.Bechtold ,A.C.M.Beljaars ,L. van de Berg, J.Bidlot, N.Bormann, C.Delsol, R.Dragani, M.Fuentes, A.J.Geer, L. Haimberger, S.B.Healy, H.Hersbach, E.V.Holm, L.Isaksen, P.Kallberg, M. Kohler, M. Matricardi, A.P.McNally, B.M.Monge-Sanz, J.-J. Morcrette, B.-K.Park, C. Peubey, P.deRosnay, C.Tavolato, J.-N. Thepaut, F. Vitart. The ERA-Interim Reanalysis: Configuration and Performance of the Data Assimilation System. Quarterly Journal of the Royal Meteorological Society, 2011, 137, pp. 553-597. [CrossRef]
- Yamamoto, M.K., Shige, S. Implementation of an orographic/nonorographic rainfall classification scheme in the GSMaP algorithm for microwave radiometers. Atmos. Res, 2014, 163, pp. 36–47. [CrossRef]
- Novella, N.S., Thiaw, W.M. African rainfall climatology version 2 for famine early warning systems. J. Appl. Meteorol. Climatol, 2012, 52 (1996), pp. 588–606. [CrossRef]
- Ushio, T., Sasashige, K., Kubota, T., Shige, S., Okamoto, K., Aonashi, K., Inoue, T., Takahashi, N., Iguchi, T., Kachi, M., Oki, R., Morimoto, T., Kawasaki, Z.-I. A Kalman filter approach to the global satellite mapping of precipitation (GSMaP) from combined passive microwave and infrared radiometric data. J. Meteorol. Soc. Japan, 2009, 87A, pp. 137–151. [CrossRef]
- Huffman, G. J., D. T. Bolvin, D. Braithwaite, K. Hsu, R. Joyce, and P. Xie. NASA Global Precipitation Measurement (GPM) Integrated Multi-satellite Retrievals for GPM (I-MERG). Algorithm Theoretical Basis Doc (ATBD) Version 4: Greenbelt, MD, 2015, 26 pp.
- Ashouri, H., Hsu, K.L., Sorooshian, S., Braithwaite, D.K., Knapp, K.R., Cecil, L.D., Nelson, B.R., Prat, O.P. PERSIANN-CDR: daily precipitation climate data record from multisatellite observations for hydrological and climate studies. Bull. Am. Meteorol. Soc. 96 (1), 2015, pp. 69–83. [CrossRef]
- Hong, Y., Hsu, K.L., Sorooshian, S., and Gao, X. Precipitation estimation from remotely sensed imagery using an artificial neural network cloud classification system. J. Appl. Meteor, 2004, 43(12), 1834-1853. [CrossRef]
- Maidment, R.I., Grimes, D., Black, E., Tarnavsky, E., Young, M., Greatrex, H., Allan, R.P., Stein, T., Nkonde, E., Senkunda, S., Misael, E., Alcántara, U. Data Descriptor: a new, long-term daily satellite-based rainfall dataset for operational monitoring in Africa. Nat. Publ. Gr, 2017, 4, pp. 1–19. [CrossRef]
- Funk, C., Verdin, A., Michaelsen, J., Peterson, P., Pedreros, P., Husak, G., A global satellite-assisted precipitation climatology. Earth Syst. Sci. Data, 2015, 7, pp. 275–287. [CrossRef]
- Lange, S. EartH2Observe, WFDEI and ERA-Interim data Merged and Bias-corrected for ISIMIP (EWEMBI) [Data set]. GFZ Data Services, 2019. [CrossRef]
- Izumi, T., Takikawa, H., Hirabayashi, Y., Hanasaki, N., Nishimori, M., Contributions of different bias-correction methods and reference meteorological forcing data sets to uncertainty in projected temperature and precipitation extremes. J. Geophys. Res. Atmos, 2017, 122 (15), pp. 7800–7819. [CrossRef]
- Weedon, G. P., G. Balsamo, N. Bellouin, S. Gomes, M. Best, J. and Viterbo, P. (2014) The WFDEI meteorological forcing data set: WATCH Forcing Data methodology applied to ERA-Interim reanalysis data. Water. Resour. Res., 2014, 50. [CrossRef]
- Gelaro, R., McCarty, W., Suarez, M.J., Todling, R., Molod, A., Takacs, L., Randles, C.A., Darmenov, A., Bosilovich, M.G., Reichle, R., Wargan, K., Coy, L., Cullather, R., Draper, C., Akella, S., Buchard, V., Conaty, A., Da Silva, A.M., Gu, W., Kim, G.-K., Koster, R., Lucchesi, R., Merkova, D., Nielsen, J.E., Partyka, G., Pawson, S., Putman, W., Rienecker, M., Schubert, S.D., Sienkiewicz, M., Zhao, B. The Modern-Era Retrospective Analysis for Research and Applications, Version 2 (MERRA-2), Ame. Meteorol. Soc, 2017, pp. 5419–5454. [CrossRef]
- Beck, H.E., Pan, M., Roy, T., Weedon, G.P., Pappenberger, F., Dijk, A.I.J.M., Van, Huffman, G.J., Adler, R.F., Wood, E.F. Daily evaluation of 26 precipitation datasets using Stage-IV gauge-radar data for the CONUS. Hydrology and Earth System Sciences, 2019, pp. 207–224. [CrossRef]
- Xie, P. and Arkin, P.A. An intercomparison of gauge observations and satellite estimates of monthly precipitation. J. Appl. Meteor, 1995, 34, pp. 1143-1160.
- Lu, G.Y., Wong, D.W. An adaptive inverse-distance weighting spatial interpolation technique. Comput.Geosci, 2008, 34(9), pp. 1044–1055. [CrossRef]
- Wang ,Y., Sen, OL., Wang, B. A highly resolved regional climate model (IPRC-RegCM) and its simulation of the 1998 severe precipitation event over China. Part I: model description and verification of simulation. J. Clim, 2003, 16, pp. 1721–1736.
- Segele, Z.T., Leslie, L.M., Lamb, P.J. Evaluation and adaptation of a regional climate model for the Horn of Africa: rainfall climatology and interannual variability. Int J Climatol, 2008. [CrossRef]
- Diro, G.T., Grimes, D.I.F., Black E, O’Neill A, Pardo-Iguzquiza E. Evaluation of reanalysis rainfall estimates over Ethiopia.Int. J Climatol, 2009, 29, pp. 67–78. [CrossRef]
- Akinsanola, A.A., Ogunjobi, K.O., Ajayi, V.O., Adefisan, E.A., Omotosho, J.A., Sanogo, S. Comparison of five gridded precipitation products at climatological scales over West Africa. Meteorol. Atmos Phys, 2016. [CrossRef]
- Houmed-Gaba, A. Hydrogéologie des milieux volcaniques sous climat aride. Caractérisation sur site expérimental et modélisation numérique de l’aquifère basaltique de Djibouti (Corne de l’Afrique), PhD thesis, University of Poitiers, Poitiers, France, 2009, 220 pp.
- Casse, C., Gosset, M., Peugeot, C., Pedinotti, V., Boone, A., Tanimoun, B.A., Decharme, B. Potential of satellite rainfall products to predict Niger River flood events in Niamey. Atmos. Res, 2015. [CrossRef]
- Poméon, T., Jackisch, D., Diekkrüger, B. Evaluating the performance of remotely sensed and reanalysed precipitation data over West Africa using HBV light. J. Hydrol, 2017, 547, pp. 222–235. [CrossRef]
- Dinku, T., Ceccato, P., Grover-Kopec, E., Lemma, M., Connor, S.J., Ropelewski, C.F. Validation of satellite rainfall products over East Africa’s complex topography. Int. J. Remote Sens, 2007, 28 (7), pp. 1503–1526. [CrossRef]
- Satgé, F., Bonnet, M.-P., Gosset, M., Molina, J., Hernan, W., Yuque Lima, Pillco Zolá, R., Timouk, F., Garnier, J. Assessment of satellite rainfall products over the Andean plateau. Atmos. Res, 2016, 167, pp. 1–14. [CrossRef]
- Gebrechorkos, S.H., Huelsmann, S., Bernhofer, C. Evaluation of Multiple Climate Data Sources for Managing Environmental Resources in East Africa. Hydrol. Earth Syst. Sci, 2018, 22, pp. 4547–4564. [CrossRef]
- Ageet, S., Fink, A. H., Maranan, M., Diem, J. E., Hartter, J., Ssali, A. L., & Ayabagabo, P. Validation of satellite rainfall estimates over equatorial east Africa. Journal of Hydrometeorology, 2022, 23(2), pp. 129–151. [CrossRef]
Figure 1.
Location of the study area and rain gauges a) Territory of the Republic of Djibouti with regionalization of two rainfall zones (EAST and WEST by Assoweh Dabar [1]). b) Focus on the southeast zone with the analysis rain gauges (underlined in cyan color). c) Focus on the Ambouli catchment
Figure 1.
Location of the study area and rain gauges a) Territory of the Republic of Djibouti with regionalization of two rainfall zones (EAST and WEST by Assoweh Dabar [1]). b) Focus on the southeast zone with the analysis rain gauges (underlined in cyan color). c) Focus on the Ambouli catchment
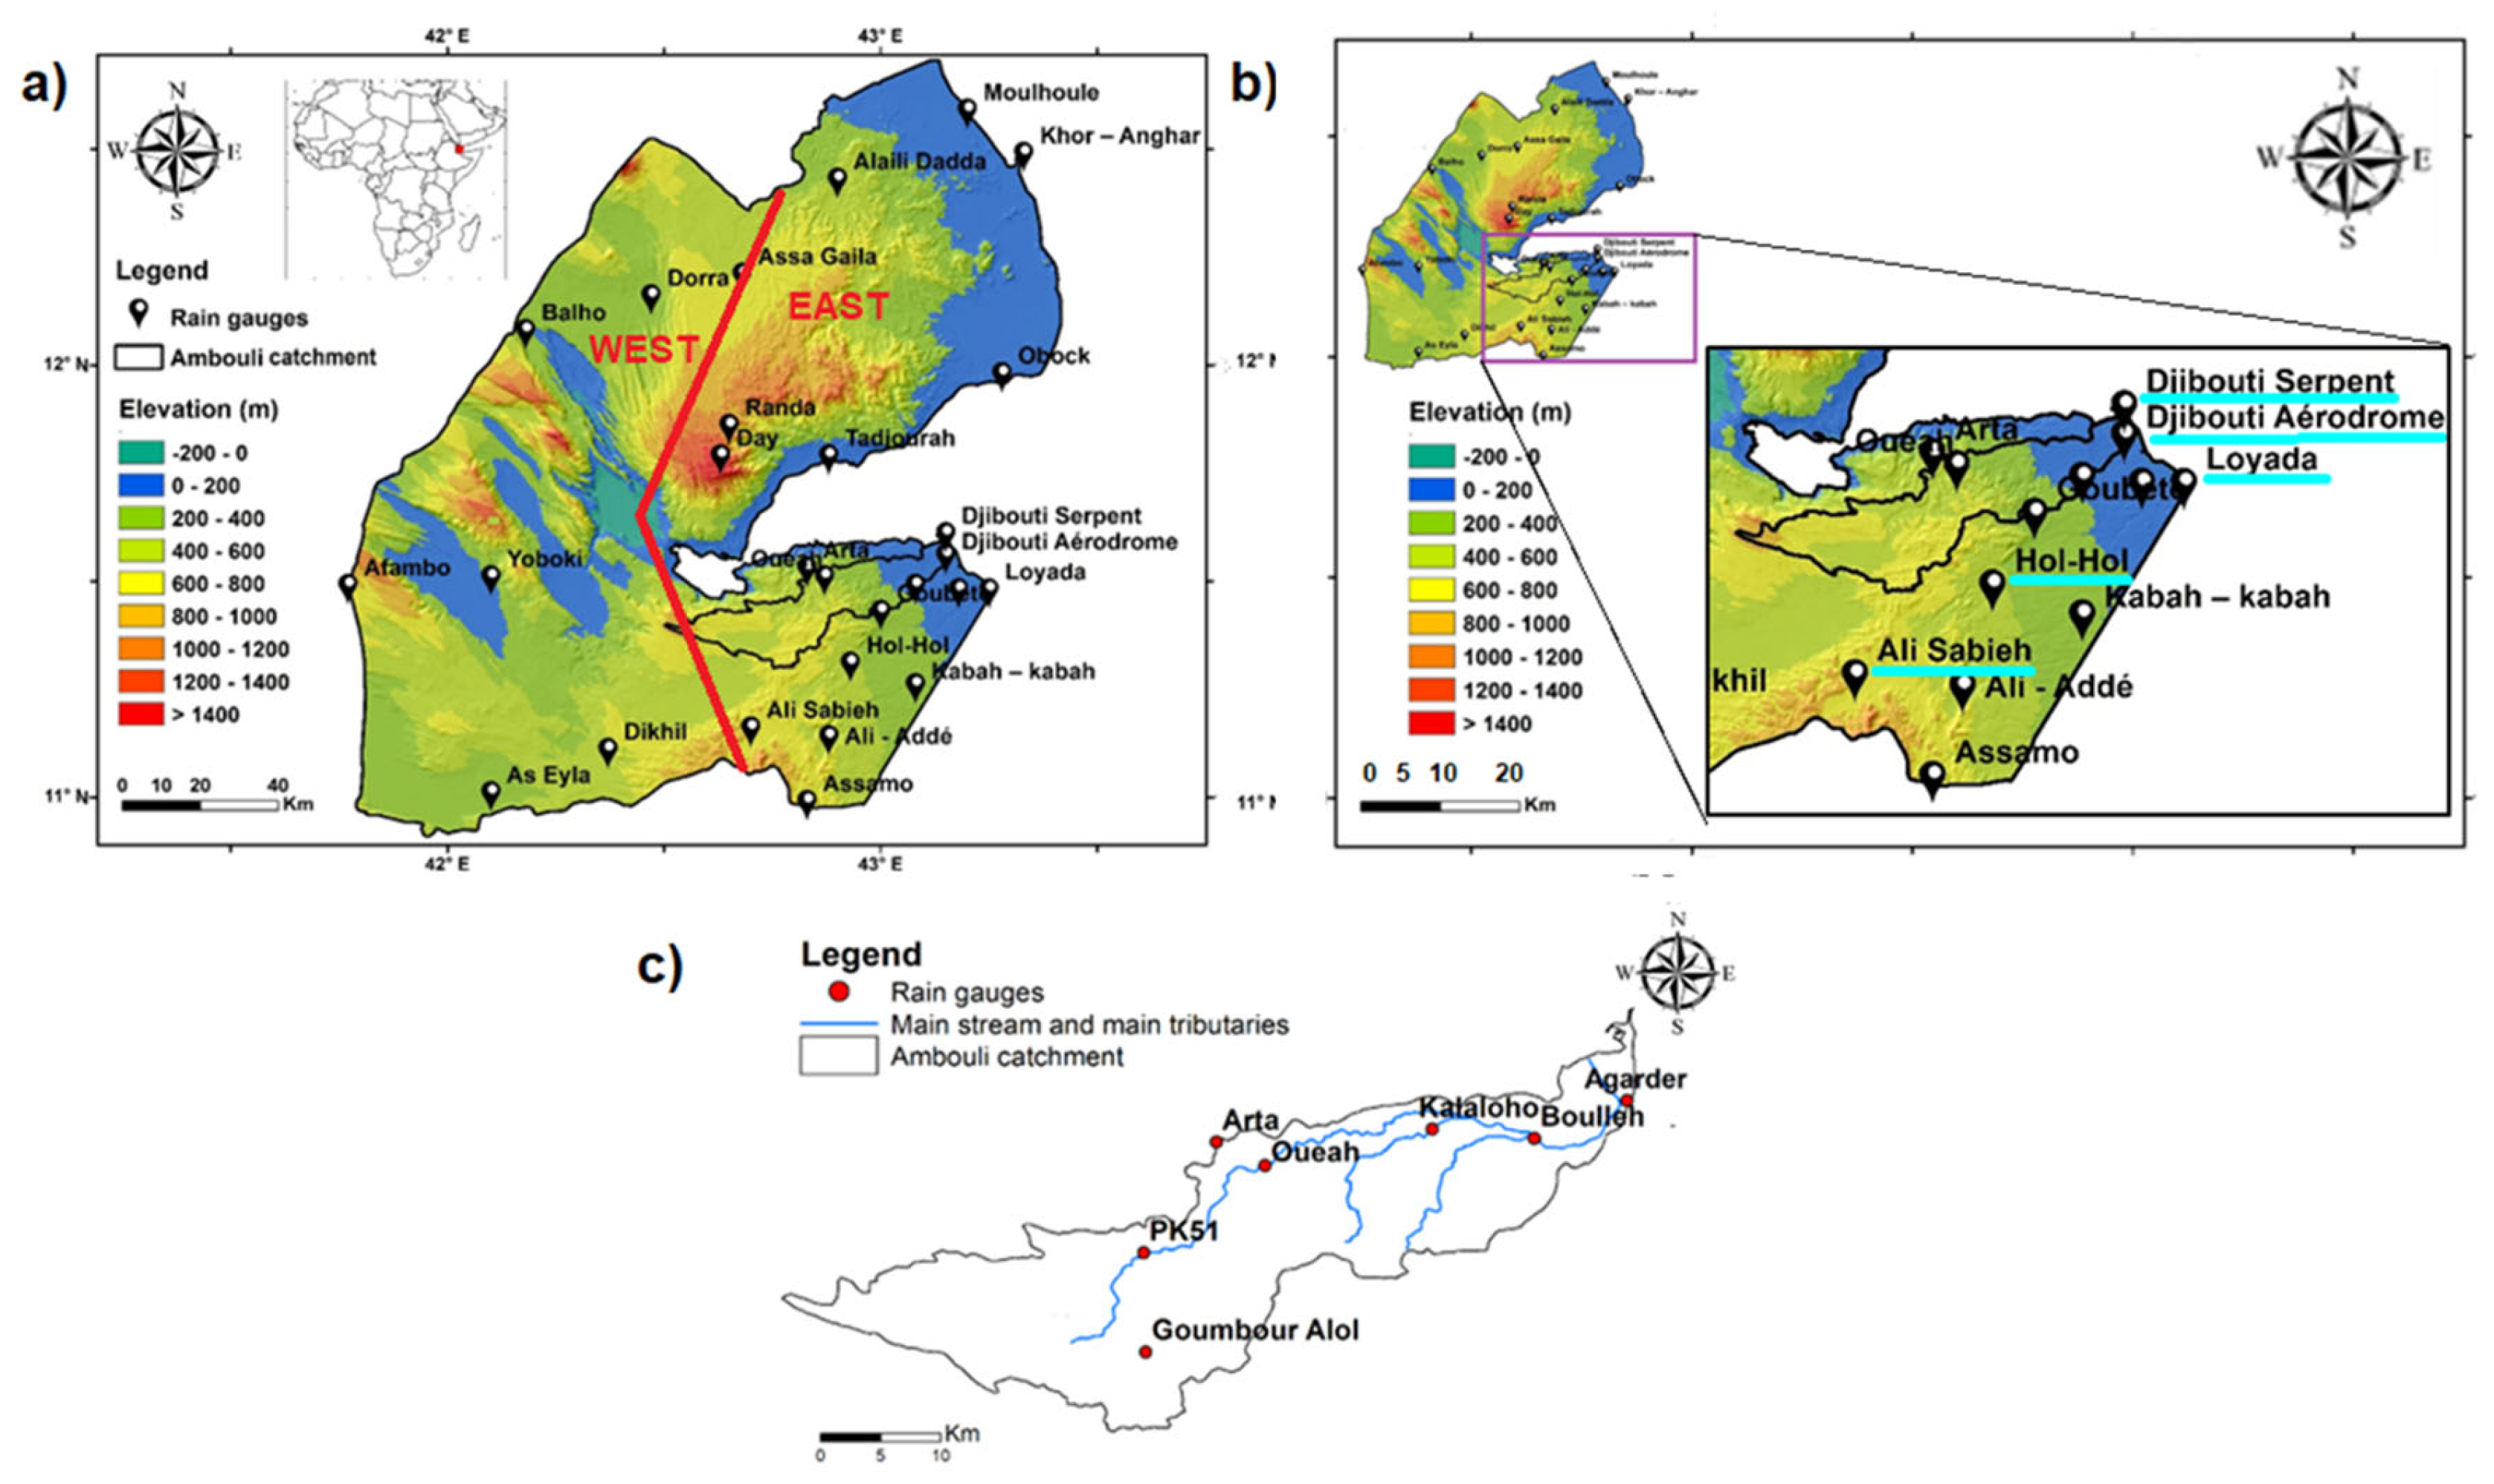
Figure 2.
Diagram summarizing the methodology used for this study.
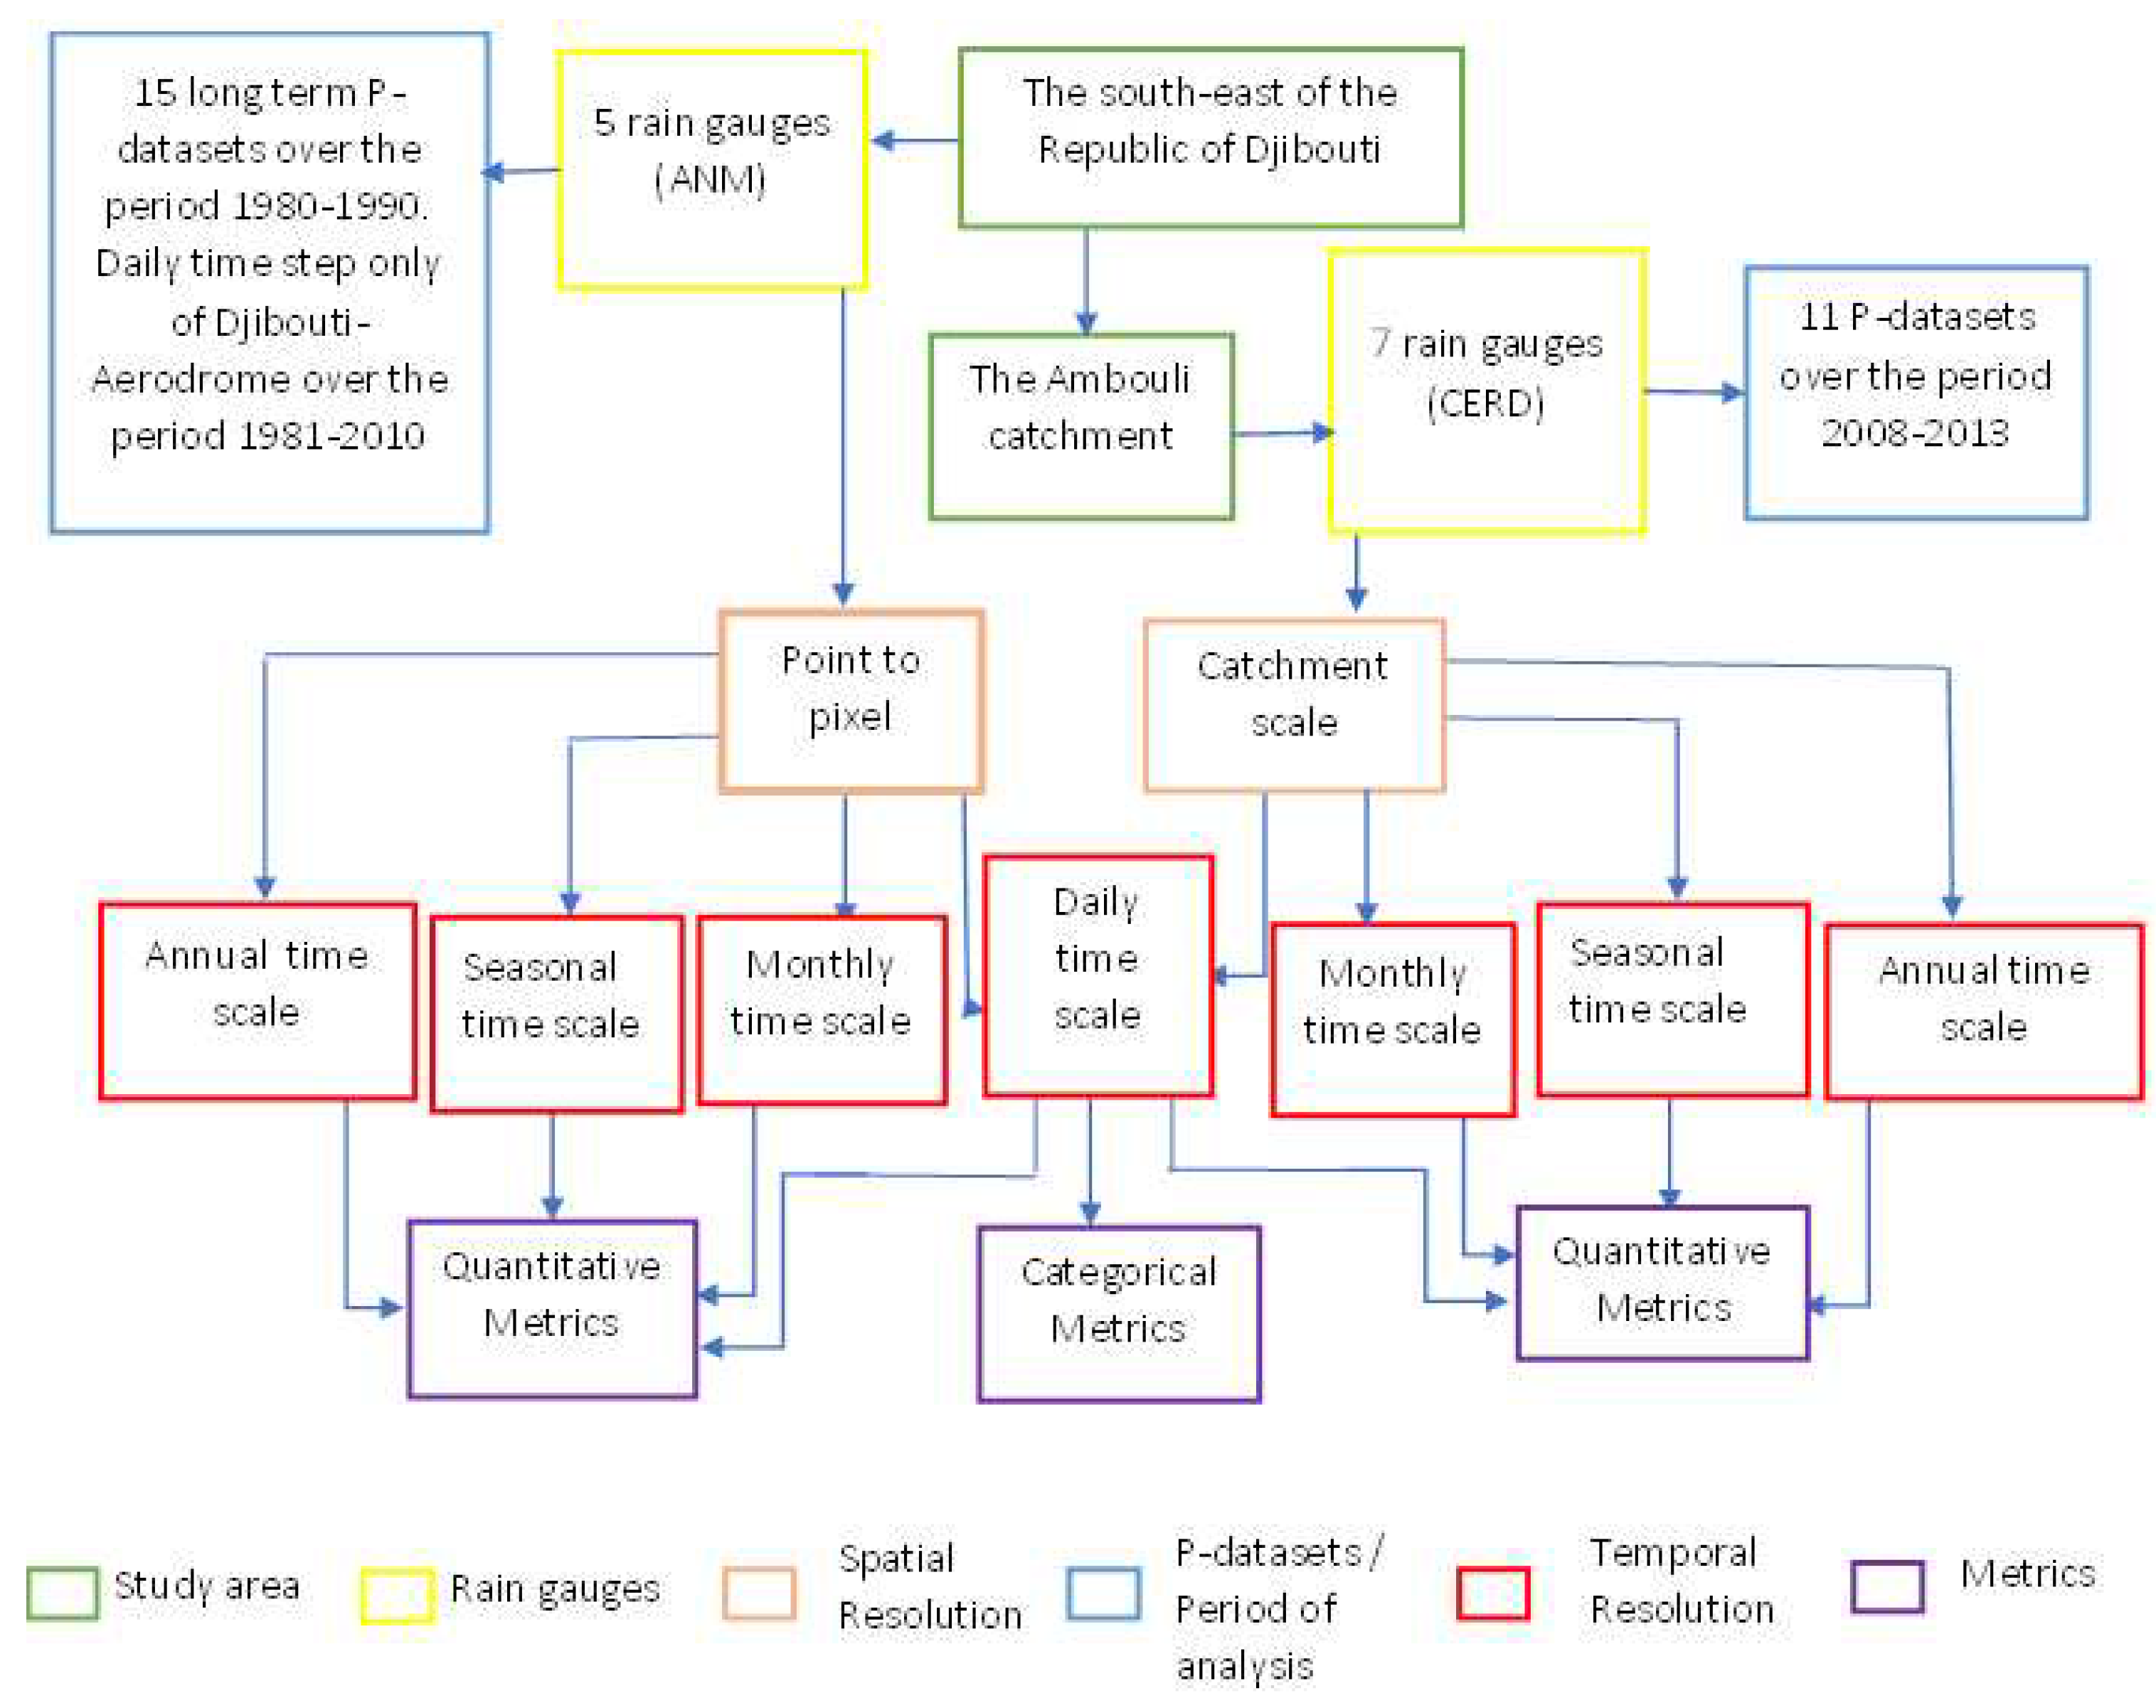
Figure 3.
P-dataset metrics for rain gauge stations in the southeast of the Republic of Djibouti, at the annual (left column) and monthly (right column) time steps over the period 1980-1990.
Figure 3.
P-dataset metrics for rain gauge stations in the southeast of the Republic of Djibouti, at the annual (left column) and monthly (right column) time steps over the period 1980-1990.
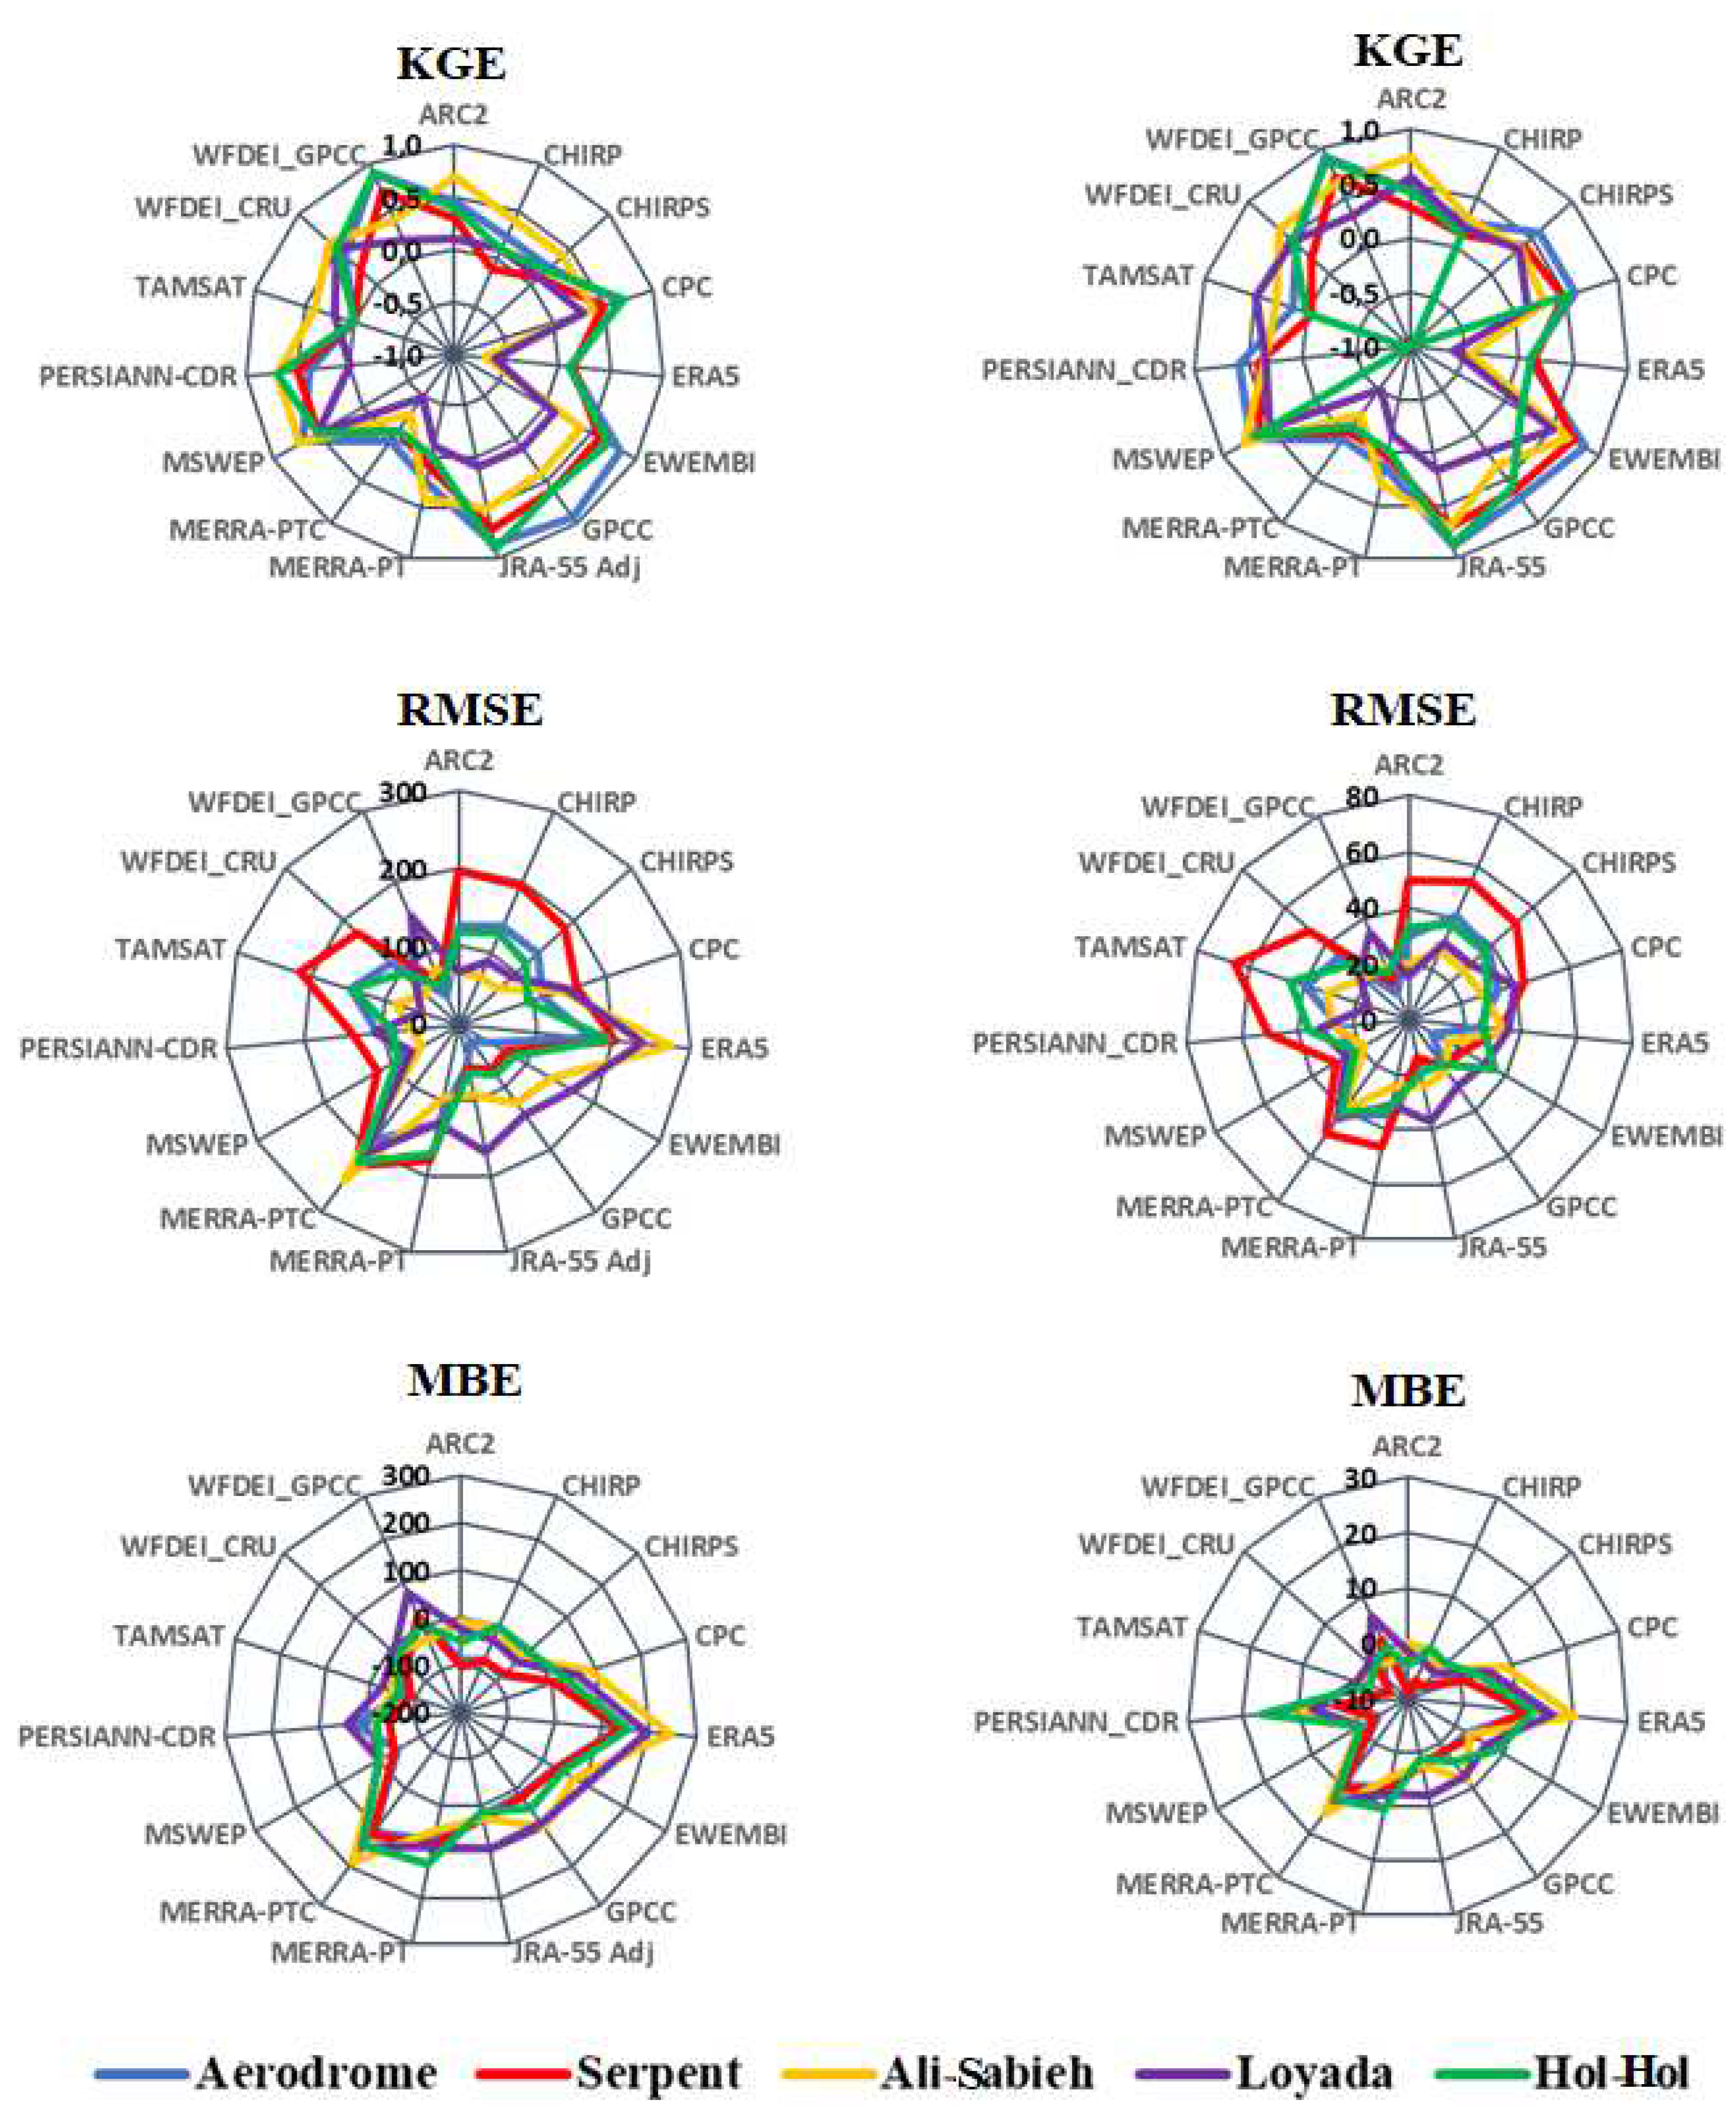
Figure 4.
The performance of P datasets in terms of mean annual precipitation compared to the average annual precipitation of the rain gauge stations on 2008-2013.
Figure 4.
The performance of P datasets in terms of mean annual precipitation compared to the average annual precipitation of the rain gauge stations on 2008-2013.
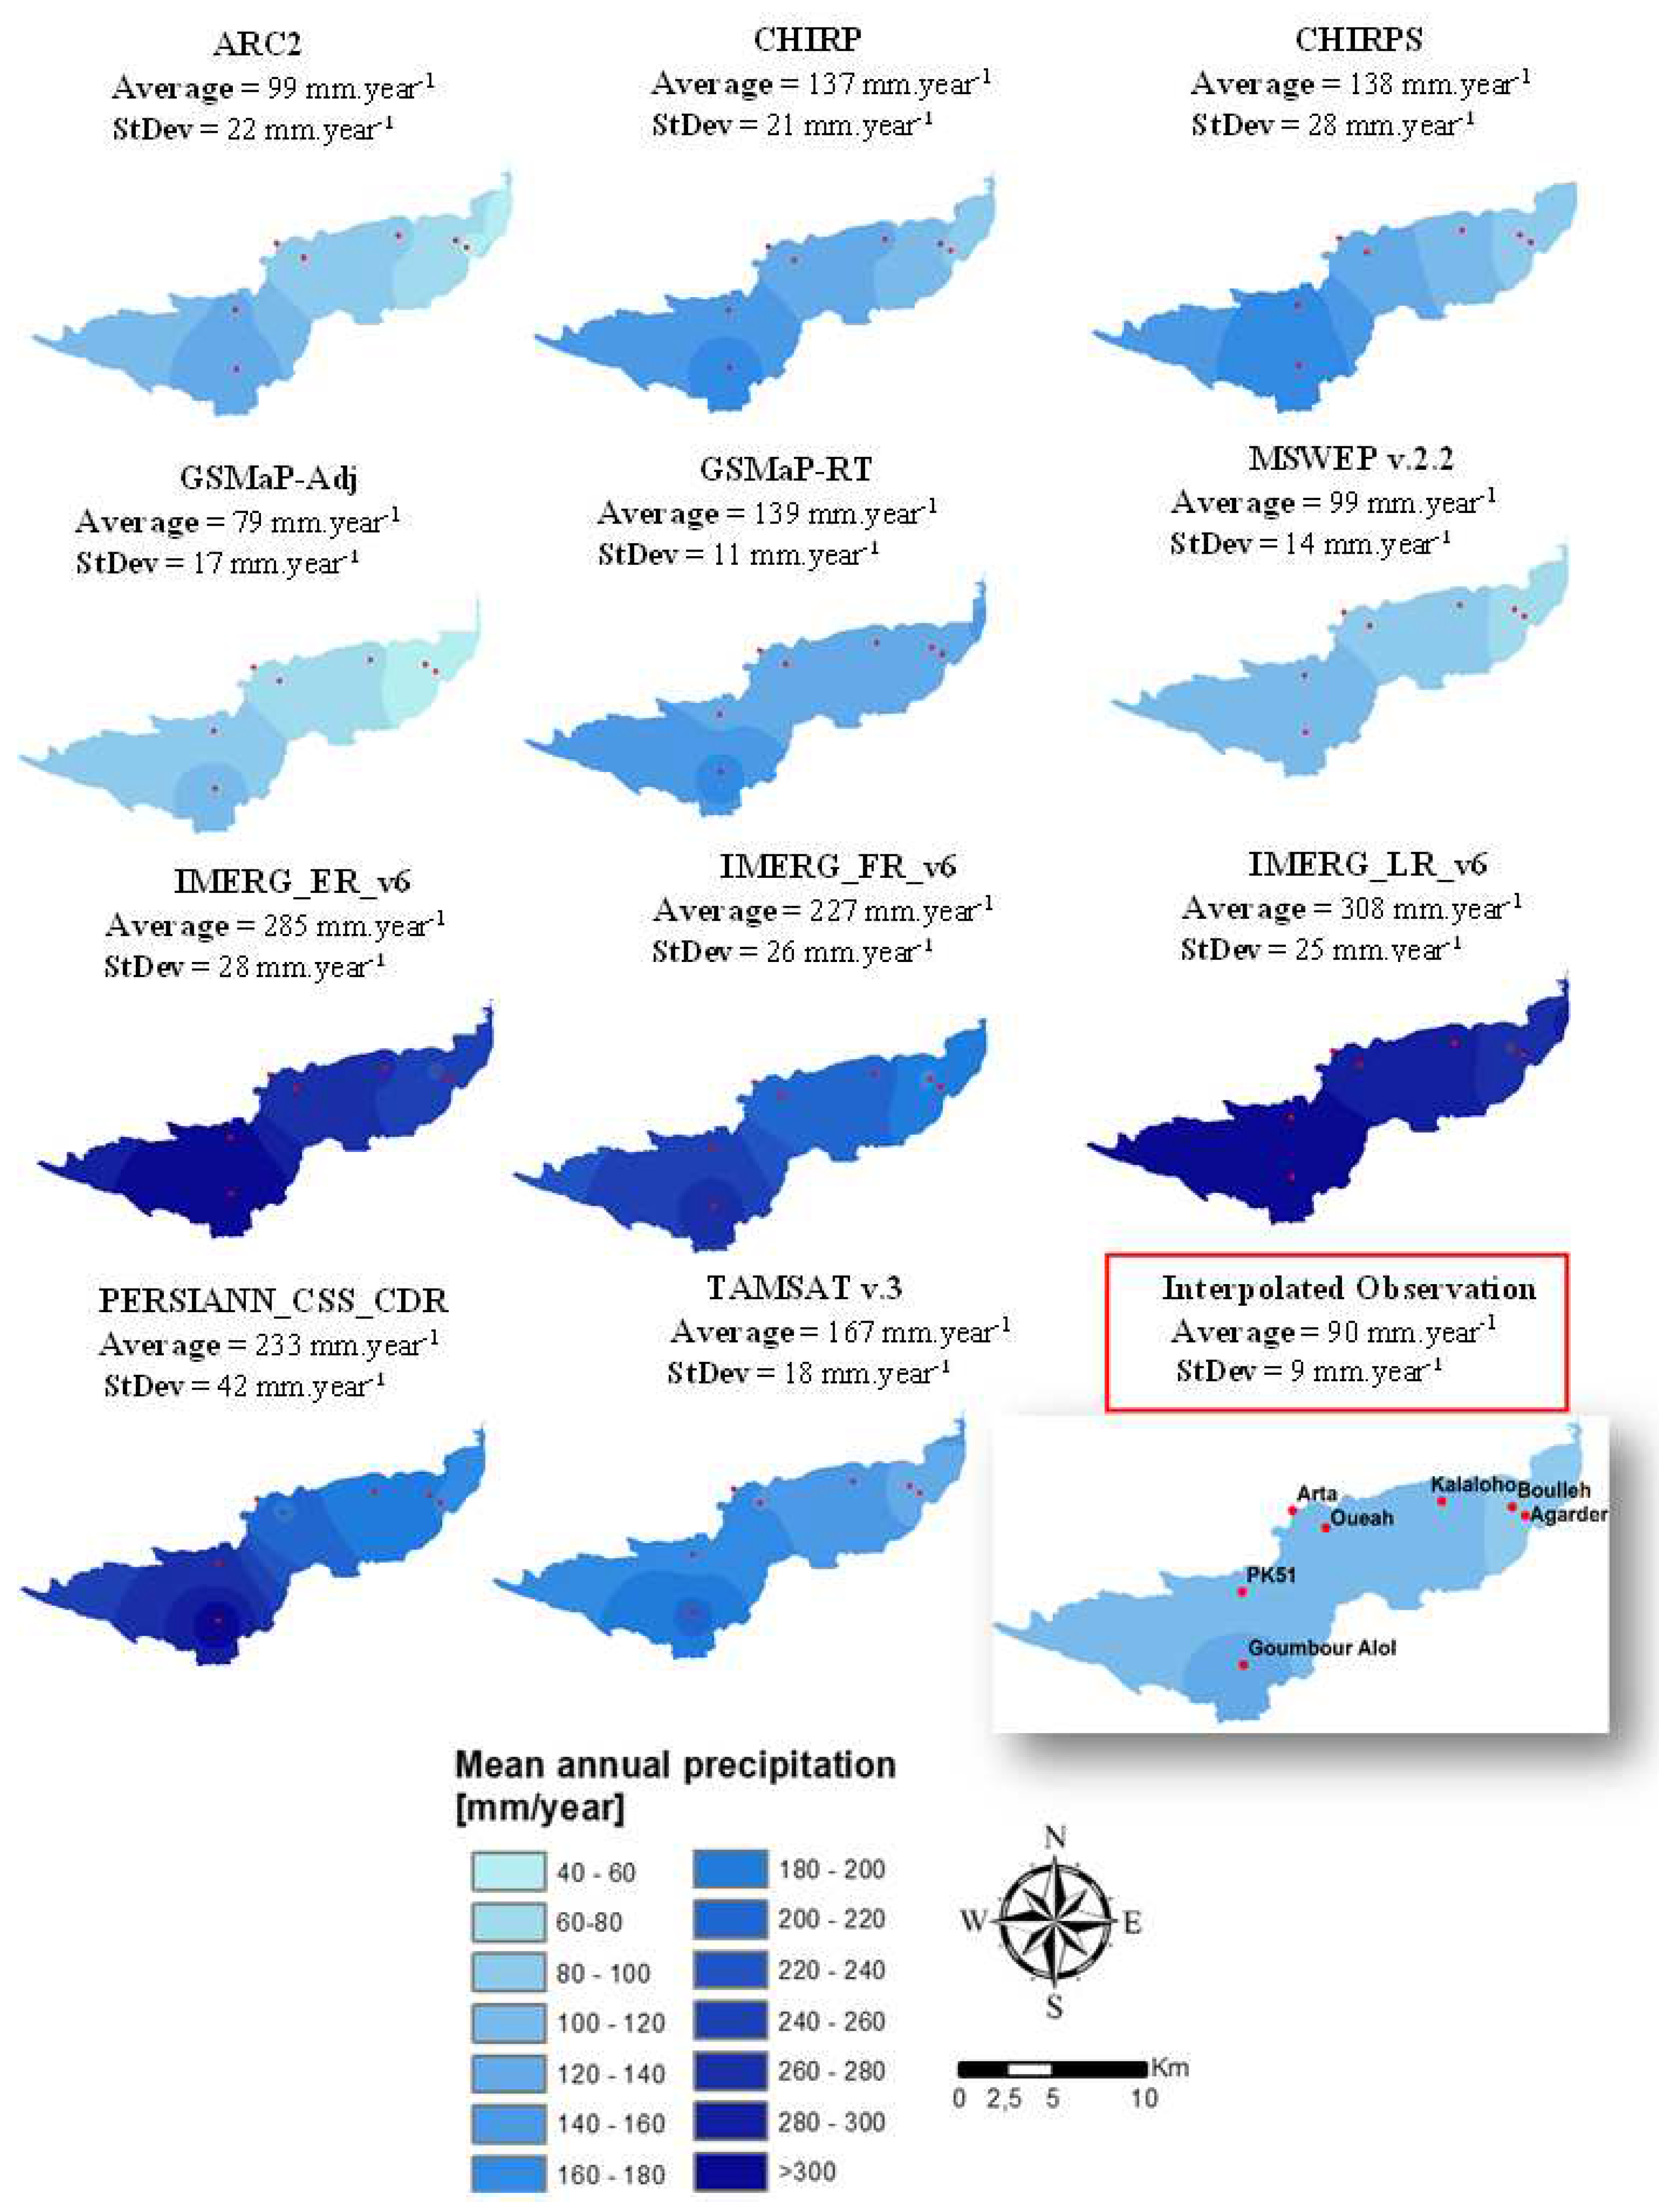
Figure 5.
P-dataset metrics for the two study areas, the southeast of the Republic of Djibouti (left column) and the Ambouli catchment (right column), at the seasonal time step.
Figure 5.
P-dataset metrics for the two study areas, the southeast of the Republic of Djibouti (left column) and the Ambouli catchment (right column), at the seasonal time step.
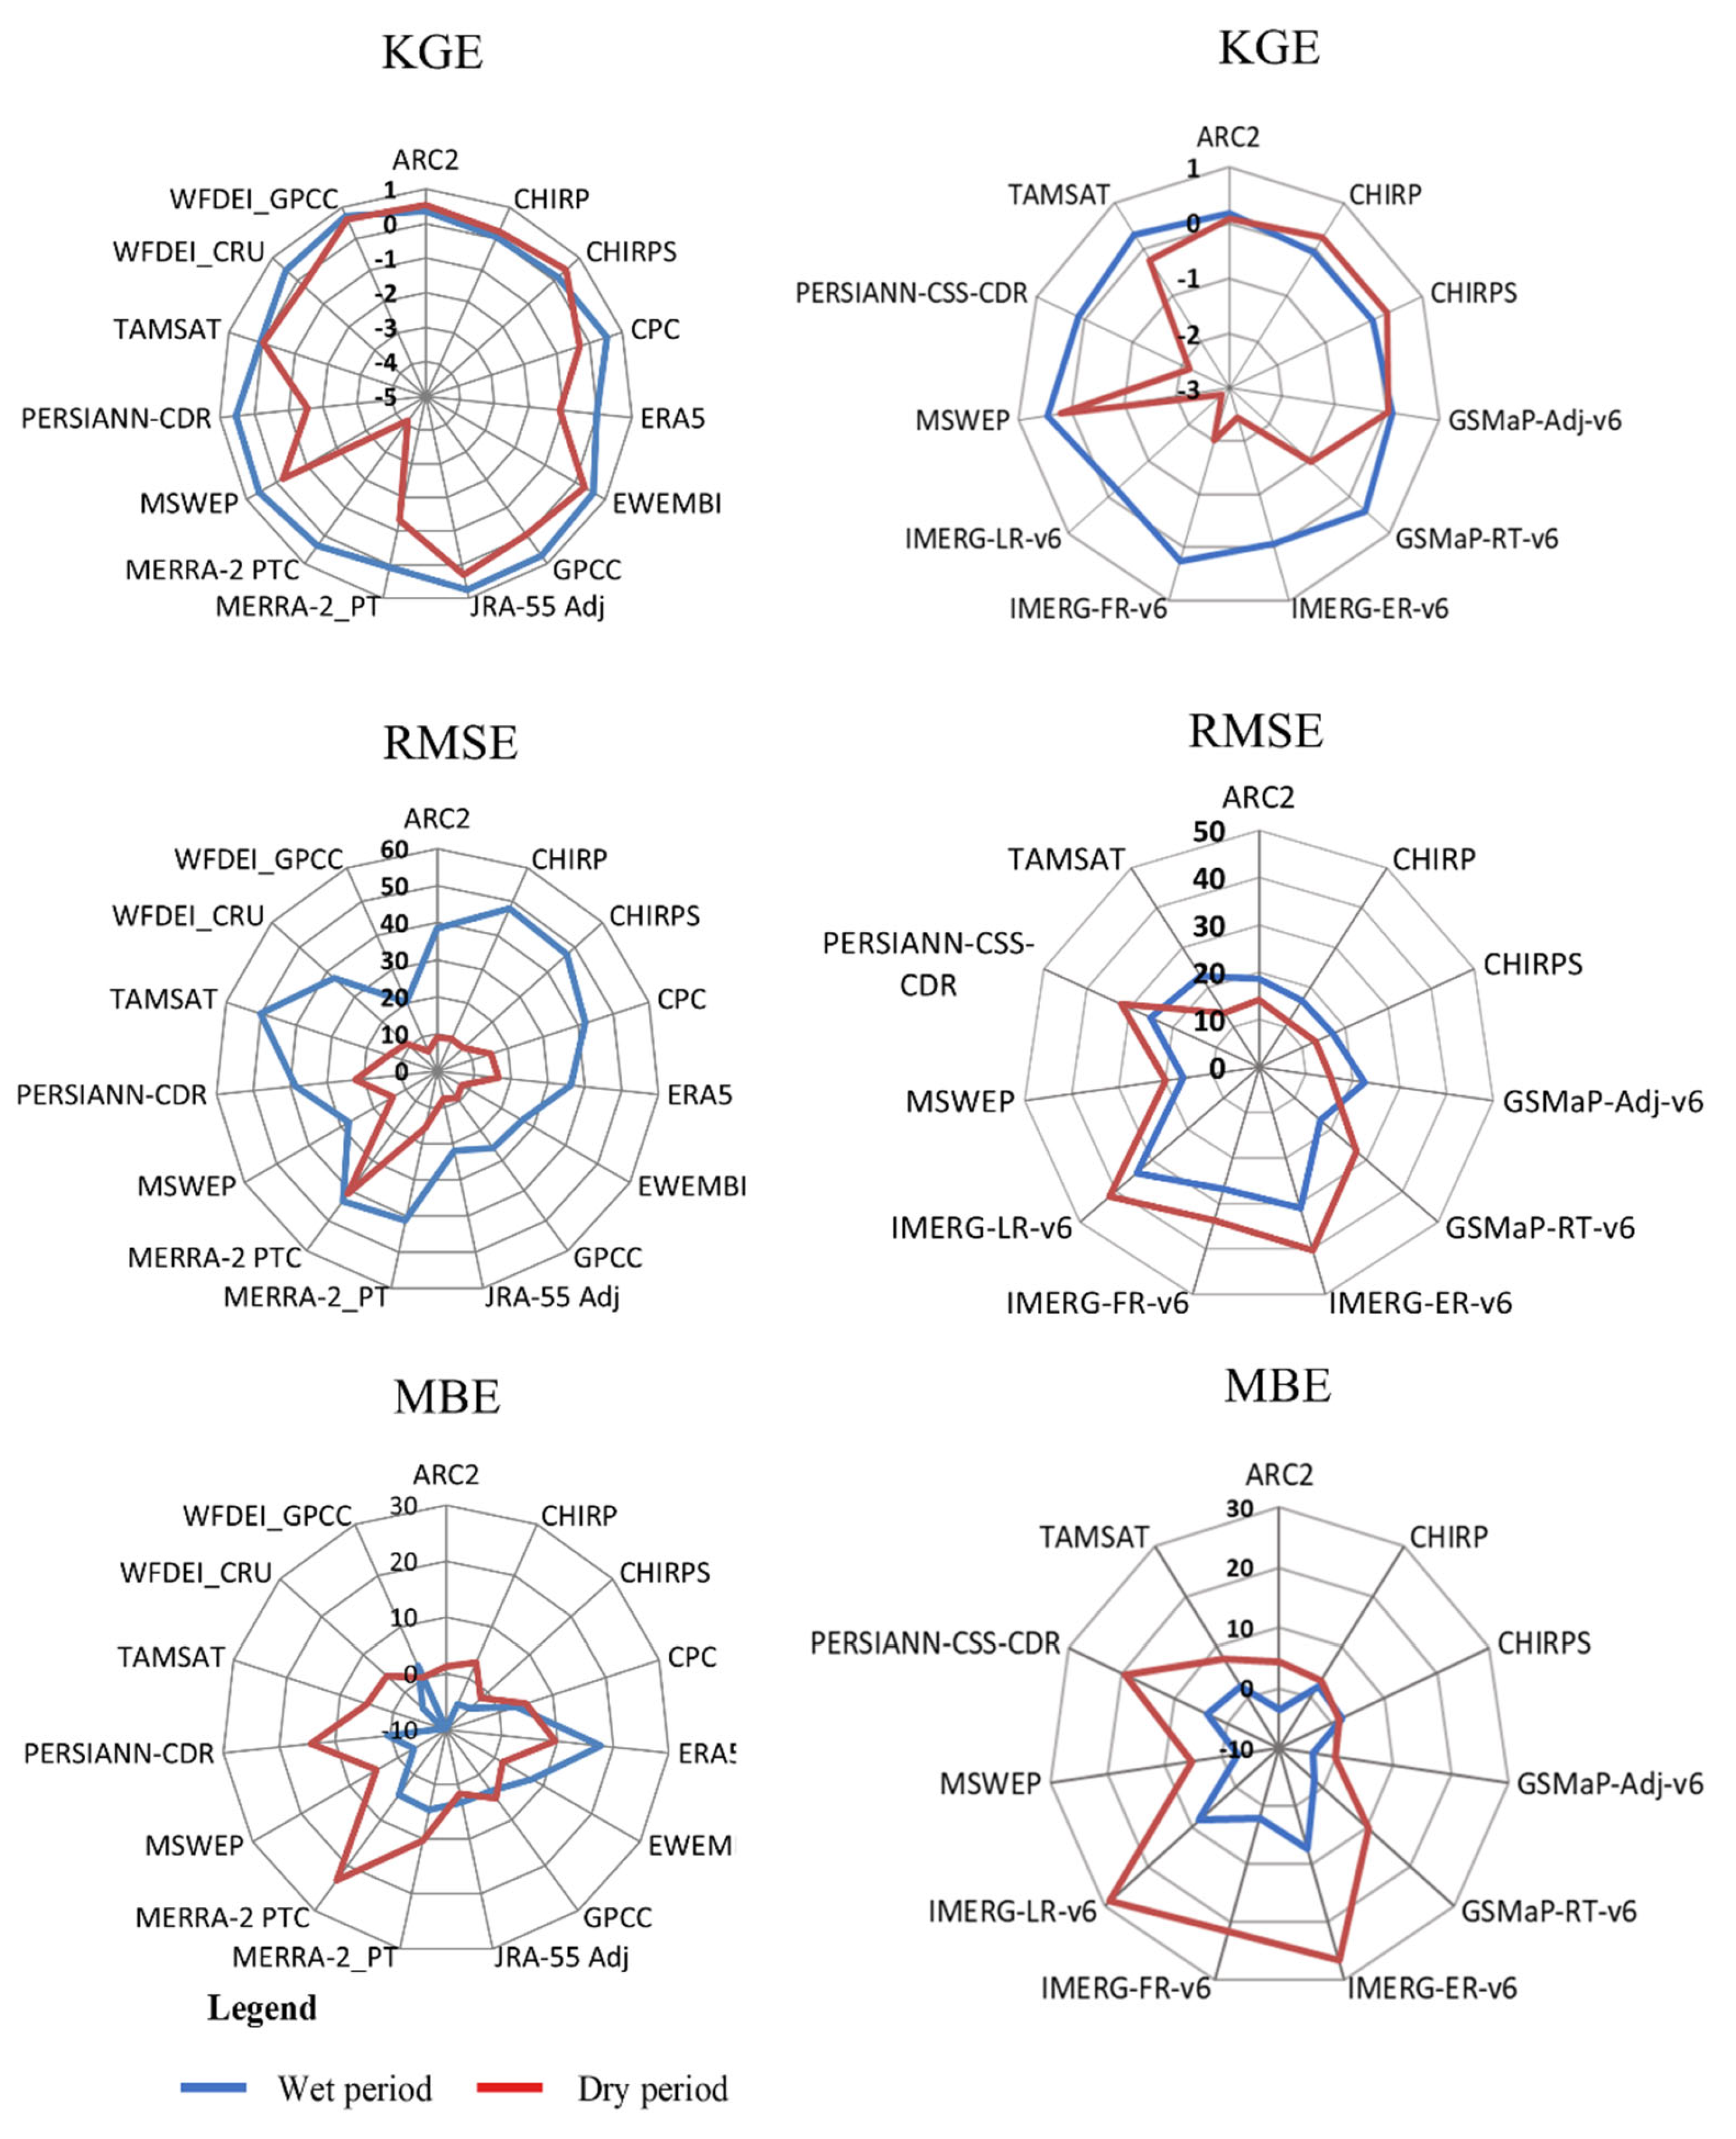

Table 1.
Main characteristics and references of the P datasets. In the data column, S, R and G stands for the sources of information, respectively Satellite, Reanalysis and Gauge; in the analysis area column, SE correspond to southeast area and AC to Ambouli catchment ; spatial coverage refers to the absolute maximum and minimum latitude and latency refers to the time delay for data availability [5].
| Reference | [20,21] | [22,23] | [24] | [25] | [26] | [27] | [28] | [28] | [28] | [29] | [30] | [31] | [32] | [33] | [34] | [35] | [35] | [32] | [36] | [36] | [37] |
| Latency | 1 day | Irregular | 3 months | 3 days | 2 days | 3 days | 4 hours | 3.5 months | 12 hours | 6 months | 6 months | 3 days | 2 days | Stopped | Stopped | Stopped | Stopped | 1 month | 2 months | 2 months | Several months |
| Spatial Resolution | 0.5° | 1° | 0.75° | 0.1° | 0.1° | 0.1° | 0.1° | 0.1° | 0.1° | 0.25° | 0.04° | 0.0375° | 0.05° | 0.5° | 0.56° | 0.5° | 0.5° | 0.05° | 0.5° | 0.5° | 0.1° |
| Spatial Coverage | Global | Global | 60° | 60° | Africa | 60° | 60° | 60° | 60° | 60° | 60° | Africa | 50° | Global | Global | Land | Land | 50° | Global | Global | Global |
| Temporal Resolution | Daily | Monthly | 3h | Hourly | Daily | Hourly | 30 min | 30 min | 30 min | Daily | 3h | Daily | Daily | Daily | 3h | Daily | Daily | Daily | Hourly | Hourly | 3h |
| Temporal Coverage | 1979-present | 1901-2013 | 1979-present | 2000-present | 1983-present | 2000-present | 2000-present | 2000-2021 | 2000-present | 1983-2016 | 1983-present | 1983-present | 1981-present | 1979-2010 | 1959-2012 | 1979-2016 | 1979-2016 | 1981-present | 1980-present | 1980-present | 1979-present |
| Analysis area | SE | SE | SE | AC | SE/AC | AC | AC | AC | AC | SE | AC | SE/AC | SE/AC | SE | SE | SE | SE | SE/AC | SE | SE | SE/AC |
| Data | G | G | R | S | S,G | S,G | S,G | S,G | S,G | S,G | S,G | S,G | S,R | R,G | R,G | R,G | R,G | S,R,G | S,R,G | S,R,G | S,R,G |
| Full Name | Climate Prediction Center v.1 | Global Precipitation Climatology Center | European Center for Medium-range Weather Forecast Re-Analysis v.5 | GSMaP standard v.6 | African Rainfall Climatology v.2 | Global Satellite Mapping of Precipitation Adjusted v.6 | Integrated Multi-satellitE Retrievals for GPM-Early Run | IMERG- Final Run | IMERG- Late Run | Precipitation Estimates from Remotely Sensed Information using Artificial Neural Network and Climate Data Record | PERSIANN-Cloud Classification System-CDR | Tropical Applications of Meteorology using SATellite and ground-based observations | Climate Hazards group InfraRed | EartH2Observe, WFDEI and ERA-Interim data Merged and Bias-corrected for ISIMIP | Japanese 55-years Re Analysis Adjusted | WATCH Forcing Data methodology applied to ERA-Interim | WATCH Forcing Data methodology applied to ERA-Interim | CHIRP with station v.2 | Modern-Era Retrospective analysis for Research and Applications v.2 | Modern-Era Retrospective analysis for Research and Applications v.2 | Multi-Source Weighted Ensemble Precipitation |
| Acronym | CPC v.1 | GPCC v.7 | ERA5 | GSMaP-RT v.6 | ARC-2 | GSMaP-Adj v.6 | IMERG-ER v.6 | IMERG-FR v.6 | IMERG-LR v6 | PERSIANN-CDR | PERSIANN-CCS-CDR | TAMSATv.3 | CHIRP v.2 | EWEMBI | JRA-55 Adj | WFDEI CRU | WFDEI GPCC | CHIRPS v.2 | MERRA-2 PT | MERRA-2 PTC | MSWEP v.2.2 |
Table 2.
Characteristics of the selected rain gauges from the national network (ANM) and the CERD Flood Monitoring and Alert System (RACA) for the periods of study.
Table 2.
Characteristics of the selected rain gauges from the national network (ANM) and the CERD Flood Monitoring and Alert System (RACA) for the periods of study.
| Rain Gauges | Latitude (°N) | Longitude (°E) | Elevation (m) | Observation Periods | Available time step | Data availability on common period 1980-1990 (%) | Data Availability on common period 2008-2013 (%) | |
|---|---|---|---|---|---|---|---|---|
| ANM network | Ali-Sabieh | 11.155 | 42.706 | 715 | 1947/1990 | Monthly | 98.86 % | - |
| Djibouti-Aerodrome | 11.550 | 43.150 | 8 | 1951/2021 | Monthly | 97.55 % | - | |
| 1981/2021 | Daily | 97.84 %* | - | |||||
| Djibouti-Serpent | 11.600 | 43.150 | 3 | 1901/1990 | Monthly | 99.46 % | - | |
| Hol-Hol | 11.309 | 42.928 | 470 | 1951/1990 | Monthly | 98.76 % | - | |
| Loyada | 11.460 | 43.254 | 3 | 1951/1990 | Monthly | 97.84 % | - | |
| - | ||||||||
| RACA network | Agarder | 11.564 | 43.127 | 6 | 2008/2013 | Daily | - | 72.35 % |
| Arta | 11.52 | 42.83 | 705 | 2008/2015 | Daily | - | 91.98 % | |
| Boulleh | 11.51 | 43.09 | 250 | 2008/2014 | Daily | - | 94.78 % | |
| Goumbour Alol | 11.36 | 42.78 | 770 | 2008/2015 | Daily | - | 94.56 % | |
| Kalaloho | 11.53 | 43 | 198 | 2008/2015 | Daily | - | 92.34 % | |
| Oueah | 11.5 | 42.87 | 415 | 2008/2014 | Daily | - | 93.28 % | |
| PK51 | 11.43 | 42.78 | 560 | 2008/2014 | Daily | - | 88.32 % |
* For Djibouti Aerodrome rain gauge the percentage of data available at daily time step is computed on the common period with the P datasets of 1981-2010.
Table 3.
Metrics used for quantitative performance measurements.
| Metric | Equation | Perfect Value |
|---|---|---|
| Mean Bias Error (MBE) | 0 | |
| Root Mean Square Error (RMSE) | 2 | 0 |
| Kling Gupta Efficiency (KGE) | 1 |
Table 4.
Contingency table used for the categorical metric analysis of rainfall.
| Rain gauges | |||
|---|---|---|---|
| Precipitation | No precipitation | ||
| P datasets | Precipitation | Hits 'a' | False Alarms 'b' |
| No precipitation | Misses 'c' | Correct Negatives 'd' | |
Table 5.
List of metrics used in categorical performance measurements.
| Categorical Metric | Equation | Perfect Value |
|---|---|---|
| Probability of detection (POD) | 1 | |
| False alarm ratio (FAR) | 0 | |
| Accuracy | 1 | |
| Error | 0 | |
| Heidke Skill Score (HSS) | 1 |
Table 6.
Quantitative metrics at different time steps in the southeast of Djibouti: ranking P-Datasets based on KGE with the Top 3 in light grey and bottom 3 in dark grey (including ties).
Table 6.
Quantitative metrics at different time steps in the southeast of Djibouti: ranking P-Datasets based on KGE with the Top 3 in light grey and bottom 3 in dark grey (including ties).
| P datasets | KGE | RMSE (mm) | MBE (mm) | KGE | RMSE (mm) | MBE (mm) | KGE | RMSE (mm) | MBE (mm) |
|---|---|---|---|---|---|---|---|---|---|
| 5 rain gauges in the southeast / 1980-1990 | 5 rain gauges in the southeast / 1980-1990 | Djibouti Aerodrome rain gauge / 1981-2010 | |||||||
| Annual | Monthly | Daily | |||||||
| ARC-2 | 0.39 | 115.72 | -55.9 | 0.49 | 29.67 | -4.38 | -0.02 | 5.29 | -0.05 |
| CHIRP v.2 | 0.15 | 123.32 | -39.8 | 0.12 | 37.84 | -3.4 | -0.14 | 3.83 | 0.05 |
| CHIRPS v.2 | 0.21 | 119.3 | -48.1 | 0.2 | 36.29 | -4.01 | -0.05 | 4.51 | -0.13 |
| CPC | 0.51 | 129.98 | 37.96 | 0.4 | 34.73 | 3.88 | -0.04 | 6.26 | 0.26 |
| ERA5 | -0.18 | 215.88 | 173.2 | -0.14 | 30.77 | 14.7 | -0.22 | 4.84 | 0.42 |
| EWEMBI | 0.53 | 101.12 | 58.9 | 0.58 | 22.85 | 4.91 | 0.19 | 4.32 | 0.13 |
| GPCC | 0.53 | 90.02 | 54.34 | 0.54 | 20.04 | 4.67 | Not available | ||
| JRA-55 Adj | 0.61 | 88.28 | 36.98 | 0.66 | 21.95 | 3.08 | 0.3 | 5.29 | 0.11 |
| MERRA-2 PT | 0.13 | 141.32 | 86.72 | 0.06 | 33.81 | 7.23 | -0.31 | 4.53 | 0.39 |
| MERRA-2 PTC | -0.19 | 217.12 | 143.7 | -0.16 | 43.37 | 12 | -0.2 | 5.01 | 0.36 |
| MSWEP v.2.2 | 0.61 | 84.4 | -18.3 | 0.66 | 24.13 | -1.52 | 0.26 | 4.42 | -0.12 |
| PERSIANN-CDR | 0.46 | 99.68 | -4.34 | 0.14 | 33.99 | 7.76 | 0.17 | 4.71 | 0.06 |
| TAMSAT | 0.12 | 128 | -60.4 | 0.18 | 39.2 | -3.41 | -0.23 | 5.06 | -0.12 |
| WFDEI-CRU | 0.44 | 104.44 | -28 | 0.44 | 31.33 | -2.34 | -0.06 | 4.56 | 0.01 |
| WFDEI-GPCC | 0.62 | 76.72 | 15.26 | 0.7 | 19.61 | 1.27 | 0.26 | 4.26 | 0.09 |
Table 7.
Quantitative metrics at different time steps in the Ambouli catchment: ranking P-Datasets based on KGE with the Top 3 in light grey and bottom 3 in dark grey (including ties).
Table 7.
Quantitative metrics at different time steps in the Ambouli catchment: ranking P-Datasets based on KGE with the Top 3 in light grey and bottom 3 in dark grey (including ties).
| P datasets | KGE | RMSE (mm) | MBE (mm) | KGE | RMSE (mm) | MBE (mm) |
|---|---|---|---|---|---|---|
| Monthly | Daily | |||||
| ARC-2 | 0.17 | 18.23 | 0.27 | 0.06 | 2.95 | 0.02 |
| CHIRP v.2 | 0.04 | 15.77 | 2.94 | -0.2 | 2.58 | 0.09 |
| CHIRPS v.2 | 0.03 | 16.33 | 2.83 | 0.11 | 2.61 | 0.08 |
| GSMaP-Adj v.6 | 0.12 | 20.23 | 1.96 | 0.06 | 3.04 | 0.07 |
| GSMaP-RT v.6 | 0.23 | 24.23 | 3.31 | 0.19 | 4.17 | 0.1 |
| IMERG-ER v.6 | -0.94 | 35.8 | 15.2 | -0.9 | 4.6 | 0.48 |
| IMERG-FR v.6 | -0.39 | 27.83 | 10 | -0.3 | 3.83 | 0.31 |
| IMERG-LR v6 | -1.11 | 38.64 | 16.7 | -1 | 4.88 | 0.53 |
| MSWEP v.2.2 | 0.32 | 15.5 | 0.06 | 0.35 | 2.72 | 0.01 |
| PERSIANN-CCS-CDR | -0.54 | 30.22 | 11 | -0.3 | 2.7 | 0.26 |
| TAMSAT | 0.1 | 19.22 | 5.27 | -0.1 | 3.17 | 0.17 |
Table 8.
Categorical metrics at different time steps in the southeast of Djibouti: Ranking P-Datasets based on HSS > 1 mm with the Top 3 in light grey and Bottom 3 in dark grey (including ties).
Table 8.
Categorical metrics at different time steps in the southeast of Djibouti: Ranking P-Datasets based on HSS > 1 mm with the Top 3 in light grey and Bottom 3 in dark grey (including ties).
| P-Datasets | POD (optimum =1) | FAR (optimum = 0) | Accuracy (optimum = 1) | Error (optimum = 0) | HSS (optimum = 1) | HSS daily rainfall > 1mm (optimum = 1) |
|---|---|---|---|---|---|---|
| ARC-2 | 0.06 | 0.93 | 0.88 | 0.12 | 10-4 | 0.08 |
| CHIRP v.2 | 0.83 | 0.92 | 0.33 | 0.67 | 0.02 | 0.12 |
| CHIRPS v.2 | 0.24 | 0.75 | 0.9 | 0.1 | 0.19 | 0.21 |
| CPC | 0.45 | 0.89 | 0.71 | 0.29 | 0.07 | 0.14 |
| ERA5 | 0.95 | 0.92 | 0.26 | 0.74 | 0.03 | 0.13 |
| EWEMBI | 0.76 | 0.9 | 0.53 | 0.47 | 0.07 | 0.19 |
| JRA-55 Adj | 0.72 | 0.9 | 0.53 | 0.47 | 0.06 | 0.19 |
| MERRA-2 PT | 1 | 0.93 | 0.07 | 0.93 | 10-6 | 0.12 |
| MERRA-2 PTC | 0.9 | 0.93 | 0.24 | 0.76 | 0.01 | 0.11 |
| MSWEP v.2.2 | 0.29 | 0.9 | 0.78 | 0.22 | 0.11 | 0.20 |
| PERSIANN-CDR | 0.38 | 0.9 | 0.74 | 0.26 | 0.06 | 0.16 |
| TAMSAT | 0.1 | 0.92 | 0.86 | 0.14 | 0.01 | 0.04 |
| WFDEI-CRU | 0.71 | 0.9 | 0.54 | 0.46 | 0.06 | 0.16 |
| WFDEI-GPCC | 0.74 | 0.9 | 0.55 | 0.45 | 0.07 | 0.19 |
Table 9.
Categorical metrics at different time steps in the Ambouli Catchment: Ranking P-Datasets based on HSS > 1 mm with the Top 3 in light grey and Bottom 3 in dark grey (including ties).
Table 9.
Categorical metrics at different time steps in the Ambouli Catchment: Ranking P-Datasets based on HSS > 1 mm with the Top 3 in light grey and Bottom 3 in dark grey (including ties).
| P datasets | POD (optimum =1) | FAR (optimum = 0) | Accuracy (optimum = 1) | Error (optimum = 0) | HSS (optimum = 1) | HSS daily rainfall > 1mm (optimum = 1) |
|---|---|---|---|---|---|---|
| ARC-2 | 0.32 | 0.77 | 0.93 | 0.07 | 0.23 | 0.21 |
| CHIRP v.2 | 0.9 | 0.96 | 0.27 | 0.73 | 0.01 | 0.16 |
| CHIRPS v.2 | 0.44 | 0.78 | 0.92 | 0.08 | 0.26 | 0.25 |
| GSMaP-Adj v.6 | 0.38 | 0.84 | 0.91 | 0.09 | 0.18 | 0.22 |
| GSMaP-RT v.6 | 0.5 | 0.77 | 0.92 | 0.08 | 0.28 | 0.34 |
| IMERG-ER v.6 | 0.54 | 0.87 | 0.85 | 0.15 | 0.16 | 0.23 |
| IMERG-FR v.6 | 0.57 | 0.86 | 0.85 | 0.15 | 0.18 | 0.21 |
| IMERG-LR v6 | 0.56 | 0.86 | 0.85 | 0.15 | 0.17 | 0.24 |
| MSWEP v.2.2 | 0.58 | 0.88 | 0.82 | 0.18 | 0.24 | 0.30 |
| PERSIANN-CCS-CDR | 0.41 | 0.81 | 0.91 | 0.09 | 0.21 | 0.22 |
| TAMSAT | 0.51 | 0.85 | 0.88 | 0.12 | 0.19 | 0.21 |
Disclaimer/Publisher’s Note: The statements, opinions and data contained in all publications are solely those of the individual author(s) and contributor(s) and not of MDPI and/or the editor(s). MDPI and/or the editor(s) disclaim responsibility for any injury to people or property resulting from any ideas, methods, instructions or products referred to in the content. |
© 2023 by the authors. Licensee MDPI, Basel, Switzerland. This article is an open access article distributed under the terms and conditions of the Creative Commons Attribution (CC BY) license (http://creativecommons.org/licenses/by/4.0/).
Copyright: This open access article is published under a Creative Commons CC BY 4.0 license, which permit the free download, distribution, and reuse, provided that the author and preprint are cited in any reuse.


