
Submitted:
10 May 2023
Posted:
10 May 2023
You are already at the latest version
Abstract
Over the last several decades, large wildfires are increasingly common across the United States causing disproportionate impact on forest health and function, human well-being, and economy. Here, we examine the severity of large wildfires across the Contiguous United States over the past decade (2011-2020) using a wide array of meteorological, vegetational, and topographical features in the Deep Neural Network model. A total of 4,538 wildfire incidents were used in the analysis covering 87,305 square miles of burned area. We observed the highest number of large wildfires in California, Texas, and Idaho, with lightning causing 43 % of these incidents. Importantly, results indicate that the severity of wildfire occurrences is highly correlated with the climatological forcings, land cover, location, and elevation of the ecosystem. Overall, results may serve useful guide in managing landscapes under changing climate and disturbance regimes.
Keywords:
Climate
; Contiguous United States
; Deep Neural Network
; Land Cover
; Large Wildfire
1. Introduction
Wildfires have increased fourfold over the past forty years primarily due to fuel accumulation and fuel aridity resulting from fire suppression and climatic variability [1]. In 2022 alone, there were 68, 988 wildfires burning a total of 7.8 million acres in the United States. Approximately, 70, 000 wildfires have been occurring every year over the past decade burning 7 million acres annually. Indeed, wildfires depend on ecoregions and ignition sources and are reported to cause serious repercussions on climate and ecology [2]. They impair wildlife habitat, alter forest structure and composition, reduce biodiversity [3], change soil structure and watershed processes [4], and affect human values, property [3], health, and well-being [5]. Recently, Burke et al. (2021) [1] estimated nearly 25% of PM2.5 across the United States resulting from wildfires [1]. However, a paradigm shift in wildfire policy has been apparent in recent years to counteract long-term risks and restore ecological functionality [3], [6]. Fires and associated problems are increasingly viewed from socioecological lenses and different management approaches like prescribed fire [7], fuel treatments (mastication, thinning) [8], and polycentric all land management (ALM) [9] have been brought into play. Yet, wildfires risk assessment and modelling are challenging due to dynamic climatic variables and complex fire behavior. Improved predictive tools and approaches are, therefore, necessary for wildfire prediction and managing unprecedented fires over time and space scales. Much progress has been made in using artificial neural networks, particularly multilayer perceptrons in predicting wildfires, but studies focusing on the use of Deep Neural Networks (DNN) in predicting wildfire spread are generally few. DNN, such as convolutional neural networks and recurrent neural networks (in particular, long short-term memory), are deep learning methods which have multiple non-linear hidden networks and have been successfully applied in detecting wildfires from satellite observations [10] or predicting wildfires spread using meteorological variables like wind, temperature, and humidity [11]. However, many such studies are limited to small spatial and temporal scales. In this short-communication paper, we examine the severity of large wildfires across the Contiguous United States over the past decade (2011-2020) using a wide array of meteorological, land cover, and topographical features in the Deep Neural Network model. Here, large wildfires are used to mean areas burned being greater than 500 acres in the Eastern and 1000 acres in the Western United States. The data-driven approaches in this paper will be instrumental in understanding different factors influencing the occurrence and severity of wildfires and thereby facilitating wildfire management and policies.
2. Materials and Methods
The study area comprises the Contiguous United States (CONUS), which are divided into 11 Level I Ecoregions and 967 Level IV sub-Ecoregions [12]. The western regions of the study area typically experience a higher number of wildfire incidents and encompass larger burn area compared with the western United states [13] due largely to the heterogeneity in landscape caused by human development and fragmentation of forest land cover [2]. The GIS data for wildfires locations and burned areas boundaries was obtained from the Monitoring Trends in Burn Severity (MBTS) program [14] (https://data.fs.usda.gov/geodata/edw/datasets.php?xmlKeyword=Burn). The program assesses the frequency, extent, and magnitudes of all large wildland fires in the United States. The thresholds for large wildfires are set to greater than 1,000 acres in the western United States and 500 acres in the Eastern United States. A period of 10 years between 2011 and 2020 was selected for analysis and the “prescribed wildfires” were removed from the dataset. A total of 4,538 wildfire incidents were used in the analysis covering 87,305 square miles of burn area. Additionally, 1992-2015 spatial wildfire occurrence dataset [15] was used to analyze large wildfires causes (https://data.fs.usda.gov/geodata/edw/edw_resources/meta/S_USA.FPA_FOD_4thedition.xml). In order to identify potential wildfires hotspots, the number of wildfire occurrences and burn area were also evaluated within each Level IV ecoregion. Figure 1 shows the point locations for occurrence of large wildfires and potential wildfire hotspots between 2011 and 2020 in the Contiguous United States.
Meteorological variables were obtained from different sources (Table 1) for wildfire prediction. Briefly, monthly climate attributes including total monthly precipitation, mean monthly temperature, and maximum and minimum vapor pressure deficit were obtained from the PRISM dataset. The Palmer Drought Severity Index (PDSI) was obtained from GRIDMET to infer the relative dryness in the region. The index typically ranges from -10 (dry) to +10 (wet) [16]. The land cover data was obtained from the National Land Cover Dataset (NLCD). The 30-meter NLCD raster for year 2016 was used to obtain land cover percentages around a 4-kilometer buffer at the point of wildfire occurrence. The 4-kilometer radius was selected based on the mean burn area of all wildfires in the dataset to represent the amount of forest and shrubland available near the fire area that could potentially increase the extent of wildfires. The relationship between land cover and wildfires was examined using NLCD land cover classes within the 4,538 burn area boundaries. Normalized Difference Vegetation Index (NDVI) and Enhanced Vegetation Index (EVI),1 kilometer resolution, were obtained from the Moderate Resolution Imaging Spectroradiometer (MODIS) satellite dataset (MOD13A3). Elevation data was obtained from the United States Geological Survey (USGS) Digital Elevation Model (DEM) dataset at 100-meter spatial resolution. All these datasets were spatially and temporally linked to each of the 4,538 wildfires that occurred in the contiguous US between 2011 and 2020 using R 4.3.0 and ArcGIS (Version 10.2).
The Deep Neural Network (DNN) model was utilized to predict wildfires based on climatological and geological attributes surrounding the point of wildfire origin. Further, keras and tensorflow libraries in python were used. The dataset was split into training and testing data using an 80/20 split. Thus, eighty percent of the data was used for training and validation and 20% for testing the accuracy of the DNN model. Further, the data was split three times to generate multiple random samples of training and test data to evaluate the accuracy over multiple test set combinations. Wildfires with missing attributes were removed from the study resulting in a total of 4,536 observations for model development. Prior to being used in the DNN model, the wildfire acres were log-transformed to account for any skewness in the observed data and to normalize the target’s distribution.
Different features in Table 2 were scaled using a standard scaler and fed as inputs to a DNN model with five layers. The DNN layers had 512, 256, 64, 16 and 1 neurons respectively. ReLU was used as the activation function for each of the five DNN layers. The DNN model was trained using root mean square optimizer and 0.001 learning rate. Callbacks were used to monitor validation loss. Mean squared error (MSE) was utilized as the loss function and mean absolute error (MAE) was used as a performance metric. The model was trained for 200 epochs with batch size of 32 and validation split of 0.2. For each of the three values of random seed that was used for generating train and test sets, plots for training loss and validation loss were convex in nature. The error rate for the test data was determined using equation below:
SHapley Additive exPlanations (SHAP) values were used to determine the relative importance of each model feature and partial dependence to evaluate the relationships between model features and burn area. SHAP is a surrogate explanation method for ML models, which computes values that quantify the contribution of each feature to a prediction based on cooperative game theory [17]. Thus, SHAP values could be used in interpreting the DNN model and determine the potential drivers of wildfire. Model prediction equals the sum of all feature SHAP values and the average prediction. A positive SHAP values indicate an increase in the model's prediction due to the feature, whereas negative SHAP values indicate a decrease in prediction.
3. Results and Discussion
Wildfires are natural or human-induced events occurring in forests, grasslands, and prairies driven by ignition, fuel, droughts, and conductive weather conditions [18]. The distribution of total large wildfires by states and potential causes is illustrated in Figure 2. The highest number of large wildfires between 2011-2020 occurred in California (448 incidents), followed by Texas (434 incidents), and Idaho (426 incidents). About 43 percent of large wildfires were caused by lightning, followed by "Miscellaneous" (18%), unidentified (10%), arson (9%), equipment use (8%), and debris burning (6%). Importantly, our data excludes small wildfires (500 acres) that are more frequent and caused largely by human activities [19]. The percentage of burned area per level IV ecoregion illustrates the severity of wildfires in various ecosystems (Figure 3). The area consumed by wildfires was higher in Mediterranean California, the Marine West Coast Forest, and North American Desserts, and smaller in Northern and Eastern Temperate Forests (Figure 3). Most of these burned areas were grassland, forest, and shrub/scrub land covers (Figure 4). The mean absolute SHAP values for grassland, forest, and shrub cover were 0.6, 0.43, and 0.35, respectively (Figure 5), indicating their predominant role in wildfire spread. We also observed the highest number of wildfires in July and August, which are typically the hottest and driest months. Temperatures in these months were approximately 21 and 24 oC, respectively (Figure 6). Indeed, warmer temperatures and extended droughts may exacerbate the vulnerability of forests and occurrence of wildfire events. The climatic dependency of wildfire behavior and spread further highlights the importance of managing fuel and restoring ecology in combating fire hazards and associated impacts [20].
Here, DNN model was utilized to predict wildfires occurrence based on climatological and geological features. Only a few studies have attempted to utilize DNN model in wildfire studies. For example, Zhang et al. (2021) [21] compared four multilayer perceptrons and CNN architectures in wildfire modeling and reported highest accuracy in predicting seasonal peak in fire activity and vulnerable areas with CNN-2D, a deep neural network model. Langford et al. (2018) [22] used DNN to detect wildfire events in Alaska for wildfire year 2004 and highlighted the utility of validation-loss weight selection approach for accurately mapping wildfire on an imbalanced dataset. In another study, deep neural computing optimized by using adaptive moment estimation algorithms showed highest accuracy in forest fire prediction compared with stochastic gradient descent, root mean square propagation, and Adadelta optimizers [23]. In our model, for test sets generated in each of the three values of random seed, the MAE was found to be between 0.055 and 0.06. This lower value of MAE indicates a higher accuracy of wildfire prediction.
The land cover classes around 4-kilometer buffer at the point of occurrence including percentage of Grasslands/Herbaceous, percentage of Forests, and percentage of Shrublands were found to be the most influential in predicting wildfire burn area within a 4 km radius of the point of wildfire occurrence. Fire activities in such locations are largely associated with fuel loads and flammability. Fuels in grasslands are generally dry which could easily and rapidly spread fires [24]. The location of wildfires, as represented by latitude, was also important in predicting burn area. Indeed, precipitation regimes vary with latitude-longitudes, with lower latitudes exhibiting reduced rainfall and moisture, and drier conditions [24].
A non-linear relationship existed between features and the predicted burn area (Figure 7), consistent with many other global studies [25]. An increase in forest area within a 4-kilometer buffer zone surrounding the point of wildfire occurrence was correlated positively with the burn area. A forest cover of 30 percent or more increased the predicted burn area above the mean. Longitude alone had negative SHAP values indicating poor performance in forecasting fire spread. However, higher elevation had positive SHAP values indicating larger burn areas in regions with higher elevation. Generally, fire activities are higher in steeper areas [24]. In the western United States, Westerling et al. (2006) [20] observed greatest wildfires in the mid-elevation range, occurring mostly as episodic events. These events were further associated with spring snowmelt timing. Topographic features may, however, develop decisively in fire spread when burning conditions are rather less extreme [26].
4. Conclusions
This study analyzed and predicted the large wildfires across the contiguous United States from 2011 to 2020. Results showed that the highest number of large wildfires and area consumed by wildfires occurred in California. Also, wildfires occurred mostly during July and August months. Results from DNN model indicate that land cover and the location (latitude and longitude) of wildfire occurrence are most likely to determine the severity and extent of wildfires in the United States. Indeed, predictive models utilizing machine learning and remote sensing tools, climate, and geospatial data are useful in understanding wildfires complexity and predicting and mitigating fire hazards. However, additional features like soil characteristics and 100-hour fuel moisture could be integrated into the DNN model to improve model accuracy and prediction.
Acknowledgments
This work was presented in the 2023 TAMIDS Data Science Competition. We extend our sincere thanks to different scientists and researchers for their valuable comments and suggestions that helped in designing and improving this paper.
Declaration of Competing Interest: The authors declare that they have no known competing financial interests or personal relationships that could have appeared to influence the work reported in this paper.
Disclaimer: The authors are responsible for the views expressed in this paper and do not necessarily represent or reflect the views and policies of the universities.
References
- Alley, W.M. The Palmer drought severity index: limitations and assumptions. Journal of Applied Meteorology and Climatology 1984, 23, 1100–1109. [Google Scholar] [CrossRef]
- Burke, M.; Driscoll, A.; Heft-Neal, S.; Xue, J.; Burney, J.; Wara, M. The changing risk and burden of wildfire in the United States. Proceedings of the National Academy of Sciences 2021, 118, e2011048118. [Google Scholar] [CrossRef] [PubMed]
- Malamud, B.D.; Millington, J.D.; Perry, G.L. Characterizing wildfire regimes in the United States. Proceedings of the National Academy of Sciences 2005, 102, 4694–4699. [Google Scholar] [CrossRef] [PubMed]
- Moritz, M.A.; Batllori, E.; Bradstock, R.A.; Gill, A.M.; Handmer, J.; Hessburg, P.F.; Leonard, J.; McCaffrey, S.; Odion, D.C.; Schoennagel, T.; et al. Learning to coexist with wildfire. Nature 2014, 515, 58–66. [Google Scholar] [CrossRef] [PubMed]
- Ice, G.G.; Neary, D.G.; Adams, P.W. Effects of wildfire on soils and watershed processes. Journal of Forestry 2004, 102, 16–20. [Google Scholar]
- Xu, R.; Yu, P.; Abramson, M.J.; Johnston, F.H.; Samet, J.M.; Bell, M.L.; Haines, A.; Ebi, K.L.; Li, S.; Guo, Y. Wildfires, global climate change, and human health. New England Journal of Medicine 2020, 383, 2173–2181. [Google Scholar] [CrossRef] [PubMed]
- Steelman, T.A.; Burke, C.A. Is wildfire policy in the United States sustainable? Journal of Forestry 2007, 105, 67–72. [Google Scholar] [CrossRef]
- Kolden, C.A. We’re not doing enough prescribed fire in the Western United States to mitigate wildfire risk. Fire 2019, 2, 30. [Google Scholar] [CrossRef]
- Reinhardt, E.D.; Keane, R.E.; Calkin, D.E.; Cohen, J.D. Objectives and considerations for wildland fuel treatment in forested ecosystems of the interior western United States. Forest Ecology and Management 2008, 256, 1997–2006. [Google Scholar] [CrossRef]
- Kelly, E.C.; Charnley, S.; Pixley, J.T. Polycentric systems for wildfire governance in the Western United States. Land Use Policy 2019, 89, 104214. [Google Scholar] [CrossRef]
- Yao, J.; Raffuse, S.M.; Brauer, M.; Williamson, G.J.; Bowman, D.M.; Johnston, F.H.; Henderson, S.B. Predicting the minimum height of forest fire smoke within the atmosphere using machine learning and data from the CALIPSO satellite. Remote Sensing of Environment 2018, 206, 98–106. [Google Scholar] [CrossRef]
- Cortez, P.; Morais, A.D.J.R. A data mining approach to predict forest fires using meteorological data. 2007.
- Omernik, J.M. Ecoregions of the conterminous United States. Annals of the Association of American Geographers 1987, 77, 118–125. [Google Scholar] [CrossRef]
- Nagy, R.C.; Fusco, E.; Bradley, B.; Abatzoglou, J.T.; Balch, J. Human-related ignitions increase the number of large wildfires across US ecoregions. Fire 2018, 1, 4. [Google Scholar] [CrossRef]
- Eidenshink, J.; Schwind, B.; Brewer, K.; Zhu, Z.L.; Quayle, B.; Howard, S. A project for monitoring trends in burn severity. Fire Ecology 2007, 3, 3–21. [Google Scholar] [CrossRef]
- Short, K.C. Spatial wildfire occurrence data for the United States, 1992-2015 [FPA_FOD_20170508]. 2017.
- Alley, W.M. The Palmer drought severity index: limitations and assumptions. Journal of Applied Meteorology and Climatology 1984, 23, 1100–1109. [Google Scholar] [CrossRef]
- Lundberg, S.M.; Lee, S.I. A unified approach to interpreting model predictions. Advances in Neural Information Processing Systems 2017, 30. [Google Scholar]
- Pausas, J.G.; Keeley, J.E. Wildfires and global change. Frontiers in Ecology and the Environment 2021, 19, 387–395. [Google Scholar] [CrossRef]
- Prestemon, J.P.; Prestemon, J.P. Wildfire ignitions: a review of the science and recommendations for empirical modeling; US Department of Agriculture, Forest Service, Southern Research Station: Asheville, NC, USA, 2013; p. 24. [Google Scholar]
- Westerling, A.L.; Hidalgo, H.G.; Cayan, D.R.; Swetnam, T.W. Warming and earlier spring increase western US forest wildfire activity. Science 2006, 313, 940–943. [Google Scholar] [CrossRef]
- Zhang, G.; Wang, M.; Liu, K. Deep neural networks for global wildfire susceptibility modelling. Ecological Indicators 2021, 127, 107735. [Google Scholar] [CrossRef]
- Langford, Z., Kumar, J., & Hoffman, F. (2018, November). Wildfire mapping in Interior Alaska using deep neural networks on imbalanced datasets. In 2018 IEEE International Conference on Data Mining Workshops (ICDMW) (pp. 770-778). IEEE. [CrossRef]
- Van Le, H., Hoang, D.A., Tran, C.T., Nguyen, P.Q., Hoang, N.D., Amiri, M., ... & Bui, D.T. (2021). A new approach of deep neural computing for spatial prediction of wildfire danger at tropical climate areas. Ecological Informatics, 63, 101300. [CrossRef]
- Stavi, I. Wildfires in grasslands and shrublands: A review of impacts on vegetation, soil, hydrology, and geomorphology. Water 2019, 11, 1042. [Google Scholar] [CrossRef]
- Li, L.M.; Song, W.G.; Ma, J.; Satoh, K. Artificial neural network approach for modeling the impact of population density and weather parameters on forest fire risk. International Journal of Wildland Fire 2009, 18, 640–647. [Google Scholar] [CrossRef]
- Turner, M.G.; Romme, W.H. Landscape dynamics in crown fire ecosystems. Landscape ecology 1994, 9, 59–77. [Google Scholar] [CrossRef]
Figure 1.
Large wildfire incidents in the contiguous United States between 2011 and 2020.
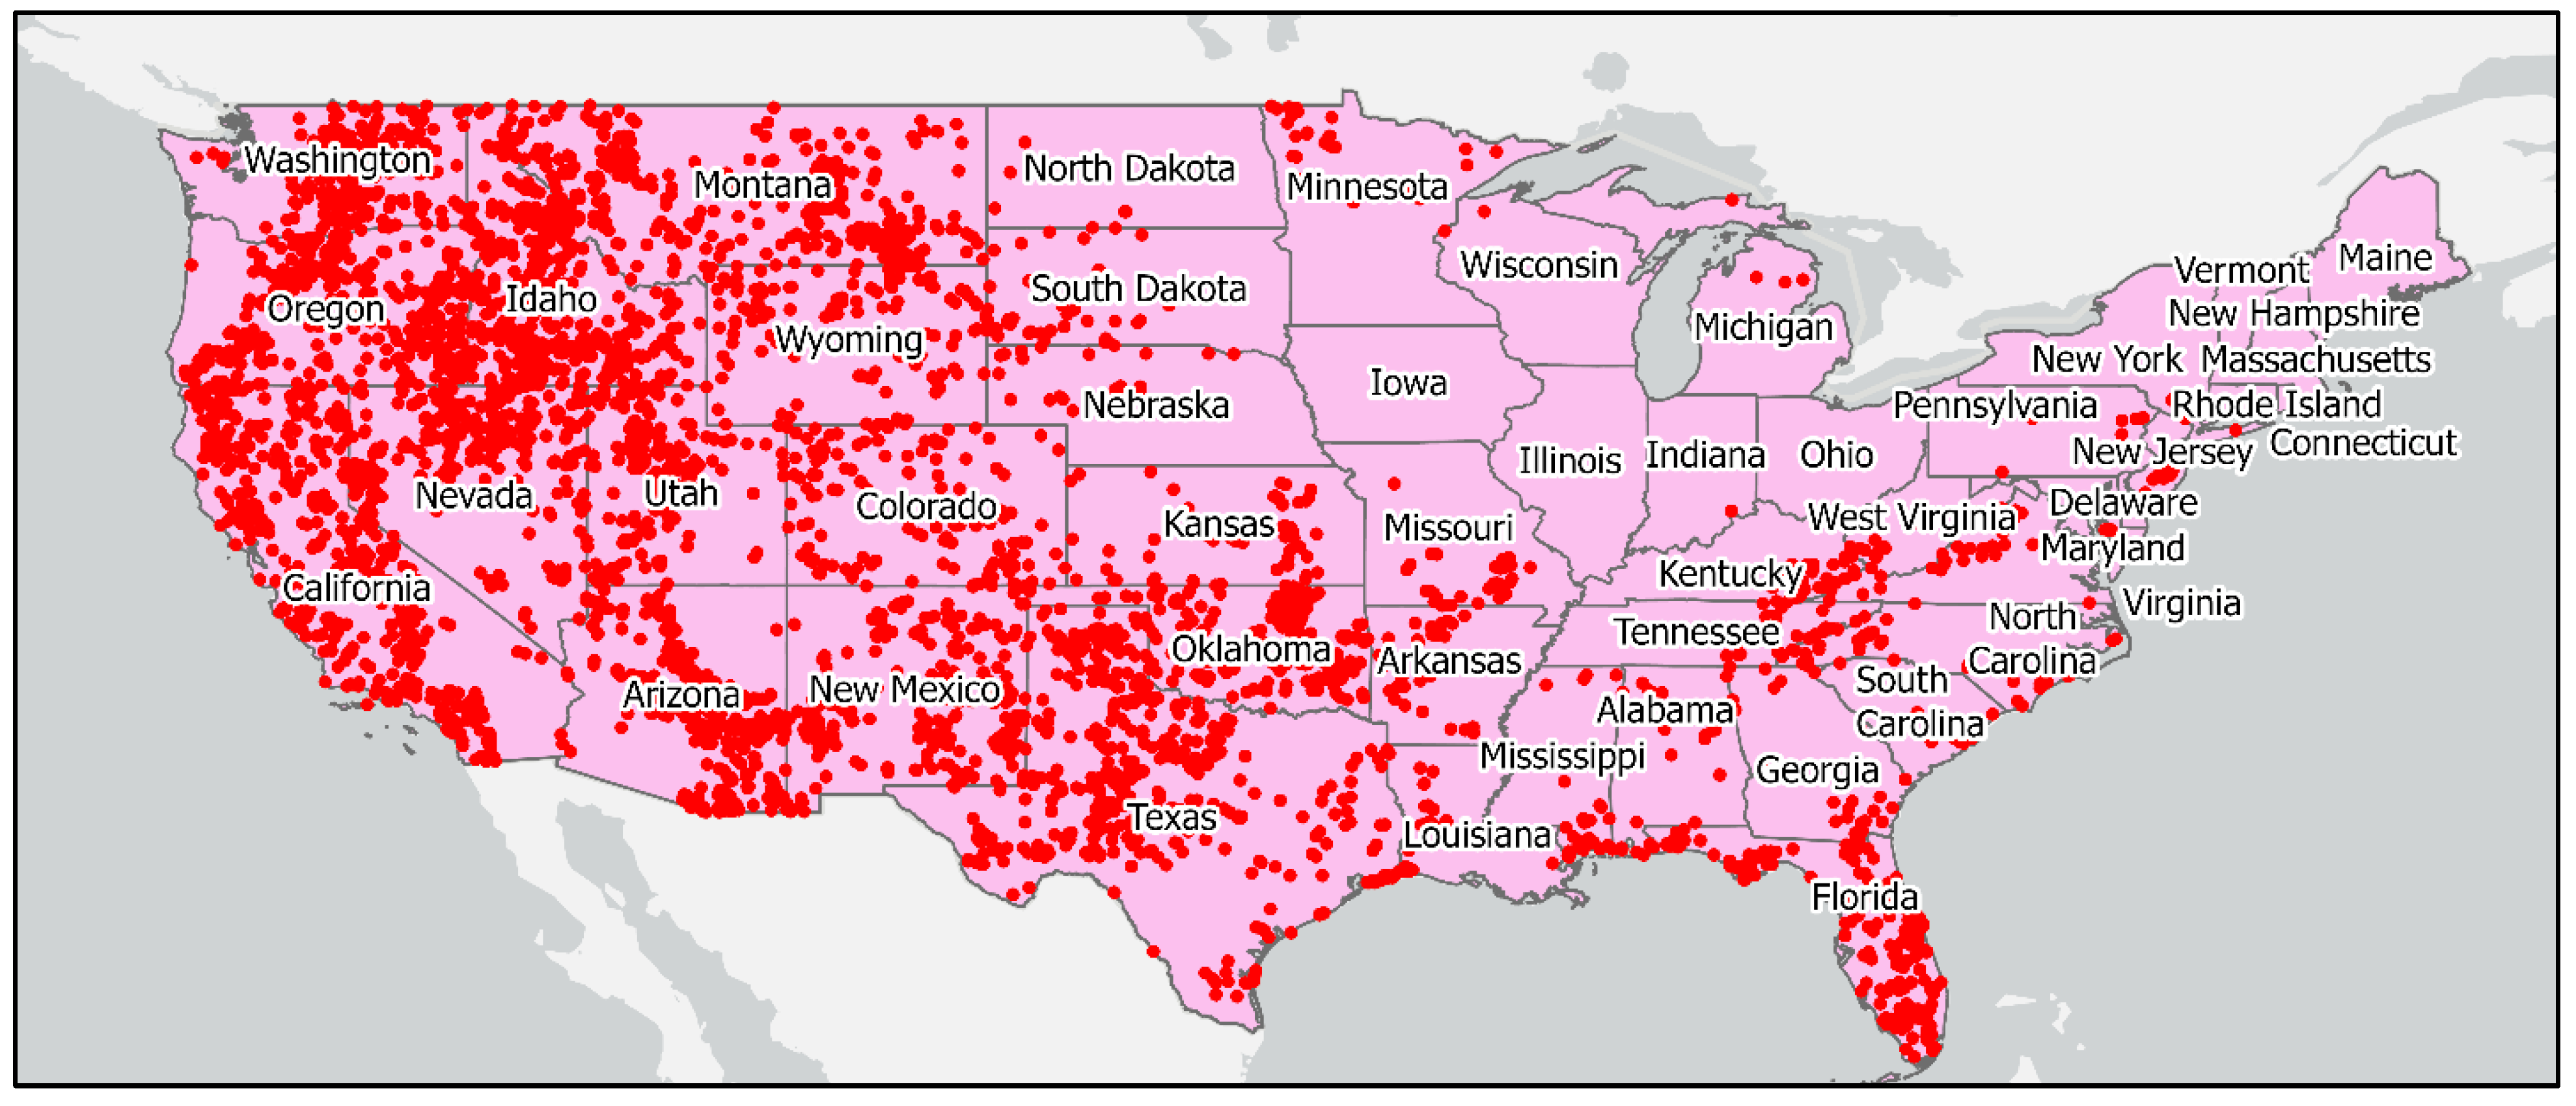
Figure 2.
Average annual large wildfire incidents by states (Left) and cause of large wildfires (>500 acres) in the contiguous United States between 2011-2015 (Right).
Figure 2.
Average annual large wildfire incidents by states (Left) and cause of large wildfires (>500 acres) in the contiguous United States between 2011-2015 (Right).
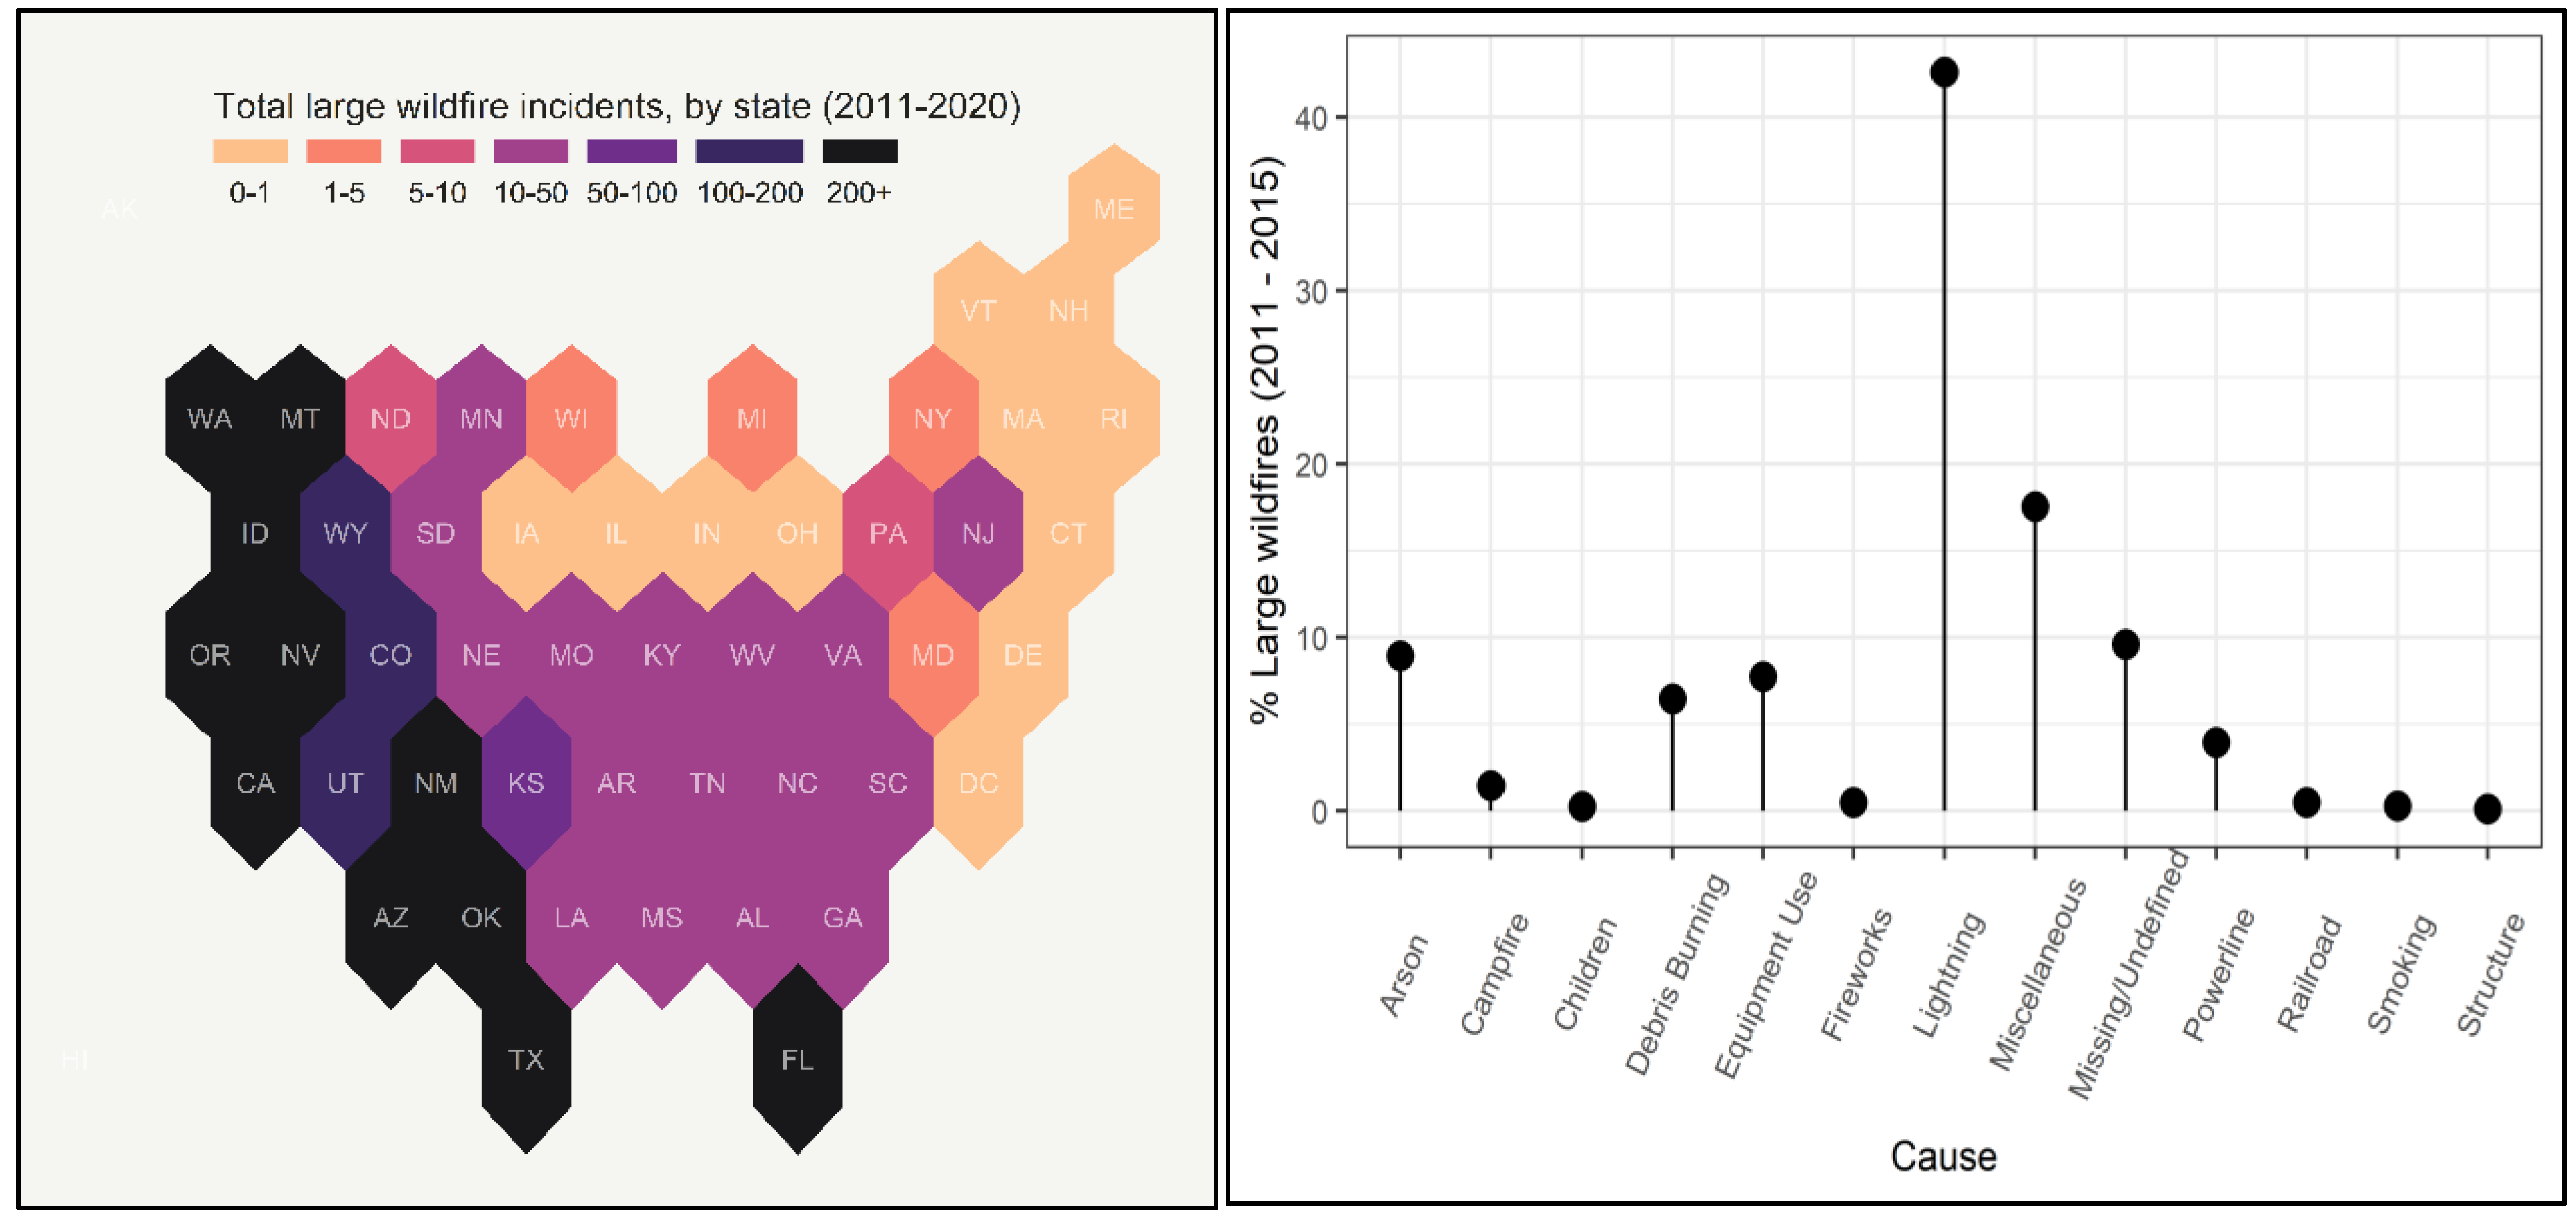
Figure 3.
Percent of Level IV Ecoregion land burned in large wildfires between 2011-2020.
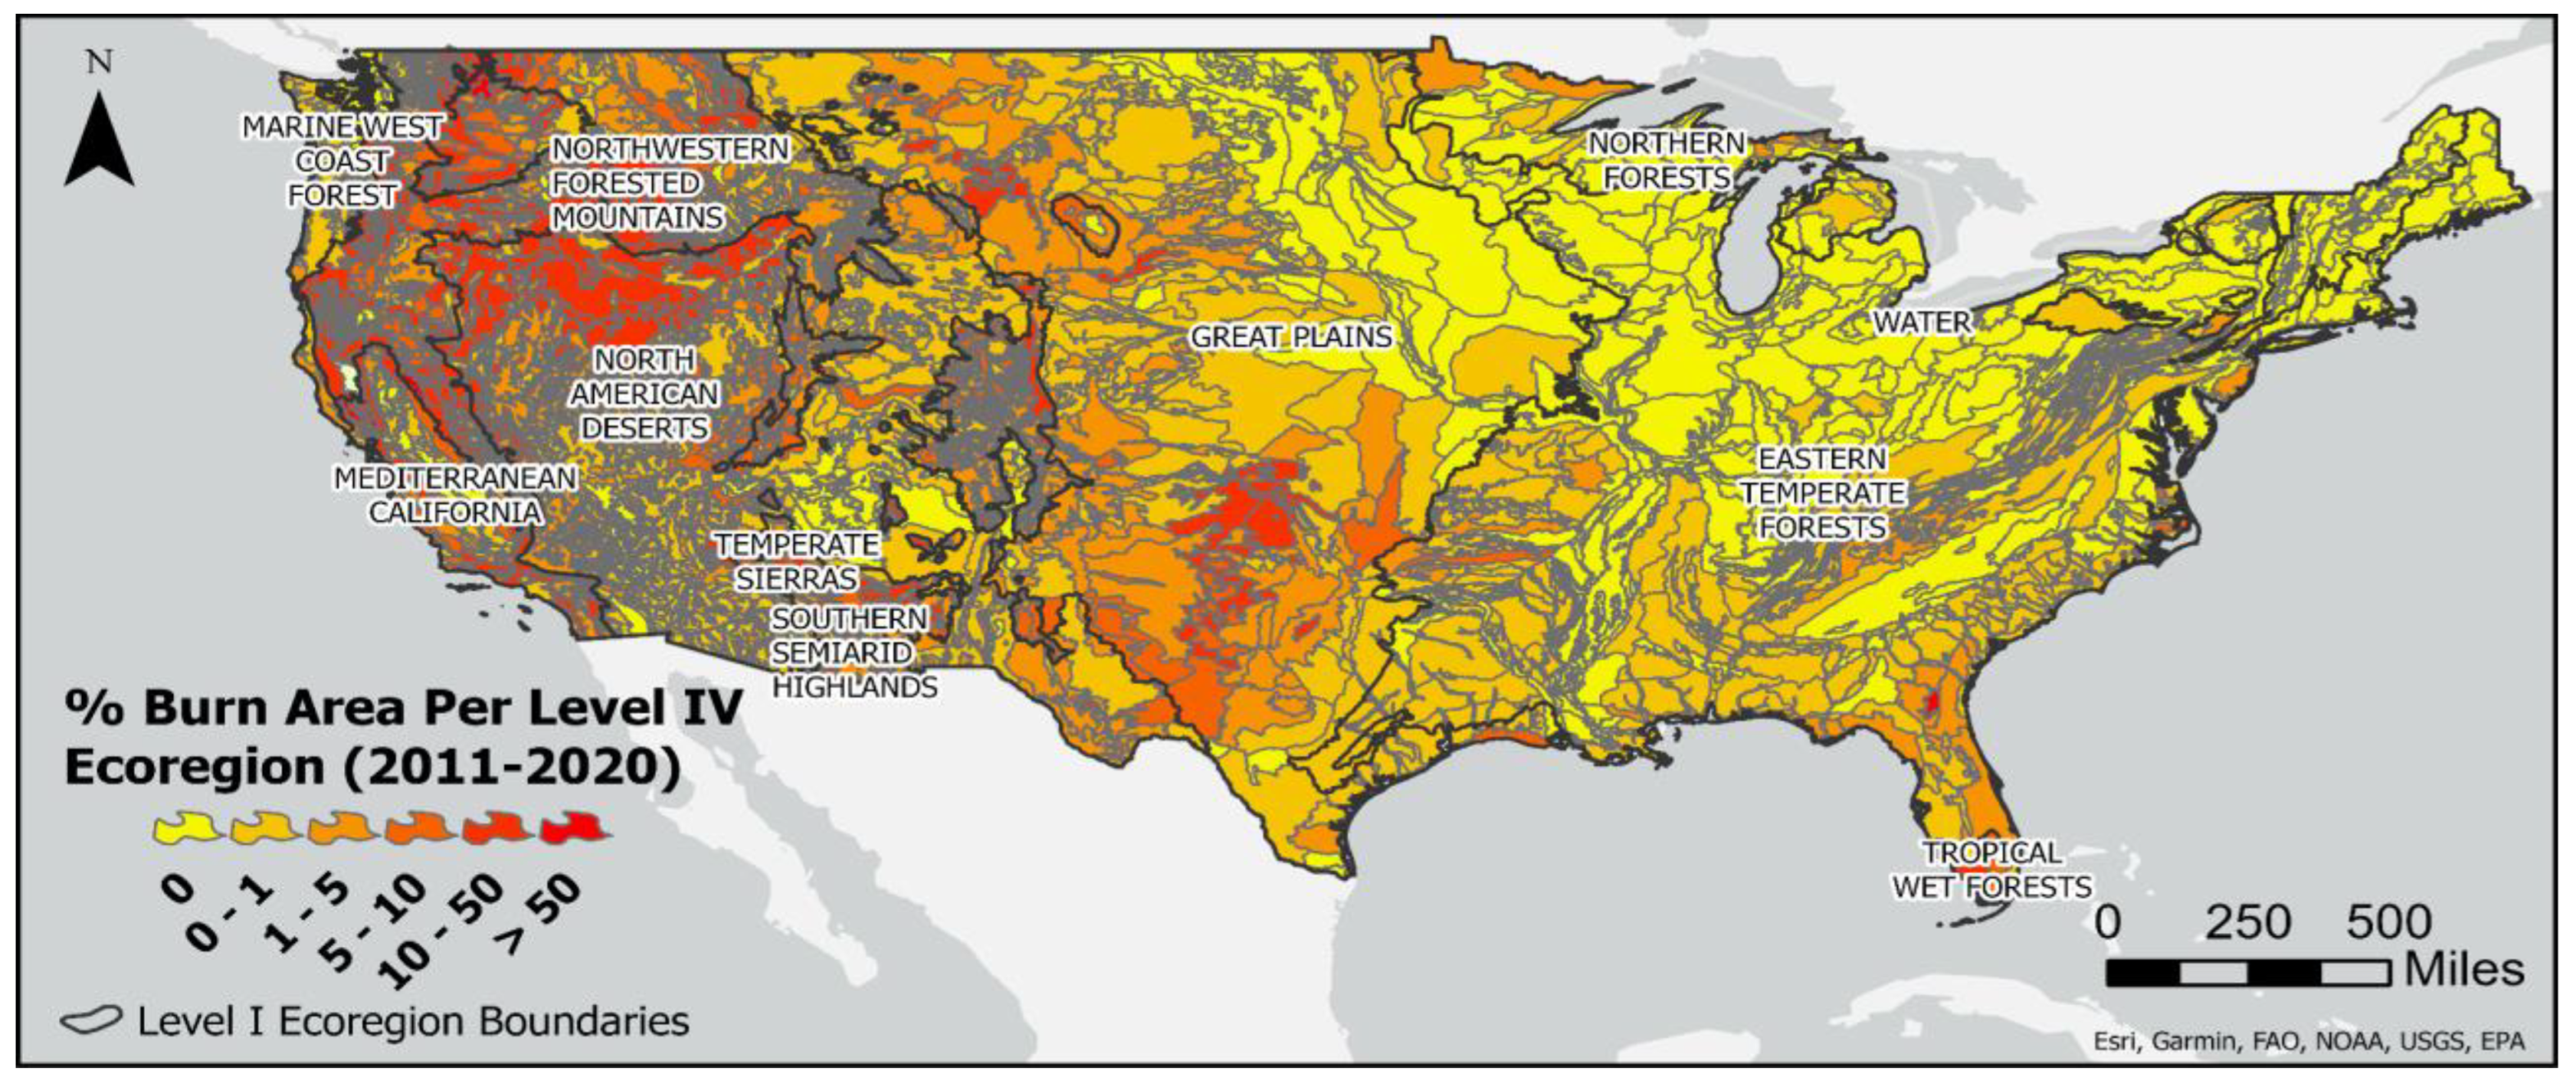
Figure 4.
Burn area by NLCD land cover in large wildfires between 2011-2020 (Left) and an example of NLCD land cover within the burned area in the September 2011 Riley Road wildfire northwest of Houston burning 19,000 acres of land (Right).
Figure 4.
Burn area by NLCD land cover in large wildfires between 2011-2020 (Left) and an example of NLCD land cover within the burned area in the September 2011 Riley Road wildfire northwest of Houston burning 19,000 acres of land (Right).
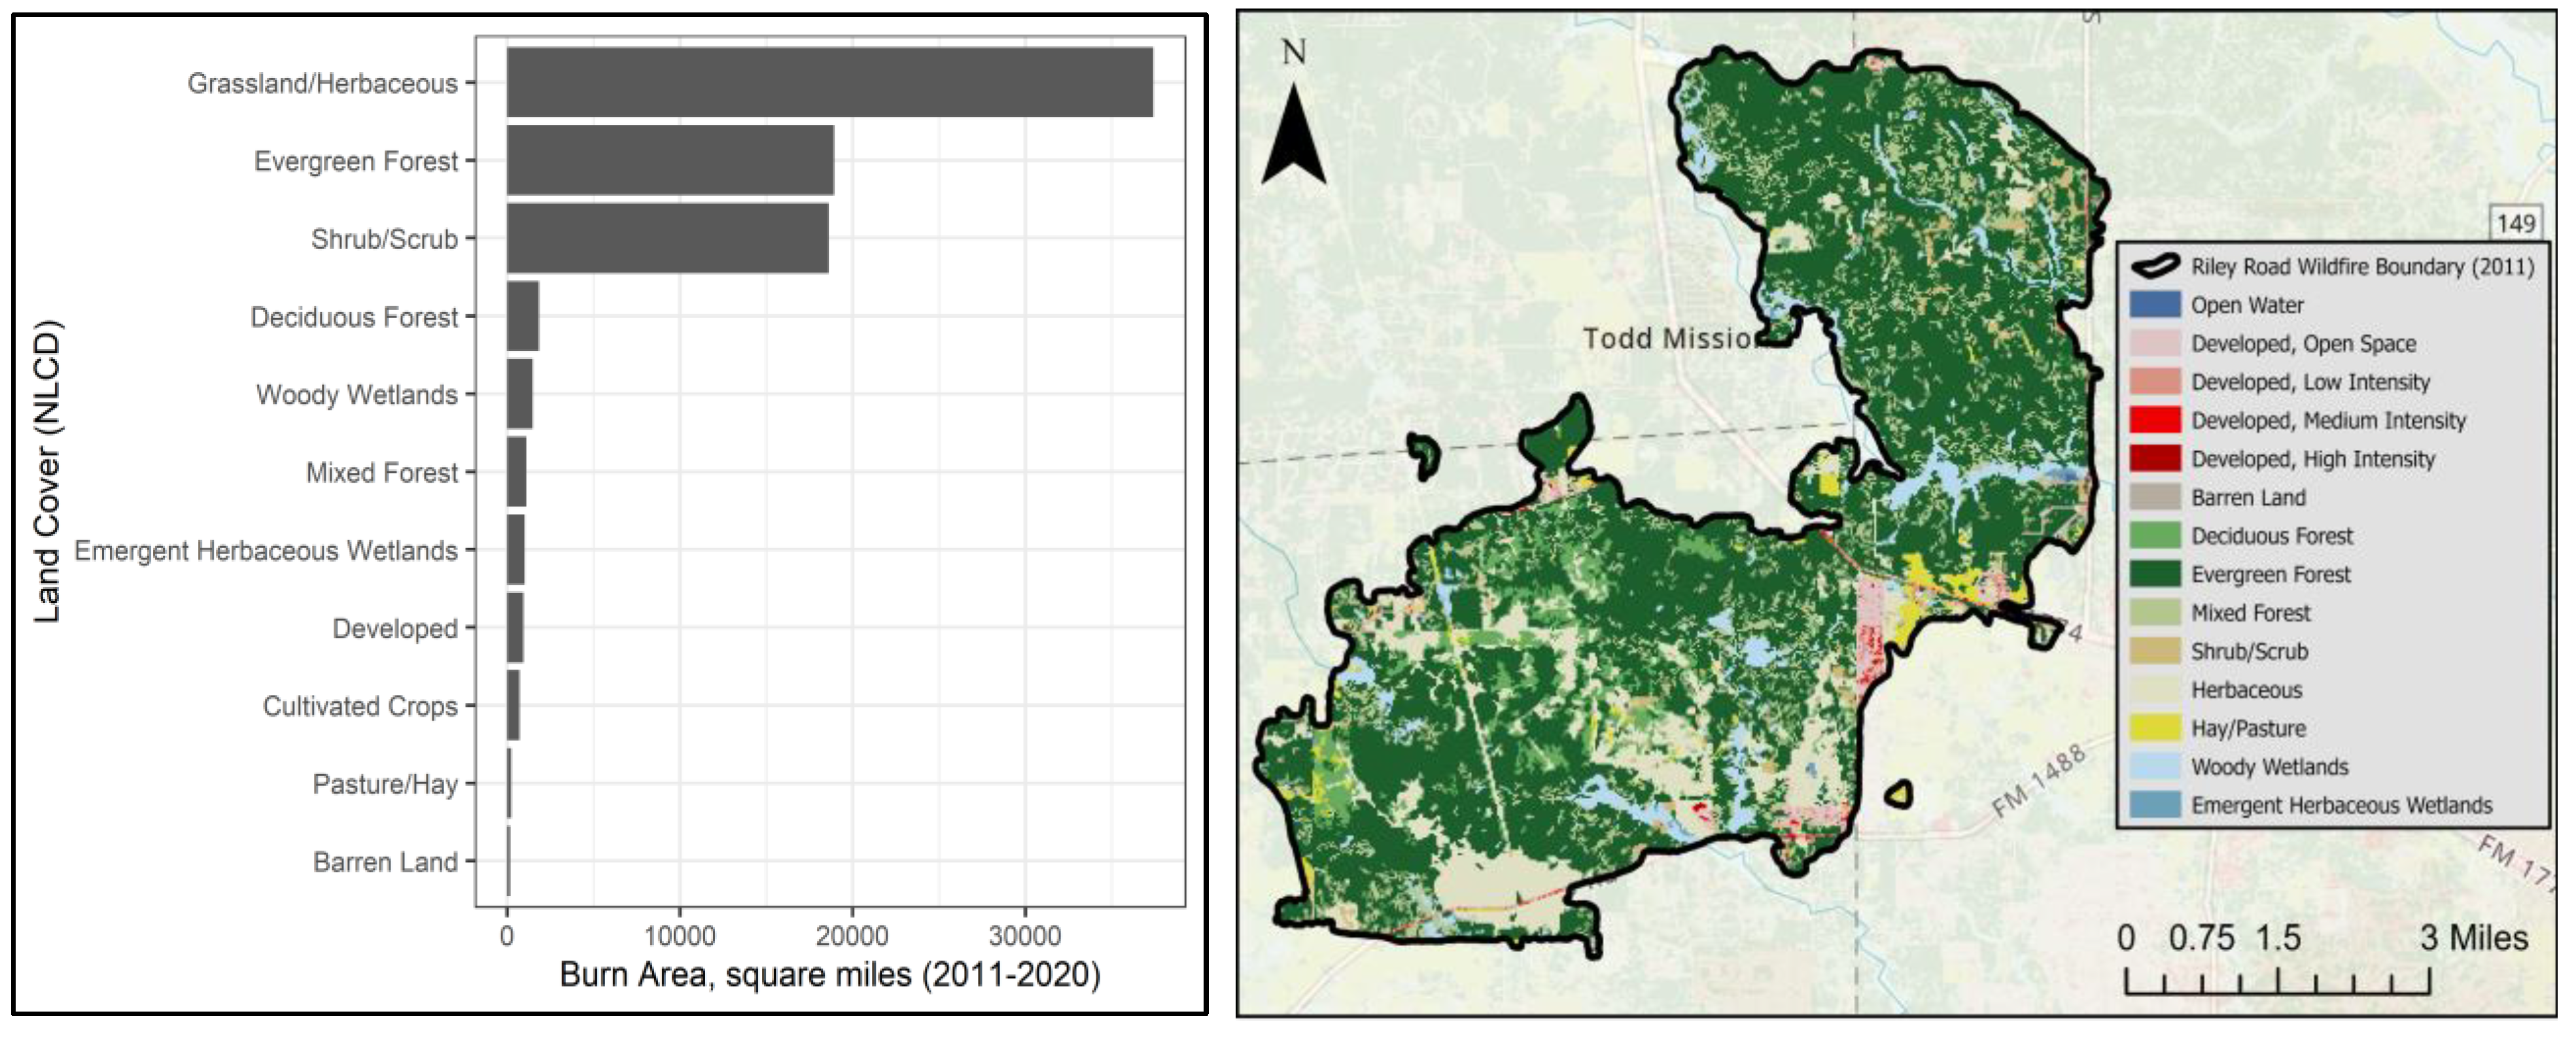
Figure 5.
Feature importance in the DNN model obtained from SHAP values.
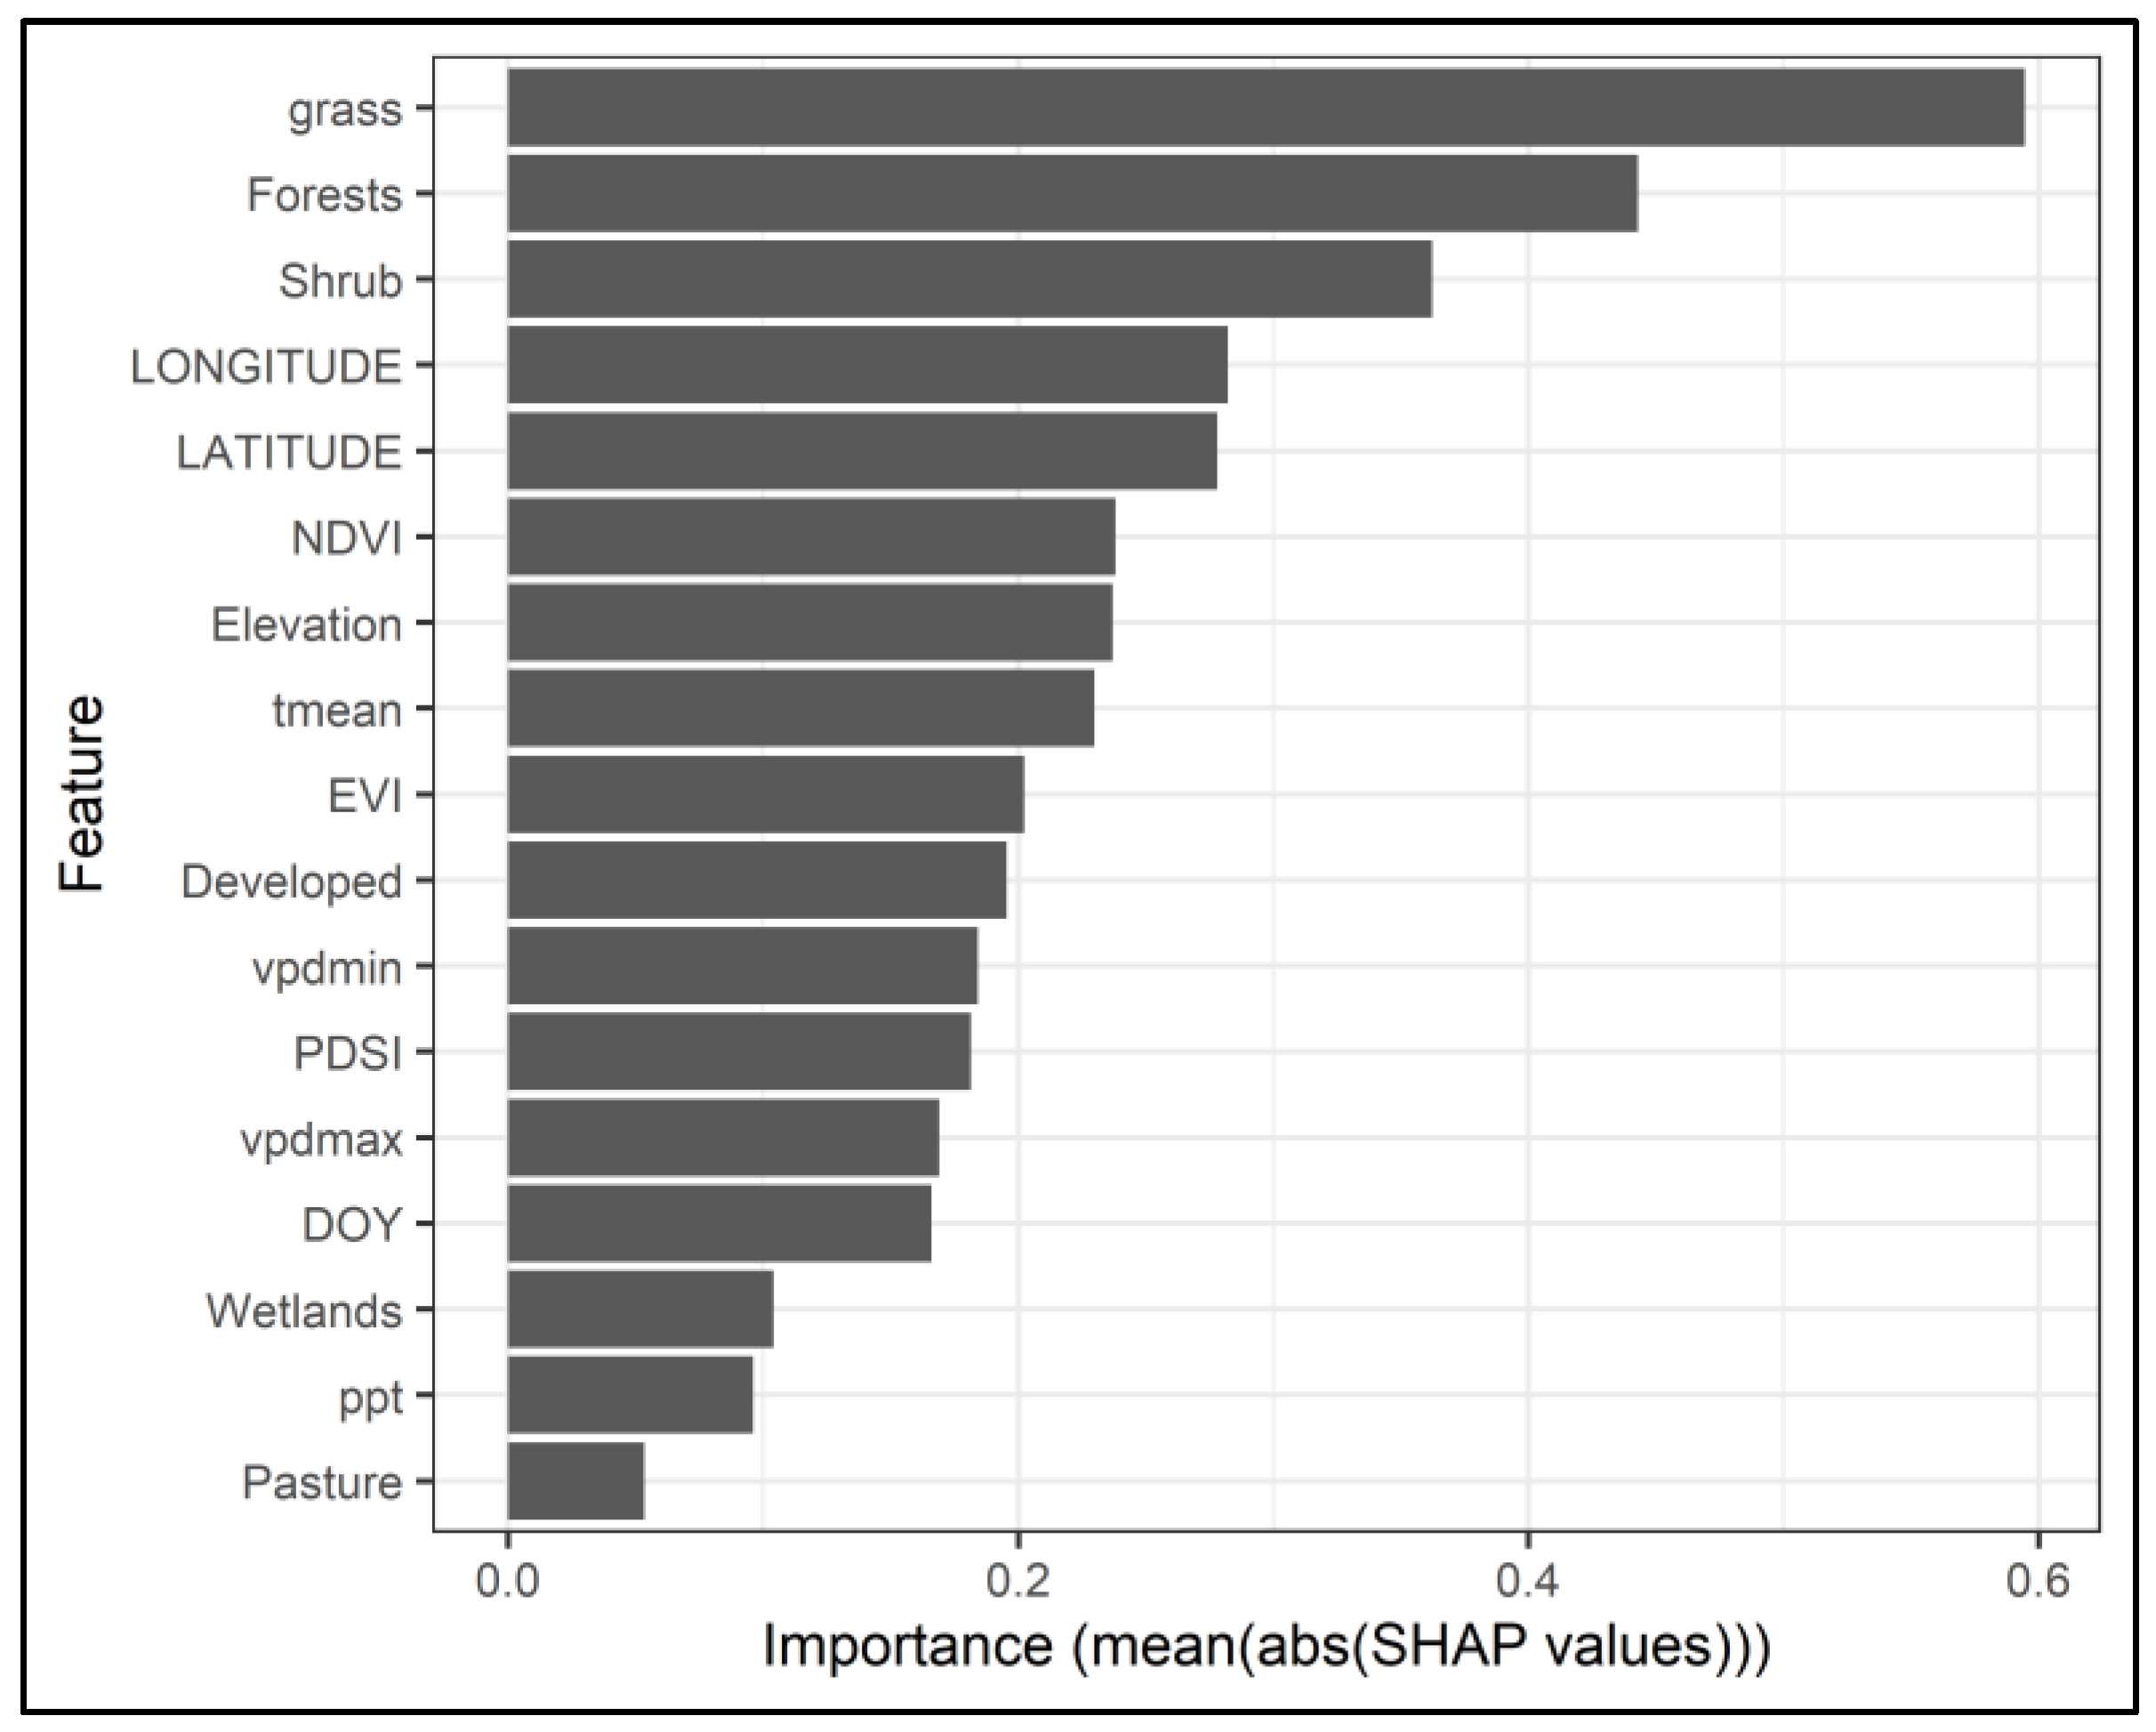
Figure 6.
Plot showing the relationship between average monthly large wildfires (primary y-axis) in the contiguous US and the mean monthly temperature (line).
Figure 6.
Plot showing the relationship between average monthly large wildfires (primary y-axis) in the contiguous US and the mean monthly temperature (line).
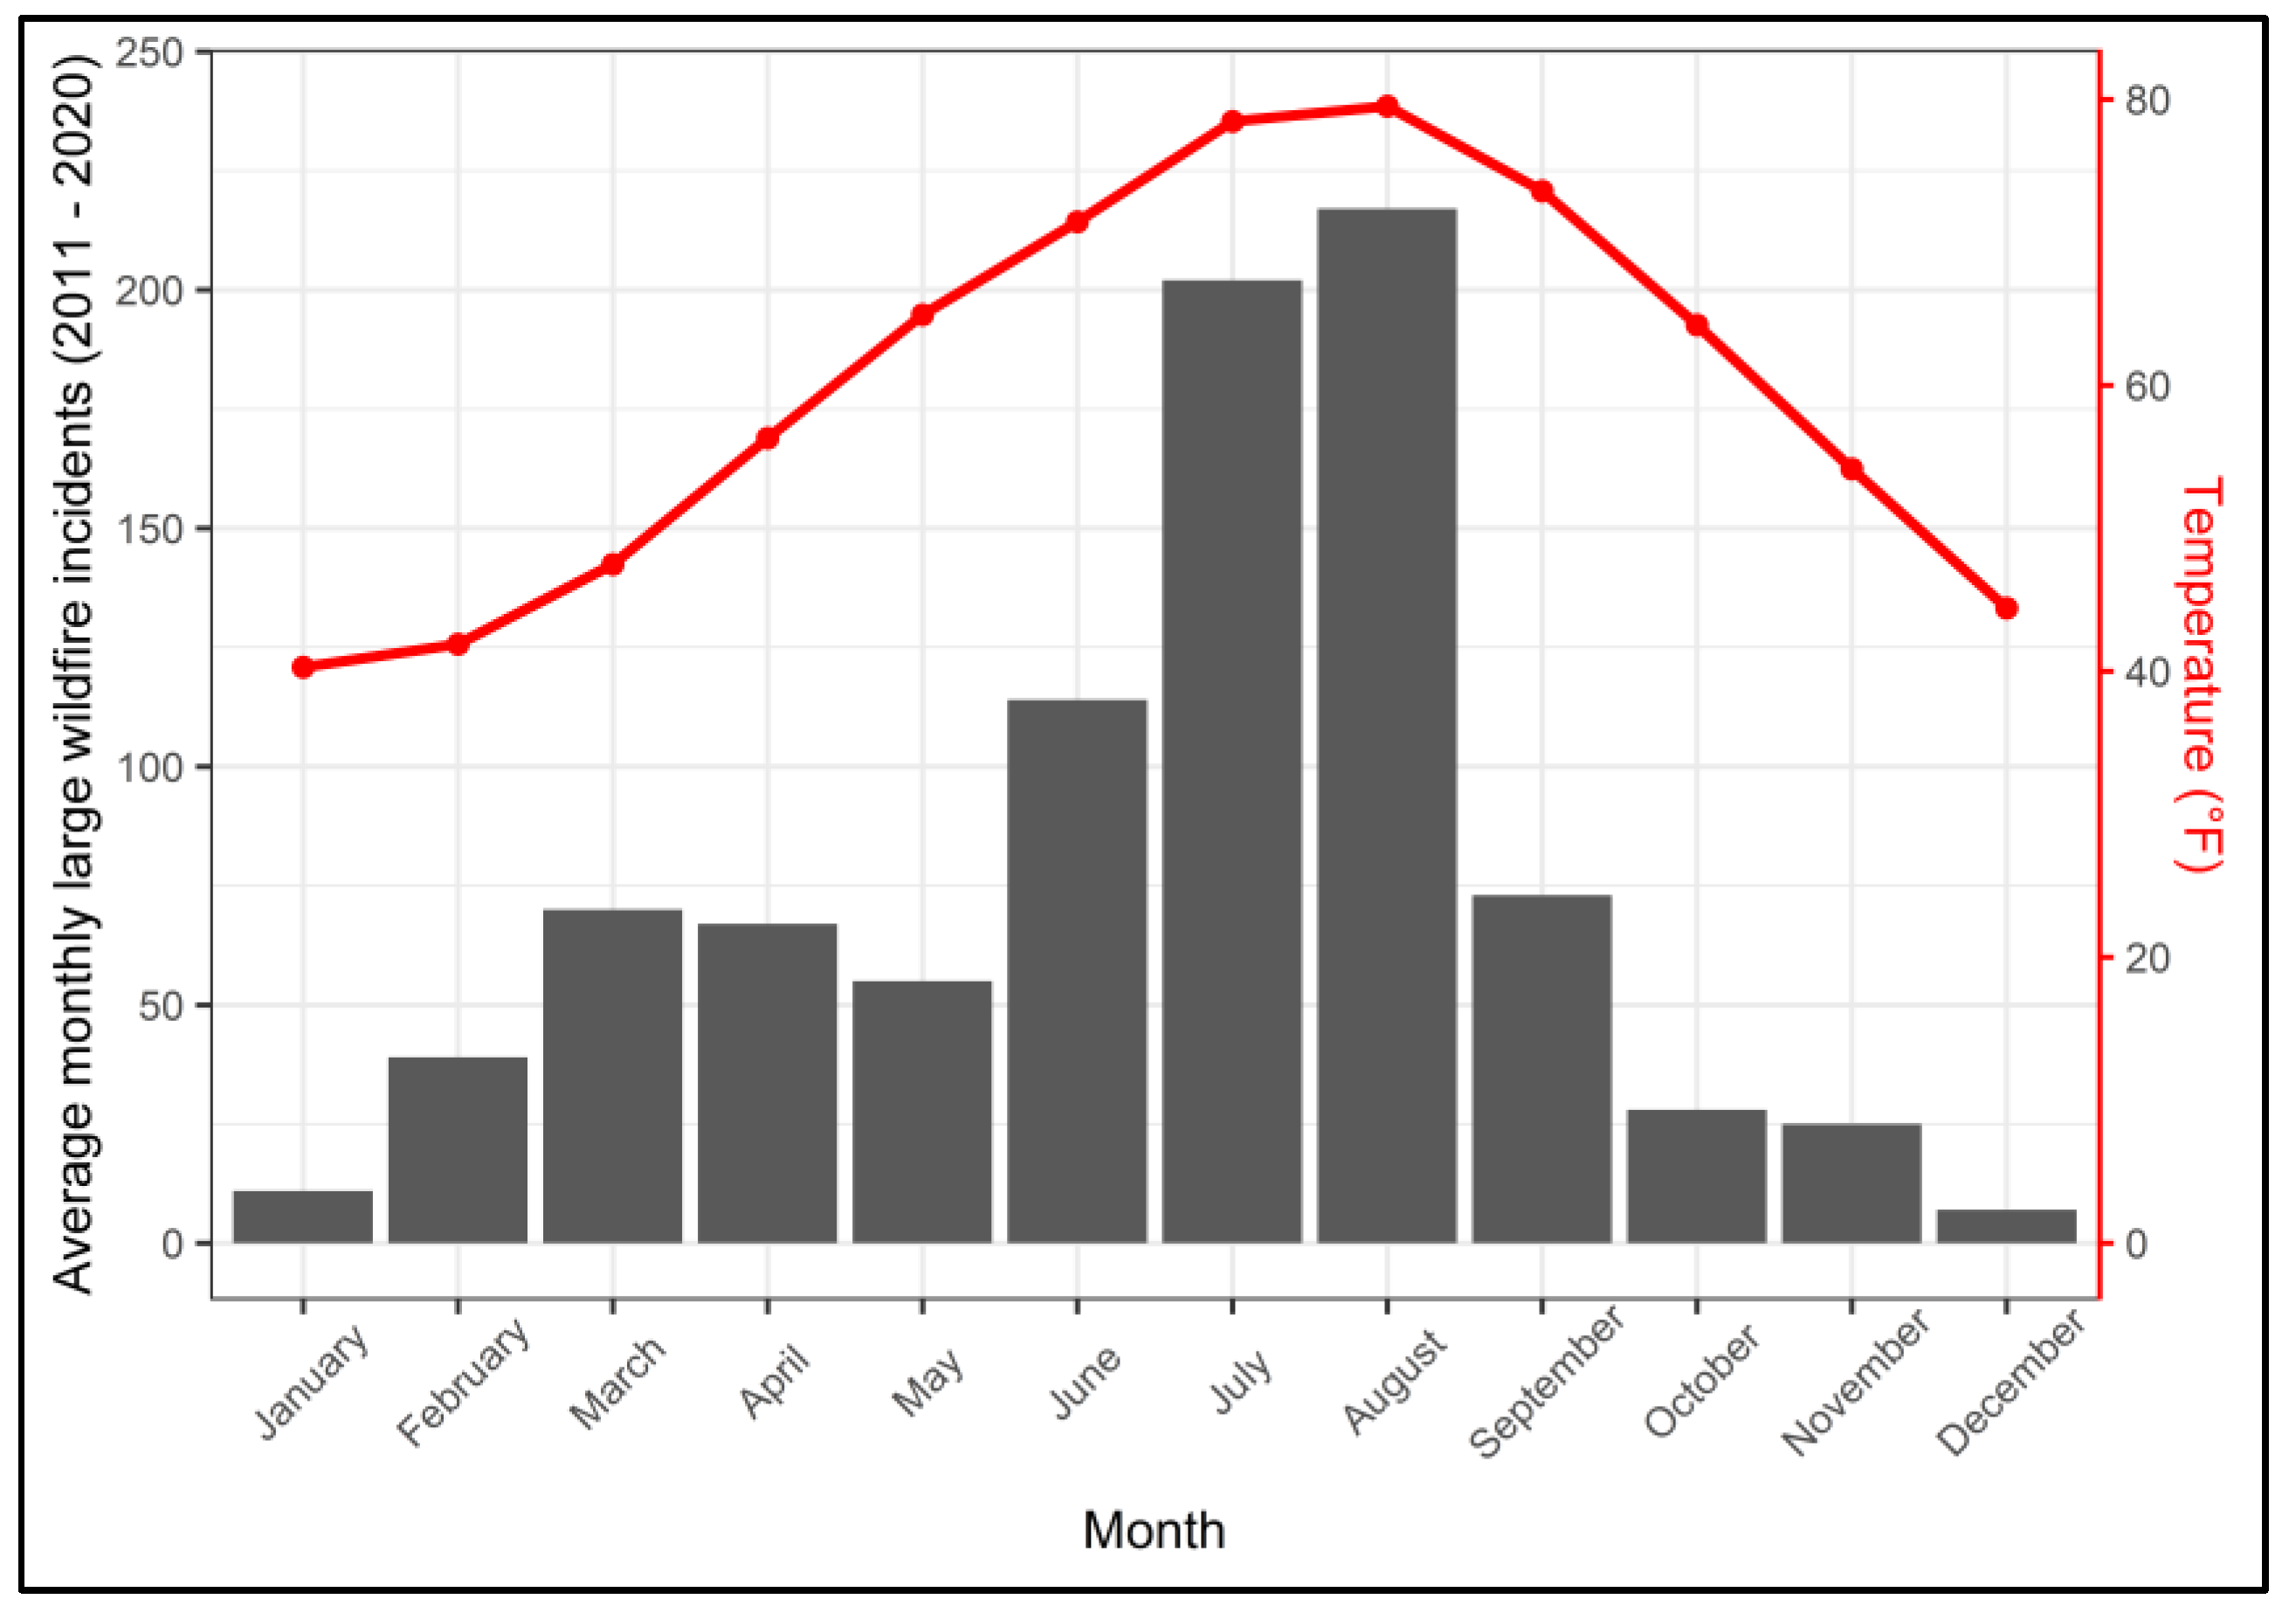
Figure 7.
Partial Dependence Plots showing the interactions between features and burn area using SHAP values.
Figure 7.
Partial Dependence Plots showing the interactions between features and burn area using SHAP values.
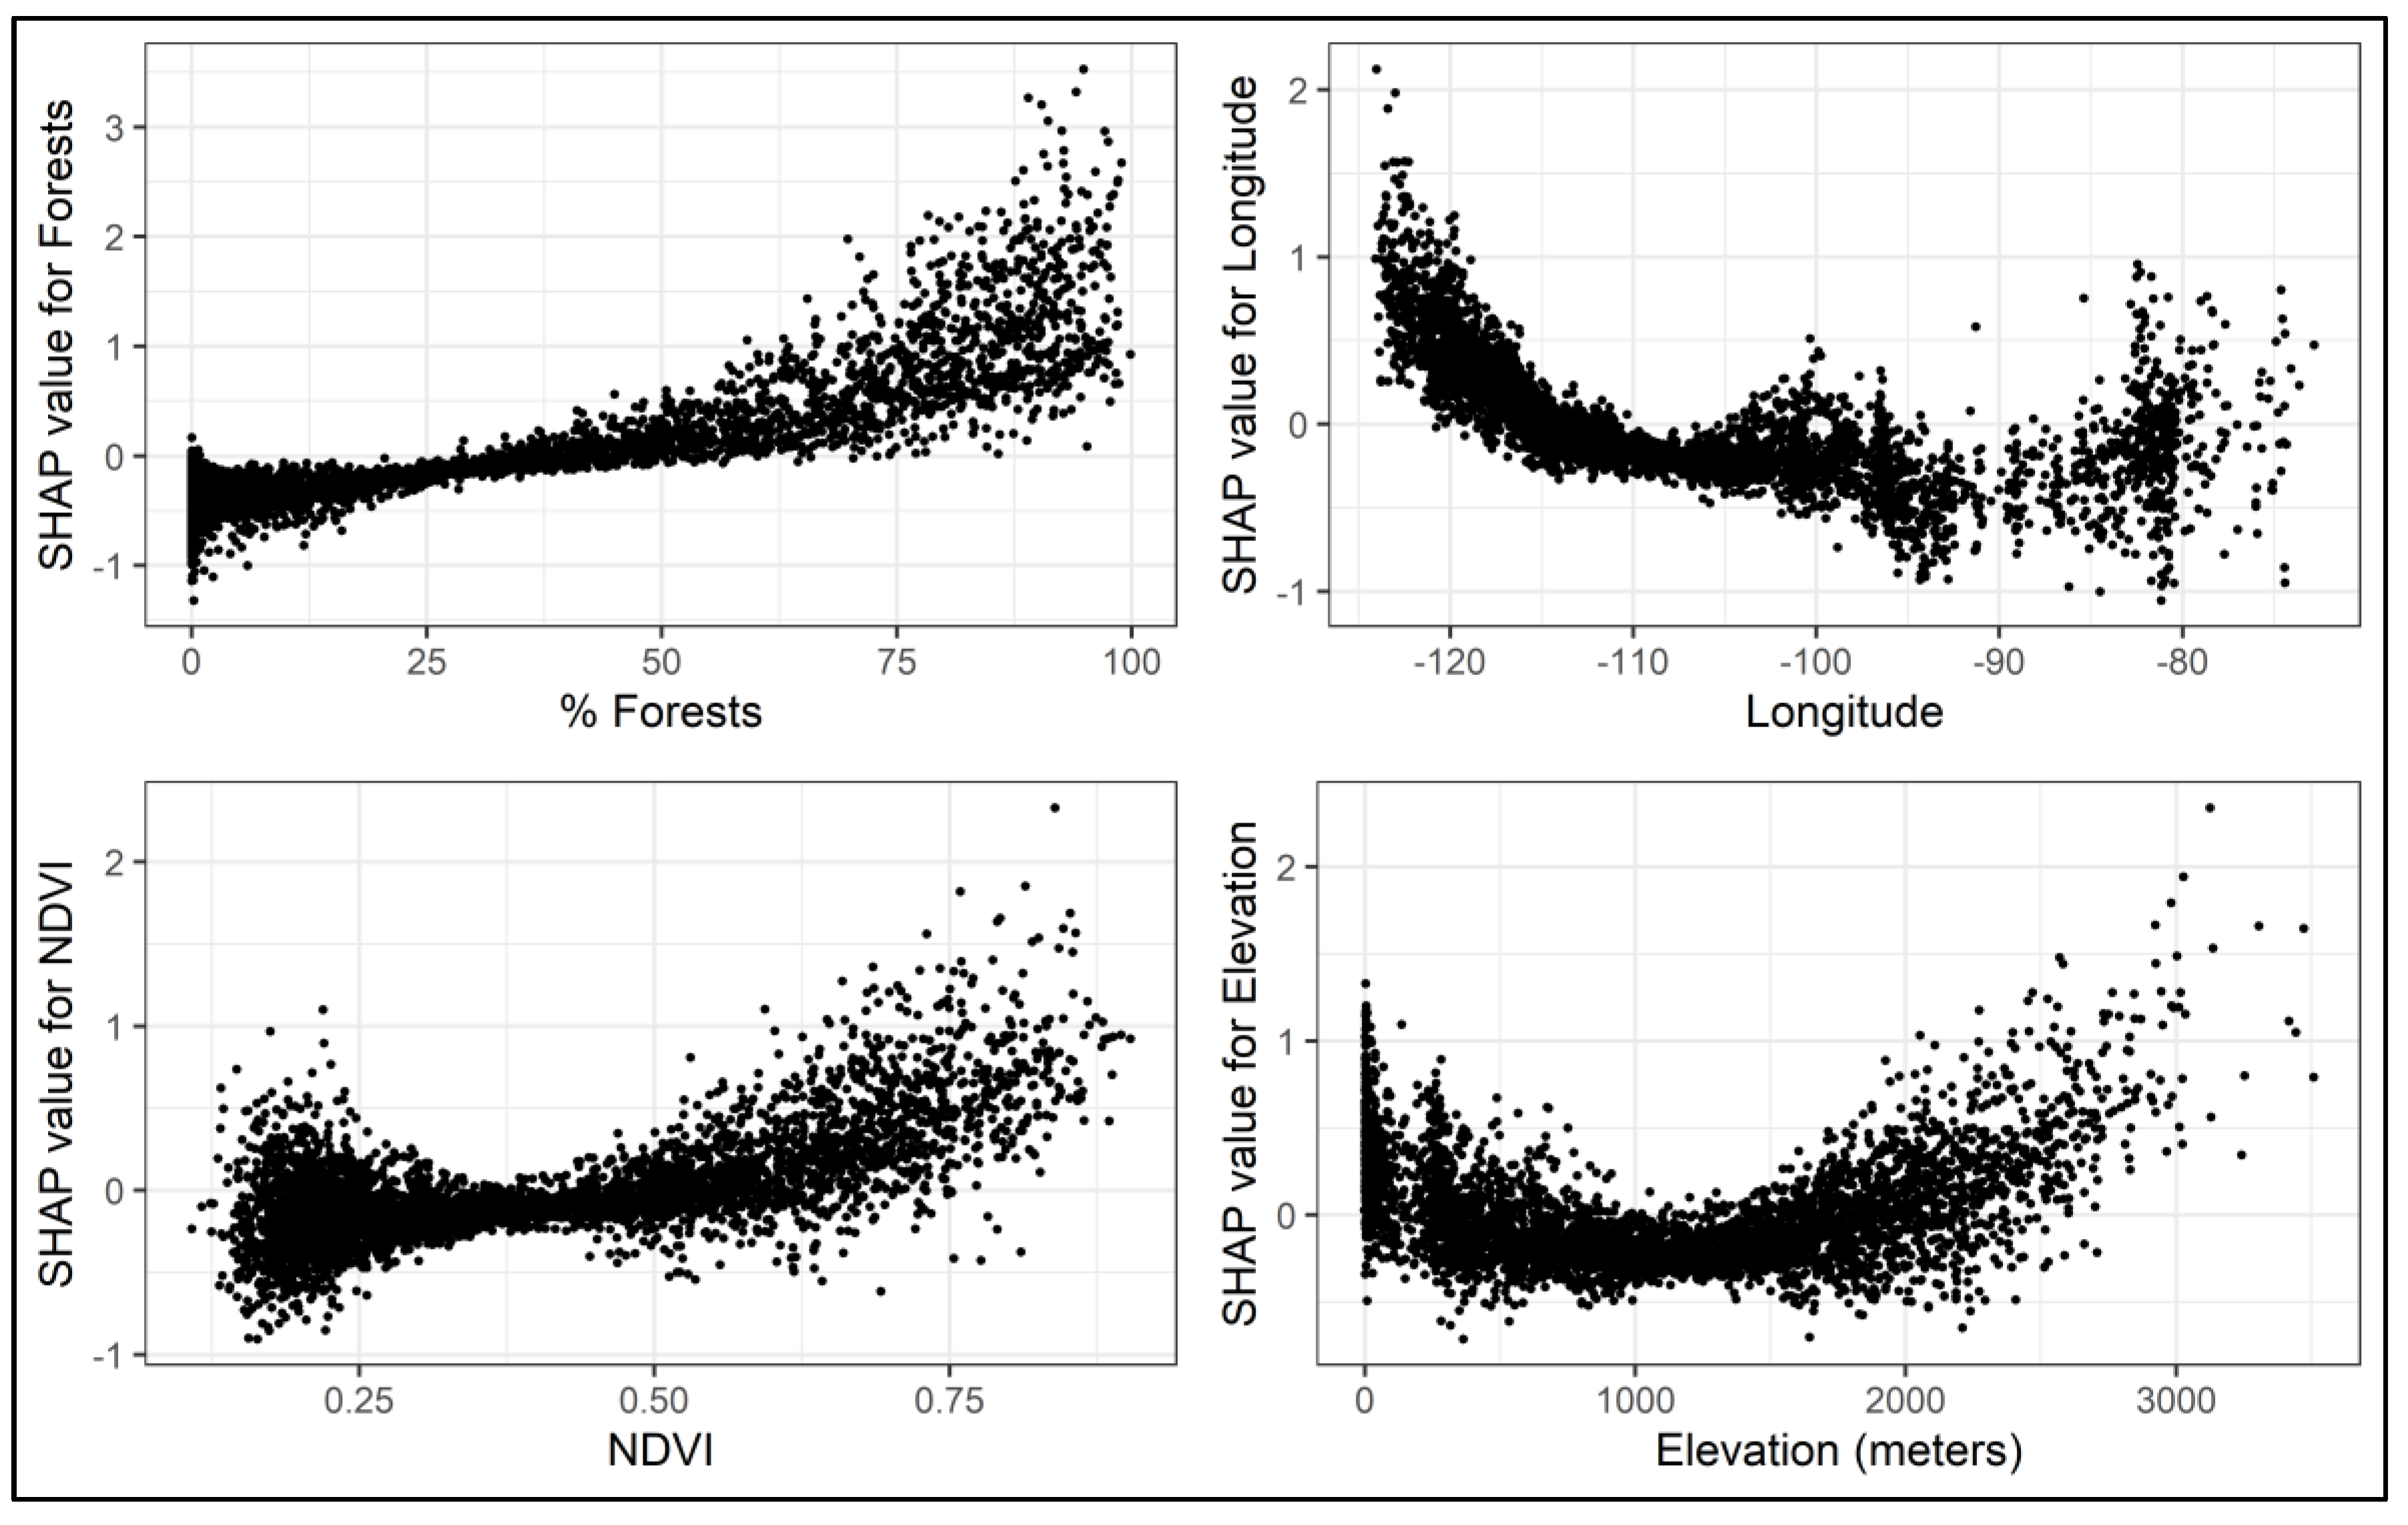

Table 1.
List of datasets used in the study to model burn area in large US wildfires.
| Category | Dataset | Variables | Source | Resolution |
|---|---|---|---|---|
| Climate | PRISM | Precipitation, Temperature, Vapor Pressure Deficit (min, max) | https://prism.oregonstate.edu/ | 4000 m gridded, Monthly |
| GRIDMET | PDSI, PET | https://www.climatologylab.org/gridmet.html | 4000 m gridded, 5-day (PDSI), 1-day (PET) | |
| Land Cover | National Land Cover Database (NLCD), 2016 | Open Water, Developed, Barren, Forests, Shrub/Scrub, Hay/Pasture, Cultivated Crops, Wetlands | https://www.mrlc.gov/ | 30 m gridded |
| MODIS | MOD13A3 Version 6 | NDVI, EVI | https://lpdaac.usgs.gov/products/mod13a3v006/ | 1000 m gridded, Monthly |
| Topography | USGS DEM | Elevation (m) | https://earthworks.stanford.edu/catalog/stanford-zz186ss2071 | 100 m gridded |
| Ecoregion Boundaries | US EPA Ecoregions | Level I and Level IV Ecoregions | https://www.epa.gov/eco-research/ecoregions | Shapefile |
Table 2.
Features used in the DNN model to predict large wildfire burn area with minimum and maximum values in the dataset.
Table 2.
Features used in the DNN model to predict large wildfire burn area with minimum and maximum values in the dataset.
| Feature | Description | Min | Max |
|---|---|---|---|
| LATITUDE | Latitude coordinates of wildfire occurrence (decimal degrees) | 25.2 | 49 |
| LONGITUDE | Longitude coordinates of wildfire occurrence (decimal degrees) | -124.1 | -72.8 |
| DOY | Wildfire ignition day of year | 1 | 365 |
| ppt | Total monthly precipitation for month of wildfire ignition | 0 | 1063.2 |
| tmean | Average monthly temperature for month of wildfire ignition | -5.3 | 36.8 |
| vpdmax | Maximum vapor pressure deficit for month of wildfire ignition | 2.7 | 81.8 |
| vpdmin | Minimum vapor pressure deficit for month of wildfire ignition | 0 | 35.3 |
| PDSI | Palmer Drought Severtiy Index during ignition date | -8.1 | 7.6 |
| Developed | % NLCD developed around 4-kilometer buffer of wildfire ignition | 0 | 64.2 |
| Forests | % NLCD forests around 4-kilometer buffer of wildfire ignition | 0 | 99.8 |
| Shrub | % NLCD shrub/scrub around 4-kilometer buffer of wildfire ignition | 0 | 100 |
| grass | % NLCD grasslands/herbaceous around 4-kilometer buffer of wildfire ignition | 0 | 100 |
| Pasture | % NLCD hay/pasture around 4-kilometer buffer of wildfire ignition | 0 | 74 |
| Wetlands | % NLCD wetlands around 4-kilometer buffer of wildfire ignition | 0 | 100 |
| NDVI | Normalized Difference Vegetation Index for month of wildfire occurrence | 0.1 | 0.9 |
| EVI | Enhance Vegetation Index for month of wildfire occurrence | 0 | 0.7 |
| Elevation | Elevation of wildfire occurrence | -2 | 3507 |
Disclaimer/Publisher’s Note: The statements, opinions and data contained in all publications are solely those of the individual author(s) and contributor(s) and not of MDPI and/or the editor(s). MDPI and/or the editor(s) disclaim responsibility for any injury to people or property resulting from any ideas, methods, instructions or products referred to in the content. |
© 2023 by the authors. Licensee MDPI, Basel, Switzerland. This article is an open access article distributed under the terms and conditions of the Creative Commons Attribution (CC BY) license (http://creativecommons.org/licenses/by/4.0/).
Copyright: This open access article is published under a Creative Commons CC BY 4.0 license, which permit the free download, distribution, and reuse, provided that the author and preprint are cited in any reuse.


