Submitted:
09 May 2023
Posted:
10 May 2023
You are already at the latest version
Abstract
A large amount of steel slag (SS) and CO2 are generated in the steelmaking process. The indirect CO2 capture using SS is a promising way for co-treatment of the wastes. Ammonium salt solution is widely used to extract Ca2+ from the SS since it is recyclable. Several works have focus on improving the carbonation rate by adjusting various parameters (e.g., temperature and pH). However, there is little detail information about the associating behaviors and interaction strength between the various ions in the ammonia solution during the carbonation process. In this work, the Ca2+–CO32-–NH4+–Cl-–H2O system was established by using Material studio software. The effects of temperature and concentration of CO32- on CaCO3 growth were explored at the atomic scale by calculating the binding energy, mean square displacement, and diffusion coefficient between particles. Furthermore, the microstructure, bonding characteristics, and occurrence behavior of each particle were studied though molecular dynamics simulation methods. The results showed that with the increase of temperature (20–80 ℃), the binding ability and diffusion coefficients of Ca2+ and CO32- increase in the system, which is beneficial to the formation of CaCO3 clusters. With the increase of the concentration of CO32- (15–25 vol.%), the binding ability and diffusion coefficient of Ca2+ and CO32- in the system are enhanced, which is beneficial to the formation of CaCO3 clusters.
Keywords:
Steel slag
; CO2 sequestration
; CCUS
; Molecular dynamics simulation
1. Introduction
The iron and steel industry is an energy-intensive industry [1], produces a large amount of CO2 and steelmaking slag (SS) [2]. Globally, the steel industry produces about 130–200 million tons of SS every year [3]. In some major steel producing countries, such as China and India [4], the utilization rate of SS is still below 30% [5]. At present, the carbon capture, utilization, and storage (CCUS) process based on SS is an effective way to reduce CO2 emissions and waste utilization [6,7]. As early as the beginning of the 21st century, it was proposed [8] that CO2 can be sealed by indirect method with SS. The method includes selectively extracting Ca2+ [9,10] from SS with aqueous solutions such as acid (e.g., HCl, HNO3, CH3COOH, or HCOOH) and ammonium salt (NH4Cl, NH4NO3, or CH3COONH4). NH4Cl is more suitable as a Ca2+ leaching agent for SS than strong and weak acids [13,14] because of its high Ca-selective, recyclability, and low cost [11,12]. Pilot-scale experiment work showed that the Ca-rich leaching solution can be produced by leaching SS with low concentration NH4Cl solvent (0.11 mol·L-1) (other elements Si, Mg, and Fe in SS are not significant or not detected) [15]. Thus, the leachate containing various ions (Ca2+, NH4+, Cl-, H2O) was obtained and then after for CO2 sequestration. However, the carbon capture efficiency of Ca2+ in SS is very low, which leads to a low yield of calcium carbonate (CaCO3), so the CaCO3 produced by SS cannot be used for large-scale industrialization. At present, a large number of experiments [16,17,18,19] have studied the formation of CaCO3 in the NH4Cl system. The results show that the formation of CaCO3 is related to temperature [20,21], solution pH [22], NH4Cl concentration [23], and CO2 flow rate [24]. Gadikotad et al. [25] concluded through experiments that the increase in temperature is beneficial to the formation of CaCO3. However, Ma et al. [26] proposed that the formation of CaCO3 is not linear with the temperature. Therefore, the formation mechanism of CaCO3 in solution should be further investigated.
It is difficult to obtained more detailed information about the relationship between the particle interactions and independent parameters through lab-experiments. Molecular dynamics (MD) simulation is an effective method to explore the relationship between partiecles from the micro level. The research shows that the MD simulation method can be used to study the nano-scale particle system [26,27], which proves the accuracy of the MD simulation method at the micro level. Jing et al. [28] established the NaCl–CO2–H2O system by using the kinetic simulation method, and studied the action mechanism of NaCl as a hydrate inhibitor. Zhang et al. [29] established the LiCl–H2O system by kinetic simulation method, studied the dissociation pathway of LiCl. Li et al. [30] established CaO–H2O–CO2 system by kinetic simulation method, and studied the effect of H2O on CO2 capture by CaO. The above research shows that MD simulation has been widely used to study the microscopic behavior of particles in complex systems.
Based on the above researches, the Ca2+–CO32-–NH4+–Cl-–H2O system was established by using this simulation method. The effects of temperature and concentration of CO32- on CaCO3 growth were explored at the atomic level by calculating the binding energy, mean square displacement, and diffusion coefficient between particles. Furthermore, the microstructure, bonding characteristics, and occurrence behavior of each particle were studied.
2. Materials and Methods
2.1. Force field
Materials Studio (MS) simulation software was used to carry out MD simulation to simulate the microstructure variations during the binding process of Ca2+ with CO32- which could not be directly evaluated by experiments. In the process of MD simulation, the choice of force field plays an important role in the accuracy of the results. The MS software provides users with various forms of force fields, among which COMPASS (condensed-phase optimized molecular potentials for atomistic simulation studies) force field is a molecular force field developed in recent years. The COMPASS force field is suitable for condensed matter systems or systems. The energy form of the system or system simulated or calculated by the COMPASS force field is relatively complete and the calculation accuracy is very high. The COMPASS force field has been proved by many studies [31] to be suitable for the system containing Ca2+ and CO32-.
2.2. Simulation model and procedure
The modules of Visualize, Amorphous Cell, and Forcite were used to simulate the interaction energy and particle distribution in a specific system, and the cluster behavior of CaCO3 in a solution system was predicted.
Firstly, the ions and molecules in the system are drawn with the help of the “Visualizer” module in MS software. After that, the solution model of Ca2+–CO32-–NH4+–Cl-–H2O system was constructed by using the “Amorphous cell” module, and the pH of the system was set at 12. When the model is established, Forcite is used to optimize the model and analyze the dynamics calculation. The chemical components of the system are established at different temperatures and different concentrations of CO32- (refer to different CO2 concentrations in solution, ranging from 15 vol.% to 25 vol.%) are shown in Table 1.

Table 1.
Composition of Ca2+–CO32-–NH4+–Cl-–H2O system at different temperature.
| Temperature/℃ | Ca2+ | NH4+ | Cl- | H2O | CO32- |
|---|---|---|---|---|---|
| 20 | 200 | 400 | 400 | 224 | 144 |
| 50 | 200 | 400 | 400 | 224 | 144 |
| 80 | 200 | 400 | 400 | 224 | 144 |
| 80 | 200 | 400 | 400 | 224 | 108 |
| 80 | 200 | 400 | 400 | 224 | 180 |
Geometry Optimization in “Forcite” module was used to optimize the geometry structure and energy of the initial model under different temperature conditions, which aimed to prevent the initial ion pairs and the formation of water molecules unreasonable overlap phenomenon. The specific optimization parameters are shown in Table 2.
Table 2.
Specific optimization parameters of the system.
| Parameter | Force field | Summation method | Truncation radius | Number of iteration steps | Quality | Optimization method |
|---|---|---|---|---|---|---|
| Settings | Compass | Ewald | 12.5 Å | 1000 | Medium | Smart |
The optimized system was simulated by using “Dynamics” in the “Forcite” module. The initial velocity of particles is random. The boundary condition of the system is periodic. The specific parameters of molecular dynamics simulation were shown in Table 3.
Table 3.
Specific parameters of Molecular Dynamics simulation.
| Parameter | Force field | Ensemble | Temperature control method | Pressure control method | Step length | Analog time |
|---|---|---|---|---|---|---|
| Settings | Compass | NPT | Nose | Anderson | 1 fs | 1500 ps |
2.3. Properties analysis
In this study, the interparticle interaction energies of CaCO3 and H2O are calculated. The radial distribution function, mean square displacement, and diffusion coefficient of Ca2+ and CO32- are analyzed. The interaction energy is the sum of the changes in kinetic energy and potential energy when particles in the system combine or separate. It is a negative value of binding energy numerically.
The calculation formula of binding energy is shown as Eq 1:
where Ebind is the binding energy of matter or system, EAB is the total energy of matter or system, EA is the energy of matter A, and EB is the energy of matter B.
Ebind=EAB-(EA+EB),
According to the above formula of binding energy calculation, the formula of binding energy between any two components in the three systems can be derived:
From the above formula, the binding energy formula of CaCO3 and H2O in three systems CaCO3–NH4Cl–H2O can be obtained:
where ETotal is the Total energy of the three system CaCO3–NH4Cl–H2O (kJ·mol-1), Ebind is the binding energy of CaCO3 and H2O (kJ·mol-1), ECaCO3+NH4Cl is the energy of CaCO3 and NH4Cl (kJ·mol-1), EH2O+NH4Cl is the energy of H2O and NH4Cl (kJ·mol-1), ECaCO3+H2O is the energy of H2O and CaCO3 (kJ·mol-1), ECaCO3, EH2O, and ENH4Cl are the energy of CaCO3, H2O, and NH4Cl (kJ·mol-1).
In addition, the radial distribution function is used to study the orderliness of particles in the solution. The radial distribution function refers to the distribution probability of central particles and other particles in space when the coordinates of a certain particle are given. It can also be considered as the ratio of regional density to the average density of matter or system. And when the studied particle is an infinity away from the central particle, the regional density tends to be equal to the average density.
The radial distribution function is calculated as follows:
where is the density of the substance or system (g/cm3), is the distance from a given central particle (Å), and N is the number of molecules in the substance or system.
Mean square displacement (MSD) refers to the average distance between all particles and their initial points when the motion time is t, which can be used to judge the speed and mode of particle motion in the system.
Mean square displacement is defined as follows:
where represents the average of the system, t is the time, and MSD is the abbreviation of mean squared displacement, that is, the mean square displacement.
The most important function of mean square displacement is to use the calculated mean square displacement to calculate the diffusion coefficient according to Einstein equation. The corresponding relationship between the mean square displacement and the diffusion coefficient of particles is as follows:
=6Dt+C,
where D and C are constants, where D is the diffusion coefficient.
When the studied system is liquid, the relationship between mean square displacement and diffusion coefficient is as follows:
In the process of molecular dynamics simulation, if the simulation time is long enough and in a cubic lattice, the diffusion coefficient is equal to one-sixth of the slope of the mean square displacement curve.
3. Results and discussion
3.1. Effects of temperature
3.1.1. Binding energy
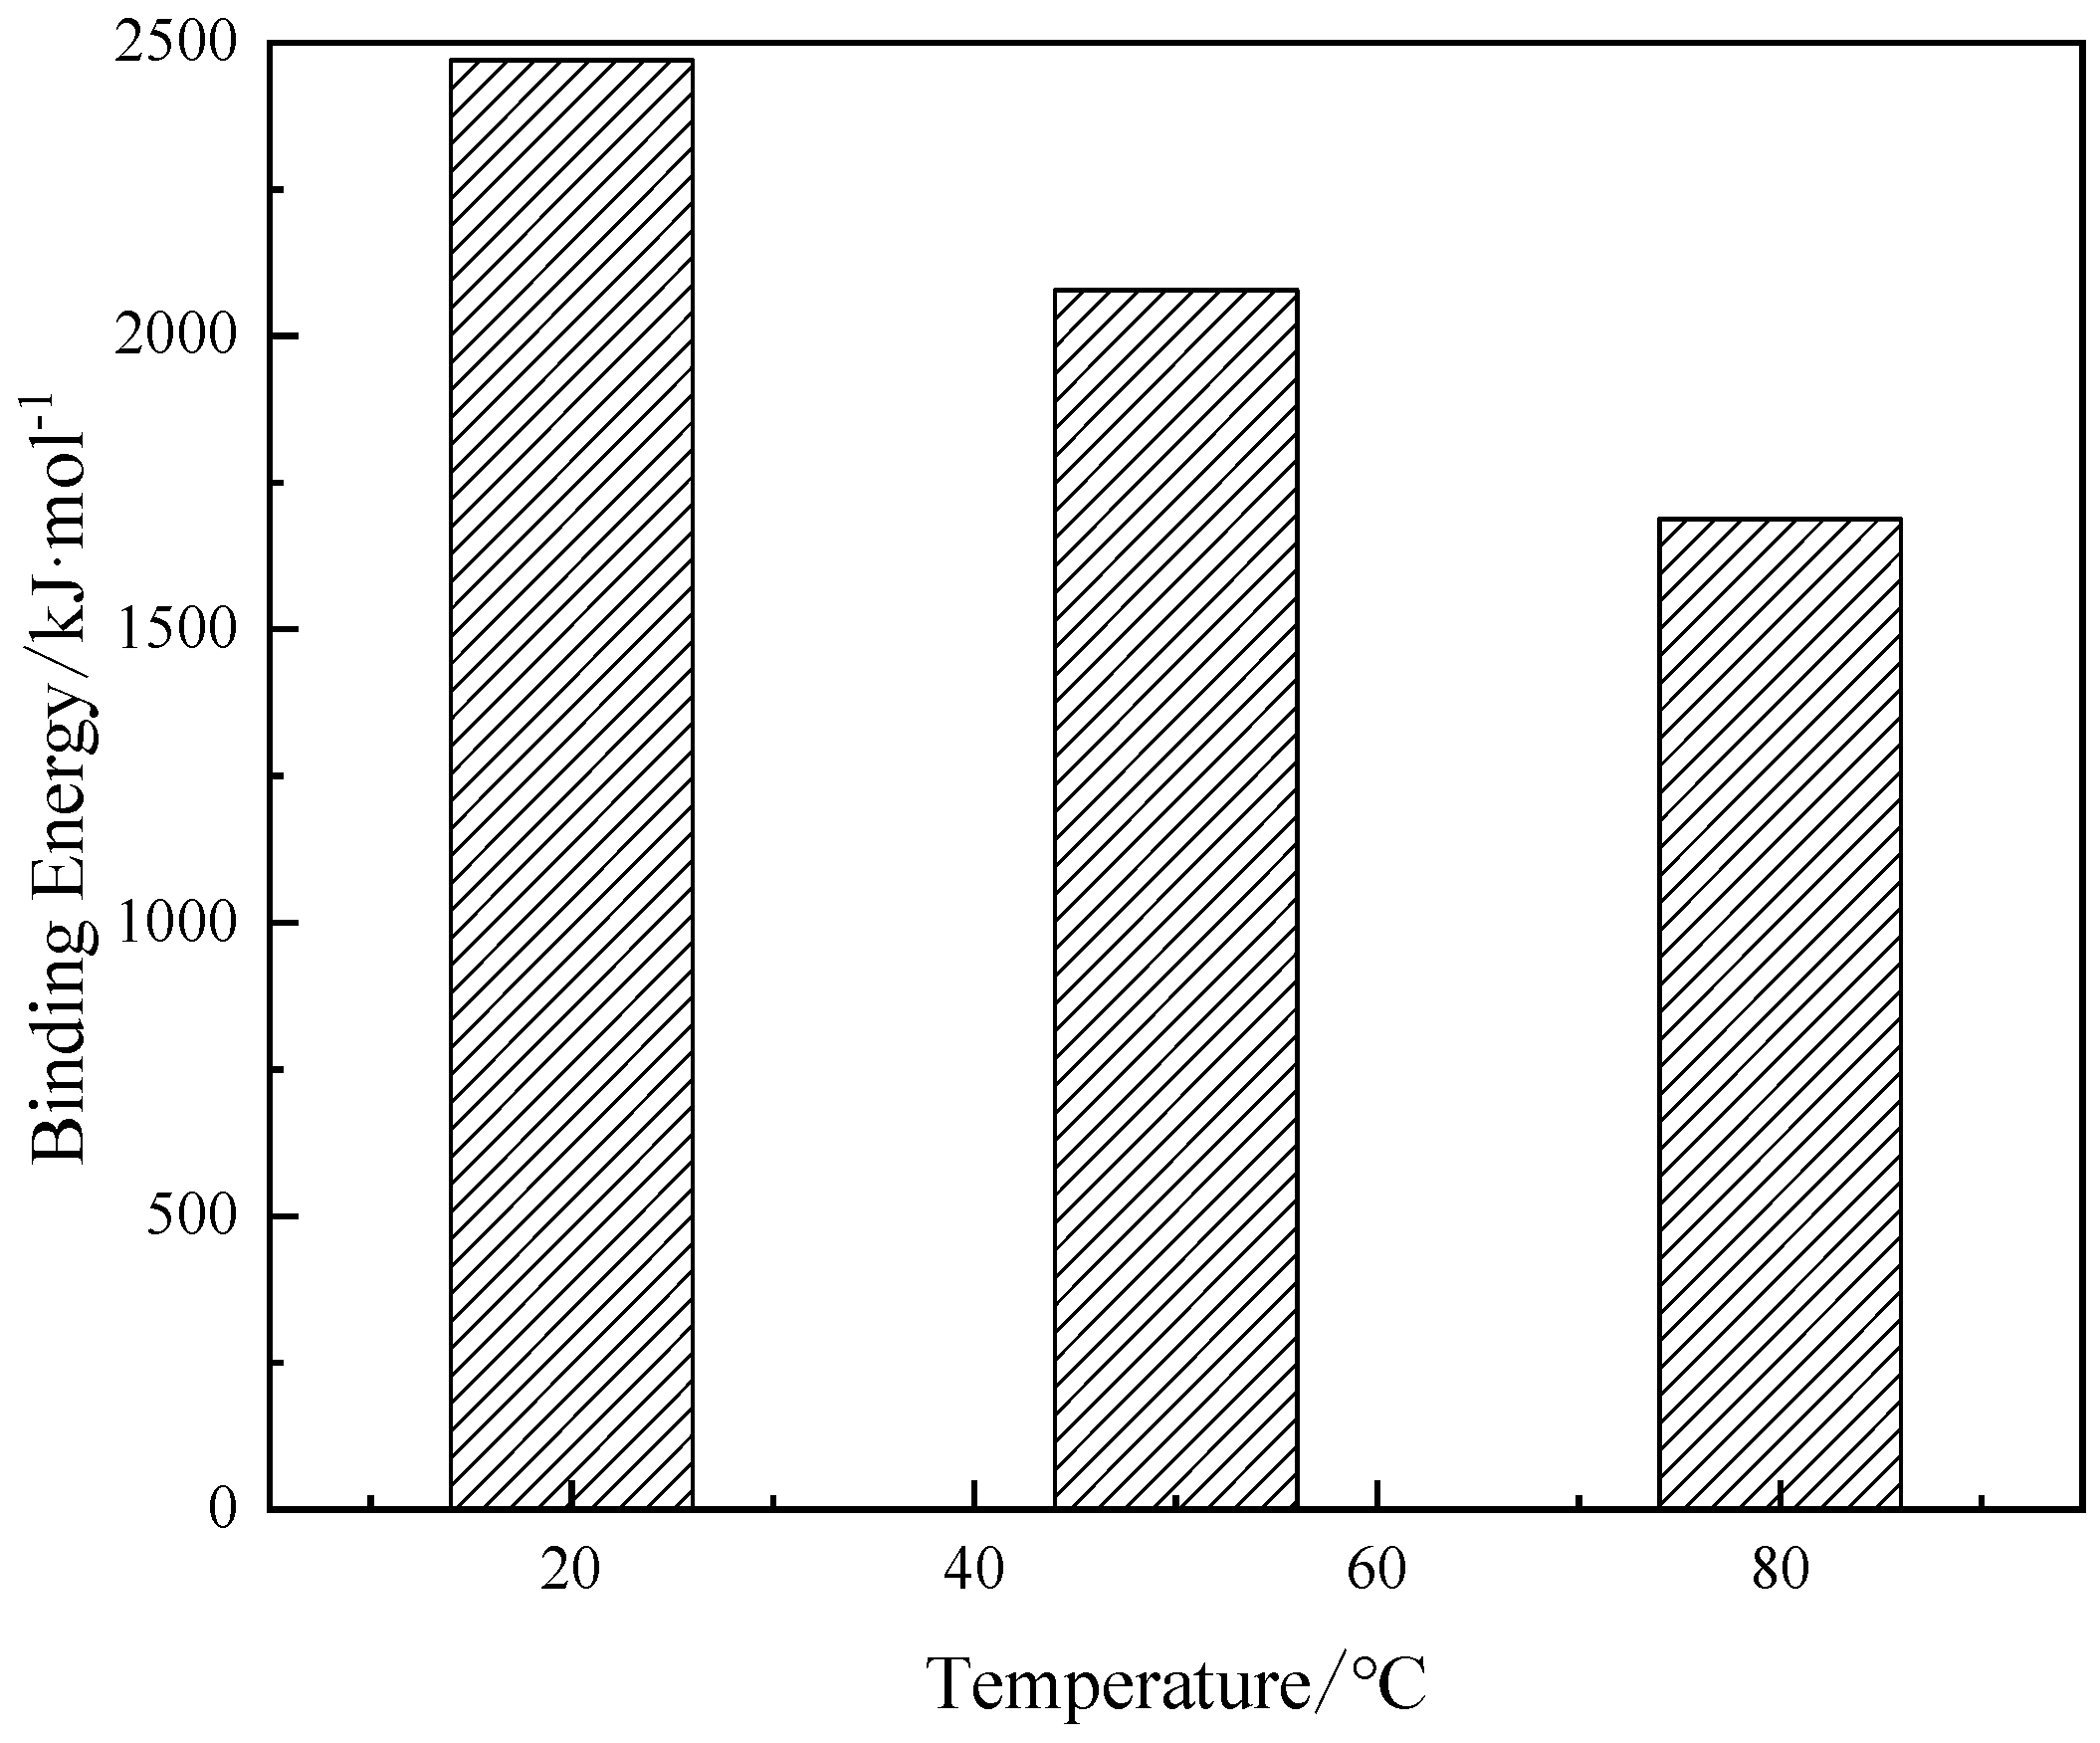
The energy of each component of the system at different temperature conditions was studied, as shown in Table 4. It can be seen that the absolute value of the total energy of the system decreases with the temperature,. Using the Eq. 3, the binding energy of CaCO3 and H2O at different temperatures can be calculated.
Table 4.
Energy values of each component in Ca2+–CO32-–NH4+–Cl-–H2O system at different temperatures(kJ·mol-1).
Table 4.
Energy values of each component in Ca2+–CO32-–NH4+–Cl-–H2O system at different temperatures(kJ·mol-1).
| Energy/kJ·mol-1 | 20 ℃ | 50 ℃ | 80 ℃ |
|---|---|---|---|
| -200885.32 | -199381.04 | -198523.37 | |
| -138188.01 | -137316.67 | -136352.72 | |
| -68686.58 | -67889.69 | -67311.95 | |
| -133390.83 | -132855.18 | -132724.31 | |
| -67266.41 | -66959.19 | -66086.94 | |
| -1349.42 | -1098.47 | -925.10 | |
| -197971.02 | -197657.37 | -196624.71 | |
| 2469.38 | 2078.09 | 1688.48 |
Figure 1 is a histogram of the binding energy of CaCO3 and H2O at different temperatures. The binding energy between CaCO3 and H2O decreases with the temperature increase (cf. Figure 1). Under natural conditions, liquid water molecules are bonded by hydrogen bonds, and most of the hydrogen bonds between water molecules are in the network structure. This network structure can reduce the average gap between molecules in the system and hinder the thermal movement of Ca2+ and CO32-. With the increase in temperature, some hydrogen bonds were broken between water molecules, thus the original spatial grid structure was destroyed in water molecules. The impediment of Ca2+ and CO32- movement in the system is reduced. Ca2+ and CO32- bind together under the action of electrostatic force. With the increase in temperature, the binding capacity of Ca2+ and CO32- increases, while the binding energy of CaCO3 and H2O decreases. However, the hydration of Ca2+ and CO32- decreases in the solution, which makes Ca2+ and CO32- begin to polymerize, increases the chance of contact between Ca2+ and CO32-, and is beneficial to the formation and polymerization of CaCO3 clusters in the solution. Shashikant [32], in Ca2+–CO32-–NH4+–Cl-–H2O system through experimental study on the effect of carbonization of SS, the results show that in 45–70 ℃, increasing the temperature is beneficial to the formation of CaCO3. Similarly, Nielsen and Polettini obtained similar results at 10–60 ℃[33] and 20–80 ℃[34], which are also consistent with the simulation results of this study.
Figure 1.
Binding energy of CaCO3 and H2O at different temperature.
3.1.2. Microstructure of particles
Table 5 shows the peak position and peak value of the Ca2+–CO32- radial distribution function diagram in the system under different temperature conditions. It can be seen that with the increase in temperature, the peak position of the highest peak is similar, which indicates that the interaction distance between Ca2+ and CO32- does not change with the change of temperature. Figure 2 shows the radial distribution function of Ca2+–CO32- in the system at different temperatures. It can be seen from the figure that under different temperature conditions, the radial distribution function of Ca2+–CO32- appears sharp peaks around r=4.07 Å, and with the increase in distance, the graph becomes flat and approaches 1. In the range of r=4.07 Å, the binding strength of Ca2+ and CO32- is higher, and the two ions interact directly at this distance. With increasing temperature, the peak value of the Ca2+–CO32- radial distribution function increases, and the peak shape tends to be sharp. This indicates that increasing the temperature is beneficial to enhance the association between Ca2+ and CO32-, and is beneficial to the formation of CaCO3 pre-nucleation clusters. As can be seen from Figure 2, Ca2+ and CO32- are in a cluster structure with short-range and medium-range order and long-range disorder.
Figure 2.
Radial distribution function diagram of Ca2+–CO32- in system at different temperatures.
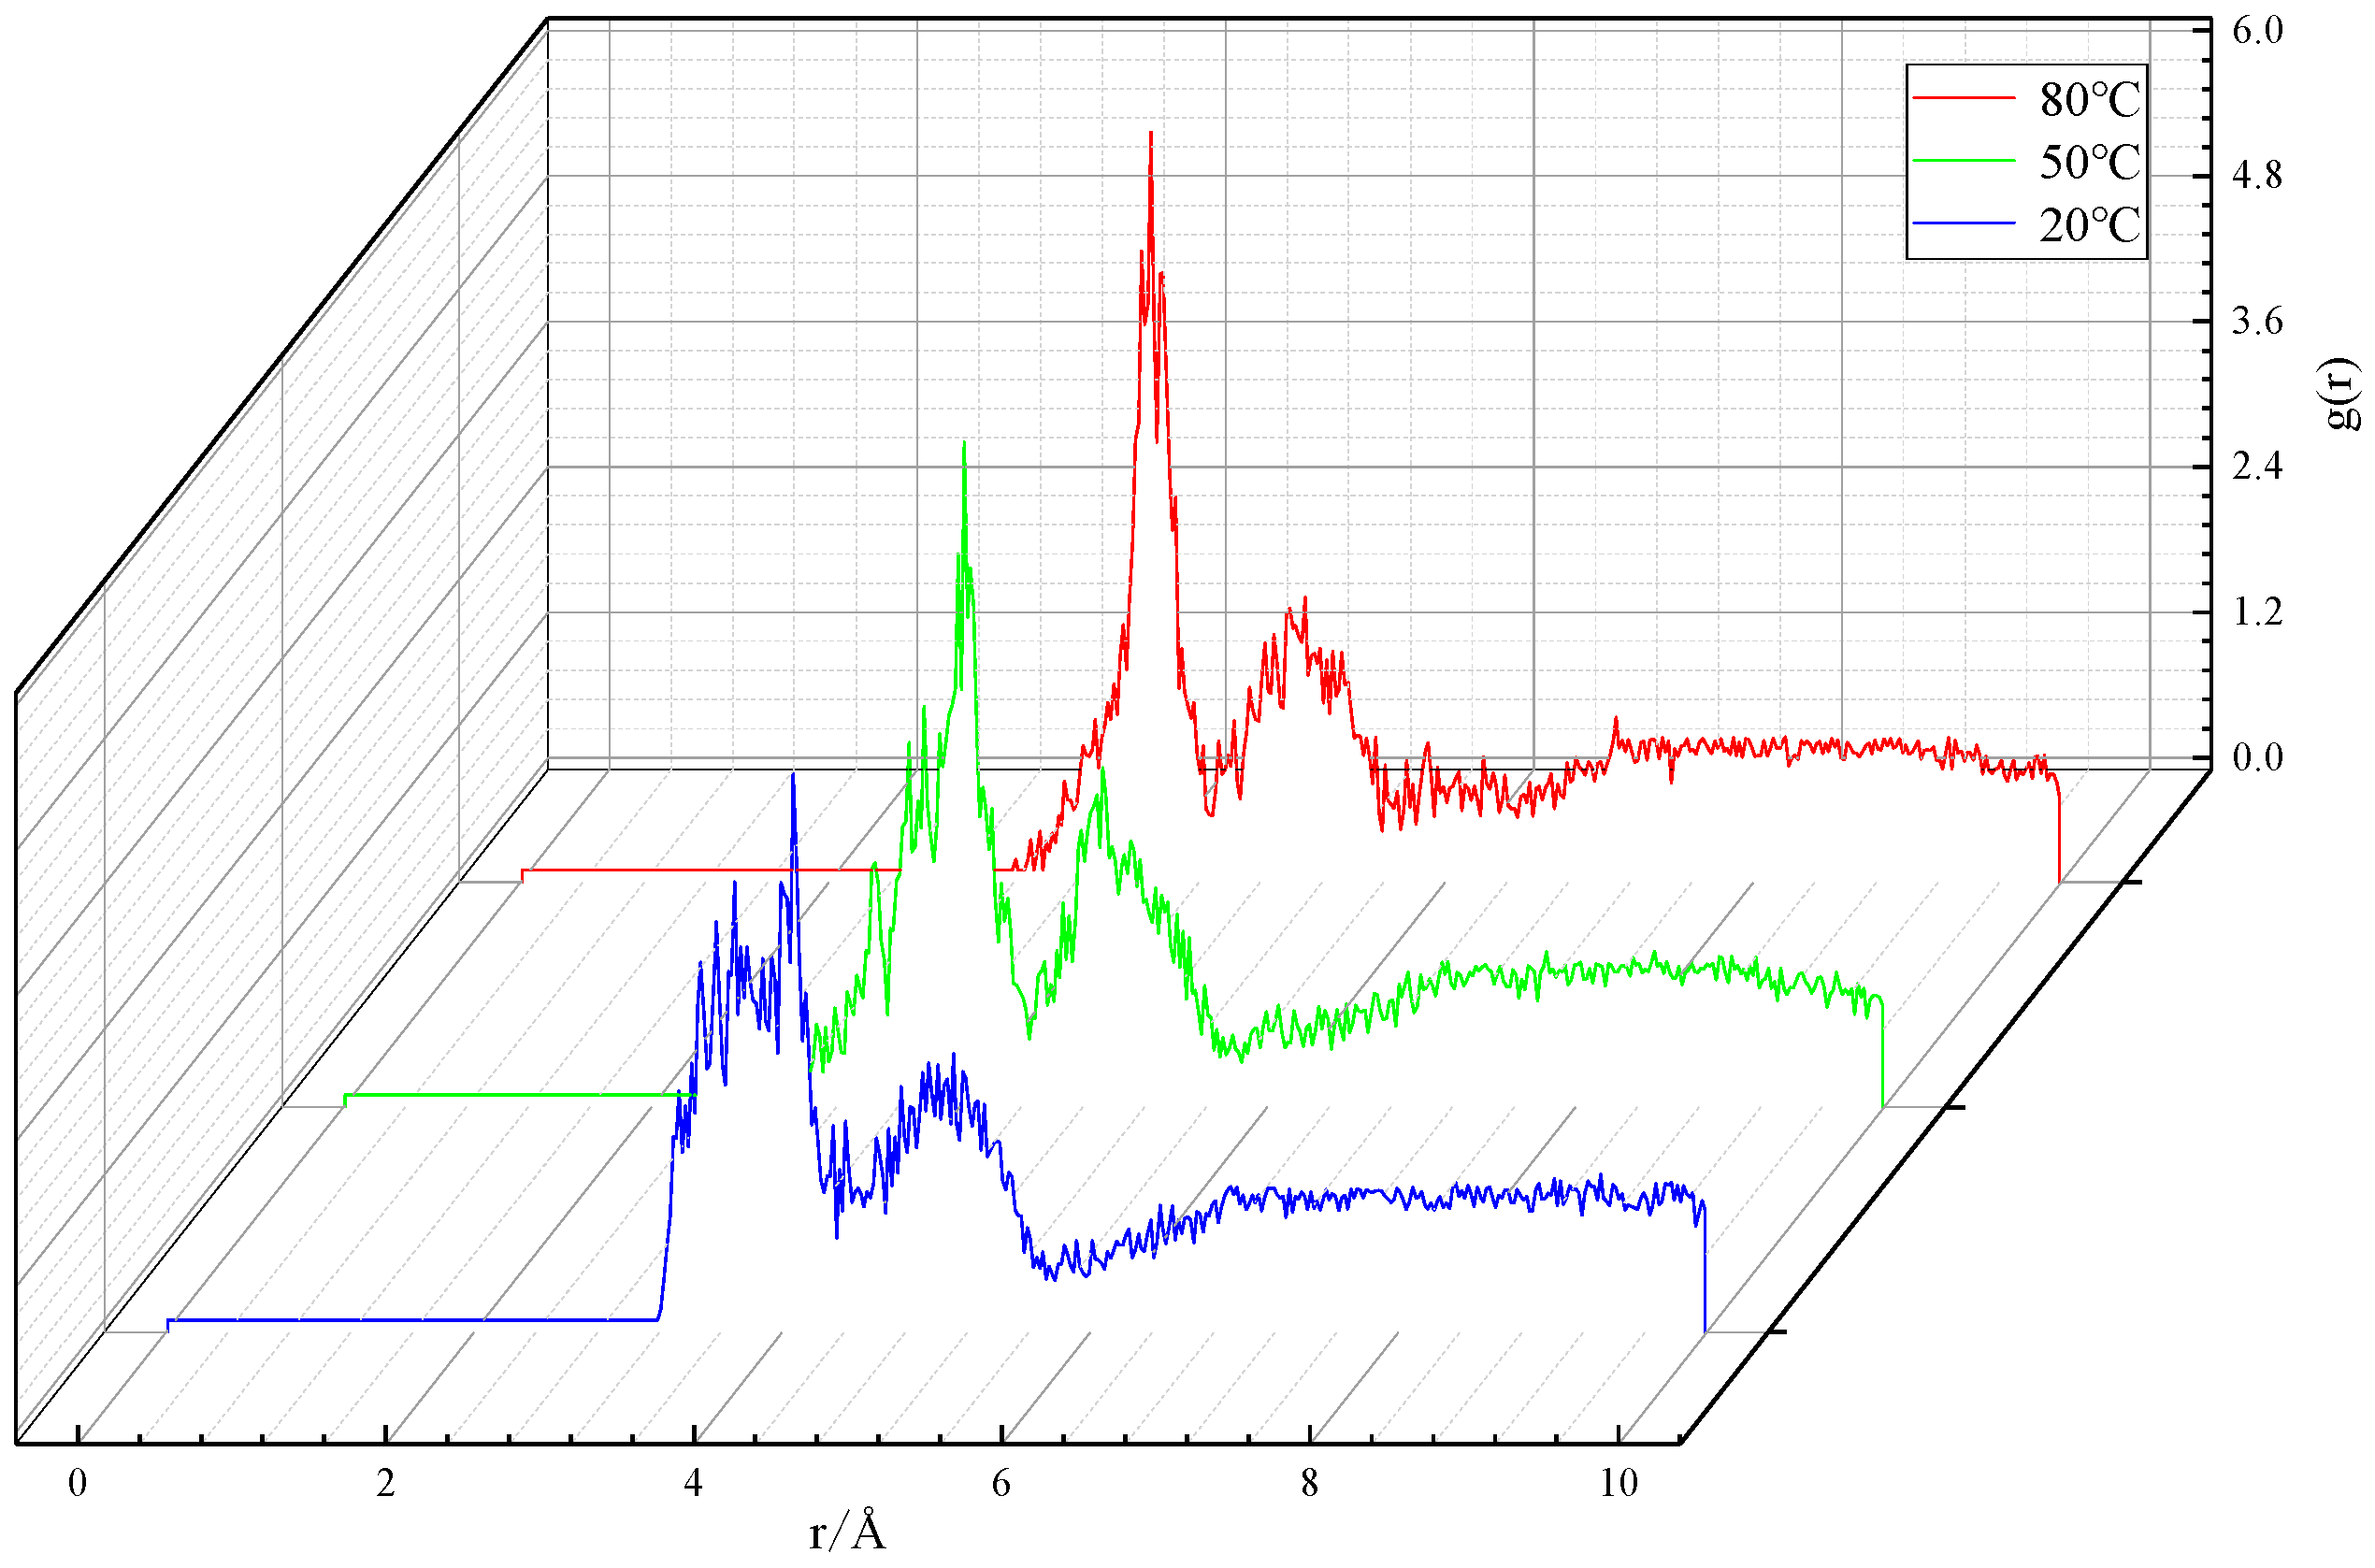
Table 5.
Peak position and peak value of radial distribution function diagram of Ca2+–CO32- in system at different temperatures.
Table 5.
Peak position and peak value of radial distribution function diagram of Ca2+–CO32- in system at different temperatures.
| Temperature/℃ | Peak position/Å | Peak value/ — |
|---|---|---|
| 20 | 4.07 | 4.51 |
| 50 | 4.03 | 5.39 |
| 80 | 4.09 | 6.11 |
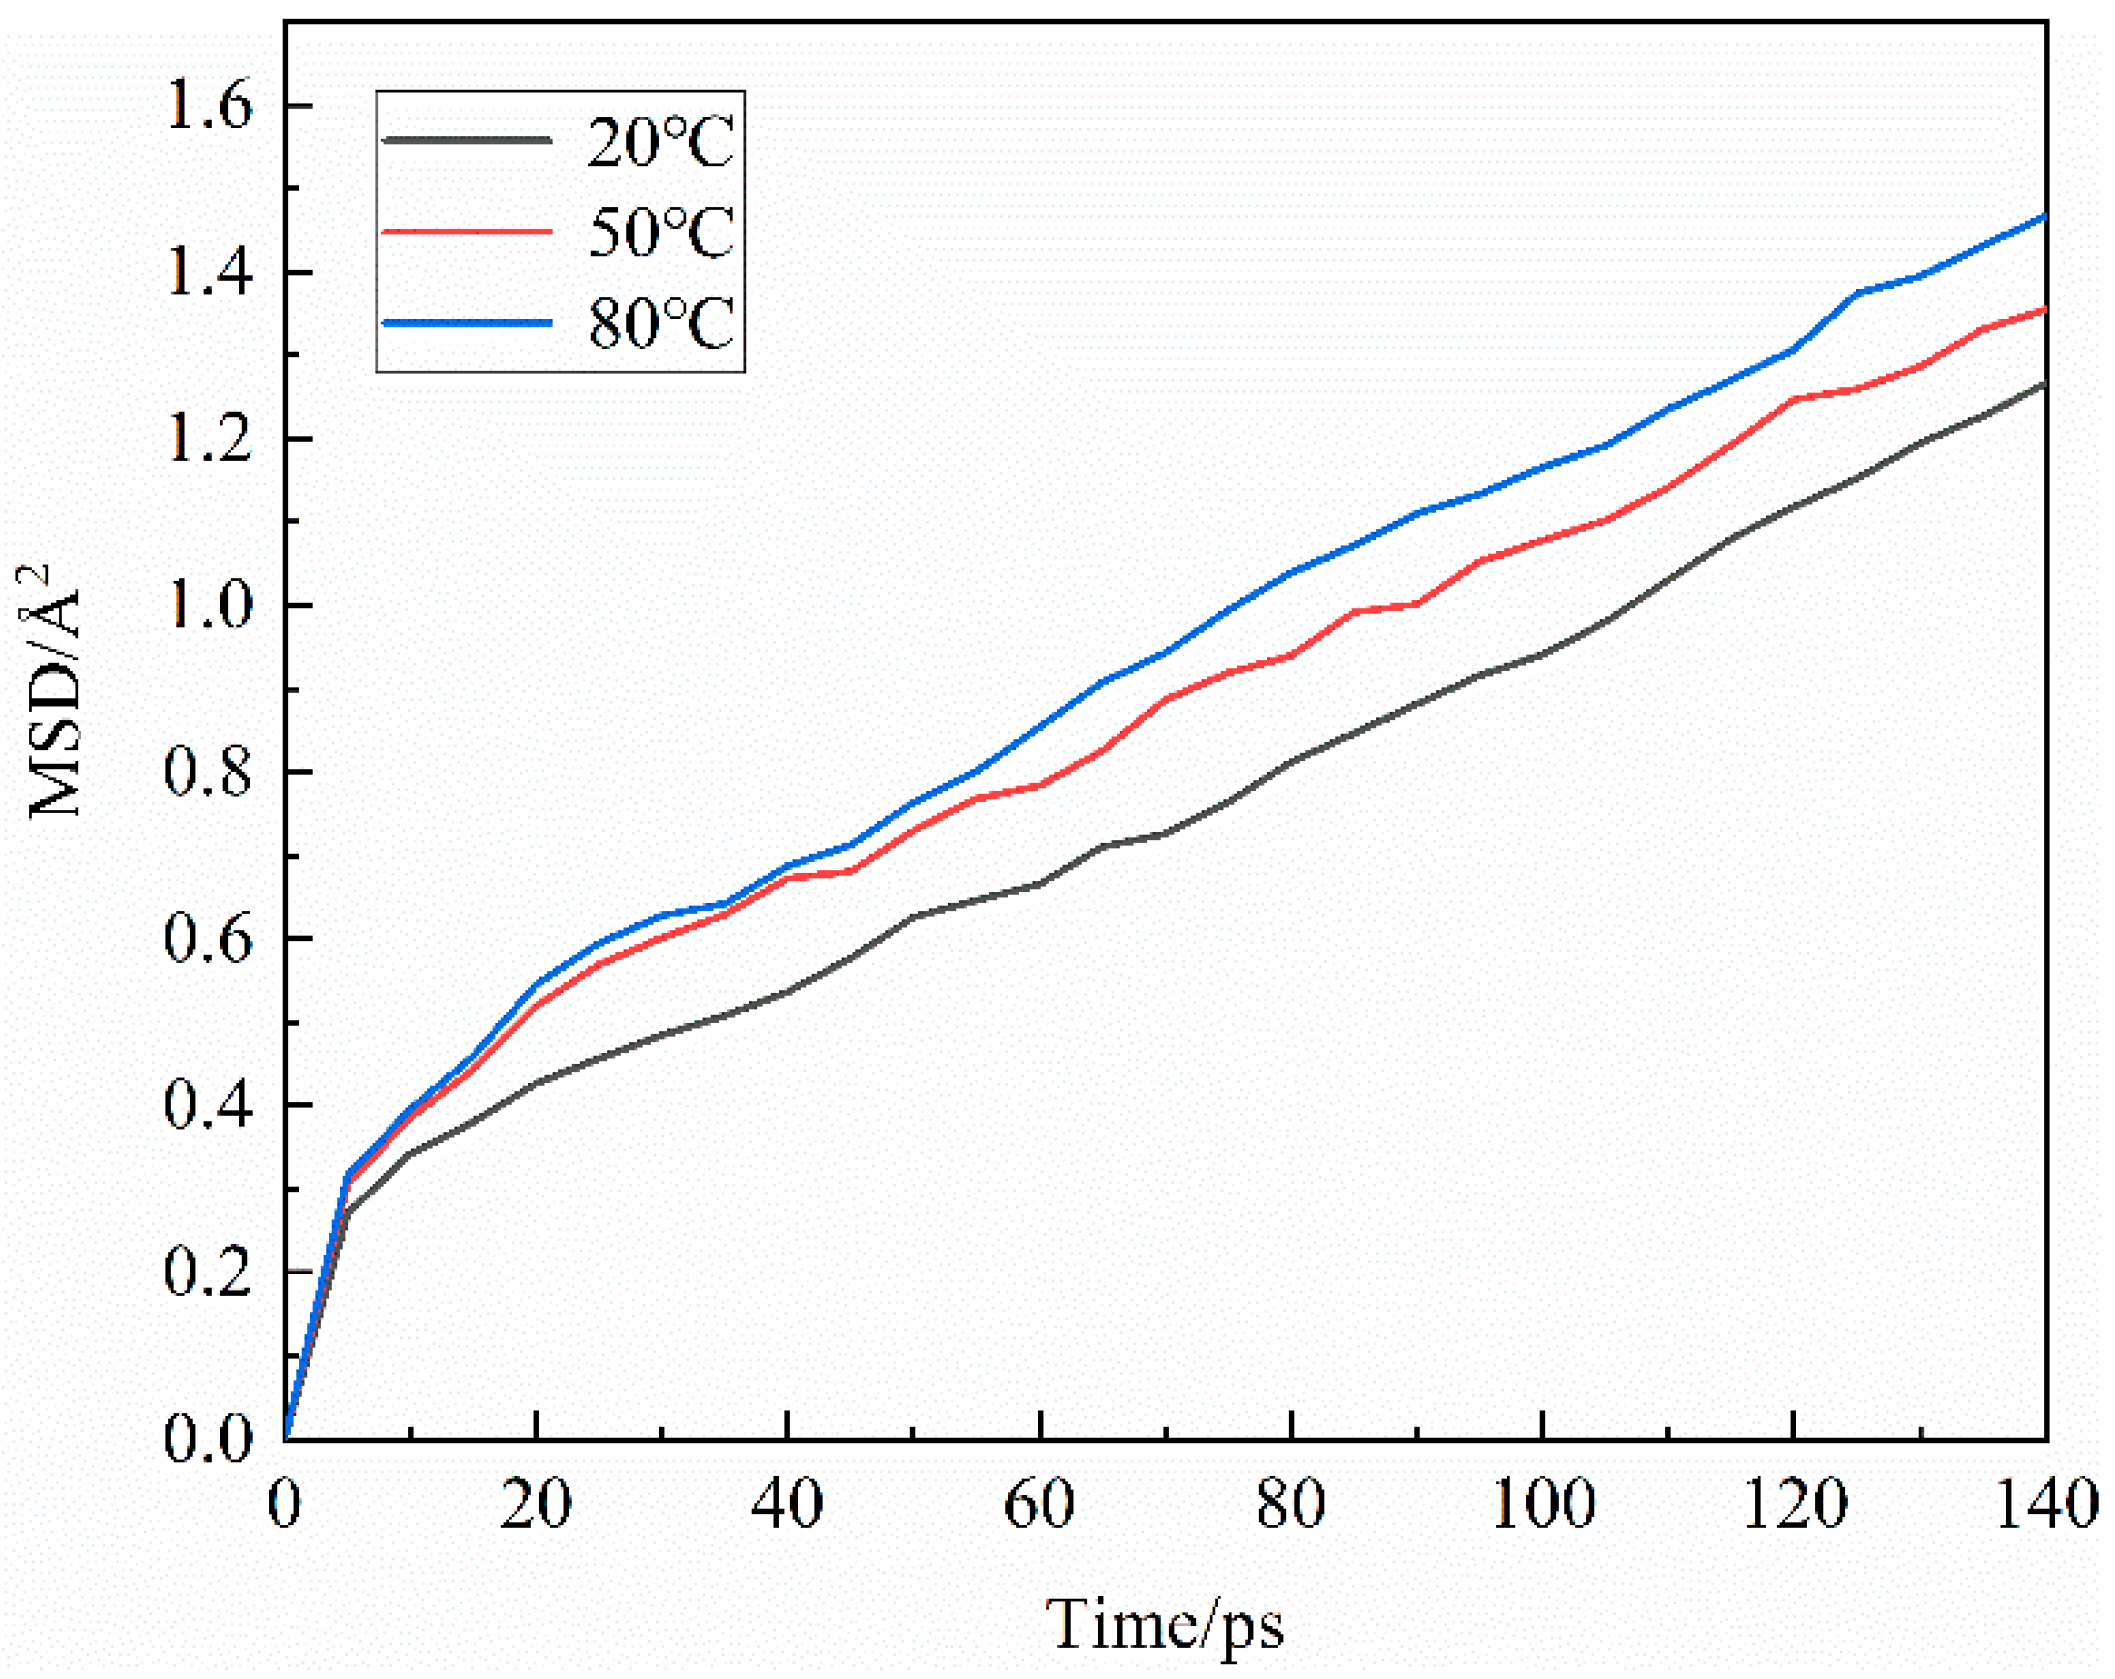
Figure 3 and Figure 4 are the mean square shifts of Ca2+ and CO32- in the system at different temperatures, respectively. It can be seen that the mean square shift of CO32- and Ca2+ has a good linear relationship with time. At different temperatures, CO32- and Ca2+ are rapidly stabilized after a short relaxation of the system and then keep a relatively stable diffusion state. With the increasing temperature, the slope of the mean square displacement curve of Ca2+ and CO32- increases, that is, the diffusion coefficients of CO32- and Ca2+ increase with the increasing temperature. This also shows that in this study, high temperature can accelerate the diffusion of Ca2+ and CO32- in the system, and increase the probability of collision and combination between them in the system, which is beneficial to the formation of CaCO3 crystals. The effect of temperature on the carbonation of steel slag at 20–100 ℃ [27,38] has been investigated experimentally, and it is considered that the increase of temperature is one of the reasons for the increase in ion diffusion rate in the system. The experimental study at 20–60 ℃ [34] also reached the same conclusion, which is also consistent with the results obtained by theoretical analysis [37,38,39].
Figure 3.
Mean square displacement of Ca2+ at different temperatures.
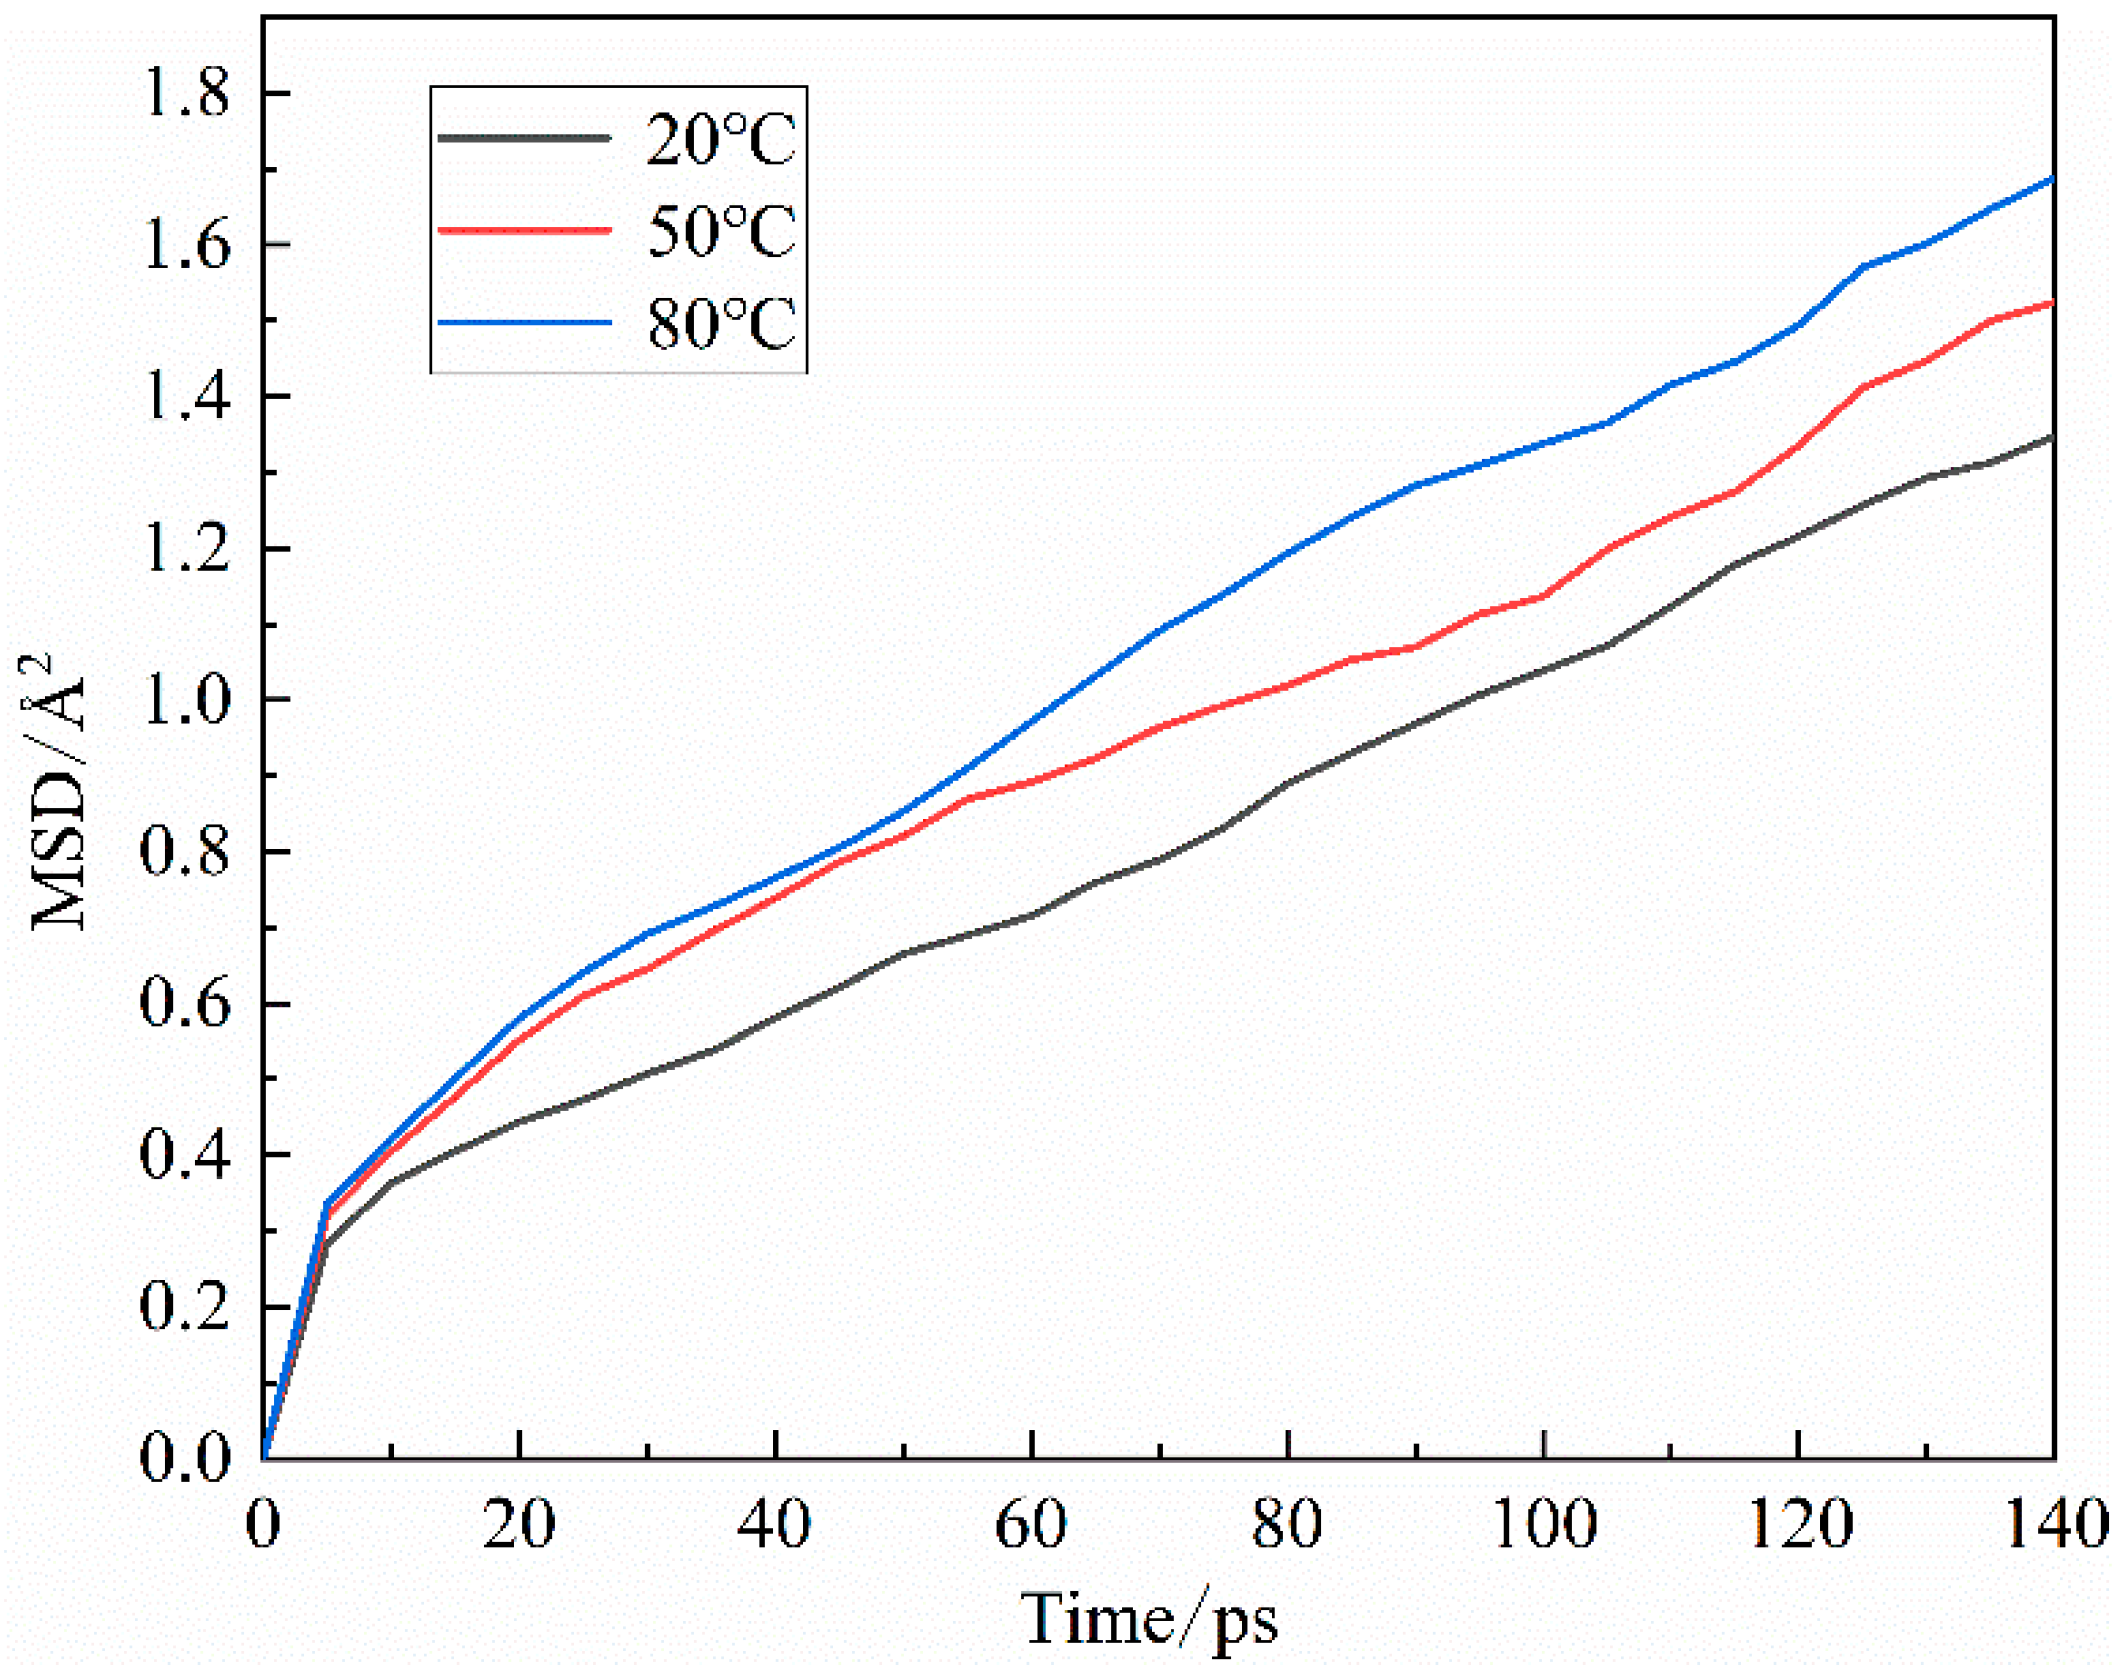
Figure 4.
Mean square displacement of CO32- at different temperatures.
3.1.3. Agglomeration behavior
Figure 5 shows the motion trajectory of each particle in the system with time when the solution temperature is 80 ℃ and the concentration of CO32- is 20 vol.%. It can be seen from the figure that Ca2+ and CO32- in the solution system are irregularly dispersed at the initial moment. With the increase of simulation time, Ca2+ and CO32- form clusters through the interaction force between ions.
Figure 5.
Motion trajectories of particles in the system with CO32- concentration of 20 vol.% at different simulation times (T=80 ℃). (a) 0 ps; (b) 150 ps; (c) 300 ps. Red: O; Green: Ca; Grey: C; Blue: H.
Figure 5.
Motion trajectories of particles in the system with CO32- concentration of 20 vol.% at different simulation times (T=80 ℃). (a) 0 ps; (b) 150 ps; (c) 300 ps. Red: O; Green: Ca; Grey: C; Blue: H.

Figure 6 shows the characteristics of the largest cluster particles in the system at different temperatures. The trajectories of particles are different with different temperatures, which also leads to the different degrees of particle clusters in the system.
Figure 6.
Characteristics of the largest cluster particles in Ca2+–CO32-–NH4+–Cl-–H2O system at different temperatures. (a) 20 ℃; (b) 50 ℃; (c) 80 ℃.
Figure 6.
Characteristics of the largest cluster particles in Ca2+–CO32-–NH4+–Cl-–H2O system at different temperatures. (a) 20 ℃; (b) 50 ℃; (c) 80 ℃.
As can be seen from Figure 6, with the gradual increase of temperature, the number of atoms contained in the largest cluster particles in the solution system increases, and the degree of agglomeration becomes larger and larger. This shows that in the temperature range of 20–80 ℃, high temperature is beneficial to the association between Ca2+ and CO32- and the formation of large clusters.
3.2. Effects of concentrations of CO32-
3.2.1. Binding energy
In this simulation experiment, with the help of the “Forcite” module in MS software, the energy of each component of the system under different concentrations of CO32- was studied at 20 ℃, and the results are shown in Table 6. It can be seen from the table that with the increase in the concentration of CO32- in the system, the absolute value of the total energy of the system decreases. The proportion of CO2 in the exhaust gas from iron and steel enterprises is 15 vol.%–25 vol.%. Therefore, using the formula 3, the binding energy of CaCO3 and H2O under different CO2 concentrations (15 vol.%–25 vol.%) of CO32- can be calculated.
Table 6.
Energy calculation of each component in Ca2+–CO32-–NH4+–Cl-–H2O system under different concentrations of CO32- (kJ·mol-1).
Table 6.
Energy calculation of each component in Ca2+–CO32-–NH4+–Cl-–H2O system under different concentrations of CO32- (kJ·mol-1).
| Energy/kJ·mol-1 | 15 vol.% | 20 vol.% | 25 vol.% |
|---|---|---|---|
| -189592.61 | -199381.04 | -213739.43 | |
| -123302.42 | -137316.67 | -150464.40 | |
| -68686.58 | -67889.69 | -66684.57 | |
| -120190.84 | -132855.18 | -146846.78 | |
| -67266.41 | -66959.19 | -69376.41 | |
| -1349.42 | -1098.47 | -959.42 | |
| -184432.24 | -197657.37 | -212247.99 | |
| 2751.18 | 2078.09 | 1169.74 |
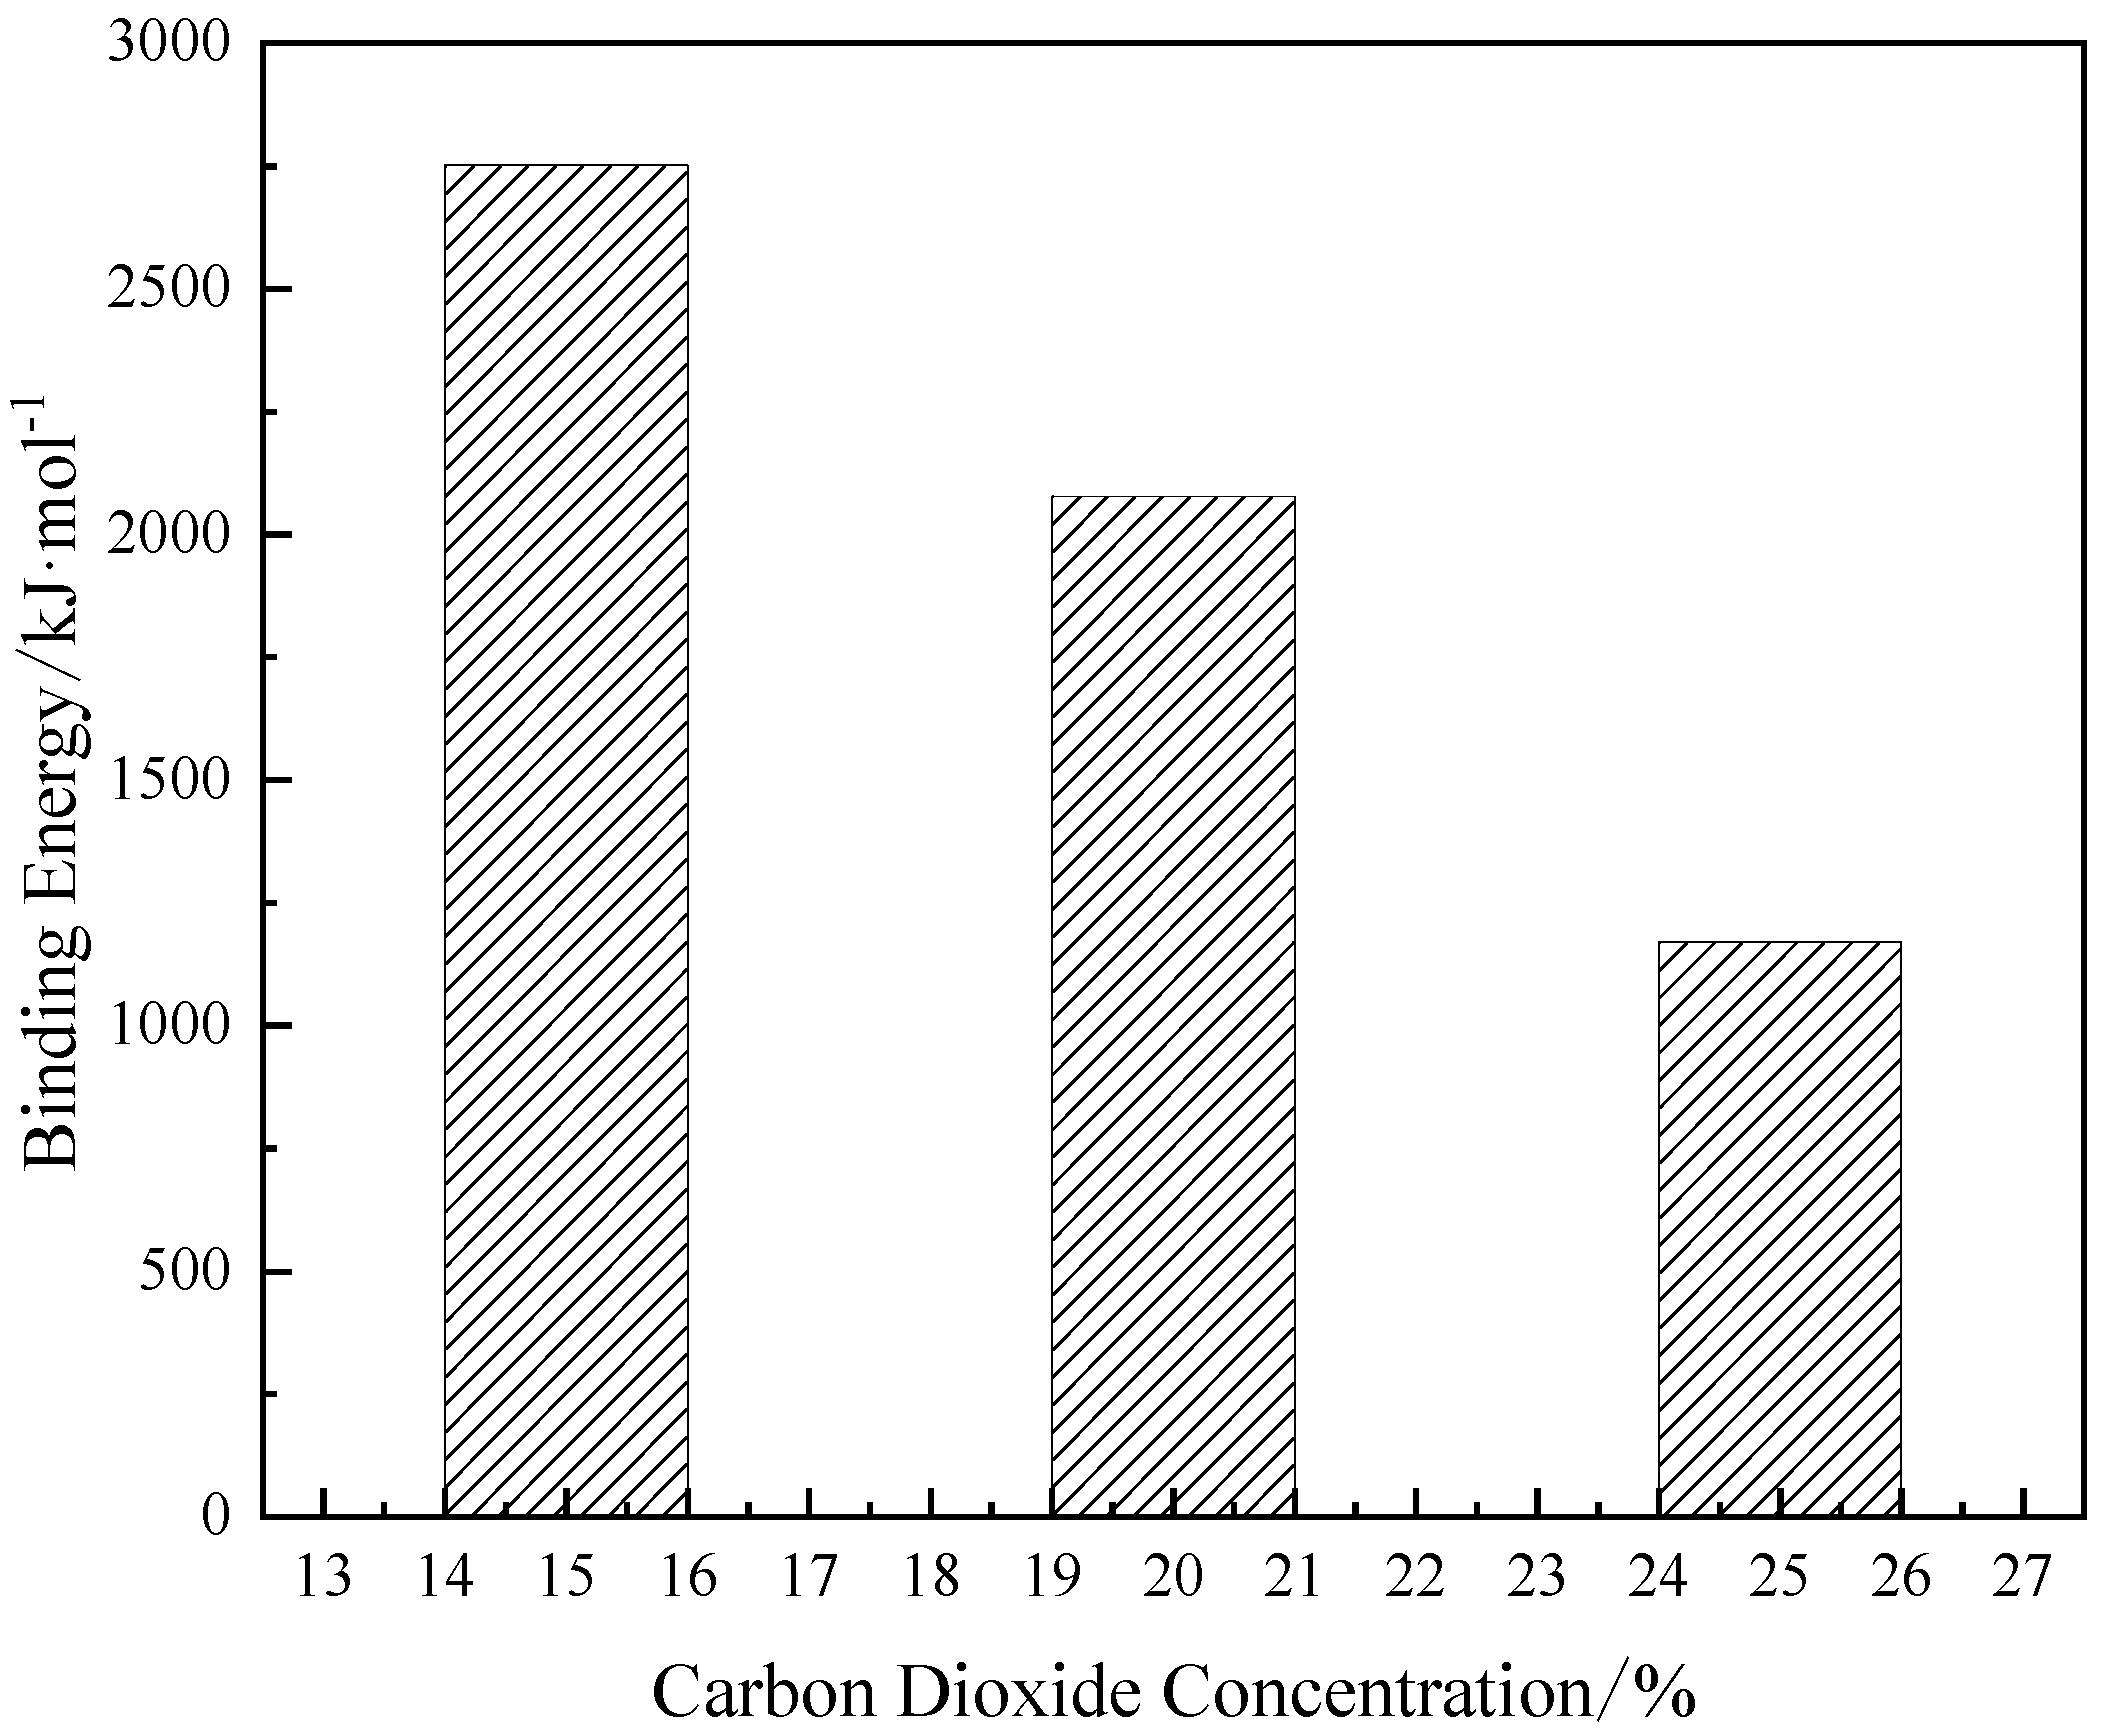
Figure 7 is a histogram of binding energy between CaCO3 and H2O under different concentrations of CO32-. It can be seen from the figure that with the gradual increase in the concentration of CO32-, the number of CO32- in the system increases, and the binding energy between CaCO3 and H2O decreases. With the increase in the concentration of CO32-, the concentration of [35] CO32- in the system increases. The increase of CO32- concentration will break the network structure of hydrogen bonds between water molecules. The breakdown of the grid structure reduces the number of hydrogen bonds in the system and the interaction force between water molecules, which leads to the decrease of the binding energy between CaCO3 and H2O. This indicates that high CO32- concentration will make Ca2+ and CO32- start to polymerize, increase the chance of contact between Ca2+ and CO32-, and facilitate the formation and polymerization of CaCO3 clusters in solution. A large number of experiments [37,40] at the concentration of 10 vol.%–100 vol.% CO2 show that the increase of CO32- concentration is beneficial to the formation of CaCO3, which is the same as the simulation results in this study, which verifies the credibility of the simulation results from the side.
Figure 7.
Binding energy of CaCO3 and H2O under different CO32- concentrations.
3.2.2. Microstructure of particles
Table 7 shows the peak position and peak value of the Ca2+–CO32- radial distribution function diagram in the system under different concentrations of CO32-. It can be seen from the table that under the conditions of 15 vol.%, 20 vol.%, and 25 vol.% CO32- concentration, the radial distribution function of Ca2+–CO32- forms its peak at r=4.03 Å, r=4.09 Å and r=4.05 Å, respectively. However, with the increase in the concentration of CO32-, the peak position of the highest peak is similar, which indicates that the interaction distance between Ca2+ and CO32- does not change with the change of the concentration of CO32-. Ca2+ and CO32- show short-range, medium-range ordered and long-range disordered cluster structures.
Table 7.
Peak position and peak value of Ca2+–CO32- radial distribution function diagram in the system under different concentrations of CO32-.
Table 7.
Peak position and peak value of Ca2+–CO32- radial distribution function diagram in the system under different concentrations of CO32-.
| CO32- concentration/vol.% | Peak position/Å | Peak value/— |
|---|---|---|
| 15 | 4.03 | 5.01 |
| 20 | 4.09 | 6.11 |
| 25 | 4.05 | 8.00 |
Figure 8 shows the radial distribution function of Ca2+–CO32- in the system under different concentrations of CO32-. It can be seen from the figure that under the condition of different concentrations of CO32-, the radial distribution function of Ca2+–CO32- has a similar peak position at r=4.05 Å, and has a second peak near r=5.21 Å, which is close to 1 in the remote range. In the range of the first peak, the binding force between Ca2+ and CO32- is strong, which is due to the direct interaction between Ca2+ and CO32- in this range. With the increase of CO32- concentration, the peak value of Ca2+–CO32- radial distribution function increases, and the peak shape tends to be sharp. This phenomenon shows that the increase of CO32-concentration is beneficial to the formation of CaCO3 clusters due to the enhancement of the association between Ca2+ and CO32-.
Figure 8.
Binding Radial distribution function diagram of Ca2+–CO32- in system under different concentrations of CO32.
Figure 8.
Binding Radial distribution function diagram of Ca2+–CO32- in system under different concentrations of CO32.
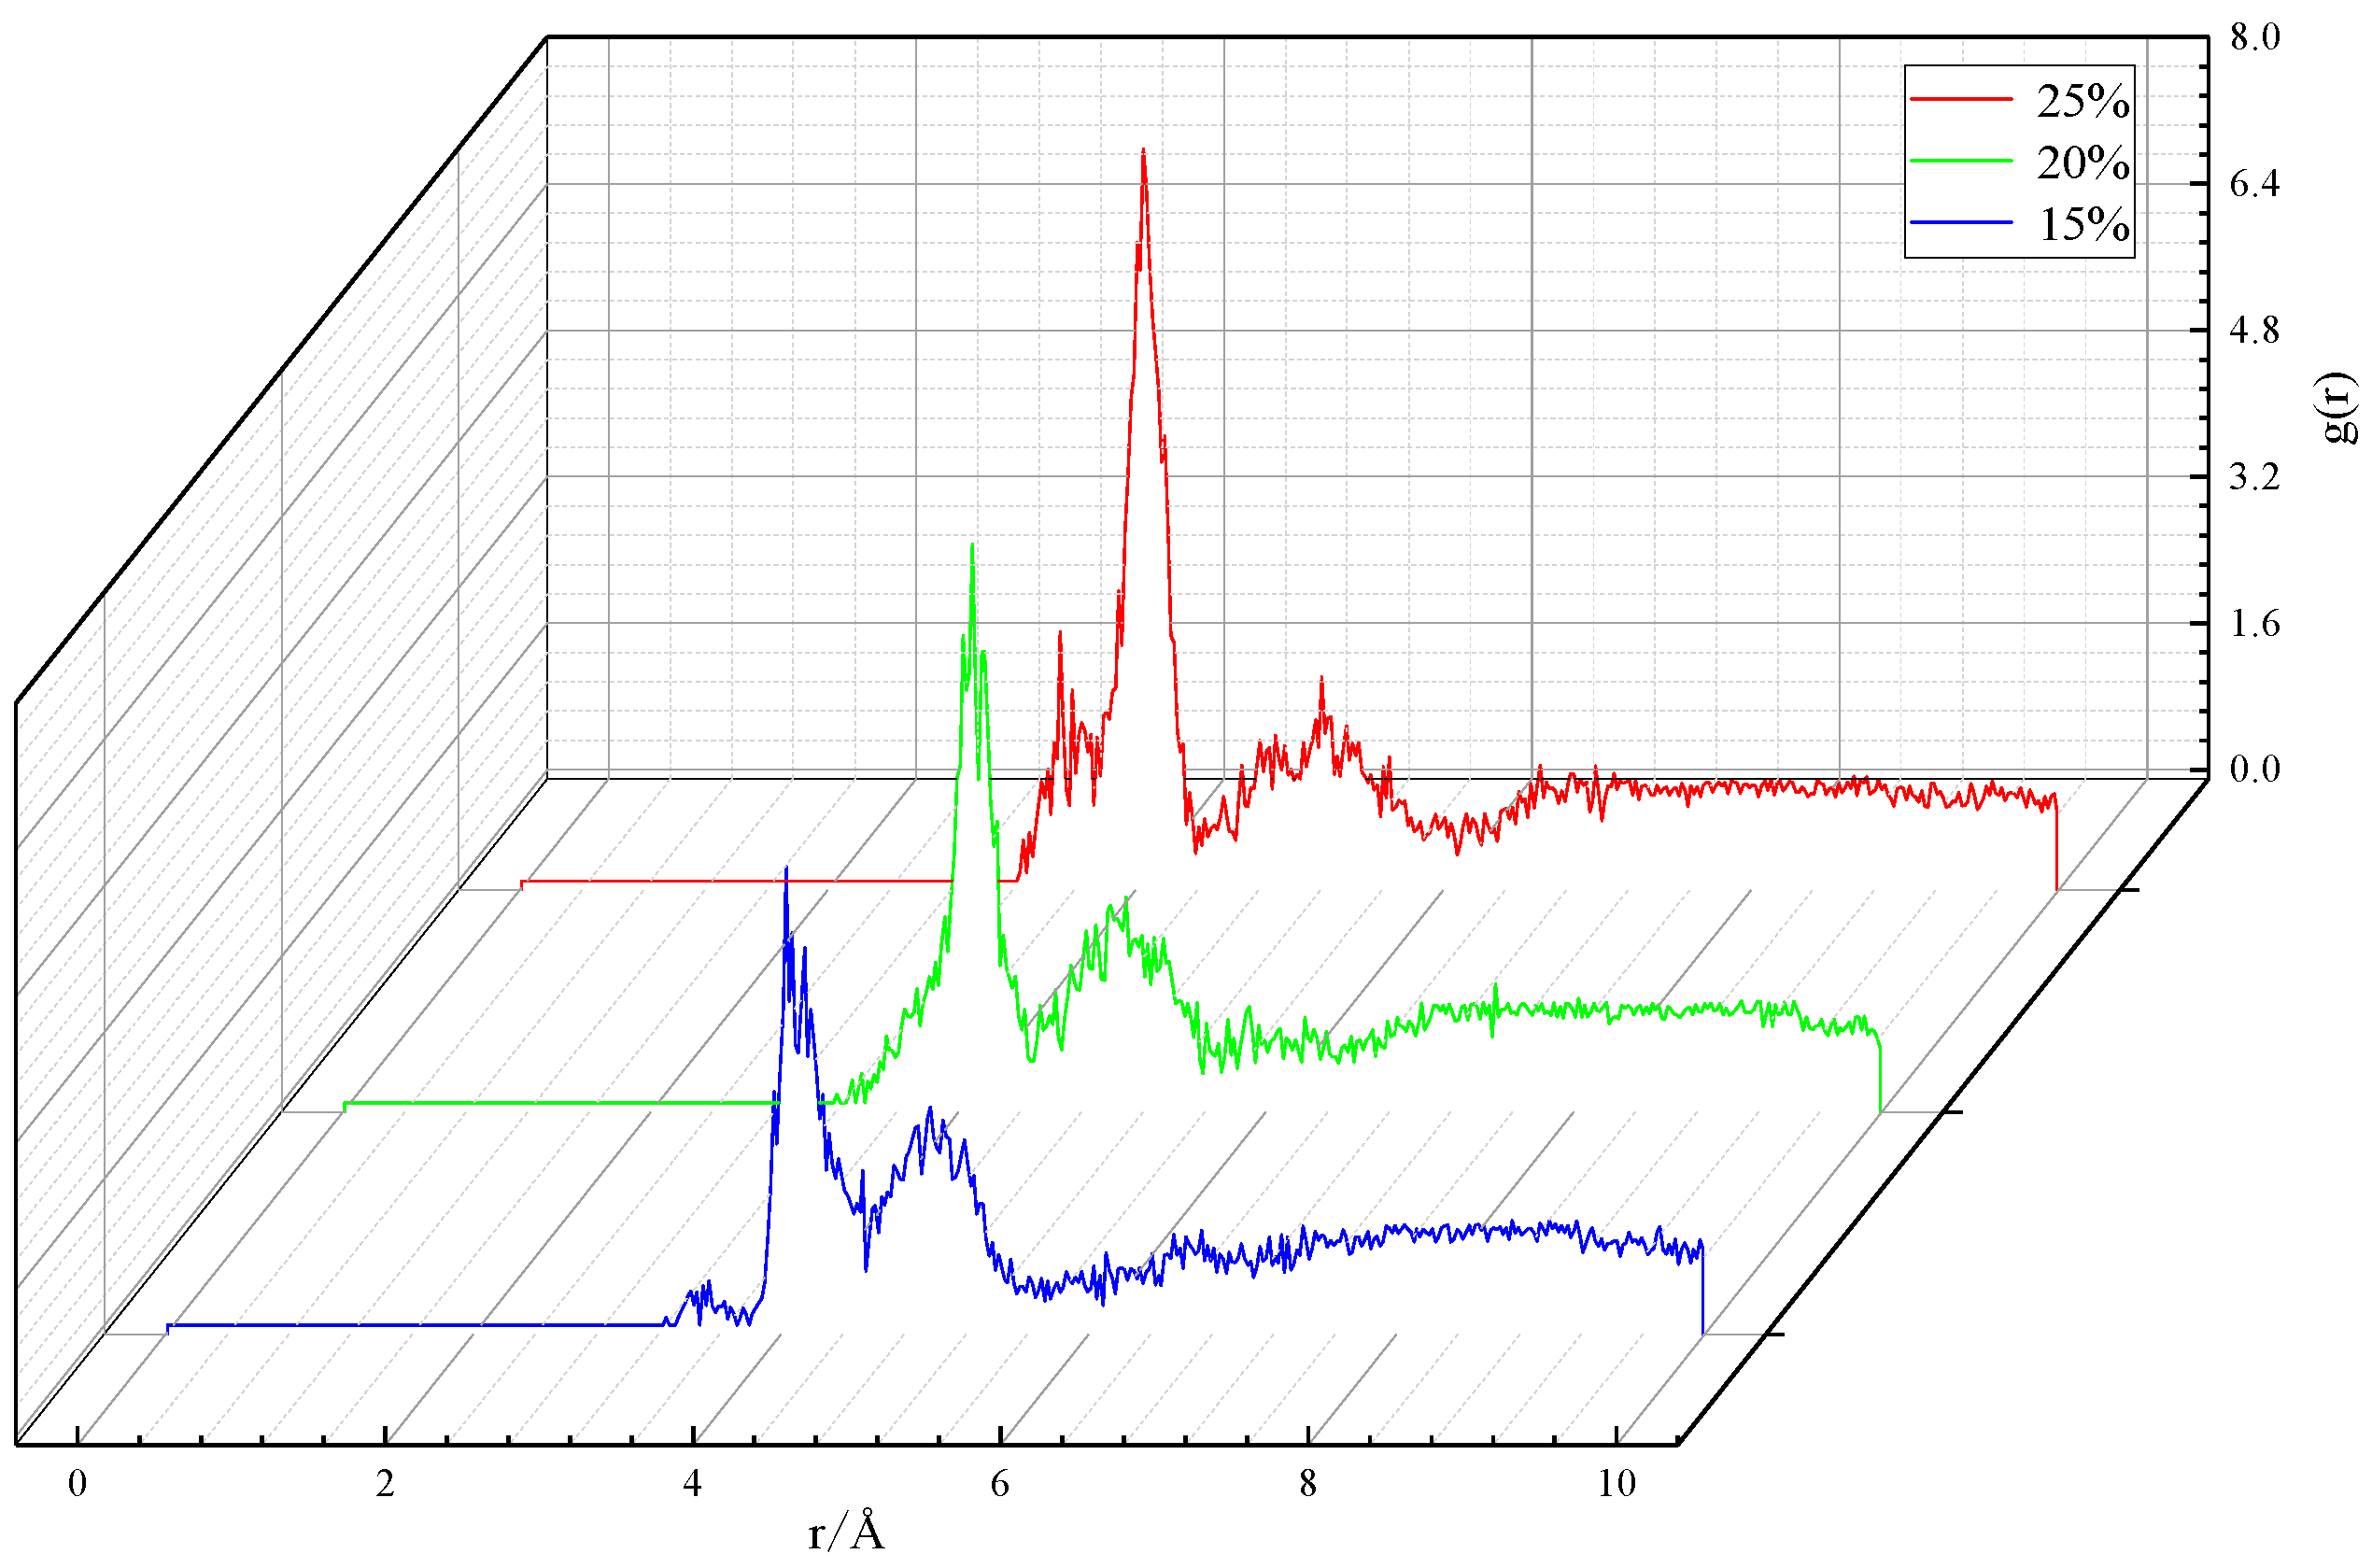
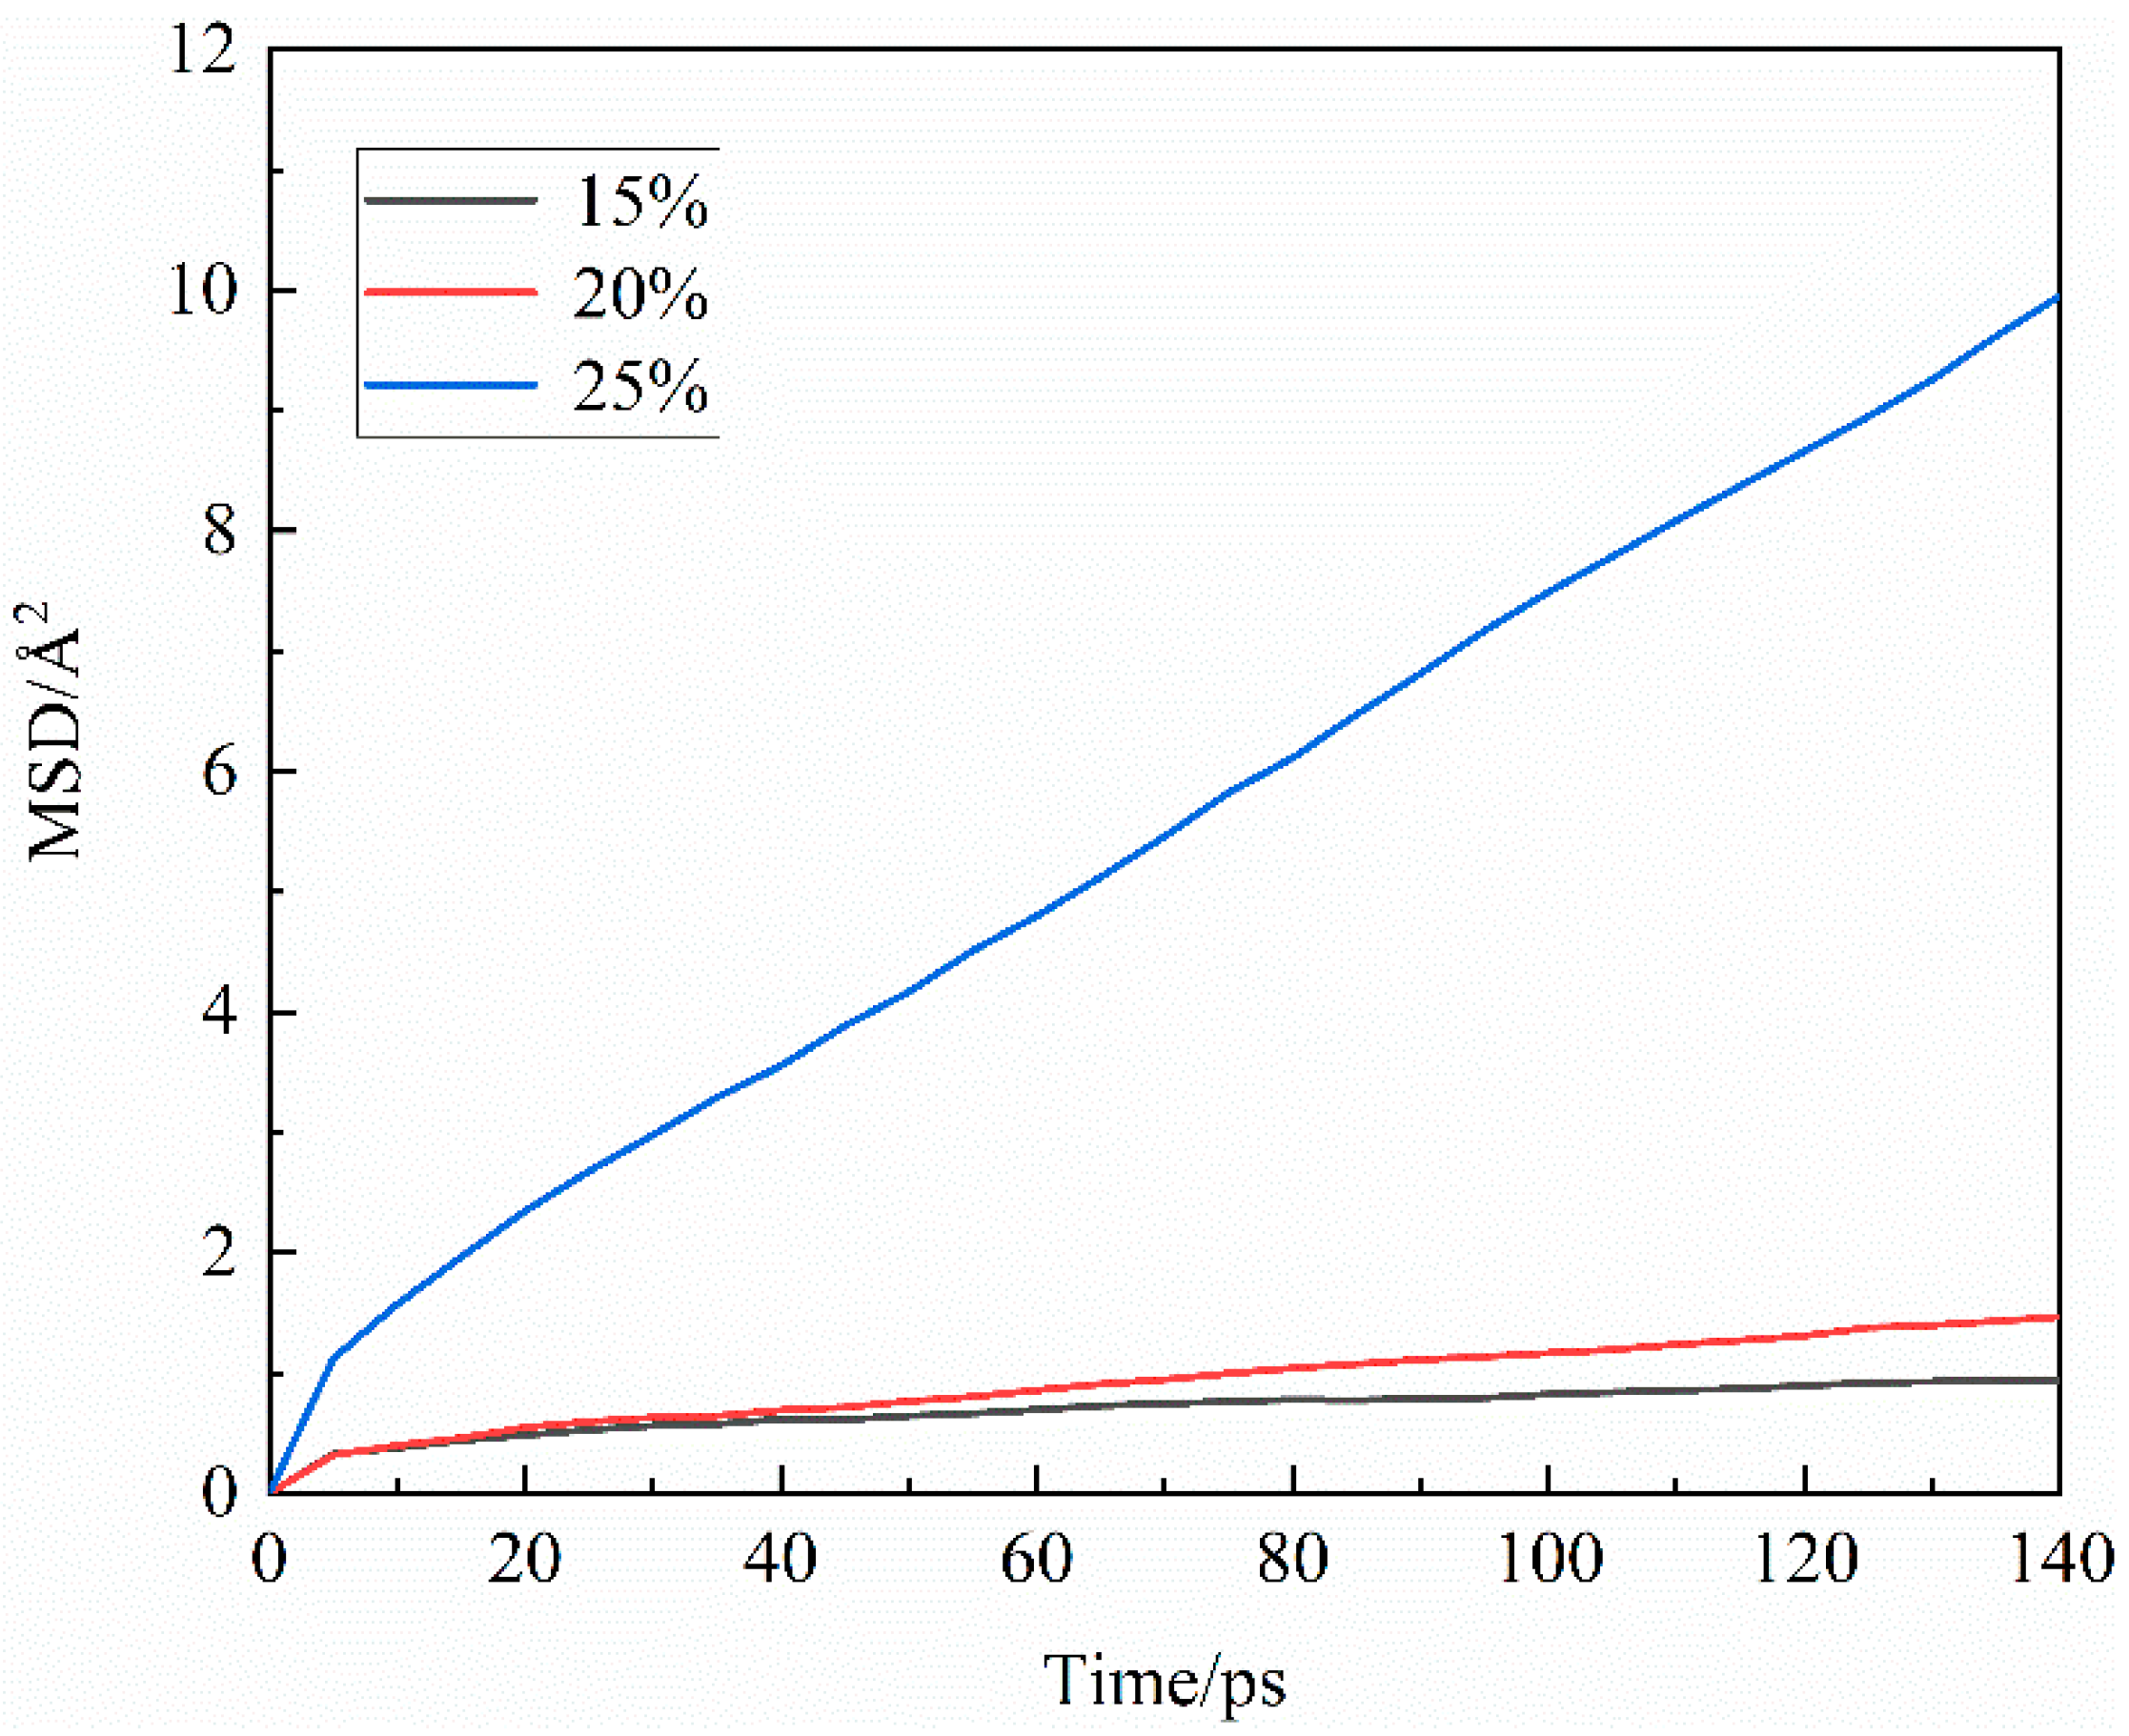
Figure 9 and Figure 10 are the mean square shifts of Ca2+ and CO32- in the system under different concentrations of CO32-, respectively. It can be seen from the figure that the mean square shift of CO32- and Ca2+ has a good linear relationship with time. Under the condition of different concentrations of CO32-, both CO32- and Ca2+ reached stability rapidly after a short relaxation of the system and then kept a relatively stable diffusion state all the time. The slope of mean square displacement curve of Ca2+ and CO32- also increases, which indicates that the diffusion coefficients of CO32- and Ca2+ increase with the increase in the concentration of CO32-. This also shows that in this study, high concentration of CO32- can accelerate the diffusion of Ca2+ and CO32- in the system and increase the probability of collision and combination between them in the system which is beneficial to the formation of CaCO3 crystals.
Figure 9.
Mean square shift of Ca2+ under different concentrations of CO32.
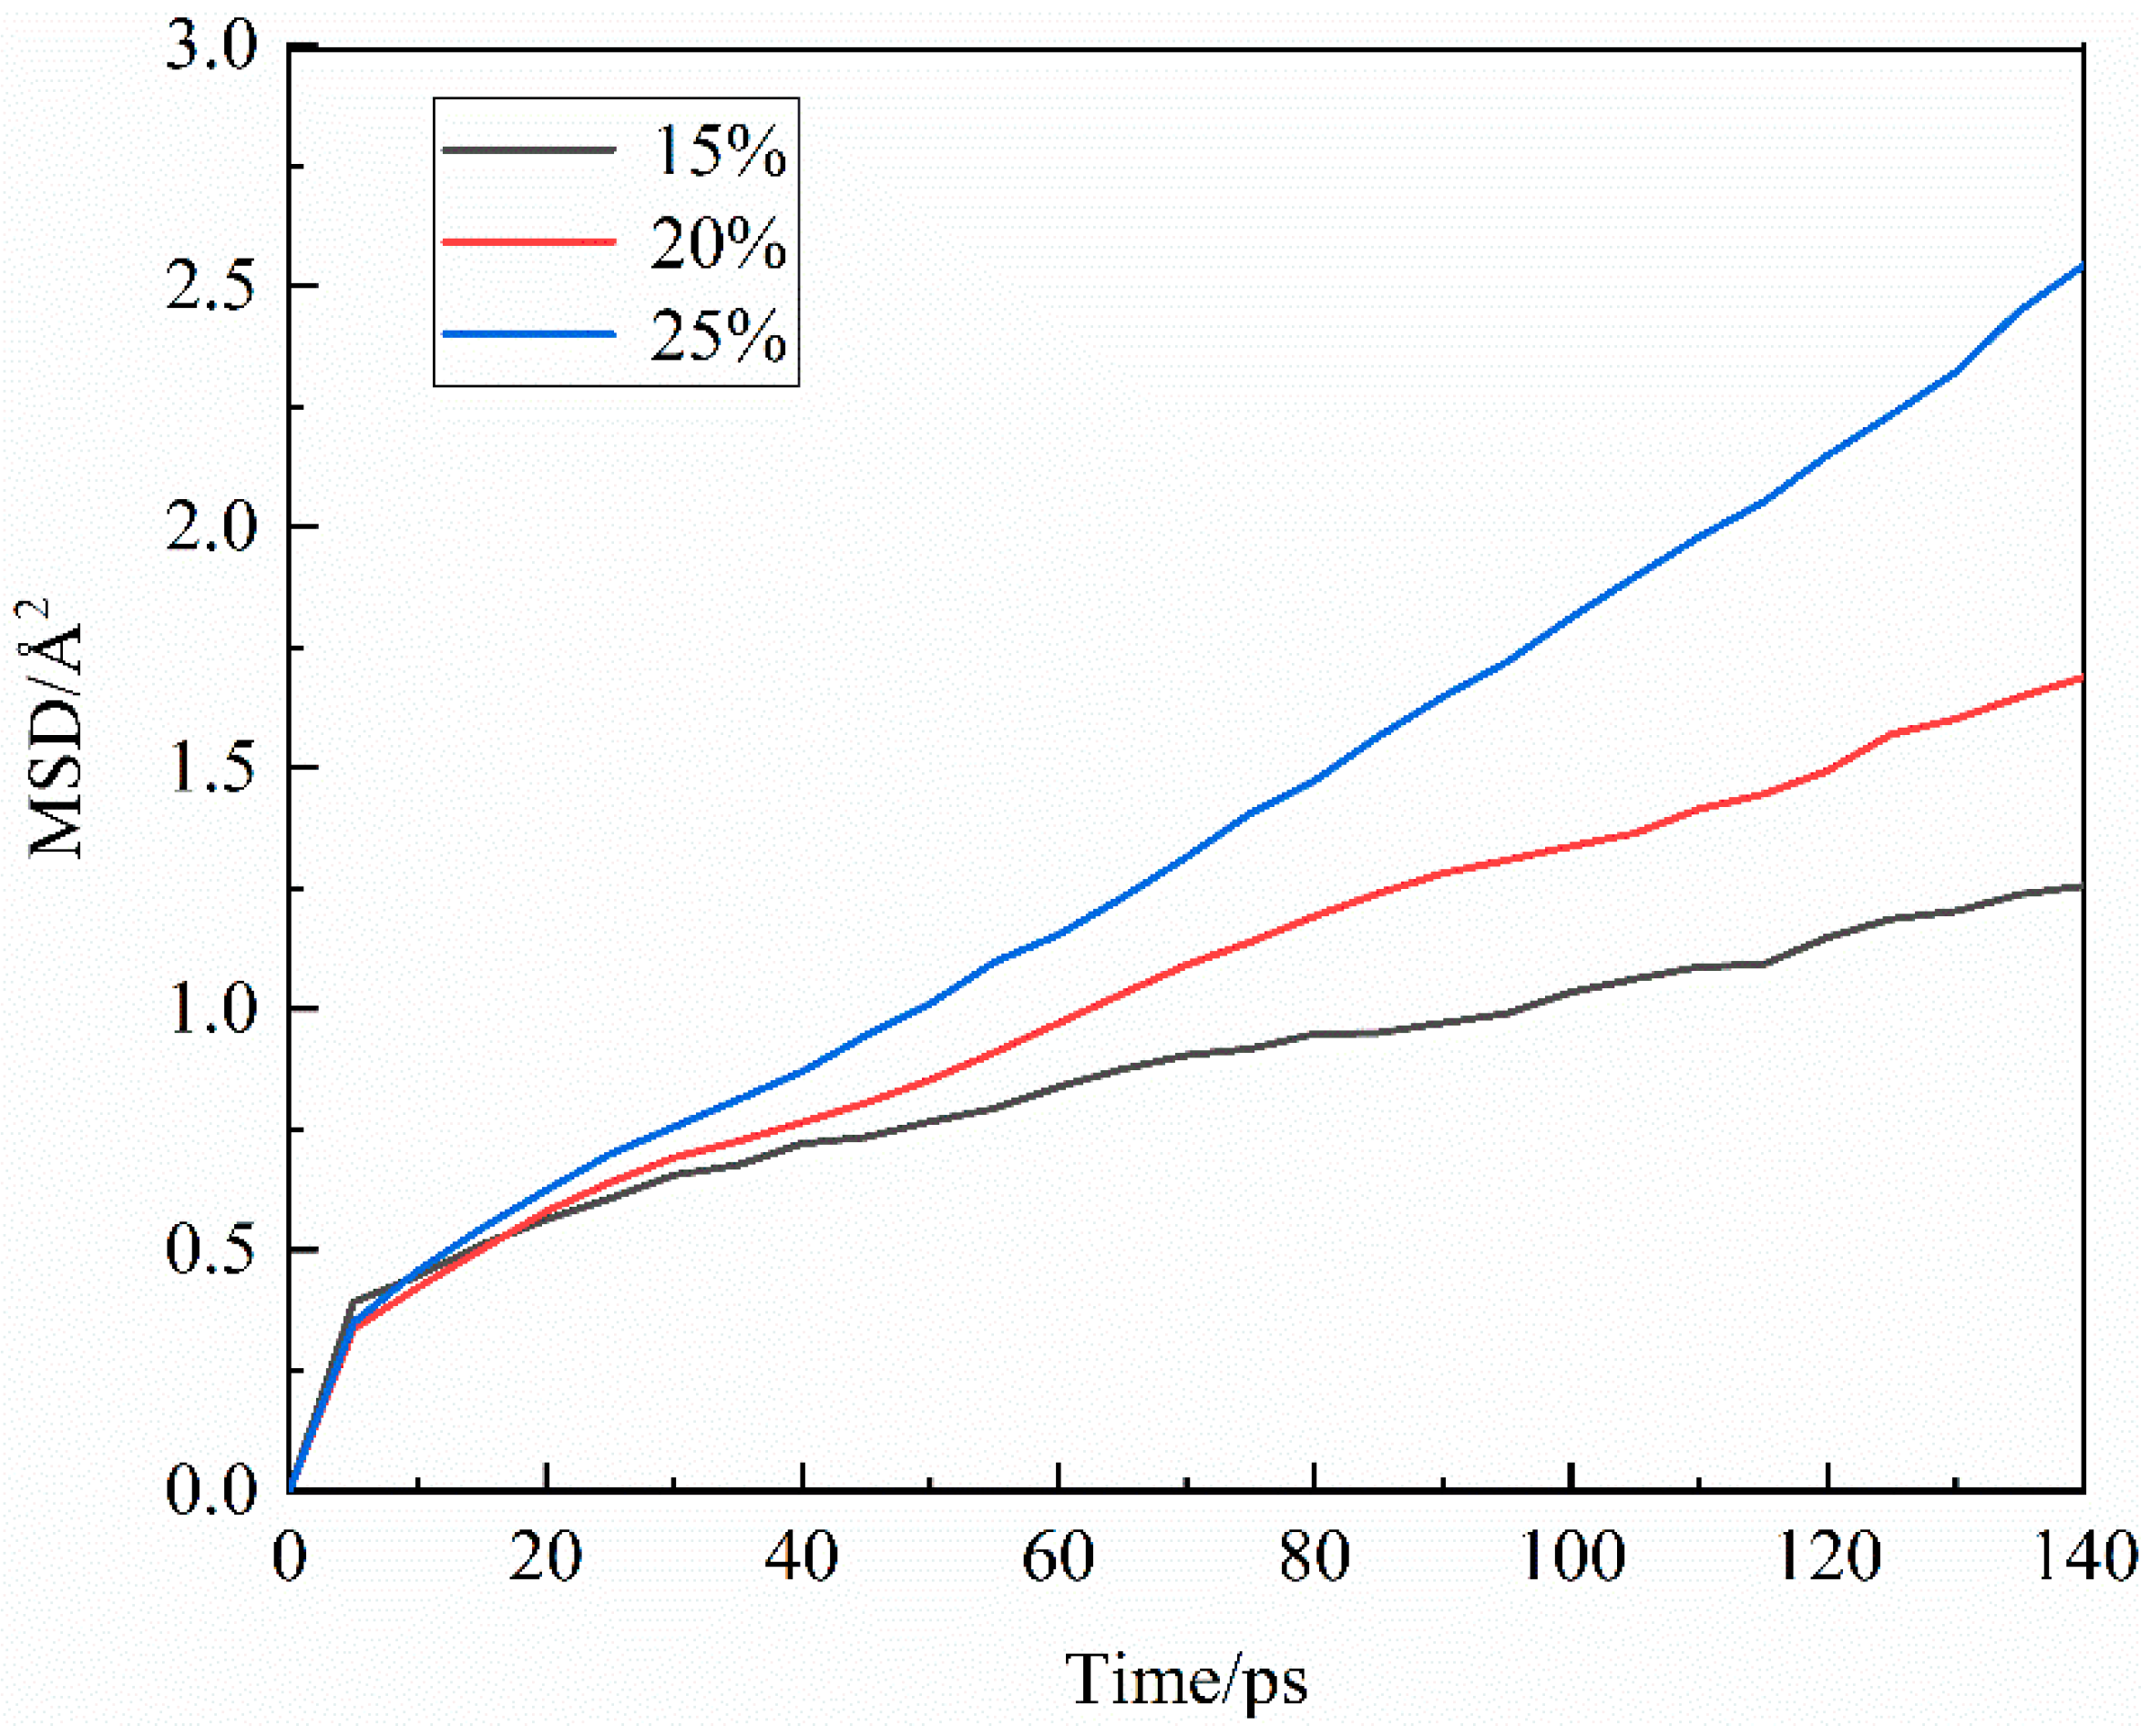
Figure 10.
Mean square shift of CO32- under different concentrations of CO32.
3.2.3. Agglomeration behavior
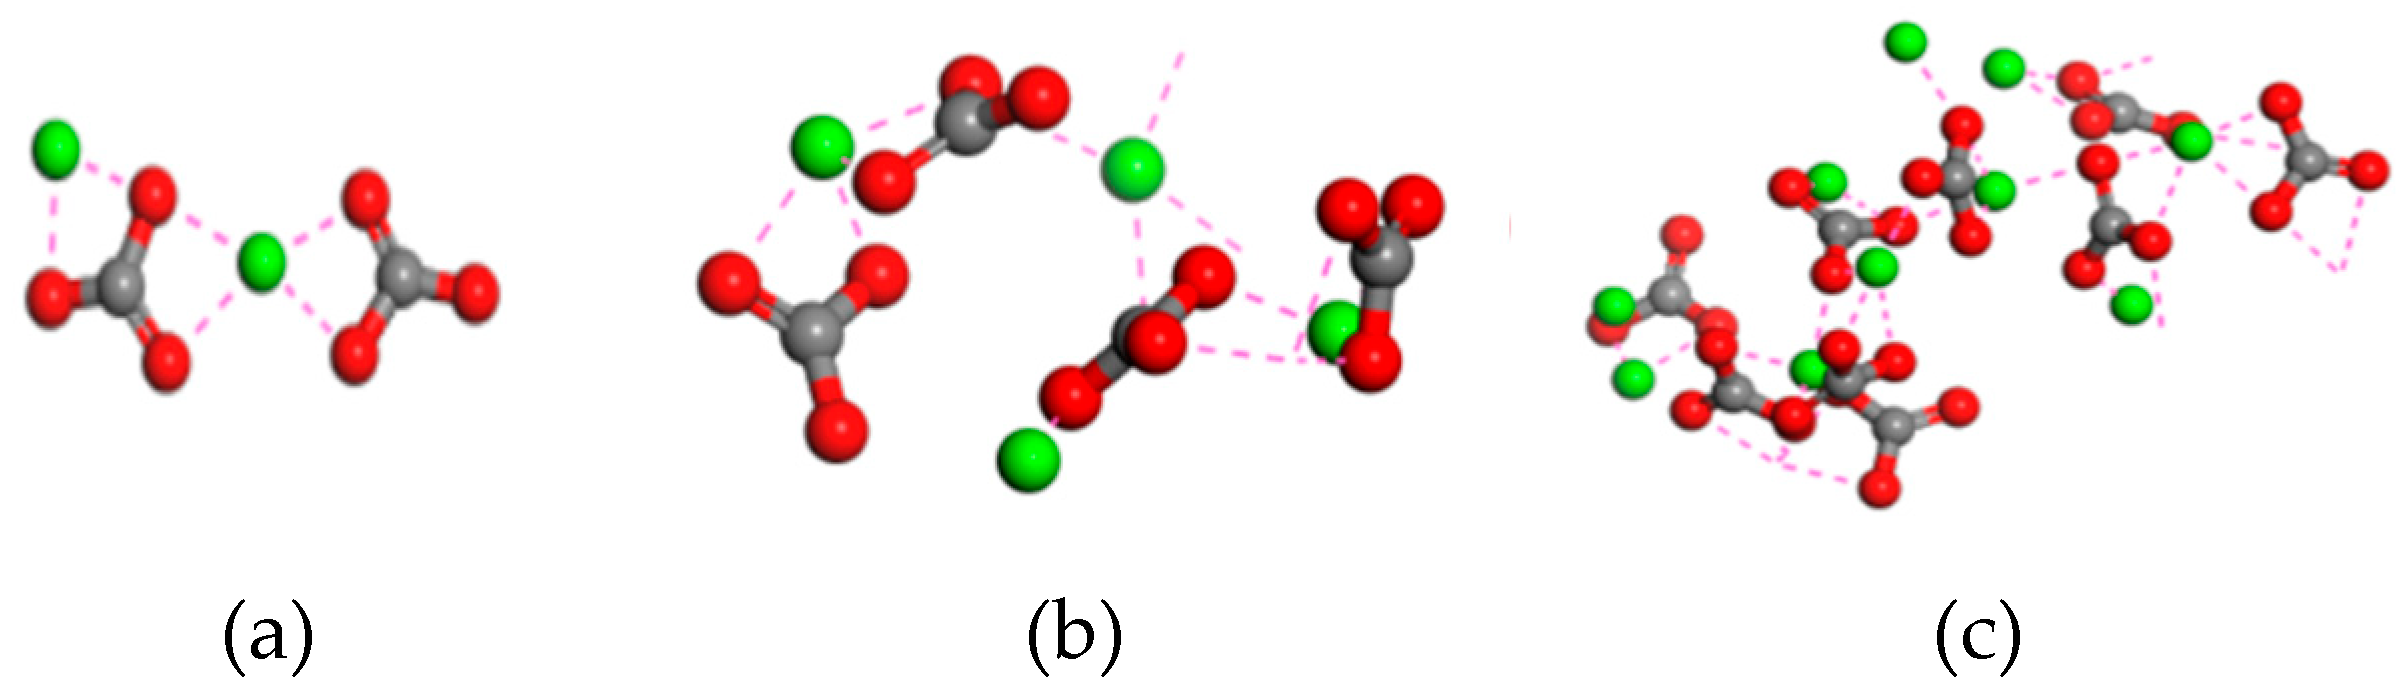
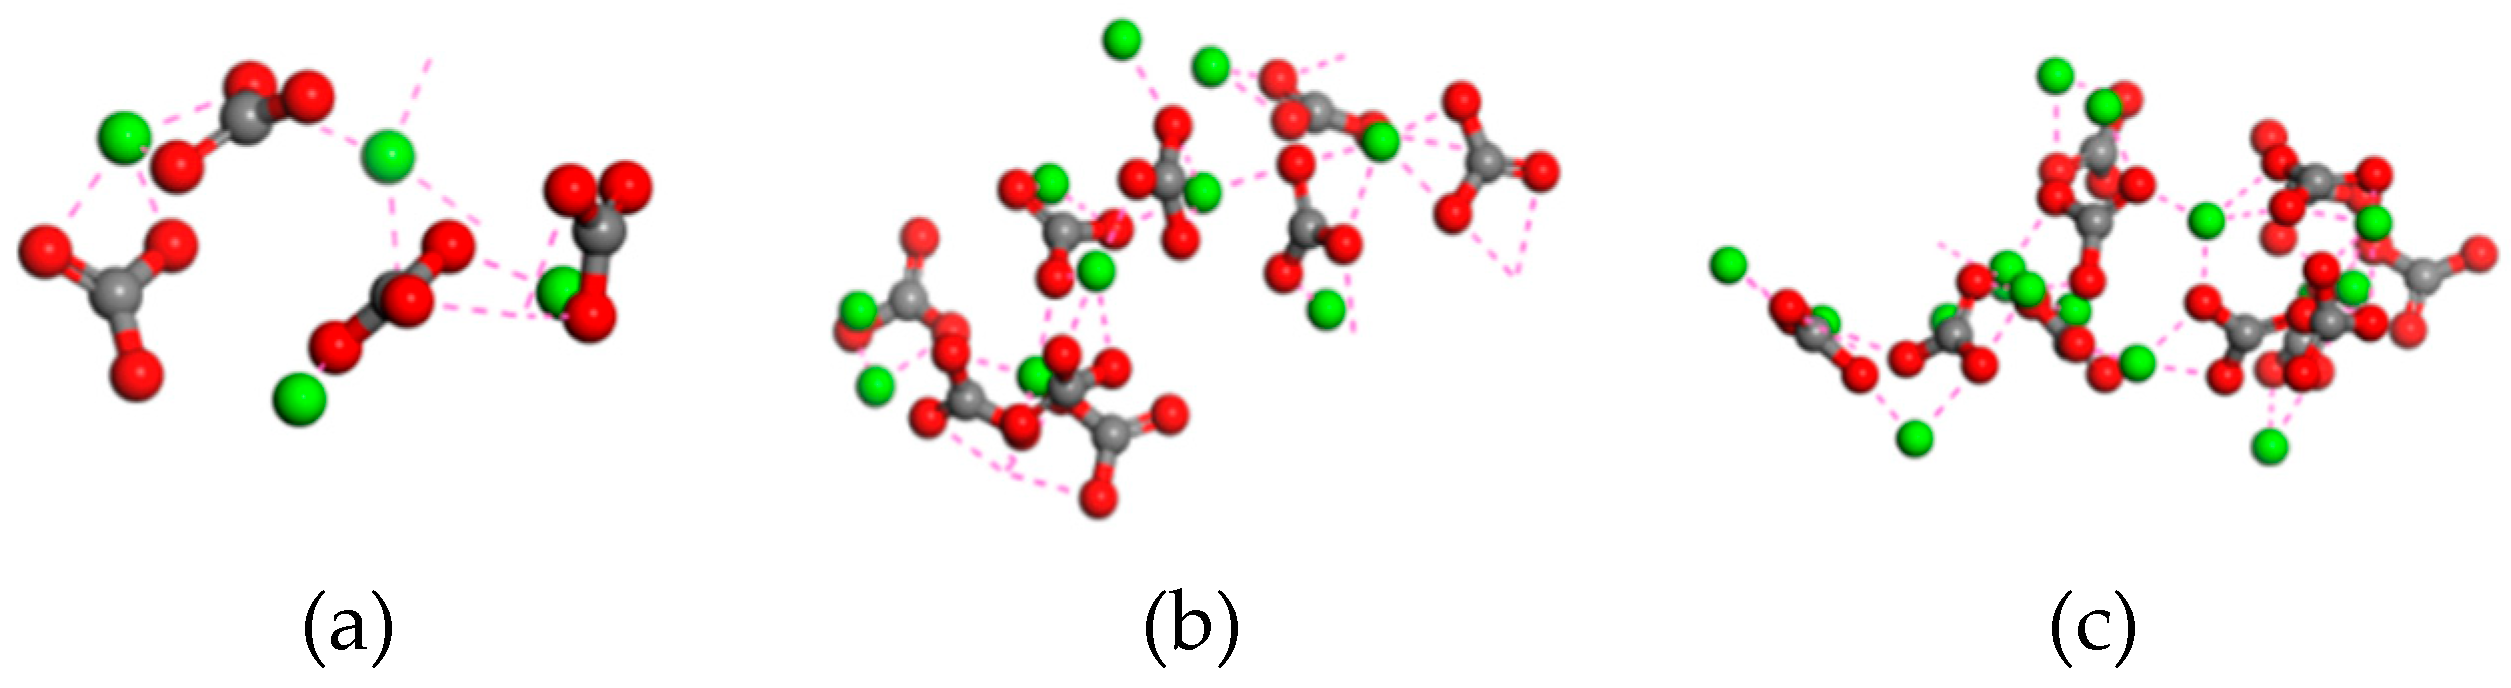
Figure 11 shows the characteristics of the largest cluster particles in the system under different concentrations of CO32-. With the change in the concentration of CO32-, the number of anions and cations in the system also changes, which also causes the difference of particle cluster degree in the system. It can be seen from the figure that with the increase in the concentration of CO32-, the number of atoms contained in the largest cluster particles in the solution system also increases, and the degree of agglomeration is increasing. This phenomenon shows that in the range of 15 vol.%–25 vol.% CO32- concentration, high concentration of CO32- is beneficial to the formation of large clusters and the association between Ca2+ and CO32-.
Figure 11.
Characteristics of the largest cluster particles in the system under different concentrations of CO32-. (a) 15 vol.%; (b) 20 vol.%; (c) 25 vol.%.
Figure 11.
Characteristics of the largest cluster particles in the system under different concentrations of CO32-. (a) 15 vol.%; (b) 20 vol.%; (c) 25 vol.%.
It shows that in the CaCO3–NH4Cl–H2O system, increasing concentration of CO32- is beneficial to the formation of large clusters of CaCO3. Ca2+ and CO32- further improve the association degree, inhibit the hydration of Ca2+ and CO32-, and enhance the stability of the association structure of Ca2+ and CO32-.
4. Conclusions
The crystallization behavior of CaCO3 in the Ca2+–CO32-–NH4+–Cl-–H2O system at different temperatures and different concentrations of CO32- was simulated by molecular dynamics simulation method using Materials Studio software. In this work, the crystallization behavior of CaCO3 in the temperature range of 20–80 ℃ was simulated. The results show that the Ca2+ bonding to CO32- at a distance of r=4.07 Å, which the bonding energy between Ca2+–CO32- increased with the temperature (20–80 ℃). This reasons behind of the phenomenon may be the destruction of the hydrogen bonding network between water molecules by a higher temperature. In addition, the diffusion coefficients of Ca2+ and CO32- are increased with the temperature. Furthermore, the effect of the concentration of CO32- on CaCO3 is studied in the range of 15 vol.%–25 vol.%. It was found that the changes of the concentration of CO32- and temperature have an insignificant of the binding distances between Ca2+–CO32-, which the first CO32- shell around Ca2+ with a distance of 4.05 Å. In addition, the intensity of the first peak of Ca2+–CO32- increased remarkably with the CO32- concentration, indicating a higher binding capacity of Ca2+ and CO32- with the increase in the concentration of CO32-. The mean square displacement of Ca2+ and CO32- increases with increasing concentration of CO32-,which beneficial to the formation of the large CaCO3 cluster. However, a high concentration of CO32- in the solution system may require a higher CO2 content in the industrial waste gas or gas flow rate.
Author Contributions
Writing–original draft preparation, C. H; investigation, C. H., B. G. and W. L.; conceptualization, X. M. and Q. Z.; methodology, X. M. and Q. Z.; resources, Q. Z. and C. L.; funding acquisition, Q. Z. and C. L.
Funding
This work was supported by the National Natural Science Foundation of China (No. 52074078), the National Key R&D Program of China (No. 2021YFC2901200), the Applied Fundamental Research Program of Liaoning Province (No. 2023JH2/101600002), the Shenyang Young Middle-Aged Scientific and Technological Innovation Talent Support Program (No. RC220491), the Liaoning Province Steel Industry-University-Research Innovation Alliance Cooperation Project of Bensteel Group (No. KJBLM202202), and the Fundamental Research Funds for the Central Universities (No. N2201023).
Acknowledgments
Thanks to the Materials Studio software developed by Accelrys, Inc., USA, and the guidance and assistance provided by Chuangteng Science and Technology Company in the use of the software.
Conflicts of Interest
The authors declare that they have no conflict of interest
References
- Chen, J; Xing, Y; Wang, Y; Zhang, W; Guo, Z; Su, W. Application of iron and steel slags in mitigating greenhouse gas emissions: A review. Science of The Total Environment 2022, 844, 157041. [CrossRef] [PubMed]
- Ali, N. S. Y; See, K. F. Revisiting an environmental efficiency analysis of global airlines: A parametric enhanced hyperbolic distance function. Journal of Cleaner Production 2023, 394, 135982. [Google Scholar]
- Wang, J. Y; Wang, Q; Sun, W. Q. Quantifying flexibility provisions of the ladle furnace refining process as cuttable loads in the iron and steel industry. Applied Energy 2023, 342, 121178. [Google Scholar] [CrossRef]
- Guo, J; Bao, Y; Wang, M. Steel slag in China: treatment, recycling, and management. Waste Manag 2018, 78, 318–330. [CrossRef] [PubMed]
- Zhao, Q; Liu, C; Mei, X. H; Saxén, H; Zevenhoven, R. Research progress of steel slag-based carbon sequestration. Fundamental Research 2022.
- Ostovari, H; Sternberg, A; Bardow, A. Rock ‘n’ use of CO2: carbon footprint of carbon capture and utilization by mineralization. Sustainable Energy & Fuels 2020.
- Zhao, Q; Liu, K; Sun, L. F; Liu, C. J; Jiang, M. F; Saxén, H; Zevenhoven, R. Towards carbon sequestration using stainless steel slag via phase modification and coextraction of calcium and magnesium. Process Saf Environ Prot 2020, 133, 73–81. [CrossRef]
- Zhang, Y. Y; Yu, L. H; Cui, K. K; Wang, H; Fu, T. Carbon capture and storage technology by steel-making slags: Recent progress and future challenges. Chemical Engineering Journal 2023, 455, 140552. [CrossRef]
- Teir, S. Fixation of carbon dioxide by producing carbonates from minerals and steelmaking slags. Helsinki University of Technology 2008. [Google Scholar]
- Eloneva, S. Reductiom of CO2 emissions by mineral carbonation: steelmaking slags as raw material with a pure calcium carbonate end product. Aalto University 2010. [Google Scholar]
- Bobicki, E; Liu, Q; Xu, Z; Zeng, H. Carbon capture and storage using alkaline industrial wastes. Progress in Energy and Combustion Science 2012, 38, 302–320. [CrossRef]
- Lee, S. W; Kim, J. W; Chao, S; Bang, J; Lee, S. W. CO2 sequestration technology through mineral carbonation: An extraction and carbonation of blast slag. Journal of CO2 Utilization 2016, 16, 336–345. [CrossRef]
- Mei, X. H; Zhao, Q; Min, Y; Liu, C. J; Saxén, H; Zevenhoven, R. Phase transition and dissolution behavior of Ca/Mg-bearing silicates of steel slag in acidic solutions for integration with carbon sequestration. Process Safety Environ Protect 2022, 159, 221–231. [CrossRef]
- Mei, X. H; Zhao, Q; Li, Y; Liu, C. J; Saxén, H; Zevenhoven, R. Phase transition and morphology evolution of precipitated calcium carbonate (PCC) in the CO2 mineralization process. Fuel 2022, 328, 125259. [CrossRef]
- Zappa, W. Pilot-scale experimental work on the production of precipitated calcium carbonate (PCC) from steel slag for CO2 fixation. Aalto University 2014. [Google Scholar]
- Kravchenko, E; Qin, C. H; Lin, Z. Z; Ng, C. Effect of polyvinyl alcohol on the CO2 uptake of carbonated steel slag. Construction and Building Materials 2023, 375, 130761. [CrossRef]
- Doucet, F. Effective CO2-specific sequestration capacity of steel slags and variability in their leaching behaviour in view of industrial mineral carbonation. Minerals Engineering 2010, 23(3), 262–269. [Google Scholar] [CrossRef]
- Wei, C; Dong, J. P; Hu, Z. H; Zhang, H; Wang, X; Tong, Z; Liao, C. CO2 sequestration exploration utilizing converter slag and cold-rolling waste water: The effect of carbonation parameters. In Process Safety and Environmental Protection; 2021; Volume 148, pp. 1233–1242.
- Sundermann, C. Production of calcium carbonate from steelmaking slag and captured CO2 optimisation of the carbonation process and product quality. Aalto University, Finland and Royal Institute of Technology 2016. [Google Scholar]
- Chang, R; Choi, D; Kim, M. H; Park, Y. Tuning crystal polymorphisms and structural investigation of precipitated calcium carbonates for CO2 mineralization. ACS Sustainable Chem 2017, 5, 1659–1667. [CrossRef]
- Clifford, Y; Chen, F. Polymorphism of CaCO3, precipitated in a constant-composition environment. AIChE. 1998, 44, 1790–1798. [CrossRef]
- Chang, R; Kim, S; Lee, S; Choi, S; Kim, M; Park, Y. Calcium carbonate precipitation for CO2 storage and utilization: A review of the carbonate crystallization and polymorphism. Energy Res 2017, 5, 17.
- Yang, P; Zeng, Q. H; Dong, K. J; Zhu, H. A quick method for developing interparticle force models of spherical gold nanoparticles from molecular dynamics simulation. Powder Technology 2020, 362, 501–506. [CrossRef]
- Gadikota, G; Matter, J; Kelemen, P; Brady, P; Park, A. Elucidating the differences in the carbon mineralization behaviors of calcium and magnesium bearing alumino-silicates and magnesium silicates for CO2 storage. Fuel 2020, 277, 117900. [CrossRef]
- Ma, Y; Sheng, J. J; Li, T. Y; Yang, C; Xiao, Q; Yang, R. Study on the optimal conditions of ultrasonic strengthening phosphogypsum storage and solidification of CO2. Sustainable Chemistry and Pharmacy 2023, 33, 101091. [CrossRef]
- Relmasira, K. J; Leonov, A. Y; Malenko, P. I. Application of molecular dynamics method for simulation of the process of increasing the diffusion mobility of atoms using vacancy diffusion mechanism. Procedia Engineering 2017, 206, 636–641. [Google Scholar] [CrossRef]
- Jing, X. W; Luo, Q; Cui, X. F; Wang, Q; Liu, Y; Fu, Z. Molecular dynamics simulation of CO2 hydrate growth in salt water. Journal of Molecular Liquids 2022, 366, 120237. [Google Scholar] [CrossRef]
- Zhang, W; Zhou, L; Yang, B; Yan, T. Molecular dynamics simulations of LiCl ion pairs in high temperature aqueous solutions by deep learning potential. Journal of Molecular Liquids 2022, 367, 120500. [CrossRef]
- Li, C. G; Zhang, C. P; Guo, X. Sintering mechanism of CaO during carbonation reaction in the presence of water vapor. Proceedings of the Combustion Institute 2022. [Google Scholar] [CrossRef]
- Yadav, S; Mehra, A. Experimental study of dissolution of minerals and CO2 sequestration in steel slag. Waste Management 2017, 64, 348–357. [CrossRef]
- Sun, Y; Yao, M. S; Zhang, J. P; Yang, G. Indirect CO2 mineral sequestration by steelmaking slag with NH4Cl as leaching solution. Chemical Engineering Journal 2011, 173(2), 437–445. [CrossRef]
- You, D; Wang, H; Sun, W. Understanding the effect of temperature, concentration, and substrate material on CaCO3 scaling: Molecular dynamics simulations and density functional theory. Computational Materials Science 2022, 209, 111352. [CrossRef]
- Nielsen, P; Boone, M. A; Horckmans, L; Snellings, R; Quaghebeur, M. Accelerated carbonation of steel slag monoliths at low CO2 pressure – microstructure and strength development. Journal of CO2 Utilization 2020, 36, 124–134. [CrossRef]
- Polettini, A; Pomi, R; Stramazzo, A. CO2 sequestration through aqueous accelerated carbonation of BOF slag: A factorial study of parameters effects. Journal of Environmental Management 2016, 167, 185–195. [CrossRef] [PubMed]
- Zhang, S. P; Ghouleh, Z; Liu, J. Y; Shao, Y. Converting ladle slag into high-strength cementing material by flue gas carbonation at different temperatures. Resources. Conservation and Recycling 2021, 174, 105819. [CrossRef]
- Hu, Q. C; Zhao, H. W; Li, H. X; Dong, Y; Liu, Z. Understanding the Raman spectroscopic quantification and dissolving behaviors of CO2 for the CO2–H2O system from water structure. Chemical Physics Letters 2019, 717, 47–52. [CrossRef]
- Pan, S. Y; Adhikari, R; Chen, Y. H; Li, P; Chiang, P. Integrated and innovative steel slag utilization for iron reclamation, green material production and CO2 fixation via accelerated carbonation. Journal of Cleaner Production 2016, 137, 617–631. [CrossRef]
- Li, J. L; Zhang, H. N; Xu, A. J; Cui, J; He, D; Tian, N. Theoretical and Experimental on Carbon Dioxide Sequestration Degree of Steel Slag. Journal of Iron and Steel Research, International 2012, 19(12), 29–32. [CrossRef]
- Mohamed, A. M. O; Gamal, M. M. E; Hameedi, S. M; Paleologos, E. Chapter 9 - Carbonation of steel slag. Sustainable Utilization of Carbon Dioxide in Waste Management 2023, 327–372. [Google Scholar]
- Huijgen, W. J. J; Witkamp, G. J; Comans, R. N. J. Mineral CO2 Sequestration by Steel Slag Carbonation. Environ Sci Technol 2005, 39(24), 9676–9682. [Google Scholar] [CrossRef]
Disclaimer/Publisher’s Note: The statements, opinions and data contained in all publications are solely those of the individual author(s) and contributor(s) and not of MDPI and/or the editor(s). MDPI and/or the editor(s) disclaim responsibility for any injury to people or property resulting from any ideas, methods, instructions or products referred to in the content. |
© 2023 by the authors. Licensee MDPI, Basel, Switzerland. This article is an open access article distributed under the terms and conditions of the Creative Commons Attribution (CC BY) license (http://creativecommons.org/licenses/by/4.0/).
Copyright: This open access article is published under a Creative Commons CC BY 4.0 license, which permit the free download, distribution, and reuse, provided that the author and preprint are cited in any reuse.


