Preprint
Review

Analytical Methods for the Identification and Quantitative Determination of Wool and Fine Animal Fibers: A Review

Altmetrics

Downloads

289

Views

149

Comments

0

A peer-reviewed article of this preprint also exists.

Submitted:

06 May 2023

Posted:

08 May 2023

You are already at the latest version

Alerts
Abstract
The identification and quantitative determination of wool and fine animal fibers are of great interest in the textile field because of significant price differences between them and common adulterations in raw and processed textiles. Since animal fibers have remarkable similarities in their chemical and physical characteristics, specific identification methods have been studied and proposed following advances in analytical technologies. The identification methods of wool and fine animal fibers are reviewed in this paper and the results of relevant studies are listed and summarized, starting from classical microscopy methods which are still used today not only in Small to Medium Enterprises but also in large industries, research studies and quality control laboratories. Particular attention has been paid to image analysis, Nir spectroscopy and proteomics which constitute the most promising technologies of quality control in the manufacturing and trading of luxury textiles and can find application in forensic science and archeology.
Keywords: 
Subject: Chemistry and Materials Science  -   Paper, Wood and Textiles

Introduction

Fine animal fibers, also known as speciality or luxury fibers or hair, derive from animal species other than sheep and have been selected according to their characteristics and performances and their possibility of being spun with traditional systems. These fibers are generally employed to obtain valuable and luxury textile items due to their characteristics of finesses, softness, gloss, luster, color and even rarity. The limited production quantities and sometimes the difficulties of supply make their price relatively high compared to wool [1]. The relatively non-damaging production of animal fibers in comparison with synthetic fibers and their biodegradability instead of microplastics pollution production, make them to replace a part of synthetic fibers, even if in small amounts in terms of quantity. Moreover, the production and commercialization of some animal fibers like cashmere, alpaca, camel and cashgora have a great impact on rural economy, to prevent migration of to cities e to protect mountain areas in remote pastoral regions [2].
Labeling textiles to indicate their composition requires analytical control methods, not only for the final product but also for the raw materials and the material during all stages of processing. Besides the legal aspects of labeling, the price difference of the components for various common fiber blends is a major motivation for developing exact analytical procedures. Other fields of interest are forensic science, archeology and other investigative sectors [3,4,5,6].
Following Annex I (list of the textile fibres names) of EU Regulation No 1007/2011 of 27 September 2011 and the consolidated version of 15/02/2018, fine animal hair is classified in the number 2 category as alpaca, llama, camel, cashmere, mohair, angora, vicuña, yak, guanaco, cashgora, beaver, otter, followed or not by the word 'wool' or 'hair'. On this list, it must be added to identify some species which have to be killed to obtain their fine hair, such as shatoosh, that was classified as a grade I animal under state protection and was listed as an endangered species and whose hair commercialization is forbidden [7].
Wool is the fiber from sheep's or lambs' fleeces (Ovis aries). The most used wool in the textile field is produced by the Merinos breed from Australia, selected for the production of fine, high quality and quantity wool (about 4-5 kg of raw wool per year per sheep) [8] Fine animal hair comes from goats (Cashmere goat- Capra hircus laniger, Mohair or Angora Goat – Capra hircus aegagrus and Cashgora produced by cross-breeding Angora goats with feral Australian or New Zealand goats), camels (Camel – Camelus bactrianus and South American Camelids, Lama- Lama glama, Alpaca –Vicugna pacos, Vicuña – Vicugna vicugna, Guanaco – Lama guanicoe), bovines (yak- Bos grunniens), and rabbit (Angora rabbit- Oryctolagus cuniculus) (see Figure 1).
The main animal breeding countries and principal characteristics of fine animal fibers are shown in Table 1. The fibers can originate from the whole fleeces or, in general, the finest ones, from the smooth and soft undercoat of animals breed at high altitudes, while the long and coarse hair from the upper coat had to be removed with a process named dehairing [9]. Colors are due to the presence of melanin pigments, divided into eumelanin, responsible for brown and black colors, and pheomelanins for yellow and reddish colors [10].
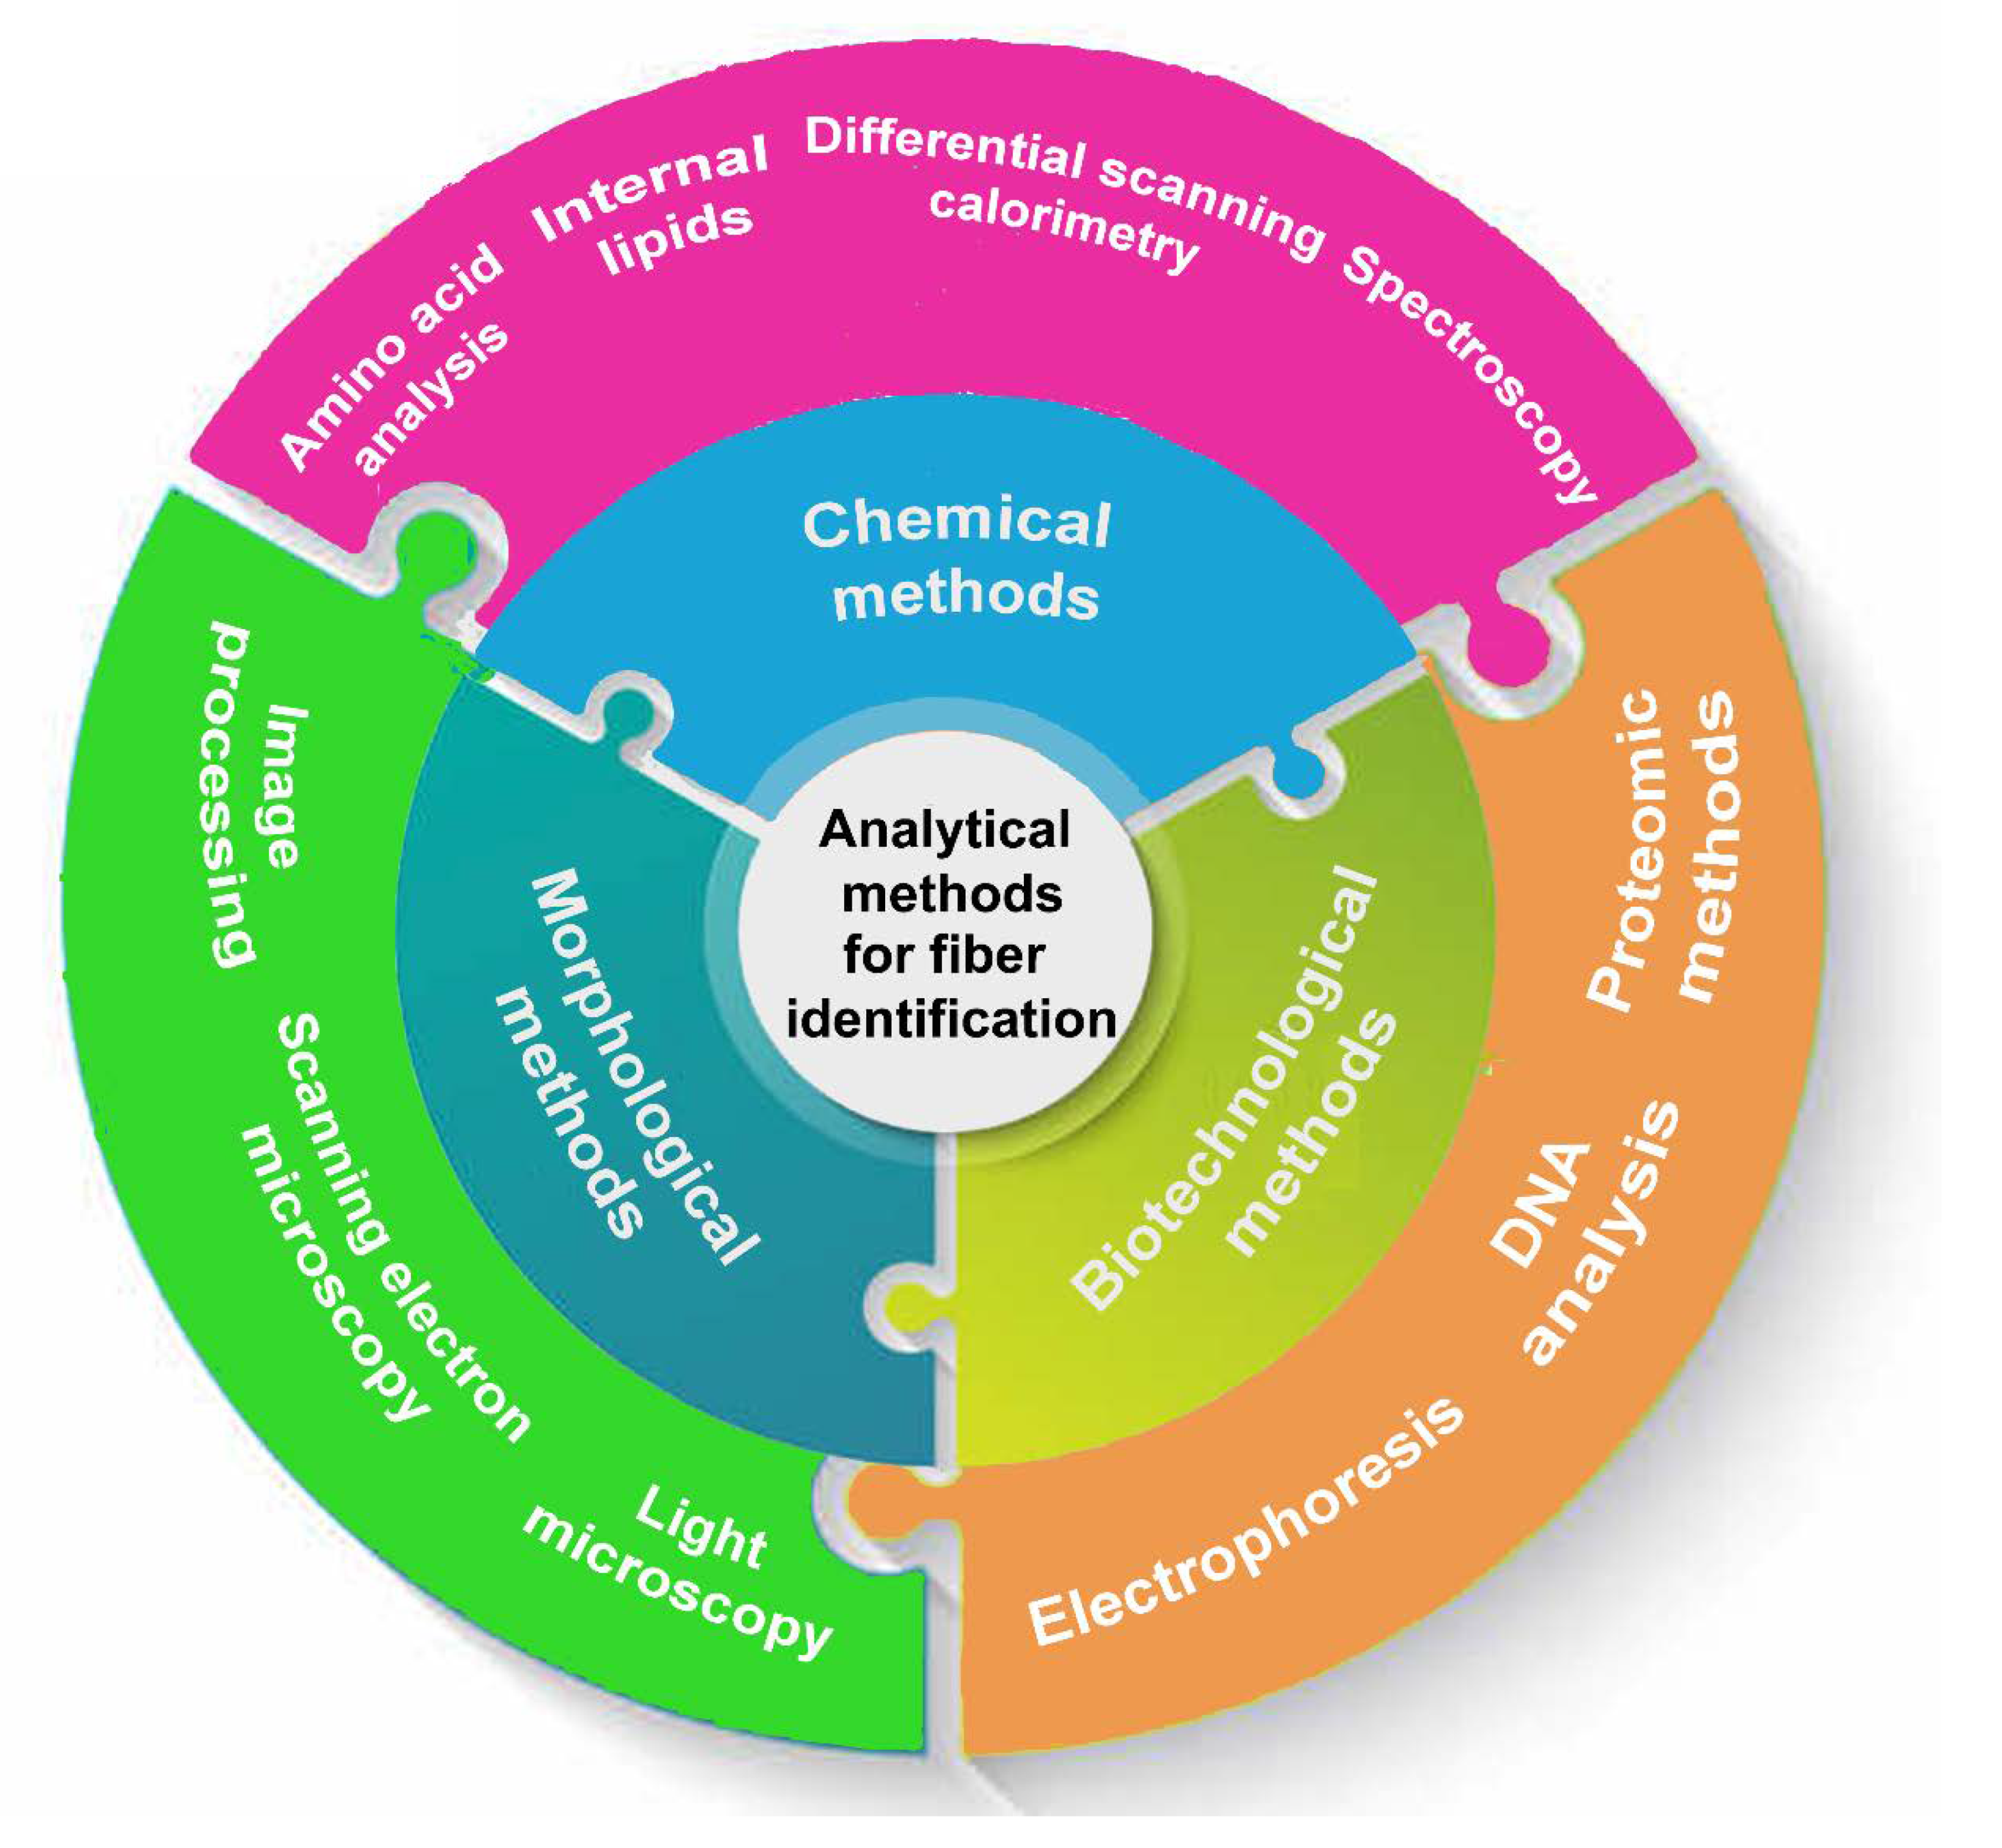
Wool and fine animal fibers have similar chemical, physical and histological characteristics, which is why their mixtures cannot be mechanically or chemically separated through solubility in selective solvents. They are made up of a protein named keratin, characterized by a high sulfur amount and by the presence of strong disulfide bonds that make keratins water-insoluble and resistant to different chemical agents. From the morphological point of view, wool and animal fibers are made up of three major components: the cuticle, the cortex and the cell membrane complex. The cuticle, which is cystine-rich and highly cross-linked, consists of a micro-sized layer of flat overlapping ‘‘cuticle cells’’ surrounding the cortex. The cortex is made up of elongated ‘‘cortical cells’’ oriented parallel to the fiber axis and contains micro-fibrils of low-sulfur, alpha-helix crystalline proteins embedded within an amorphous matrix of high-sulfur and glycine/tyrosine-rich proteins. The cell membrane complex, sometimes referred to as intercellular cement, performs the function of cementing cortical and cuticle cells together. In the fibers with larger diameters, or in some fine animal fibers (e.g. angora rabbit), an inner channel named medulla both continuous or interrupted or fragmental can be present [19]. In this review, the results of relevant research from morphological, chemical and biotechnological methods of wool and animal fibers identification and quantification are shown and discussed (Figure 2).
Each group of methods moved from general or subjective analysis to modern techniques following technological innovations and targeted approaches as technology and animal fiber studies have been progressed. Regarding the morphological analysis of the fibers, many studies are now focusing on image analysis to try to overcome the problems related to subjective and time consuming classic techniques of recognition of the fibers using optical or electron microscopy performed by expert operators. As far as chemical techniques are concerned, analysis moved from the more dated techniques related to the chemical components of the fibers, i.e. amino acids and internal lipids, to much faster spectroscopic analyses which take advantage of modern chemometric techniques of spectra evaluation. Finally, biotechnological techniques have passed from simple one- or two-dimensional electrophoresis to DNA analysis and finally to proteomics as animal fibers are mainly made up of proteins characterized by persistence, abundance and derivation from DNA. Among the different fibers, the majority of examined papers concern the distinction between wool and cashmere, being cashmere the most produced and marketed animal fibers in the world. Global Cashmere Clothing Market was valued at USD 3015.98 million in 2021 and is expected to reach USD 4105.41 million by 2029, registering a CAGR of 3.93% in 2022-2029 [20].

Morphological methods to identify wool and fine animal fibers

The identification of fine animal fibers is an essential task in many activities ranging from research studies and quality control laboratories to large industries and Small to Medium Enterprises (SMEs). Classical and extensively used methods for the identification of wool and fine animal fibers are morphological methods using Light (LM) and Scanning Electron Microscopies (SEM). Although new instrumental identification techniques originated with the technical advancements are now available, these traditional methods are prevalent in small industries as they are the most affordable alternative.

Light and Scanning Electron Microscopy

LM and SEM are the old and classical methods to identify wool and fine animal fibers. Using LM, fiber snippets of fixed length are cut and dispersed in a mounting medium having an appropriate refractive index, e.g. glycerine. Morphological characteristics that allow distinguishing wool and different fine animal fibers using LM are based on cuticular cell morphology, pigment distribution and fiber medulla as described in great detail by Wildman [12] and specified in the ISO 17751-1:2016 standard [21] providing in deepth information about the sampling and statistics to be used. The simplicity of sample preparation and the ability to see both surface and internal fiber morphology, including medulla and pigment distribution, are benefits of LM as a method for animal fibers identification. The limitations are due to the poor resolution of the instrumentation and the interference with dark dyes and pigments.
Using SEM analysis, fibers are cut in snippets of determined length, made to adhere to specimen stub and coated to a thin layer of gold prior to SEM observation, following the ISO 17751-2:2016 standard [22]
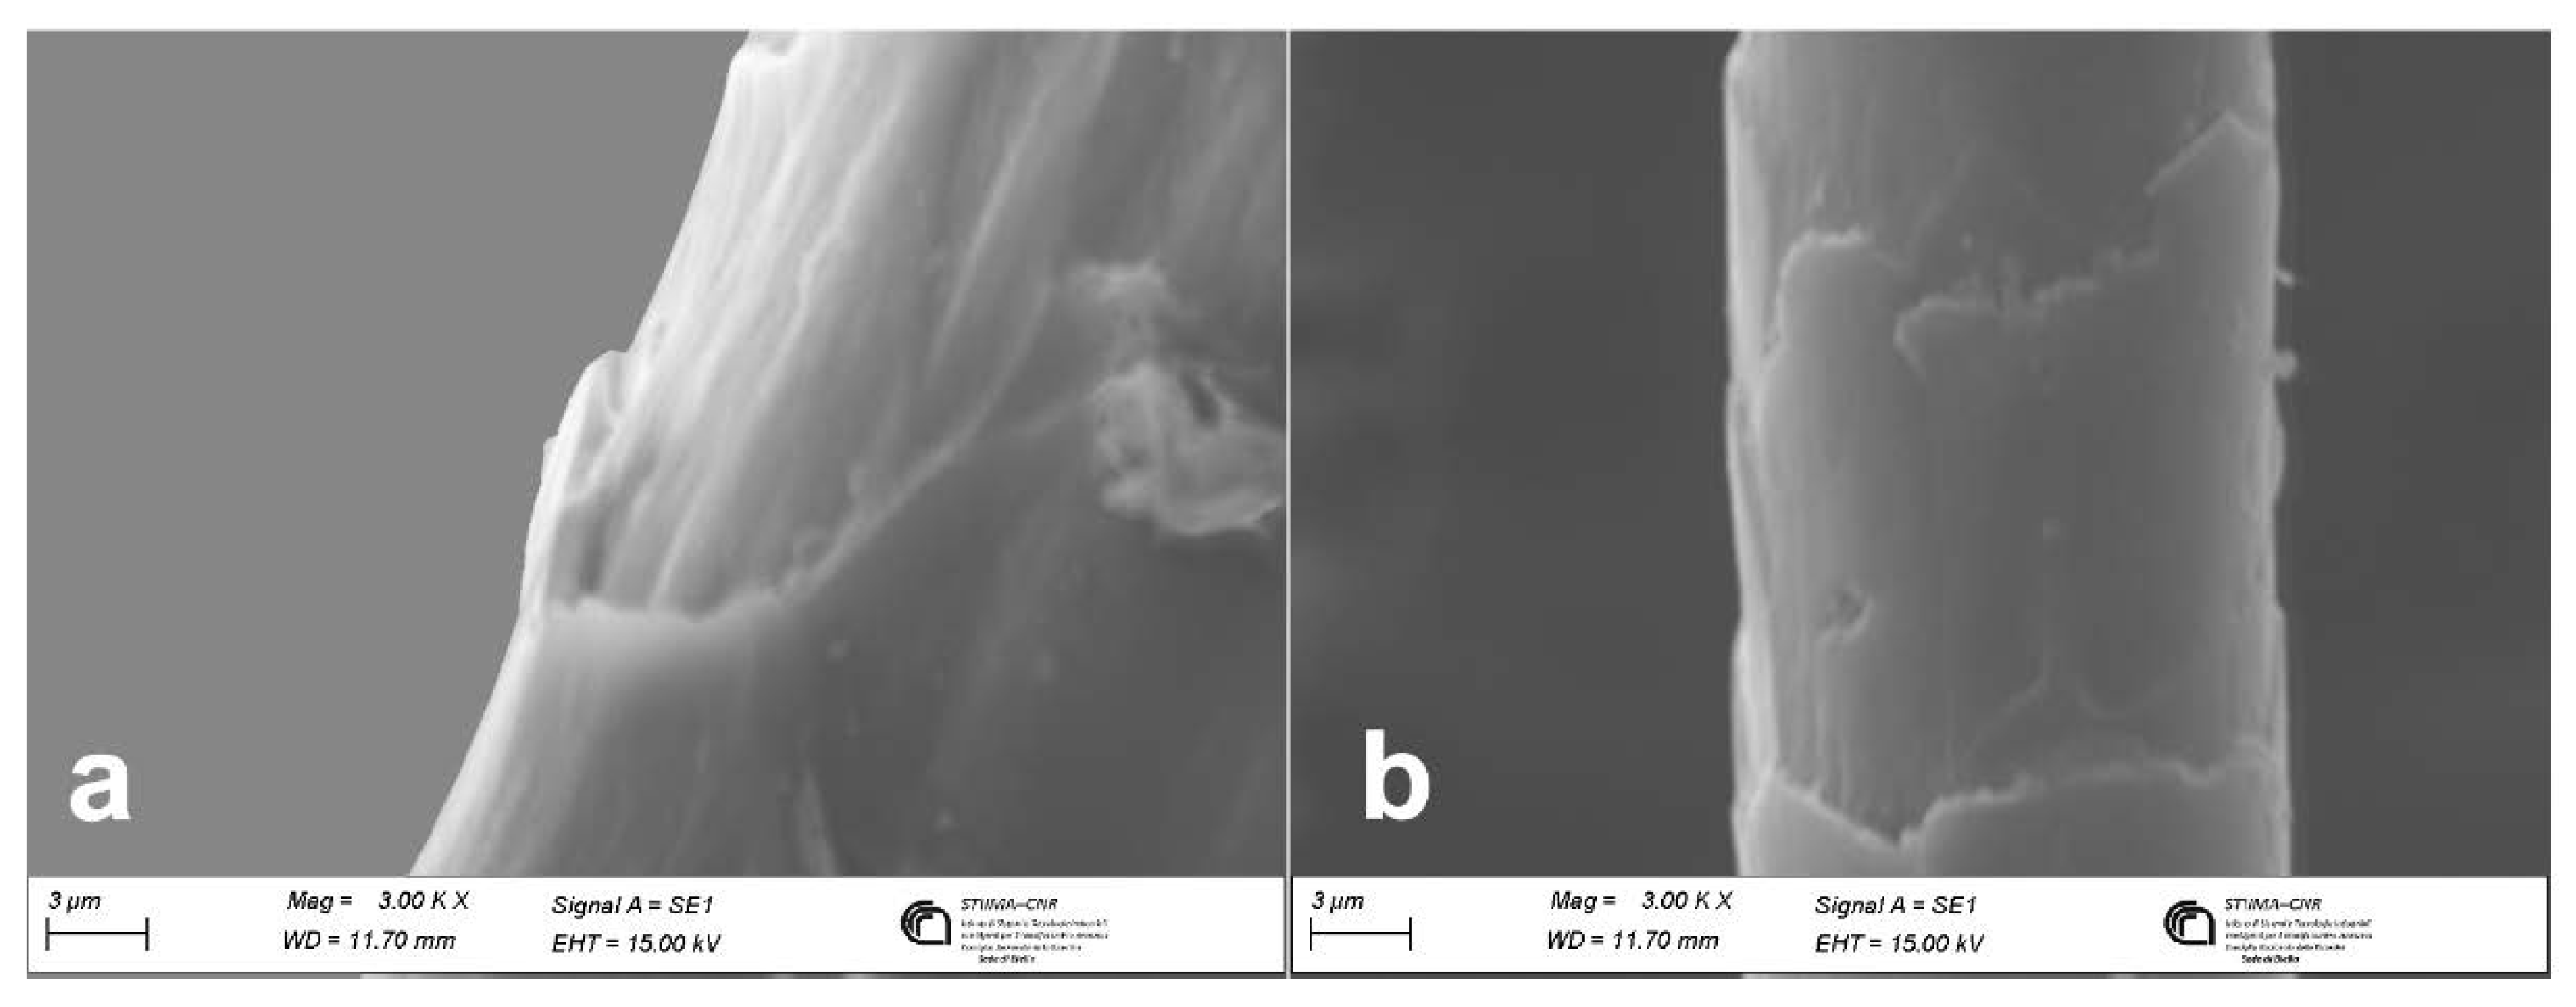
Compared to LM, the advantages of SEM are related to high magnification and resolution, which allow measuring the thickness of cuticular cells, greater than 0.6 µm for wool and less than 0.5 µm for fine animal fibers (Figure 3).
The main disadvantage consists of the possibility of examining only the surface characteristics of the fibers without investigating the medulla and pigment distribution [23].
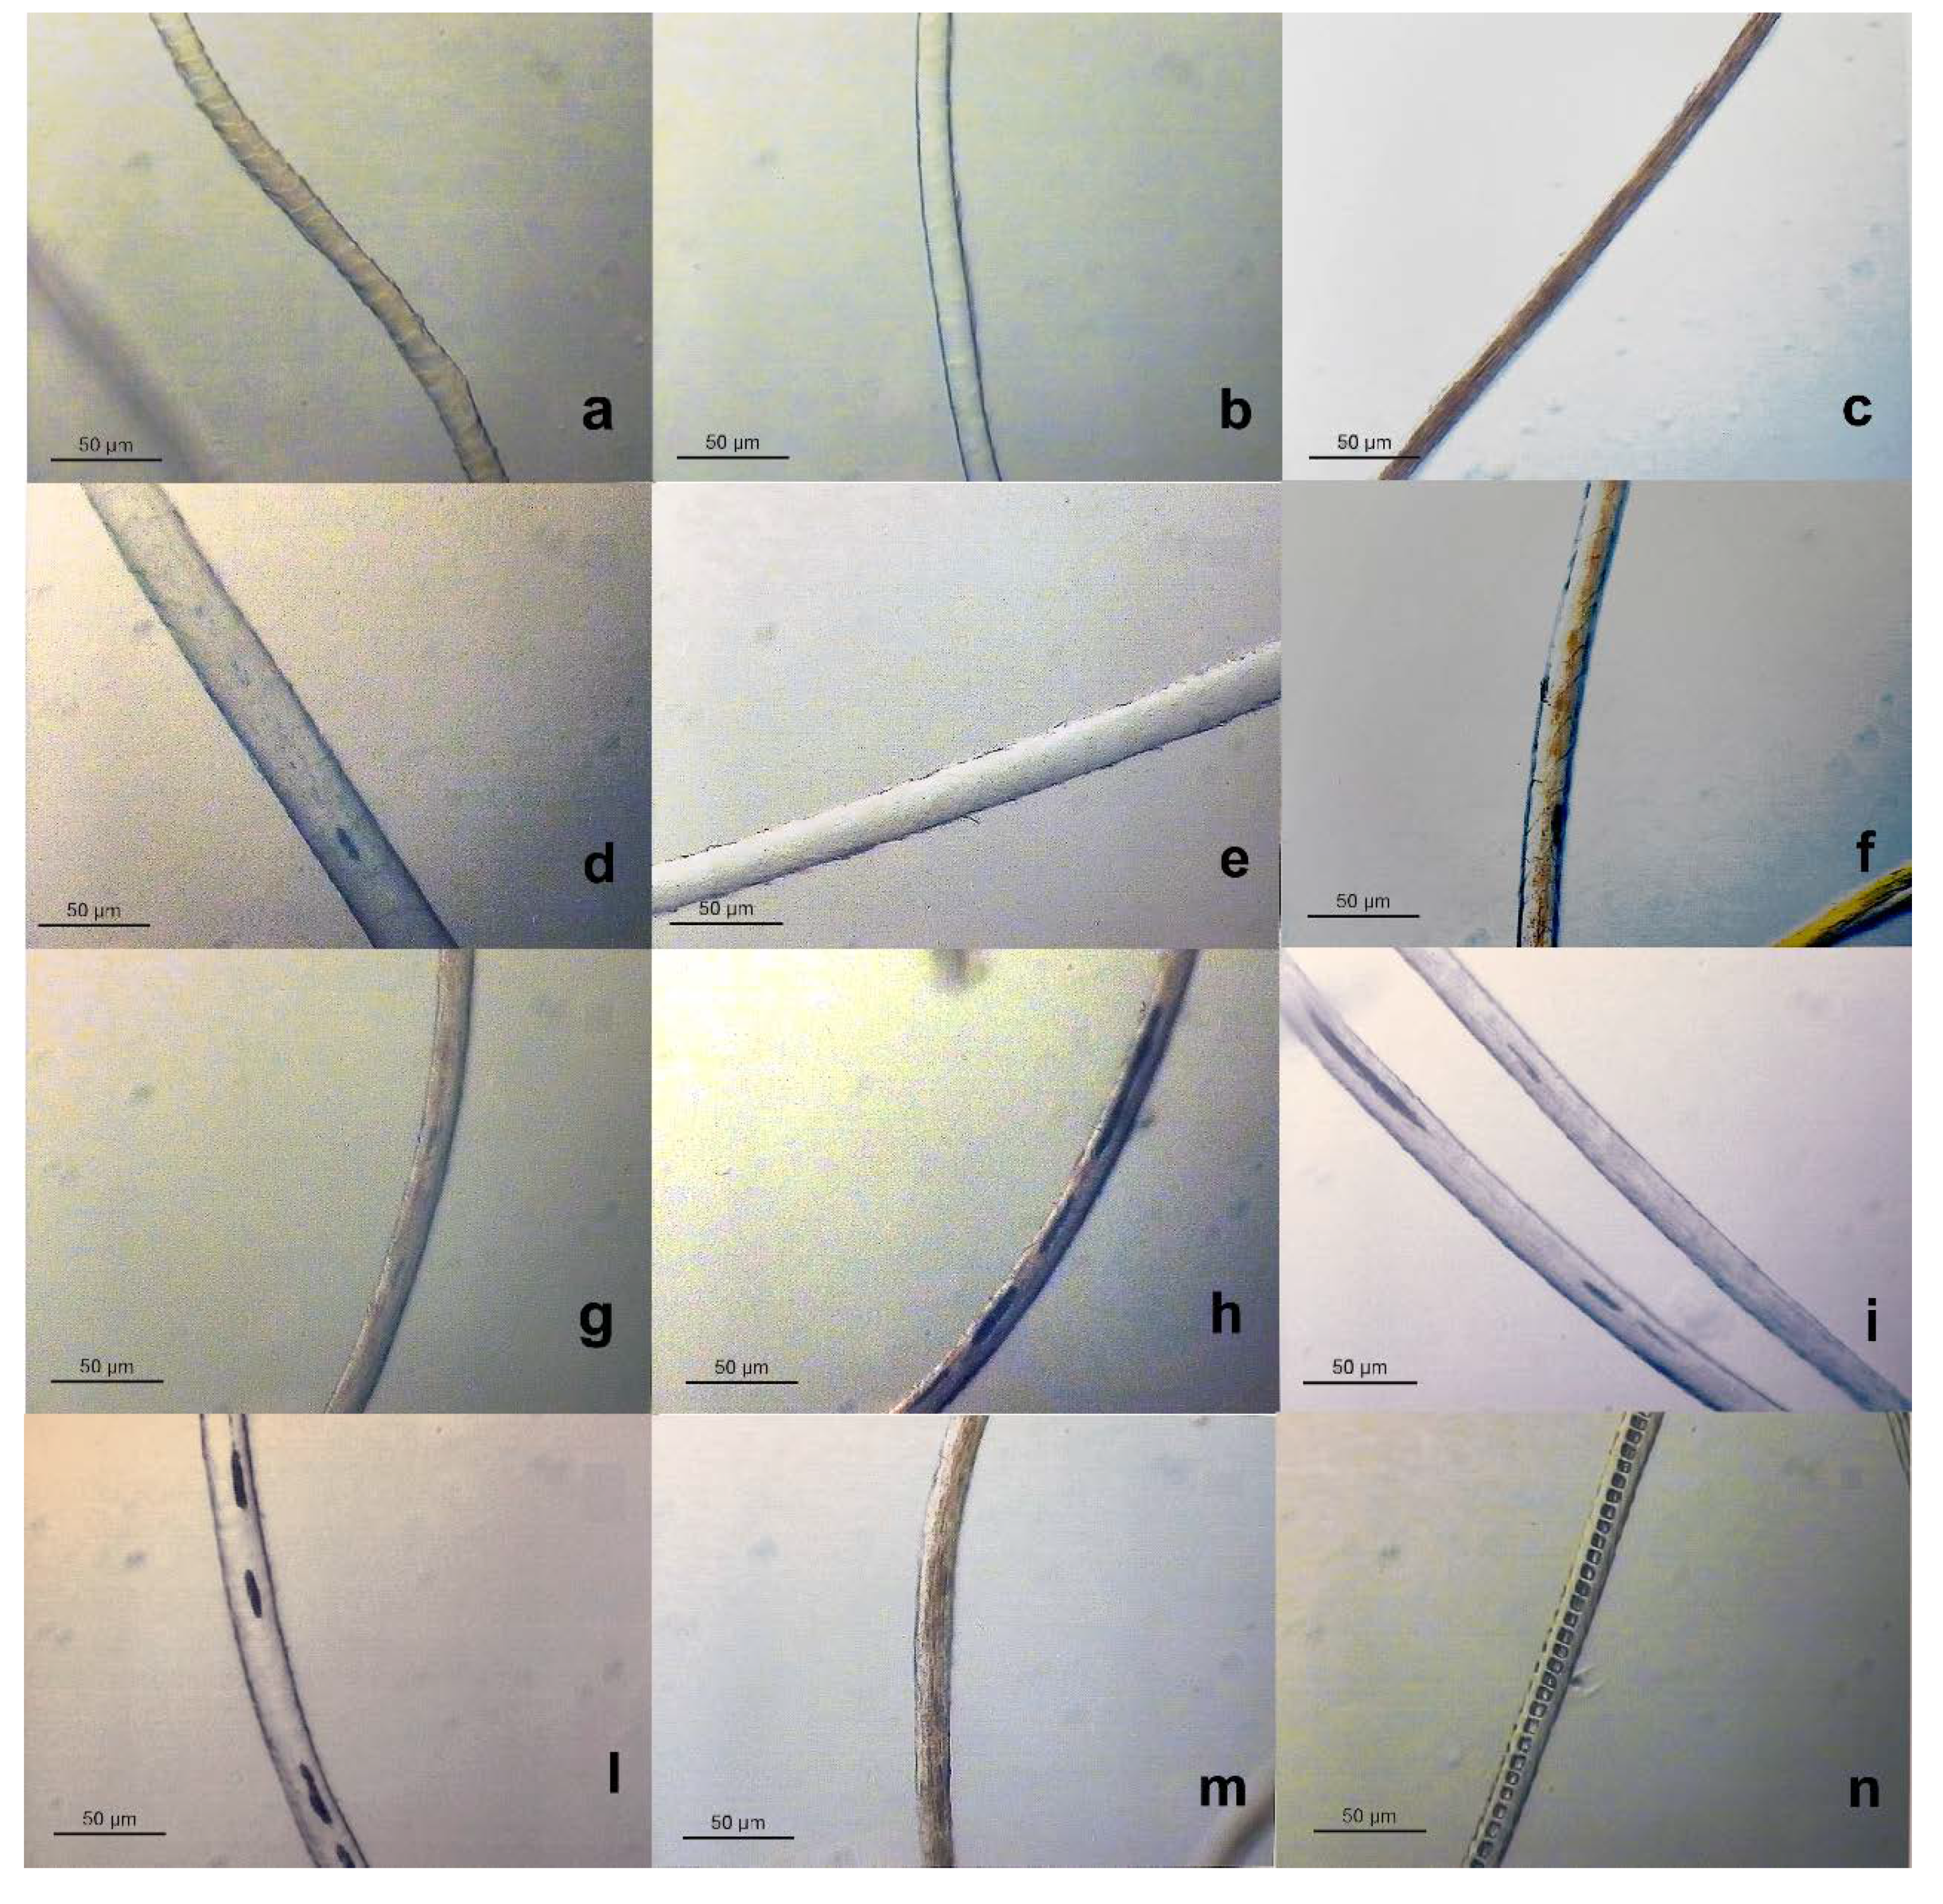
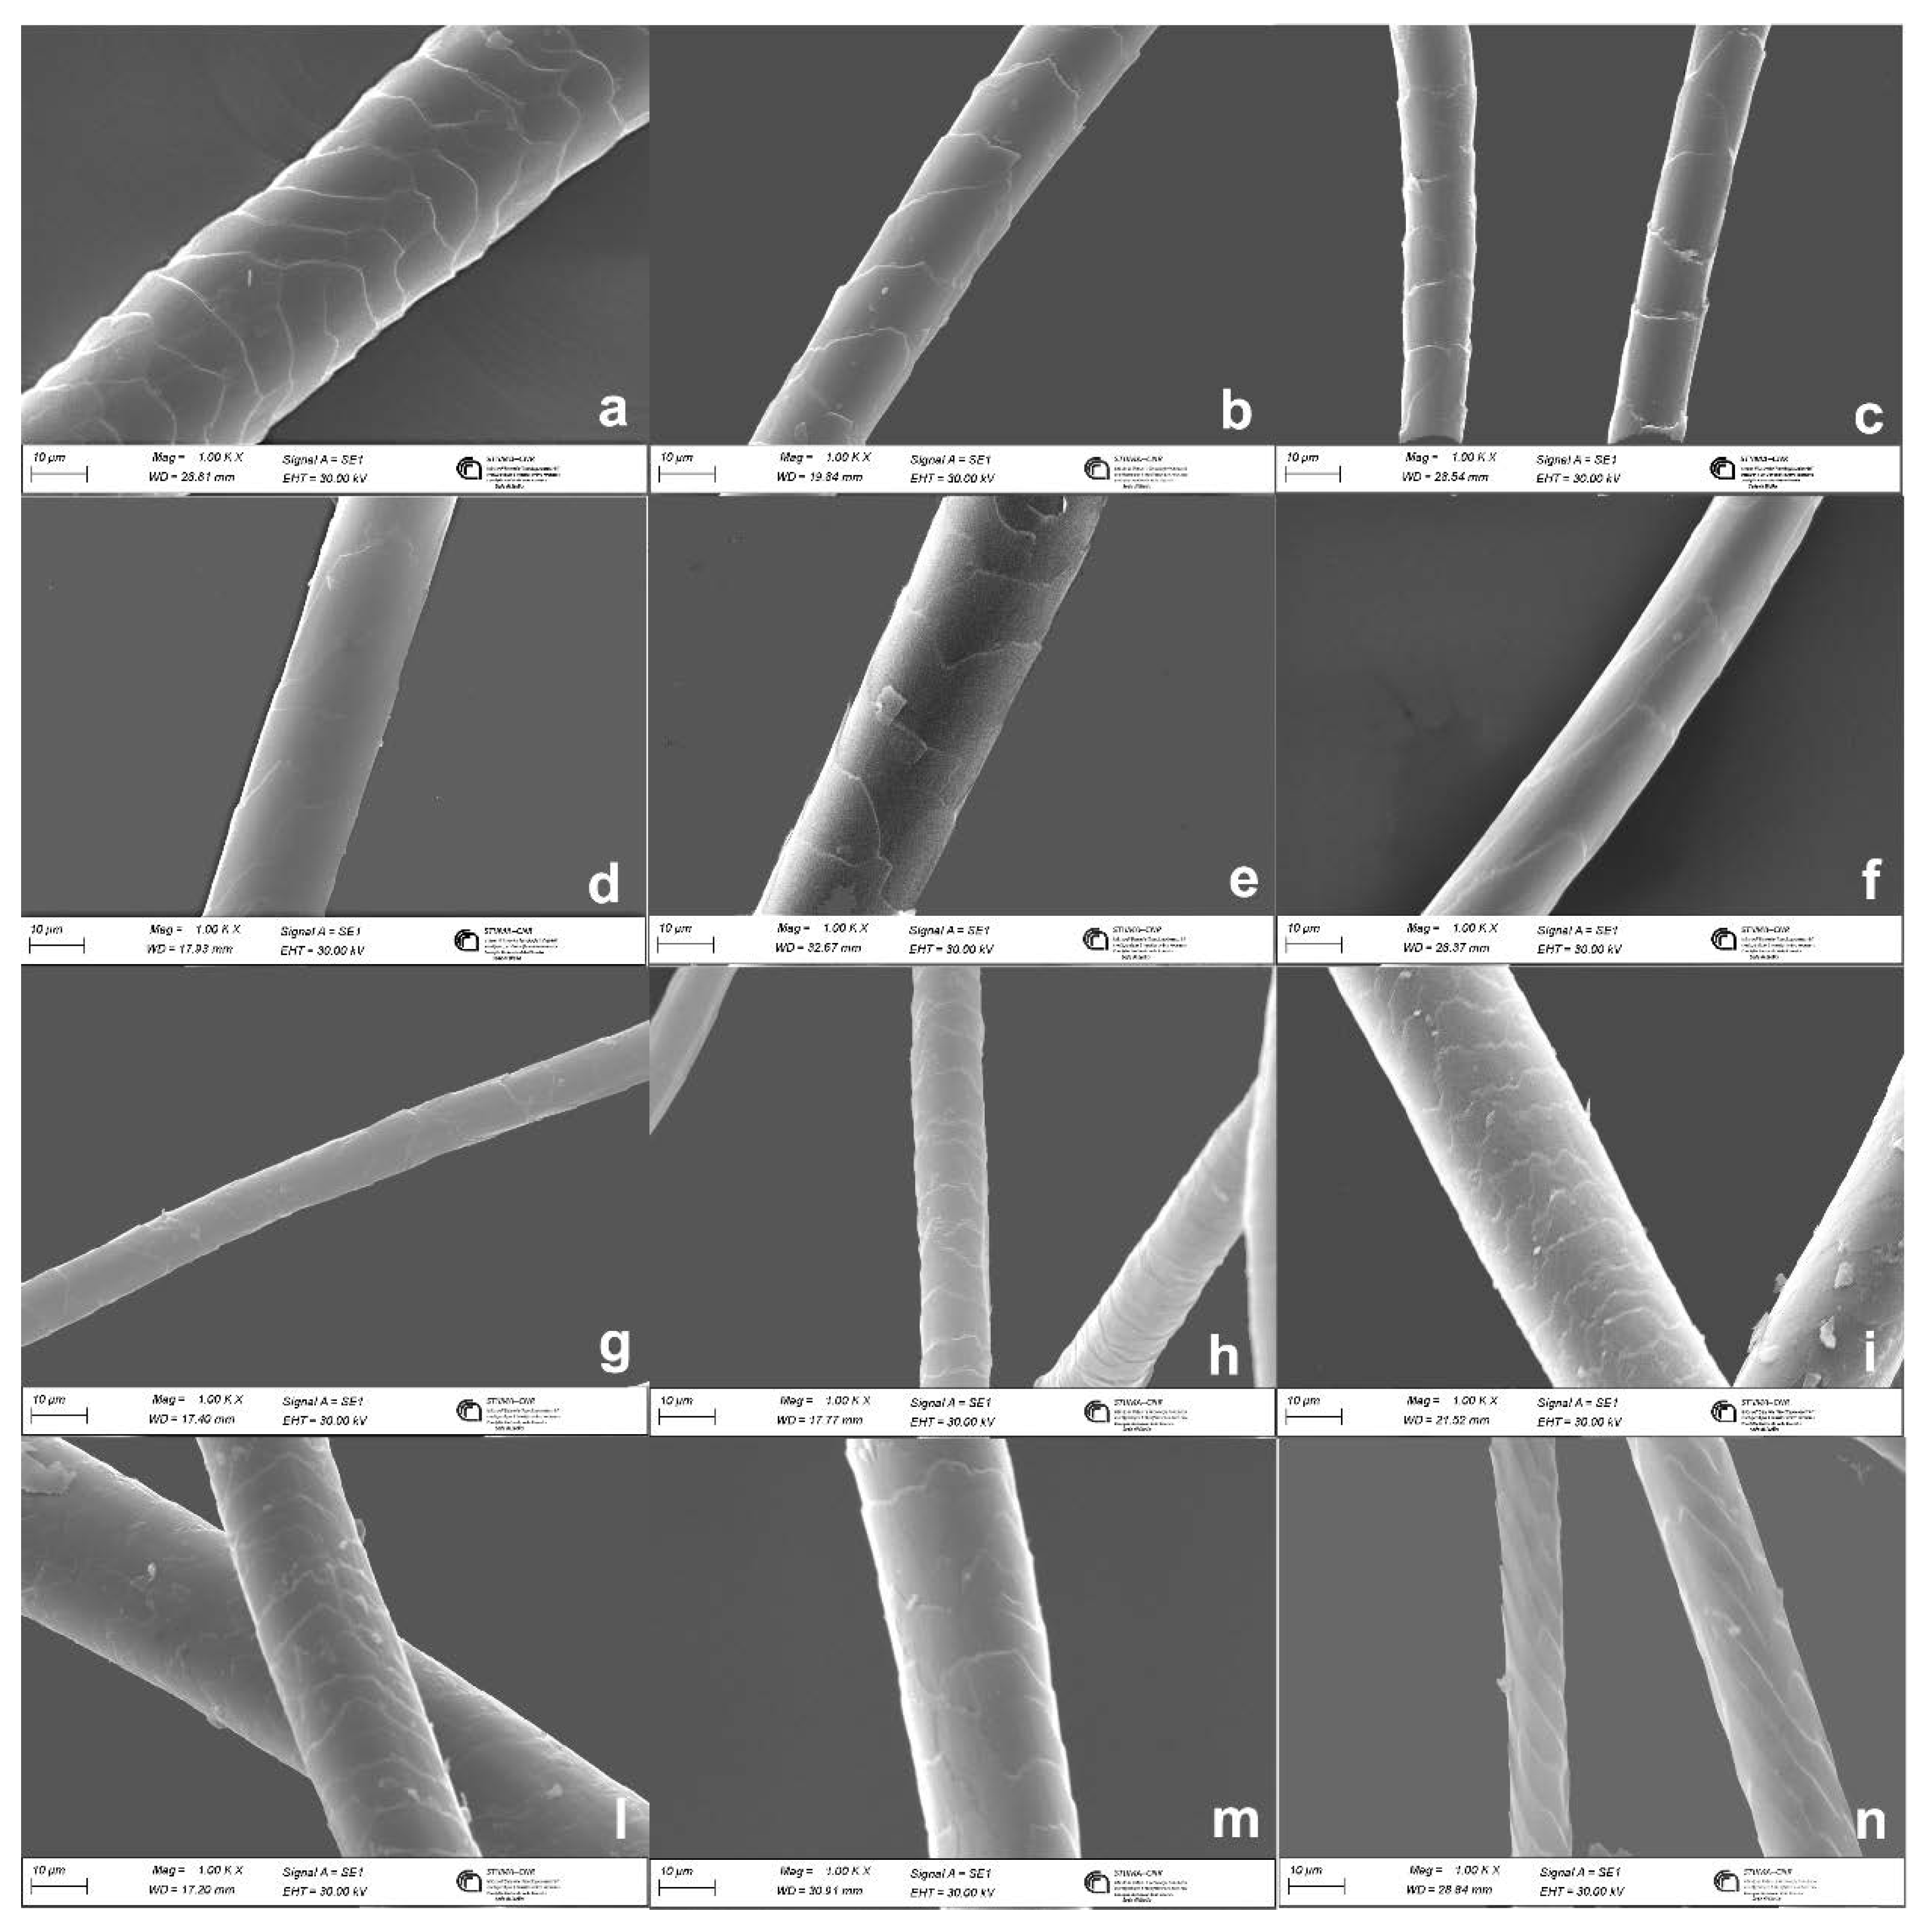
Figure 4 and Figure 5 show the images of wool and fine animal fibers obtained by LM and SEM, respectively and principal morphological characteristics useful for wool and fine animal fibers identification are summarized in Table 2.
The identification methods based on LM or SEM were often criticized because they lack objectivity and require operators with a high degree of skill and experience, mainly for LM [29]. An additional problem arises from superficial treatments hiding the fiber's surface (e.g., antifelting treatments) [30].
Despite in the recent literature, there are few publications concerning the identification of animal fibers with microscopy, LM and SEM are still primarily employed in many laboratories, not only for quality control in SMEs. Moreover, LM and SEM are the classic identification methods to quantify animal fibers and compare obtained amounts with quantities obtained with new analytical methods, where the exact amounts of fibers in samples like yarns or fabrics is not available [31,32].
Different morphological approaches for fiber identification were tried to overcome the lack of objectivity of LM and SEM methods. McGregor et al. measured the cuticular and cortical cell dimensions of different fine animal fibers including cashmere, alpaca, vicuña and mohair, but this study have not led to any sure conclusions being these measurements not enough standardized and affected by fiber diameters and animal age and productivity [33]. Similarly, the investigation carried out by Tian et al. [34] on yak, cashmere and wool fibers led to the detection of differences in cuticular cell scale thickness and frequencies between these fibers, but a standardized application of measured parameters in fiber identification was not obtained.
On the contrary, many studies using image analysis are getting excellent results.

Image processing

In recent years image processing has been developing rapidly. Many researchers use related algorithms to analyze the texture or morphological features for better recognition of wool and fine animal fibers (mainly cashmere). The improvement is not only related to the accuracy of fiber identification, avoiding subjective identification, but it is also realized the automation and batch of fiber identification, which greatly improves the work efficiency. Many studies have been carried out on image processing for animal fibers identification and a lot of them in the last few years as shown in Table 3.
Proposed methods either follow a Deep Learning [40,48,58] or more frequently a Machine Learning approach, in which features are extracted from images and then used to train a supervised classification algorithm. In litterature both features extracted from scale patterns [47,69,70,71,73] and height [72] and texture features [56,60] have been employed with success. For the classification, different algorithms such as linear discriminant analysis [73], Multi-Layer Perceptron [70,74], Support Vercor Machine [49,53,57,59]have been employed.
From Table 3, it can be seen that most of the studies focus on the distinction between wool and cashmere, sharing these fibers the majority of the market [75] and only few papers deals with the distinction between other fibers like wool and mohair [48,70,71]in this case an optimal discrimination was obtained.
Imaging type are in most cases obtained by LM as the easiest and cheapest way to obtain image from fibers. This partially contradicts many works demonstrating that manual identification of wool and cashmere is mainly carried out measuring the thickness of cuticular cells, that can be only determined by means of SEM [26]. However, in most cases, good accuracies have been obtained, often exceeding 90% and even much higher up to 98% - 99% [36,40,42,48], the highest accuracies being obtained in more recent studies.
Undoubtedly image analysis is one of the most promising techniques for the identification of wool and fine animal fibers, but some problems are still open.
First at all, even if the fibers to be recognized for commercial purposes are 11 (10 fine animal fibers and wool), research typically focuses on binary classification with the exception of few works. Indeed, Xing et al. [40] proposed a novel fiber identification method based on deep learning and transfer learning for distinguishing among four kinds of fiber images including goat hair, yellow wool, sheep wool and cashmere. Rippel et al. [76] investigated the performance of natural fiber identification algorithms under the open set condition using SEM images from 4 animal fibers types (wool, cashmere, yak and silk) from 10 different sources by applying out-of-distribution - detection techniques. Moreover, in the reviewed literature, with few exceptions [68] images originate from raw fibers or combed slivers, so in general from unprocessed fibres, not from real samples on the market or fibers at different processing stages. As an example, problems for the identifications can arise from treatments that mask the surface morphology of the fibers such as widespread treatment to impart felt resistance which includes chlorination and a polymer adhesion [30]. Finally, some problems in fiber identification can occur from marketed recycled wool and cashmere textiles derived from post-factory and post-consumer waste, today produced in the frame of a green economy. Although it is not possible to use completely regenerated cashmere yarns due to poor mechanical characteristics, the presence of damaged fibers with the classic brush breaking can prevent their recognition [77]. In a similar way, problems in fiber identification can be found in archaeological textiles where the recognizable structural information of hair has not survived [78].

Chemical methods

Amino acids and internal lipids analysis
Wool and fine animal fibers consist mainly of protein and a small amount of internal lipids. The first chemical attempts to identify wool and fine animal fibers focused on their main composition, i.e., protein and their main components amino acids. Wool and fine animal fibers are made up of eighteen amino acids and characterized by the abundance of the amino acids cystine, which forms disufur intra and inter molecular chain bonds which confer to the protein named keratin a hight chemical resistance. Cystine can be oxidized by the cleavage of disulphur bond until the production of cysteic acid by the oxidizing effect of solar light on the fleece [79]. It was found that lama, vicuña, alpaca and guanaco have much higher cystine levels than yak, cashmere, cashgora and wool [80]. Moreover, the cysteic acid levels of lama, vicuña, yak and camel were higher than cashmere, cashgora and wool [81], but in this case care must be taken in the interpretation of results because samples of south American camelids are the results of more than one year of fiber growth and hence they are subjected to great photodegradation. Despite these differences, amino acid composition depends on animal species and environmental conditions, such as the changes in diet and textile processing conditions in yarns and fabrics, so amino acid composition can not be considered a strong enough discriminant between different animal fibers.
Internal lipids, one of the components of cell membrane complex in the fibers, were also investigated to discriminate between wool and different animal fibers. They consist mainly of ceramides, sterols, and free fatty acids for a total amount of about 1.5 % of fiber weight [82]. Some authors concluded that it is possible to use sterol analysis of fibers extracts and Gas Chromatography (GC) fatty acids analysis as an addition to conventional procedures to aid in fiber identification [83,84]. However, it was found that lipid analysis as a criterion for fine animal fiber discrimination should be confined to untreated samples because the textile process can affect the fibers' internal lipids fatty acids composition[85]. In any case, no fiber quantification was tried using internal lipid analysis.
Thermal analysis
Different attempts were made to identify fine animal fibers using modern analytical techniques such as Differential Scanning Calorimetry (DSC) which was studied as an alternative qualitative method to identify different textile animal hair fibers. DSC has well known applications to study the thermal properties of materials including melting, glass transition, crystallization, evaporation, thermal decomposition, denaturation, specific heat capacity and thermal history. The thermograms in Figure 6 show DSC traces of wool and different animal fibers consisting of a first endothermic peak due to water evaporation and a second peak around the 230 °C due to denaturation of the α- helix keratin crystallites of cortical cells [86]
Wortmann et al. [87] found a significant positive correlation between the denaturation temperatures and the cystine content in keratin. It was concluded that the α-helix denaturation temperatures are kinetically controlled by the amount and/or the chemical composition of the surrounding non helical matrix, and that the double-peak endotherms observed for wool and other keratins originate from two cell types that are sufficiently different in sulphur content to allow endotherm separation. In the case of wool and other fine animal fibers, these cells are orthocortical and paracortical cells, while mohair fibers core is made up of ortho-cortical cells only, with a single endothermic peak (see Figure 6).
Vineis et al. [28] used DSC traces to distinguish between animal fibers from domestic livestock (merino wool, yak, alpaca, mohair, cashmere, camel, angora) and wild and hybrid livestock (yangir, cashgora, vicuña, shatoosh) based on the differences in transition enthalpy and temperature of the crystalline material that constitutes the ortho - and paracortex. They stated that hair of animals exposed to thermal and nutritional stresses tend to develop a higher amount of cross-linked cysteine-rich paracortex. However, industrial treatments such as steaming and stretching can cause changes in thermal traces due to the transition to α- helix to the β- sheet conformation or rearrangements in the matrix [88]. In conclusion DSC can be used on various animal fibers without previous long classification studies, but it remains a fast method of qualitative analysis to confirm animal fiber origin or study thermal modification in different fiber processing stages.
Spectroscopy
Spectroscopies in the near infrared field (NIR), in the mid infrared field (IR) and Raman have been proposed by many authors as a tool to identify fine animal hair and for quantitatively determining wool and cashmere in a blend ( See Table 4).
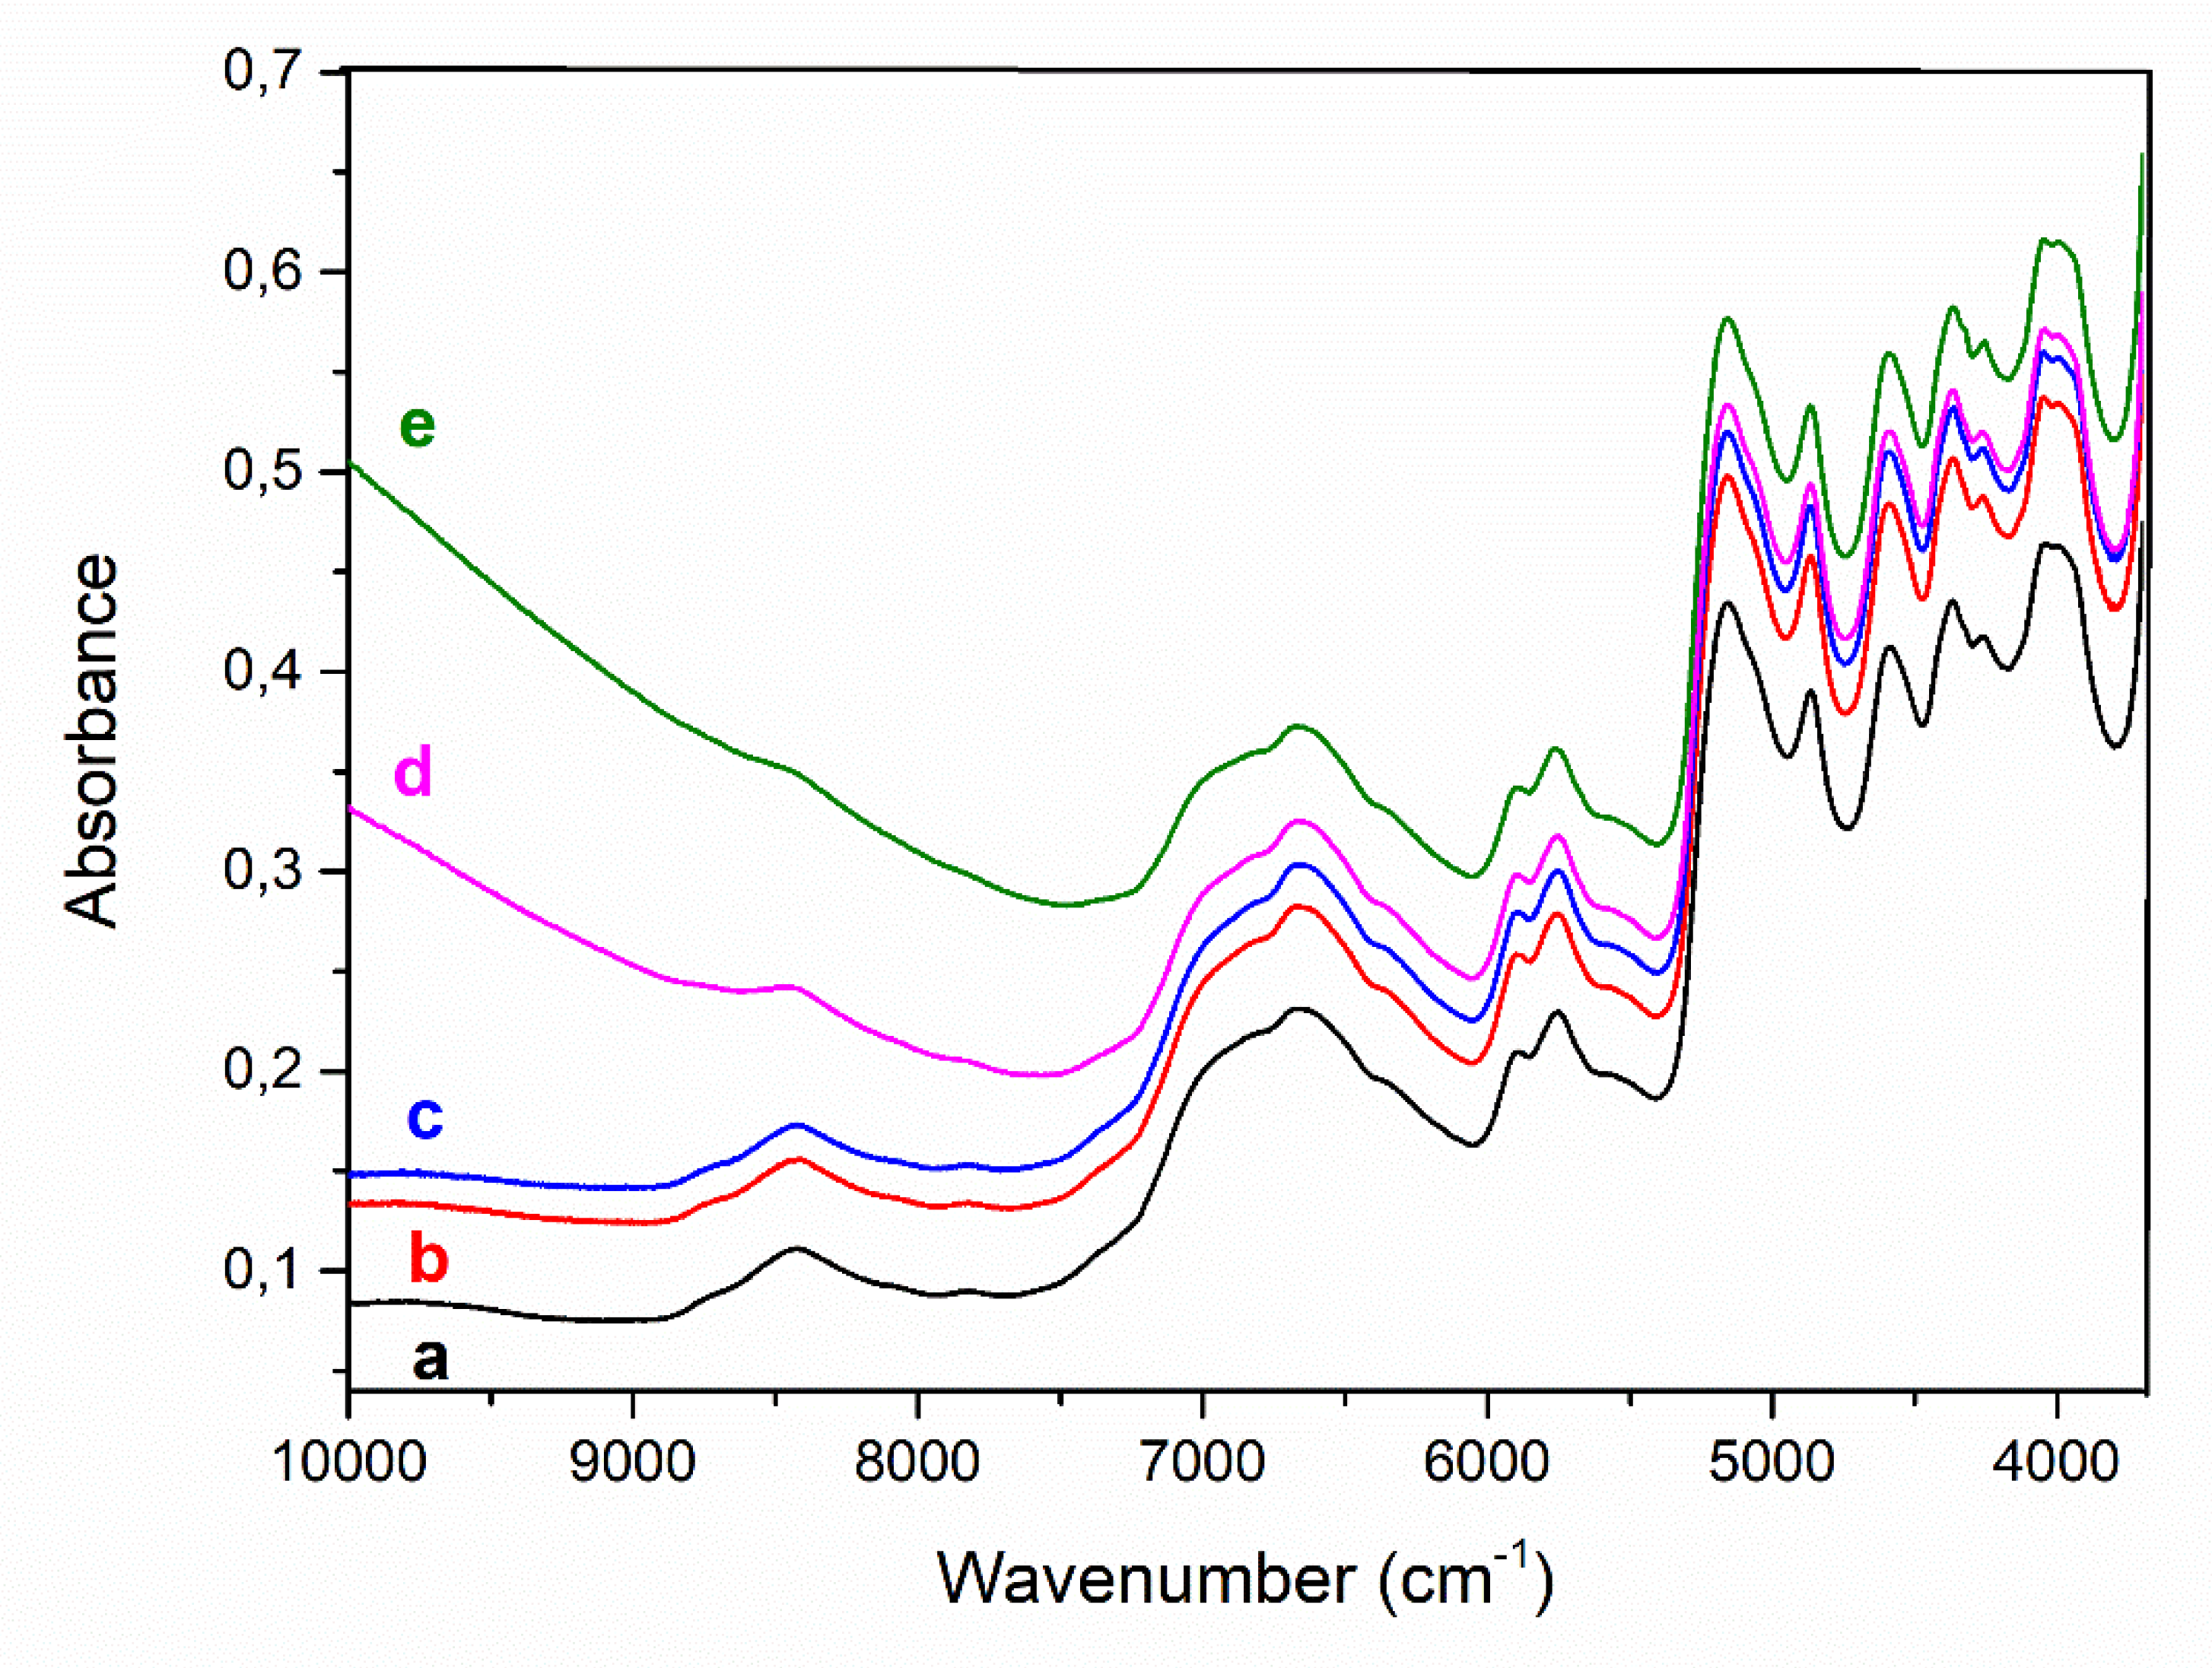
Among them, NIR spectroscopy is the most studied and the most promising one. NIR absorbance of a material is mainly associated with the overtone and combination vibrations of the chemical bonds, e.g., C–H, O–H, N–H, S-H, but also the physical properties of a material, such as surface scattering and sample size, have influences on the spectrum [101]. In Figure 7, NIR spectra of wool and some fine animal hair are shown in the wavenumber range from 10,000 to 3,700 cm-1.
The major difference clearly visible between the spectra is the tail between 10,000 cm-1 and 7,300 cm-1 present in the pigmented fibers and imputable to the semiconductor properties of eumelanin pigments and correlated with their amount in the sample [102]. Another difference among spectra is their absorption intensity at different wave numbers, which is caused by a different scattering of the NIR radiation correlated mainly with physical properties of samples such as the fiber diameter, the presence or absence of medulla and the shape and distribution of cuticular cells [98].
The main advantages of NIR spectroscopy are related to the rapid testing of samples without destroying their integrity and the ability to use portable instruments or take measurements directly on the production line. Main disadvantage is the time-consuming calibration of the methods. Acquired spectra are then evaluated using modern chemometric methods [103].
From Table 4 we can see that identification of fibers is not restricted to wool and cashmere but includes angora rabbit, camel, yak, [93,98] and different natural and mand-made fibres like cotton, tencel, PET, PLA, PP [92] and PET, PA, PU, silk, flax, cotton, viscose and their blends [99] or wool blend with cotton, mohair, silk, cashmere and spandex [96]. For quantitative analysis wool/cashmere blends have usually been tested. In general fibers are in raw state or as combed slivers, but also yarn and fabrics and textile from market have been tested obtaining good discrimination accuracy [99]. Most popular statistics used for identification purposes was SIMCA (Soft Independent Modelling by Class Analogy) [93,98,99]and for quantitative analysis algorithms such as PCR (Principal Component Regression) [98], Partial Least Squares regression (PLS) [97] and multiple linear regression (MLR) [95,100] were applied. In the in qualitative studies for the identification of textile materials, the accuracy achieved is often 100% even if when the distinction occurs between chemically different fibers and similar fibers (wool and cashmere), more specific algorithms were used for wool cashmere discrimination [92].
Quantitative tests to assess the amount of wool and cashmere in a blend gave discordant results with Standard Error of Prediction (SEP) ranging from 13.10 [98] to 1.2061 [100] and 0.5 [95] depending on the sampling and algorithm used for calibration. Good results were also obtained by Sun et al. [91] who tested NIR on real sample in the market and achieved an accuracy of 93,33% for cashmere textiles and of 96,60% for cashmere-wool blended textiles using a portable NIR-based textile analyzer.
Even more in detail, NIR spectroscopy was proposed to discriminate among varieties of cashmere material [104] and to distinguish between virgin and recycled cashmere fibers [105]. In conclusion, NIR spectroscopy, is a fast and non destructive technique which need long and accurate calibration work and it is valuable to areas where large numbers of raw fiber samples must be tested, such as quality control in large enterprises and in import/export business.
Alternative methods of fiber identification using Spectroscopies such as Fourier Transform Infrared Spectroscopy (FTIR) sensible to amino acids variation correlated with animal species and Raman spectroscopy were investigated. Although some works have not produced satisfactory results [89,94], positive results were obtained when FTIR analysis was coupled with chemometric tools. Indeed, in a recent work as a proof-of-concept study illustrating the potential of ATR FT-IR spectroscopy in animal fibers identification, Sharma et al. [90] obtained a complete differentiation between cashmere, angora and shahtoosh using FT-IR spectroscopy coupled with partial least squares discriminant analysis (PLS DA) .

Biotechnological methods

Electrophoresis
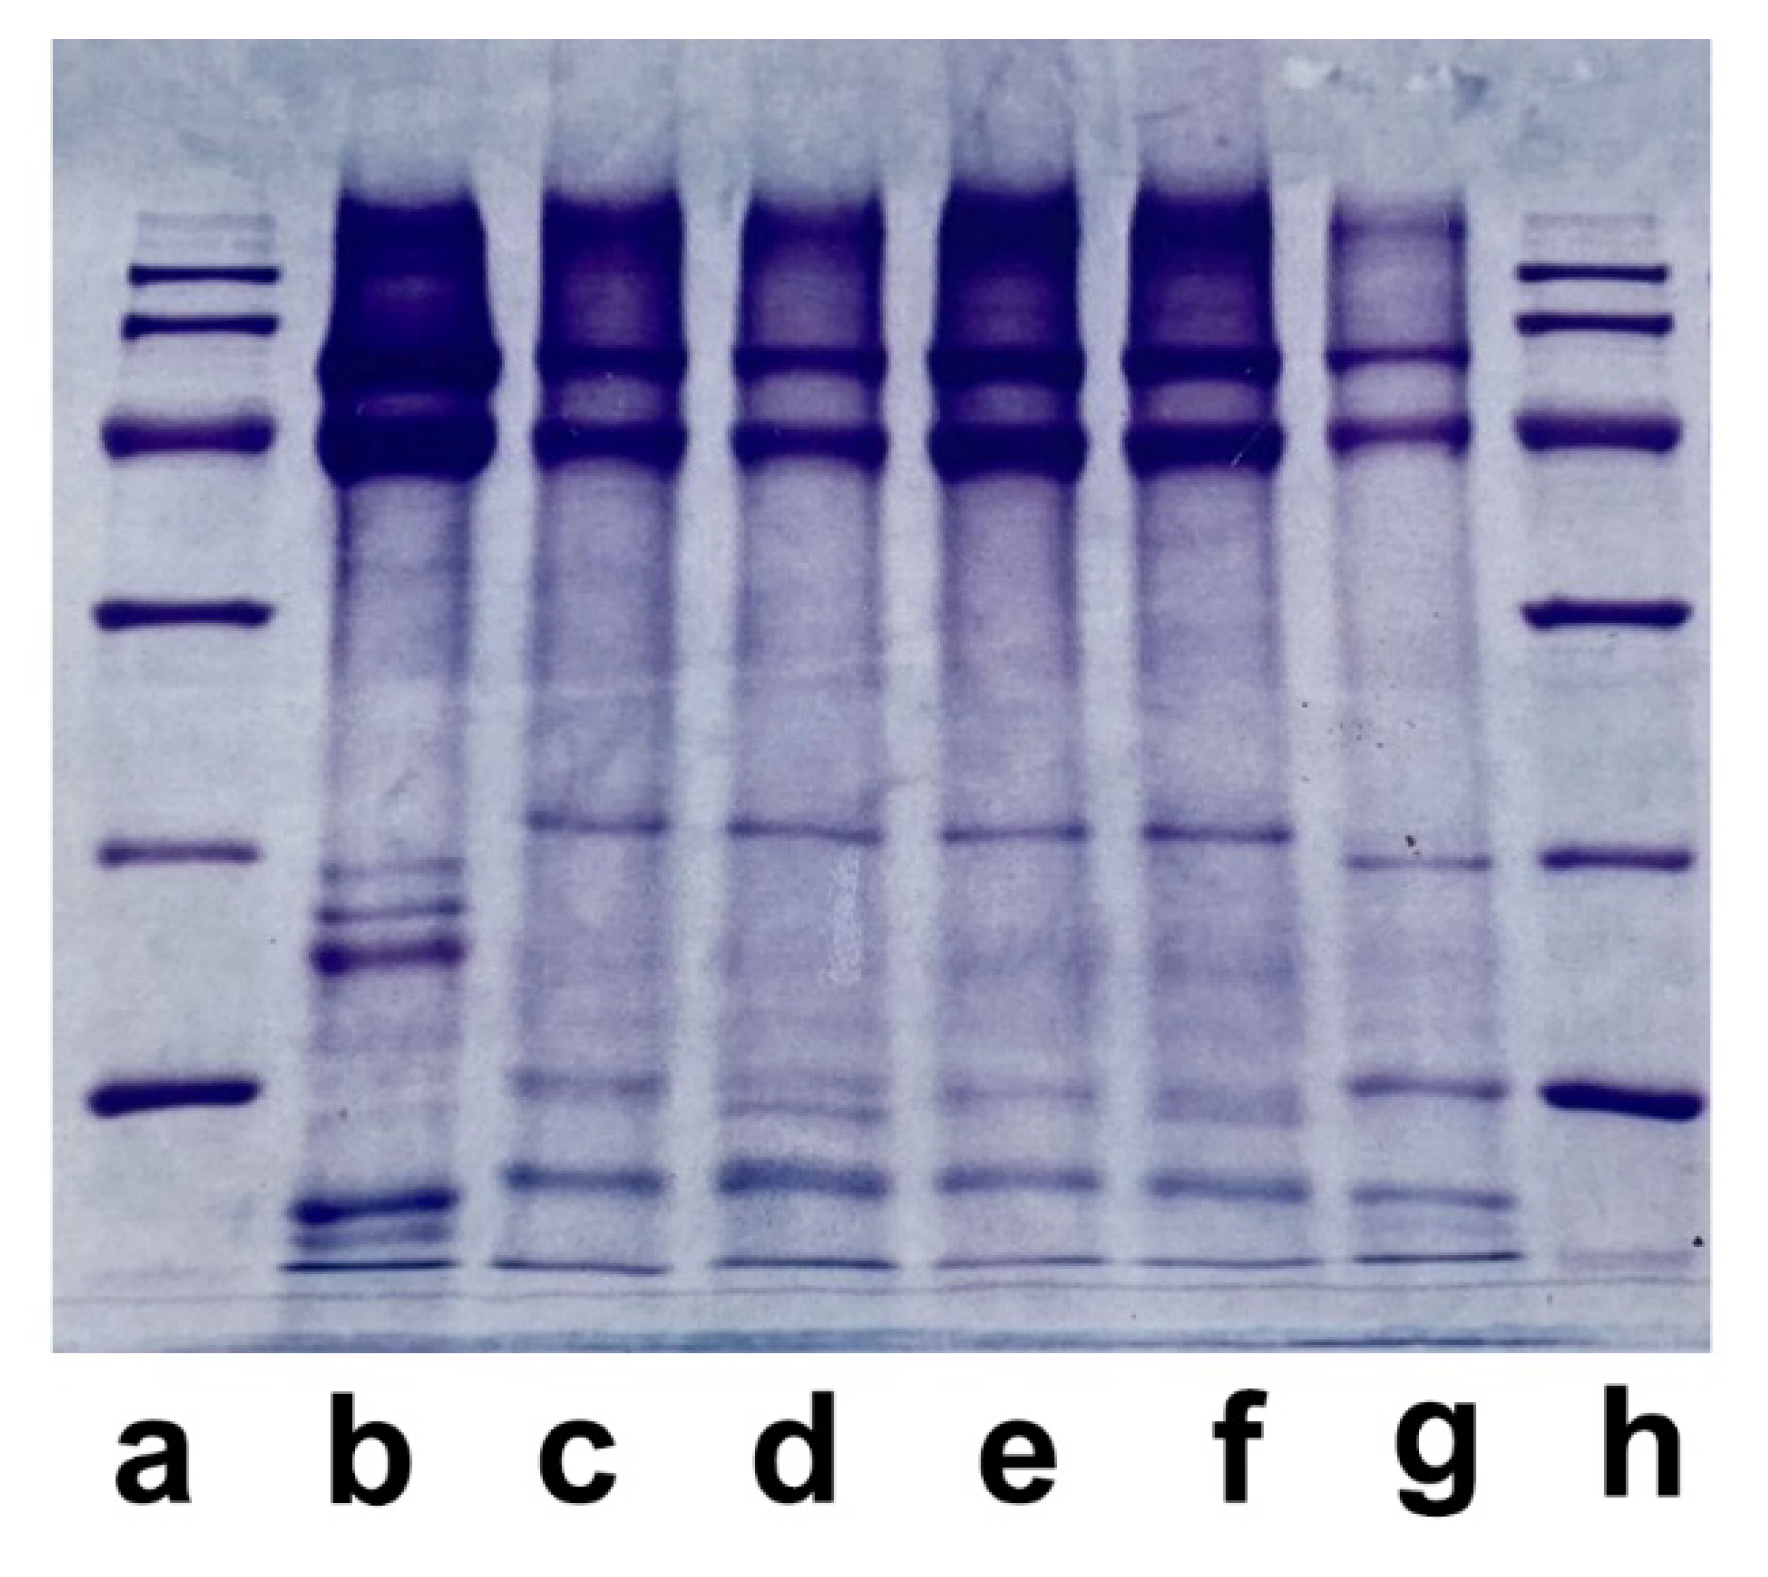
Keratin protein synthesis is primarily under genetic control and therefore is species specific. The first attempt to distinguish between wool and different animal fibers focused on protein separation by one or two-dimensional polyacrylamide gel electrophoresis analysis. In one-dimensional gel electrophoresis, the proteins extracted from fibers by reducing the disulphide bonds are separated according to their molecular mass, while in two-dimensional gel electrophoresis, proteins are separated according to their isoelectric point and in the other dimension according to their molecular mass [78] According to molecular mass, the keratin fiber samples show two important protein fractions at about 50 kDa, which correspond to the low-sulphur proteins of the intermediate filaments present in the cortex, molecular weight between 28 and 11 KDa corresponding to protein fractions of the high-sulphur proteins in the cuticle, while molecular weight lower than 10 KDa correspond the high glycine, tyrosine protein of the matrix between cortical cells and cuticular and cortical cells [106] (see Figure 8).
Marshal et al. [107] demonstrated that two-dimensional electrophoresis technique can differentiate between wool, mohair, camel and alpaca, and the main variations occurred in the high sulphur proteins. Tucker et al. [108] applied two-dimensional electrophoresis using either acidic or alkaline gels to differentiate among cashmere, mohair, cashgora and wool concluding that this technique is able to differentiate between goat and sheep fibers, but not unequivocally between cashmere, mohair and cashgora. The relatively simple method of one-dimensional electrophoresis was applied by Wortmann et al. [27] to distinguish between yak and cashmere and between lama and mohair fibers as well as between their blends. Despite the positive judgment of the gel electrophoresis to differentiate between fine animal fibers, the main problems arise from the low protein extraction yields of many hair samples following industrial textile processes or extreme weathering which seriously affect their quantitative determination.
DNA analysis
A breakthrough in speciality fiber biotechnological analysis was made in the late 1980s when it was demonstrated that DNA (deoxyribonucleic acid), the chemical molecule that carries the hereditary/genetic information, was not only present in hair roots but could be extracted from animal hair shafts. For the first time Kalbé et al. [109] isolated DNA from whole fiber and cuticular cells of animal hair (i.e. alpaca, angora rabbit, cashmere, cashgora, mohair, merino wool and yak). The extracted DNA was then hybridized with selected DNA fragments appositely prepared from rabbit, bovine livers and sheep. Results from dot blot hybridization showed that yak and angora were recognized by bovine and rabbit DNA probes, but goat and sheep may be differentiated only gradually using these probes. However, these first results allowed new possibilities to identify animal fibers employing techniques from molecular biology.
Some years later Hamlyn et al. [110] describes the advantages and limits of DNA analysis used to distinguish between wool, cashmere and yak. DNA hybridization analysis using a classical dot blot technique is usually carried out on fibers in their raw state, while in processed materials and finished garments, the amount of DNA present in the fibers is so reduced that DNA must be amplified in vitro with a technology known as polymerase chain reaction (PCR) before the analysis. The authors affirmed that even if the DNA analysis with PCR amplification is able to detect fraudulent substitution of small amounts of fibers, the analysis is not quantitative. A major challenge could be identifying DNA in situ directly on the fiber shafts, but this technology was not developed yet because DNA is encapsulated in a waterproof environment of the keratinized cells of the fibers. Kerkhoff et al. [111] studied a DNA-analytical method with PCR amplification to identify cashmere/cashgora, fine wool, yak and camel hair in untreated and treated (washed, bleached, dyed) fibers samples. The authors concluded that using this method is possible to differentiate between fine wool-cashmere and cashmere-yak hair, which are the most difficult fibers to distinguish by SEM methods. However, main problems arise from the differentiation between breeds or varieties of the same species (cashmere, cashgora and mohair) and from obtaining quantitative results.
In Table 5 studies carried out using DNA approaches to identify fine animal fibers have been summarized.
In general, even if a lot of studies are focused on the distinction between wool and cashmere, and on the identification of the presence of wool in cashmere labelled products, the studies concern different fibers ranging from shatoosh to alpaca, yak, camel and rabbit. Particular attention was paid to the distinction between yak and cashmere, which are two fibers that are particularly difficult to distinguish under microscopy, while DNA analysis makes identification easier as they belong to genetically distant species [111] Some problems have been found in distinguishing between genetically similar species such as mohiar, cashgora and cashmere goat,[120]while no literature was found about the distinction between fibers of South American Camelids. The studies were carried out both on raw fibers [113,114] and on finished products on the market [116] with particular attention to dyed products [31,115] as dyeing has been demonstrated to be the main process damaging the DNA present in the fibers.
DNA analysis is basically a qualitative analysis, able to identify fibers very similar in the microscopic analysis, while the quantitative analysis presents some problems. The quantitative result generally consists in determining the minimum amount of foreign fiber that can be detected in a sample and this ranges from about 10% [113,114] to 1% [116,119].
Although DNA analysis to identify animal fibers is still now used in some laboratories following the ISO 18074 standard [121], there have been no studies in the recent literature on DNA analysis probably because they have been replaced by proteomics studies.
The main problem of DNA analysis is its low and probably uneven amount in animal fibers. In contrast, proteins seem to be an ideal target for discrimination since animal hair consists primarily of keratins and keratin-associated proteins characterized by persistence, abundance and derivation from DNA.

Proteomic analysis

Proteomic methods are able to distinguish one species from another by MS (Mass Spectrometry) approaches applied in protein or peptide identification. Usually the “bottom- up” or “shotgun” proteomic approach is employed consisting in detecting only peptides, and identity the unique peptides to confirm the presence of a proteins in the sample. Proteins are extracted from animal fibers using a buffer solution containing a reducing agent, usually dithiothreitol [5,122,123]able to cleave the disulphide bonds between cysteine’s side chains. In some cases mercaptoethanol [124,125] has been used instead of DTT. Extracted proteins are digested usually by trypsin, a proteolytic enzyme able to cleave proteins at the C-terminal side of arginine and lysine obtaining short peptide fragments of up to 20-30 residues [32,126]. In one case a double digestion was carried out with trypsin-chymotrypsin (sensitive to Asp/Glu) or trypsin-Glu-C (sensitive to Phe/Tyr/ Trp/Leu) [127] in order to improve the species specific peptides identification in similar species.
Digestion can be performed either in-solution or after protein separation by gel electrophoresis from the bands (one dimension – SDS Page )[128] or spots (2 dimension) formed on the gels. Peptides are then analysed in MS mode, where they are identified by their mass or MS/MS mode where the amino acid sequence of the peptide can be obtained and then compared with protein sequences in databases. To be detected in MS mode, peptides are ionized or by matrix assisted laser desorption ionization (MALDI) or by electrospray Ionization (ESI). The first is often coupled with a time-of-flight mass spectrometer (TOF-MS) in which the ions are accelerated through a fixed electric field and their time of flight to reach the detector determine their mass-to-charge ratio, the second is the interface between a separation system where sample is injected (high performance liquid chromatography (HPLC), ultra-performance liquid chromatography (UPLC)) and the MS detector.
As shown in Table 6, common approaches used are UPLC/ESI-MS [123], UPLC/ESI-MS/MS, [32] in order to identify peptidic species-specific markers able to differentiate between wool, cashmere and yak fibers, MALDI- TOF MS [125], MALDI TOF MS/MS [129]
In Table 6 main literature about fine animal fibers identification using proteomic analyses is summarized.
Studies on the identification of animal fibers using proteomic methods concern in many cases wool, cashmere and yak, being the last one often used for the adulteration of cashmere products and being difficult to distinguish yak from cashmere using microscopic methods [32,128]. Moreover some studies cover a wide range of fibers ranging from cashmere, wool, mohair, yak, camel, angora, alpaca, lama, mink, fox and dog [125,131]. The recognition of South American Camelids (SACs) fibers has a been investigated also on ancient textiles found in archeological sites [122] and the presence of shahtoosh fibers on cashmere fabrics has been investigated for fraud control to detect the illegal trade of shahtoosh [7]Samples investigated range from raw fibers to yarn and fabrics and historical textiles. In most cases raw fibers were used for species–specific marker screening and commercial textile fibers for marker verification [127]. Accuracy when reported is good, ranging from -3% / -6% to +3% / +7% [123] as well as the limit of detection around 5% [7]even if it is less sensitive than that PCR-based DNA analysis method where the limitation of detection is 1% [116], but in this case the advantage lies in the fact that no false positives are detected.
Some studies focus on analysis for commercial purposes [123], others on the identification of specific species markers to implement the existing databases [5,122]and allow the recognition of treated or damaged samples also in the field of palaeoproteomics and in the case where the surface fibers morphology does not allow fibers recognition.
In some cases analyses are particularly challenging due to the extensive hybridization between the species, e.g. domestics SACs lama and alpaca identification [122]. In conclusion, proteomic approach is a long and complex process, useful for the discrimination among fibers or materials difficult to distinguish with other methods, and important to reveal information about relationships between close species or sub-species, to evaluate morphological characteristics in fibers related to expression and quantitation of proteins (e.g. fineness of wool), to study the degradation of proteins following industrial process in commercial fabrics or ageing, in historical textiles.

Conclusions

The identification and quantitative determination of wool and animal fibers is a major challenge mainly for textile fraud control but also in fashion, forensics and archeological fields. Old methods, i.e. optical and electron microscopies, which are often criticized because they cause subjective results, still dominates in fibers identification, being the cheaper and more affordable ones and providing a range of information barely possible with other methods. However, many different methods are now available about techniques of identification and classification of fibers which have evolved following advances in new technologies, especially in image processing, NIR spectroscopy coupled with chemiometric and proteomic. The prospects for expanding the use of these techniques depend on the application fields and on overcoming some critical issues. The automated analysis by means of image analysis techniques, as obvious alternative to the expert-based analysis of fiber morphology, is one of the most promising techniques able at correctly identify animal fiber types and an ever-increasing classification performance is reported in many works. However, some gaps remain to be filled with regard to the enlargement from the wool- cashmere binary classification to different animal fibers and from raw fibers to commercial yarn and fabrics. NIR spectroscopy, as a fast and non destructive technique, is valuable to areas where large numbers of sample have to be evaluated, while proteomic approach is a long and complex analysis, useful for the discrimination among fibers or materials difficult to distinguish with other methods (e.g. cashmere- yak, cashmere- shahtoosh) for commercial purposes or fraud control and it allow the recognition of treated or damaged samples in the field of archeological textile and in the case where the surface fibers morphology does not allow fibers recognition.

Author Contributions

Conceptualization, M.Z. and A.P.; data curation, M.Z. P.B. and A.A; writing—original draft preparation, M.Z., and A.A.; writing—review and editing, P.B. and M.Z.; supervision, A.P.,P.B. All authors have read and agreed to the published version of the manuscript.

Funding

This research received no external funding.

Data Availability Statement

Not applicable.

Conflicts of Interest

The authors declare no conflict of interest.

References

  1. McGregor, B.A. Physical, Chemical, and Tensile Properties of Cashmere, Mohair, Alpaca, and Other Rare Animal Fibers. In Handbook of Properties of Textile and Technical Fibres (Second Edition); Bunsell, A.R., Ed.; Woodhead Publishing, 2018; pp. 105–136. ISBN 978-0-08-101272-7. [Google Scholar]
  2. Gutierrez, G.; Pablo Gutiérrez, J. Challenges and Opportunities of Genetic Improvement in Alpacas and Llamas in Peru. In Proceedings of the Proceedings of the World Congress on Genetics Applied to Livestock Production, 11.; p. 7622019.
  3. Madkour, F.A.; Abdelsabour-Khalaf, M. Performance Scanning Electron Microscopic Investigations and Elemental Analysis of Hair of the Different Animal Species for Forensic Identification. Microsc Res Tech 2022, 85, 2152–2161. [Google Scholar] [CrossRef] [PubMed]
  4. Sharma, C.; Sharma, S.; Gopal, S.; Rawat, G.; Singh, R. Rapid and Non-Destructive Differentiation of Shahtoosh from Pashmina/Cashmere Wool Using ATR FT-IR Spectroscopy. Science & Justice 2022, 62. [Google Scholar] [CrossRef]
  5. Azémard, C.; Zazzo, A.; Marie, A.; Lepetz, S.; Debaine-Francfort, C.; Idriss, A.; Zirah, S. Animal Fibre Use in the Keriya Valley (Xinjiang, China) during the Bronze and Iron Ages: A Proteomic Approach. J Archaeol Sci 2019, 110, 104996. [Google Scholar] [CrossRef]
  6. Price, E.; Larrabure, D.; Gonzales, B.; McClure, P.; Espinoza, E. Forensic Identification of the Keratin Fibers of South American Camelids by Ambient Ionization Mass Spectrometry: Vicuña, Alpaca and Guanaco. Rapid Communications in Mass Spectrometry 2020, 34. [Google Scholar] [CrossRef]
  7. Fei, J.; Liu, M.; Zhang, S.; Chen, X.; Zhang, S. Technical Note: A Protein Analysis-Based Method for Identifying Shahtoosh. Forensic Sci Int 2022, 336, 111341. [Google Scholar] [CrossRef] [PubMed]
  8. Hill, W.G. Merino Improvement Programs in Australia. Proceedings of a National Symposium, Leura, New South Wales 1987. Supervising Editor, B. J. McGuirk. Australian Wool Corporation, Melbourne. 535 Pages. ISBN 0 642 115311. Genet Res (Camb) 1989, 53, 72–72. [Google Scholar] [CrossRef]
  9. Mcgregor, B.A.; Butler, K.L. The Effects of Cashmere Attributes on the Efficiency of Dehairing and Dehaired Cashmere Length. Textile Research Journal 2008, 78, 486–496. [Google Scholar] [CrossRef]
  10. Zoccola, M.; Pozzo, P.D.; Bianchetto Songia, M.; Sanchez Nieto, A. SEM and Light Microscopy Investigation of Depigmented Fine Animal Fibres and Melanin Pigments Extracted from Fibres. In Proceedings of the 5th multinational congress on electron microscopy, Lecce, 20 September 2001; pp. 501–502. [Google Scholar]
  11. Https://Www.Cashmere.Org/Facts.Php.
  12. Wildman, A.B. The Identification of Animal Fibres. Journal of the Forensic Science Society 1961, 1, 115–119. [Google Scholar] [CrossRef]
  13. Robert R Franck Silk, Mohair, Cashmere and Other Luxury Fibres. In Silk, Mohair, Cashmere and Other Luxury Fibres; Woodhead Publishing Series in Textiles; Franck, R.R. (Ed.) Woodhead Publishing, 2001; p. ii. ISBN 978-1-85573-540-8. [Google Scholar]
  14. Gardetti, M.A.; Muthu, S.S. Environmental Footprints and Eco-Design of Products and Processes Handbook of Sustainable Luxury Textiles and Fashion Volume 2; 2016. [Google Scholar]
  15. Wheeler, J.C. South American Camelids - Past, Present and Future. Journal of Camelid Science 2012, 5, 1–24. [Google Scholar]
  16. Frank, E.N.; Hick, M.V.H.; Gauna, C.D.; Lamas, H.E.; Renieri, C.; Antonini, M. Phenotypic and Genetic Description of Fibre Traits in South American Domestic Camelids (Llamas and Alpacas). Small Ruminant Research 2006, 61, 113–129. [Google Scholar] [CrossRef]
  17. Samanta, K.; Roy, A. Chemical Modification of Indian Yak Fibre for Development of Jute/Yak Fibres Blended Warm Textile; 2019; pp. 151–165. ISBN 978-981-13-7720-4. [Google Scholar]
  18. Perincek, S.; Bahtiyari, M.İ.; Körlü, A.E.; Duran, K. Ozone Treatment of Angora Rabbit Fiber. J Clean Prod 2008, 16, 1900–1906. [Google Scholar] [CrossRef]
  19. Zoccola, M.; Aluigi, A.; Patrucco, A.; Tonin, C. Extraction, Processing and Applications of Wool Keratin. In Keratin: Structure, properties and applications; Nova Science Publisher Inc: New York, 2012; pp. 36–62. [Google Scholar]
  20. Cashmere Clothing Market Overview, Trends, Segmentation, Scenario, and Forecast Analysis to 2029. Available online: https://www.databridgemarketresearch.com/reports/global-cashmere-clothing-market (accessed on 18 April 2023).
  21. ISO 17751-1:2016 - Textiles. Quantitative analysis of cashmere, wool, other specialty animal fibers and their blends — Part 1: Light microscopy method; 2016. [Google Scholar]
  22. ISO 17751-2:2016 - Textiles. Quantitative analysis of cashmere, wool, other specialty animal fibers and their blends — Part 2: Scanning electron microscopy method; 2016. [Google Scholar]
  23. Wortmann, F.J.; Wortmann, G. Scanning Electron Microscopy as a Tool for the Analysis of Wool/ Speciality Fiber Blends; Universidade de Minho: Guimarães, 1991. [Google Scholar]
  24. Greaves, P.H.; Saville, B.P. Microscopy of Textile Fibres, 1st ed.; Taylor & Francis Group: London, 1995. [Google Scholar]
  25. Langley, K.D.; Kennedy, T.A. The Identification of Specialty Fibers. Textile Research Journal 1981, 51, 703–709. [Google Scholar] [CrossRef]
  26. Wortmann, F.-J.; Arns, W. Quantitative Fiber Mixture Analysis by Scanning Electron Microscopy: Part I: Blends of Mohair and Cashmere with Sheep’s Wool. Textile Research Journal 1986, 56, 442–446. [Google Scholar] [CrossRef]
  27. Wortmann, G.; Wortmann, F.J. Chemical Characterization of Fine Animal Hair. In Proceedings of the 1st International Symposium on Speciality animal fibers; Aachen, October 26 1987; pp. 39–70. [Google Scholar]
  28. Vineis, C.; Aluigi, A.; Tonin, C. Outstanding Traits and Thermal Behaviour for the Identification of Speciality Animal Fibres. Textile Research Journal 2010, 81, 264–272. [Google Scholar] [CrossRef]
  29. Langley, K.D. Development of Precision and Bias Statement for Cashmere Quantitative Fiber Analysis. In Proceedings of the Proceedings of the 4th International Cashmere Determination Technique Symposium; China National Cashmere Products Engineering and Technical Centre and China Inner Mongolia Erdos Cashmere Group Corporation: Erodosi, China, 2008; pp. 154–160. [Google Scholar]
  30. Rippon, J.A.; Evans, D.J. Improving the Properties of Natural Fibres by Chemical Treatments. In Handbook of natural fibres; Woodhead Publishing Series in Textiles: Philadelphia, 2012; Volume 2, pp. 63–140. [Google Scholar]
  31. Sun, M.; Fei, J.; Cai, J.; Zhao, J. Application of DNA Analysis in Quantifying Cashmere and Wool Binary Blend. In Proceedings of the Key Engineering Materials; Trans Tech Publications Ltd, 2015; Vol. 671, pp. 378–384. [Google Scholar]
  32. Paolella, S.; Bencivenni, M.; Lambertini, F.; Prandi, B.; Faccini, A.; Tonetti, C.; Vineis, C.; Sforza, S. Identification and Quantification of Different Species in Animal Fibres by LC/ESI-MS Analysis of Keratin-Derived Proteolytic Peptides. J Mass Spectrom 2013, 48, 919–926. [Google Scholar] [CrossRef] [PubMed]
  33. McGregor, B.A.; Quispe Peña, E.C. Cuticle and Cortical Cell Morphology of Alpaca and Other Rare Animal Fibres. Journal of the Textile Institute 2018, 109, 767–774. [Google Scholar] [CrossRef]
  34. Tian, Z.; Hong, X.; Xu, X.; Ma, H. Identification of Kid Cashmere. Wool Textile Journal 2020, 48, 83–88. [Google Scholar]
  35. Zhu, Y.; Zhao, L.; Chen, X.; Li, Y.; Wang, J. Identification of Cashmere and Wool Based on LBP and GLCM Texture Feature Selection. J Eng Fiber Fabr 2023, 18, 15589250221146548. [Google Scholar] [CrossRef]
  36. Zhu, Y.; Jiayi, H.; Li, Y.; Li, W. Image Identification of Cashmere and Wool Fibers Based on the Improved Xception Network. Journal of King Saud University - Computer and Information Sciences 2022, 34, 9301–9310. [Google Scholar] [CrossRef]
  37. Xuebao, F. Cashmere and Wool Classification Based on Sparse Dictionary Learning. Journal of Textile Research 2022, 43, 28–32. [Google Scholar]
  38. Zhu, Y.; Zhao, L.; Chen, X.; Li, Y.; Wang, J. Animal Fiber Recognition Based on Feature Fusion of the Maximum Inter-Class Variance. Autex Research Journal 2022, 0. [Google Scholar] [CrossRef]
  39. Zang, L.; Xin, B.; Deng, N. Identification of Wool and Cashmere Fibers Based on Multiscale Geometric Analysis. Journal of the Textile Institute 2022, 113, 1001–1008. [Google Scholar] [CrossRef]
  40. Xing, W.; Liu, Y.; Xin, B.; Zang, L.; Deng, N. The Application of Deep and Transfer Learning for Identifying Cashmere and Wool Fibers. Journal of Natural Fibers 2022, 19, 88–104. [Google Scholar] [CrossRef]
  41. Zhu, Y.; Duan, J.; Li, Y.; Wu, T. Image Classification Method of Cashmere and Wool Based on the Multi-Feature Selection and Random Forest Method. Textile Research Journal 2021, 92, 1012–1025. [Google Scholar] [CrossRef]
  42. Zang, L.; Xin, B.; Deng, N. Identification of Overlapped Wool/Cashmere Fibers Based on Multi-Focus Image Fusion and Convolutional Neural Network. Journal of Natural Fibers 2021, 19, 6715–6726. [Google Scholar] [CrossRef]
  43. Yaolin, Z.; Wanwan, M.; Yunhong, L.; Tong, W. Identification of Cashmere and Wool Based on Matched Filter and Multi-Feature Fusion. Wool Textile Journal 2021, 49, 64–69. [Google Scholar]
  44. Sun, C. Image Classification of Cashmere and Wool Fiber Based on LC-KSVD. In Proceedings of the Journal of Physics: Conference Series, 28 June 2021; IOP Publishing Ltd; Vol. 1948. [Google Scholar]
  45. Luo, J.; Lu, K.; Chen, Y.; Zhang, B. Automatic Identification of Cashmere and Wool Fibers Based on Microscopic Visual Features and Residual Network Model. Micron 2021, 143. [Google Scholar] [CrossRef]
  46. Zhu, Y.; Huang, J.; Wu, T.; Ren, X. Identification Method of Cashmere and Wool Based on Texture Features of GLCM and Gabor. J Eng Fiber Fabr 2021, 16. [Google Scholar] [CrossRef]
  47. Xing, W.; Liu, Y.; Deng, N.; Xin, B.; Wang, W.; Chen, Y. Automatic Identification of Cashmere and Wool Fibers Based on the Morphological Features Analysis. Micron 2020, 128. [Google Scholar] [CrossRef]
  48. Yildiz, K. Identification of Wool and Mohair Fibres with Texture Feature Extraction and Deep Learning. IET Image Process 2020, 14, 348–353. [Google Scholar] [CrossRef]
  49. Lu, K.; Luo, J.; Zhong, Y.; Chai, X. Identification of Wool and Cashmere SEM Images Based on SURF Features. J Eng Fiber Fabr 2019, 14. [Google Scholar] [CrossRef]
  50. Xing, W.; Deng, N.; Xin, B.; Wang, Y.; Chen, Y.; Zhang, Z. An Image-Based Method for the Automatic Recognition of Cashmere and Wool Fibers. Measurement 2019, 141, 102–112. [Google Scholar] [CrossRef]
  51. Xing, W.; Deng, N.; Xin, B.; Chen, Y.; Zhang, Z. Investigation of a Novel Automatic Micro Image-Based Method for the Recognition of Animal Fibers Based on Wavelet and Markov Random Field. Micron 2019, 119, 88–97. [Google Scholar] [CrossRef] [PubMed]
  52. Xing, W.; Deng, N.; Xin, B.; YU, C. Identification of Wool and Cashmere Based on Multi-Feature Fusionimage Analysis Technology. Journal of Textile Research 2019, 15, 146–152. [Google Scholar] [CrossRef]
  53. Xing, W.; Deng, N.; Xin, B.; Liu, Y.; Chen, Y.; Zhang, Z. Identification of Extremely Similar Animal Fibers Based on Matched Filter and HOG-SVM. IEEE Access 2019, 7, 98603–98617. [Google Scholar] [CrossRef]
  54. Wang, H. Combining the Hough Transform with MLP for Identifying Cashmere and Wool Fibers. In Proceedings of the ACM International Conference Proceeding Series; Association for Computing Machinery, 2019; Vol. Part F148262, pp. 124–128. [Google Scholar]
  55. Wang, F.; Jin, X.; Luo, W. Intelligent Cashmere/Wool Classification with Convolutional Neural Network. In Proceedings of the Advances in Intelligent Systems and Computing; Springer Verlag, 2019; Vol. 849, pp. 17–25. [Google Scholar]
  56. Xing, W.; Xin, B.; Deng, N.; Chen, Y.; Zhang, Z. A Novel Digital Analysis Method for Measuring and Identifying of Wool and Cashmere Fibers. Measurement (Lond) 2019, 132, 11–21. [Google Scholar] [CrossRef]
  57. Lu, K.; Zhong, Y.; Li, D.; Chai, X.; Xie, H.; Yu, Z.; Naveed, T. Cashmere/Wool Identification Based on Bag-of-Words and Spatial Pyramid Match. Textile Research Journal 2018, 88, 2435–2444. [Google Scholar] [CrossRef]
  58. Wang, F.; Jin, X. The Application of Mixed-Level Model in Convolutional Neural Networks for Cashmere and Wool Identification. International Journal of Clothing Science and Technology 2018, 30, 710–725. [Google Scholar] [CrossRef]
  59. Lu, K.; Chai, X.; Xie, H.; Yu, Z.; Zhong, Y. Identification of Cashmere/Wool Based on Pairwise Rotation Invariant Co-Occurrence Local Binary Pattern. In Proceedings of the Proceedings - 2017 International Conference on Computational Science and Computational Intelligence, CSCI 2017, 4 December 2018; Institute of Electrical and Electronics Engineers Inc.; pp. 463–467. [Google Scholar]
  60. Zhong, Y.; Lu, K.; Tian, J.; Zhu, H. Wool/Cashmere Identification Based on Projection Curves. Textile Research Journal 2017, 87, 1730–1741. [Google Scholar] [CrossRef]
  61. Yuan, S.; Lu, K.; Zhong, Y. Identification of Wool and Cashmere Based on Texture Analysis. In Proceedings of the Key Engineering Materials; Trans Tech Publications Ltd, 2015; Vol. 671, pp. 385–390. [Google Scholar]
  62. Chen, H.; Liu, Y.X. Research on Feature Extraction and Optimization of Cashmere and Wool Fiber Based on Digital Image. In Proceedings of the Applied Mechanics and Materials; Trans Tech Publications Ltd, 2014; Vol. 667, pp. 260–263. [Google Scholar]
  63. Liu, Y.; Liu, Y.; Shang, S.; Yuan, Y.; Yang, W. Research on the Scale Density Extraction Technology of Cashmere and Wool. In Proceedings of the Applied Mechanics and Materials; 2012; Vol. 217–219, pp. 947–950. [Google Scholar]
  64. Yang, Y.; Ji, Y. Study on Classification Technology of Wool and Cashmere Based on GA-SVM. In Proceedings of the Advanced Materials Research; 2011; Vol. 332–334, pp. 1198–1201. [Google Scholar]
  65. Shi, X.-J.; Yu, W.-D. Intelligent Animal Fibre Classification with Artificial Neural Networks’. Int. J. Modelling, Identification and Control 2011, 12, 107–112. [Google Scholar] [CrossRef]
  66. Shang The Research on Identification of Wool or Cashmere Fibre Based on Digital Image. In Proceedings of the Proceedings of the Ninth International Conference on Machine Learning and Cybernetics; IEEE, 2010.
  67. Zang, J.; Palmer, S.; Wang, X. Identification of Animal Fibers with Wavelet Texture Analysis. In Proceedings of the Proceedings of the World Congress on Engineering; 2010; pp. 742–747. [Google Scholar]
  68. Kun, Q.; Li, H.; Haijian, C.; Kejing, Y.; Shen, W.; Qian, K.; Cao, H.; Yu, K.; Shen, W. Measuring the Blend Ratio of Wool/Cashmere Yarns Based on Image Processing Technology. FIBRES & TEXTILES in Eastern Europe 2010, 18, 35–38. [Google Scholar]
  69. Shi, X.J.; Yu, W.D. Identification of Animal Fiber Based on Scale Shape. In Proceedings of the Proceedings - 1st International Congress on Image and Signal Processing, CISP 2008; 2008; Vol. 3, pp. 573–577. [Google Scholar]
  70. Kong, L.; She, F.; Nahavandi, S.; Kouzani, A.Z. Feature Extraction for Animal Fiber Identification. In Proceedings of the Second International Conference on Image and Graphics, vol. 4875; International Society for Optics and Photonics, 2002; pp. 699–704. [Google Scholar]
  71. She, F.H.; Chow, S.; Wang, B.; Kong, L.X. Identification and Classification of Animal Fibres Using Artificial Neural Networks. Journal of Textile Engineering 2001, 47, 35–38. [Google Scholar] [CrossRef]
  72. Robson, D. Animal Fiber Analysis Using Imaging Techniques Part II: Addition of Scale Height Data. Textile Research Journal 2000, 70, 116–120. [Google Scholar] [CrossRef]
  73. Robson, D. Animal Fiber Analysis Using Imaging Techniques Part I: Scale Pattern Data. Textile Research Journal 1997, 67, 747–752. [Google Scholar] [CrossRef]
  74. Kong, L.; She, F.; Nahavandi, S.; Kouzani, A. Fuzzy Pattern Recognition and Classification of Animal Fibers. In Proceedings of the Proceedings Joint 9th IFSA World Congress and 20th NAFIPS International Conference; 2001; pp. 1050–1055. [Google Scholar]
  75. Wool Market - Growth, Trends, and Forecasts (2023 - 2028). Available online: https://www.mordorintelligence.com/industry-reports/wool-market (accessed on 2 May 2023).
  76. Rippel, O.; Gülçelik, S.; Rahimi, K.; Kurniadi, J.; Herrmann, A.; Merhof, D. Animal Fiber Identification under the Open Set Condition. In Proceedings of the IEEE International Instrumentation and Measurement Technology Conference; 2021. [Google Scholar]
  77. Anceschi, A.; Zoccola, M.; Mossotti, R.; Bhavsar, P.; Fontana, G.D.; Patrucco, A. Colorimetric Quantification of Virgin and Recycled Cashmere Fibers: Equilibrium, Kinetic, and Thermodynamic Studies. Journal of Natural Fibers 2022, 19, 11064–11077. [Google Scholar] [CrossRef]
  78. Solazzo, C. Characterizing Historical Textiles and Clothing with Proteomics. Conservar Patrimonio 2019, 97–114. [Google Scholar] [CrossRef]
  79. Maclaren, J.A.; Milligan, B. Wool Science. The Chemical Reactivity of the Wool Fibre; Science Press: Marrickville, 1981. [Google Scholar]
  80. Villarroel, V. Wool handbook; Von Bergen, W., Ed.; Interscience: New York, 1963; Vol 1, pp. 411–413. [Google Scholar]
  81. Satlow, G.; Cieplik, M. von S.; Fichtner, G. Textiltechnik. 1965, 16, 143–145. [Google Scholar]
  82. Ferrero, F.; Mossotti, R.; Innocenti, R.; Coppa, F.; Periolatto, M. Enzyme-Aided Wool Dyeing: Influence of Internal Lipids. Fibers and Polymers 2015, 16, 363–369. [Google Scholar] [CrossRef]
  83. Logan, R.I.; Rivett, D.E.; Tucker, D.J.; Hudson, A.H.F. Analysis of the Intercellular and Membrane Lipids of Wool and Other Animal Fibers. Textile Research Journal 1989, 59, 109–113. [Google Scholar] [CrossRef]
  84. Tucker, D.J.; Hudson, A.H.F.; Rivett, D.E.; Logan, R.I. The Chemistry of Speciality Animal Fibres. Schriftenreihe des Deutschen Wollforschungsinstitutes 1990, 106. [Google Scholar]
  85. Korner, A. Lipids in the Analysis of Fine Animal Fibres. In Proceedings of the 1st International Symposium on Speciality Animal Fibres, Aachen; 1988; pp. 104–127. [Google Scholar]
  86. Zoccola, M.; Aluigi, A.; Tonin, C. Characterisation of Keratin Biomass from Butchery and Wool Industry Wastes. J Mol Struct 2009, 938, 35–40. [Google Scholar] [CrossRef]
  87. Wortmann, F.J.; Deutz, H.D. Characterizing Keratins Using High-pressure Differential Scanning Calorimetry (HPDSC). J Appl Polym Sci 1993, 48, 137–150. [Google Scholar] [CrossRef]
  88. Tonetti, C.; Varesano, A.; Vineis, C.; Mazzuchetti, G. Differential Scanning Calorimetry for the Identification of Animal Hair Fibres. J Therm Anal Calorim 2015, 119, 1445–1451. [Google Scholar] [CrossRef]
  89. Notayi, M.; Hunter, L.; Engelbrecht, J.A.; Botha, A.F.; Minnaar, E.G.; Lee, M.E.; Erasmus, R. The Application of Raman Spectroscopic Ratiometric Analysis for Distinguishing between Wool and Mohair. Journal of Natural Fibers 2022, 19, 11536–11546. [Google Scholar] [CrossRef]
  90. Prakash Sharma, C.; Sharma, S.; Singh Rawat, G.; Singh, R. Rapid and Non-Destructive Differentiation of Shahtoosh from Pashmina/Cashmere Wool Using ATR FT-IR Spectroscopy. Science & Justice 2022, 62, 349–357. [Google Scholar] [CrossRef]
  91. Sun, X.; Yuan, H.; Song, C.; Li, X.; Hu, A.; Yu, S.; Ren, Z. A Novel Drying-Free Identification Method of Cashmere Textiles by NIR Spectroscopy Combined with an Adaptive Representation Learning Classification Method. Microchemical Journal 2019, 149. [Google Scholar] [CrossRef]
  92. Zhou, J.; Yu, L.; Ding, Q.; Wang, R. Textile Fiber Identification Using Near-Infrared Spectroscopy and Pattern Recognition. Autex Research Journal 2019, 19, 201–209. [Google Scholar] [CrossRef]
  93. Chen, H.; Lin, Z.; Tan, C. Classification of Different Animal Fibers by near Infrared Spectroscopy and Chemometric Models. Microchemical Journal 2019, 144, 489–494. [Google Scholar] [CrossRef]
  94. McGregor, B.A.; Liu, X.; Wang, X.G. Comparisons of the Fourier Transform Infrared Spectra of Cashmere, Guard Hair, Wool and Other Animal Fibres. Journal of the Textile Institute 2018, 109, 813–822. [Google Scholar] [CrossRef]
  95. Zhou, J.; Wang, R.; Wu, X.; Xu, B. Fiber-Content Measurement of Wool–Cashmere Blends Using Near-Infrared Spectroscopy. Appl Spectrosc 2017, 71, 2367–2376. [Google Scholar] [CrossRef]
  96. Wang, C.; Wu, X.; Ding, X. Non-Destructive Identification of Wool Blended Fabrics with near Infrared Spectroscopy Based on Support Vector Machine. Wool Textile Journal 2016, 44, 1–5. [Google Scholar]
  97. Mao, M.-H.; Li, W.-S. Determination of Cashmere and Wool Contents in Textile by near Infrared Spectroscopy. Wool Textile Journal 2014, 42, 41–43. [Google Scholar]
  98. Zoccola, M.; Lu, N.; Mossotti, R.; Innocenti, R.; Montarsolo, A. Identification of Wool, Cashmere, Yak, and Angora Rabbit Fibers and Quantitative Determination of Wool and Cashmere in Blend: A near Infrared Spectroscopy Study. Fibers and Polymers 2013, 14, 1283–1289. [Google Scholar] [CrossRef]
  99. Yuan, H.; Chang, R.-X.; Tian, L.-L.; Song, C.-F.; Yuan, X.-Q.; Li, X.-Y. Study of Nondestructive and Fast Identification of Fabric Fibers Using Near Infrared Spectroscopy. Guang Pu Xue Yu Guang Pu Fen Xi 2010, 30, 1229–1233. [Google Scholar] [CrossRef] [PubMed]
  100. Lv, D.; Yu, C.; Zhao, G.-L. Study on Identification of Cashmere and Wool Using near Infrared Spectroscopy. Journal of Beijing Institute of Clothing Technology (Natural Science Edition) 2010, 30, 29–34. [Google Scholar]
  101. Ciukzak, W. Principles of Near- Infrared Spectroscopy. In Handbook of Near-Infrared Analysis; Burns, D.A., Ciurczak, E.W., Eds.; Marcel Dekker: New York, 1992; pp. 7–11. [Google Scholar]
  102. Zoccola, M.; Mossotti, R.; Innocenti, R.; Loria, D.I.; Rosso, S.; Zanetti, R. Near Infrared Spectroscopy as a Tool for the Determination of Eumelanin in Human Hair. Pigment Cell Res 2004, 17 4, 379–385. [Google Scholar] [CrossRef]
  103. Zoccola, M.; Mossotti, R.; Montarsolo, A.; Patrucco, A.; Innocenti, R. Near Infrared Spectroscopy in the Textile Industry. In Infrared Spectroscopy: Theory, Developments and Applications; Cozzolino, D., Ed.; Nova Science Publishers, 2014; pp. 491–516. ISBN 978-1-62948-523-2. [Google Scholar]
  104. Wu, G.; He, Y. Identification of Varieties of Cashmere by Vis/NIR Spectroscopy Technology Based on PCA-SVM. In Proceedings of the 7th World Congress on Intelligent Control and Automation; 2008; pp. 1548–1552. [Google Scholar]
  105. Anceschi, A.; Zoccola, M.; Mossotti, R.; Bhavsar, P.; Dalla Fontana, G.; Patrucco, A. Identification and Quantitative Determination of Virgin and Recycled Cashmere: A Near-Infrared Spectroscopy Study. ACS Sustain Chem Eng 2022, 10, 738–745. [Google Scholar] [CrossRef]
  106. Rajabinejad, H.; Zoccola, M.; Patrucco, A.; Montarsolo, A.; Rovero, G.; Tonin, C. Physicochemical Properties of Keratin Extracted from Wool by Various Methods. Textile Research Journal 2018, 88, 2415–2424. [Google Scholar] [CrossRef]
  107. Marshall, R.; Zahn, H.; Blankenburg, G. Possible Identification of Specialty Fibers by Electrophoresis. Textile Research Journal 1984, 54, 126–128. [Google Scholar] [CrossRef]
  108. Tucker, D.; Hudson, A.; Laudani, A.; Marshall, R.; Rivett, D. Variation in Goat Fibre Protein. Aust J Agric Res 1989, 40, 675–683. [Google Scholar] [CrossRef]
  109. Kalbé, J.; Kuropka, R.; Meyer-Stork, L.; Souther, S.L.; Höcher, H.; Bernt, H; Riesner, D.; Henco, K. Isolation and Characterization of Hight Molecular Weigt DNA from Hair Shafts of Wool and Fine Animal Hairs Fibres. In Proceedings of the 1st International Symposium on Speciality animal fibers221, Aachen, 26 October 1987; pp. 221–227. [Google Scholar]
  110. Hamlyn, P.F.; Bayliffe, A.; McCarty, B.J.; Nelson, G. Molecular Speciation of Animal Fibres. Journal of the Society of Dyers and Colourist 1998, 114, 78–80. [Google Scholar] [CrossRef]
  111. Kerkhoff, K.; Cescutti, G.; Kruse, L.; Müssig, J. Development of a DNA-Analytical Method for the Identification of Animal Hair Fibers in Textiles. Textile Research Journal 2009, 79, 69–75. [Google Scholar] [CrossRef]
  112. Wang, M.; Ren, L.; Kong, P.; et al. Qualitative Analyzing Method Based on Real-Time Fluorescence Quantitative PCR for Identifying Rabbit Hair. Wool Textile Journal 2015, 55–58. [Google Scholar]
  113. Geng, Q.R. A Duplex Polymerase Chain Reaction Assay for the Identification of Goat Cashmere and Sheep Wool. Mitochondrial DNA A DNA Mapp Seq Anal 2016, 27, 1808–1811. [Google Scholar] [CrossRef] [PubMed]
  114. Geng, R.Q. Species-Specific PCR for the Identification of Goat Cashmere and Sheep Wool. Mol Cell Probes 2015, 29, 39–42. [Google Scholar] [CrossRef] [PubMed]
  115. Tang, M.; Zhang, W.; Zhou, H.; Fei, J.; Yang, J.; lu, W.; Zhang, S.; ye, S.; Wang, X. A Real-Time PCR Method for Quantifying Mixed Cashmere and Wool Based on Hair Mitochondrial DNA. Textile Research Journal 2014, 84, 1612–1621. [Google Scholar] [CrossRef]
  116. Fei, J.; Yang, J.; Zhou, H.; Tang, M.; Lu, W.; Yan, A.; Hou, Y.; Zhang, S. A Novel Method for Identifying Shahtoosh. J Forensic Sci 2014, 59, 723–728. [Google Scholar] [CrossRef]
  117. Fei, J.; Lu, W.M.; Duan, J.Y.; Yang, J.; Zhou, Z.P.; Yu, J. Study on Precision of a DNA Analysis Method for Quantifying Cashmere/Wool Mixture. In Proceedings of the Advanced Materials Research; Trans Tech Publications Ltd, 2013; Vol. 821–822, pp. 243–247. [Google Scholar]
  118. Geng, R.Q.; Yuan, C.; Chen, Y.L. Identification of Goat Cashmere and Sheep Wool by PCR-RFLP Analysis of Mitochondrial 12S RRNA Gene. Mitochondrial DNA 2012, 23, 466–470. [Google Scholar] [CrossRef]
  119. Ji, W.; Bai, L.; Ji, M.; Yang, X. A Method for Quantifying Mixed Goat Cashmere and Sheep Wool. Forensic Sci Int 2011, 208, 139–142. [Google Scholar] [CrossRef]
  120. Nelson, G.; Hamlyn, P.F.; Holden, L. A Species-Specific DNA Probe for Goat Fiber Identification. Textile Research Journal 1992, 62, 590–595. [Google Scholar] [CrossRef]
  121. ISO 18074 Textiles. Identification of some animal fibers by DNA analysis method —Cashmere, wool, yak and their blends.
  122. Azémard, C.; Dufour, E.; Zazzo, A.; Wheeler, J.C.; Goepfert, N.; Marie, A.; Zirah, S. Untangling the Fibre Ball: Proteomic Characterization of South American Camelid Hair Fibres by Untargeted Multivariate Analysis and Molecular Networking. J Proteomics 2021, 231. [Google Scholar] [CrossRef] [PubMed]
  123. Vineis, C.; Tonetti, C.; Sanchez Ramirez, D.O.; Carletto, R.A.; Varesano, A. Validation of UPLC/ESI-MS Method Used for the Identification and Quantification of Wool, Cashmere and Yak Fibres. Journal of the Textile Institute 2017, 108, 2180–2183. [Google Scholar] [CrossRef]
  124. Kim, Y.; Kim, T.; Choi, H.M. Qualitative Identification of Cashmere and Yak Fibers by Protein Fingerprint Analysis Using Matrix-Assisted Laser Desorption/Ionization Time-of-Flight Mass Spectrometry. Ind Eng Chem Res 2013, 52, 5563–5571. [Google Scholar] [CrossRef]
  125. Hollemeyer, K.; Altmeyer, W.; Heinzle, E. Identification and Quantification of Feathers, down, and Hair of Avian and Mammalian Origin Using Matrix-Assisted Laser Desorption/Ionization Time-of-Flight Mass Spectrometry. Anal Chem 2002, 74 23, 5960–5968. [Google Scholar] [CrossRef]
  126. Li, S.; Zhang, Y.; Wang, J.; Yang, Y.; Miao, C.; Guo, Y.; Zhang, Z.; Cao, Q.; Shui, W. Combining Untargeted and Targeted Proteomic Strategies for Discrimination and Quantification of Cashmere Fibers. PLoS One 2016, 11. [Google Scholar] [CrossRef] [PubMed]
  127. Miao, C.; Yang, Y.; Li, S.; Guo, Y.; Shui, W.; Cao, Q. Discrimination and Quantification of Homologous Keratins from Goat and Sheep with Dual Protease Digestion and PRM Assays. J Proteomics 2018, 186, 38–46. [Google Scholar] [CrossRef]
  128. Ohashi, S.; Demura, Y.; Sano, M. Identification of Cashmere Fiber by Using SDS-PAGE and Maldi-Tof Mass Spectrometry. Journal of Fiber Science and Technology 2012, 68, 276–281. [Google Scholar] [CrossRef]
  129. Ohashi, S.; Demura, Y.; Sano, M.; Yoshioka, Y. Quantitative Analysis of Cashmere and Other Animal Hair Fibers in Textiles Using MALDI-TOF Mass Spectrometry. Journal of Fiber Science and Technology 2014, 114–120. [Google Scholar] [CrossRef]
  130. Gong, Y.; Zhang, J.; Zhou, Y.; Wang, Y. Study of the Principle of Time of Flight Mass Spectrometry for the Identification of Cashmere and Wool Fiber Protein. Wool Textile Journal 2016, 44, 21–24. [Google Scholar]
  131. Izuchi, Y.; Tokuhara, M.; Takashima, T.; Kuramoto, K. Peptide Profiling Using Matrix-Assisted Laser Desorption/Ionization-Time-of-Flight Mass Spectrometry for Identification of Animal Fibers. Mass Spectrometry 2013, 2, A0023–A0023. [Google Scholar] [CrossRef]
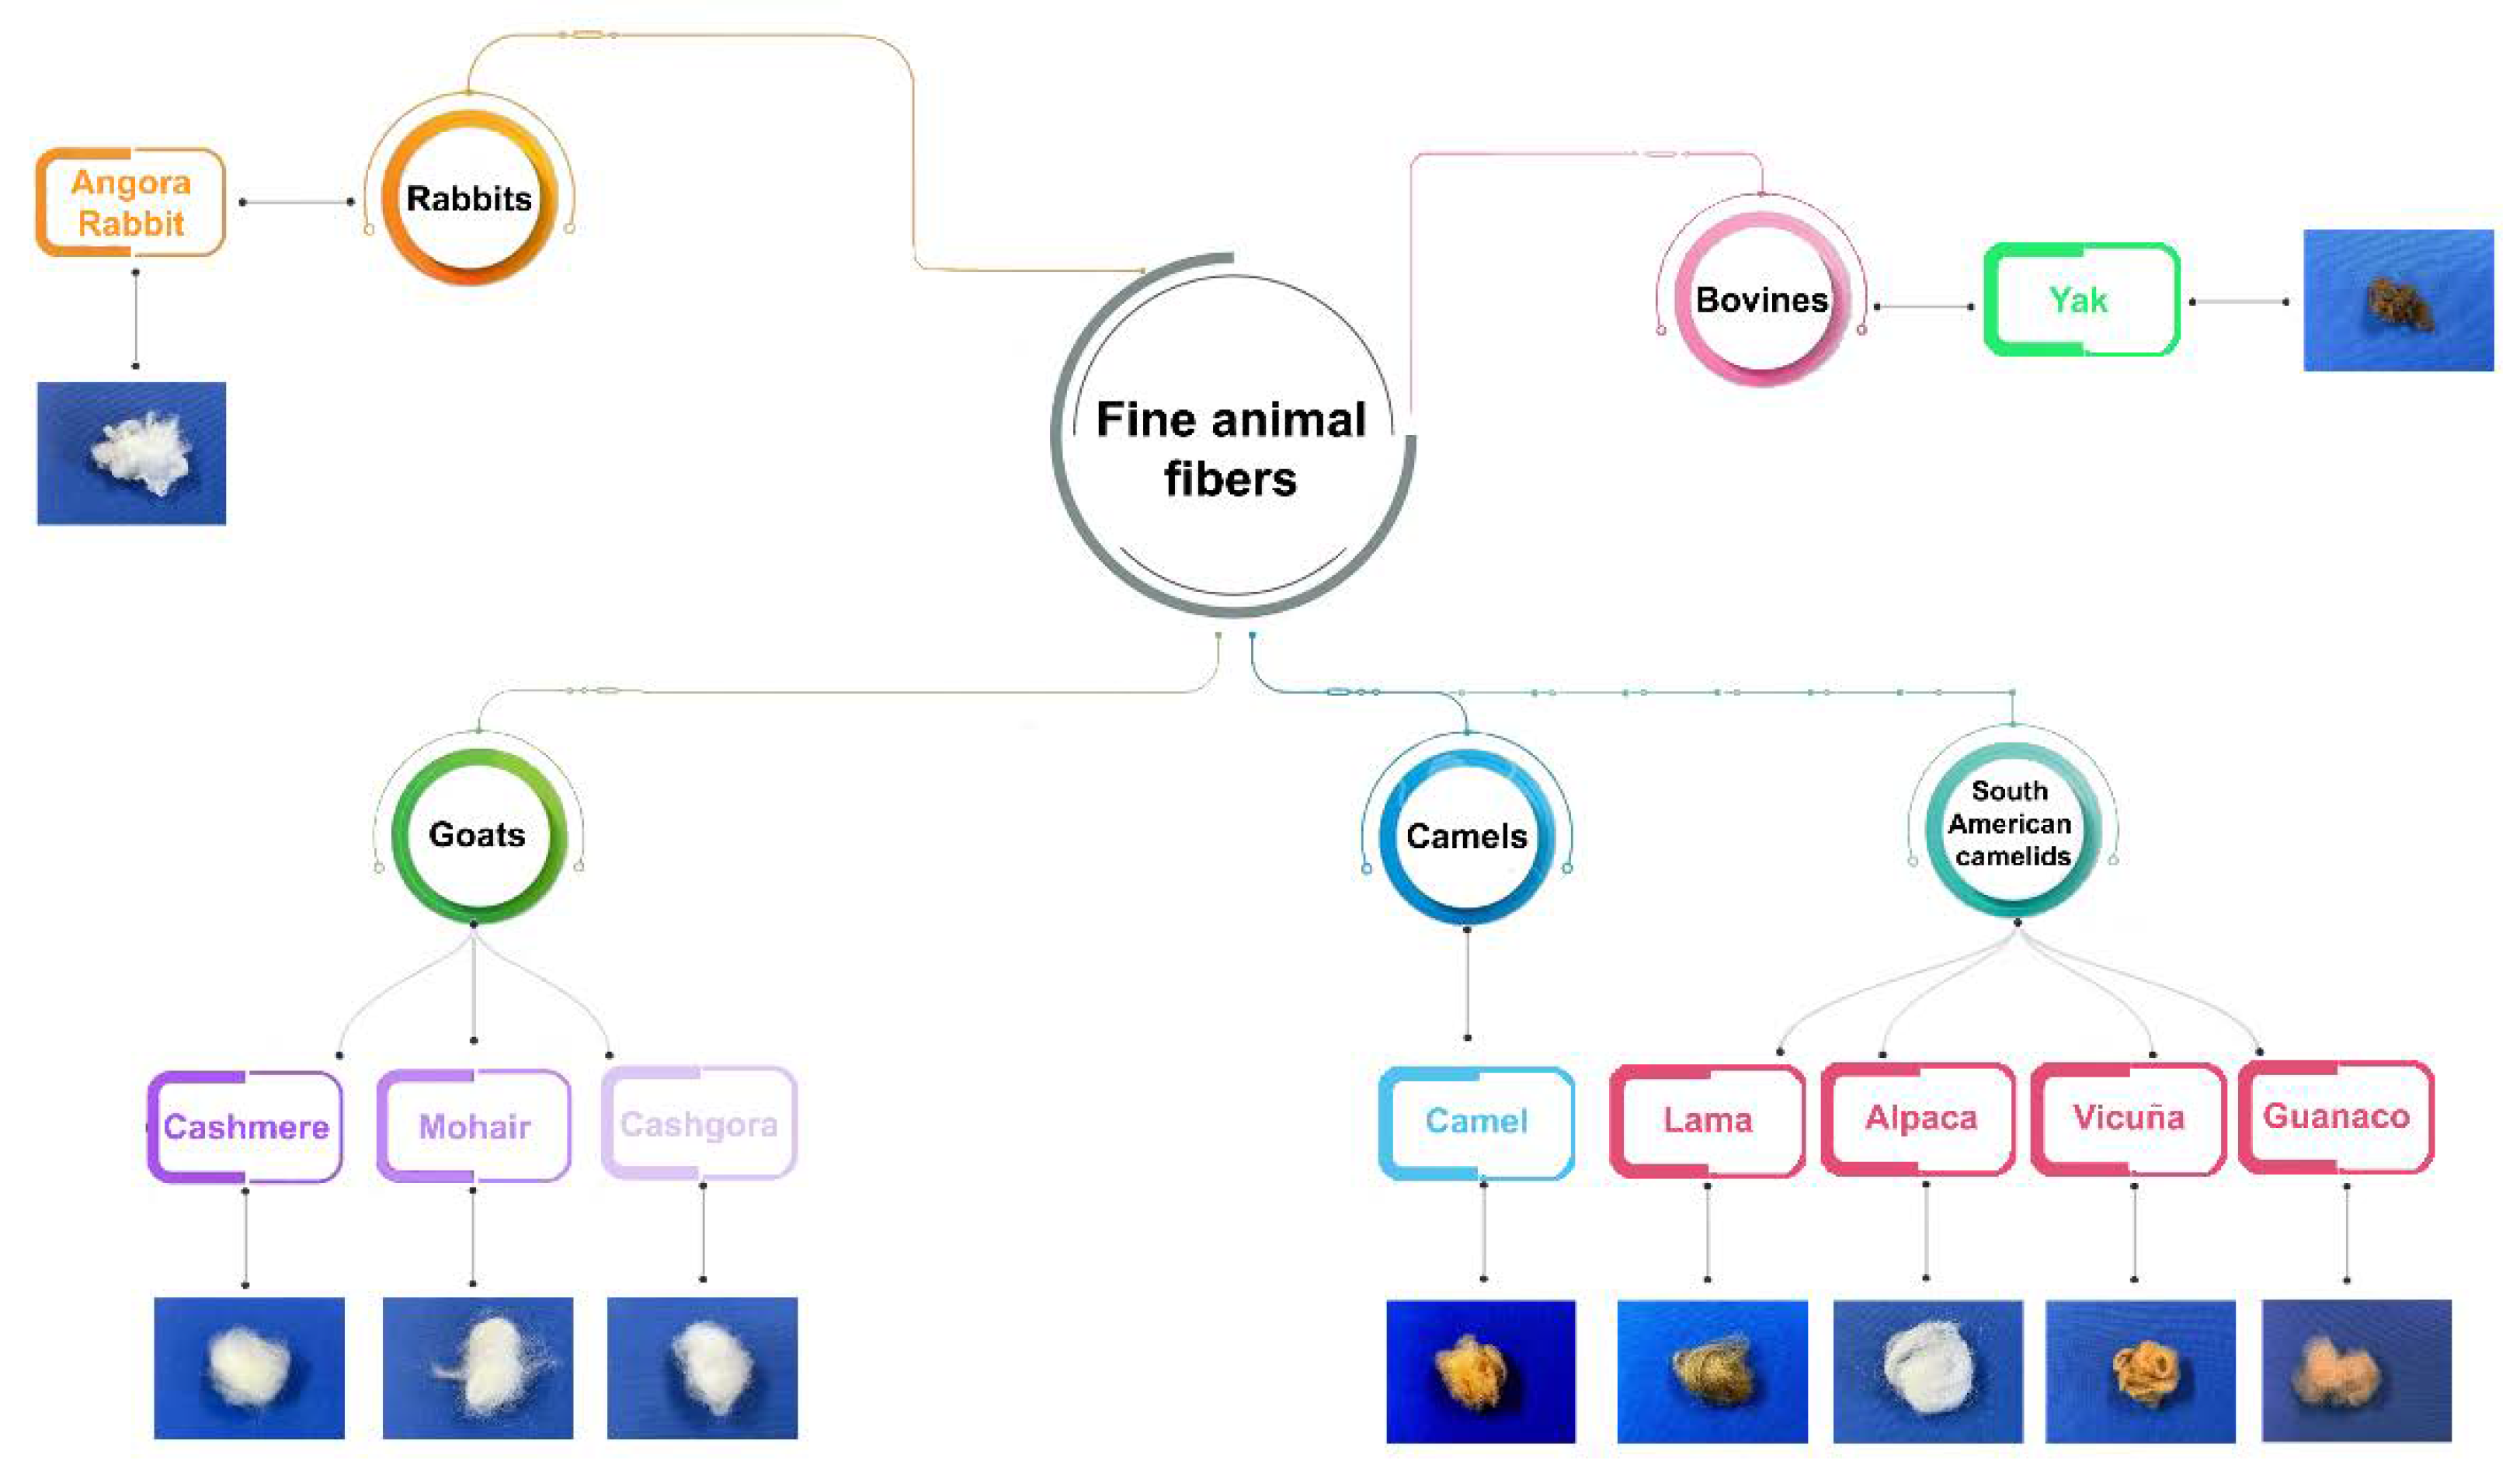
Figure 1. Fine animal fibers.
Preprints 72951 g001
Figure 2. Analytical methods for wool and fine animal fibers identification.
Preprints 72951 g002
Figure 3. Example of a scale from a) wool and b) cashmere (3000x).
Preprints 72951 g003
Figure 4. LM pictures (200x) of wool and fine animal fibers a) wool b) cashmere c) pigmented cashmere d) mohair e) cashgora, f) camel, g) vicuña, h) guanaco, i) lama, l) alpaca, m) yak, n) angora rabbit.
Preprints 72951 g004
Figure 5. SEM pictures (1000x) of wool and fine animal fibers a) wool b) cashmere c) pigmented cashmere d) mohair e) cashgora, f) camel, g) vicuña, h) guanaco, i) lama, l) alpaca, m) yak, n) angora rabbit.
Preprints 72951 g005
Figure 6. DSC traces of wool, cashmere, mohair and vicuña fibers (left) a detail from DSC traces (right).
Preprints 72951 g006
Figure 7. NIR spectra of samples from (a) angora rabbit, (b) white cashmere, (c) wool, (d) pigmented cashmere, and (e) pigmented yak fibers.
Preprints 72951 g007
Figure 8. Electrophoretic separation patterns (SDS-PAGE) sample. Lane a: MW standard; lane b: wool; lane c: guanaco; lane d: vicuña; lane e: lama; lane f: alpaca; lane g: camel; lane h: MW standard.
Preprints 72951 g008
Table 1. Fine animal fibers: main breading countries or areas and characteristics.
Fiber Main breeding countries Coat or undercoat Finess Natural color Reference
cashmere China, Mongolia, Afghanistan and Iran undercoat 15–19 μm white, gray and brown [11]
mohair South Africa and the U.S.A. coat not so fine white and glossy [12]
cashgora Australia and New Zealand coat 18 to 23 μm white [13]
camel China, Mongolia, Iran, Afghanistan, Russia, New Zealand and Australia undercoat fine golden tan [11]
lama South America coat 10-44 μm various colors, sometimes brown [14,15,16]
alpaca South
America
coat 20 -40 μm Grey, fawn white, black, cafe ́, etc [14,15,16]
vicuña Perù, Bolivia and Argentina undercoat 13-14 μm from golden to cinnamon [14,15]
guanaco South America undercoat fine light brown [14,15]
yak China, Afghanistan, Nepal, and other Asian countries undercoat 15-20 μm dark brown [17]
angora China coat fine white [18]
Table 2. Wool and fine animal fibers morphological characteristics.
Fiber Cuticular cells thickness Cuticular cells morphology Medulla Pigments Reference
wool ≥ 0.6 µm cuticular cells quite close along the fiber axis absent in fine wool usually absent [24,25,26]
cashmere ≤ 0.5 µm distant and smooth cuticular cells margins usually absent sparsely distributed when present [10,23,27]
mohair ≤ 0.5 µm distant cuticular cells margins absent absent [26]
cashgora ≤ 0.5 µm distant cuticular cells margins absent absent [28]
camel ≤ 0.5 µm high cuticular cell margins slope usually absent present [12]
lama ≤ 0.5 µm smooth cuticular cells margins fragmental medulla present [12]
alpaca ≤ 0.5 µm smooth cuticular cells margins fragmental medulla present [12]
vicuña ≤ 0.5 µm smooth cuticular cells margins fragmental medulla present [12]
guanaco ≤ 0.5 µm smooth cuticular cells margins fragmental medulla present [12]
yak ≤ 0.5 µm distant and smooth cuticular cells margins usually absent distributed in string [28]
angora ≤ 0.5 µm chevron cuticular cells patterns Ladder type of medulla absent [12]
Table 3. Literature overview for animal fibers identification and quantification by imaging analysis.
Animal fibers Accuracy (%) Fiber processsing stage Imaging type References Year
wool, cashmere 94.39 fiber SEM [35] 2023
wool, cashmere 98.95 fiber SEM [36] 2022
wool, cashmere up to 91 fiber SEM and LM [37] 2022
wool, cashmere 95.2 fiber SEM [38] 2022
wool, cashmere 96.67 fiber LM [39] 2022
wool, cashmere,
yellow wool, goat hair
99.15 fiber LM [40] 2022
wool, cashmere 90 fiber SEM [41] 2021
wool, cashmere 98.7 fiber LM [42] 2021
wool, cashmere 97.1 fiber SEM [43] 2021
wool, cashmere up to 90 fiber LM [44] 2021
wool, cashmere 97.1 fiber LM [45] 2021
wool, cashmere 93.33 fiber SEM [46] 2021
wool, cashmere 94.2 fiber LM [47] 2020
wool, mohair 99.8 fiber LM [48] 2020
wool, cashmere and wool cashmere blends recognition highter than 93 fiber SEM [49] 2019
wool, cashmere 94.29 fiber LM [50] 2019
wool, cashmere 90.07 fiber LM [51] 2019
wool, cashmere 95.25 fiber LM [52] 2019
wool, cashmere 92.5 fiber LM [53] 2019
wool, cashmere 96 fiber SEM [54] 2019
wool, cashmere and wool cashmere blends around 90 fiber LM [55] 2019
wool, cashmere and wool cashmere blends 97.47 fiber LM [56] 2019
wool, cashmere and wool cashmere blends more than 90 fiber from top LM [57] 2018
wool, cashmere
and wool cashmere blends
up to 95.2 fiber LM [58] 2018
wool, cashmere 90 fiber LM [59] 2018
wool cashmere blends around 90 fiber from top LM [60] 2017
wool, cashmere 81.17 fiber LM [61] 2015
wool, cashmere 87.35 fiber LM [62] 2014
wool, cashmere above 83 fiber SEM [63] 2012
wool, cashmere over 92 fiber xxxxxxx [64] 2011
wool, cashmere higher than 93 fiber LM [65] 2011
wool, cashmere and stretch wool, cashmere 99 and 81.06 fiber xxxxxxx [66] 2010
wool, cashmere xxxxxxx fiber SEM [67] 2010
wool, cashmere blends xxxxxxx yarn LM [68] 2010
wool, cashmere until 98.75 fiber LM [69] 2008
wool, mohair xxxxxxx fiber LM [70] 2002
wool, mohair 88 fiber LM [71] 2001
wool, cashmere until 97.5 fiber SEM [72] 2000
wool, cashmere xxxxxxx fiber SEM [73] 1997
Table 4. Literature overview for animal fibers identification and quantification by spectroscopies. Abbreviations: PET: polyethylene terephthalate, PLA: polylactic acid; PP: polypropylene; PA: polyamide, PU: polyurethane, RMSEP: root mean standard error of prediction; SEP: standard error of prediction.
Fibers Analytical
method
Identification or quantification Accuracy Fiber processing stage References Year
wool, mohair raman spectroscopy
and ratiometric analysis
identification xxxxxxx fiber [89] 2022
shahtoosh, cashmere, angora rabbit FTIR and chemometry identification 100% xxxxxxx [90] 2022
wool, cashmere, wool/cashmere blend NIR spectroscopy identification 93.33% for cashmere and 96.60 for cashmere wool blend textiles from market [91] 2019
cotton, tencel, wool, cashmere, PET, PLA, PP NIR spectroscopy identification 100% identification fiber sliver by carding [92] 2019
wool, cashmere, rabbit, camel NIR spectroscopy identification 100% sensitivity and 100% specificity fiber [93] 2019
wool, cashmere, qiviut, bison, vicuña FTIR identification xxxxxxx fiber [94] 2018
wool cashmere blends NIR spectroscopy quantification SEP of cashmere content 0.5% fiber [95] 2017
wool/cotton, wool/mohair, wool/spandex, wool/silk
and wool/cashmere blends
NIR spectroscopy blend identification from 100% to 85% fabric [96] 2016
wool cashmere blend NIR spectroscopy quantification RMSEP: 2.8% fiber [97] 2014
wool, cashmere, yak, angora rabbit and wool cashmere blends NIR spectroscopy identification and quantification percentages of recognition and rejection of 98-100%.
SEP: 13.10 for wool/cashmere blend
combed sliver [98] 2013
wool, cashmere,PET, PA, PU, silk,
flax, linen, cotton, viscose, cotton-flax blending, PET-cotton blending, and wool-cashmere blending
NIR spectroscopy identification 100% discrimination between wool and cashmere fiber, yarn, fabric [99] 2010
wool, cashmere and wool/ cashmere blend NIR spectroscopy identification and quantification SEP: 1.2061 fiber [100] 2010
Table 5. Literature overview for animal fibers identification and quantification by DNA analysis.
Animal fiber Identification or quantification Accuracy Fiber processing stage References Year
wool/cashmere blend quantification results of DNA analysis and LM in fabrics were quite close fiber, yarn, dyed and finished fabrics [31] 2015
rabbit, wool, cashmere, yak, alpaca, duck down identification of rabbit good accuracy fiber [112] 2015
wool/cashmere blend identification minimum amount of wool detectable in cashmere 9.09% fiber [113] 2015
wool, cashmere identification minimum amount of wool detectable in cashmere 11.1% fiber [114] 2015
wool, cashmere quantification in blend xxxxxxx fiber and fabric [115] 2014
shahtoosh, cashmere identification minimum amount of shahtooosh detectable in cashmere:1% fiber and processed product [116] 2014
wool, cashmere and wool/cashmere blend identification and quantification in blend more precise and accurate than traditional microscopic examination fabric [117] 2013
wool, cashmere identification and quantification in blend minimum amount of wool detectable in cashmere and viceversa: 11.1% fiber [118] 2012
wool, cashmere and wool/cashmere blend identification and quantification in blend minimum amount of wool detectable in cashmere: 1% fiber [119] 2011
cashmere/cashgora,fine wool, yak and camel identification and quantification in blend detection limit about 3% for fine wool/cashmere and yak/cashmere blend untreated and treated (dyed, bleached) samples [111] 2009
wool and goat ( cashmere, cashgora, mohair) distinguishing between sheep and goat fiber xxxxxxxx fiber [120] 1992
Table 6. Literature overview for animal fibers identification and quantification by proteomic analysis. Abbreviations: RMSE: root mean squared error.
Animal fibers Protein extraction Peptide production Analytical method Identification or quantification Accuracy Fiber processing stage References Year
cashmere, shahtoosh DTT sds page and trypsin Maldi TOF-MS quantification minimum amount of shahtoosh detectable in cashmere:5% raw fiber and fabric [7] 2022
vicuña, alpaca, guanaco, lama DTT trypsin UHPLC MS/MS and chemometry Identification of guanaco, vicuña, alpaca 100% discrimination guanaco, vicuña, alpaca fiber and ancient textiles [122] 2021
wool, goat, cattle, camel, human hair DTT trypsin UHPLC-MS ESI-Q-TOF species-specific marker list improvement xxxxxxx ancient raw fibers and ancient textiles [5] 2019
wool, cashmere DTT trypsin, trypsin-chymotrypsin,
trypsin- GLU-C
NanoLC MS/MS selection of species unique peptides xxxxxxx raw fibers and commercial textiles (for verification) [127] 2018
wool, cashmere, yak DTT trypsin UPLC/ESI-MS quantification average errors from -3%/-6% to 3%/7% depending on the fiber fiber, sliver, yarn, fabric [123] 2017
wool, cashmere DTT trypsin MALDI-TOF MS marker identification xxxxxxx fiber [130] 2016
wool, cashmere, yak DTT trypsin nanoLC MS/MS triple TOF marker identification, fiber identification and quantification cashmere percentages are in good agreement with LM results fiber and fabric [126] 2016
wool, cashmere, yak DTT sds page and trypsin MALDI TOF/MS MS quantification in blend very good linearity between the composition
and the peak area ratio
fiber and textile [129] 2014
cashmere, wool, mohair, yak, camel, angora, alpaca DTT trypsin MALDI-TOF MS and chemometric identification RMSE 0.365 for pure fiber
RMSE 0.471 for blend
untreated and treated fibers and 50/50 blend [131] 2013
cashmere, yak mercaptoethanol trypsin MALDI TOF MS identification xxxxxxx fiber and fabric [124] 2013
wool, cashmere, yak DTT trypsin UPLC/ESI MS
UPLC/ESI MS MS
identification and quantification in blend limit of detection: 5% raw, bleached, depigmented, dyed fiber [32] 2013
wool, cashmere, yak DTT sds page and trypsin MALDI-TOF MS specific marker identification for keratin I xxxxxxx fiber [128] 2012
wool, yak, human, rabbit, dog, mohair, mink, fox mercaptoethanol trypsin MALDI-TOF MS Identification and quantification xxxxxxx raw, dyed, bleached fibers [125] 2002
Disclaimer/Publisher’s Note: The statements, opinions and data contained in all publications are solely those of the individual author(s) and contributor(s) and not of MDPI and/or the editor(s). MDPI and/or the editor(s) disclaim responsibility for any injury to people or property resulting from any ideas, methods, instructions or products referred to in the content.
Copyright: This open access article is published under a Creative Commons CC BY 4.0 license, which permit the free download, distribution, and reuse, provided that the author and preprint are cited in any reuse.
Prerpints.org logo

Preprints.org is a free preprint server supported by MDPI in Basel, Switzerland.

Subscribe

© 2024 MDPI (Basel, Switzerland) unless otherwise stated