

Submitted:
05 May 2023
Posted:
08 May 2023
You are already at the latest version
Abstract
Introduction: The relation between physical well-being and chronic pain is complex and involves several subjective and objective covariates. We aimed to assess the role of media-tor, confounder, or interactor played by covariates, including sleep quality, physical activity, perceived stress, smoking, and alcohol drinking in the relation between physical well-being and chronic pain.
Method: We used Poisson regression to obtain incidence rate ratios (IRR) of the associa-tion between physical well-being and chronic pain in a cohort study carried out among uni-versity students. We applied General Structural Equation Modeling (GSEM) to assess me-diation, and stratum-specific analysis to distinguish confounding from interaction. We computed Relative Excess Risks due to Interaction (RERI), Attributable Proportion (AP), and Synergy index (S) to measure additive interaction.
Results: High physical well-being is related to a large decrease in the risk of chronic pain (IRRTotal Effect= 0.58; 95%CI 0.50-0.81). Perceived stress mediates 12.5% of the total effect of physical well-being on chronic pain. The stratum-specific IRRs of current smokers and non-current smokers were different from each other and were larger than the crude IRR (IRR=1.49; 95% CI: 1.24-1.80), which indicates that smoking could be both confounder and interactor. Interaction analyses showed that physical activity could act as a potential interactor (RERI=0.25; 95% CI: 0.13, 0.60).
Conclusion: Perceived stress is an important mediator of the relation between physical well-being and chronic pain, while smoking is both a confounder and an interactor. Our findings may prove useful in distinguishing high-risk from low-risk groups, in the interven-tions aimed at reducing chronic pain.
Keywords:
Chronic pain
; confounding
; interaction analysis
; mediation analysis
; physical well-being
1. Introduction
Chronic pain is a psychophysiological perception in which somatosensory inputs convert into the physiological, cognitive, affective, and functional responses identified as chronic pain (Garland, 2012). Pain is usually considered a symptom or indicator of underlying diseases. However, due to its notable influence on the quality of life and its economic burden, chronic pain has been defined in the last decades as an illness “in its own right” (Niv and Devor, 2004). Chronic pain is the most prevalent chronic health problem in the world population (Fayaz et al., 2016). Globally, one in every nine young adults suffers from it (Murray et al., 2021) and out of 139 million disability-adjusted life years (DALY) accounted for musculoskeletal disorders, 65 million are due to low back pain (GBD, 2018).
It has been estimated that 37% of adolescents suffer from chronic pain in Spain (Huguet and Miró, 2008). Furthermore, the Spanish National Health Survey showed that chronic back pain alone had a prevalence of almost 24% in the general Spanish population and that this prevalence is higher (30%) in Galicia, the region in which the present study was carried out (Instituto Nacional de Estadística, 2020a).
Galicia has the highest relative humidity of all Spanish regions and presents lower barometric pressure than other regions (Orosa et al., 2014). This climate characteristic was suggested as an important factor of the high frequency of chronic pain (Fagerlund et al., 2019). Furthermore, Galicia was found to be the region with the lowest well-being values in Spain (Instituto Nacional de Estadística, 2020b). The average frequency of self-perceived poor health in Spain has been reported to be 33.6%, while the highest frequency was in Galicia with 45.7% (Henares Montiel et al., 2020).
Physical well-being is a multidimensional concept that encompasses physical, mental, social, cultural, and cognitive dimensions (WHOQOL, 1995). Physical well-being and chronic pain represent interrelated multidimensional concepts with a highly subjective components (Fillingim, 2017; Niv and Kreitler, 2001). The relation between physical well-being with chronic pain is not straightforward. For instance, it is remarkable that patients with impairments or diseases do not necessarily report poor physical well-being (Calman, 1984).
The relation of well-being with chronic pain is either mediated by factors in the causal pathway (indirect effect) or unmediated (direct effect). Other factors may also play the role of confounders of the relation between well-being and pain. To be a confounder, a variable should associate with both exposure and outcome and distort the association between them (VanderWeele, 2012). Modern epidemiology shows that, to be a mediator, a variable should be in the pathways between exposure and outcome and account for their association, either partially or entirely (Hafeman and Schwartz, 2009). Furthermore, interaction occurs when two factors collaborate to produce an outcome, i.e., when the presence of any of them influences the effect of the other. Improving knowledge about the joint effects of covariates with physical well-being in causing chronic pain aids in identifying high-risk subgroups.
To assess the role of mediator, confounder, or interactor played by the variables sleep quality, physical activity, perceived stress, smoking, and alcohol drinking in the relationship between physical well-being and chronic pain, we analyzed the data of a prospective cohort study carried out in Spain. Assessing the causal role of each covariate will provide insight into the high prevalence and incidence of chronic pain in Galicia.
2. Method
2.1. Study sample and procedure
The Pain Study Online is a web-based follow-up study aiming to identify risk factors for chronic pain in a young population.
In 2019 two thousand students of a Galician university were invited to complete a baseline questionnaire on demographic, behavioral, medical, and nutritional aspects, as well as pain measurements. The sample size of the study was estimated using the instructions of Wang and Ji (Wang and Ji, 2020) with power = 80%, type 1 error rate = 0.05, the expected probability of chronic pain in the unexposed group = 0.30, the ratio of unexposed to exposed = 3, and the Incidence Rate Ratio (IRR) to be detected = 1.5. Assuming a dropout proportion of 0.2, the total sample size necessary was 948.
The exposure and covariates were collected at baseline, and pain episodes were detected using a questionnaire sent every four months during a one-year follow-up.
The University of Santiago de Compostela institutional review board approved this study (reference BT-RDC-2017-01). Informed consent was obtained from each participant before starting the study.
2.2. Outcome definition
The outcome was defined, using the International Association for the Study of Pain (IASP) definition (Treede et al., 2019), as pain at any part of the body that lasts more than three months, and was assessed by the question: “In the past four months, did you have pain that lasted for more than three months?”. If the answer was “yes” participants had to specify which part of their body was concerned with chronic pain, and then answer the Short-Form McGill Pain Questionnaire 2 (SF-MPQ-2), validated in Spain, in order to describe the characteristics of the pain.
2.3. Exposure definition
Information on physical well-being, the exposure variable of this study, was obtained from the short-form 12-item health survey (SF-12) validated in the Spanish population (Vilagut et al., 2008). This survey evaluates two components, mental and physical, of the Health-Related Quality of Life (HRQoL) (Vilagut et al., 2008; Ware et al., 1996). It generates a score between 0 and 100, calculated through algorithms and recommended coefficients, with higher scores indicating better well-being (Ware et al., 2002). For our purpose, we subsequently transformed the calculated scores into a binary variable: lower/higher than the median score.
2.4. Covariate definition
Demographic characteristics (age and sex) and lifestyle habits were collected at baseline using a self-administered and validated questionnaire.
Smoking status was divided into three categories: current smokers (subjects who smoked more than one cigarette per week in the past six months), former smokers (subjects who previously smoked at least one cigarette per week but had quit more than six months ago), and non-smokers (subjects who have not smoked any cigarette). In our analysis, for practical reasons, we combined non-smokers and former smokers into one binary variable with the categories: “non-current smokers” and “current smokers”.
Alcohol consumption information was collected from a food frequency questionnaire (Vázquez et al., 2012) and was categorized, based on the Centres for Disease Control and Prevention guidelines, into abstainer/low-drinkers (subjects who either report no alcohol consumption or drank less than once a day for women and twice or less than twice a day for men) and moderate drinkers (subjects who drank alcohol once a day for women and twice a day for men). Subjects with an intake higher than moderate were exceptional in our population (10 subjects only) and, therefore, were excluded from the analysis.
A score of physical activity was obtained using the short form of the International Physical Activity Questionnaires (IPAQ-SF) to define two groups, low and high activity, based on pre-established algorithms (Rodríguez-Muñoz et al., 2017).
Sleep quality was assessed using the Pittsburgh Sleep Quality Index (PSQI). The calculated scores, ranging from 0 to 21, with lower scores indicating higher sleep quality, were divided into two categories, using the cut-off value of 6, the median score of the sample (Hita-Contreras et al., 2014).
Perceived stress was considered a dichotomous variable, using the cut-off value of 8, the median score obtained from the Perceived Stress Scale questionnaire (PSS-4) (Vallejo et al., 2018). Higher scores indicate more perceived stress.
All questionnaires were previously validated in the Spanish population and the baseline questionnaire was pilot-tested in the study population before the study initiation. Those individuals who participated in the pilot test did not form part of the cohort study.
2.5. Measures of association
Person-time was calculated as the time elapsed from the date of filling out the baseline questionnaire until the onset of a chronic pain episode, loss to follow-up, or end of the study, whichever appeared first. Cases of chronic pain were allocated half of the period between the last follow-up and the onset of the episode, assuming constant incidence during that period.
To examine the relation between physical well-being and chronic pain occurrence, incidence rate ratios (IRR) and their 95% confidence intervals (95% CI) were estimated by Poisson regression.
We used Directed acyclic graphs (DAGs) to represent our hypothesis and assumptions regarding the causal relationship between physical well-being and chronic pain (Figure 1). Two types of covariates that are considered in our models are confounders (variables that shared causes of the exposure and outcome), and mediators (variables that transmit some of the effect of interest through an indirect pathway). Colliders (variables that are caused by the outcome and the exposure) were not considered further due to the longitudinal design of our study that forces exposure and covariates to precede outcome. We also represented interaction covariates (also known as interactors or moderators), which are variables that interact with exposure to affect the outcome. Since DAGs are nonparametric representations, interactors/moderators are depicted in the same way as confounders. However we distinguished the interactors from confounders when we translated the DAG into a statistical model, using stratum-specific analysis (0).
2.6. Mediation analysis
We used General Structural Equation Modeling (GSEM) to test whether the potential mediators (physical activity, perceived stress, sleep quality, smoking status, and alcohol consumption) may represent indirect causal paths between physical well-being (main exposure) and chronic pain (Figure 1). We first estimated the model parameters and causal effects, including Natural Direct Effect (NDE), Natural Indirect Effect (NIE), and Total Effect (TE): The indirect effects were generated by multiplying the estimated regression coefficient of physical well-being on each mediator by the regression coefficient of each mediator on chronic pain (VanderWeele and Vansteelandt, 2014). The direct effects were generated by the regressions of the association between physical well-being and pain perception. Finally, the total effects comprised a sum of direct and indirect effects captured in the GSEM analysis (Baron and Kenny, 1986). We calculated the proportion mediated as (IRRNDE × [IRRNIE − 1])/(IRRNDE × IRRNIE − 1).
2.7. Stratum-specific analysis
In order to distinguish confounding from interaction (Figure 1b), we measured the relation between physical well-being and pain in the different strata of each covariate separately (perceived stress, smoking, alcohol consumption, and sleep quality). If the crude overall estimate and the stratum-specific estimates were similar, the covariate was considered neither a confounder nor an interactor. If the stratum-specific measures of association were similar to each other, but differed from the overall crude estimate by 10% or more (Greenland, 1996), we considered this covariate as a confounder. If the stratum-specific estimates differ from each other, we consider this covariate as an interactor. There is both confounding and interaction if 1) the stratum-specific estimates vary from each other and both have higher or lower values than the crude estimate, or 2) the stratum-specific estimates differ from each other, and the crude estimate is between the two stratum-specific estimates. In the latter case, we adjusted the Poisson regression estimate for the covariate to find out whether the adjusted estimate differs in more than 10% from the crude estimate. Those covariates that changed crude IRR estimates by more than 10% were considered both confounders and interactors. If the crude estimate did not differ by more than 10%, we considered the covariate to be only an interactor.
2.8. Interaction analysis
After performing the stratum-specific analysis and deciding on the confounding and interactional nature of the covariates, we performed an additive interaction analysis for the variables that were not potentially eligible as confounders of the association between physical well-being and chronic pain.
Additive interaction analyses between physical well-being and each covariate were performed to measure the joint effects of the combination of two potential risk factors (Rothman et al., 2008). For each physical well-being–covariate relation, we computed the adjusted Relative Excess Risk due to Interaction (RERI), also named Interaction Contrast Ratio (ICR), the Attributable Proportion (AP), and the Synergy index (S) along with their 95% CIs (Rothman et al., 2008; Knol et al., 2011).
RERI is interpreted as the additional risk due to interaction added to the expected total risk by summing each exposure’s risks separately. The AP is interpreted as the proportion of the outcome due to the interaction of both exposures. Accordingly, a RERI and AP > 0 imply a deviation from additivity and provide evidence that the exposure and the covariate may have a joint effect in causing the outcome (de Mutsert et al., 2009). The low-risk groups were considered as the reference category. However, since moderate alcohol consumption is known to exert analgesic effects (Karimi et al., 2022), in this study, we considered moderate alcohol consumption as the reference category. The joint effect analyses were adjusted for age and sex. We used Poisson regression to estimate IRRs of chronic pain and their 95% CIs for interaction analysis.
All the analyses were conducted on multiply imputed data. In this study, to generate more precise estimates, we imputed the missing data first and then performed the analysis and bootstrapping as explained hereafter (Bartlett and Hughes, 2020). Ten imputed data sets were generated via Multiple Imputation by Chained Equations (MICE), and a fitted conditional imputation model was obtained for each variable used for imputation. The analysis was replicated for each multiply-imputed data set, and the estimates were pooled from the ten imputed data sets (White et al., 2011). We used bootstrap resampling to calculate the mean point estimate for the parameters by repeating the mediation analysis across 1000 bootstrapped data sets (Efron and Tibshirani, 1994). Bias-corrected and accelerated 95% CIs were calculated to assess skewness in the confidence interval obtained from mediation analysis (Mackinnon et al., 2004).
All analyses were performed with STATA/MP software version 15.1 (Stata Corp LLC, Tx, USA).
3. Results
3.1. Characteristics of the study population
One thousand eight hundred and forty-two students completed the baseline questionnaire. After excluding participants aged >50, those who did not provide any ID or were duplicated, and subjects who reported pain at baseline, a total of 1,024 students were free of pain at the beginning of the study and were then enrolled in the follow-up (Figure 2). Seventy-three were lost to follow-up, and 951 were finally included in the analysis. During the follow-up, we identified 584 new pain cases, with a total of 160.4 years at risk, which yielded an overall incidence rate of 3.6 year−1.
Table 1 presents the study population’s descriptive results by physical well-being status for all variables. The mean score of physical well-being was 55.63 (SD: 5.44), and the population was evenly distributed across sex and age groups, with a mean age of 25.29 ± 5.7 and 24.31 ± 6.3 years for men and women, respectively. In addition, the baseline physical well-being scores were similar in women and men (mean = 55.7 and 55.1, respectively).
3.2. Mediation analysis
Mediation analysis was conducted separately for all potential mediators. Figure 1a displays our hypothesized relations, and the estimated total causal effect, as well as the direct and indirect effects of physical well-being on chronic pain, are shown in Table 2.
The GSEM analysis revealed that, compared to low physical well-being, high physical well-being is related to a large decrease in the risk of chronic pain (IRRTotal Effect = 0.58; 95%CI 0.50-0.81), and that the indirect effect of perceived stress of that relation was IRRNatural Indirect Effect = 0.92; 95%CI 0.89-1.00. Perceived stress mediates 12.5% of the total effect of physical well-being on chronic pain (Table 2). Other potential mediators, including physical activity, smoking, drinking, and sleep quality showed a 6.4%, 4.8%, and 3.4% mediation proportion of the association between physical well-being and chronic pain.
3.3. Stratum-specific analysis
Table 3 shows the results of the stratum-specific analysis. The crude estimate value (IRR = 1.49; 95% CI: 1.24-1.80) was between the low physical activity value (IRR = 1.76; 95% CI: 1.28-2.36) and the high physical activity value (IRR = 1.20; 95% CI: 1.06-1.45), and the adjusted estimate did not change the crude estimate by more than 10% (IRR = 1.51; 95% CI: 1.20-1.90), indicating that the physical activity could be an interactor but not a confounder. We observed the same pattern for perceived stress and alcohol drinking. However, the stratum-specific IRRs of smokers (IRR = 1.80; 95% CI: 1.05-2.81) and non-smokers (IRR = 1.52; 95% CI: 1.35-1.62) were different from each other and both were larger than the crude estimate, which indicates that smoking can be both a confounder and an interactor in the association between physical well-being and chronic pain. The IRR of the association between physical well-being and chronic pain changed slightly less than 10% when it was adjusted for smoking (IRR = 1.59; 95% CI: 1.39-1.62), which favors the explanation that smoking is not a strong confounder of this association. Furthermore, the magnitude of the association between physical well-being and chronic pain in low sleep quality (IRR = 1.54, 95% CI: 1.01-2.26) is not different from that in high sleep quality (IRR = 1.52, 95% CI: 0.97-2.20). The crude estimate of this association and the stratum-specific estimates are similar, indicating that sleep quality is neither a confounder nor an interactor in the association between physical well-being and chronic pain.
3.4. Interaction analysis
Interaction analyses (Table 4) showed that the RERI of physical well-being and physical activity on pain was 0.25 (95% CI: 0.13-0.60), which indicates that the joint effect on the additive scale of physical activity and physical well-being together was greater than the sum of the effects of physical activity alone and physical well-being alone. Also, we found that low physical well-being, when it is present together with no alcohol consumption, shows an excess risk of pain (RERI = 0.11; 95% CI: 0.06-0.36).
The interaction results did not show any indication of departure from additivity of effects in other covariates. AP and synergy index gave results that were consistent with those shown by RERI.
4. Discussion
Although previous research discussed the relation between biopsychosocial and lifestyle factors and chronic pain (Heneweer et al., 2011; Lindell and Grimby-Ekman, 2022; Mills et al., 2019; Shiri et al., 2010; van Hecke et al., 2013; Zale et al., 2015), to our knowledge, this is the first longitudinal study of chronic pain incidence among students in a high prevalence region that examines the potential mediators, interactors, and confounders.
The high incidence of chronic pain found in this study is compatible with that forecasted by national reports for the Galician region (Instituto Nacional de Estadística, 2020 a). As mentioned before, Galicia is an extremely humid region with low barometric pressure, a characteristic that some authors have linked with a high frequency of chronic pain (Fagerlund et al., 2019). Some animal studies have shown that lower pressure might stimulate the sympathetic nervous system and activate pain fibers (Messlinger et al., 2010). Also, humidity can affect the perceived temperature rather than the actual temperature by itself and thus decrease the person’s comfort, which might result in more pain perception (Gabler et al., 2008).
Galicia has the highest suicide rates in Spain in people <30 years old (Gago-Ageitos, 2019), a fact that has been related to unemployment during economic recession periods (Fernández-Navarro, 2016). This deficient mental health could result in maladaptive plasticity in the nervous system and thus increase the vulnerability to chronic pain onset (Sheng et al., 2017).
In this study, perceived stress played an important role in mediating the effect of physical well-being on chronic pain onset. We showed that approximately one-seventh of the total effect of physical well-being on chronic pain development was mediated by perceived stress.
The role of mediator played by perceived stress may relate to the fact that students with higher physical well-being levels have better social support and a greater sense of individual cohesion to overcome stressors and life changes (Mato and Tsukasaki, 2017). Lower physical well-being is then expected to increase these individuals’ stress levels. Higher stress levels induce lower thresholds of pain perception due to impaired dopaminergic activity in the nucleus accumbens and, consequently, may cause hyperalgesia (Ben-Ami and Korn, 2020; Bergenheim et al., 2019; Bottos and Dewey, 2004). Moreover, the level of perceived stress in our study population was rather low, and it is plausible that higher levels of stress could reveal a stronger indirect effect between physical well-being and chronic pain through perceived stress.
Due to the physiological overlap that pain has with stress (Abdallah and Geha, 2017) and physical well-being (Niv and Kreitler, 2001), it would be reasonable to suspect that students who perceived more stress or lower physical well-being at baseline might have had chronic pain before starting the study; this may have caused potential reverse causation in our research. In addition, perceived stress could represent both a cause and a consequence of low physical well-being (Schultchen et al., 2019). This bidirectional association between physical well-being and stress can create a vicious cycle by promoting pain perception in students. Although our design was longitudinal, the aforementioned reciprocal inter-relation could be compatible with a reverse causation procedure between mediator and exposure since they were both collected at baseline.
Furthermore, our results suggest that physical activity interacts with physical well-being, and that students with low physical well-being and low physical activity levels had a higher incidence of chronic pain. Physical activity and exercise reduce the excessive sensitivity of central neurons by altering the neuroimmune signals in the central nervous system and increasing the release of endogenous opioids and serotonin in the brainstem pain inhibitory pathways (Bobinski et al., 2015; Sluka et al., 2013; Stagg et al., 2011).
Also, in this study, abstainer/low drinkers who had low physical well-being experienced more chronic pain than other subgroups. The analgesic effects of alcohol, described in previous studies, could explain this feature. Consuming a moderate amount of alcohol can increase the level of neurotransmitters in the central nervous system responsible for reducing the activity of neurons and decreasing pain experience (Chastain, 2006; Karimi et al., 2022; Zale et al., 2015).
The stratum-specific analysis showed that, in our study, smoking could be both a confounder and an interactor of the association between physical well-being and chronic pain. However, both interaction and confounding analysis showed that the impact of smoking in this association is so small that it can be dismissed.
The interrelation between psychosocial factors may also explain the results of this study. For example, low physical well-being among those with smoking or drinking profiles will deteriorate stress-coping skills by limiting adaptive coping strategies (Gonzalez et al., 2009; McGee et al., 2013). As we showed, higher perceived stress can be responsible for part of the total effect between physical well-being and chronic pain.
The longitudinal character of the study supports the belief that the direct and indirect (through perceived stress) association between physical well-being and chronic pain may be causal. However, our results should be interpreted while considering some limitations. First, we should consider that pain status was assessed using a self-report questionnaire. Although the perception of pain is not clinically measurable, it is possible that using an active clinical examination for measuring the outcome could lead to other potential associations. Second, other potential confounder variables, such as personality traits and depression that could give a broader vision of the biopsychosocial model approach, were not included. Finally, this longitudinal study measured exposure and mediators at baseline without lapses, and the temporal ambiguity between exposure (physical well-being) and mediator (perceived stress) cannot be disregarded.
Knowing the role of covariates in the relation between subjective exposures and outcomes is of paramount importance. For example, adjusting a mediator variable can block a causal path, and distinguishing a confounder from an interactor provides a more accurate interpretation of the results.
In conclusion, in a region with an a priori high risk of chronic pain, perceived stress, as an emotional state, plays a relevant role in the relation between physical well-being and pain, and might be regarded as an intermediate outcome for evaluating interventions aimed at reducing chronic pain in students. If perceived stress is elected as a high-priority intervention in pain management, physical well-being should be acknowledged as one of the determinants of perceived stress. Furthermore, these findings may enable professionals to distinguish high-risk from low-risk subgroups, focusing their interventions on subjects with lower physical well-being and levels of physical activity.
Author Contributions
Conceptualization, Bahi Takkouche; Data curation, Roya Karimi and Jesús Prego-Domínguez; Formal analysis, Roya Karimi; Methodology, Roya Karimi, Jesús Prego-Domínguez and Bahi Takkouche; Supervision, Bahi Takkouche; Writing—original draft, Roya Karimi; Writing—review & editing, Jesús Prego-Domínguez and Bahi Takkouche.
Funding
Consellería de Cultura, Educación e Ordenación Universitaria, (Regional Ministry of Education, Universities and Vocational Training), Xunta de Galicia, Santiago de Compostela, Spain, ED431C 2018/20.
Institutional Review Board Statement
The data obtained from each student were anonymous and the various questionnaires answered by the same participant were linked to each other using a code. The institutional review board at the University of Santiago de Compostela approved this stud y (reference BT-RDC-2017-01).
Data Availability Statement
Dataset and codes are available at https://osf.io/djt8f/under the heading “Physical well-being and chronic pain” DOI 10.17605/OSF.IO/DJT8F.
Conflicts of Interest
The authors have no conflicts of interest to declare.
References
- Abdallah, C.G., Geha, P., 2017. Chronic pain and chronic stress: two sides of the same coin? Chronic Stress 1, 247054701770476. [CrossRef]
- Baron, R.M., Kenny, D.A., 1986. The moderator-mediator variable distinction in social psychological research: conceptual, strategic, and statistical considerations. J Pers Soc Psychol 51, 1173–1182. [CrossRef]
- Bartlett, J.W., Hughes, R.A., 2020. Bootstrap inference for multiple imputation under uncongeniality and misspecification. Stat Methods Med Res 29, 3533–3546. [CrossRef]
- Ben-Ami, N., Korn, L., 2020. Associations between backache and stress among undergraduate students. J Am Coll Health 68, 61–67. [CrossRef]
- Bergenheim, A., Juhlin, S., Nordeman, L., Joelsson, M., Mannerkorpi, K., 2019. Stress levels predict substantial improvement in pain intensity after 10 to 12 years in women with fibromyalgia and chronic widespread pain: a cohort study. BMC Rheumatol 3, 21. [CrossRef]
- Bobinski, F., Ferreira, T.A.A., Córdova, M.M., Dombrowski, P.A., da Cunha, C., Santo, C.C. do E., Poli, A., Pires, R.G.W., Martins-Silva, C., Sluka, K.A., Santos, A.R.S., 2015. Role of brainstem serotonin in analgesia produced by low-intensity exercise on neuropathic pain after sciatic nerve injury in mice. Pain 156, 2595–2606. [CrossRef]
- Bottos, S., Dewey, D., 2004. Perfectionists’ appraisal of daily hassles and chronic headache. Headache: J Headache Pain 44, 772–779. [CrossRef]
- Calman, K.C., 1984. Quality of life in cancer patients--an hypothesis. J Med Ethics 10, 124–127. [CrossRef]
- Chastain, G., 2006. Alcohol, neurotransmitter systems, and behavior. J Gen Psychol 133, 329–335. [CrossRef]
- de Mutsert, R., Jager, K.J., Zoccali, C., Dekker, F.W., 2009. The effect of joint exposures: examining the presence of interaction. Kidney Int 75, 677–681. [CrossRef]
- Efron, B., Tibshirani, R.J., 1994. An introduction to the bootstrap. CRC press Boca Raton, FL, USA. [CrossRef]
- Fagerlund, A.J., Iversen, M., Ekeland, A., Moen, C.M., Aslaksen, P.M., 2019. Blame it on the weather? The association between pain in fibromyalgia, relative humidity, temperature and barometric pressure. PLoS One 14, e0216902. [CrossRef]
- Fayaz, A., Croft, P., Langford, R.M., Donaldson, L.J., Jones, G.T., 2016. Prevalence of chronic pain in the UK: A systematic review and meta-analysis of population studies. BMJ Open 6, e010364. [CrossRef]
- Fernández-Navarro, P., Barrigón, M. L., Lopez-Castroman, J., Sanchez-Alonso, M., Páramo, M., Serrano, M., Arrojo, M., & Baca-García, E., 2016. Suicide mortality trends in Galicia, Spain and their relationship with economic indicators. Epidemiol Psychiatr Sci 25, 475–484. [CrossRef]
- Fillingim, R.B., 2017. Individual differences in pain: understanding the mosaic that makes pain personal. Pain 158, S11–S18. [CrossRef]
- Gabler, R.E., Petersen, J.F., Trapasso, L.M., Sack, D., 2008. Physical Geography. Cengage Learning: Belmont, NC, USA, p. 679.
- Gago-Ageitos AM, Durán-Maseda MJ, Vidal-Millares M, Ares-Durán J, Carballal-Mariño, M 2019. Mental health care for children and adolescents in Galicia (Spain). Differences between different regions in Spain. Communication presented at the 19th World Psychiatric Association World Congress. Lisbon, Portugal 2019. Available at: https://www.morressier.com/o/event/5ca1d27b57558b317a13f5a3/article/5d1a038357558b317a140c8c (accessed February 3, 2023. [CrossRef]
- Garland, E.L., 2012. Pain processing in the human nervous system: a selective review of nociceptive and biobehavioral pathways. Prim Care 39, 561–571. [CrossRef]
- GBD, 2018. Global, regional, and national disability-adjusted life-years (DALYs) for 359 diseases and injuries and healthy life expectancy (HALE) for 195 countries and territories, 1990-2017: a systematic analysis for the Global Burden of Disease Study 2017. Lancet 392, 1859–1922. [CrossRef]
- Gonzalez, V.M., Bradizza, C.M., Collins, R.L., 2009. Drinking to cope as a statistical mediator in the relationship between suicidal ideation and alcohol outcomes among underage college drinkers. Psychol Addict Behav 23, 443–451. [CrossRef]
- Greenland, S., 1996. Basic methods for sensitivity analysis of biases. Int J Epidemiol 25, 1107–1116.
- Hafeman, D.M., Schwartz, S., 2009. Opening the Black Box: a motivation for the assessment of mediation. Int J Epidemiol 38, 838–845. [CrossRef]
- Henares Montiel, J., Ruiz-Péreza, I., Sordo, L., 2020. Salud mental en España y diferencias por sexo y por comunidades autónomas. Gac Sanit 34, 114-119. [CrossRef]
- Heneweer, H., Staes, F., Aufdemkampe, G., van Rijn, M., Vanhees, L., 2011. Physical activity and low back pain: a systematic review of recent literature. Eur Spine J 20, 826–845. [CrossRef]
- Hita-Contreras, F., Martínez-López, E., Latorre-Román, P.A., Garrido, F., Santos, M.A., Martínez-Amat, A., 2014. Reliability and validity of the Spanish version of the Pittsburgh Sleep Quality Index (PSQI) in patients with fibromyalgia. Rheumatol Int 34, 929–936. [CrossRef]
- Huguet, A., Miró, J., 2008. The severity of chronic pediatric pain: an epidemiological study. J Pain 9, 226–236. [CrossRef]
- Instituto Nacional de Estadística, 2020a. Estado de salud: Cifras absolutas. Encuesta Europea de Salud. https://www.ine.es/dynt3/inebase/es/index.htm?type=pcaxis&path=/t15/p420/a2019/p01/&file=pcaxis. (accessed January 23, 2023).
- Instituto Nacional de Estadística, 2020b. Indicadores de Calidad de Vida/Análisis multidimensional. Encuesta Europea de Salud. https://www.ine.es/ss/Satellite?c=Page&pagename=ProductosYServicios%2FPYSLayout&cid=1259947314645&L=0#27sc. (accessed January 23, 2023).
- Karimi, R., Mallah, N., Nedjat, S., Beasley, M.J., Takkouche, B., 2022. Association between alcohol consumption and chronic pain: a systematic review and meta-analysis. Br J Anaesth 129, 355–365. [CrossRef]
- Knol, M.J., VanderWeele, T.J., Groenwold, R.H.H., Klungel, O.H., Rovers, M.M., Grobbee, D.E., 2011. Estimating measures of interaction on an additive scale for preventive exposures. Eur J Epidemiol 26, 433–438. [CrossRef]
- Lindell, M., Grimby-Ekman, A., 2022. Stress, non-restorative sleep, and physical inactivity as risk factors for chronic pain in young adults: A cohort study. PLoS One 17, e0262601. https://doi:10.1371/journal.pone.0262601.
- Mackinnon, D.P., Lockwood, C.M., Williams, J., 2004. Confidence limits for the indirect effect: distribution of the product and resampling methods. Multivariate Behav Res 39, 99. [CrossRef]
- Mateos, R., Páramo, M., Carrera, I., Rodríguez-López, A., 2002. Alcohol consumption in a southern European region (Galicia, Spain). Subst Use Misuse 37, 1957–1976. [CrossRef]
- Mato, M., Tsukasaki, K., 2017. Factors promoting sense of coherence among university students in urban areas of Japan: individual-level social capital, self-efficacy, and mental health. Glob Health Promot 26, 60–68. [CrossRef]
- McGee, R., Williams, S., Nada-Raja, S., Olsson, C.A., 2013. Tobacco smoking in adolescence predicts maladaptive coping styles in adulthood. Nicotine Tob Res 15, 1971–1977. [CrossRef]
- Messlinger, K., Funakubo, M., Sato, J., Mizumura, K., 2010. Increases in neuronal activity in rat spinal trigeminal nucleus following changes in barometric pressure - relevance for weather-associated headaches? J Headache Pain 50, 1449–1463. [CrossRef]
- Mills, S.E.E., Nicolson, K.P., Smith, B.H., 2019. Chronic pain: a review of its epidemiology and associated factors in population-based studies. Br J Anaesth 123, e273–e283. [CrossRef]
- Murray, C.B., Vega, R., Murphy, L.K., Kashikar-Zuck, S., Palermo, T.M., 2021. The prevalence of chronic pain in young adults: a systematic review and meta-analysis. Pain 163, e972–e984. [CrossRef]
- Niv, D., Kreitler, S., 2001. Pain and quality of life. Pain Practice 1, 150–161. [CrossRef]
- Niv, D., Devor, M., 2004. Chronic pain as a disease in its own right. Pain Pract 4, 179–181. [CrossRef]
- Orosa, J.A., Costa, Á.M., Rodríguez-Fernández, Á., Roshan, G., 2014. Effect of climate change on outdoor thermal comfort in humid climates. J Environ Health Sci Eng 12, 46. [CrossRef]
- Rodríguez-Muñoz, S., Corella, C., Abarca-Sos, A., Zaragoza, J., 2017. Validation of three short physical activity questionnaires with accelerometers among university students in Spain. J Sports Med Phys Fitness 57, 1660–1668. [CrossRef]
- Rothman, K.J., Greenland, S., Lash, T.L., 2008. Modern Epidemiology. Wolters Kluwer Health/Lippincott Williams & Wilkins. Philadelphia, PA, USA.
- Schultchen, D., Reichenberger, J., Mittl, T., Weh, T.R.M., Smyth, J.M., Blechert, J., Pollatos, O., 2019. Bidirectional relationship of stress and affect with physical activity and healthy eating. Br J Health Psychol 24, 315–333. [CrossRef]
- Sheng, J., Liu, S., Wang, Y., Cui, R., Zhang, X., 2017. the link between depression and chronic pain: neural mechanisms in the brain. Neural Plast 2017, 9724371. [CrossRef]
- Shiri, R., Karppinen, J., Leino-Arjas, P., Solovieva, S., Viikari-Juntura, E., 2010. The association between smoking and low back pain: a meta-analysis. Am J Med 123, 87.e7–35. [CrossRef]
- Sluka, K.A., O’Donnell, J.M., Danielson, J., Rasmussen, L.A., 2013. Regular physical activity prevents development of chronic pain and activation of central neurons. J Appl Physiol 114, 725–733. [CrossRef]
- Stagg, N.J., Mata, H.P., Ibrahim, M.M., Henriksen, E.J., Porreca, F., Vanderah, T.W., Philip Malan, T., 2011. Regular exercise reverses sensory hypersensitivity in a rat neuropathic pain model. Anesthesiology 114, 940–948. [CrossRef]
- Treede, R.-D., Rief, W., Barke, A., Aziz, Q., Bennett, M.I., Benoliel, R., Cohen, M., Evers, S., Finnerup, N.B., First, M.B., Giamberardino, M.A., Kaasa, S., Korwisi, B., Kosek, E., Lavand’homme, P., Nicholas, M., Perrot, S., Scholz, J., Schug, S., Smith, B.H., Svensson, P., Vlaeyen, J.W.S., Wang, S.-J., 2019. Chronic pain as a symptom or a disease: the IASP Classification of Chronic Pain for the International Classification of Diseases (ICD-11). Pain 160, 19–27. [CrossRef]
- Vallejo, M.A., Vallejo-Slocker, L., Fernández-Abascal, E.G., Mañanes, G., 2018. Determining factors for stress perception assessed with the Perceived Stress Scale (PSS-4) in Spanish and other European samples. Front Psychol 9, 37. [CrossRef]
- van Hecke, O., Torrance, N., Smith, B.H., 2013. Chronic pain epidemiology – where do lifestyle factors fit in? Br J Pain 7, 209–217. [CrossRef]
- VanderWeele, T., Vansteelandt, S., 2014. Mediation analysis with multiple mediators. Epidemiol Methods 2, 95–115. [CrossRef]
- VanderWeele, T.J., 2012. Confounding and effect modification: distribution and measure. Epidemiol Methods 1, 55–82.
- Vázquez, C., Alonso, R., Garriga, M., de Cos, A., de la Cruz, J.J., Fuentes-Jiménez, F., Salas-Salvadó, J., Mata, P., 2012. Validation of a food frequency questionnaire in Spanish patients with familial hypercholesterolaemia. Nutr Metab Cardiovasc Dis 22, 836–842. [CrossRef]
- Vilagut, G., María Valderas, J., Ferrer, M., Garin, O., López-García, E., Alonso, J., 2008. Interpretación de los cuestionarios de salud SF-36 y SF-12 en España: componentes físico y mental. Med Clin (Barc) 130, 726–735. [CrossRef]
- Wang, X., Ji, X., 2020. Sample size estimation in clinical research: from randomized controlled trials to observational studies. Chest 158, S12–S20. [CrossRef]
- Ware, J.E., Kosinski, M., Keller, S.D., 1996. A 12-Item Short-Form Health Survey: construction of scales and preliminary tests of reliability and validity. Med Care 34, 220–233. [CrossRef]
- Ware, J.E., Kosinski, M., Turner-Bowker, D., Gandek, B., Keller, S.D., 2002. How to score version 2 of the SF-12(R) health survey (with a supplement documenting version 1). Qualitymetric., Lincoln, RI, USA.
- White, I.R., Royston, P., Wood, A.M., 2011. Multiple imputation using chained equations: Issues and guidance for practice. Stat Med 30, 377–399. [CrossRef]
- WHOQOL, 1995. The World Health Organization quality of life assessment (WHOQOL): position paper from the World Health Organization. Soc Sci Med 41, 1403–1409. [CrossRef]
- Zale, E.L., Maisto, S.A., Ditre, J.W., 2015. Interrelations between pain and alcohol: An integrative review. Clin Psychol Rev 37, 57–71. [CrossRef]
Figure 1.
A hypothesized causal diagram of the model with covariates of the association between physical well-being and chronic pain.
Figure 1.
A hypothesized causal diagram of the model with covariates of the association between physical well-being and chronic pain.
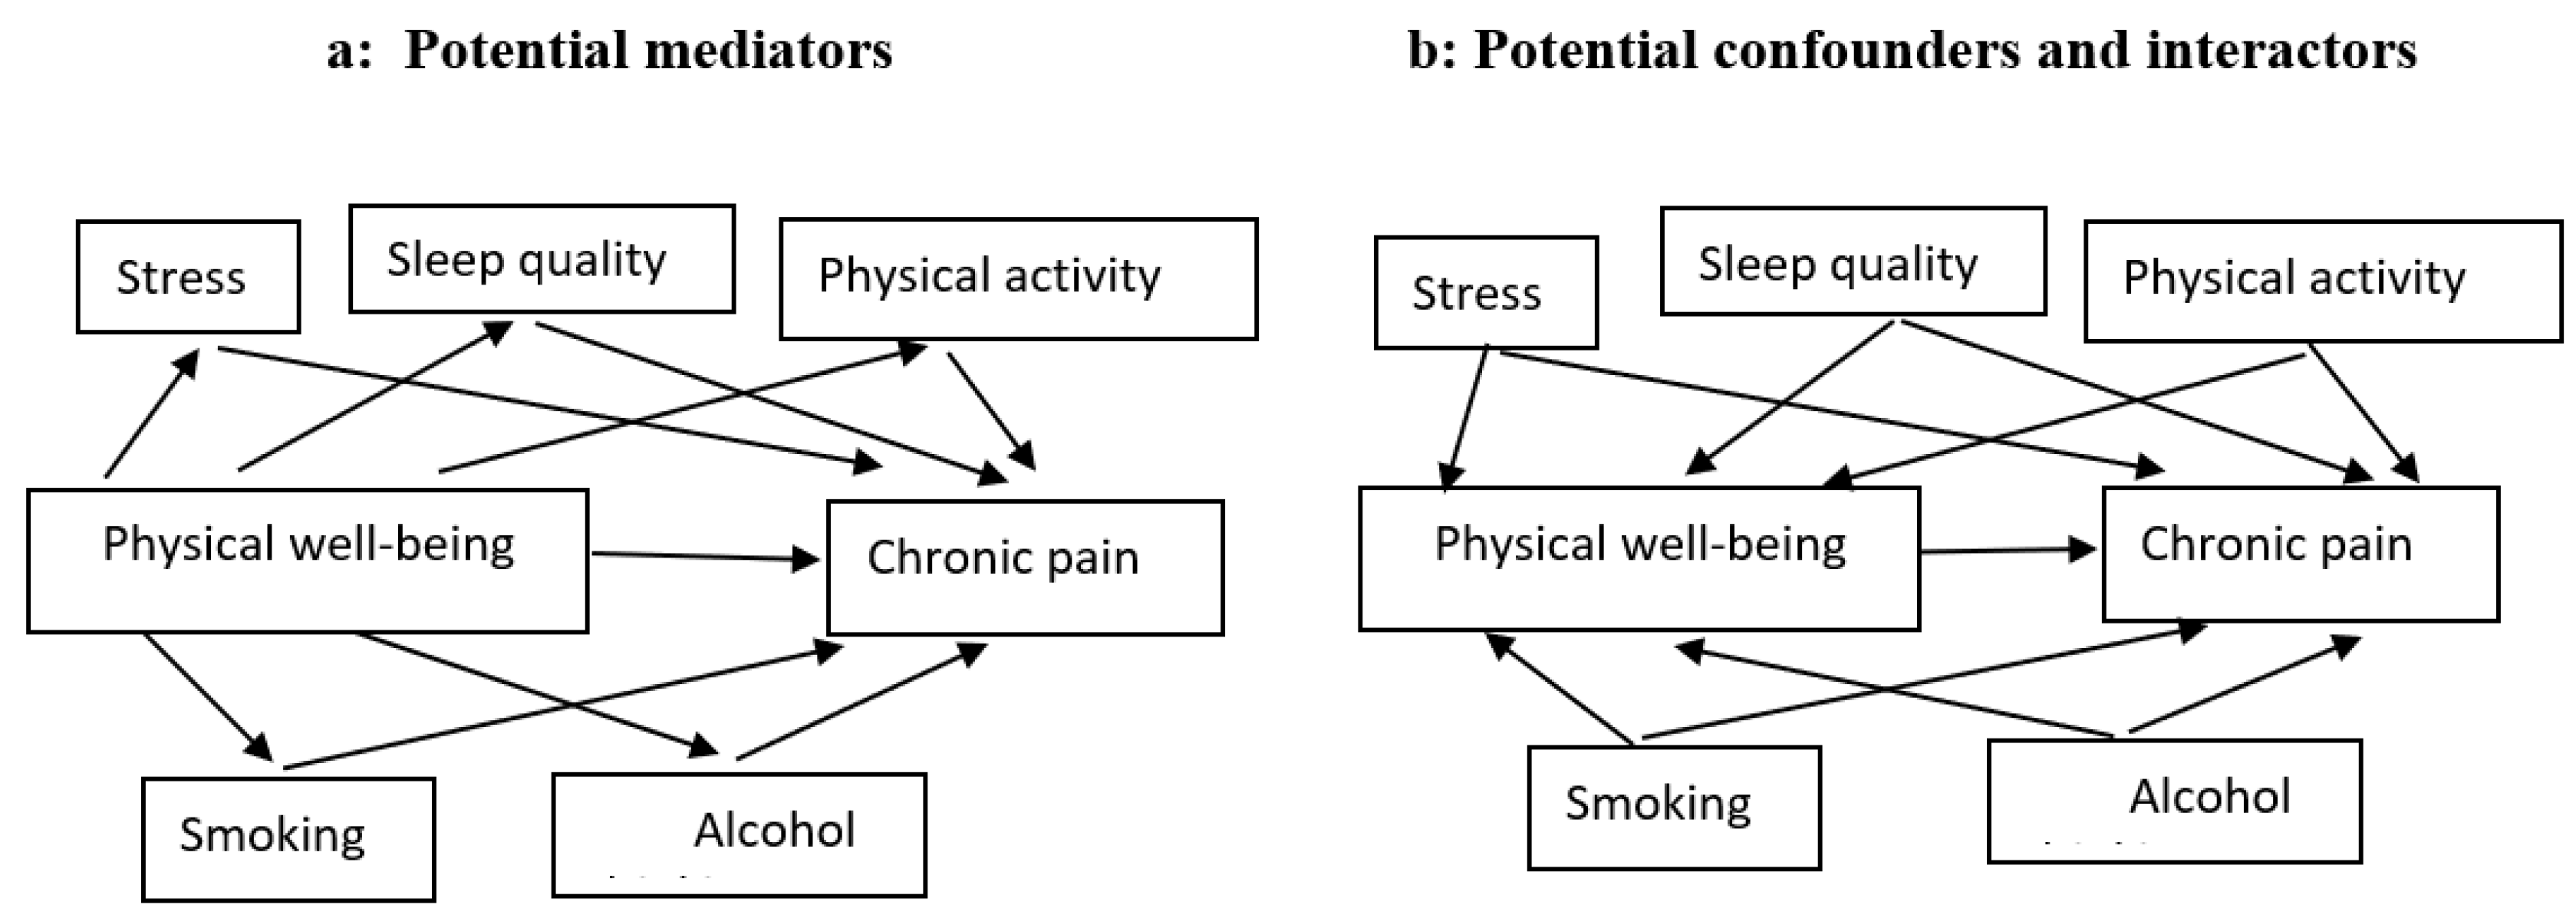
Figure 2.
Flow diagram of Pain Study Online, Spain, 2019-2020.
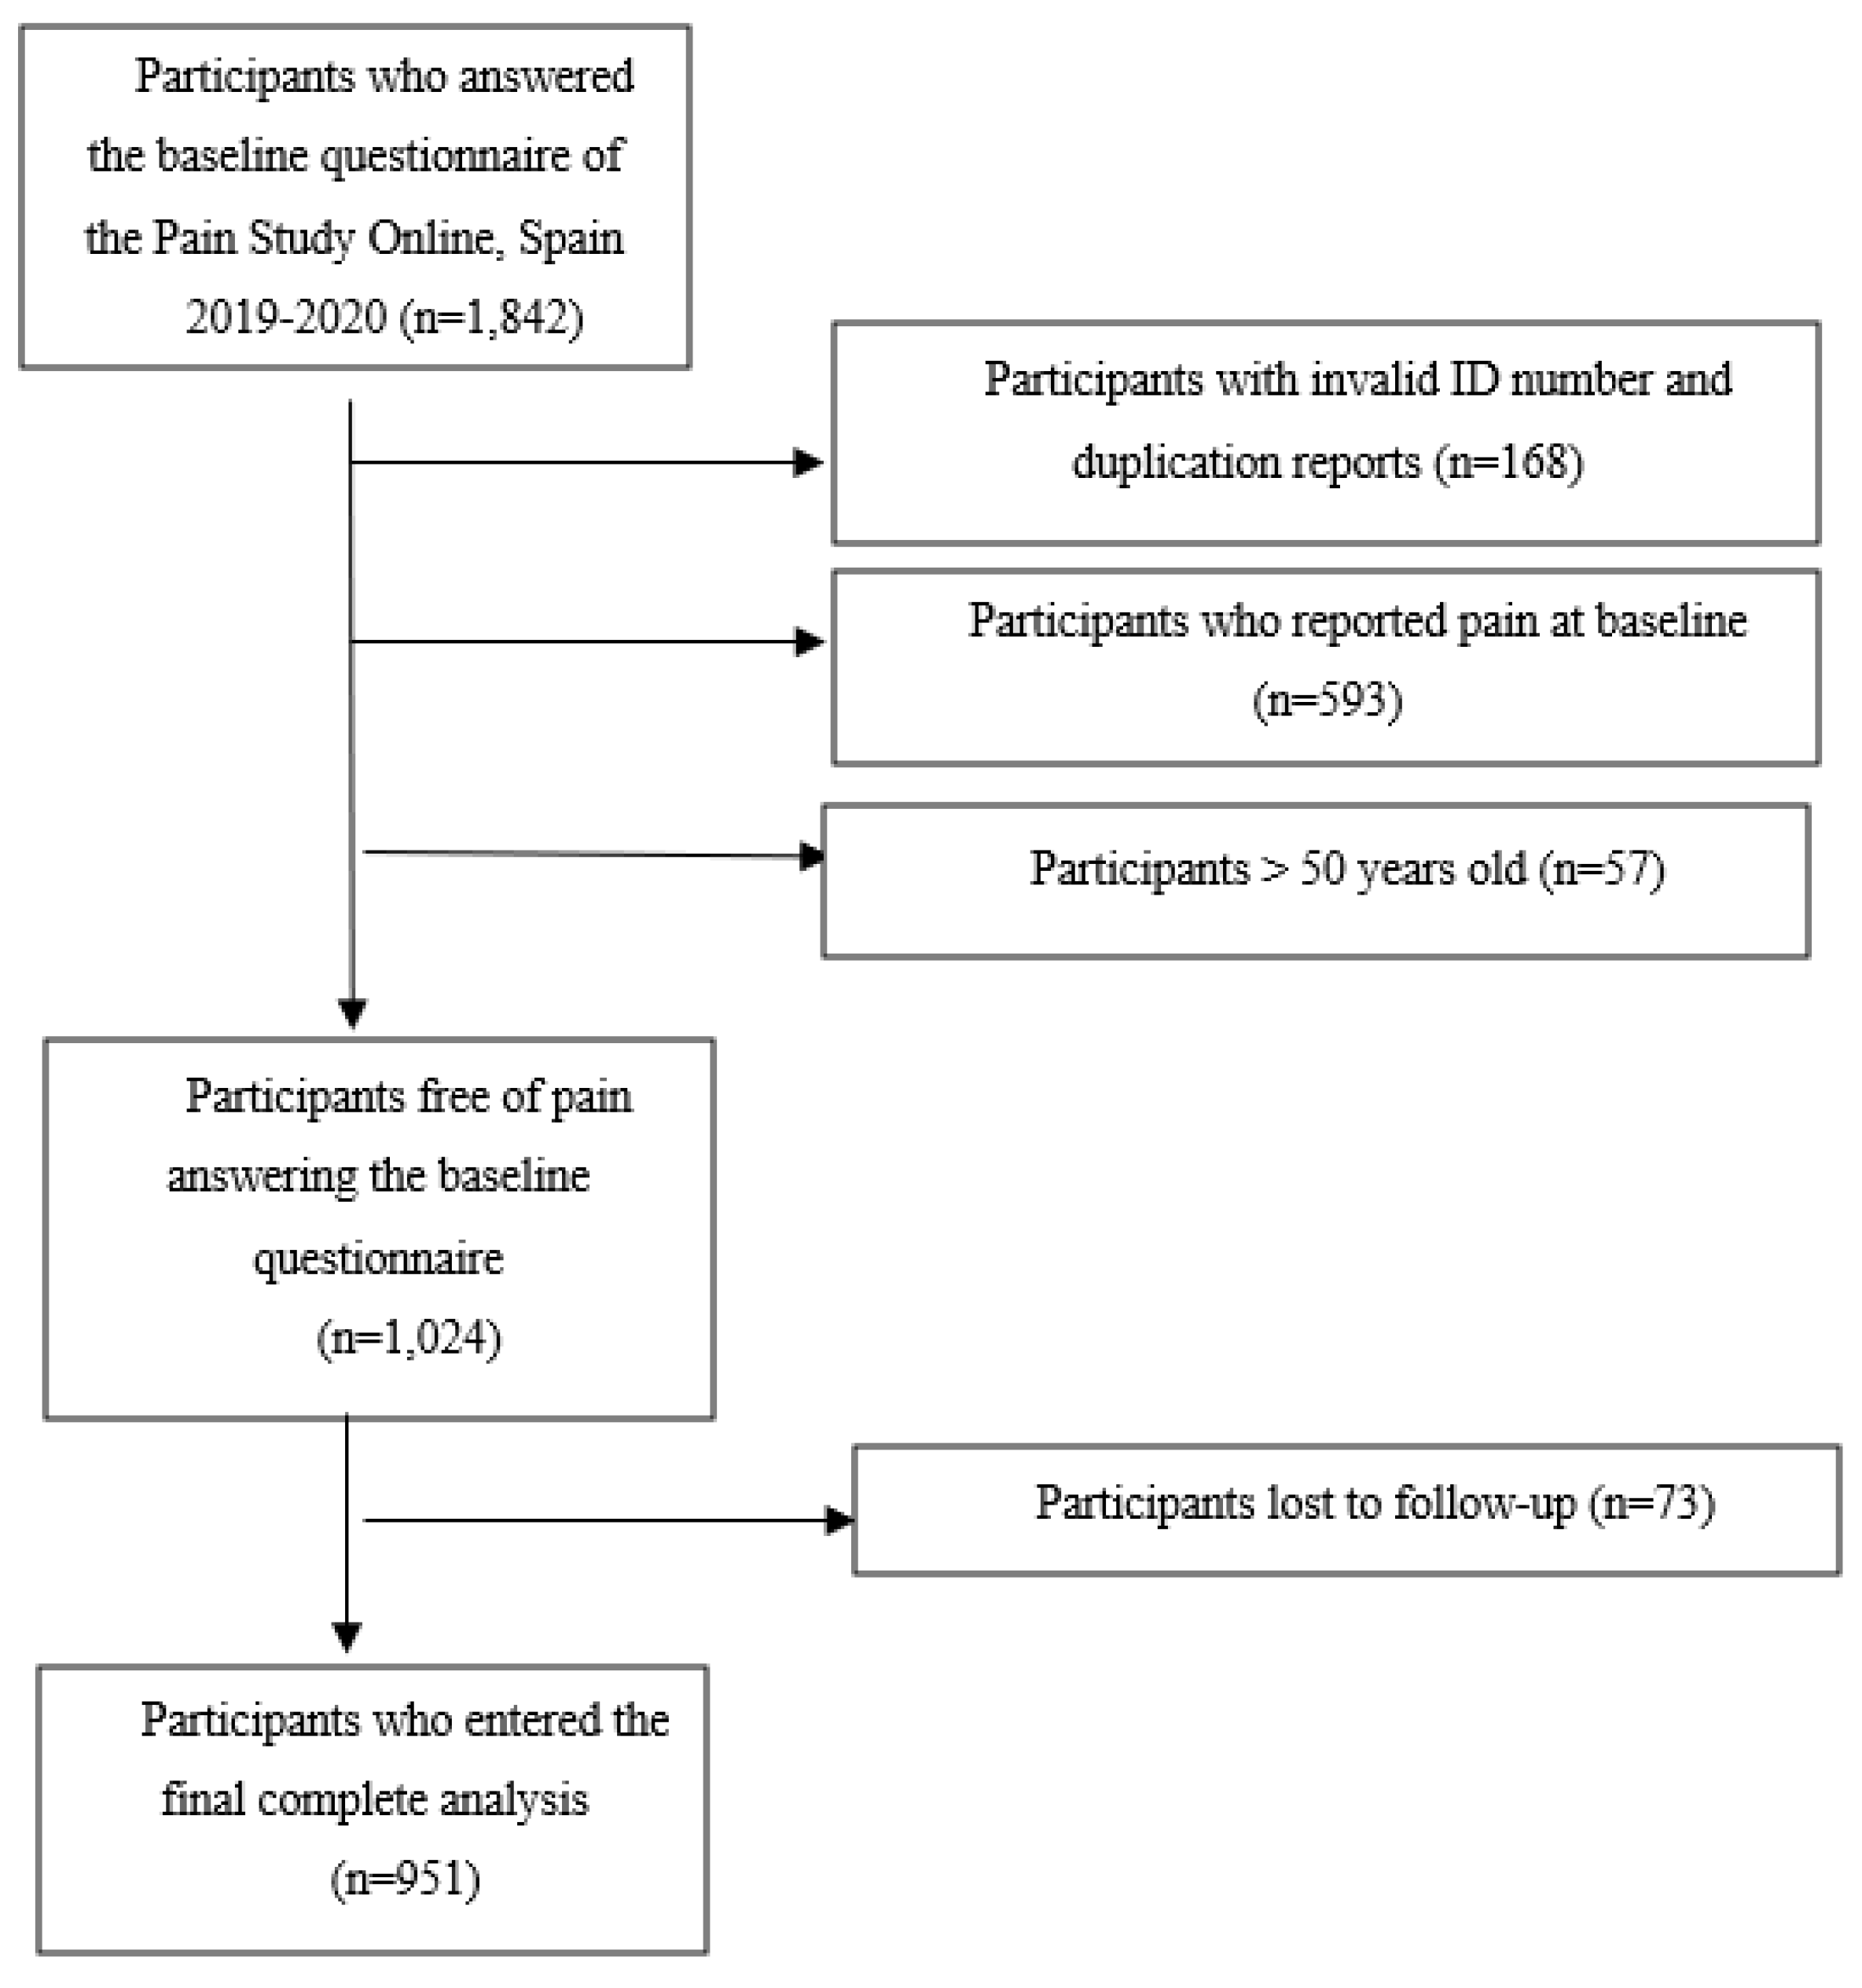

Table 1.
Baseline characteristics of 1,024 Students, Pain Study Online, Spain, 2019-2020.
| Exposure | Physical well-being (Physical Component Summary) | |
|---|---|---|
| Low Mean = 48.4 (n = 154) |
High Mean = 58.07 (n = 460) |
|
| Age; Mean (SD) | 24.95 (6.2) | 24.61 (6.1) |
| Sex; n (%) | ||
| Male | 37 (24.50) | 93 (20.53) |
| Female | 114 (75.50) | 360 (79.47) |
| Physical activity; n (%) | ||
| High | 34 (21.12) | 127 (78.88) |
| Low | 108 (25.29) | 319 (74.71) |
| Perceived stress; n (%) | ||
| High (>8) | 88 (26.91) | 239 (73.09) |
| Low (<8) | 41 (17.01) | 200 (82.99) |
| Smoking; n (%) | ||
| Non-current smokers | 112 (22.72) | 381 (77.28) |
| Current smokers | 42 (34.71) | 79 (65.29) |
| Alcohol consumption; n (%) | ||
| Abstainers/low drinkers | 25 (25.77) | 72 (74.23) |
| Moderate drinkers | 30 (21.90) | 107 (78.10) |
| Sleep quality; n (%) | ||
| Low >5 | 56 (52.83) | 149 (36.97) |
| High <5 | 50 (47.17) | 254 (63.03) |
Table 2.
Natural direct, indirect, and total effects of physical well-being on chronic pain incidence among students, Pain Study Online, Spain, 2019-2020.
Table 2.
Natural direct, indirect, and total effects of physical well-being on chronic pain incidence among students, Pain Study Online, Spain, 2019-2020.
| Mediator | Unadjusted | Adjusteda | ||||||
| Natural Indirect Effect | Natural Direct Effect | Natural Total Effect | Proportion Mediated, % | Natural Indirect Effect | Natural Direct Effect | Natural Total Effect | Proportion Mediated, % | |
| IRR (95% CI) | IRR (95% CI) | IRR (95% CI) | IRRa (95% CI) | IRRa (95% CI) | IRRa (95% CI) | |||
|
Physical activity (Low vs. High) |
0.97 (0.87, 1.07) | 0.64 (0.45, 0.79) | 0.60 (0.44, 0.81) | 5.1 | 0.96 (0.85, 1.09) | 0.63 (0.50, 0.82) | 0.59 (0.49, 0.82) | 6.4 |
|
Perceived stress (Low vs. High) |
0.94 (0.91, 1.03) | 0.63 (0.45, 0.77) | 0.59 (0.46, 0.92) | 9.3 | 0.92 (0.89, 1.00) | 0.64 (0.48, 0.81) | 0.58 (0.50, 0.81) | 12.5 |
|
Smoking (non-current vs. current) |
0.98 (0.89, 1.05) | 0.62 (0.45, 0.80) | 0.60 (0.44, 0.80) | 3.2 | 0.97 (0.84, 1.07) | 0.63 (0.49, 0.79) | 0.60 (0.50, 0.78) | 4.8 |
|
Drinking (abstainers/low vs. moderate) |
1.02 (0.86, 1.15) | 0.63 (0.44, 0.80) | 0.60 (0.48, 0.82) | -3.5 | 1.03 (0.83, 1.16) | 0.63 (0.48, 0.78) | 0.65 (0.50, 0.79) | -5.3 |
|
Sleep quality (Good vs. poor) |
0.98 (0.84, 1.10) | 0.63 (0.48, 0.81) | 0.61 (0.47, 0.80) | 3.3 | 0.98 0.93, 1.07) | 0.64 (0.48, 0.84) | 0.62 (0.49, 0.85) | 3.4 |
Abbreviations: CI, confidence interval; IRR, incidence rate ratio. a Adjusted for age and sex.
Table 3.
Stratum-specific Incidence Rate Ratios of the association between physical well-being and chronic pain among students, Pain Study Online, Spain, 2019-2020.
Table 3.
Stratum-specific Incidence Rate Ratios of the association between physical well-being and chronic pain among students, Pain Study Online, Spain, 2019-2020.
| Covariates | Stratum-specific IRR | IRR crude | IRR pooled |
|---|---|---|---|
| Low physical activity | 1.76 (1.28, 2.36) | 1.49 (1.24, 1.80) | 1.51 (1.20, 1.90) |
| High physical activity | 1.20 (1.06, 1.45) | ||
| Low stress | 1.27 (1.30, 1.79) | 1.49 (1.24, 1.80) | 1.47 (1.16, 1.86) |
| High stress | 1.68 (1.22, 2.32) | ||
| Non-current smokers | 1.80 (1.05, 2.81) | 1.49 (1.24, 1.80) | 1.59 (1.39, 1.62) |
| Current smokers | 1.52 (1.35, 1.62) | ||
| Low/non-drinkers | 1.59 (1.19, 2.75) | 1.49 (1.24, 1.80) | 1.44 (1.22, 1.58) |
| Moderate drinkers | 1.44 (1.10, 1.58) | ||
| Low sleep quality | 1.54 (1.01, 2.26) | 1.49 (1.24, 1.80) | 1.50 (1.13, 1.98) |
| High sleep quality | 1.52 (0.97, 2.20) |
Abbreviations: CI, confidence interval; IRR, incidence rate ratio.
Table 4.
Measures of additive interaction between covariates and physical well-being among students in the occurrence of chronic pain, Pain Study Online, Spain, 2019-2020.
Table 4.
Measures of additive interaction between covariates and physical well-being among students in the occurrence of chronic pain, Pain Study Online, Spain, 2019-2020.
| Interaction | Adjusted * IRR (95% CI) | Univariate RERI (95% CI) | Adjusted RERI * (95% CI) | AP (95% CI) | S (95% CI) |
|---|---|---|---|---|---|
| Physical activity/Physical well-being | 0.25 (0.13, 0.60) | 0.27 (0.12, 0.51) | 0.19 (0.13, 0.58) | 3.79 (1.29, 7.84) | |
| High activity, high well-being | 1(ref) | ||||
| Low activity, high well-being | 0.89 (0.77, 1.04) | ||||
| High activity, low well-being | 1.20 (1.06, 1.45) | ||||
| Low activity, low well-being | 1.34 (1.07, 1.59) | ||||
| Perceived stress/Physical well-being | 0.02 (-0.89, 0.16) | 0.01 (-0.92, 0.17) | 0.02 (-0.83, 0.23) | 1.07 (0.59, 1.27) | |
| Low stress, high well-being | 1(ref) | ||||
| High stress, high well-being | 1.03 (0.73, 1.09) | ||||
| Low stress, low well-being | 1.27 (1.30, 1.79) | ||||
| High stress, low well-being | 1.37 (0.79, 1.10) | ||||
| Smoking status/Physical well-being | -0.07 (-0.15, 0.01) | -0.04 (-0.24, 0.10) | -0.08 (-0.10, 0.11) | 0.64 (0.32, 0.70) | |
| Non-current smokers, high well-being | 1(ref) | ||||
| Smokers, high well-being | 0.74 (0.45, 1.30) | ||||
| Non-current smokers, low well-being | 1.52 (1.35, 1.62) | ||||
| Smokers, low well-being | 1.17 (0.92, 1.26) | ||||
| Drinking status/Physical well-being | 0.11 (0.06, 0.36) | 0.09 (0.04, 0.28) | 0.08 (0.05, 0.30) | 1.81 (1.51, 2.12) | |
| Moderate drinkers, high well-being | 1(ref) | ||||
| Abstainer, high well-being | 0.68 (0.56, 0.81) | ||||
| Moderate drinkers, low well-being | 1.44 (1.10, 1.58) | ||||
| Abstainer, low well-being | 1.24 (1.12, 1.36) | ||||
Abbreviations: CI, confidence interval; IRR, incidence rate ratio. a Adjusted for age and sex.
Disclaimer/Publisher’s Note: The statements, opinions and data contained in all publications are solely those of the individual author(s) and contributor(s) and not of MDPI and/or the editor(s). MDPI and/or the editor(s) disclaim responsibility for any injury to people or property resulting from any ideas, methods, instructions or products referred to in the content. |
© 2023 by the authors. Licensee MDPI, Basel, Switzerland. This article is an open access article distributed under the terms and conditions of the Creative Commons Attribution (CC BY) license (http://creativecommons.org/licenses/by/4.0/).
Copyright: This open access article is published under a Creative Commons CC BY 4.0 license, which permit the free download, distribution, and reuse, provided that the author and preprint are cited in any reuse.


