
Submitted:
05 May 2023
Posted:
08 May 2023
You are already at the latest version
Abstract
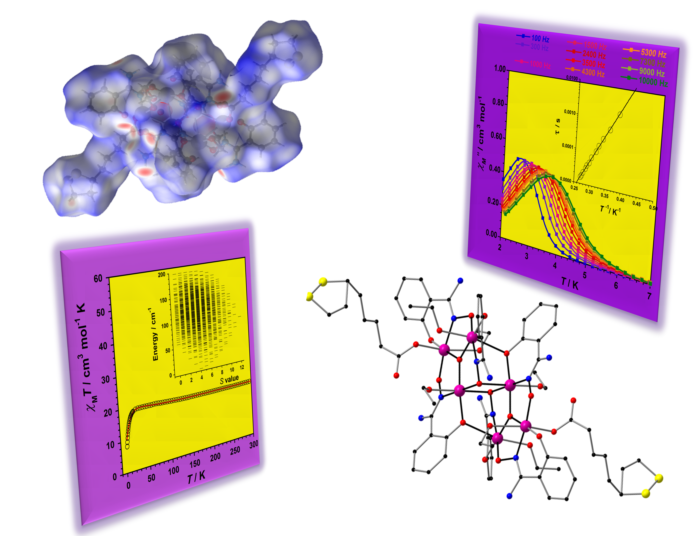
Single-Molecule Magnets (SMMs) have attracted much interest because of their spin properties and potential technological applications. Besides, a great effort has been devoted to their functionalization, which is made with functional groups convenient to connect suitable SMMs to junction devices or to perform their grafting on surfaces of different substrates. We have synthesized and characterized two lipoic acid-functionalized and oxime-based MnIII compounds, of formula [Mn6(μ3-O)2(H2N-sao)6(lip)2(MeOH)6][Mn6(μ3-O)2(H2N-sao)6(cnph)2(MeOH)6]}·10MeOH (1) and [Mn6(μ3-O)2(H2N-sao)6(lip)2(EtOH)6]·EtOH·2H2O (2) [H2N-saoH2 = salicylamidoxime, lip = lipoate anion, cnph = 2-cyanophenolate anion]. 1 crystallizes in the triclinic system with space group Pī and 2 crystallizes in the monoclinic system with space group C2/c. In their crystal packing, adjacent Mn6 complexes are connected through non-coordinating solvent molecules, which are H-bonded to N atoms of –NH2 groups of salicylamidoxime ligand. In addition, Hirshfeld surfaces of 1 and 2 were calculated to study the variety of intermolecular interactions and different level of importance that take place in their crystal lattice, this type of computed study being the first time performed on Mn6 molecules. The study of the magnetic properties of 1 and 2 through dc magnetic susceptibility measurements reveals the coexistence of ferro- and antiferromagnetic exchange couplings between the Mn(III) metal ions in both compounds, the latter being the predominant magnetic interaction. A ground state spin value of S = 4 was obtained through isotropic simulations of the experimental magnetic susceptibility data for both 1 and 2. Ac magnetic susceptibility measurements show the occurrence of slow relaxation of the magnetization in 1 and 2, which indicate that SMM behavior take place in both compounds.
Keywords:
manganese
; lipoic acid
; salicylamidoxime
; crystal structure
; magnetic susceptibility
; single-molecule magnet
1. Introduction
Single-Molecule Magnets (SMMs) are molecules that can act as nanomagnets at molecular level and low temperatures, these compounds being suitable candidates to investigate potential technological applications, some of which can be high-density data storage, quantum computing and molecular refrigeration [1,2,3,4,5,6]. Hence, the singular magnetic properties that these compounds exhibit can also be investigated in functional devices, mainly in the research fields of molecular spintronics and molecular electronics [7,8,9,10]. The self-assembly of SMMs on surfaces and junction devices has been mainly reported for molecules functionalized with sulfur-based groups, which have allowed grafting them on adapted substrates of gold, silicon and nickel, thus generating new materials of technological interest [11,12,13,14].
The synthesis of hexanuclear Mn(III) complexes (Mn6) starting from Mn(II) salts and phenolic oximes, such as salicylaldoximes and salicylamidoximes and their derivative molecules, has been investigated during the last two decades and has proven to be a successful and reliable method for the preparation of Mn(III)-based SMMs, as all these discrete Mn6 molecules display this singular magnetic behavior [15,16,17,18,19,20,21,22,23,24,25,26,27].
Both experimental and theoretical studies performed on this family of oxime-based Mn6 SMMs have established that these compounds exhibit spin ground states (S) that vary from 4 to 12 and anisotropy energy barriers (Ueff) covering the range from 24 to 86 K. Interestingly, the magnetic coupling involving the Mn(III) metal ions varies according to the Mn–N–O–Mn set of atoms which forms significant angles in oxime-based Mn6 complexes. Thus, a critical angle in which the global magnetic coupling among adjacent Mn(III) metal ions changes from antiferro- to ferromagnetic has been found. This critical angle is approximately 27° for salicylamidoxime-based compounds and ca. 31° for salicylaldoxime-based complexes [18,21,24].
Some of these Mn6 molecules have been functionalized using thioester-based ligands and have been connected by means of the lift-off method to two nickel electrodes of an exposed-edge tunnel junction [28]. Transport studies performed at room temperature on this device have shown an increase of the current with the presence of this functionalized Mn6 complex [29,30]. Theoretical calculations performed on this type of molecule-based devices have been carried out in order to investigate their molecular features and spin properties [30].
In literature, there only exists an oxime-based Mn(III) nanomagnet obtained with lipoic acid. It is a chiral, decanuclear Mn(III) complex containing non-coordinated sulfur atoms (Scheme 1), which has shown to be suitable for surface grafting [31]. Hence, the investigation in the coordination chemistry of complexes based on lipoic acid is clearly underdeveloped and is very appealing to get new insights in this type of studies.
Herein, we describe the preparation, the structural characterization and the investigation of the magnetic characteristics of two oxime-based Mn(III) compounds with the formula [Mn6(μ3-O)2(H2N-sao)6(lip)2(MeOH)6][Mn6(μ3-O)2(H2N-sao)6(cnph)2(MeOH)6]}·10MeOH (1) and [Mn6(μ3-O)2(H2N-sao)6(lip)2(EtOH)6]·EtOH·2H2O (2) [H2N-saoH2 = salicylamidoxime, Hlip = lipoic acid, cnph = 2-cyanophenolate], which constitute the second reported example of Mn(III)-based SMM containing lipoic acid.
2. Results and Discussion
2.1. Synthetic Procedure
By reacting salicylamidoxime and lipoic acid ligands together with a Mn(II) salt [MnCl2·4H2O for 1 and Mn(NO3)2·4H2O for 2] in the presence of NEt3, a dark green solution was formed in MeOH and EtOH for 1 and 2, respectively. The thus obtained solution provided a dark green microcristaline solid in the case of the synthesis of 1 and dark green crystals in the case of 2. The better yield covers the range 55-70%. These fresh samples were the ones employed to perform the magnetism studies. In order to get crystals and to study the crystal structure of 1, a concentrated solution of the microcrystalline solid in methanol was layered with acetone, generating dark green crystals through the solvent diffusion. Nevertheless, these crystals present two crystallographically independent Mn6 complexes, one of them contains lipoate ligand as compound 2, but the other is bearing 2-cyanophenolate ligand instead. It was generated by partial hydrolysis of salicylamidoxime during the re-crystallization process. The in situ formation of 2-cyanophenolate in syntheses of Mn6 complexes has been previously reported [24]. In any case, this synthetic procedure would be a straightforward method to add the lipoate ligand to the well-known family of Mn6 complexes.
2.2. Description of the Crystal Structures
The crystal structures of the reported complexes (1 and 2) are made up of neutral hexanuclear Mn(III) complexes, so-called Mn6 SMMs [15,16,17,18,19,20,21,22,23,24,25,26,27]. Compound 1 crystallizes in the space group Pī of the triclinic system and compound 2 crystallizes in the space group C2/c of the monoclinic system (see Table 1). The crystallization solvent molecules MeOH (1), H2O (2) and EtOH (2) are also present in the structures of these compounds. The characteristic Mn6 complexes found in 1 and 2 are shown in Figure 1. In this family of compounds, the core is formed by two {Mn3(μ3-O)} subunits, which display a connection between them through phenolate and oximate O atoms (Figure 1). Three Mn(III) metal ions of each {Mn3(μ3-O)} triangular subunit are mainly connected by three –N–O– bonds of salicylamidoxime molecules and a oxo group which is located approximately in the plane containing the triangle in 1 and 2.
In compound 1 there are two crystallographically independent Mn6 complexes. The Mn(III) metal ions in the center of 1 and 2 show a metal environment very close to those of earlier published amidoxime-based Mn6 compounds [32,33], exhibiting elongated Oh geometries with axial axes pretty much located at 90° about the main plane of the triangular subunits. The Mn-N-O-Mn angles of the {Mn3(μ3-O)} triangular subunits are 43.7, 41.2 and 26.1° and 38.0, 36.2 and 26.3° for 1 and 42.9, 36.9 and 24.4° for 2. These torsion angles values are very important to explain the magnetic properties of this type of Mn6 complexes [15,16,17,18,19,20,21,22,23,24,25,26,27,28,29,30,31,32,33]. In both compounds, the coordinated lipoate ligand is bonded to the Mn(3) ion and to its symmetry equivalent [Mn(3a); (a) = -x, -y, -z+1 for 1 and (a) = -x+1, -y+1, -z+1 for 2], by means of the carboxylate group in a monodentate fashion, as previously reported for other carboxylate-based ligands in this family of complexes [15,16,17,18,19,20,21,22,23,24,25,26,27]. In both cases, the lipoate ligand exhibits average values of the S–S, C–S and C–C bond lengths of the dithiolane ring that are in agreement with those previously reported [31].
In the molecules arrangement of 1, the neutral Mn6 entities are linked through H-bonding interactions promoted by solvent MeOH molecules, oximate oxygen atoms and −NH2 groups of neighboring neutral Mn6 units via the N(9)···O(10)···O(24) pathway [N(9)···O(10) distance of ca. 2.89(1) Å and O(10)···O(24) distance of ca. 2.80(1) Å], thus generating a 1D motif based on Mn6 complexes (Figure 2). The shortest intermolecular S···S distance in 1 is approximately 11.44(1) Å [S(2)···S(1b) distance; (b) = x, y+1, z]. Further intermolecular crystal interactions formed through S atoms of the dithiolane rings and −C-H groups of salicylamidoxime ligands of adjacent Mn6 complexes [S···C distances cover the 3.4(1)-3.8(1) Å range; (c) = -x+1, -y+1, -z+1 and (d) = -x+2, -y+1, -z+2] link the Mn6 pseudo-chains leading to a 2D structure of alternating Mn6 complexes in 1 (Figure 3).
In the molecules arrangement of 2, adjacent discrete Mn6 entities are connected each other by means of hydrogen bonds, which involve −NH2 groups and O atoms of phenolate groups of close salicylamidoxime ligands [N(2)···O(4b) separation of ca. 2.99(1) Å; (b) = -x+3/2, -y+3/2, -z+1], leading to a 1D arrangement (Figure 2). Further H-bonded Mn6 molecules are linked by means of additional −NH2 and carboxylate groups of neighboring Mn6 entities [N(6)···O(11c) separation of approximately 3.05(1) Å; (c) = -x+1, y, -z+3/2], generating a 2D structure in 2 (Figure 3). The shortest intermolecular S···S distance in 2 is much more reduced than that found in 1 [S(1)···S(1d) separation of ca. 5.14(1) Å; (d) = -x+2, -y+1, -z+2]. Finally, weak interactions between S atoms of the dithiolane rings and −C-H groups of salicylamidoxime ligands of neighboring complexes [S···C separations spanning the ca. 3.4(1)-3.8(1) Å range; (c) = -x+1, -y+1, -z+1 and (d) = -x+2, -y+1, -z+2] link the Mn6 pseudo-chains leading to a 2D structure of alternating Mn6 complexes in 2 (Figure 3).
2.3. Analysis of the Hirshfeld Surfaces
The intermolecular interactions involving the neutral Mn6 complexes of 1 and 2 were further studied through the CrystalExplorer program [34]. By mapping the distances of the 3D surface formed having into account the nearest atom outside (de) and inside (di) distances of each studied molecule and a normalized contact distance (dnorm), that overcomes some limitations generated by the atom size, this program allowed the qualitative and quantitative study of the significant molecular contacts [34,35,36]. It is displayed with a set of colors. Red color is used for short contacts, white indicates contacts interactions close to the van der Waals distances, and blue is assigned to long interactions. With all this information, it is generated a fingerprint, which is a 2D plot outline of the involved molecular interactions [35,36,37,38]. The Hirshfeld surfaces for complexes 1 and 2 are the first ones reported for oxime-based Mn6 entities and are given in Figure 4 and Figure 5, respectively. The intermolecular O···H contacts formed among the -NH2 groups of salicylamidoxime ligands and solvent MeOH molecules, which connect the Mn6 complexes in 1, are approximately 14% of the complete fingerprint plot (Figure 4). Besides, intermolecular weak S···H contacts involving S atoms of the dithiolane rings and –C-H groups of salicylamidoxime ligands of adjacent Mn6 entities cover ca. 6% of the graphic outline of complex 1 (Figure 4). In complex 2, intermolecular O···H contacts generated by H-bonding interactions, which are formed between the -NH2 groups of salicylamidoxime ligands and carboxylate groups of neighboring Mn6 molecules, are close to 11% of the complete fingerprint plot (Figure 5) and, therefore, it is a somewhat lower percentage than that detected for O···H contacts in complex 1. Finally, intermolecular S···H contacts are also observed in complex 2, in this case, displaying a higher percentage (ca. 12% of the complete fingerprint plot) than that shown in complex 1 (Figure 4 and Figure 5).
2.4. Study of the Magnetic Properties
Dc magnetic susceptibility studies were carried out on microcrystalline samples of both compounds in the temperature range from 300 to 1.9 K. An external magnetic field of Hdc = 0.5 T was employed. χMT vs T curves of 1 and 2 are shown in Figure 6. At T = 300 K, the initial χMT values are approximately 19.2 (1) and 18.3 cm3mol-1K (2). These χMT values are very close to that expected for six isolated Mn(III) metal ions, with S = 2 and g = 1.99 values for each metal ion, which are in accordance with those earlier published for amidoxime-based hexanuclear Mn(III) complexes [15,16,17,18,19,20,21,22,23,24,25,26,27]. With cooling, the χMT value in complex 1 remains pretty much constant to 200 K, before χMT slightly increases to reach a value of ca. 21.2 cm3mol-1K at 60 K. Afterwards, χMT value decreases very fast to finish with a value of ca. 6.5 cm3mol-1K at 1.9 K (Figure 6). In complex 2, χMT value follows the Curie law with reducing temperature to 150 K, before χMT somewhat rises to get a number of approximately 19.2 cm3mol-1K at 35 K. Finally, χMT decreases very fast reaching a final number of ca. 8.3 cm3mol-1K at 2 K (Figure 6). The decrease of the χMT values displayed at low temperature by 1 and 2 are likely due to the ocurrence of molecular magnetic exchange and/or zero-field splitting (ZFS) consequence, which have been earlier published for close Mn6 systems [15,16,17,18,19,20,21,22,23,24,25,26,27].
The experimental magnetic susceptibility values of the χMT vs T curves of 1 and 2 were analyzed employing a 2J model which can be exemplified through the isotropic Hamiltonian shown in equation (1), where J1 and J2 are the magnetic exchange constants for the molecular manganese-manganese couplings assuming the pathway based on the Mn–N–O–Mn set of atoms in the Mn6 entity. J1 is assigned to higher Mn–N–O–Mn torsion angles and J2 with the lower ones (Figure S1). A term to account for the Zeeman result is also added to the final part of the Hamiltonian. The magnetic g parameter is the Landé factor for the involved metal ions. The best theoretical fit thus obtained gave the following parameters: g = 1.98, J1 = +1.95 cm-1 and J2 = -2.07 cm-1 for complex 1, and g = 1.99, J1 = +1.78 cm-1 and J2 = -2.04 cm-1 for complex 2. This theoretical 2J model reproduces very well the experimental magnetic susceptibility data in the reported temperature range (see solid red lines in Figure 6). The numbers computed for J1 and J2 are in line with the Mn–N–O–Mn angles obtained in the structures of both compounds, and are in agreement with earlier reported values of similar Mn6 compounds [15,16,17,18,19,20,21,22,23,24,25,26,27,28]. In both compounds, the global antiferromagnetic interaction (associated with J2) is the main magnetic exchange between the implicated Mn(III) ions, even though both magnetic contributions are important in both 1 and 2, as observed in their experimental curves (Figure 6), and both compounds exhibit at least a torsion angle value lower than the critical value of 27°, as indicated in the 2.2 section [21,22,23,24,25,26,27].
Ĥ = − 2𝐽1(Ŝ1·Ŝ3 + Ŝ1·Ŝ3' + Ŝ1·Ŝ1' + Ŝ1'·Ŝ3 + Ŝ1'·Ŝ3') − 2𝐽2(Ŝ1·Ŝ2 + Ŝ2·Ŝ3 + Ŝ1'·Ŝ2' + Ŝ2'·Ŝ3') + μBgHŜ
In general, in this family of Mn6 systems, the antiferromagnetic compounds display a spin S = 4 value, whereas the ferromagnetic compounds show a spin S = 12 value [15,16,17,18,19,20,21,22,23,24,25,26,27]. The reported χMT vs T plot for both 1 and 2 would be consistent with a global antiferromagnetic interaction and, a priori, a spin S = 4 value for the ground state would be expected for both 1 and 2. In fact, the simulation of the magnetic susceptibility data of 1 and 2 generated the plots of the energy vs spin value displayed in the respective insets in Figure 6, which was performed as in previous studies focused on Mn6 complexes [17,18,19,20,21]. In both compounds, the ground state spin value would be S = 4 and the first excited state would be S = 5, which is placed at 3.50 (1) and 2.97 cm-1 (2). In many other amidoxime-based Mn6 complexes with S = 4, which were previously studied, the first excited state was S = 3 [32,33]. These results match the S values obtained from the reduced magnetization data fits (Figure S2 and Figure S3).
Ac magnetic susceptibility studies were carried out on microcrystalline samples of 1 and 2 in the temperature range from 7 to 2 K. An ac magnetic field of Hac = 5.0 G oscillating at several frequency values (102-104 Hz range) was used. Slow relaxation of the magnetization is detected in 1 and 2 through out-of-phase ac signals (χ″M) that were detected at Hdc = 0 G. In this way, both 1 and 2 display Single-Molecule Magnet (SMM) behavior, which is typical for all the members of this oxime-based family of Mn6 compounds [15,16,17,18,19,20,21,22,23,24,25,26,27]. The magnetic relaxation of 1 and 2 was investigated by means of out-of-phase (χM″) ac susceptibilities vs frequency (ν/Hz) plots and out-of-phase (χM″) ac susceptibilities vs temperature (T/K) plots, which are given in Figure 7 and Figure 8, respectively. In the two types of ac plots, the data of each maximum in 1 show much higher intensity than those data of 2. Nevertheless, a similar magnetic relaxation would be observed for 1 and 2.
We have reported previous works dealing with systems where two Mn6 molecules coexist in the crystal structure and, hence, two clearly distinguishable χM″ peaks are observed and associated with the two Mn6 molecules [21,24]. This fact is not detected in the ac experimental data of compound 1.
In the insets of Figure 8 it is shown the ln(τ) vs 1/T plots for 1 and 2. In both compounds, the plotted data follows a straight line covering the ranges of approximately 0.27–0.38 (1) and 0.33–0.47 K−1 (2). These data were fitted through the same mechanism for the relaxation of magnetization, namely, Orbach, and following the Arrhenius equation or eqn (2), where τo is the pre-exponential factor, τ is the relaxation time, Ueff is the barrier to relaxation of the magnetization, and kB is the Boltzmann constant. The fitted data were plotted in their respective insets (Figure 8). Once fitted the experimental data of 1 and 2 by means of a least-squares fit of eqn (2), these parameters were obtained: τo = 2.54(1) × 10−10 s and Ueff = 40.9(1) K [28.4(1) cm−1] for 1 and τo = 2.80(2) × 10−10 s and Ueff = 33.0(2) K [22.9(2) cm−1] for 2.
τ−1 = τo−1exp(−Ueff/kBT)
The τo values reported for 1 and 2 are in concordance with those earlier published for Mn6 SMMs with S = 4 [13,17], and their computed Ueff values fall into the range previously reported for this family of compounds [24.0 K (16.7 cm-1) < Ueff < 86.0 K (59.8 cm-1)] [15,16,17,18,19,20,21,22,23,24,25,26,27].
3. Experimental Section
3.1. Preparation of the Complexes
3.1.1. Synthesis of 1
MnCl2·4H2O (150 mg, 0.75 mmol) was poured with constant stirring to a solution generated by salicylamidoxime (114 mg, 0.75 mmol) and lipoic acid (350 mg, 1.7 mmol) in MeOH (25 mL), then NEt3 (500 µL, 0.9 mmol) was added. After a 2h reaction, a dark green solution was formed along with a dark green microcrystalline solid of 1, which was separated by means of filtration and washed up with ethyl ether. Yield ca. 70%. Crystals suitable for X-ray diffraction data collection were grown through a concentrated acetone solution of the microcrystalline solid with MeOH. These crystals present two crystallographically independent Mn6 complexes, one of them contains 2-cyanophenolate ligand which was generated by partial hydrolysis of salicylamidoxime during the recrystallization process. Elemental analysis calculated (found) for the desolvated C64H68O24N12S4Mn6 compound: C, 41.6 (42.0); H, 3.7 (3.9); N, 9.1 (9.0)%. Selected IR data (in KBr/cm−1): peaks were observed at 3420 (s), 3312 (s), 1615 (vs), 1564 (m), 1530 (s), 1481 (w), 1441 (s), 1385 (w), 1310 (w), 1250 (w), 1143 (vw), 1020 (m), 908 (s), 880 (m), 750 (w), 681 (m), 640 (w), 578 (vw).
3.1.2. Synthesis of 2
Mn(NO3)2·4H2O (0.173 g, 0.688 mmol) was dissolved with continuous stirring in EtOH (20 mL), then salicylamidoxime (0.103 g, 0.670 mmol) was added, followed by lipoic acid (350 g, 1.7 mmol) and NEt3 (0.1 mL, 0.72 mmol). The resulting dark green solution was stirred for 1h and let to evaporate at room temperature. Crystals of 2 were obtained in 5 days and were suitable for X-ray diffraction. Yield: 55%. Elemental analysis calculated (found) for the desolvated C70H96O24N12S4Mn6 compound: C, 43.2 (42.9); H, 5.0 (4.8); N, 8.6 (9.0)%. Selected IR data (in KBr/cm−1): 3426 (s), 3314 (s), 1614 (vs), 1564 (m), 1529 (s), 1483 (w), 1442 (s), 1384 (w), 1311 (w), 1251 (w), 1147 (vw), 1022 (m), 910 (s), 881 (m), 755 (w), 683 (m), 642 (w), 580 (vw).
3.2. X-Ray Data Collection and Structure Refinement
X-ray diffraction data collection on single crystals of dimensions 0.13 x 0.04 x 0.03 (1) and 0.13 x 0.06 x 0.05 mm3 (2) were collected on a Bruker D8 Venture diffractometer with PHOTON II detector and by using monochromatised Mo-Kα radiation (λ = 0.71073 Å). Crystal parameters and refinement results for 1 and 2 are summarized in Table 1. The structures were solved by standard direct methods and subsequently completed by Fourier recycling using the SHELXTL [39] software packages and refined by the full-matrix least-squares refinements based on F2 with all observed reflections. The final graphical manipulations were performed with the DIAMOND [40] and CRYSTALMAKER [41] programs. CCDC 2253180 and 2253181 for 1 and 2, respectively.
3.3. Physical Measurements
Elemental analyses (C, H, N) were carried out on an Elemental Analyzer CE Instruments CHNS1100 in the Central Service for the Support to Experimental Research (SCSIE) at the University of Valencia. Infrared spectra (IR) of 1 and 2 were recorded with a PerkinElmer Spectrum 65 FT-IR spectrometer in the 4000-400 cm-1 region. Variable-temperature, solid-state (dc and ac) magnetic susceptibility data were measured on Quantum Design MPMS-XL SQUID and Physical Property Measurement System (PPMS) magnetometers. Experimental magnetic data were corrected for the diamagnetic contributions of both the sample holder and the eicosene. Besides, the molecular diamagnetic contribution for each compound was corrected through the tabulated Pascal’s constants [42].
4. Conclusions
In conclusion, the preparation, the structural study and the magnetic features of two novel Mn6 compounds based on oxime and lipoate ligands have been reported. The investigation of the magnetic properties of these Mn6 systems through dc magnetic susceptibility measurements reveals a very similar magnetic behavior, both compounds exhibiting both ferromagnetic and antiferromagnetic exchange among Mn(III) metal ions. Besides, ac magnetic susceptibility studies show slow relaxation of magnetization at Hdc = 0 G, these features showing the occurrence of Single-Molecule Magnet (SMM) phenomenon in both manganese compounds.
The relative stability and structural features of these two Mn(III) systems make them suitable SMMs to be studied on devices in the field of molecular spintronics. Indeed, we believe that our new lipoate-based complexes could be adequate systems to be grafted on surfaces or connected to junction devices, as previously done with similar Mn(III) systems functionalized with sulfur-based groups. This investigation is underway.
Supplementary Materials
The following supporting information can be downloaded at the website of this paper posted on Preprints.org, CIF file of 1. CIF file of 2.
Author Contributions
Conceptualization, J.M.-L.; funding acquisition, J.M.-L.; methodology, M.O.-A., C.R.-D., N.M. and J.M.-L.; investigation, M.O.-A., C.R.-D., N.M. and J.M.-L.; formal analysis, M.O.-A., C.R.-D., N.M. and J.M.-L.; writing-original draft preparation, J.M.-L.; writing-review and editing, J.M.-L. All authors have read and agreed to the published version of the manuscript.
Funding
This research was funded by Spanish Ministry of Science and Innovation [Grant numbers PID2019-109735GB-I00 and CEX2019-000919-M (Excellence Unit “María de Maeztu”)] and also by Generalitat Valenciana [Grant number AICO/2021/295].
Data Availability Statement
The raw data that support the findings of this study are available from the corresponding author upon reasonable request.
Acknowledgments
M.O.-A. thanks the Spanish “FPI fellowships” program.
Conflicts of Interest
The authors declare no conflict of interest.
References
- Liu, J.-L.; Chen, Y.-C.; Tong, M.-L. Symmetry strategies for high performance lanthanide-based single-molecule magnets. Chem. Soc. Rev. 2018, 47, 2431–2453. [Google Scholar] [CrossRef]
- Zabala-Lekuona, A.; Seco, J.M.; Colacio, E. Single-Molecule Magnets: From Mn12-ac to dysprosium metallocenes, a travel in time. Coord. Chem. Rev. 2021, 441, 213984. [Google Scholar] [CrossRef]
- Ferrando-Soria, J.; Vallejo, J.; Castellano, M.; Martínez-Lillo, J.; Pardo, E.; Cano, J.; Castro, I.; Lloret, F.; Ruiz-García, R.; Julve, M. Molecular magnetism, quo vadis? A historical perspective from a coordination chemist viewpoint. Coord. Chem. Rev. 2017, 339, 17–103. [Google Scholar] [CrossRef]
- Guo, F.-S.; Day, B. M.; Chen, Y.-C.; Tong, M.-L.; Mansikkamäki, A.; Layfield, R.A. Magnetic hysteresis up to 80 kelvin in a dysprosium metallocene single-molecule magnet. Science 2018, 362, 1400–1403. [Google Scholar] [CrossRef] [PubMed]
- Gebrezgiabher, M.; Bayeh, Y.; Gebretsadik, T.; Gebreslassie, G.; Elemo, F.; Thomas, M.; Linert, W. Lanthanide-Based Single-Molecule Magnets Derived from Schiff Base Ligands of Salicylaldehyde Derivatives. Inorganics 2020, 8, 66. [Google Scholar] [CrossRef]
- Orts-Arroyo, M.; Castro, I.; Lloret, F.; Martínez-Lillo, J. Field-induced slow relaxation of magnetisation in two one-dimensional homometallic dysprosium(III) complexes based on alpha- and beta-amino acids. Dalton Trans. 2020, 49, 9155–9163. [Google Scholar] [CrossRef] [PubMed]
- Bogani, L.; Wernsdorfer, W. Molecular spintronics using single-molecule magnets. Nat. Mater. 2008, 7, 179–186. [Google Scholar] [CrossRef] [PubMed]
- Sanvito, S. Molecular spintronics. Chem. Soc. Rev. 2011, 40, 3336–3355. [Google Scholar] [CrossRef]
- Cornia, A.; Pierre Seneor, P. The molecular way. Nat. Mater. 2017, 16, 505–506. [Google Scholar] [CrossRef]
- Clemente-Juan, J.M.; Coronado, E.; Gaita-Ariño, A. Magnetic polyoxometalates: from molecular magnetism to molecular spintronics and quantum computing. Chem. Soc. Rev. 2012, 41, 7464–7478. [Google Scholar] [CrossRef]
- Tyagi, P.; Li, D.; Holmes, S.M.; Hinds, B.J. Molecular Electrodes at the Exposed Edge of Metal/Insulator/Metal Trilayer Structures. J. Am. Chem. Soc. 2007, 129, 4929–4938. [Google Scholar] [CrossRef] [PubMed]
- Komeda, T.; Isshiki, H.; Liu, J.; Zhang, Y.-F.; N. Lorente, N.; Katoh, K.; Breedlove, B.K.; Yamashita, M. Observation and electric current control of a local spin in a single-molecule magnet. Nat. Commun. 2011, 2, 217. [Google Scholar] [CrossRef] [PubMed]
- Guo, L.; Gu, X.; Zhu, X.; Sun, X. Recent Advances in Molecular Spintronics: Multifunctional Spintronic Devices. Adv. Mater. 2019, 31, 1805355. [Google Scholar] [CrossRef] [PubMed]
- Lewkowitz, M.; Adams, J.; Sullivan, N.S.; Wang, P.; Shatruk, M.; Zapf, V.; Arvij, A.S. Direct observation of electric field-induced magnetism in a molecular magnet. Sci Rep. 2023, 13, 2769. [Google Scholar] [CrossRef] [PubMed]
- Milios, C.J.; Raptopoulou, C.P.; Terzis, A.; Lloret, F.; Vicente, R.; Perlepes, S.P.; Escuer, A. Hexanuclear manganese(III) single-molecule magnets. Angew. Chem. Int. Ed. 2004, 43, 210–212. [Google Scholar] [CrossRef] [PubMed]
- Milios, C.J.; Vinslava, A.; Wood, P.A.; Parsons, S.; Wernsdorfer, W.; Christou, G.; Perlepes, S.P.; Brechin, E.K. A Single-Molecule Magnet with a “Twist”. J. Am. Chem. Soc. 2007, 129, 8–9. [Google Scholar] [CrossRef] [PubMed]
- Milios, C.J.; Vinslava, A.; Wernsdorfer, W.; Moggach, S.; Parsons, S.; Perlepes, S.P.; Christou, G.; Brechin, E.K. A Record Anisotropy Barrier for a Single-Molecule Magnet. J. Am. Chem. Soc. 2007, 129, 2754–2755. [Google Scholar] [CrossRef]
- Milios, C.J.; Piligkos, S.; Brechin, E.K. Ground state spin-switching via targeted structural distortion: Twisted single-molecule magnets from derivatised salicylaldoximes. Dalton Trans. 2008, 14, 1809–1817. [Google Scholar] [CrossRef]
- Inglis, R.; Milios, C.J.; Jones, L.F.; Piligkos, S.; Brechin, E.K. Twisted molecular magnets. Chem. Commun. 2012, 48, 181–190. [Google Scholar] [CrossRef]
- Kalofolias, D.A.; Flamourakis, A.G.; Siczek, M.; Lis, T.; Milios, C.J. A bulky oxime for the synthesis of Mn(III) clusters. J. Coord. Chem. 2015, 68, 1–20. [Google Scholar] [CrossRef]
- Tomsa, A.-R.; Martínez-Lillo, J.; Li, Y.; Chamoreau, L.-M.; Boubekeur, K.; Farias, F.; Novak, M.A.; Cremades, E.; Ruiz, E.; Proust, A.; et al. A new family of oxime-based hexanuclear manganese(III) single-molecule magnets with high anisotropy energy barriers. Chem. Commun. 2010, 46, 5106–5108. [Google Scholar] [CrossRef] [PubMed]
- Jiang, X.; Liu, C.-M.; Kou, H.-Z. Porous Coordination Polymers Based on {Mn6} Single-Molecule Magnets. Inorg. Chem. 2016, 55, 5880–5885. [Google Scholar] [CrossRef] [PubMed]
- Martínez-Lillo, J.; Chamoreau, L.-M.; Proust, A.; Verdaguer, M.; Gouzerh, P. Hexanuclear manganese(III) single-molecule magnets from derivatized salicylamidoximes. C. R. Chim. 2012, 15, 889–894. [Google Scholar] [CrossRef]
- Martínez-Lillo, J.; Tomsa, A.-R.; Li, Y.; Chamoreau, L.-M.; Cremades, E.; Ruiz, E.; Barra, A.-L.; Proust, A.; Verdaguer, M.; Gouzerh, P. Synthesis, crystal structure and magnetism of new salicylamidoxime-based hexanuclear manganese(III) single-molecule magnets. Dalton Trans. 2012, 41, 13668–13681. [Google Scholar] [CrossRef] [PubMed]
- Martínez-Lillo, J.; Dolan, N.; Brechin, E.K. A cationic and ferromagnetic hexametallic Mn(III) single-molecule magnet based on the salicylamidoxime ligand. Dalton Trans. 2013, 42, 12824–12827. [Google Scholar] [CrossRef] [PubMed]
- Martínez-Lillo, J.; Dolan, N.; Brechin, E.K. A family of cationic oxime-based hexametallic manganese(III) single-molecule magnets. Dalton Trans. 2014, 43, 4408–4414. [Google Scholar] [CrossRef] [PubMed]
- Martínez-Lillo, J.; Cano, J.; Wernsdorfer, W.; Brechin, E.K. The Effect of Crystal Packing and ReIV Ions on the Magnetisation Relaxation of [Mn6]-Based Molecular Magnets. Chem. Eur. J. 2015, 21, 8790–8798. [Google Scholar] [CrossRef]
- Rojas-Dotti, C.; Martínez-Lillo, J. Thioester-functionalised and oxime-based hexametallic manganese(III) single-molecule magnets. RSC Adv. 2017, 7, 48841–48847. [Google Scholar] [CrossRef]
- Tyagi, P.; Riso, Ch.; Amir, U. , Rojas-Dotti, C.; Martínez-Lillo, J. Exploring room-temperature transport of single-molecule magnet-based molecular spintronics devices using the magnetic tunnel junction as a device platform. RSC Adv. 2020, 10, 13006–13015. [Google Scholar] [CrossRef]
- Grizzle, A.; D'Angelo, Ch.; Martínez-Lillo, J.; Tyagi, P. Spin state of a single-molecule magnet (SMM) creating long-range ordering on ferromagnetic layers of a magnetic tunnel junction – a Monte Carlo study. RSC Adv. 2021, 11, 32275–32285. [Google Scholar] [CrossRef]
- Mitcov, D.; Pedersen, A.H.; Ceccato, M.; Gelardi, R.M.; Hassenkam, T.; Konstantatos, A.; Reinholdt, A.; Sørensen, M.A.; Thulstrup, P.W.; Vinum, M.G.; Wilhelm, F.; Rogalev, A.; Wernsdorfer, W.; Brechin, E.K.; Piligkos, S. Molecular multifunctionality preservation upon surface deposition for a chiral single-molecule magnet. Chem. Sci. 2019, 10, 3065–3073. [Google Scholar] [CrossRef] [PubMed]
- Rojas-Dotti, C.; Moliner, N.; Lloret, F.; Martínez-Lillo, J. Ferromagnetic Oxime-Based Manganese(III) Single-Molecule Magnets with Dimethylformamide and Pyridine as Terminal Ligands. Crystals 2019, 9, 23. [Google Scholar] [CrossRef]
- Rojas-Dotti, C.; Moliner, N.; Lloret, F.; Martínez-Lillo, J. Hexanuclear manganese(III) single-molecule magnets based on oxime and azole-type ligands. Polyhedron 2019, 170, 223–231. [Google Scholar] [CrossRef]
- Turner, M.J.; McKinnon, J.J.; Wolff, S.K.; Grimwood, D.J.; Spackman, P.R.; Jayatilaka, D.; Spackman, M.A. CrystalExplorer 17; University of Western Australia, 2017.
- McKinnon, J.J.; Jayatilaka, D.; Spackman, M.A. Towards quantitative analysis of intermolecular interactions with Hirshfeld surfaces. Chem. Commun. 2007, 3814–3816. [Google Scholar] [CrossRef] [PubMed]
- Spackman, M.A.; Jayatilaka, D. Hirshfeld surface analysis. CrystEngComm 2009, 11, 19–32. [Google Scholar] [CrossRef]
- Orts-Arroyo, M.; Ten-Esteve, A.; Ginés-Cárdenas, S.; Castro, I.; Martí-Bonmatí, L.; Martínez-Lillo, J. A Gadolinium(III) Complex Based on the Thymine Nucleobase with Properties Suitable for Magnetic Resonance Imaging. Int. J. Mol. Sci. 2021, 22, 4586. [Google Scholar] [CrossRef]
- Sanchis-Perucho, A.; Orts-Arroyo, M.; Castro, I.; Lloret, F.; Martínez-Lillo, J. Crystal polymorphism in 2,2'-bipyrimidine-based iridium(III) complexes. J. Coord. Chem. 2022, 75, 2495–2507. [Google Scholar] [CrossRef]
- SHELXTL-2013/4, Bruker Analytical X-ray Instruments, Madison, WI, 2013.
- Diamond 4.5.0, Crystal Impact GbR, CRYSTAL IMPACT, 2018.
- CrystalMaker 8.5.1, CrystalMaker Software Ltd, Oxford, England.
- Bain, G.A.; Berry, J.F. Diamagnetic Corrections and Pascal's Constants. J. Chem. Educ. 2008, 85, 532–536. [Google Scholar] [CrossRef]
Scheme 1.
Molecular structure of the D,L-α-lipoic acid.
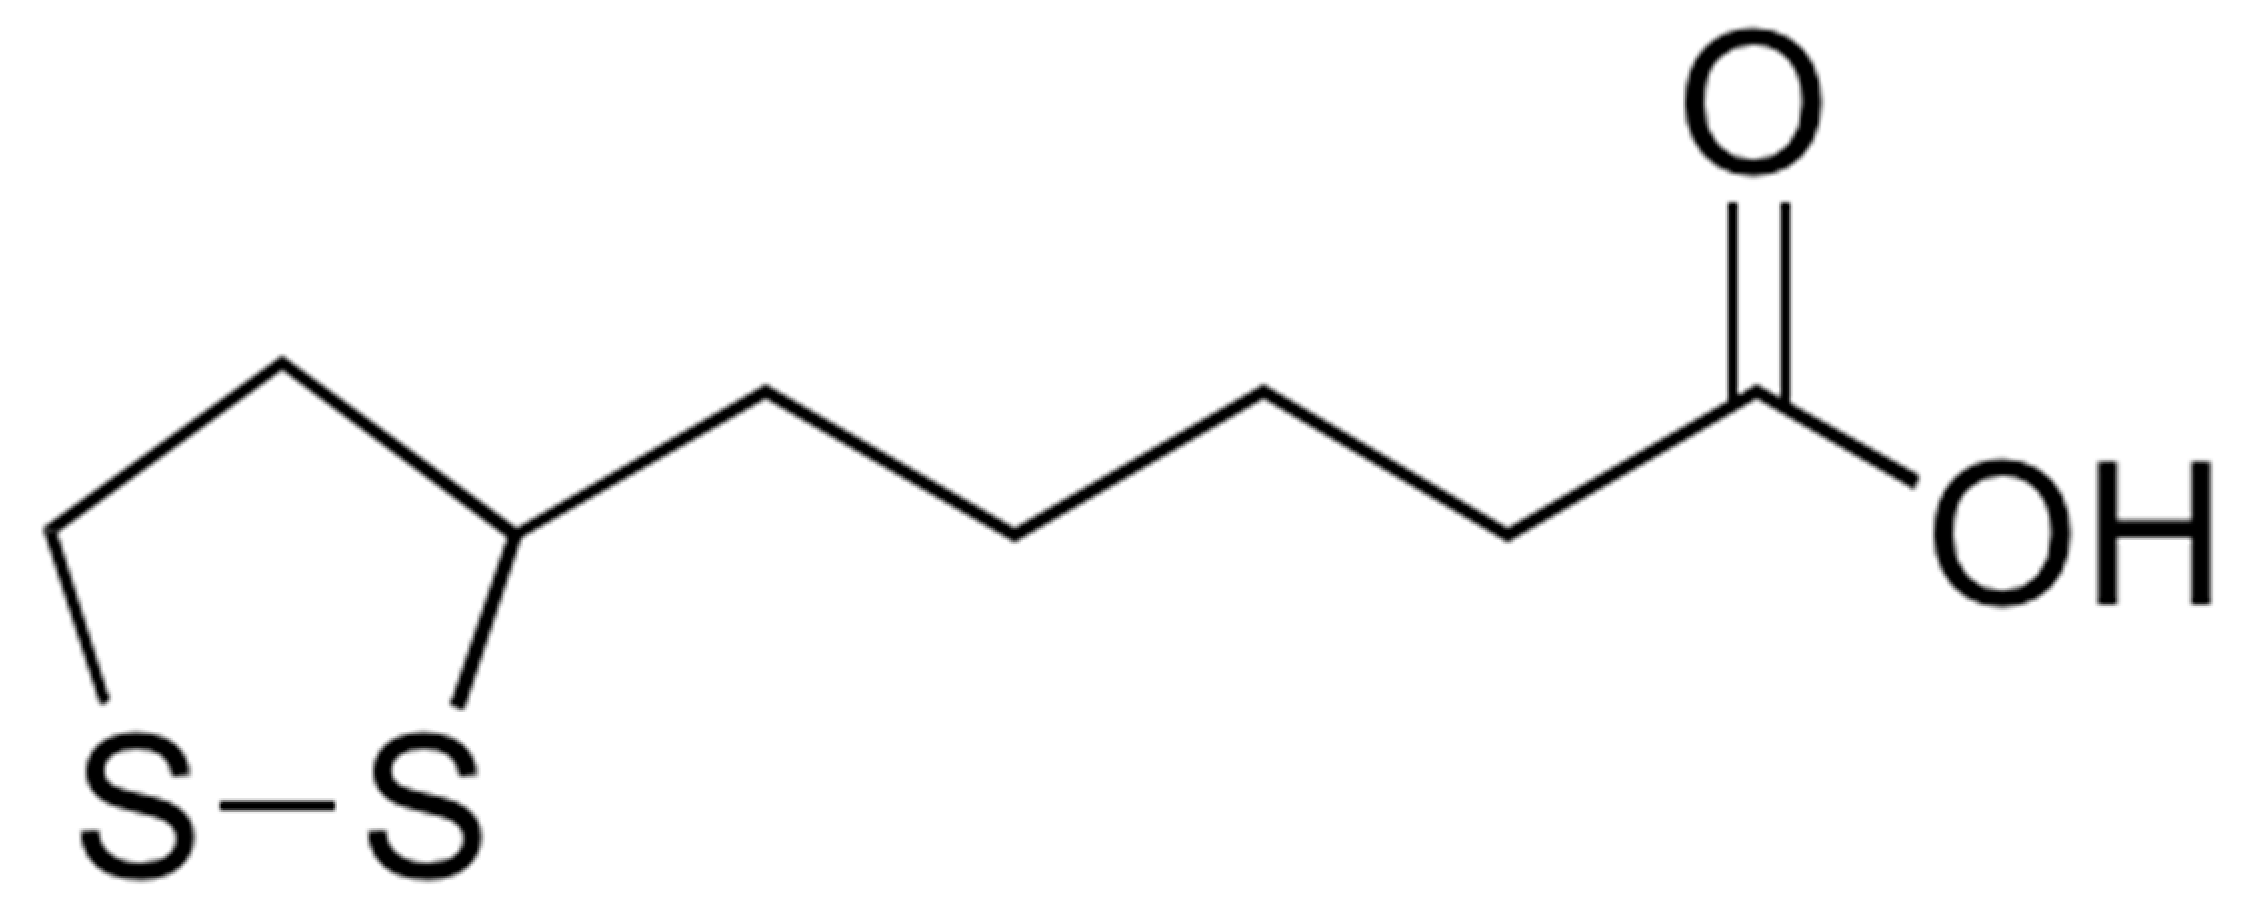
Figure 1.
(a) Detail of the hexanuclear [Mn6(μ3-O)2(H2N-sao)6(lip)2(MeOH)6] complex in 1; (b) Detail of the hexanuclear [Mn6(μ3-O)2(H2N-sao)6(lip)2(EtOH)6] complex in 2. H atoms and non-coordinating solvent molecules have been omitted. Color code: pink, Mn; yellow, S; red, O; blue, N; black, C.
Figure 1.
(a) Detail of the hexanuclear [Mn6(μ3-O)2(H2N-sao)6(lip)2(MeOH)6] complex in 1; (b) Detail of the hexanuclear [Mn6(μ3-O)2(H2N-sao)6(lip)2(EtOH)6] complex in 2. H atoms and non-coordinating solvent molecules have been omitted. Color code: pink, Mn; yellow, S; red, O; blue, N; black, C.
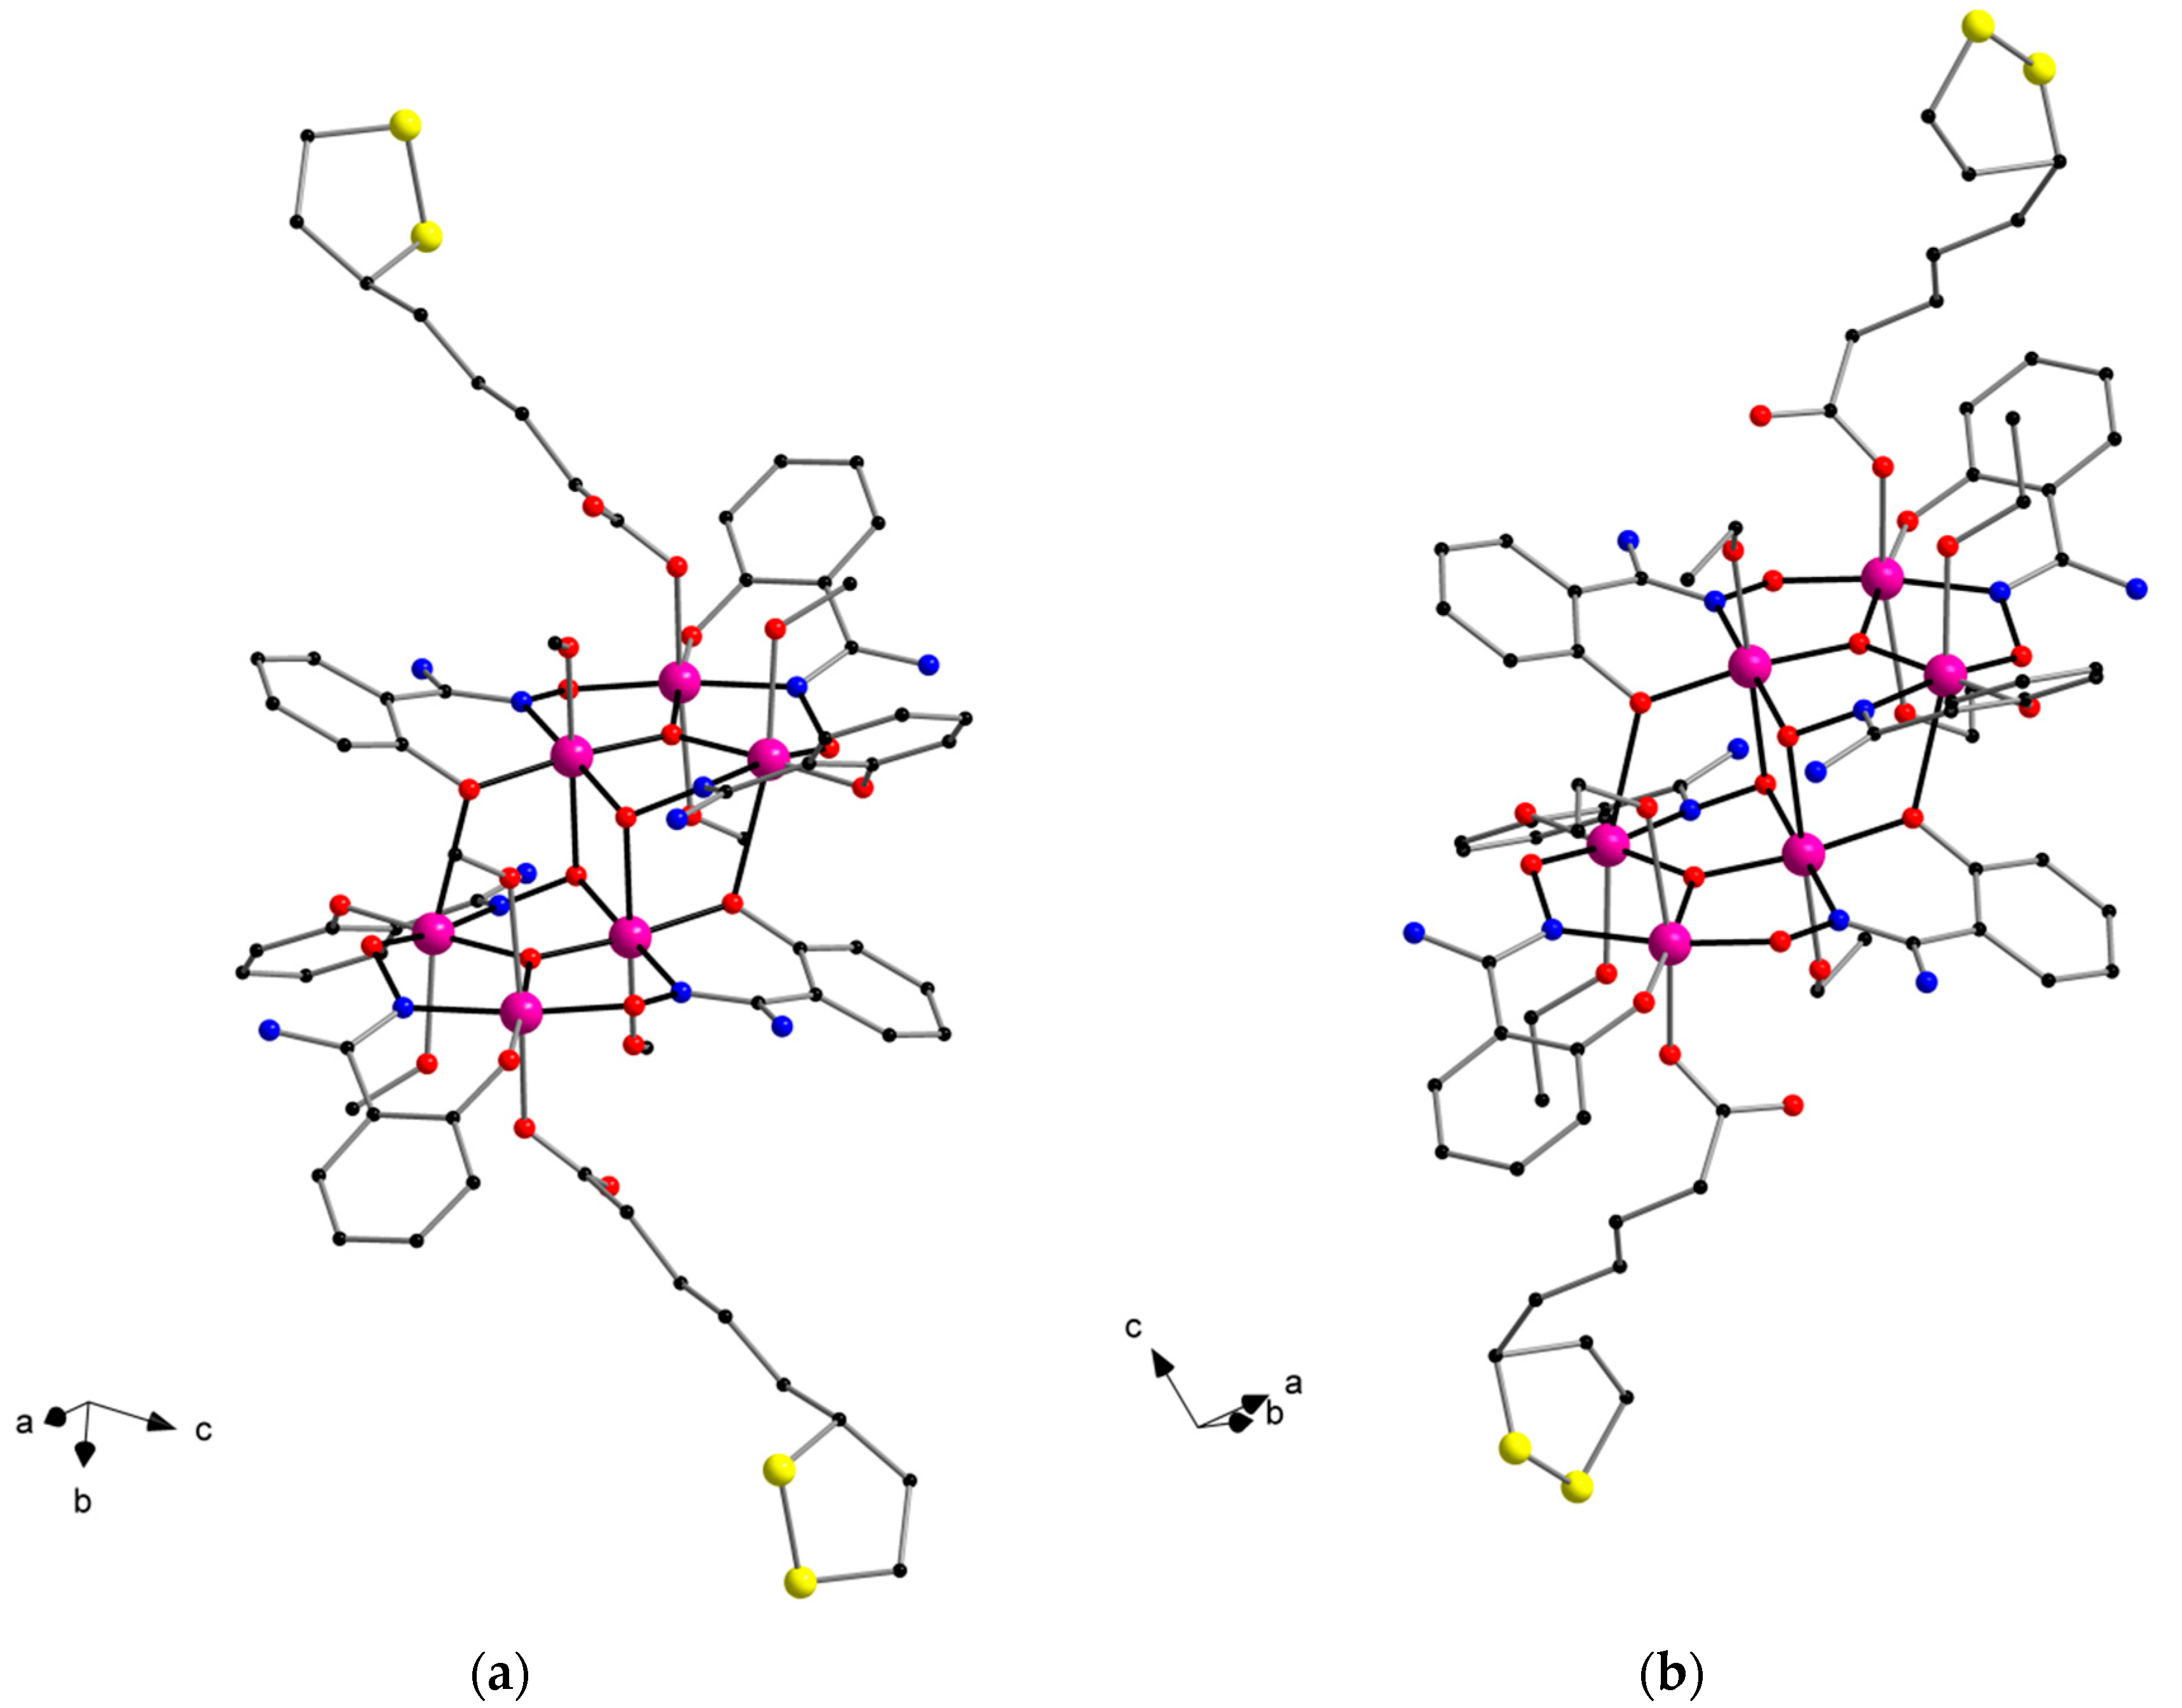
Figure 2.
(a) One-dimensional motif generated by H-bonding interactions of homometallic [Mn6(μ3-O)2(H2N-sao)6(lip)2(MeOH)6] complexes along with non-coordinating solvent molecules in 1; (b) View of the one-dimensional motif generated by H-bonding interactions of homometallic [Mn6(μ3-O)2(H2N-sao)6(lip)2(EtOH)6] complexes in 2.
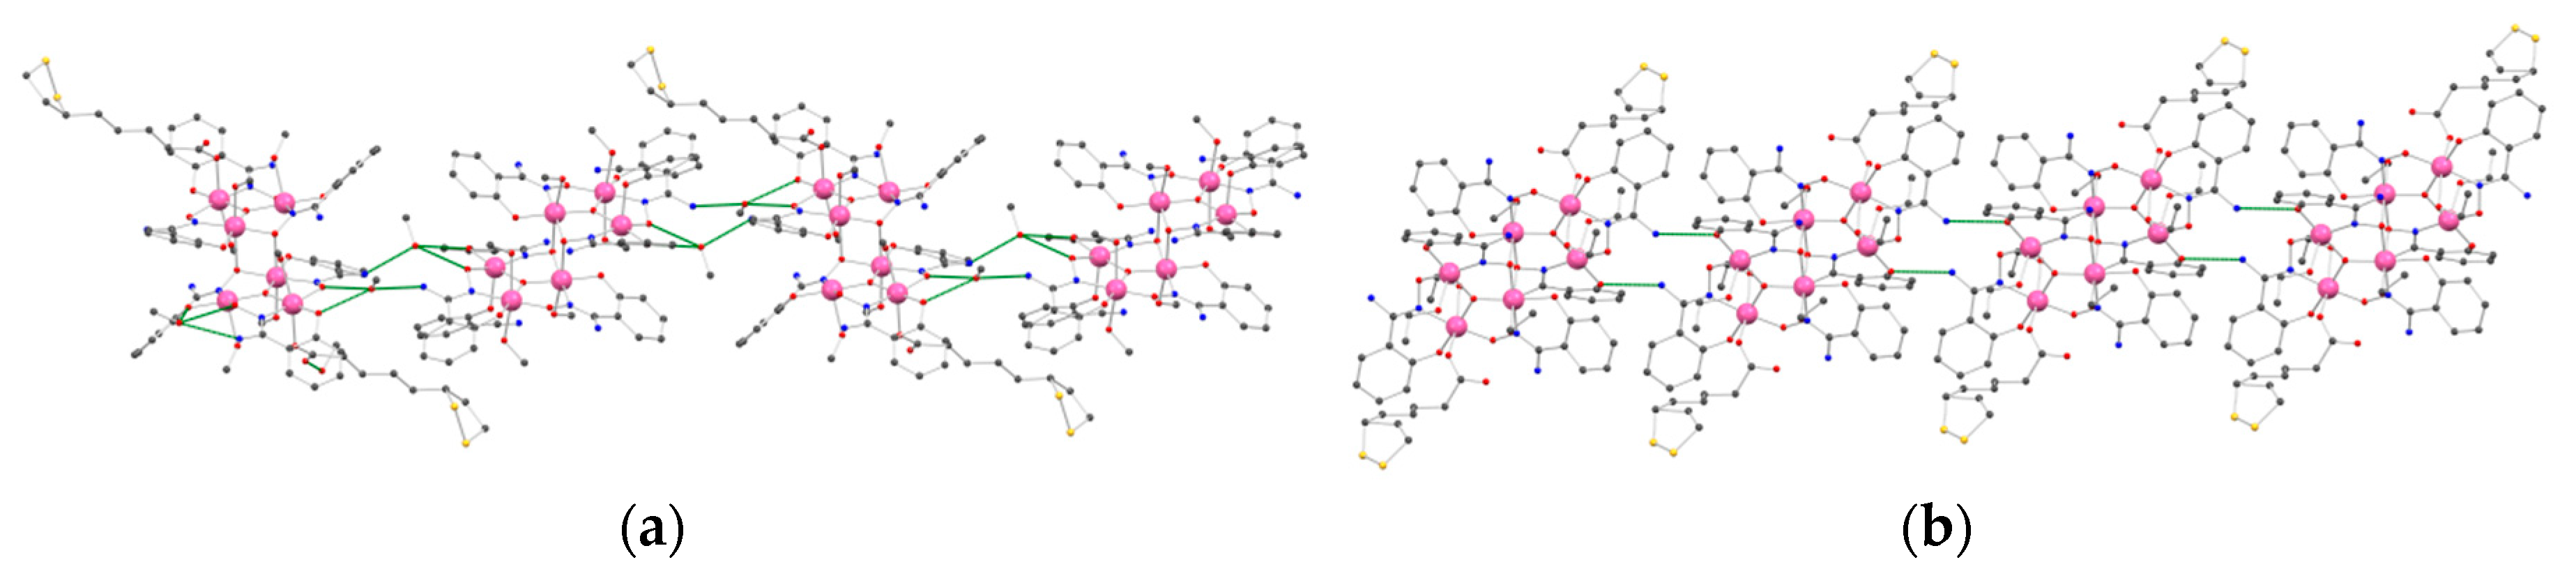
Figure 3.
A fragment of the crystal arrangement of Mn6 complexes in 1 (top); A fragment of the packing of Mn6 complexes in 2 (bottom). In both cases, H atoms have been omitted.
Figure 3.
A fragment of the crystal arrangement of Mn6 complexes in 1 (top); A fragment of the packing of Mn6 complexes in 2 (bottom). In both cases, H atoms have been omitted.
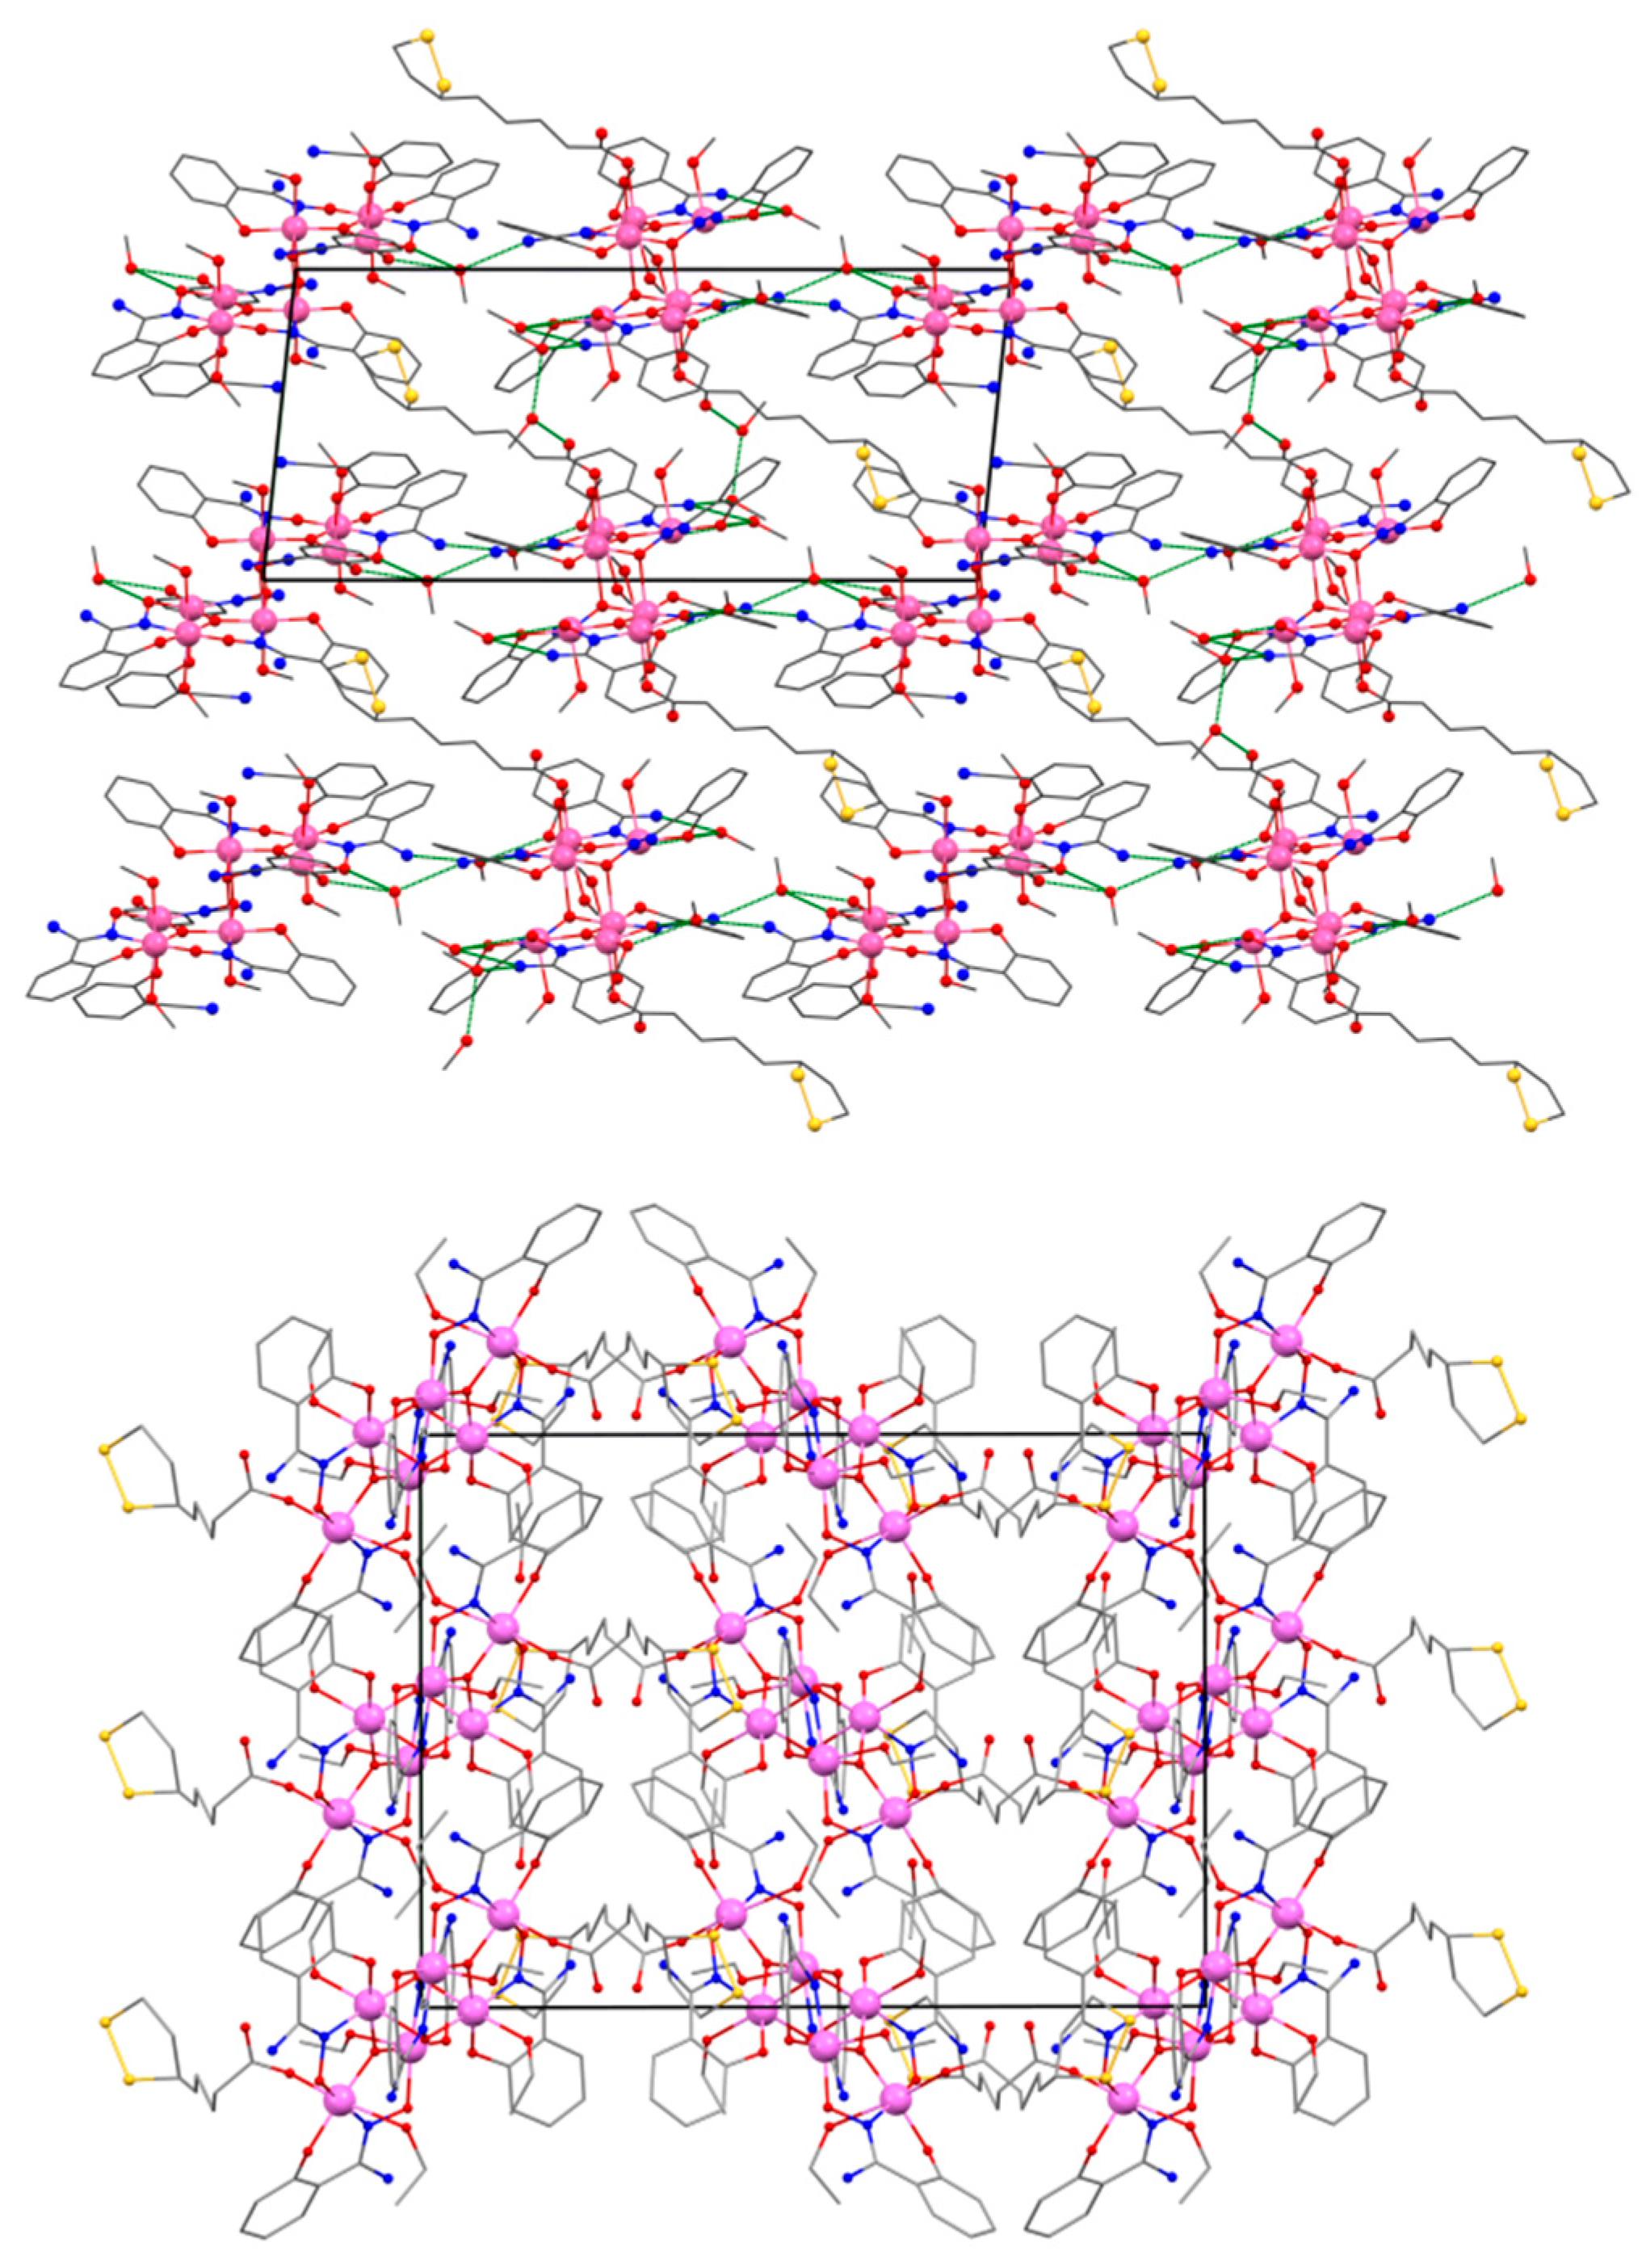
Figure 4.
Hirshfeld surface mapped by means of dnorm expression for the hexanuclear Mn(III) complex in 1 (left); Full fingerprint plot for complex 1 (right).
Figure 4.
Hirshfeld surface mapped by means of dnorm expression for the hexanuclear Mn(III) complex in 1 (left); Full fingerprint plot for complex 1 (right).
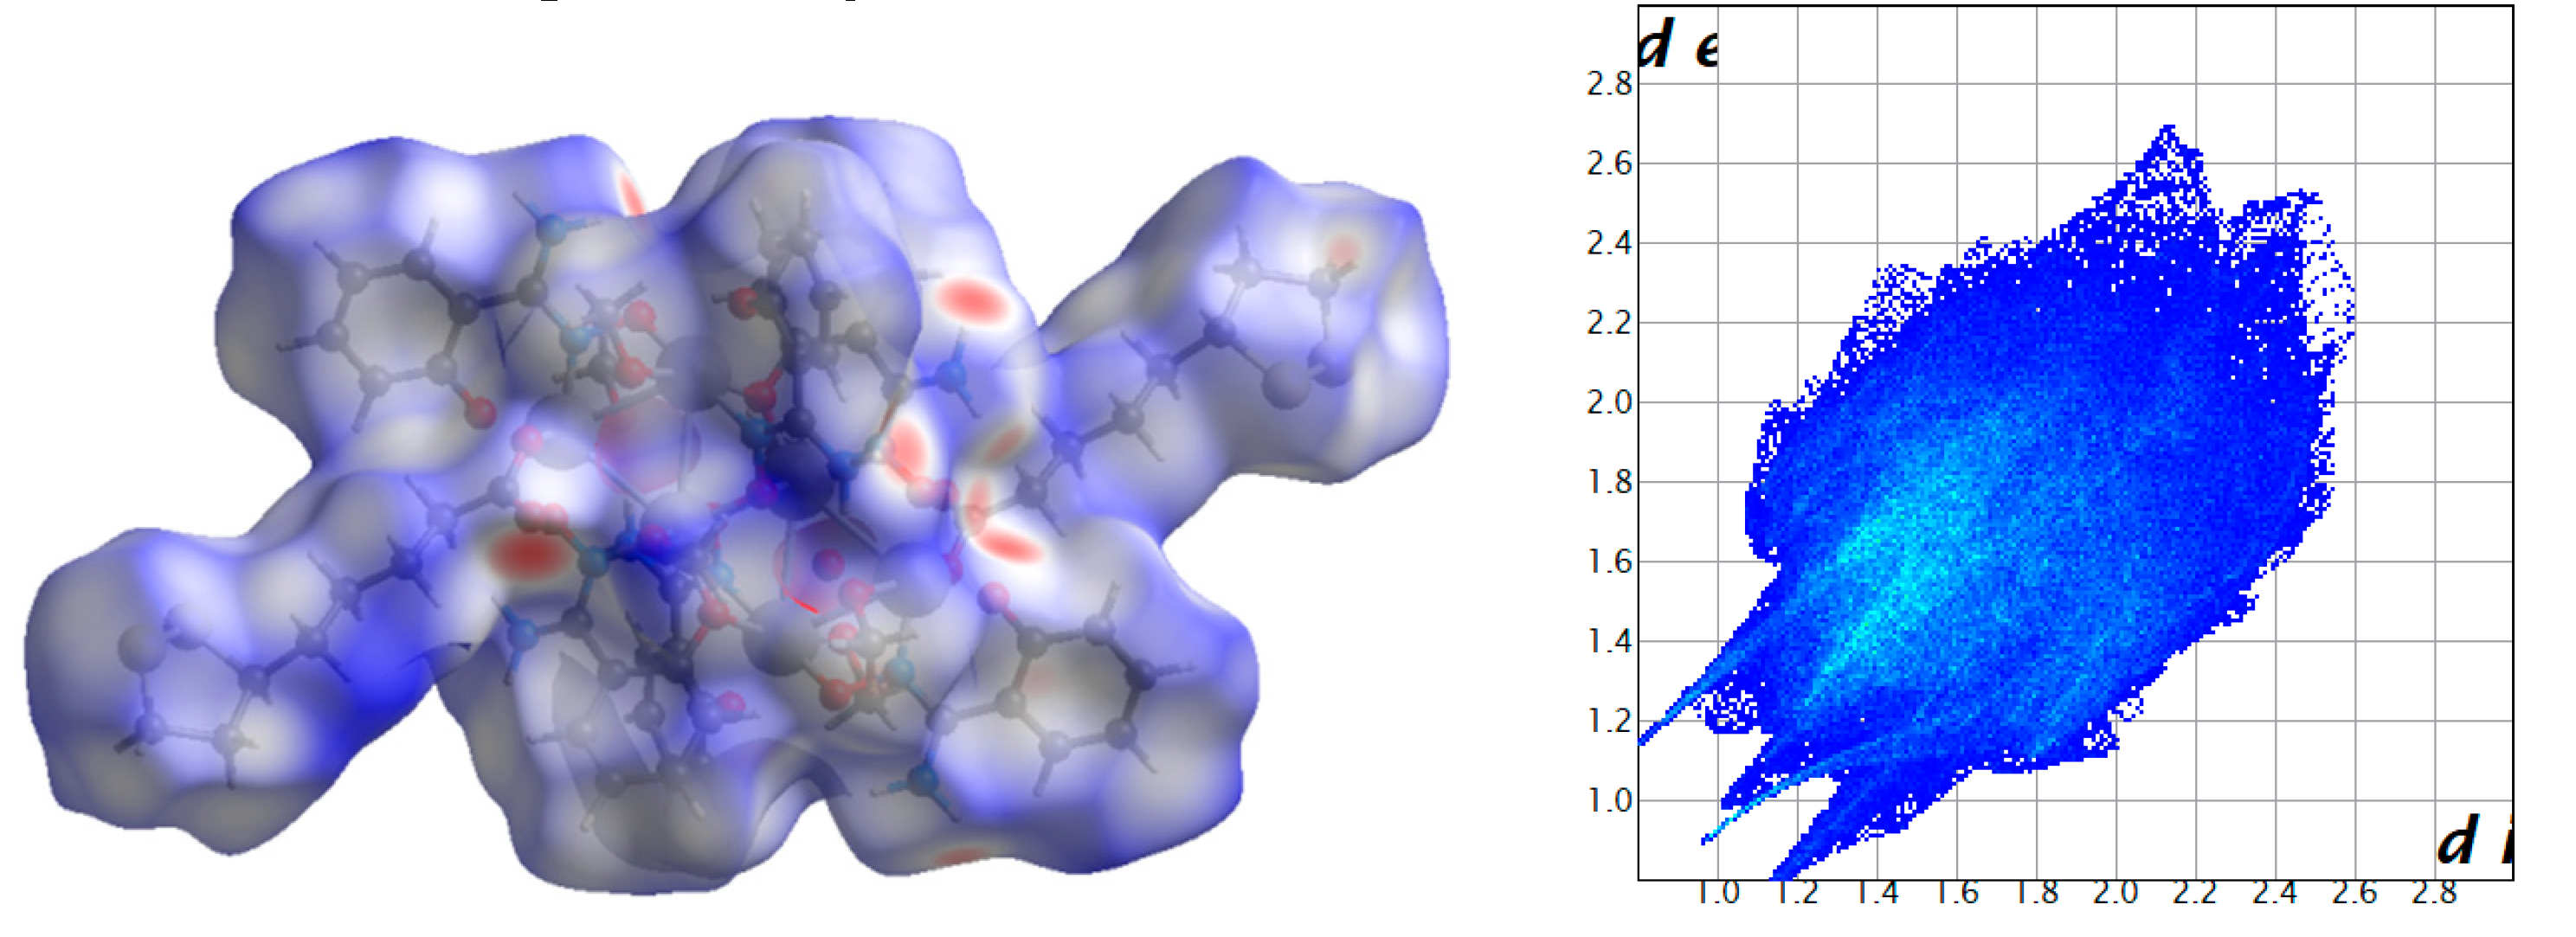
Figure 5.
Hirshfeld surface mapped by means of dnorm expression for the hexanuclear Mn(III) complex in 2 (left); Full fingerprint plot for complex 2 (right).
Figure 5.
Hirshfeld surface mapped by means of dnorm expression for the hexanuclear Mn(III) complex in 2 (left); Full fingerprint plot for complex 2 (right).
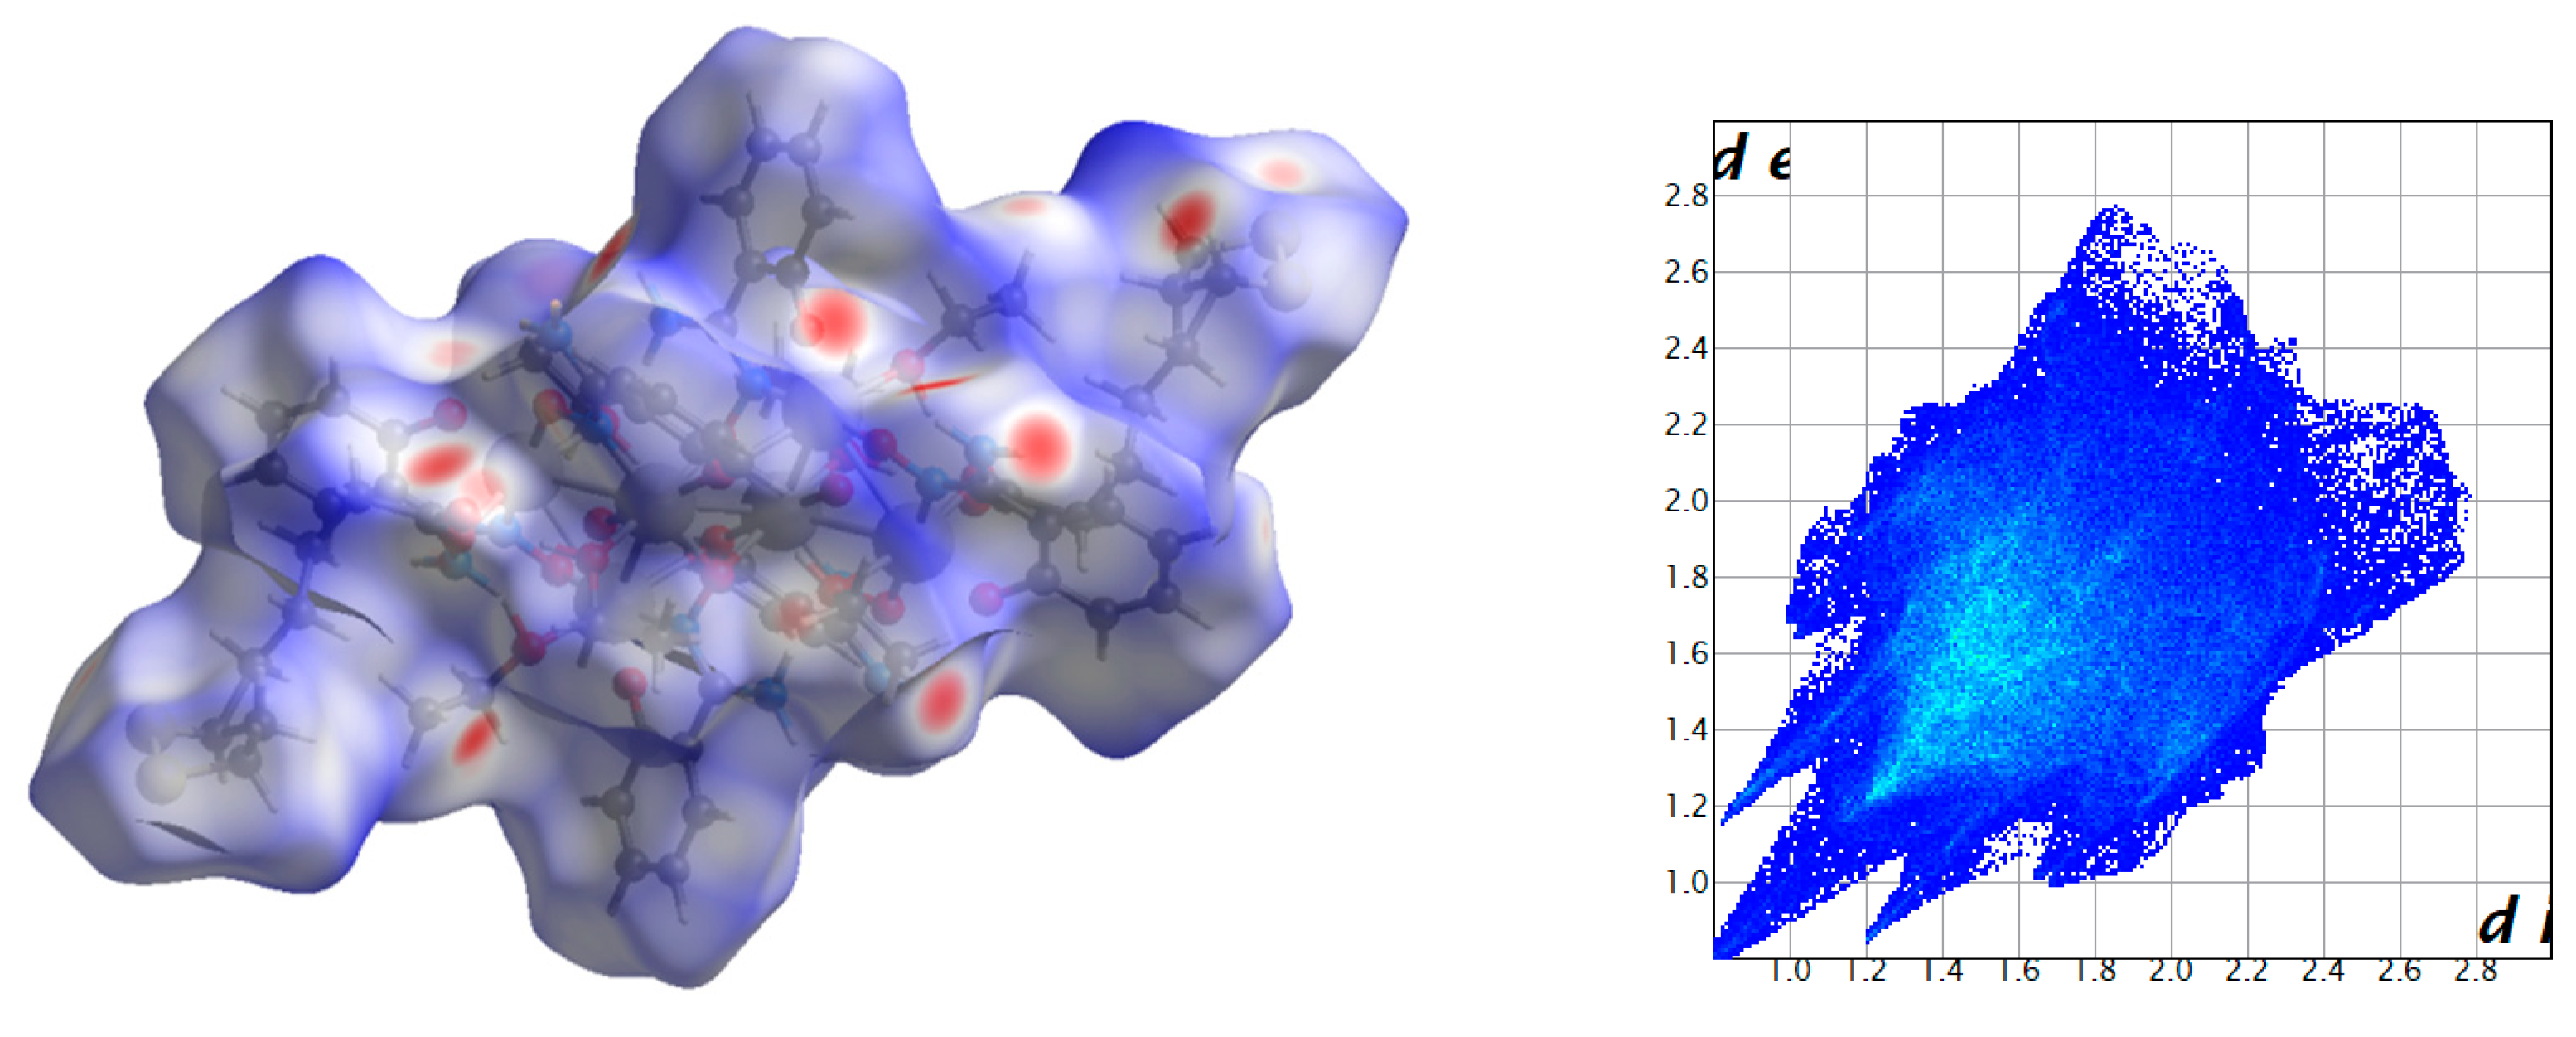
Figure 6.
Thermal variation of the χMT product for compounds 1 (left) and 2 (right). The solid red line indicates the fit of the experimental magnetic susceptibility values. The inset shows the plot of energy vs spin value (S) obtained from the isotropic simulation of the magnetic susceptibility data for each compound.
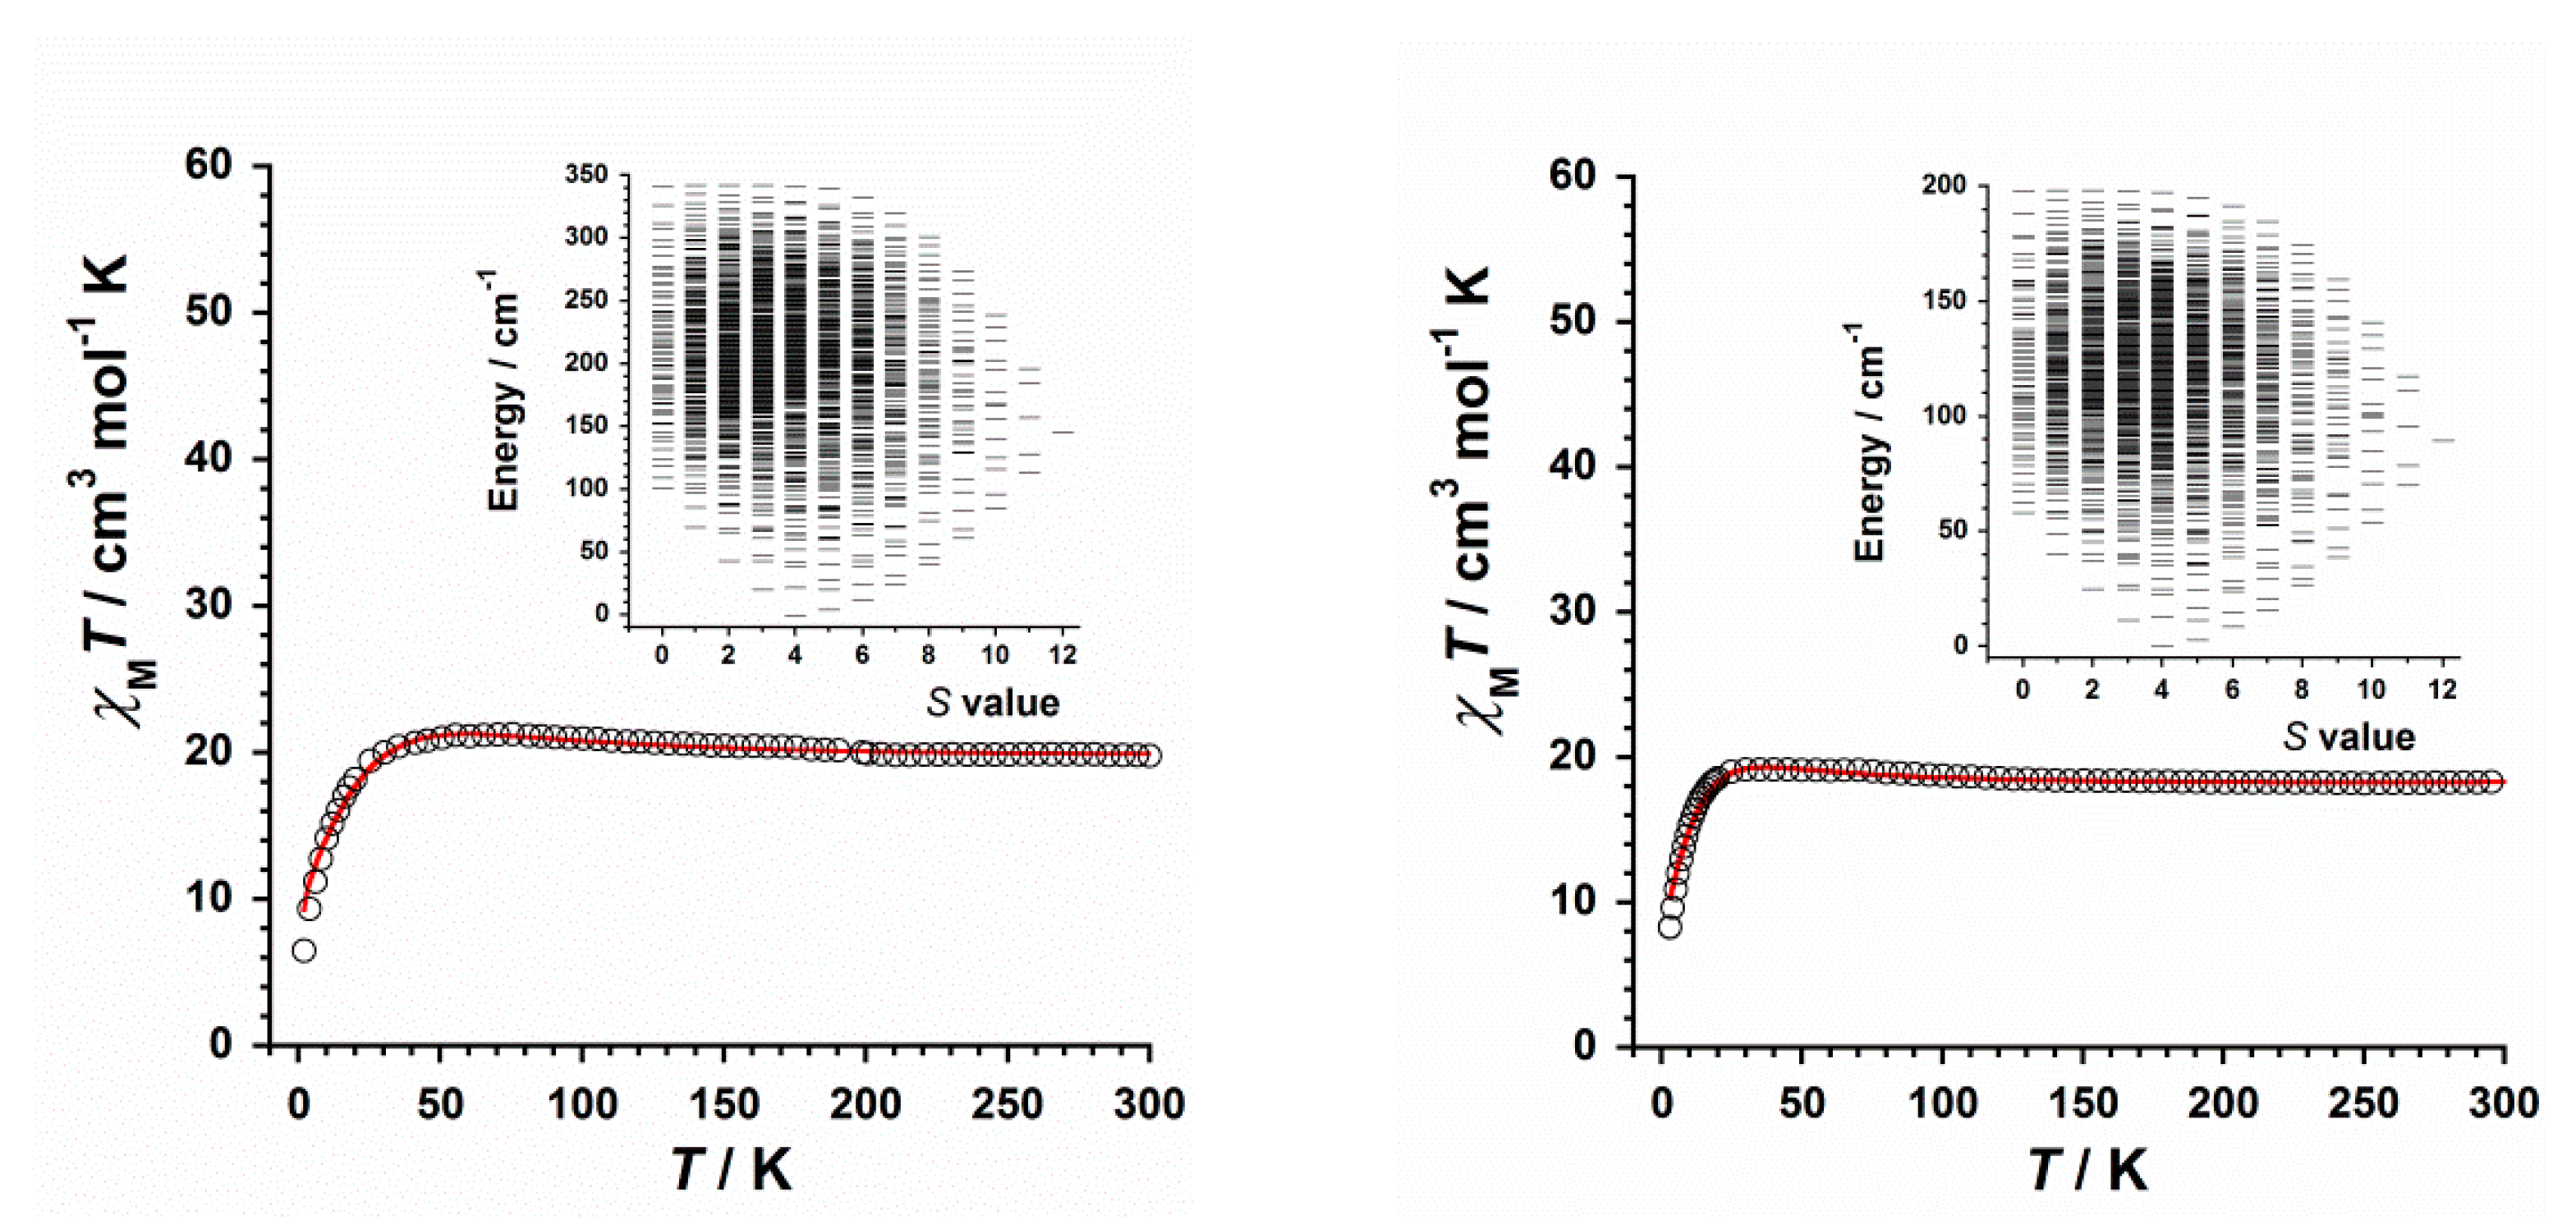
Figure 7.
Frequency dependence of the out-of-phase ac magnetic susceptibility signals obtained with a magnetic field of Hdc = 0 G for 1 (left) and 2 (right). .
Figure 7.
Frequency dependence of the out-of-phase ac magnetic susceptibility signals obtained with a magnetic field of Hdc = 0 G for 1 (left) and 2 (right). .
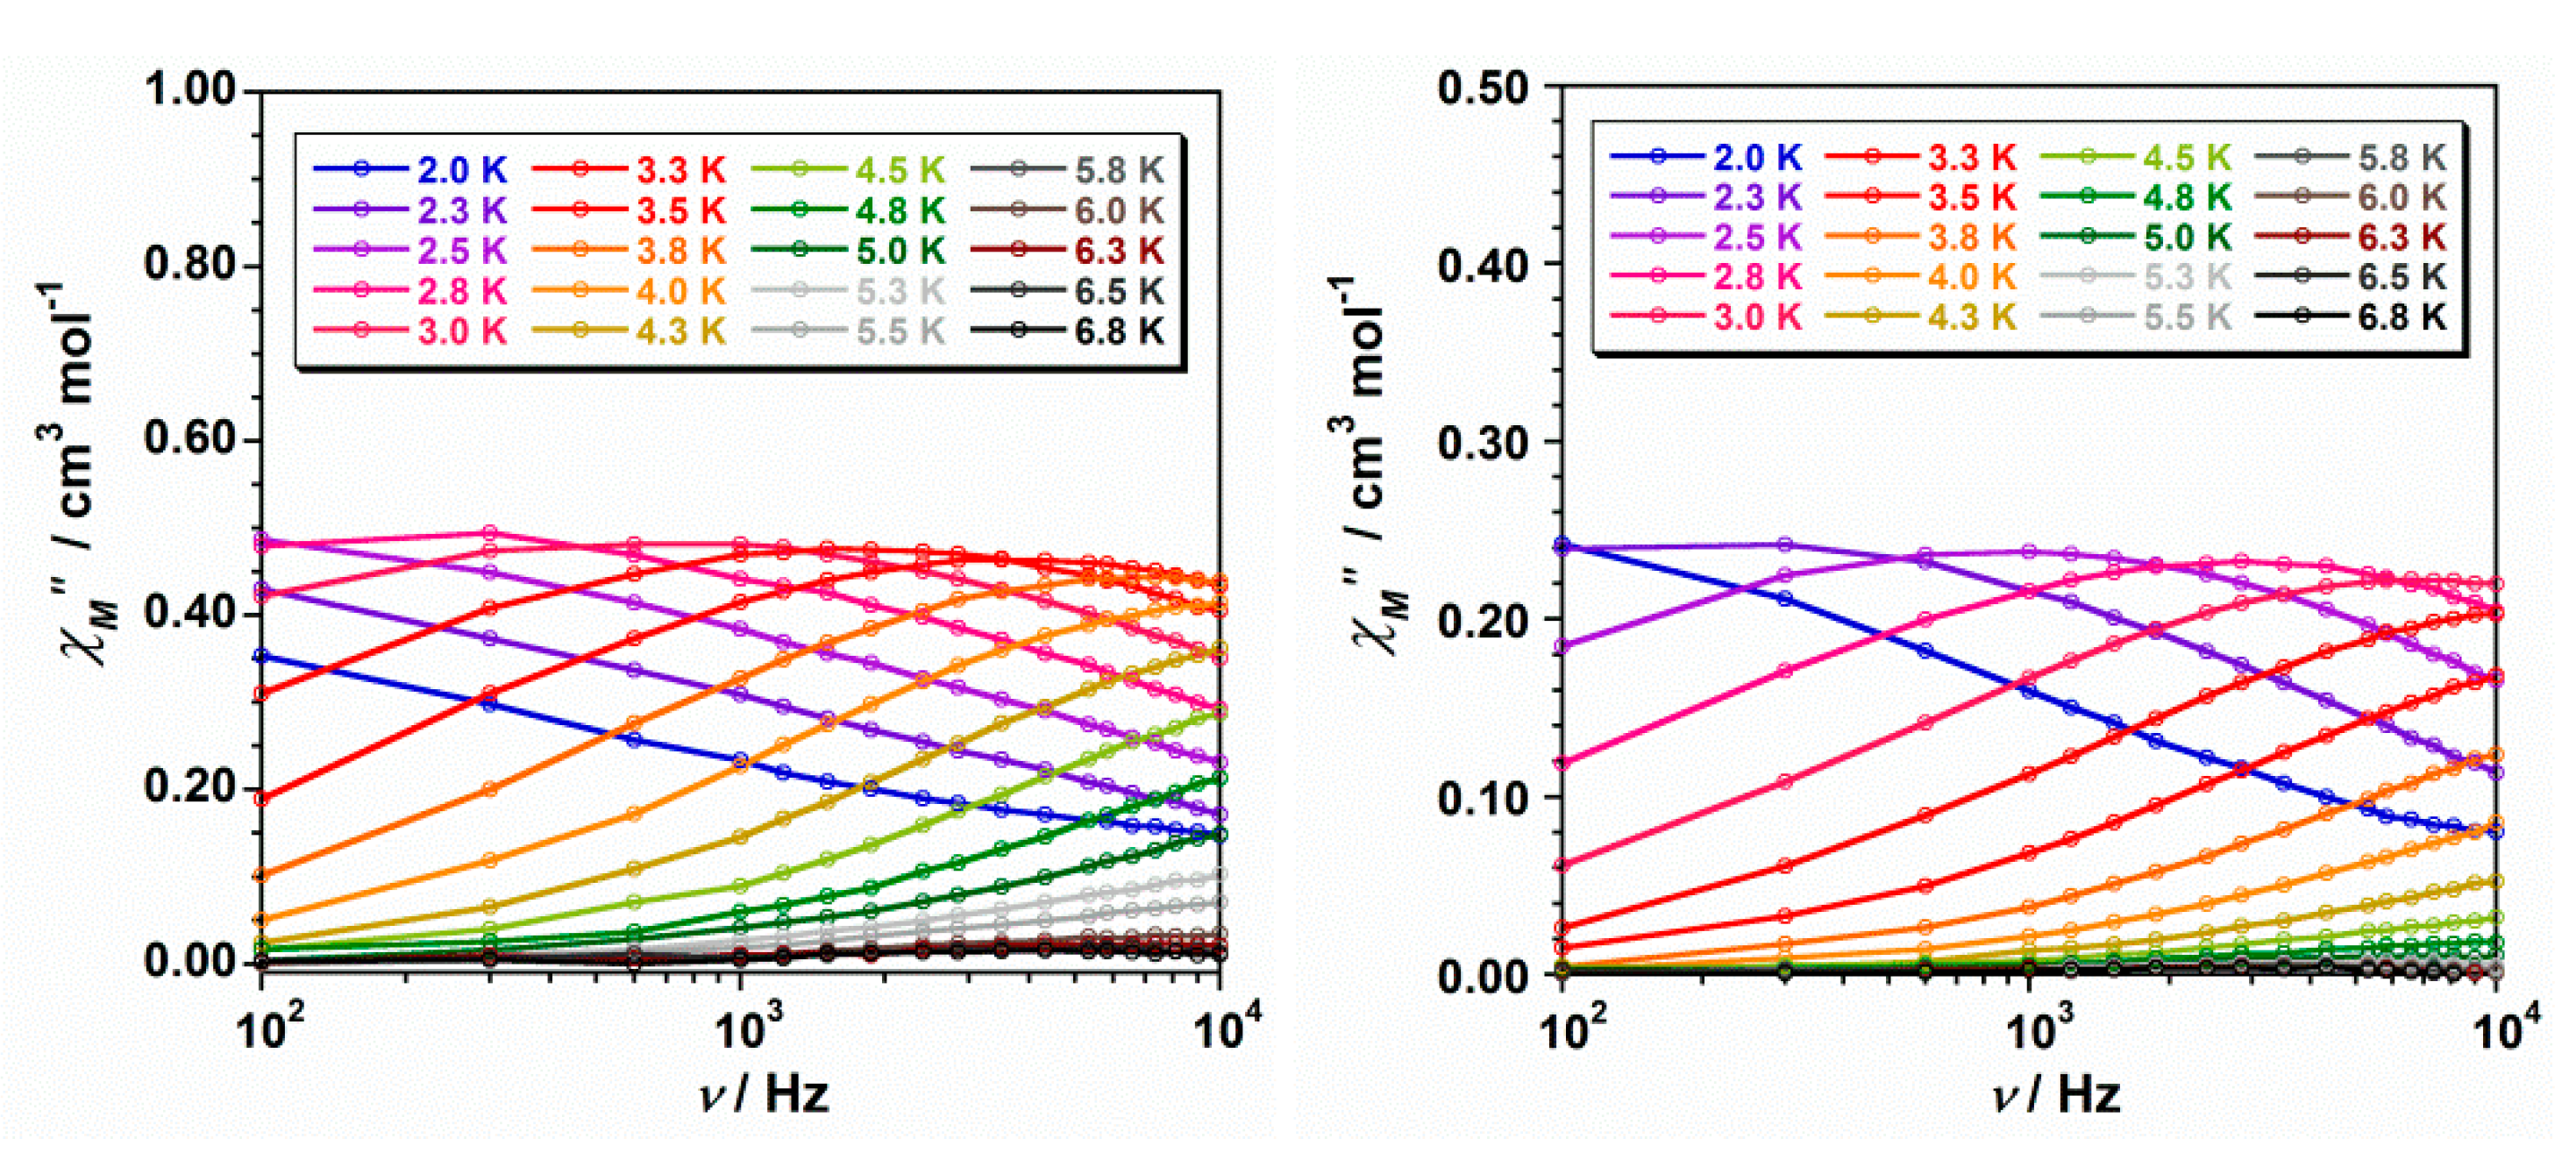
Figure 8.
Out-of-phase ac magnetic susceptibility signals at several frequencies (100-10000 Hz) obtained with a magnetic field Hdc = 0 G for 1 (left) and 2 (right). The inset displays the ln(τ) versus 1/T plot considering a theoretical fit with only an Orbach mechanism.
Figure 8.
Out-of-phase ac magnetic susceptibility signals at several frequencies (100-10000 Hz) obtained with a magnetic field Hdc = 0 G for 1 (left) and 2 (right). The inset displays the ln(τ) versus 1/T plot considering a theoretical fit with only an Orbach mechanism.
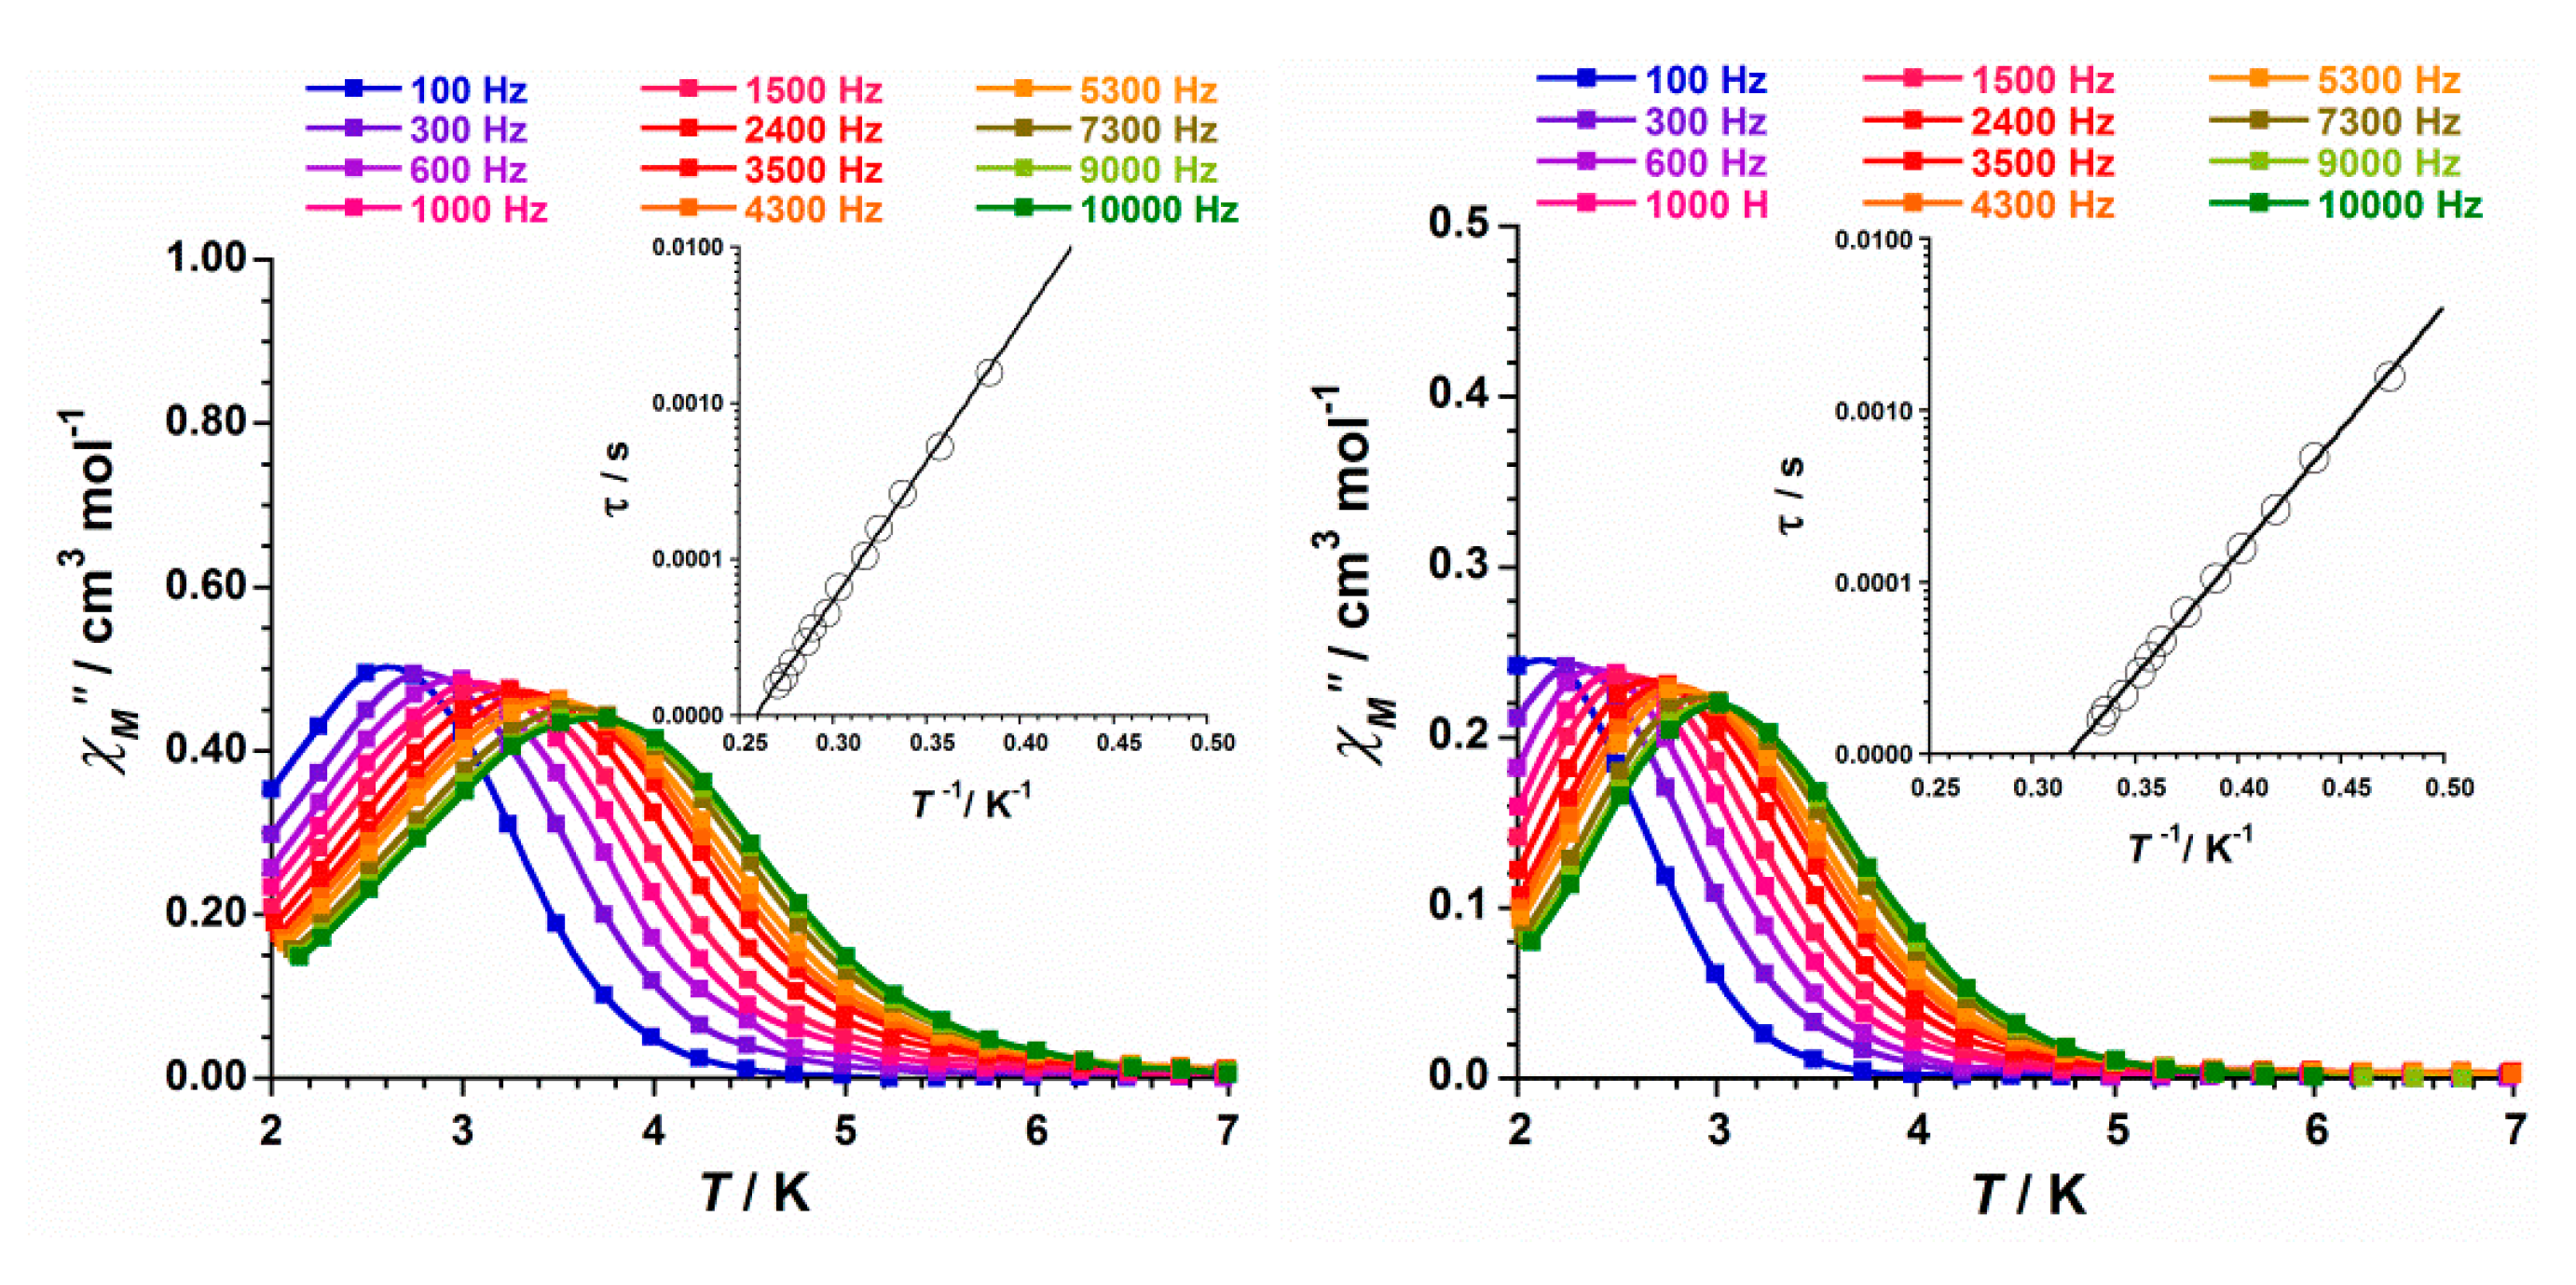

Table 1.
Summary of the crystal data and structure refinement parameters for 1 and 2.
| Compound | 1 | 2 |
|---|---|---|
| CCDC | 2253180 | 2253181 |
| Formula | C136H182N26O56S4Mn12 | C72H104N12O27S4Mn6 |
| Fw/g mol−1 | 3864.58 | 2027.55 |
| Crystal system | triclinic | Monoclinic |
| Space group | Pī | C2/c |
| a/Å | 13.048(1) | 20.482(1) |
| b/Å | 13.185(1) | 17.701(1) |
| c/Å | 27.654(2) | 24.934(1) |
| α/° | 91.06(1) | 90 |
| β/° | 99.89(1) | 103.91(1) |
| γ/° | 115.57(1) | 90 |
| V/Å3 | 4204.6(5) | 8774.5(4) |
| Z | 1 | 4 |
| Dc/g cm−3 | 1.526 | 1.535 |
| μ(Mo-Kα)/mm−1 | 1.008 | 1.014 |
| F(000) | 1992 | 4200 |
| Goodness-of-fit on F2 | 1.037 | 1.126 |
| R1 [I > 2σ(I)]/all data | 0.0900/0.1569 | 0.0938/0.1145 |
| wR2 [I > 2σ(I)] /all data | 0.2042/0.2443 | 0.2328/0.2447 |
Disclaimer/Publisher’s Note: The statements, opinions and data contained in all publications are solely those of the individual author(s) and contributor(s) and not of MDPI and/or the editor(s). MDPI and/or the editor(s) disclaim responsibility for any injury to people or property resulting from any ideas, methods, instructions or products referred to in the content. |
© 2023 by the authors. Licensee MDPI, Basel, Switzerland. This article is an open access article distributed under the terms and conditions of the Creative Commons Attribution (CC BY) license (http://creativecommons.org/licenses/by/4.0/).
Copyright: This open access article is published under a Creative Commons CC BY 4.0 license, which permit the free download, distribution, and reuse, provided that the author and preprint are cited in any reuse.


