
Submitted:
04 May 2023
Posted:
06 May 2023
You are already at the latest version
Abstract
The use of the voice of the customer as a main input to guide decision making towards customer centricity strategies has become a necessity for companies. This research proposes a structured method of textual processing using the KDD (Knowledge Discovery Databases) methodology applied to the tweets of users of Colombian public sector companies, through the analysis of temporal sentiments and topic modeling to identify the areas in which actions should be taken to improve the perception of service. To fulfill such purpose, tweets from January to June 2022 are processed, followed by a temporal analysis of the evolution of the sentiment based on 3 enriched dictionaries; after, the LDA (Linear Discriminant Analysis) algorithm is implemented to find the areas with ailment for the user, in addition to propose a method to homologate the CIER (Comisión de Integración Energética Regional) survey. Finally, metrics are detailed to follow up the perception of the service. It is concluded that for the Acueducto the topic with the highest number of complaints is related to "Water truck request", for Enel "Servide Outages" and for Vanti: " Case solution and request information". Also, the homologation of 3 of the 5 pillars on which the CIER survey is based is presented.
Keywords:
LDA
; Topic Modeling
; Twitter
; Time Series
; Sentiment Analysis
; CIER
1. Introduction
In Bogotá, the public utilities providers are Enel Colombia [1], Vanti [2] and Empresa de Acueducto y Alcantarillado de Bogotá (or Acueducto de Bogotá). [3] Large companies with more than 2 million customers each, which must be characterized by generating value through a large technical and technological infrastructure that allows them to fulfill their mission and serve their users promptly, complemented by Customer Centricity strategies focused on capitalizing customer experiences.
However, the SSPD -Super Intendencia de Servicios Públicos de Colombia- in its latest report of 2021 [4] indicates that: more than 30% of the petitions, complaints, and claims filed before this state entity are against Enel, Vanti, and Acueducto of Bogota; furthermore, it is reported that during the last year, more than 10 thousand users never obtained a reply to their claims.
All the above raises the question of whether a customer centric strategy really exists, and which are the areas with the greatest opportunities for improvement that have a negative impact on users’ perception of service, so it is imperative to know what customers think through the voice of the customer (VOC), to identify opportunities for improvement and act in an appropriate way. This is precisely the main objective of this research: the identification of the critical areas for the mentioned companies and their evolution over time, taking advantage of the VOC present in the users’ tweets.
Twitter is used because after the pandemic, it has positioned itself as one of the fastest growing channels for companies in the utilities sector in the Colombian capital, as indicated for example, in Enel’s sustainability reports. [5] having 1,447 posts, 43,799 followers, and 121,274 comments, which grew 147% more than what was reported at the end of 2019.
In the scientific literature, there are great contributions to achieve the objective of this study applied in areas such as tourism. [6] The authors use different classification methods (e.g., decision trees) to classify the comments. In the health sector, a very relevant reference can be found in [7] where the main areas of opportunity for improvement are determined from the tweets of the retail customers of three pharmaceutical companies in the United Kingdom using Topic Modeling, sentiment analysis, and simple visualizations, which allow determining key areas of improvement for service provision.
To maximize the potential of the voice of the customer imbued in Twitter as a digital channel, this article presents the following organization:
First, the main scientific background is presented, then, the contribution of the KDD methodology implemented in the research is explained, followed by a brief description of the method of downloading and cleaning of the downloaded tweets, after, the temporal and trend analysis is presented, then, the application of Topic Modeling is shown, the critical topics and their evolution in the time window of the analysis are determined, as well as their homologation with the CIER survey. [8]. Finally, conclusions and possible future work of the research line are presented.
The result of the research shows that there are marked trends in terms of channel contactability, especially in the afternoon time slot on Mondays, Tuesdays, Fridays, and Saturdays. In addition, the critical topics in the social network correspond to: Service outages for Enel, Request for water trucks for Acueducto y Alcantarillado de Bogotá, and information request for Vanti. On the other hand, it is concluded that through Topic Modeling it is possible to make homologations with international surveys, such as the CIER survey. [8]. The above generates a high impact on service provision since an automated methodology is proposed that allows knowing the main customer distresses from the VOC, showing areas with opportunities for improvement from which actions can be taken to improve the perception of the companies in the public utilities sector.
2. Background and Previous Research
The inclusion of the voice of the customer in the operational and tactical decisions of companies has been strengthened in recent years, largely explained by the use of social networks such as Twitter. An example of this is presented in the field of insurance [9], through the approach of a model of neural networks and machine learning that enables personalization of the fee for each customer. In this study, tools such as: Tweet Archiver, OpenRefine, Biome-textSE and metrics such as precision, recall and F1 are used to measure the performance of the system. In addition to comparing the performance of the model through data visualizations.
On the other hand, in [10], a series of combinations between text classification algorithms (Nayve Bayes, K Means, Fuzzy K Means and Dirichlet process) and data clustering (KNN, C4.5 Tree and SMV) are applied to a dataset of 100 tweets on customer opinions about the perception of the IKEA brand. It is found that the best classification of opinions is given by employing Dirichlet Process and C4.5 Tree method with better performance for Tanimoto Coefficient Distance metric.
Sentiment analysis is highly impacted by the inclusion of personalized dictionaries, where idioms and regionalisms are incorporated. [11] investigate the impact of the entry of a new competitor on the followers of the Twitter pages of companies in the telecommunications sector, through a sentiment analysis at a temporal level. A customized dictionary is implemented to improve these results, which, in turn, feeds a network follower growth prediction model based on Pearson’s correlation index, demonstrating high predictability of their monthly growth model in regard to projections made with real industry data.
Another example of the importance of lexicon enrichment is also highly relevant in [12], where improvement opportunities are identified based on the needs conveyed by customers of companies in the private transport sector in India, using the Nayve Bayes classifier, reaching an accuracy level of 73.24% in addition to using the 10-Cross Fold Validation method.
Another contribution to the present research that supports the inclusion of customer centricity in company decisions is found in [7]. This research, considered as pioneering, allows determining which areas are critical within companies in the UK retail sector through the LDA algorithm and sentiment analysis. After finding the main topics with their respective Keywords, a theoretical review of the main factors that influence the determined areas is carried out, which are then compared with the main words of each topic to determine the areas where enhancements should be done, which is not done automatically or massively.
The use of the voice of the customer is not limited to the service sector alone. In [13], the application of algorithms such as TD-IDF and LASSO is appreciated to determine the main topics of customer reviews of fast-food restaurants, in a pre- and post-pandemic time sale. Defining that the main topics allude to food quality, customer service, waiting times, and agility in an automatic way, without having to review each comment individually.
The previously described research, demonstrates the use of text analytics methods and algorithms to leverage VOC in social networks. Those provide the basis for more in-depth evaluations such as the one proposed in [6] to perform a matching analysis between a hotel’s user comments and the rating provided by the customer in surveys. Decision trees and classifiers such as Nayve Bayes were implemented to predict a user’s rating from his review. An accuracy of 94.37% is reached.
Another study applied to levels of service has been presented by [14], who propose an investigation to determine the level of potential detraction and promotion in three mobile network operators in South Africa. Through the exploration of data, important patterns are found in addition to correlations through timelines, on the other hand, georeferencial data clusters are established in addition to using the LDA algorithm to predict and classify the polarity of the data along with Porter’s algorithm. Visualizations quantify the performance of the NLP through the analyzed data, having a 96.52% of success with this model. Finally, they make a neural network from pairs of words that identify the level of relationship between users and their relationship with the topics found.
This type of analysis, in which user comments are quantified by means of text analytics techniques, has a wide field of application since it allows measuring perception even when no metrics or measurement scales have been previously established. In [15], an evaluation of perception is proposed through the following metrics: User sentiment score, tweet sentiment score, Positive-Negative tweet ratio, Positive-Negative user ratio, calculated from the classification of tweets (in positive and negative) of the followers of certain public figures, through the LIWC method and the implementation of dictionaries. All in all, this study raised a relevant concept for this research: the evaluation of the evolution over time of this perception.
Ref. [16] details the use of a new method to analyze the perception of customers regarding the main features of the products of some cell phone brands. The methodology is described as MSAS - Micro blog Sentiment Analysis System- and involves all the definition of the main metrics to compare the downloading and processing of the tweets, the definition of the polarity, and the visualization to assess which attributes are more important. This Study also presents a lot of new graphics such as: radar, line and bar charts that facilitate the comparison of brands and attributes.
It can be said that text analytics and the application of topic modeling are areas that have been well developed, with a great variety of methods to propose effective models. However, there are no clear precedents where, through the application of algorithms, critical issues can be identified in an agile manner, only through theoretical reviews, which requires considerable analysis time to better guide decisions. Furthermore, there is no research where these techniques are used to homologate the results of user surveys.
3. Materials and Methods
The KDD methodology, which combines automated methods for data-driven modeling, is used. [17]. This method considers an iterative and interactive process with the data set that, by applying the appropriate models will generate knowledge that can be used for decision making or simply structure this information to be arranged in another area or field of knowledge [18].
To process the textual data, the use of R software has been defined to obtain the DTM (Document Term Matrix) for each company. As part of the software definitions, a benchmark of the R libraries that allow connecting and downloading the data through the Twitter API credentials is performed.
Before processing the data, first, the dictionaries that will allow to perform the sentiment analysis (Table 1) are chosen, second, the method of application of each one is defined, where 1,928 tweets are randomly chosen from the Enel company to determine whether the method defined by R or the assignment method using the Merge function for each dictionary allows to obtain a greater coverage of the corpus. The results are presented below:
- Affin Dictionary: Quantifies each word on a scale of -1 to 1 according to intensity.
- Bing Dictionary: Qualifies each word between positive, neutral, and negative.
- NRC Dictionary: Quantifies each word among one or more of the 8 sentiment categories on a scale of 1 to 10.
- Emoji Dictionary: Each emoji is assigned its equivalent in hexadecimal code to convert it into a word by means of a search.
Prior to data processing and before obtaining the DTM, 3 levels of cleaning are applied to obtain only the tweets of the users of each company described below:
First level of cleaning (Preprocessor): The variables of interest for the research are defined and the data structure for the modeling is configured. Additionally, the user threads are consolidated and the tweets from corporate, governmental, and non-profit organization accounts are eliminated, and, finally, they are consolidated in a single database. On the other hand, emojis are transformed into words according to the hexadecimal code of the emoji and its equivalent in a single word. At this level, an average of 24.06% of the initially downloaded tweets are lost.
Second level of cleaning (RemoveWords function): A list of terms identified in the messages that do not generate value for the research is defined and by means of the “RemoveWords” function they are eliminated from the messages. At this level, an average of 1.28% of the tweets from the first cleaning level are lost.
Third level of cleaning (StringR function): At this level, the StringR function is used, which is part of the process to obtain the DTM, and here the web addresses, hashtags, punctuations and accentuations, numbers and StopWords defined within R are eliminated. At this level, an average of 1.21% of the tweets resulting from the second level of cleaning are lost.
Considering the above points, all the processing of the tweets is performed to obtain the refined DTM and with the relevant information for further analysis, in addition to obtaining the qualitative and quantitative labeling of each word to make the sentiment analysis (word clouds, frequency graphs, topwords, among others).
4. Results
4.1. Timelines
The data collected allows to perform a temporal analysis on the behavior of message traffic for each company through Twitter and understand the days of the week and the times when users transmit the most messages (Figure 1).
In the case of the Acueducto, Thursdays and Fridays present the highest number of messages with a marked trend for these days. On the other hand, Enel shows a homogeneous behavior on each of the days of the week, with the highest number of messages on Saturdays, Sundays, and Mondays. Finally, for Vanti there is a seasonal behavior of 3 days (Tuesday to Thursday and Friday to Sunday) where the first group has the highest number of tweets.
Regarding the hours of the day with the highest traffic of messages, the 3 companies have a similar behavior in their traffic between 10 am and 4 pm; and from 8 pm to 11 pm. One of the important findings in this regard is that between 12 am and 3 am they present an amount of messages equivalent to the traffic received during the day and specifically during a working day. The above is shown in Figure 2.
It is important to know the behavior of the messages throughout the period analyzed for each of the companies, to identify possible trends, seasonality, and to detail at a general level of the days with atypical behavior which are the topics that users are talking about.
In the case of Enel (Figure 3), an average of 50 daily Tweets was obtained throughout the period analyzed, with an upward trend at the end of the period. When verifying the messages in the outlier points of the series, it can be observed that between the months of April and May the daily number increases considerably compared to the average, since there is a rainy season in Bogota, and these were sent to communicate massive failures in the continuity of service in several locations of the city and even in the surrounding municipalities. Besides, people communicate the effects that this has brought with respect to food conservation, the operation of vital equipment for people, and the damage to household appliances and electronic equipment.
For the Acueducto (Figure 4), at the end of the period analyzed, there were atypical values due to high contactability explained by service outage in the northwestern area of Bogota, where users reported no service for more than 72 hours and a shortage of water trucks to supply the service.
To visualize this time series, the average by right and left was performed, which consisted of taking the 7 values closest to the left of the first peak and the 6 values following the second peak to normalize the series and make the result consistent with the other data. With the normalized series (Figure 5), it can be defined that on average the Acueducto received 57 daily tweets with an upward trend at the end of the period and a possible seasonality of the data is identified by observing that, on average, every 47 days the company shows high traffic of messages exceeding 200 tweets. The outliers identified in the series and given a detailed analysis of the messages can help determine that users communicate problems related to service outages, service continuity, water quality, and mobility problems due to the execution of public networks.
In the case of Vanti, the results obtained in Figure 6 allows to conclude that the series shows an average of 18 daily tweets for the period analyzed, with a slight downward trend at the end of the period. With the volumetric data, it can be inferred that Twitter is not a representative channel compared to the other two companies. The time series led on to identify a possible seasonality of an average of 25 days in which the number of messages is expected to increase. Series and message outliers identify users writing about topics related to reconnection and service costs, home visits, and responses to customer requests through SICC (suggestions, issues, claims, or complaints).
4.2. Evolution and Sentiment Analysis
4.2.1. Evolution of Sentiment through BING
To understand how sentiments, evolve through the period analyzed under the BING dictionary perspective, the results of the labeling of the tweets of the consolidated corpus are shown below: 20,817 categorized tweets (88.67%) and 2,659 (11.32%) unassigned tweets, where the former are distributed as follows: 13,458 negative tweets (64.65%), 2,659 neutral tweets (12.77%) and 4,700 positive tweets (22.58%). Initially for the Acueducto, 10,802 labeled tweets were obtained (86.56%) and 1,677 discarded tweets (13.43%). According to the result shown in Figure 7, June was the month with the highest number of messages influenced by service outage problems. At the calendar day level, the second half of the month is the one with the highest number of messages received and it is evident that negative tweets occupy an average of 55% of the tweets of the daily total.
For Enel, 7,390 tweets were tagged (88.42%) and 968 tweets were discarded (11.58%). Within Figure 8, it can be observed that on average 67.7% of the tweets are labeled as negative, on average 20.11% as neutral tweets, and the remaining as positive. Among the findings, it can be identified that for the months from March to June, the number of tweets and their proportions are homogeneous and according to the calendar days, there is a sinusoidal behavior with low variability where the second fortnight shows the highest number of messages received per day.
The result for Vanti can be seen in the following Figure 9, where 2,623 labeled tweets (94.6%) and 150 discarded tweets (5.4%) were obtained. Within the group of labeled tweets, 1,873 tweets were classified as negative (71.41%), 303 neutral tweets (11.55%) and 447 positive tweets (17.04%). Within the findings obtained, it can be inferred that April was the month that received the most messages, as well as the month with the highest proportion of messages for this company. On the other hand, analyzing the series through the calendar days, it can be determined that during the second fortnight there is an increase in the traffic of messages and that except for the outliers there is a slight seasonality between 8 to 10 days with a downward trend for the last days analyzed.
4.2.2. Evolution of Sentiments through AFFIN
The AFFIN dictionary allows quantifying the intensity of each word associated with its respective sentiment on a scale from -1 to 1, where the daily average of the word scores is taken to make the series and the “Loess” method is used, which consists of a general local regression from the multiple regression adjustments applied to all the data considering the premises of the nearest neighbor method. It is defined to use this method and its subsequent visualization for the following reasons:
- It is characterized by the fact that the larger the interval of the analyzed data, the smoother the resulting curve and the better performance using a considerable volume of data.
- The visualization of data on this scale is difficult to interpret, the method eliminates noise and allows observing characteristics and trends over the analyzed series.
The results of Figure 10 correspond to the Acueducto and there is high variability until mid-April and from then on and until the end of the period it stabilizes close to 0, the curve adjusts along with the confidence interval on the modeled values. Regarding the applied smoothing, the values are close to 0 with a slight tendency to be positive and tending to decrease at the end of the period; where it is highlighted how the outliers make the curve sensitive to its value and the confidence interval is higher.
In the case of Enel, the Figure 11 shows that most of the days there are scores above 0, so it can be inferred that there is a tendency to transmit slightly positive messages, with the smoothed series it is observed that the data has a high variability, given that the confidence intervals are wider with respect to the other two companies. The series presents several outliers throughout the period studied, with March and April being the months in which this tendency is most marked.
Finally, for Vanti, it can be observed in Figure 12 that within the results there is low variability with a couple of outliers that do not affect the smoothing of the data. The series allows identifying a possible seasonality of 20 days on average, so it can be inferred that every period, messages with marked negative content are obtained. The smoothed curve has a reduced variation interval, so it can be concluded that the data are homogeneous and behave stably over time.
4.2.3. Evolution of Sentiment of through NRC
To analyze the evolution of sentiments through the NRC dictionary, the number of words assigned in each tag was totaled and multiplied as many times as their frequency of occurrence in each tweet to obtain the percentage share of the corpus in each category.
For the Acueducto, the results shown in Figure 13 indicate that users convey feelings associated with Trust, Sadness, and Fear, which are dominant in the period analyzed. Positive feelings such as Surprise and Joy occupy the last places in the labeling in all months. An important finding to highlight is that the Anticipation sentiment is dominant in the months of April and May, so it can be inferred that messages use words to anticipate ambiguous responses from companies and receive a direct response.
In the case of Enel, Figure 14 shows the results of the labeling of sentiments over time and in which it can be highlighted that the sentiments are marked month by month where Trust, Sadness and Fear predominate. An important finding has to do with the dominance of the Anticipation sentiment, which infers that user, in addition to feeling trust, anticipate the conjectures with which they might receive a response.
For Vanti, in the Figure 15 the results of the evolution of sentiments over time can be observed; where a variable behavior is highlighted in each month where 4 categories of sentiments predominate: Anticipation, Trust, Fear, and Sadness. With the above, it can be inferred that users transmit negative and additional messages that, for the company’s volumetrics, allow to conclude that Twitter is not an effective communication channel given the high response time and the way in which users write.
4.3. Topic Modeling
4.3.1. Optimal Number of Topics
As already explained, the identification of the main topics that customers mention in the social network is performed by the “topicmodels” library of the R software [19]. However, it is imperative to previously define the optimal number of topics for each company. For this purpose, the “FindTopicNumbers” function of the “Ldatuning” package of the same program is implemented.
The result of the application corresponds to the graphical representation of 4 metrics: “Griffiths2004”, “Deveaud2014”, “CaoJuan2009”, “Arun2010”. The objective is to identify the number of topics where the first two metrics present a maximum value and the other two a minimum value. The result for Acueducto, Enel, and Vanti are presented in Figure 16.
From Figure 16, it is determined that the optimal number of topics for all the companies ranges between 5 and 6, however when applying the LDA algorithm with a K=6, it is found that some words are present in more than one topic, that is, they are repeated in different lists of grouped words, so there may be confusion to determine the name of the topic. Furthermore, some of these groupings do not make sense, so the exercise is performed with a k=5.
4.3.2. Main Topics
The result of the application of the LDA algorithm uses the top 10 terms with the highest probability of occurrence for each of the 5 defined topics and thus, assigns a name to each group under which the main topics that the customer talks about on Twitter are identified, which is presented in Table 2.
To evaluate the evolution of VOC over time, a dominant topic must be assigned to each tweet of each user of the 3 companies. To perform this assignment in a massive way, the following is required: the list of words for each topic with their respective probability of appearance and the words in each tweet. Subsequently, a weighting is performed between the number of words in each message and the probability of occurrence of each term in each topic to obtain the prevalence of a single topic in each tweet (or the dominant topic) based on the probability of occurrence of the words used in each topic.
The distribution of the topics at the general level for each company can be seen in the following figure. Figure 17 which were constructed using Power BI [20]. It is emphasized that more than 90% of all tweets were assigned to one topic, the remaining ones are assigned to the “other” category. At a general level, each company has a dominant topic in which more than 25% of the communications are classified, for the Acueducto it corresponds to “Water Truck Request”, for Enel it is identified with “Service Outages”, and for Vanti with “ Case Resolution and information Request”.
To deepen the understanding of the topics, a word cloud is constructed for each topic of each company, this result is presented in Appendix A. Through these visualizations, it is inferred that the terms involved in the tweets classified in each topic correspond to the assigned title and therefore present a direct relationship.
4.3.3. Temporal Evolution of Topics
Through the identification of the dominant topic of each tweet, it is possible to perform temporal analysis focused on the previously exposed topics, specifically in the days of the week and in the six months of the study, allowing to identify trends, critical days, cyclicity, among others. The visualizations presented are also built in Power BI. [20].
The Figure 18 shows the behavior of the general contactability of the topics of each company, the days with the highest traffic for the Acueducto are Thursdays and Fridays in which the dominant topic is trending (“Water Truck Request”) as well as “Service Outages”. For Enel, a uniform behavior is evidenced throughout the week (except on Saturdays), especially in the tweets related to “Case Resolution” and “Service Outages” (dominant topic, with high traffic on Sundays), finally for Vanti, weekends are days with very little contactability, however, from Monday to Friday the dominant topic is seen to be “Case Resolution”; which presents peaks on Tuesdays as well as “On-site Review”.
On the other hand, Figure 19 represents the monthly evolution of the topics of each company, for example, for Acueducto, it is evident that in June there is a peak of more than 2,000 tweets due to the fact that on the 23rd and 24th there is a massive failure service exceeding 24 hours and for more than one neighborhood of Bogota, those customers jointly report the situation, as a result, the topics: “Water Truck Request” and “Service Outages” have an increase of more than 50%.
For Enel, it is displayed in the Figure 20 an increase in the use of the channel during the last 3 months, the topics in general have a stable behavior (in comparison with the other 2 companies), especially for “Service Outages”, so it is inferred that the channel is used to report and know the status of these failures.
Finally, for the Vanti company, Figure 21 is presented, in which a slight growth in terms of its dominant topic takes place (“Case Resolution and information Request”) until March, from then on, there is a gradual decrease. As for the second topic of greater participation, it does not present a constant behavior because during some months it is found that it is “Poor Service - PQRs” and others “Service Outages”.
4.3.4. Critical Topics
In Section 4.3.2 the main topics mentioned by the customers of the three companies are presented, however, it is not yet identified which topics generate the most pain and around the specific areas of each industry actions should be taken to improve customer perception. To accomplish this, a sentiment analysis is performed on the tweets of each topic and heat maps are made to identify in the six months of the study which areas are most critical.
As explained in Section 3, the Bing dictionary is used to assign a polarity to each tweet, since this lexicon has a higher percentage of classification of tweets than Afinn. On the other hand, at a general level it can be identified that about 56% of the communications are categorized as negative tweets and 21% as positive tweets.
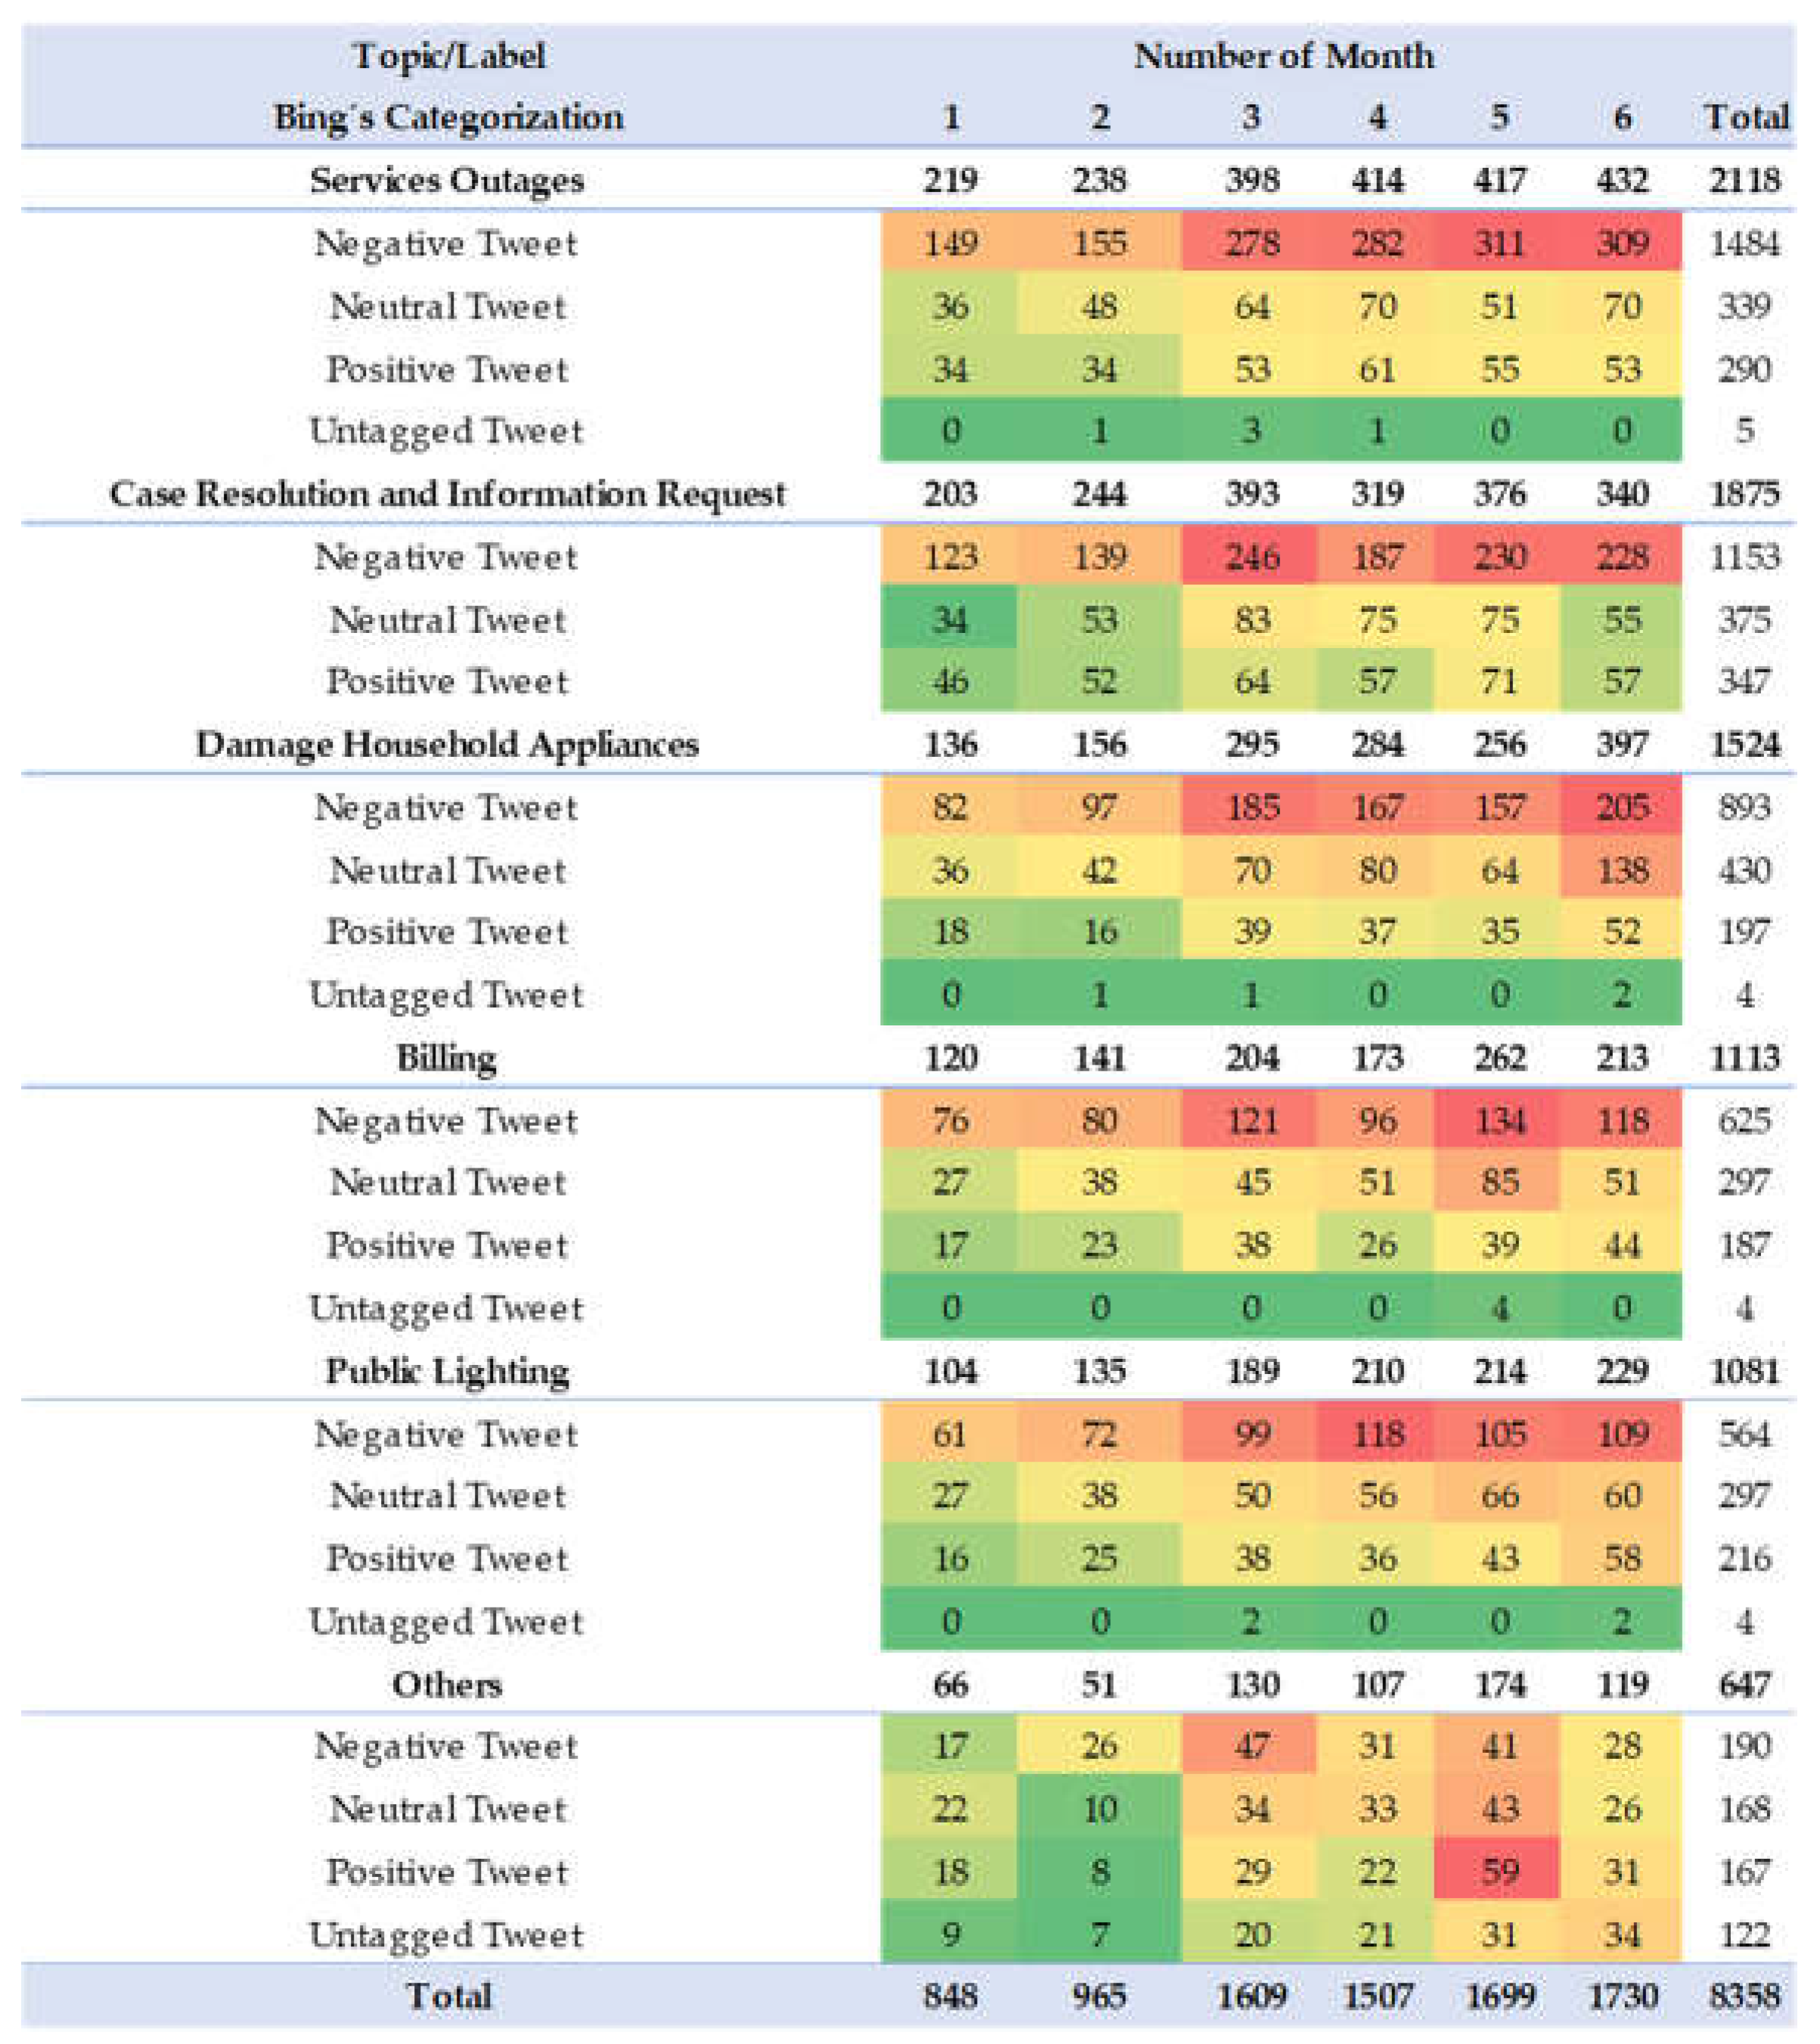
Having clarified the above classification, it can be proceeded to cross- check the positive, negative, and neutral tweets corresponding to each of the topics. The result is presented in Appendix B for the company Enel, where it is identified that “Service Outages” is the biggest customer pain, in the evaluation period this topic has a sharp increase since March reaching about 300 negative tweets per month. “Damage Household Appliances” and “Case Resolution and information Request” are the other two ailments that generate an impact on the perception of service.
On the other hand, for the Acueducto of Bogota corresponds to “solicitud de carrotanques” with more than 1162 negative tweets, followed by “Service Outages” which starts with 150 negative communications and ends with more than 300, the third pain corresponds to “Case Resolution and information Request” starting in January with 108 tweets (from the previously mentioned category) and closing with more than 200.
Finally, for Vanti there is an increase during the first months of the study, in May there is an inflection point where some topics show a decrease in negative tweets. “ Case Resolution and information Request “ is the central pain. “On-site Review” is another topic that shows a downward trend in the first four months of the year, but then reaches a considerable percentage of negative tweets.
4.4. Approval: CIER Survey
4.4.1. Context CIER Survey
The CIER survey conducted by the Commission for Regional Energy Integration - CIER - [8] is international research focused on determining, comparing, and finding improvement opportunities for distribution companies in the residential energy sector.
In order to have a rating per company, the survey proposes the following division based on the areas of greatest impact for the customer: energy service, billing, customer service, communications and company image (in Spanish: servicio de energía, factura, atención al cliente, comunicaciones e imagen), and in turn, segments each of these into about 5 or 6 attributes, which are the basis for the customer to rate from 1 to 10 how satisfied they are with each of them, classifying the value obtained according to the following scale: 1-2: Very bad, 3-4: Bad, 5-6: Fair, 7-8: Good and 9-10: Very Good.
By having the percentage for each attribute of the users who rated 7 or more, the IDAT (attribute performance index) and the IDAR (area performance index) are obtained. The detail of the above can be found in the document referenced in. [8].
For the purposes of this research, it has been chosen to consider the classification at the area level (IDAR) not by attributes (IDAT) since each tweet of each user has been associated to a specific topic, which is not divided into more attributes, for example, the topic: “Billing” (Factura) does not have subdivisions to know the subtopics that are found within it.
4.4.2. Approval of Quantitative Scale
The AFINN dictionary is used to homologate the rating scale of the CIER survey. The minimum and maximum values are -0.5 and 0.989, since 98% of the score of the tweets obtained by means of the dictionary is found within this interval. To define the limit values for the classification of the intervals: “very bad”, “bad”, “regular”, “good”, “very good”, the value of the range is progressively added by 20%, for example: for the label “regular”, 60% of the value of the range is added to the minimum score found. In the Table 3 shows the numerical division to categorize each tweet according to the CIER scale:
4.4.3. Topic Modeling vs. CIER Survey
After analyzing the attributes of each of the pillars proposed by the CIER survey and comparing them with the topics found through the LDA algorithm, the 5 main areas are homologated shown in Table 4. It is worth clarifying that the following are excluded: Information and communication, Socio-environmental responsibility, and Image (Information and communication, Social-environmental responsibility and Image) since the client does not deal with these topics in the social network. The tweets that are not categorized in any of the five main topics are identified as “other”.
The participation results for each of the intervals are presented in Table 5. The critical area corresponds to “Energy Bill” (Factura de energia) and “energy supply” (Suministro de energía) is the one with the least novelties.
4.4.4. CIER Survey Considerations
- Information privacy: The 2021 report is available on the CIER organization’s website. [8] However, these results are not detailed for each energy company, so the above is proposed as a method of approval.
- Time horizon: As mentioned, the report available corresponds to the year 2021 and the tweets used for this research are from 2022, so even if the CIER result for Enel were available, the comparison could not be made since the results have not yet been published.
- CIER survey granularity: To cover the above, an interaction with the LDA algorithm can be performed again, but for each set of tweets of each topic separately, to seek homologation at the IDAR level.
- Homologation: Although it has been tried to use other methods to homologate the scale (for example, normalizing or taking the minimum value as the smallest of the values assigned to the tweets and the maximum as the highest of the scores), many values are close to 0, thus overloading the “regular” category interval, it is recommended to include and enrich the dictionaries so that more words are recognized and the value assigned to each tweet can be increased or decreased.
4.5. Metrics
Finally, some metrics are proposed as a complement to the objective of this research, they are proposed so that companies can perform a comprehensive monitoring of critical issues that are determined through the analysis of the voice of the customer in social networks, to take preventive and corrective actions in a timely manner, to improve the operation of the channels and the perception of the service.
It is important to clarify that most of the metrics use the BING dictionary (since it was the one with the best performance), many metrics that can be calculated from the Affin dictionary are not included; since, according to the results obtained, the measurement could take extreme values for a high percentage of the total data analyzed, causing a perception analysis with high variability and margin of error. The metrics are described in detail in Appendix C, including the proposed timing and the objective of each one.
5. Discussion
Text mining has become relevant for organizations with the objective of using these sources of information to generate value and know the perception of people on a certain topic. Social networks are becoming unstructured data sources that, when properly modeled, allow obtaining tactical and strategic information to make organizational decisions without the need for high investments in development and technology to achieve this purpose.
One of the findings shared with the authors of previous works is the importance of a data cleaning and debugging process based on the identification and the context to be analyzed to ensure that the results obtained from the modeling are as accurate as possible to the reality of the problem. On the other hand, with some previous works it is found that Twitter messages are limited to 280 characters, so for longer messages threads are used and this causes that when doing text mining the context and purpose of the message is lost.
Some research highlighted the importance of considering native language in the analysis of tweets, given that idioms and regionalisms make some words uncategorizable and discarded in the model. Therefore, the BING and AFFIN dictionaries were enriched with Colombian words, which have been assigned their respective scores based on their synonyms to achieve a better performance of the models that quantify and qualify the data.
The definition of methods to apply sentiment analysis under the dictionary perspectives was carried out in order to cover the largest number of words in the corpus to increase accuracy and obtain more robust results that are closer to the reality under study; and this is how the BING and AFFIN dictionaries have a better performance of 70.9% and 63.6% respectively when using the assignment of terms from the corpus to the labeling of each dictionary and for the NRC dictionary better results were obtained through the predefined functions of R used for this purpose.
One of the relevant contributions of this research is related to the analysis of temporal evolution of the sentiments and the recognition of how they change over time to find patterns, trends, and outliers; in addition to understanding, under the perspective of each dictionary, the points to highlight and the points of convergence between every time series to reach common conclusions. Finally, the convergence of results allows to identify topics for improvement on various service fronts for each company and to identify through text the issues that need to be addressed to improve processes and user experience with the services acquired.
The application of topic modeling through the LDA algorithm is closely linked to the selection of the number of topics -k- as mentioned in Section 4.3.1, there are several methods to obtain the optimum number of topics; however, the literature consulted does not detail how to make this selection, so this is considered as a highly relevant contribution of this research. On the other hand, it can be stated that the graphical method works to give an adequate approximation, however, for the 3 corpuses of the selected companies, it was necessary to perform a subsequent analysis of each group of words to evaluate if they made sense, so it is inferred that an interpretation of the result should be made to have a greater assertiveness, likewise, several iterations should be performed, which involve numbers of topics close to the one found to improve the final result.
Through the analysis of the topics, it can be concluded that customers of the three companies mention common themes on Twitter, which correspond to “Service Outages” and “Case Resolution and information Request”. The former presented an overall participation of 4.47 thousand tweets (20% of the entire corpus) and the latter 5.1 thousand communications (23% of the entire corpus). Based on the above, “Case Resolution and information Request” is identified as the dominant general topic, this topic tends to remain constant and with high traffic during all days of the week, however, it is highlighted that Tuesday and Monday are the peak days in terms of contactability. The “Otros” tag was only assigned to 2,249 tweets, less than 10% of the communication download, this reaffirms the above, that the performance of the model (LDA algorithm) is a good approximation.
When reviewing the monthly behavior of the topics of the companies, the trend of the critical topics is seconded, since month after month the topics with the highest number of associated tweets were always the same, for the aqueduct: “Service Outages”, for Enel and Vanti: “Case Resolution and information Request”. Therefore, it is suggested to make a more exhaustive analysis where the subtopics of each critical topic can be identified in more depth, increasing the study time to more than 6 months and using an additional layer of topic modeling.
With respect to the heat maps used to identify the critical topics of each company, it can be said that it is a good visual tool that enables the quick identification of the customer’s ailments; at a general level it can be concluded that the perception is not the best given the increase in negative tweets. For the aqueduct, the critical topic was “Service Outages” (leaving aside “Water Truck Request” due to its atypical behavior), which tends to increase its non-positive tweets, with a rate higher than 50%. As for Enel, it could be said that the greatest pain is related to “Service Outages”, negative communications presented an upward behavior in the first months and then remained constant, which also indicates that the perception does not tend to improve. Finally, for Vanti, the greatest inconvenience was related to “Case Resolution and information Request”, however, this company is the one that ended with a downward trend in terms of negative tweets, so it can be said that its perception is the one that can improve.
On the other hand, it was concluded that it is feasible to use the proposed model to make a homologation with the main pillars of the CIER survey, according to the results, 3 of the 5 main attributes were matched, in addition to the plus of including “Public Lighting”. Additionally, it was determined that the area with the most opportunities for improvement corresponded to energy supply (Service Outages) and the one with the best perception could be said to be energy bill. Finally, it should be noted that, for better results, a different homologation in terms of scale can be investigated, as well as enriching the dictionaries so that the scores of the tweets can vary and lower those labeled as regular.
In this sense, it was shown that it is possible to propose a metrics model to improve monitoring, based on obtaining the classification and categorization of tweets according to the topic and the use of the Bing dictionary, which can generate much value since the voice of the customer is being used as the main input for monitoring the performance of a channel (in this case Twitter), which allows taking tactical actions that align the operation with customer centricity strategies.
Finally, it was proved that through the method used in the research it is possible to transform data into information, allowing to assign quantitative values to data that are merely qualitative and unstructured. This conversion and assignment was performed through the use of tools such as R [19] and Power BI [20], which were used to build visualizations for a managerial level, allowing decisions to be made based on numbers (data driven) and which, in turn, are oriented towards improving customer satisfaction and experience.
This research, allowed to define a methodology in which the information that can be obtained through digital channels (in this case Twitter), could be exploited by applying the appropriate methods to take advantage of its maximum value, transforming it into strategic assets of high relevance for commercial areas, marketing areas and Business Intelligence.
6. Future Works
The following is a description of some lines of research based on the method described above, through which new knowledge can be generated based on the management and exploitation of textual data obtained from social networks.
- Language: Enriching the dictionaries used for sentiment analysis with terms from the Latin Spanish language will allow a wider coverage of the corpus, improving the score assigned to each tweet, the tagging per word and the homologation with the user survey scales.
- Sources of information: Considering other sources of information provided by each of the companies can increase the size of the corpus, contributing to the generation of an automated model of experience management; where other channels of attention are involved, to identify issues of general interest as well as new knowledge that not only social networks can provide.
- LDA for each topic: In order to be able to identify in greater detail the opportunities for improvement and also to make a more detailed comparison with the CIER survey (in the case of Enel), it is proposed to take each corpus of tweets from each company independently (after having gone through the different levels of cleaning) and perform the procedure to find the optimal number of topics and the application of the LDA algorithm for each set of topics.
- Smart Cities: The use of text mining in social networks can be of potential use for projects related to smart cities; since by taking the labeling of this data it is possible to identify social issues related to the provision of basic services and generate impact projects that improve the quality of life of users.
- Machine Learning: Considering the automation of text mining models and techniques at an unsupervised level will allow the creation of self-learning algorithms that can interpret according to the context the message that each user transmits to each organization and create personalized attention flows. Likewise, this can be used to enrich the dictionaries used for sentiment analysis, training the algorithms to refine and improve the results of topic modeling.
- Identify irony, sarcasm and mockery within texts: An important advance that can be made in the field of text mining to identify sentences, tweets and messages in general is determining the irony with which the sender expresses himself in order to obtain an objective context of the intentions of the message and what he really wants to convey to the receiver.
Author Contributions
Conceptualization, CD (Conti, Dante), OV (Ospina, Victoria), GC (Gomez, Carlos) and JJ (Jaramillo, Juan); methodology, DC, OV, GC and JJ; validation, DC, OV, GC and JJ; formal analysis, DC, OV, GC and JJ; investigation, DC, OV, GC and JJ; writing—original draft preparation, DC, OV, GC and JJ; writing—review and editing, DC, OV, GC and JJ; visualization, DC, OV, GC and JJ;. All authors have read and agreed to the published version of the manuscript.
Funding
This research received no external funding.
Data Availability Statement
Data will be made available upon request.
Conflicts of Interest
The authors declare no conflict of interest.
Appendix A

Table A1.
Word clouds by topic for Enel (This exercise was performed for the other two companies).
| Company | N° | Topic | Word Cloud | Analysis |
|---|---|---|---|---|
| Enel | 1 | Service Outages | 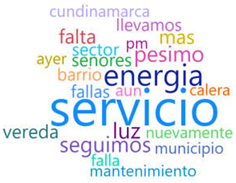 |
It should be noted that for this topic the words “Cundinamarca”, “calera”, “municipio” and “vereda” appear, which indicates that this channel is also used at the rural level as a means of reporting failures, especially in the municipality of La Calera. Terms such as “failures”, “again”, “maintenance” and “service” appear, which means that there are service interruptions. |
| 2 | Case Resolution and information Request | 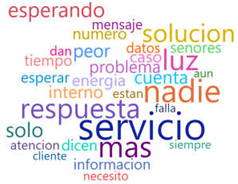 |
For topic 2, words such as “answer”, “internal”, “need”, “message”, “response” are evidenced, which means that customers are waiting for their answers, that they have sent the data of their “cases” and that they may require an effective response to what they indicate through the channel. | |
| 3 | Billing | 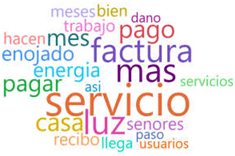 |
For the topic “Billing”, there is the appearance of words such as “pay”, “receipt”, “arrives” and “invoice”, which revolve around the topic of payments and invoicing. It is evident that customers ask about the payment of their “receipts” through this network and that they may be inconvenienced since there are terms of annoyance such as “angry”. | |
| 4 | Public Lighting | 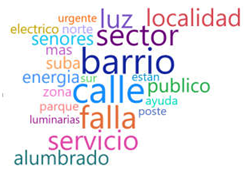 |
This topic is related to power outages, but directly on “poles” and “luminaires”. Terms such as “park”, “urgent”, “zone” and “public” suggest that customers report public lighting failures in the social network and that, in some cases, they may be of an “urgent” nature. Terms such as “neighborhood” and “locality” show that the address of the new development is shared. | |
| 5 | Damage Household Appliances | 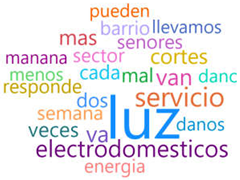 |
As can be seen, this topic is closely related to topic 1, since words such as “outages”, “damages”, “services”, among others, appear. This indicates that, given the micro-cuts and interruptions in the electric power supply, the customers’ “electrical appliances” burn out, so the user chooses to use this channel as a means of resolution. |
Appendix B
This section presents the heat maps corresponding to the evolution of the 5 topics for each company and the categorization into positive, negative, and neutral of the tweets of each of the messages included in each topic (this exercise was also performed for the Acueducto and Vanti).
Figure A1.
Heat Map by Topics – Enel.
Appendix C
Table A2.
Tracking Metrics.
| Metrics | Objective | Temporality |
|---|---|---|
| Number of tweets per hour by topic | Identify topics that may be trending within each company in advance to take corrective actions. | Per hour |
| Number of negative tweets on the critical topic by company | Based on the identification of the topics with the highest number of negative tweets (categorized through the Bing dictionary), it is proposed to perform a daily monitoring of the number of communications that are categorized within this group. As in previous cases, we can identify actions that have generated a decrease in this indicator and that can be maintained over time to generate a continuous improvement. | Daily |
| Tweet polarity score (tps) | Determine the number of positive and negative tweets according to the Bing dictionary classification. | Per hour |
| Pn Tweet polartiy scoreBREAK(pn tweet) | Determine the ratio between the total number of positive and negative tweets, always aiming to be greater than or equal to one. It makes it possible to quickly track the general perception of the user. | Per hour |
| User polarity scoreBREAK(up) | Identify the category (positive, negative, neutral, n/a) of users from the tagging of their tweets, focusing on identifying which users have a higher amount of positive or negative tweets. It is based on the Bing dictionary | Per hour |
| Pn user polarity scoreBREAK(pn user) | Determine the ratio between users categorized as positive and negative according to the Bing dictionary. Like the previous metric, it shows a ratio, but this time between the number of positive and negative users, so it should aim to be at least equal to one. | Per hour |
References
- Enel - Codensa, “Enel,” 16 Septiembre 2021. [Online]. Available: https://www.enel.com.co/es/las-companias/codensa.html#:~:text=Con%20un%2024%25%20de%20participaci%C3%B3n,el%20manejo%20de%20sus%20operaciones. [Accessed 16 Septiembre 2021].
- Vanti, “Informe de Sostenibilidad 2020,” Una Tinta Medios SAS, Bogota, 2020.
- Empresa de Acueducto y alcantarillado de Bogotá, “EAAB,” 16 Septiembre 2021. [Online]. Available: https://www.acueducto.com.co/wps/portal/EAB2/Home/la-empresa/informacion-general/!ut/p/z0/04_Sj9CPykssy0xPLMnMz0vMAfIjo8zizQKdDQwtDIz8DEyMnA0CgwOcgvxDnQ19jMz0C7IdFQFA0Q31/. [Accessed 16 Septiembre 2021].
- Super Intendencia de Servicios Publicos Domiciliarios, “En 2020, Superservicios recibió más de 260 mil trámites y solicitudes de usuarios de los servicios públicos domiciliarios,” Bogota, 2021.
- Enel, “Informe de sosteniblidad 2020,” N.E, Bogotá, 2020.
- W. Songpan, “The Analysis and Prediction ofCustomer Review Rating Using Opinion Mining,” IEEE Computer Society, pp. 71-77, 7-9 Junio 2017.
- Y. Zhan, R. Han, M. Tse, M. Helmi Ali and J. Hu, “A social media analytic framework for improving operations and service management: A study of the retail pharmacy industry,” Technological Forecasting & Social Change, pp. 1-14, 2021. [CrossRef]
- Innovare Pesquisa CIER, “COCIER Juntos Progresamos,” 25 Octubre 2021. [Online]. Available: COCIER Juntos Progresamos.
- M. P. Avila Rodriguez, Análisis de tweets y su influencia en los seguros de vida en el ámbito colombiano, Bogotá, Cundinamarca: Escuela Colombiana de Ingeniería Julio Garavito, 2020, pp. 1-121.
- G. Bello-Orgaz, H. Menéndez, S. Okazaki and D. Camacho, “Combining social-based data mining techniques to extract collective trendsfrom twitter,” Malaysian Journal of Computer Science, vol. 27, no. 2, pp. 95-111, 2014.
- S. Ranjan, S. Sood and V. Verma, “Twitter Sentiment Analysis of Real-time Customer Experience Feedback for Predicting Growth of Indian Telecom Companies,” in 2018 4th International Conference on Computing Sciences (ICCS), 2019.
- E. Y. Sari, A. D. Wierfi and A. Setyanto, “Sentiment Analysis of Customer Satisfaction on Transportation Network Company Using Naive Bayes Classifier,” in 2019 International Conference on Computer Engineering, Network, and Intelligent Multimedia (CENIM), Surabaya, Indonesia, 2019.
- W.-K. Kuo, D. Riantama and L.-S. Chen, “Using a Text Mining Approach to Hear Voices of Customers from Social Media toward the Fast-Food Restaurant Industry,” Sustainability, pp. 268-285, 30 Diciembre 2020. [CrossRef]
- K. Ogudo and N. Dahj Muwawa Jean, “Sentiment Analysis Application and Natural Language Processing for Mobile Network Operators’ Support on Social Media,” in 2019 International Conference on Advances in Big Data, Computing and Data Communication Systems (icABCD), Winterton, South Africa, 2019.
- Y. Ba and H. Lee , “Sentiment Analysis of Twitter Audiences: Measuring the Positive or Negative Influence of Popular Twitterers,” JOURNAL OF THE AMERICAN SOCIETY FOR INFORMATION SCIENCE AND TECHNOLOGY, pp. 2522-2535, 20 Noviembre 2012.
- W. Chamlertwat, P. Bhattarakosol, T. Rungkasiri and C. Haruechaiyasak, “Discovering Consumer Insight from Twitter via Sentiment Analysis,” Journal of Universal Computer Science, pp. 973-992, 2018.
- U. Fayyad, G. Piatetsky-Shapiro and P. Smyth, “The KDD Process for Extracting Useful Knowledge from Volumes of Data,” COMMUNICATIONS OF THE ACM, vol. 39, no. 11, pp. 27-34, Noviembre 1996. [CrossRef]
- V. Valcárcel Asencios, “DATA MINING Y EL DESCUBRIMIENTO DEL CONOCIMIENTO,” Industrial Data, vol. 7, no. 2, pp. 83-86, 2004. [CrossRef]
- R Core Team, “R: A language and environment for statistical computing,” 2021. [Online]. Available: https://www.R-project.org/.
- Microsoft Power BI, “Microsoft Corporation,” 2022. [Online]. Available: https://powerbi.microsoft.com/es-es/.
Figure 1.
Number of Tweets per day of the week for (a) Acueducto, (b) Enel, and (c) Vanti.
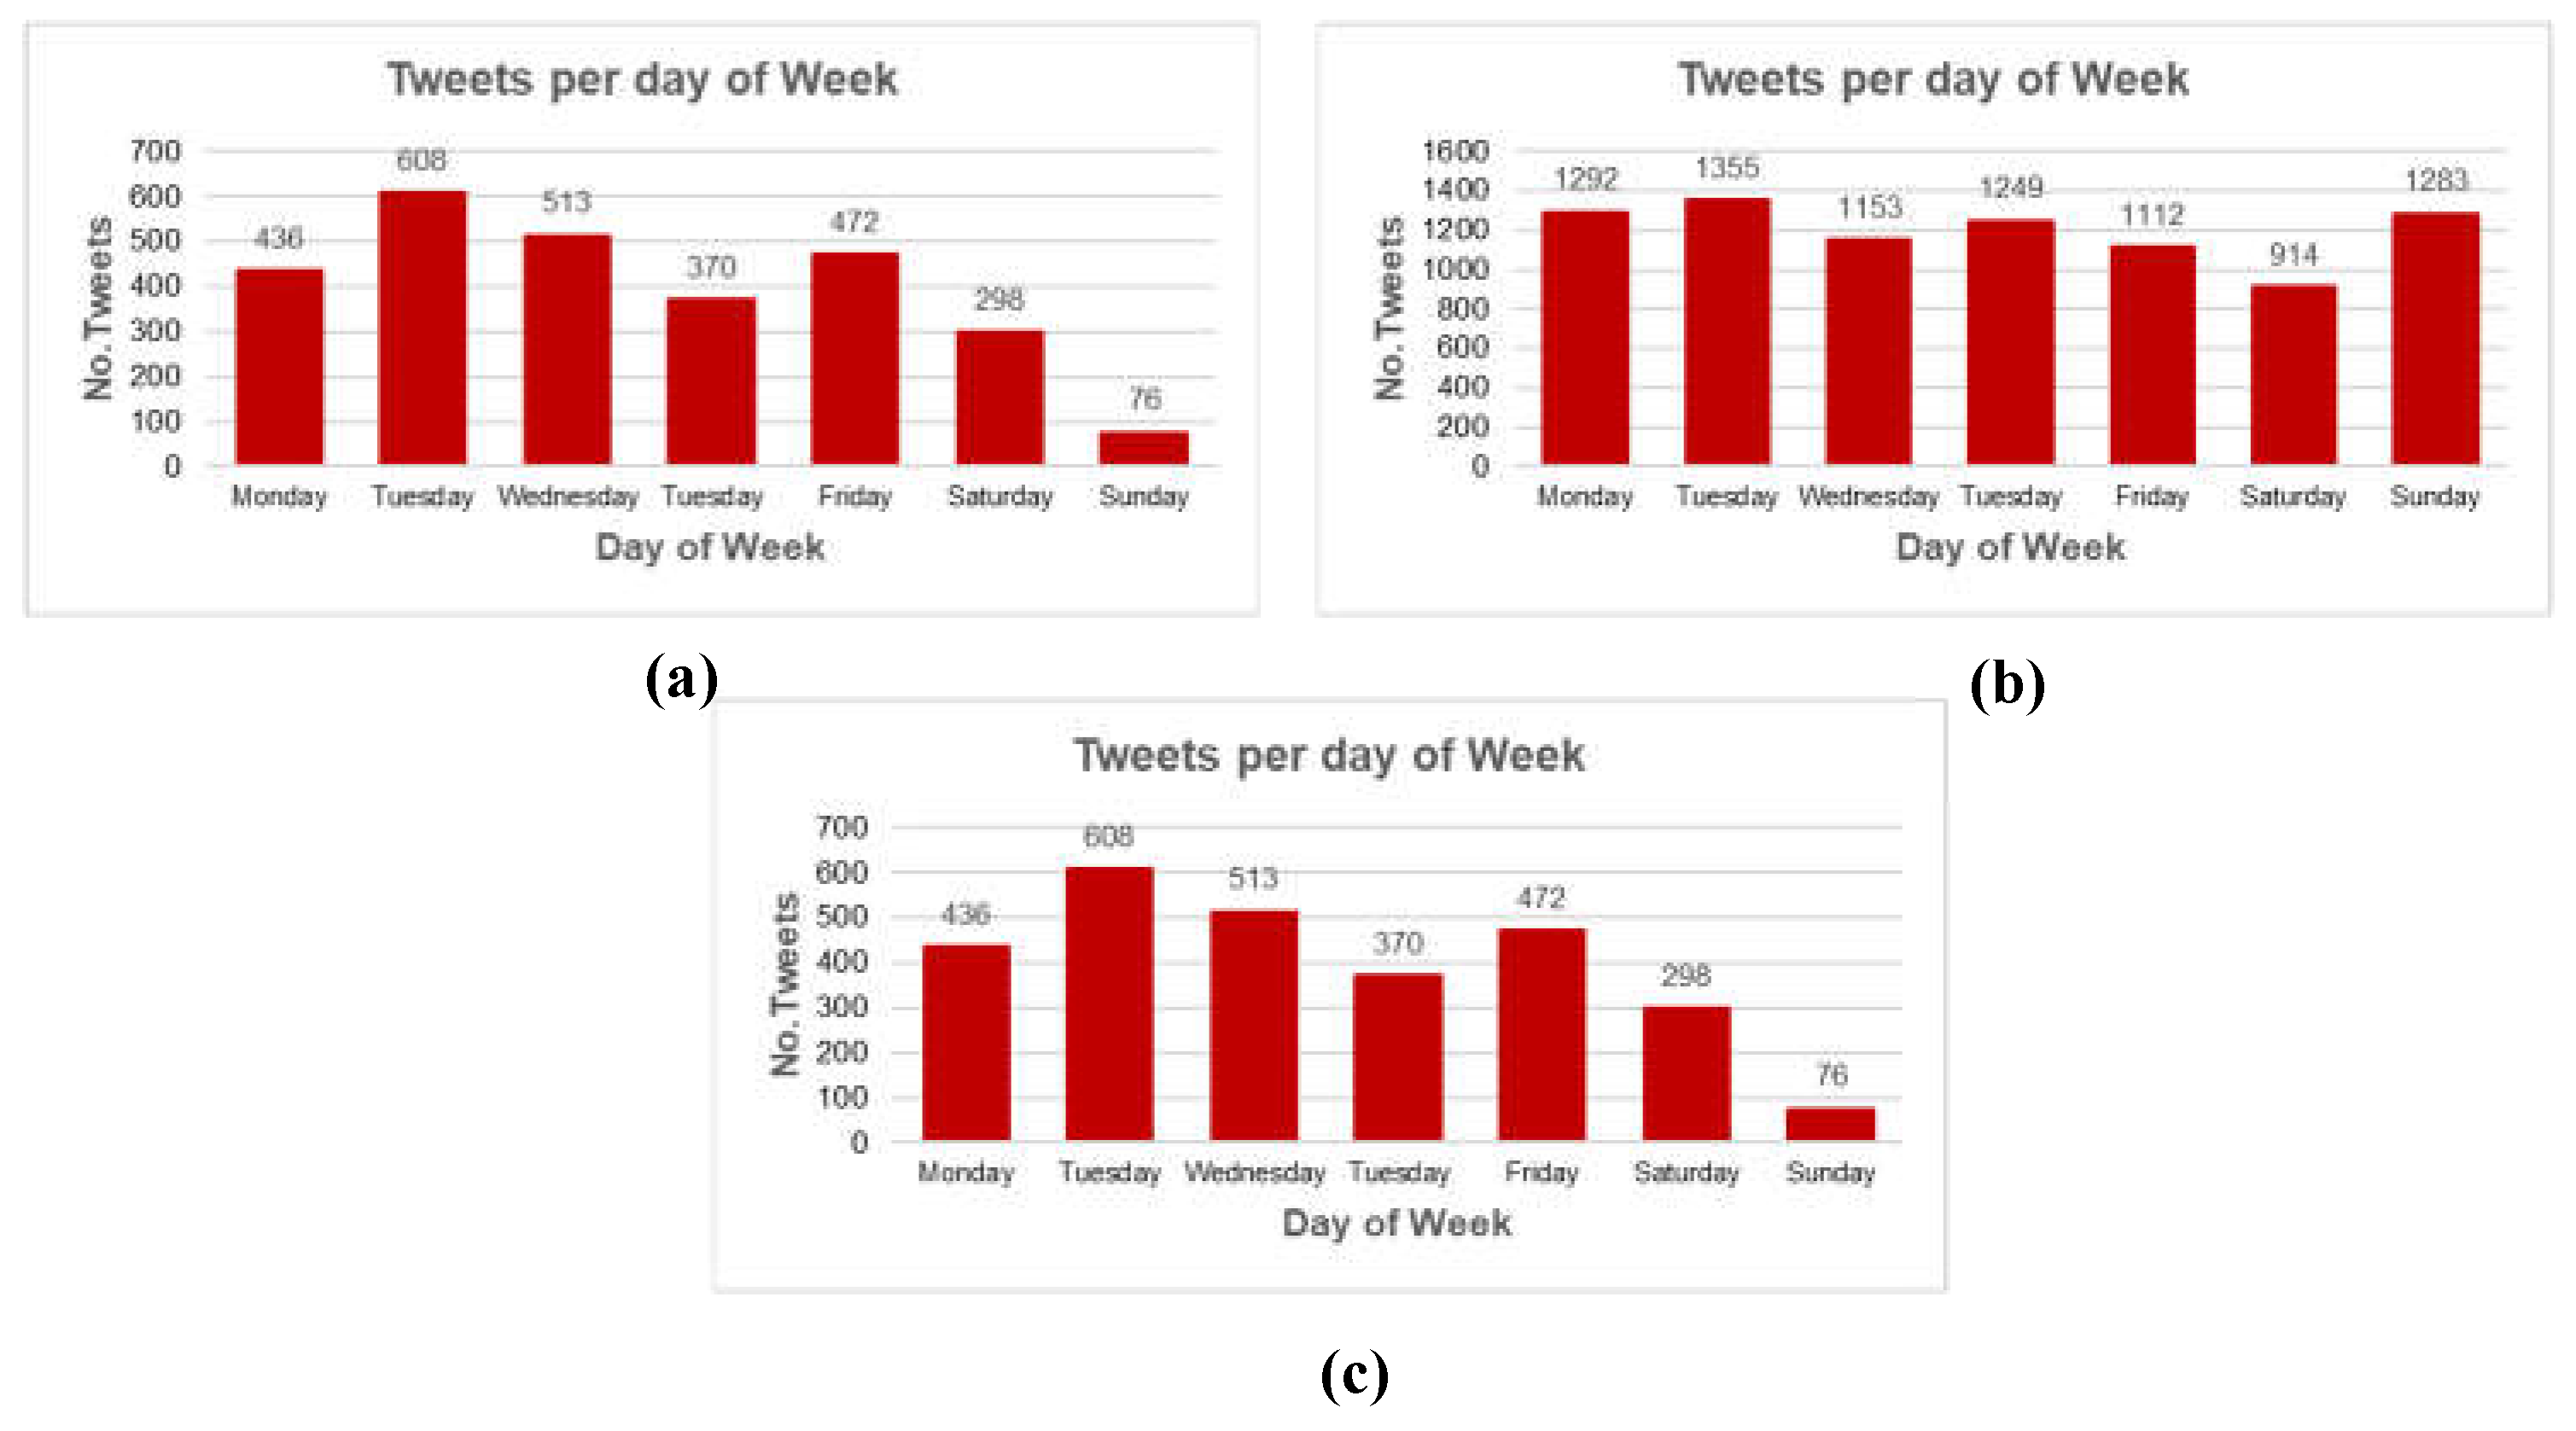
Figure 2.
Tweet traffic per hour of the day for each company.
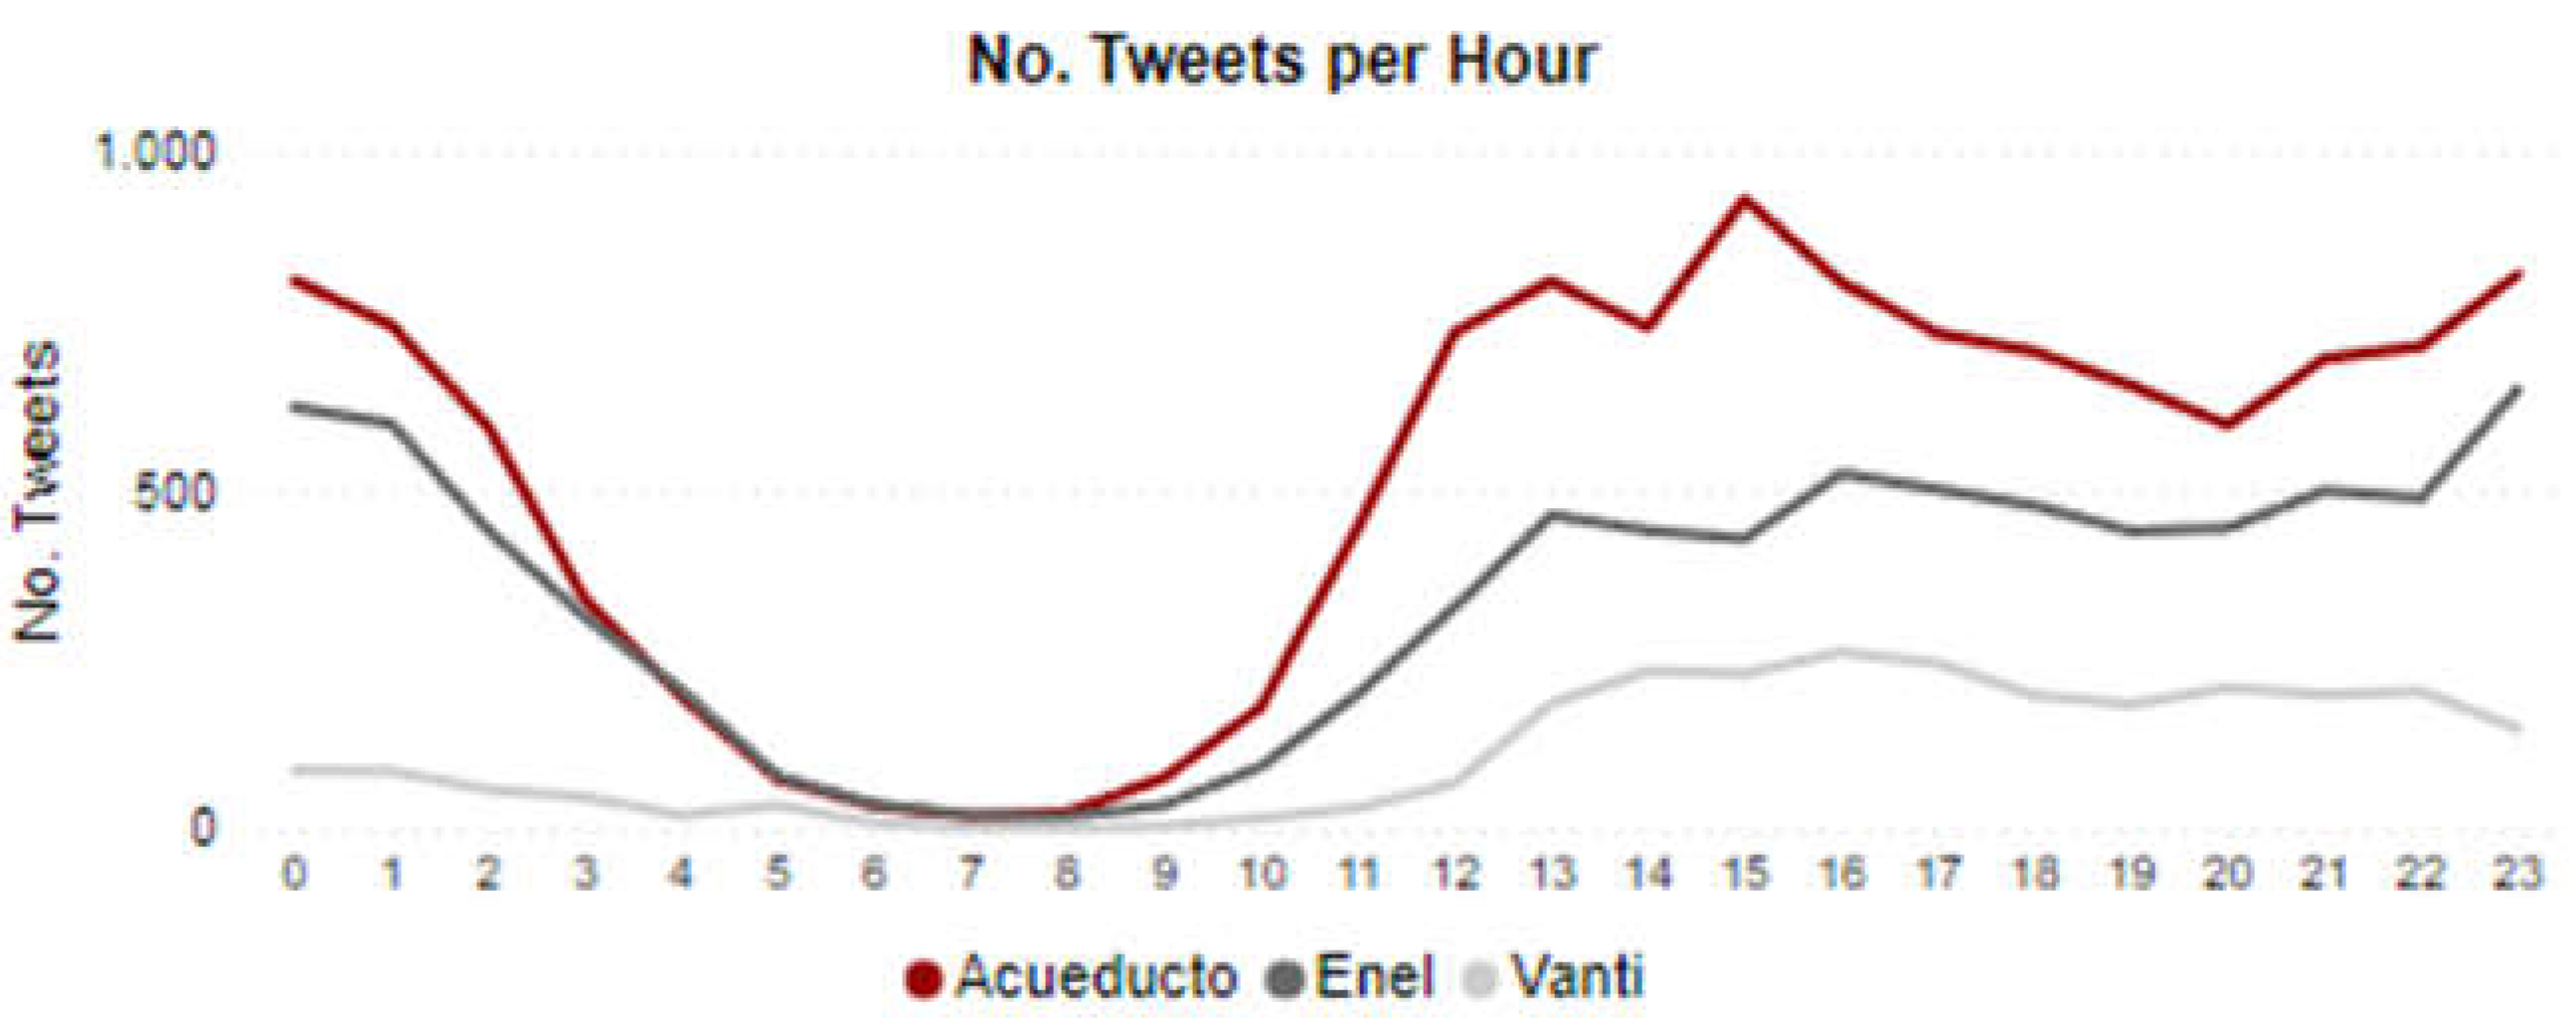
Figure 3.
Enel Time Series.
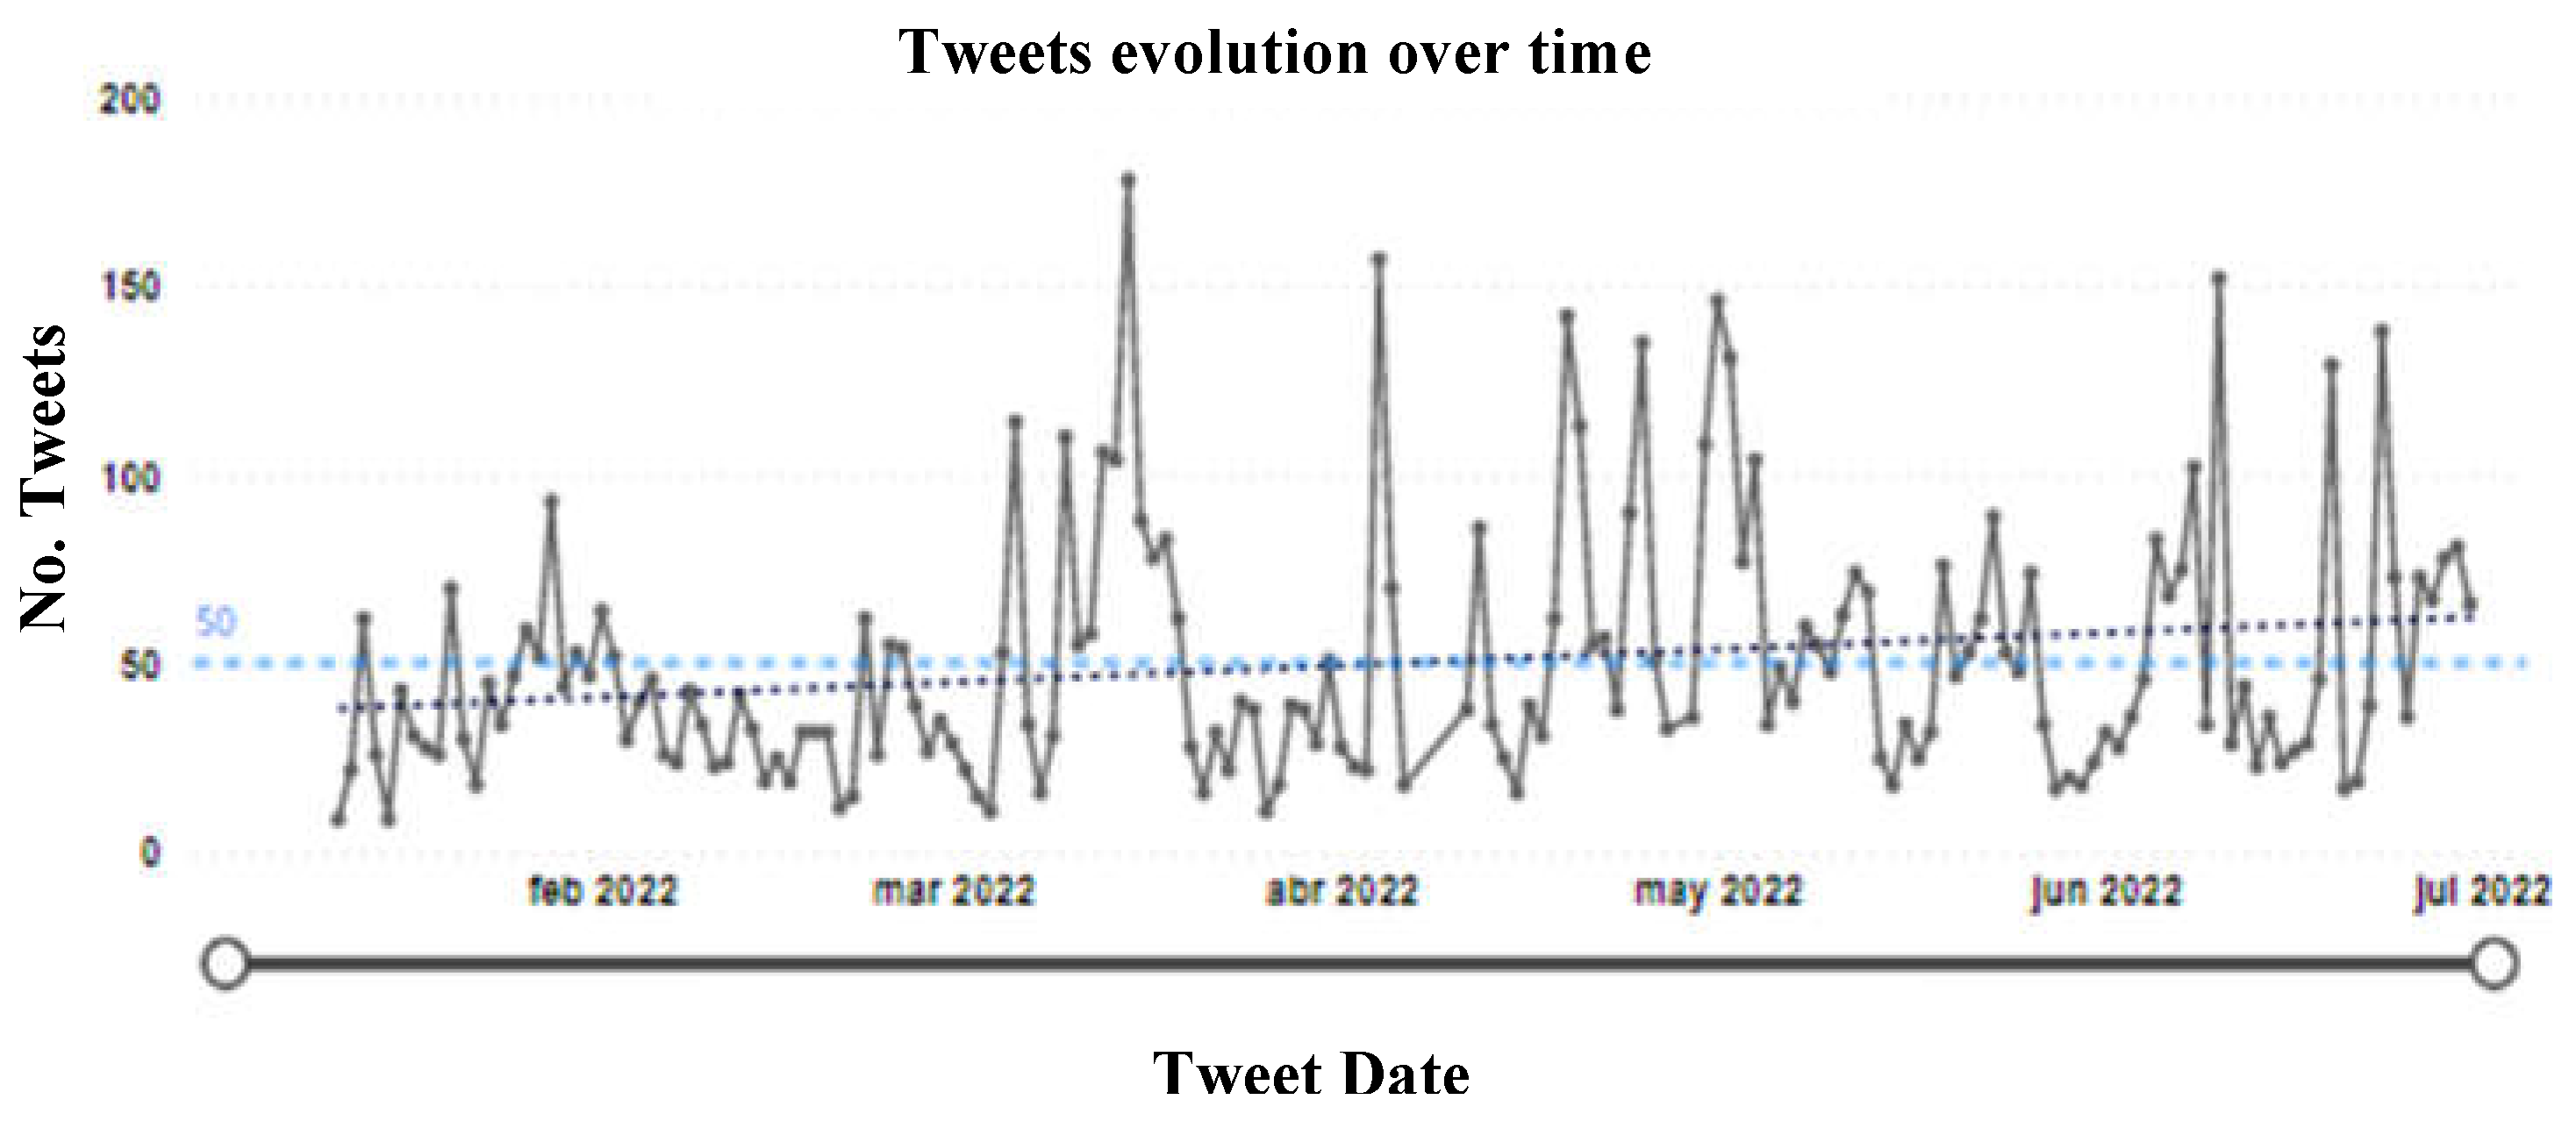
Figure 4.
Acueducto Time Series.
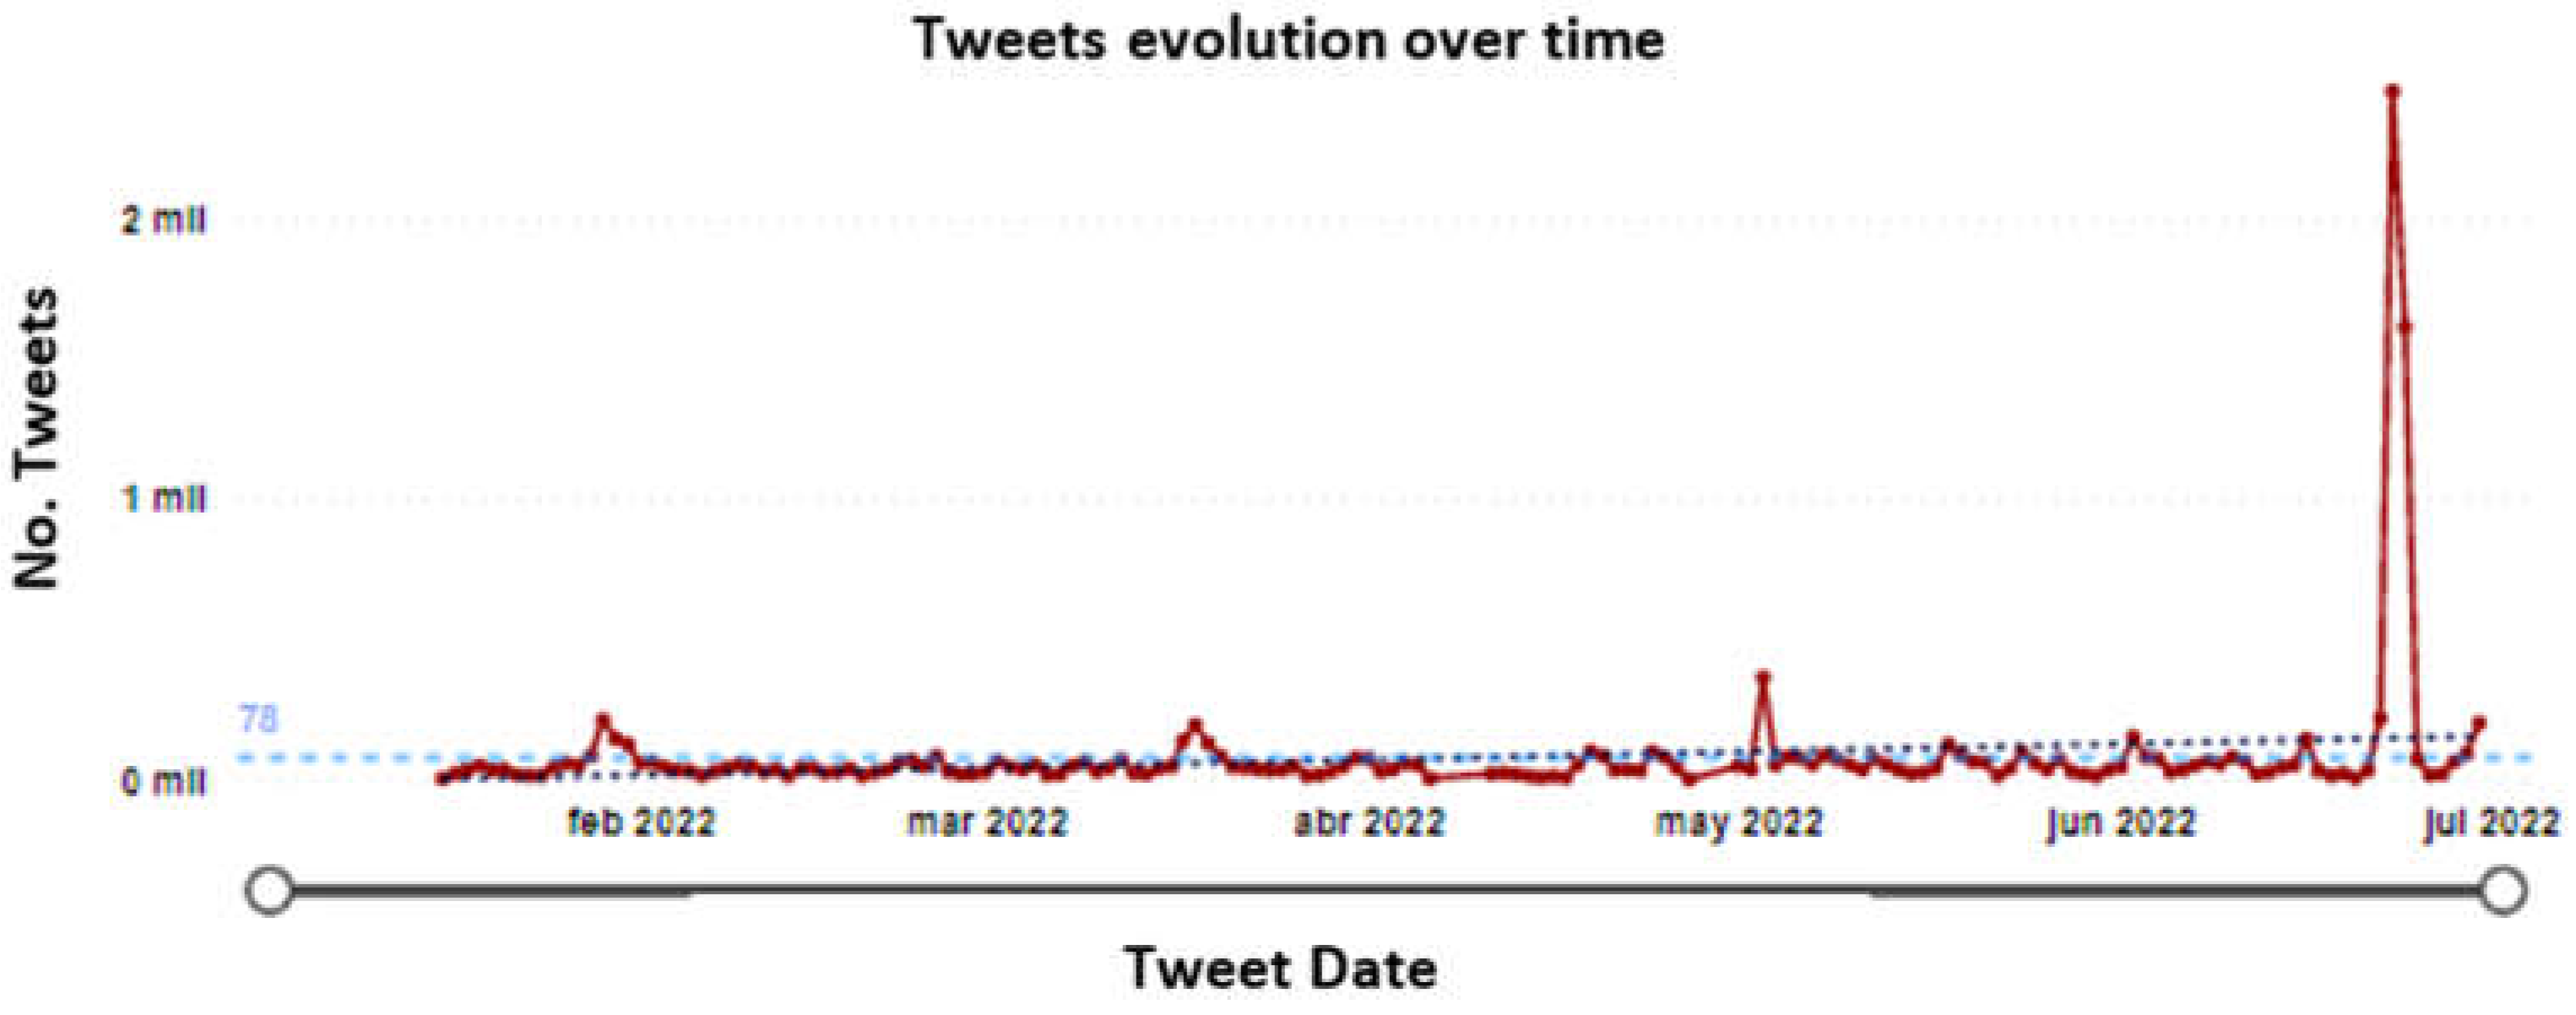
Figure 5.
Normalized Acueducto time series.
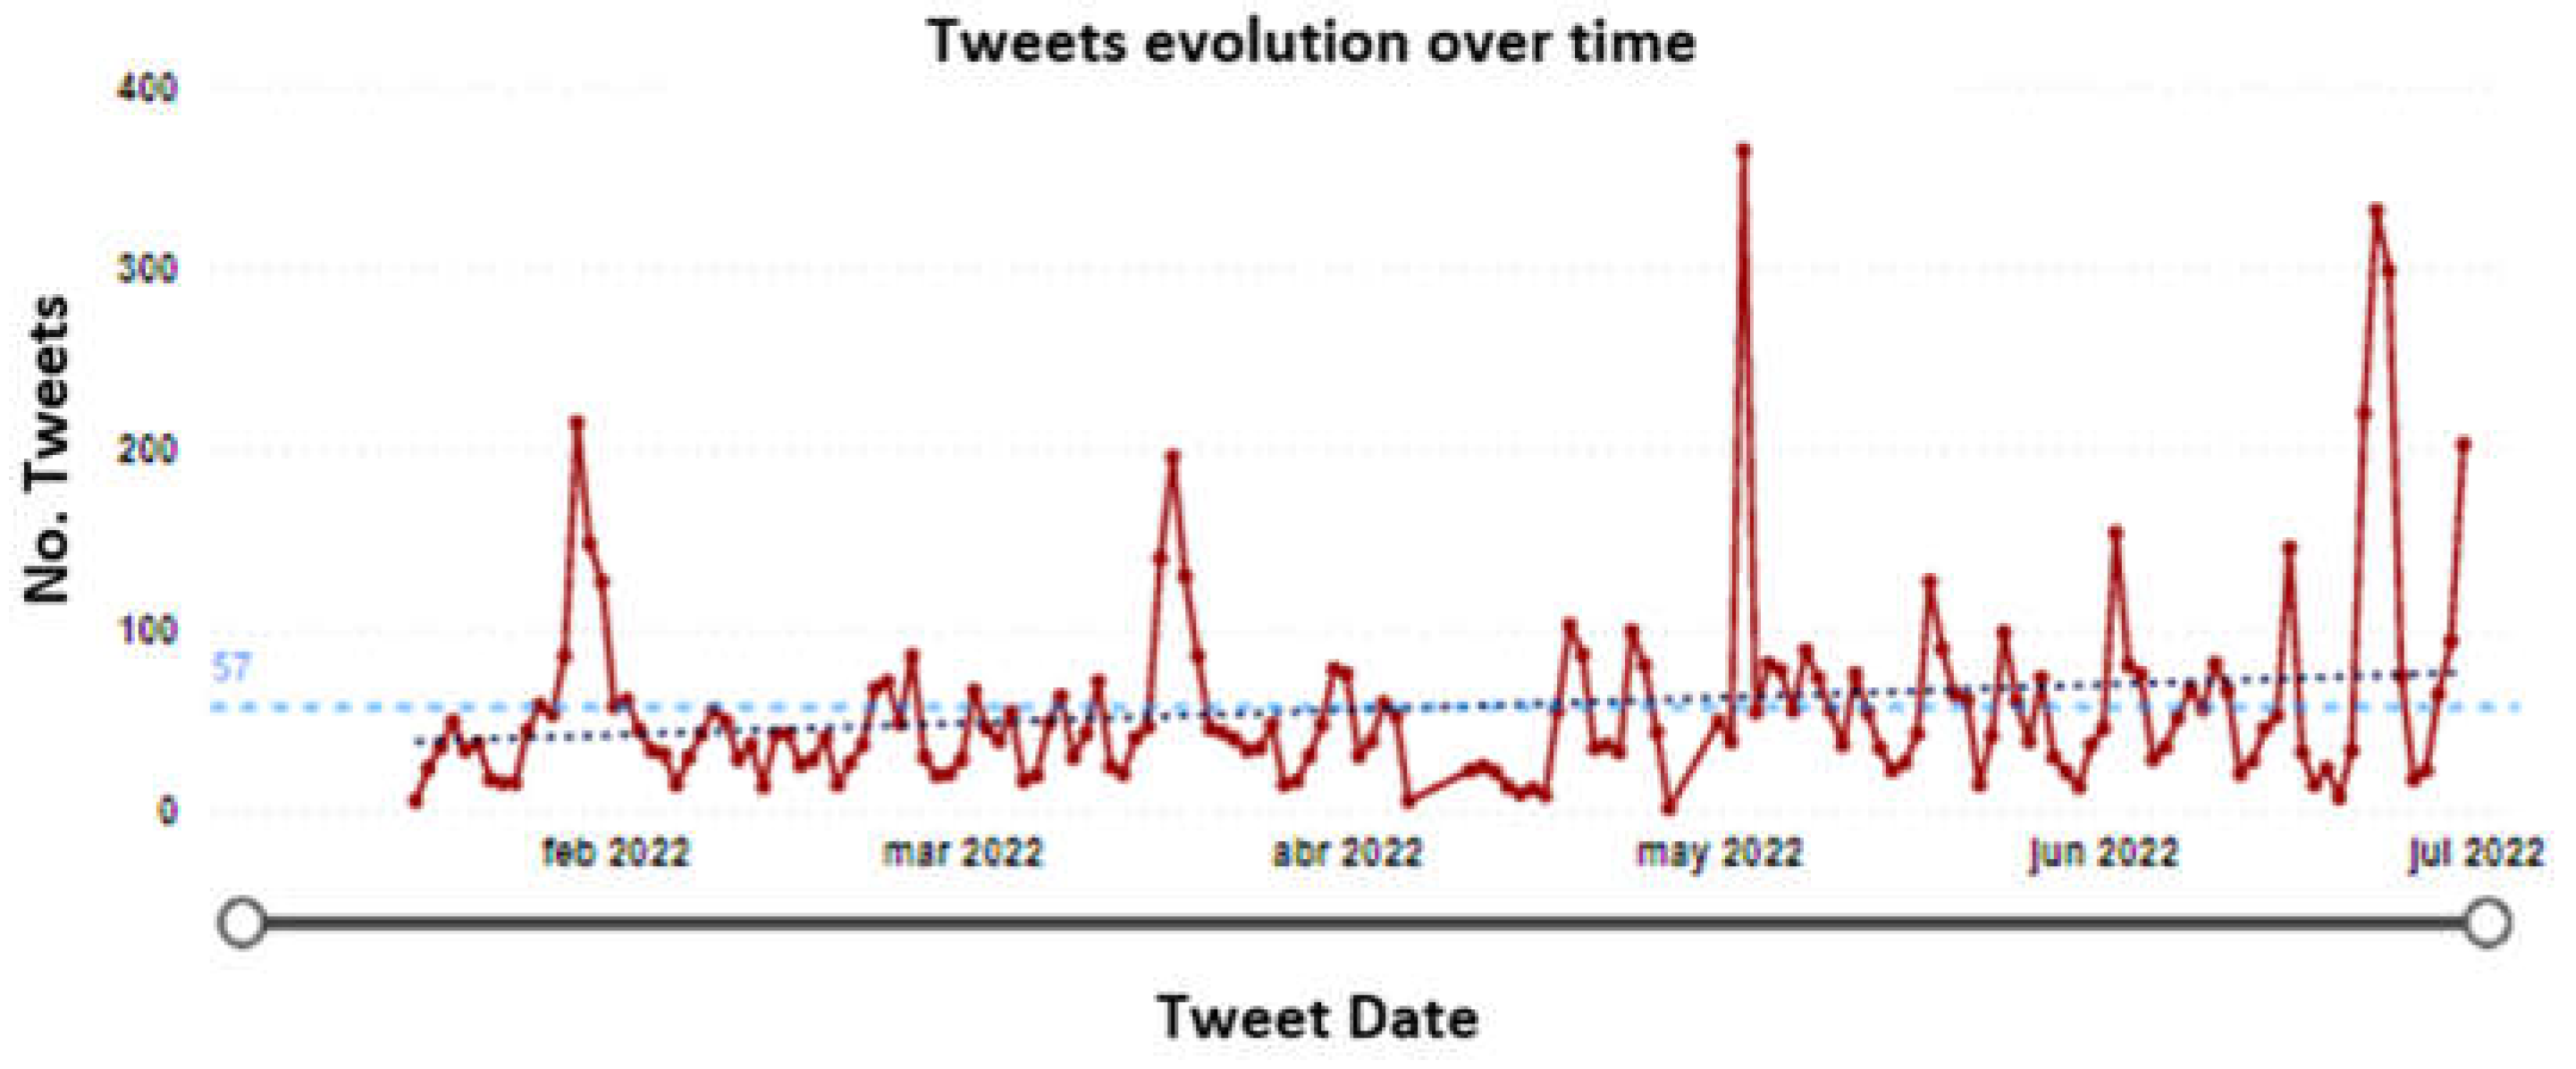
Figure 6.
Vanti Time Series.
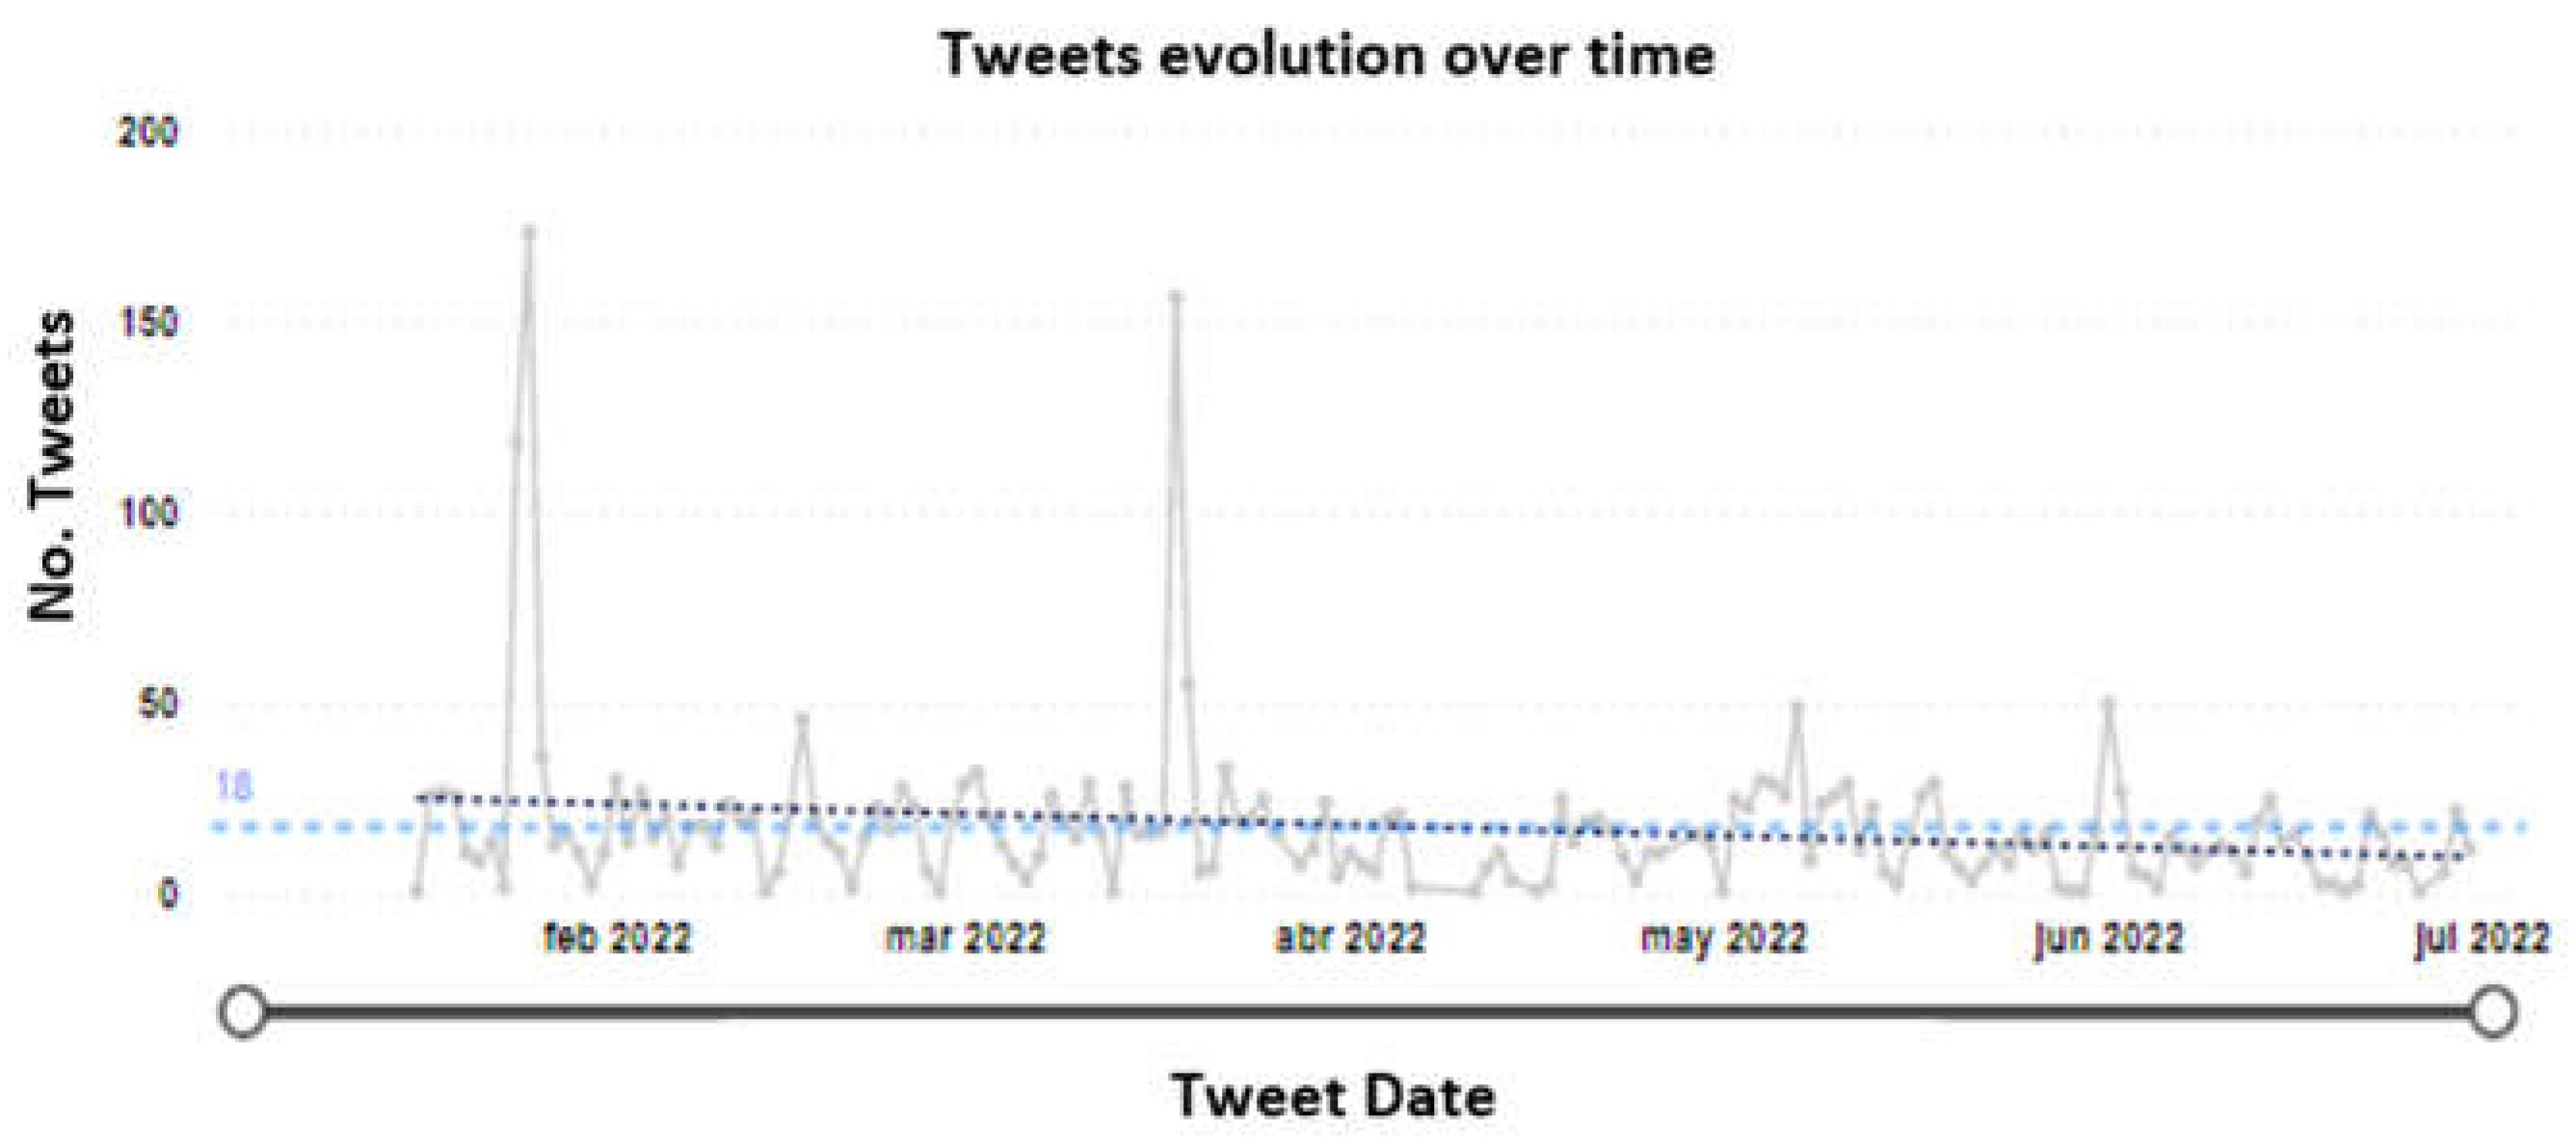
Figure 7.
Monthly temporal analysis of the distribution of tweet tagging through BING for the Acueducto.
Figure 7.
Monthly temporal analysis of the distribution of tweet tagging through BING for the Acueducto.
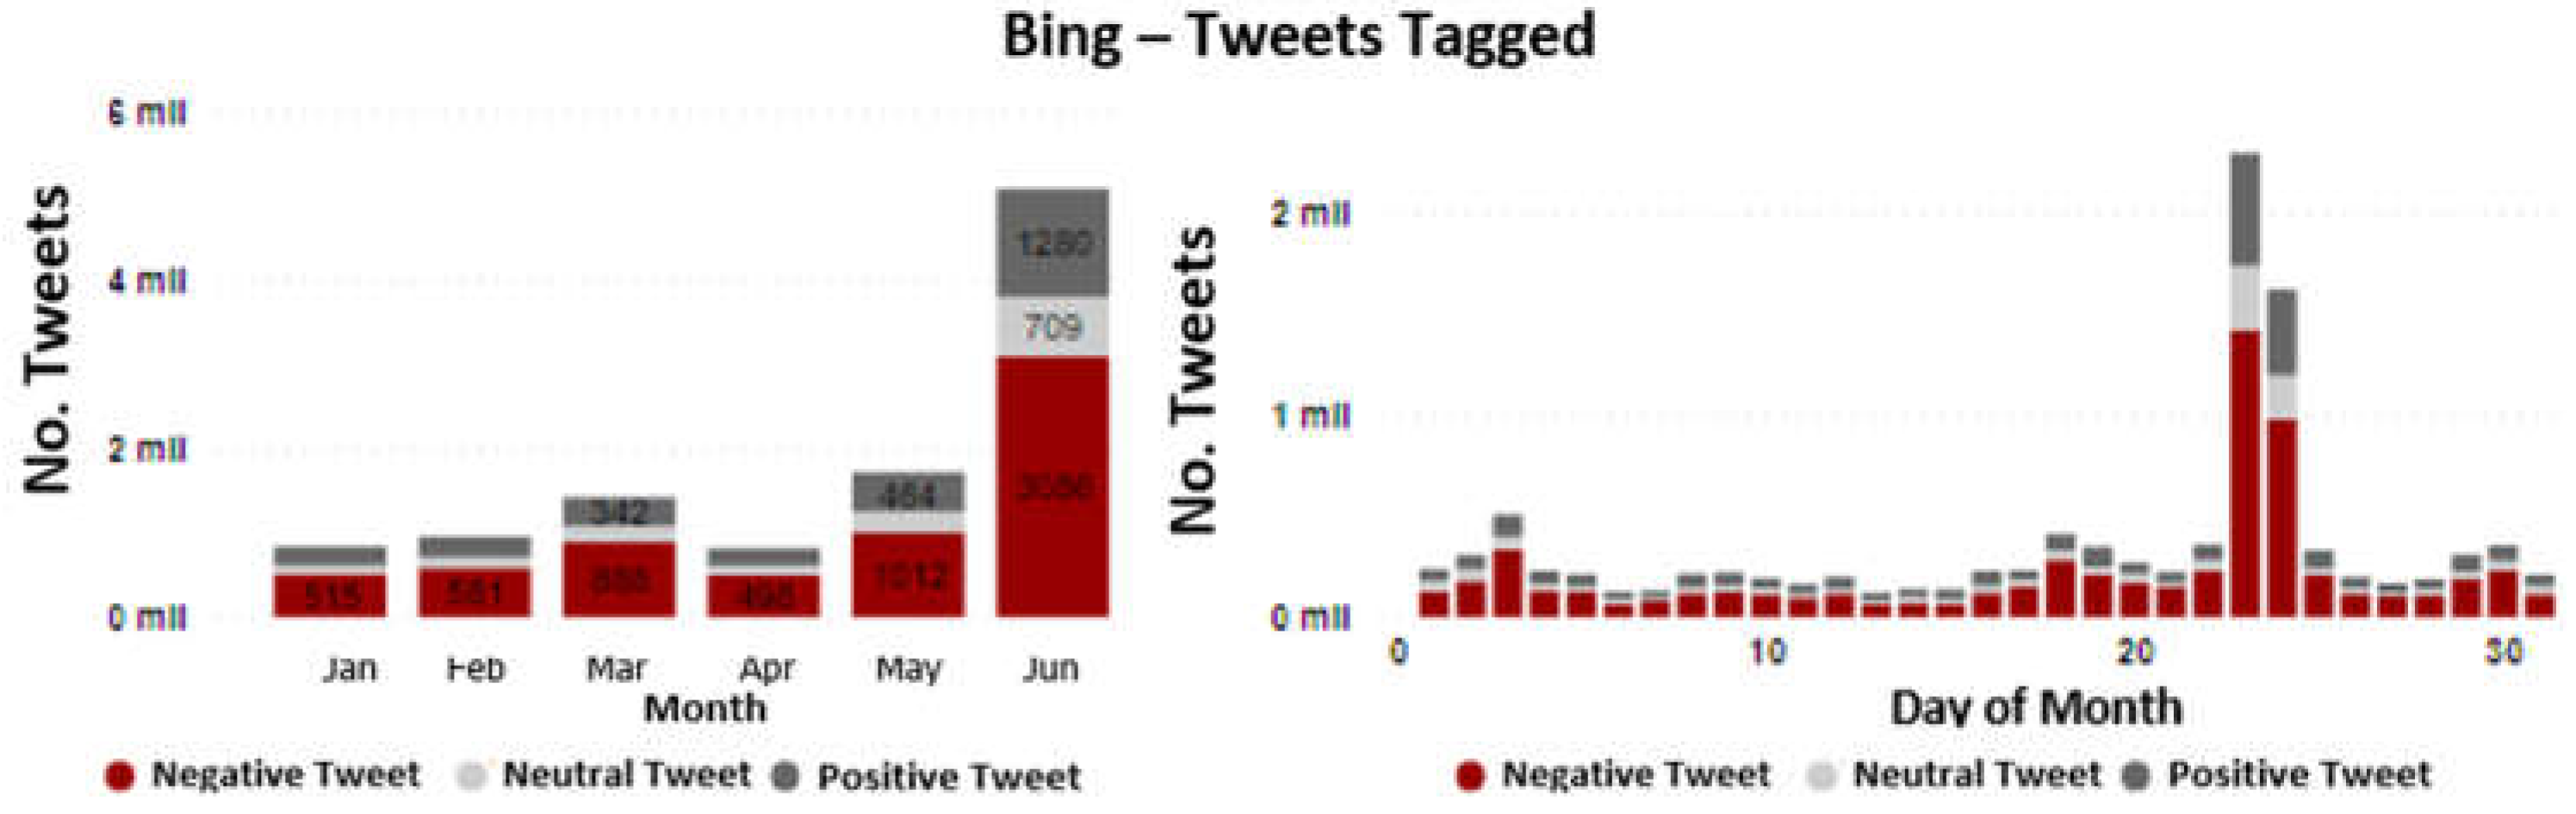
Figure 8.
Monthly temporal analysis of the distribution of tweet tagging through BING for Enel.
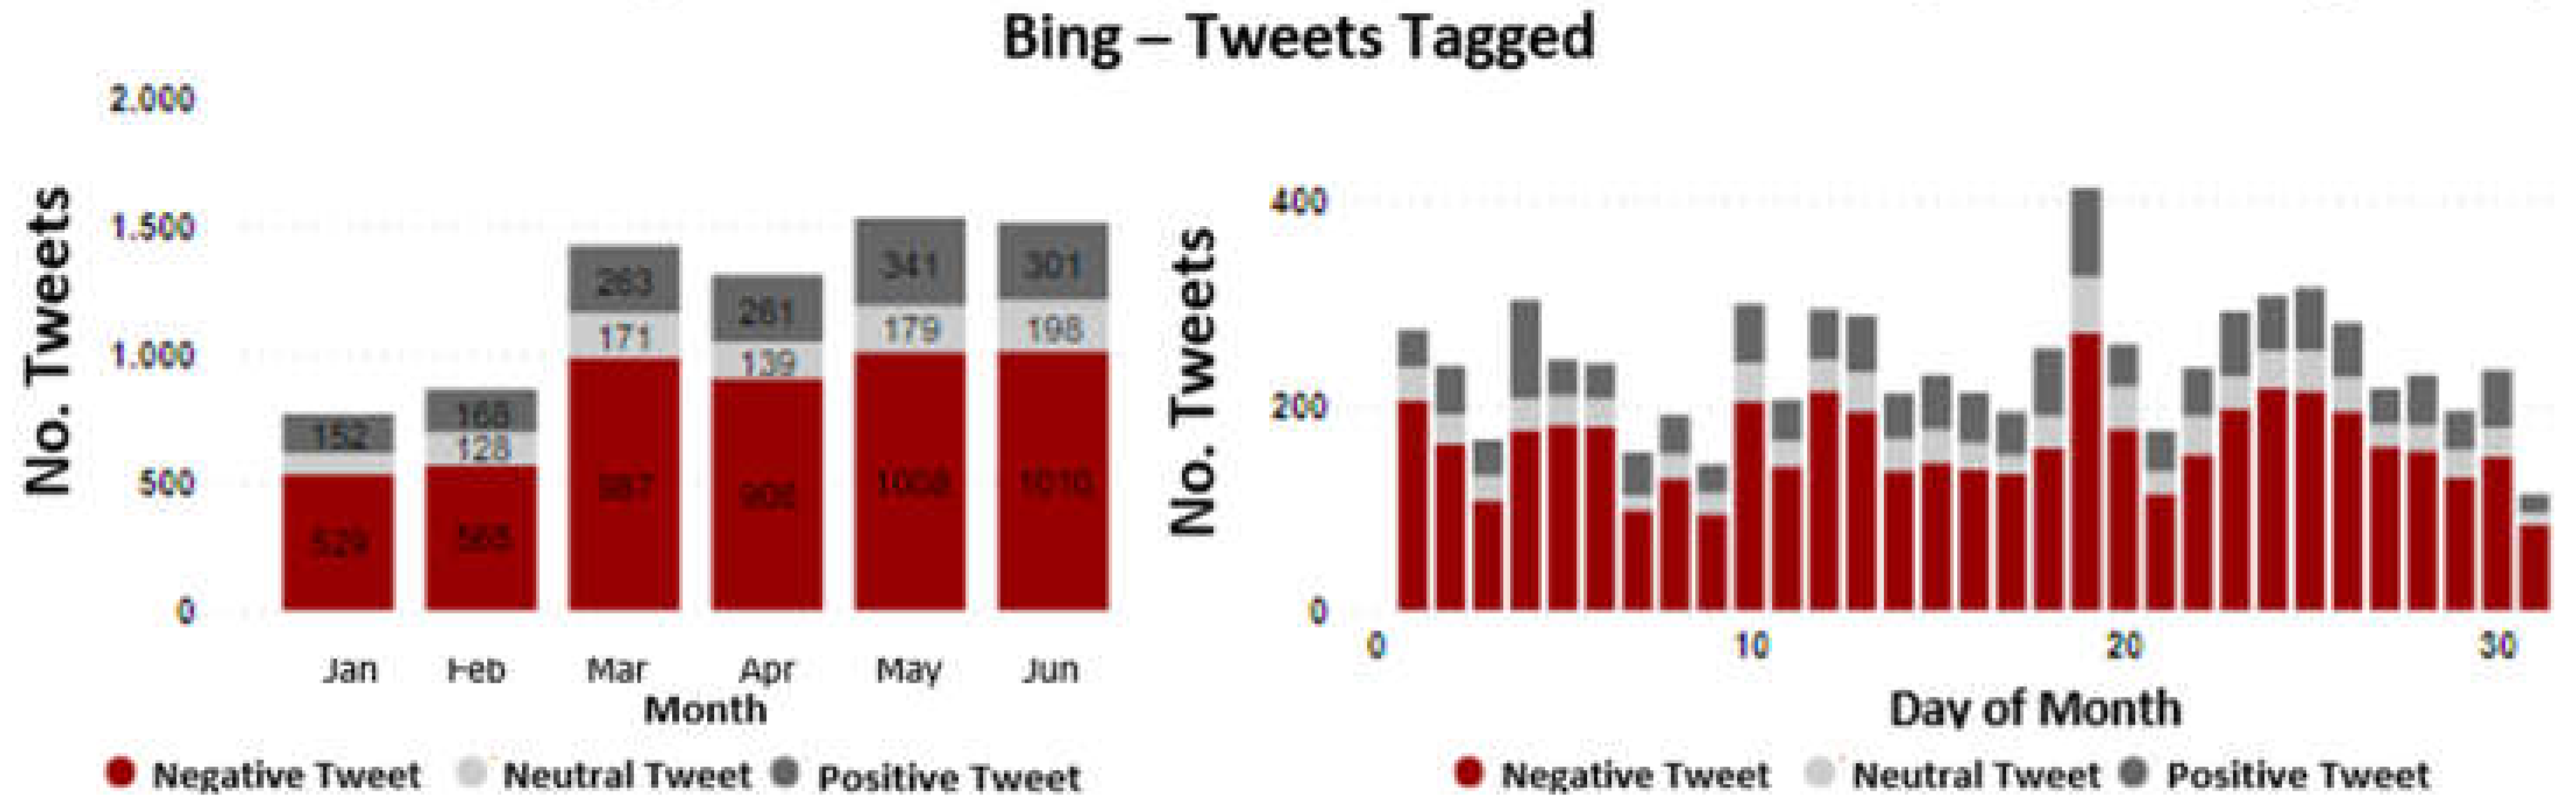
Figure 9.
Monthly temporal analysis of the distribution of tweet tagging through BING for Vanti.
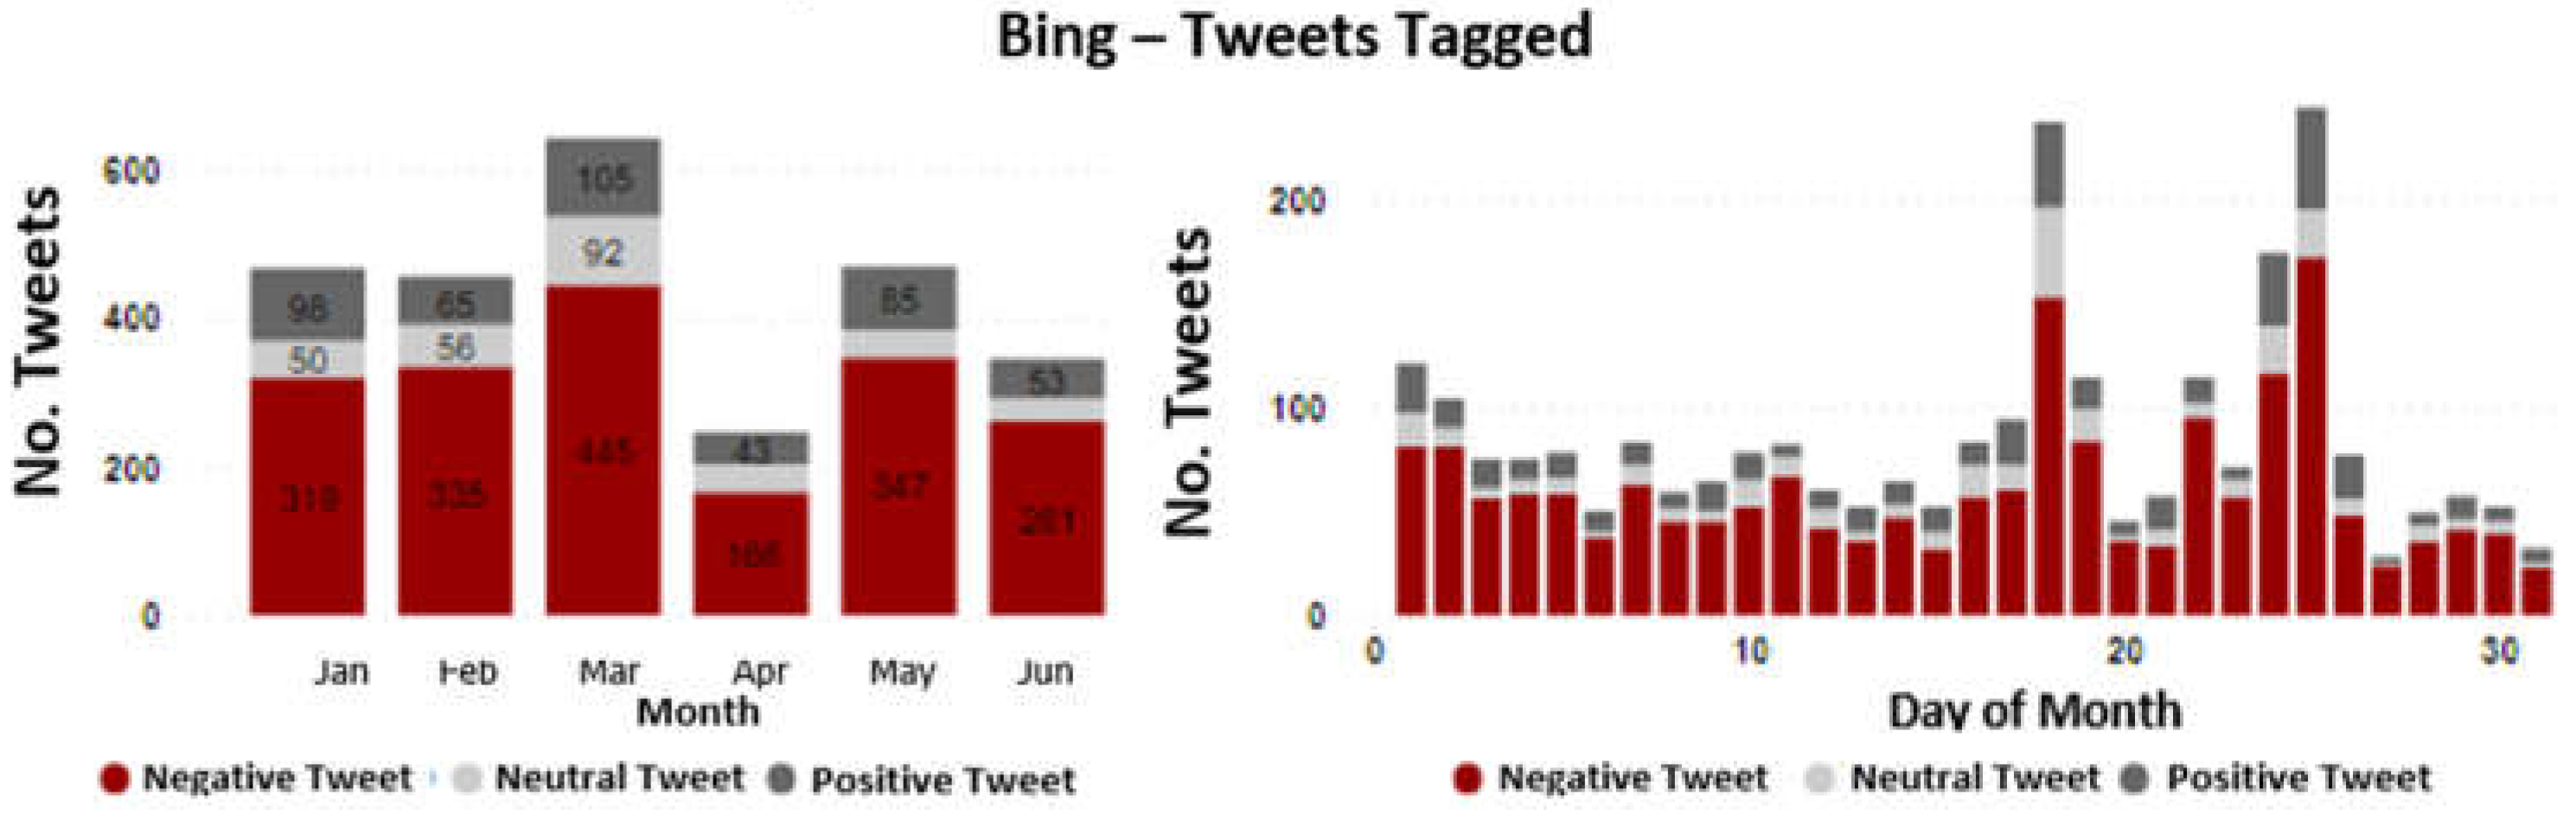
Figure 10.
Temporal analysis of sentiment intensity through Affin for Acueducto.
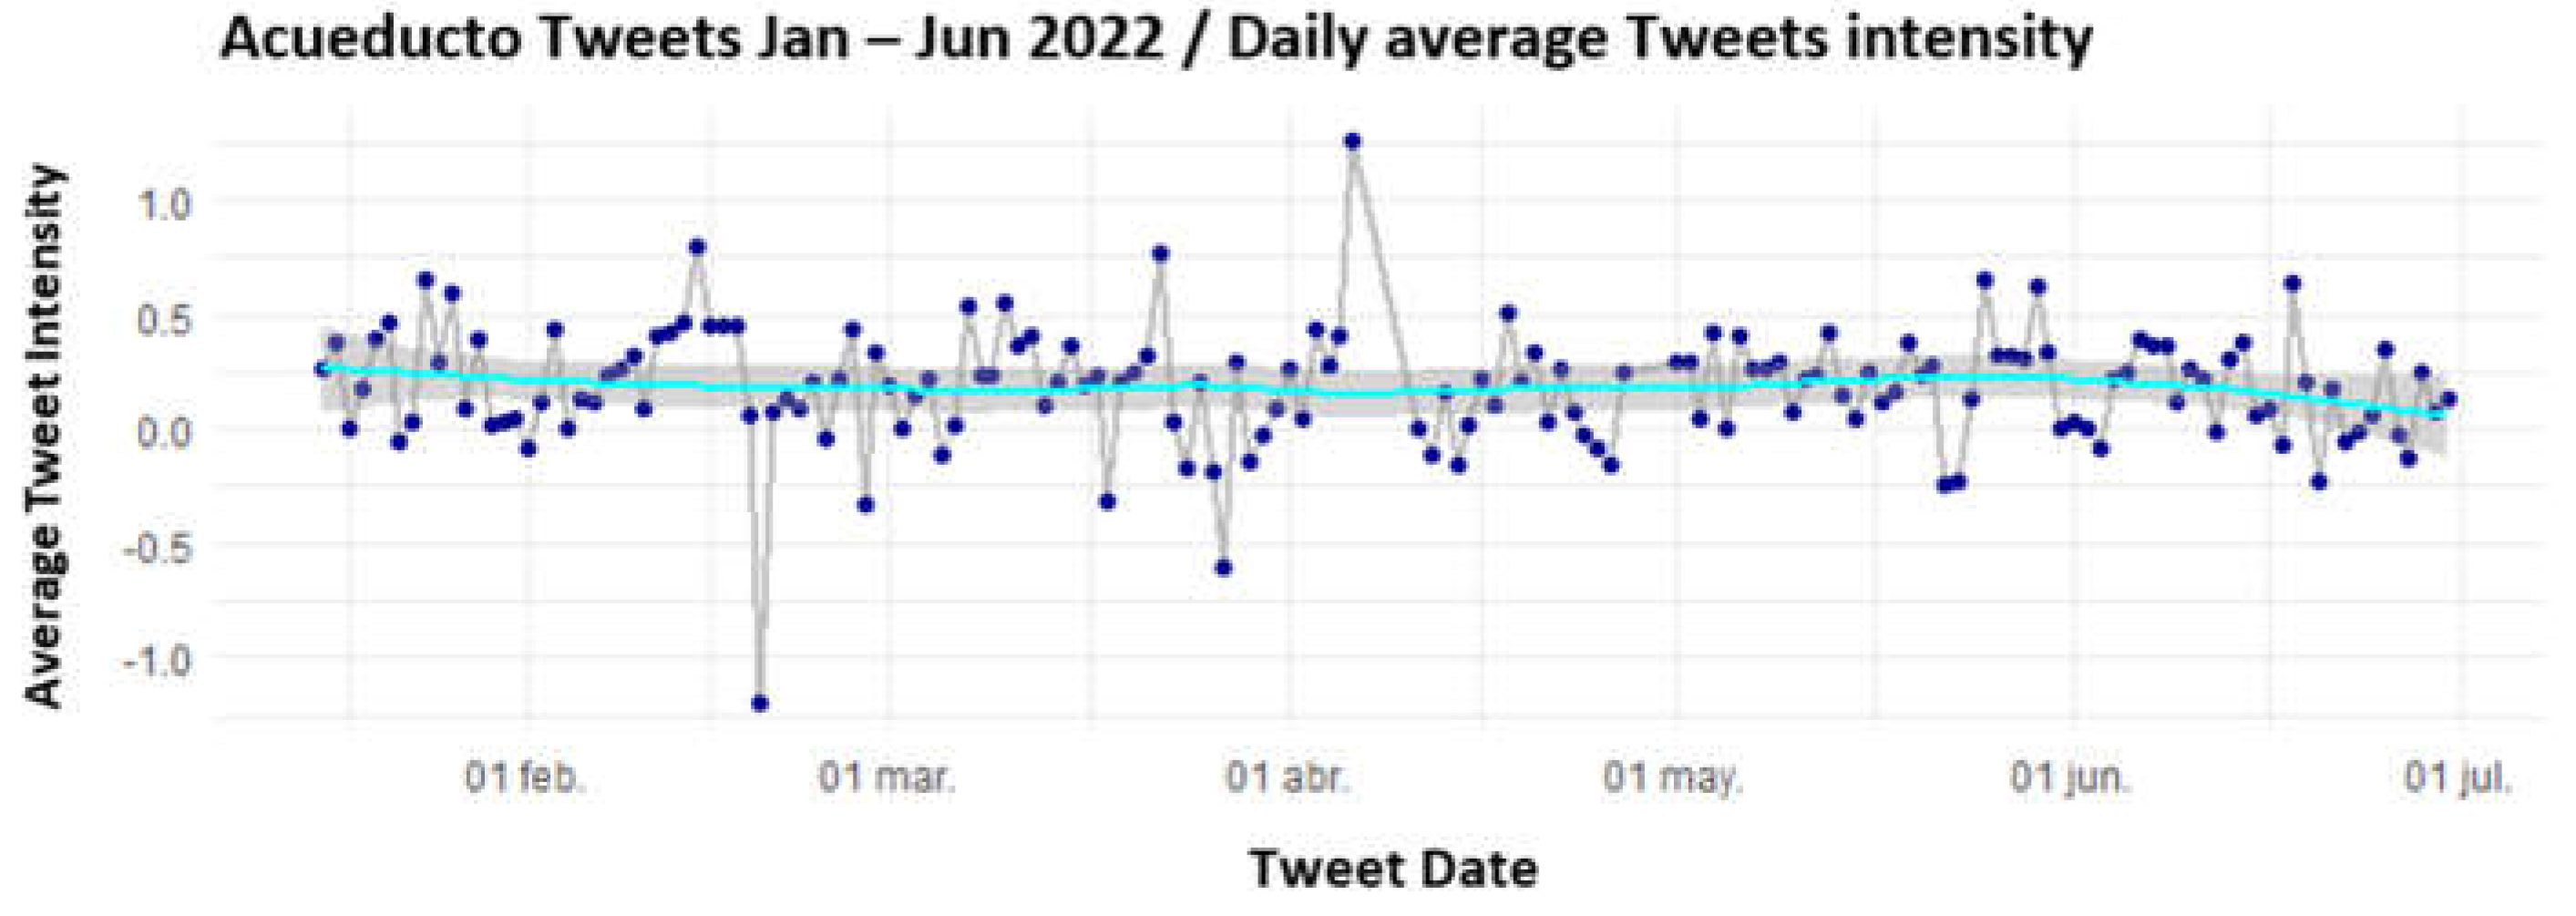
Figure 11.
Temporal analysis of sentiment intensity through Affin for Enel.
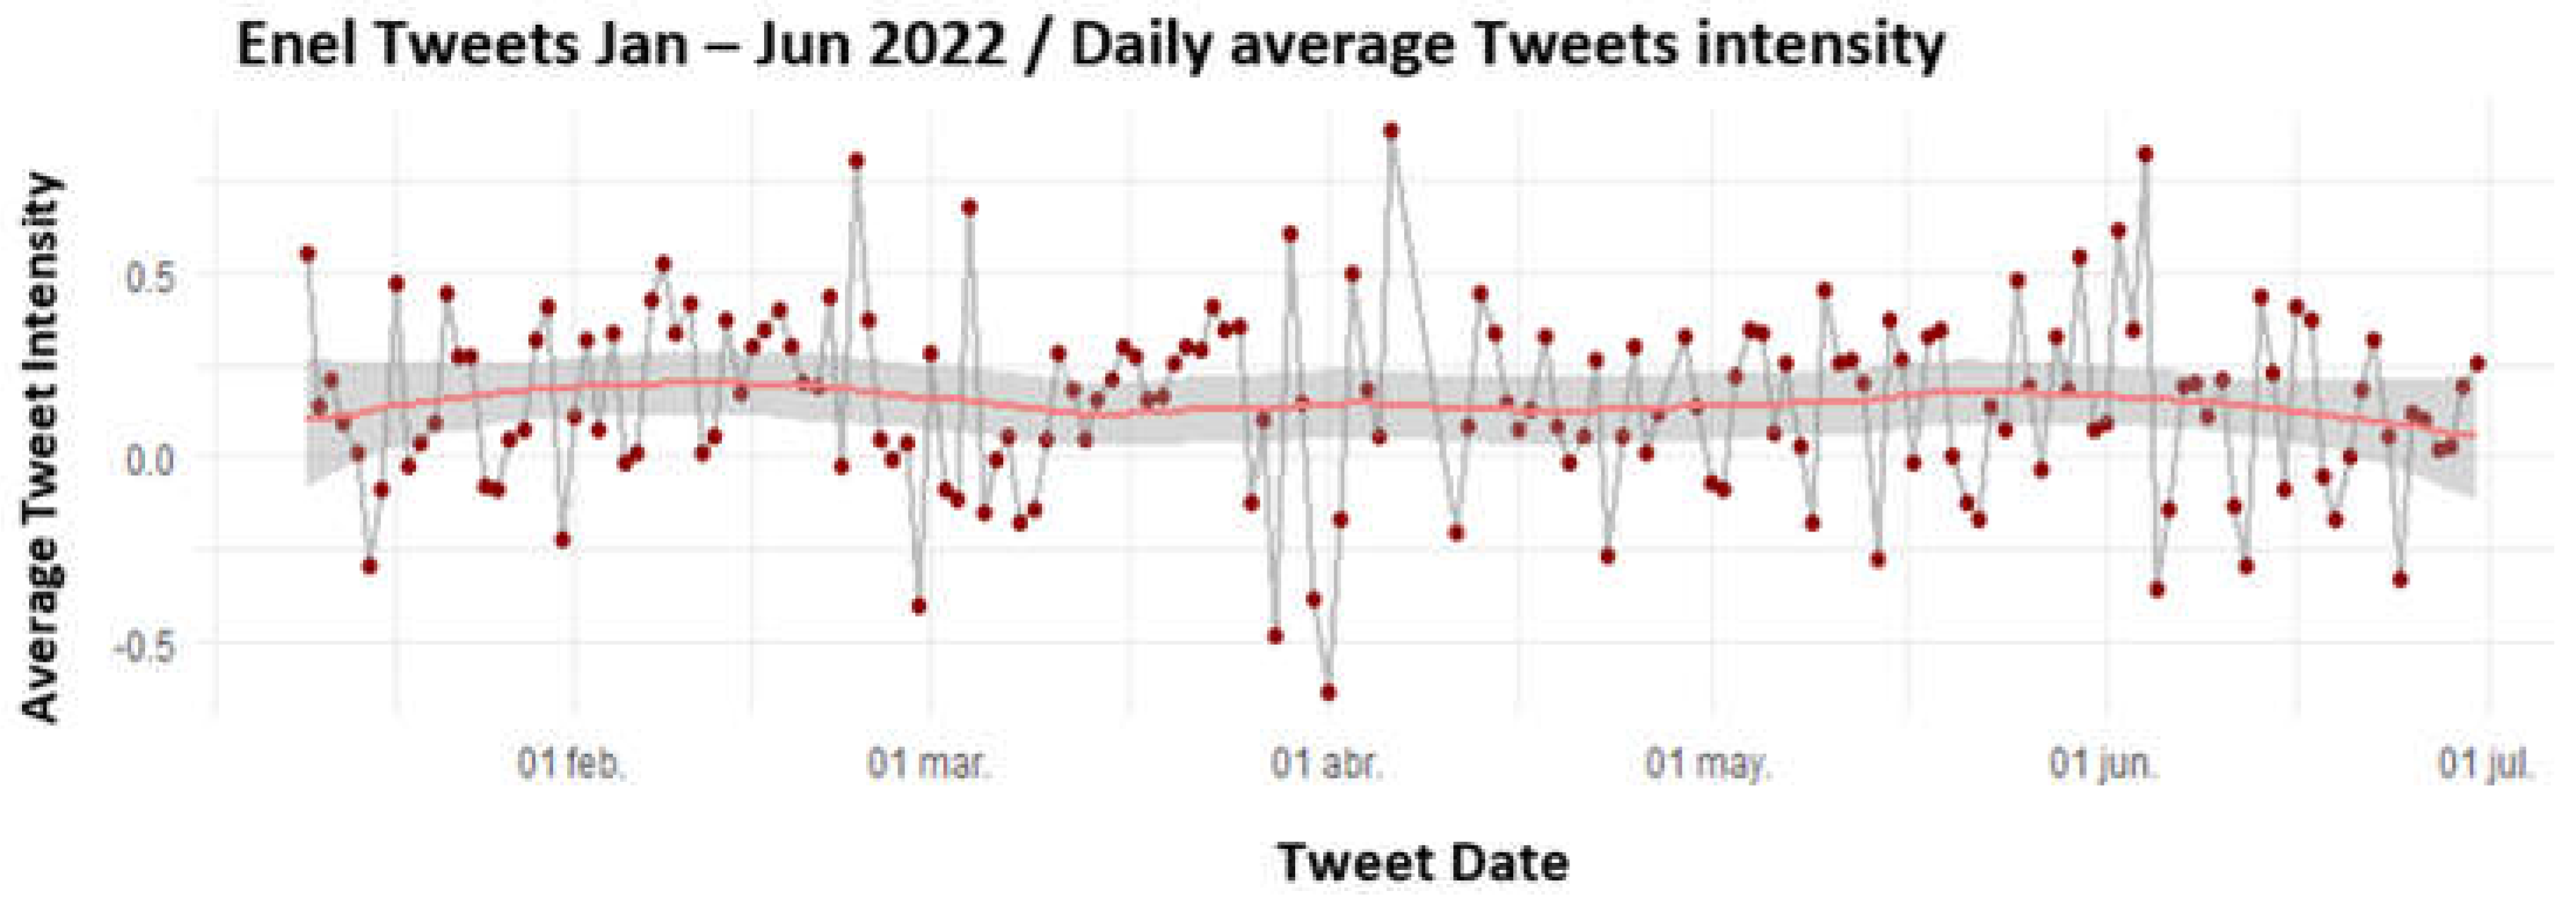
Figure 12.
Temporal analysis of sentiment intensity through Affin for Vanti.

Figure 13.
Temporal analysis of sentiments through NRC to Acueducto.
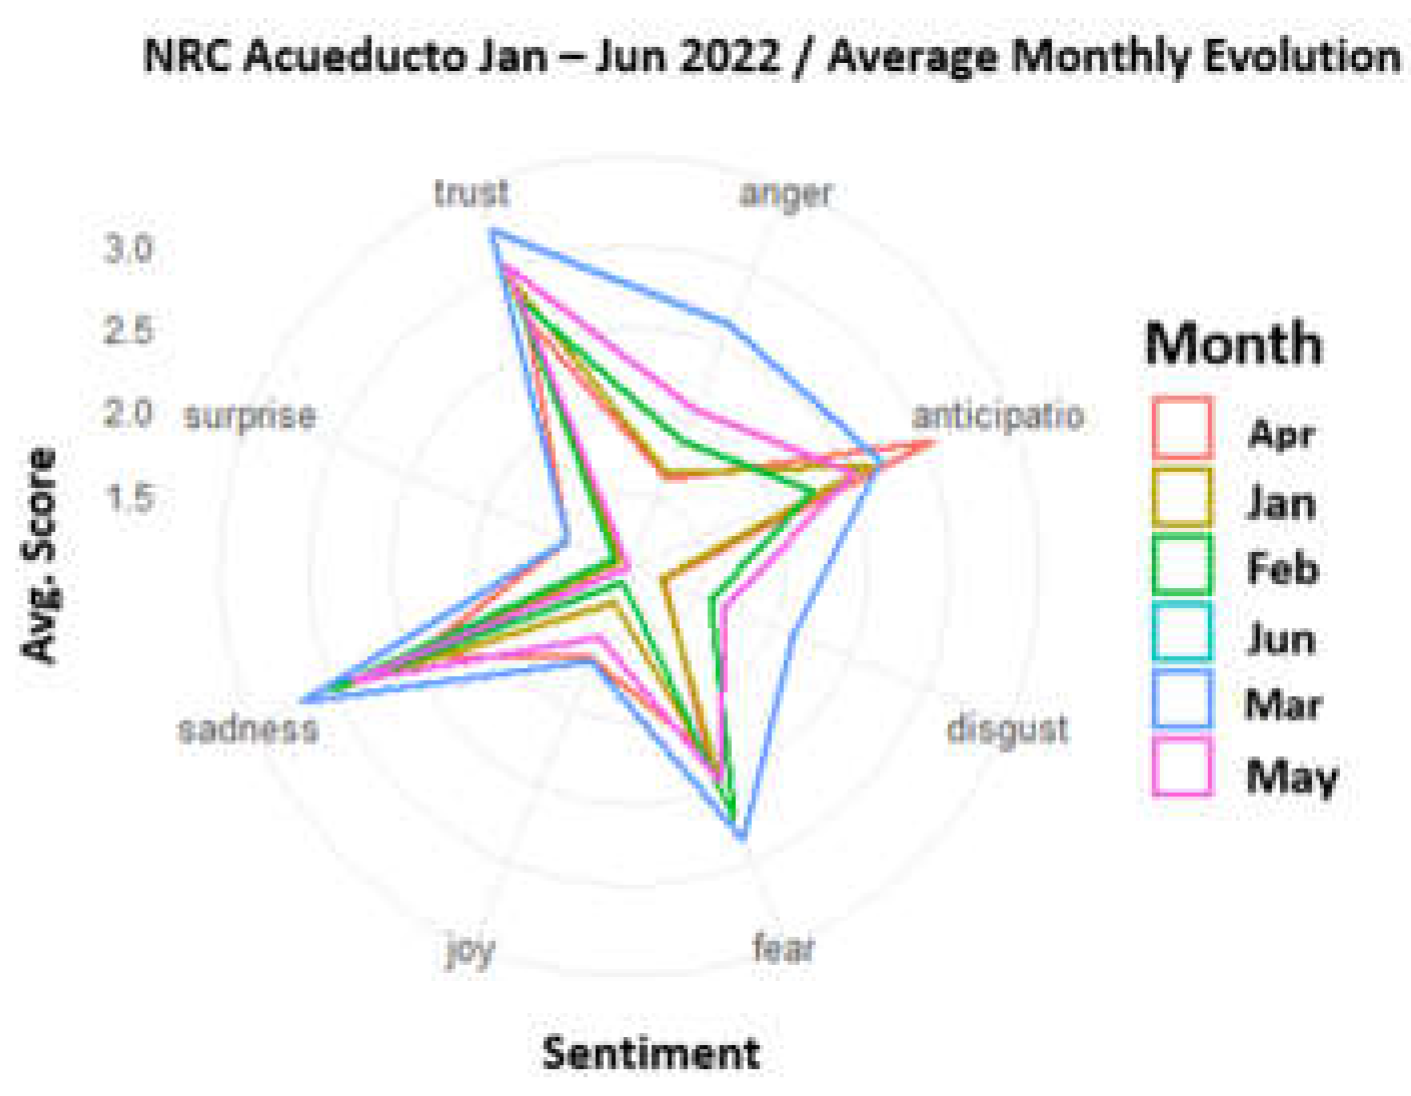
Figure 14.
Temporal analysis of sentiments through NRC to Enel.
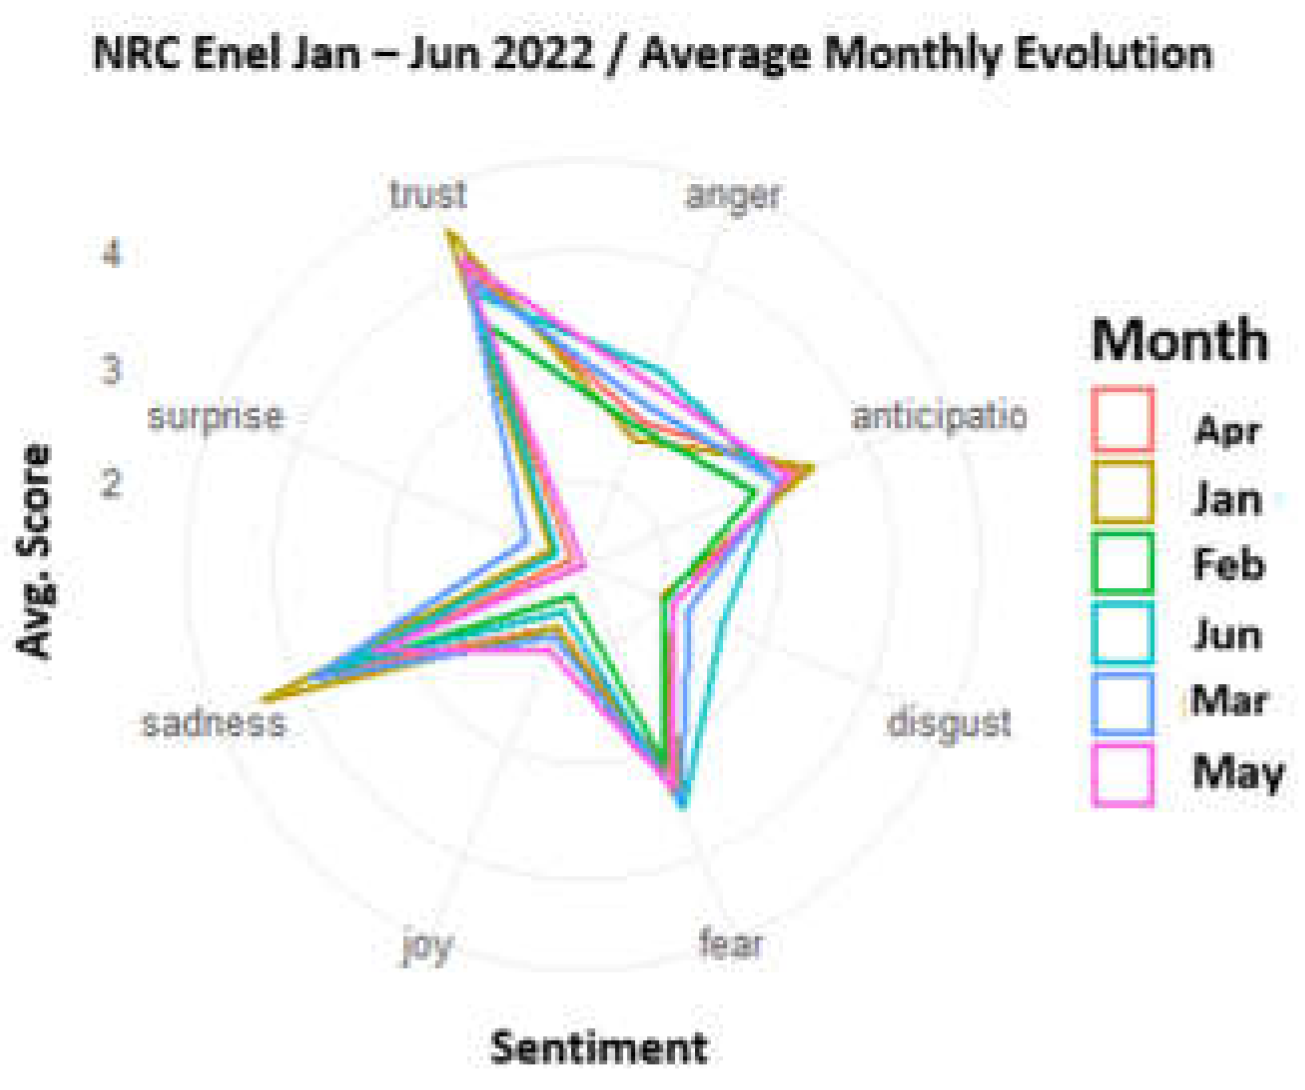
Figure 15.
Temporal analysis of sentiment through NRC to Vanti.
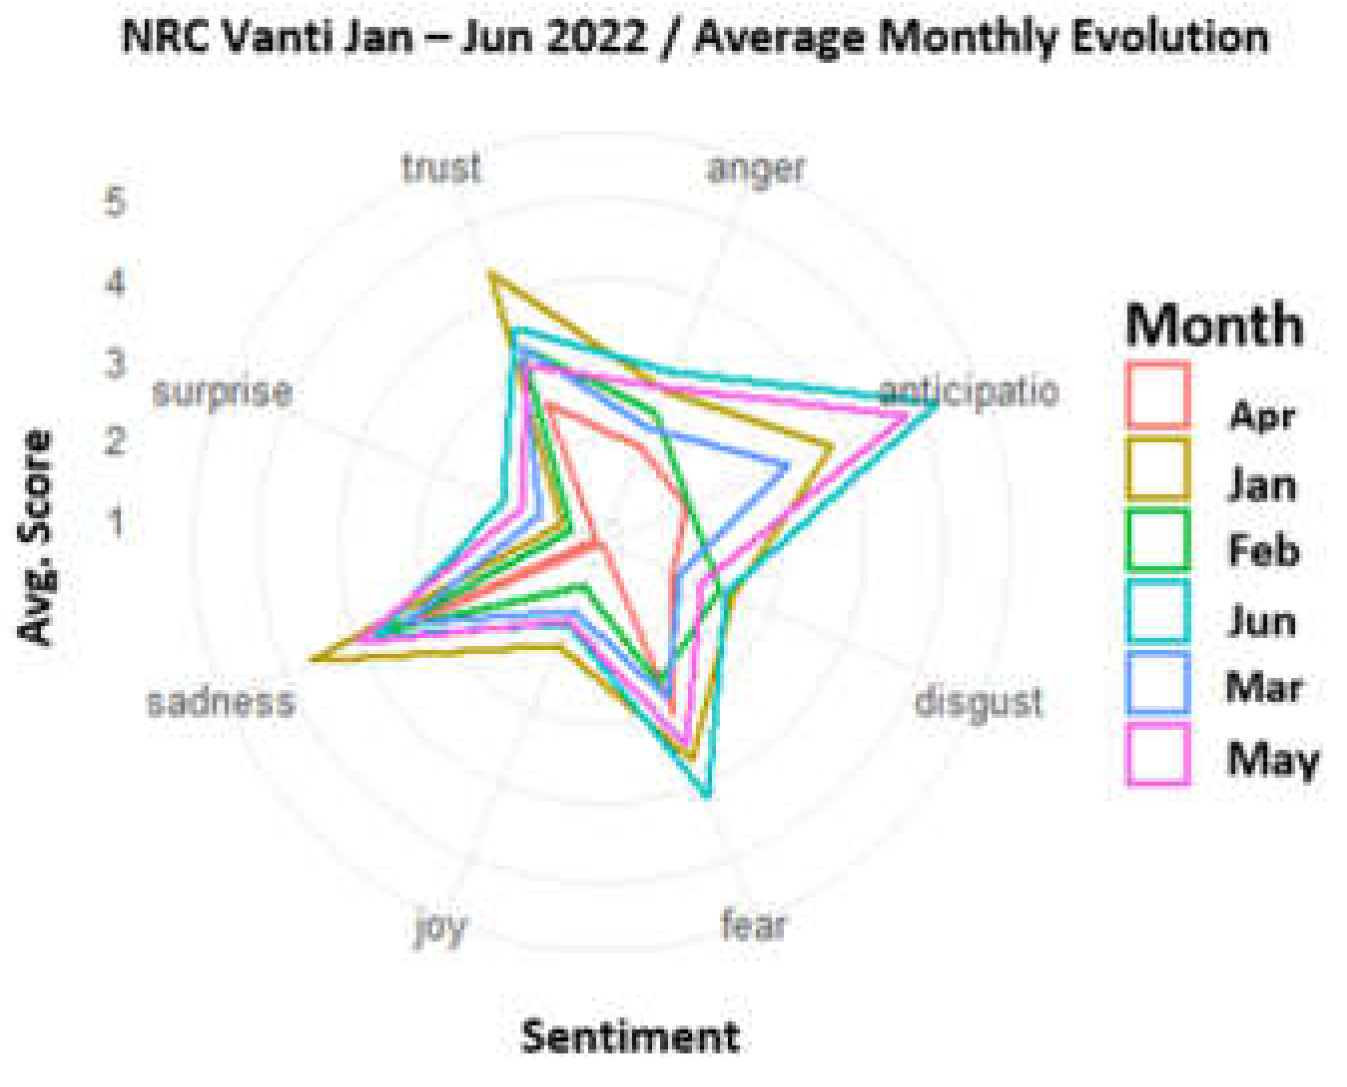
Figure 16.
Optimal number of topics for (a) Acueducto de Bogotá (b) Enel (c) Vanti.
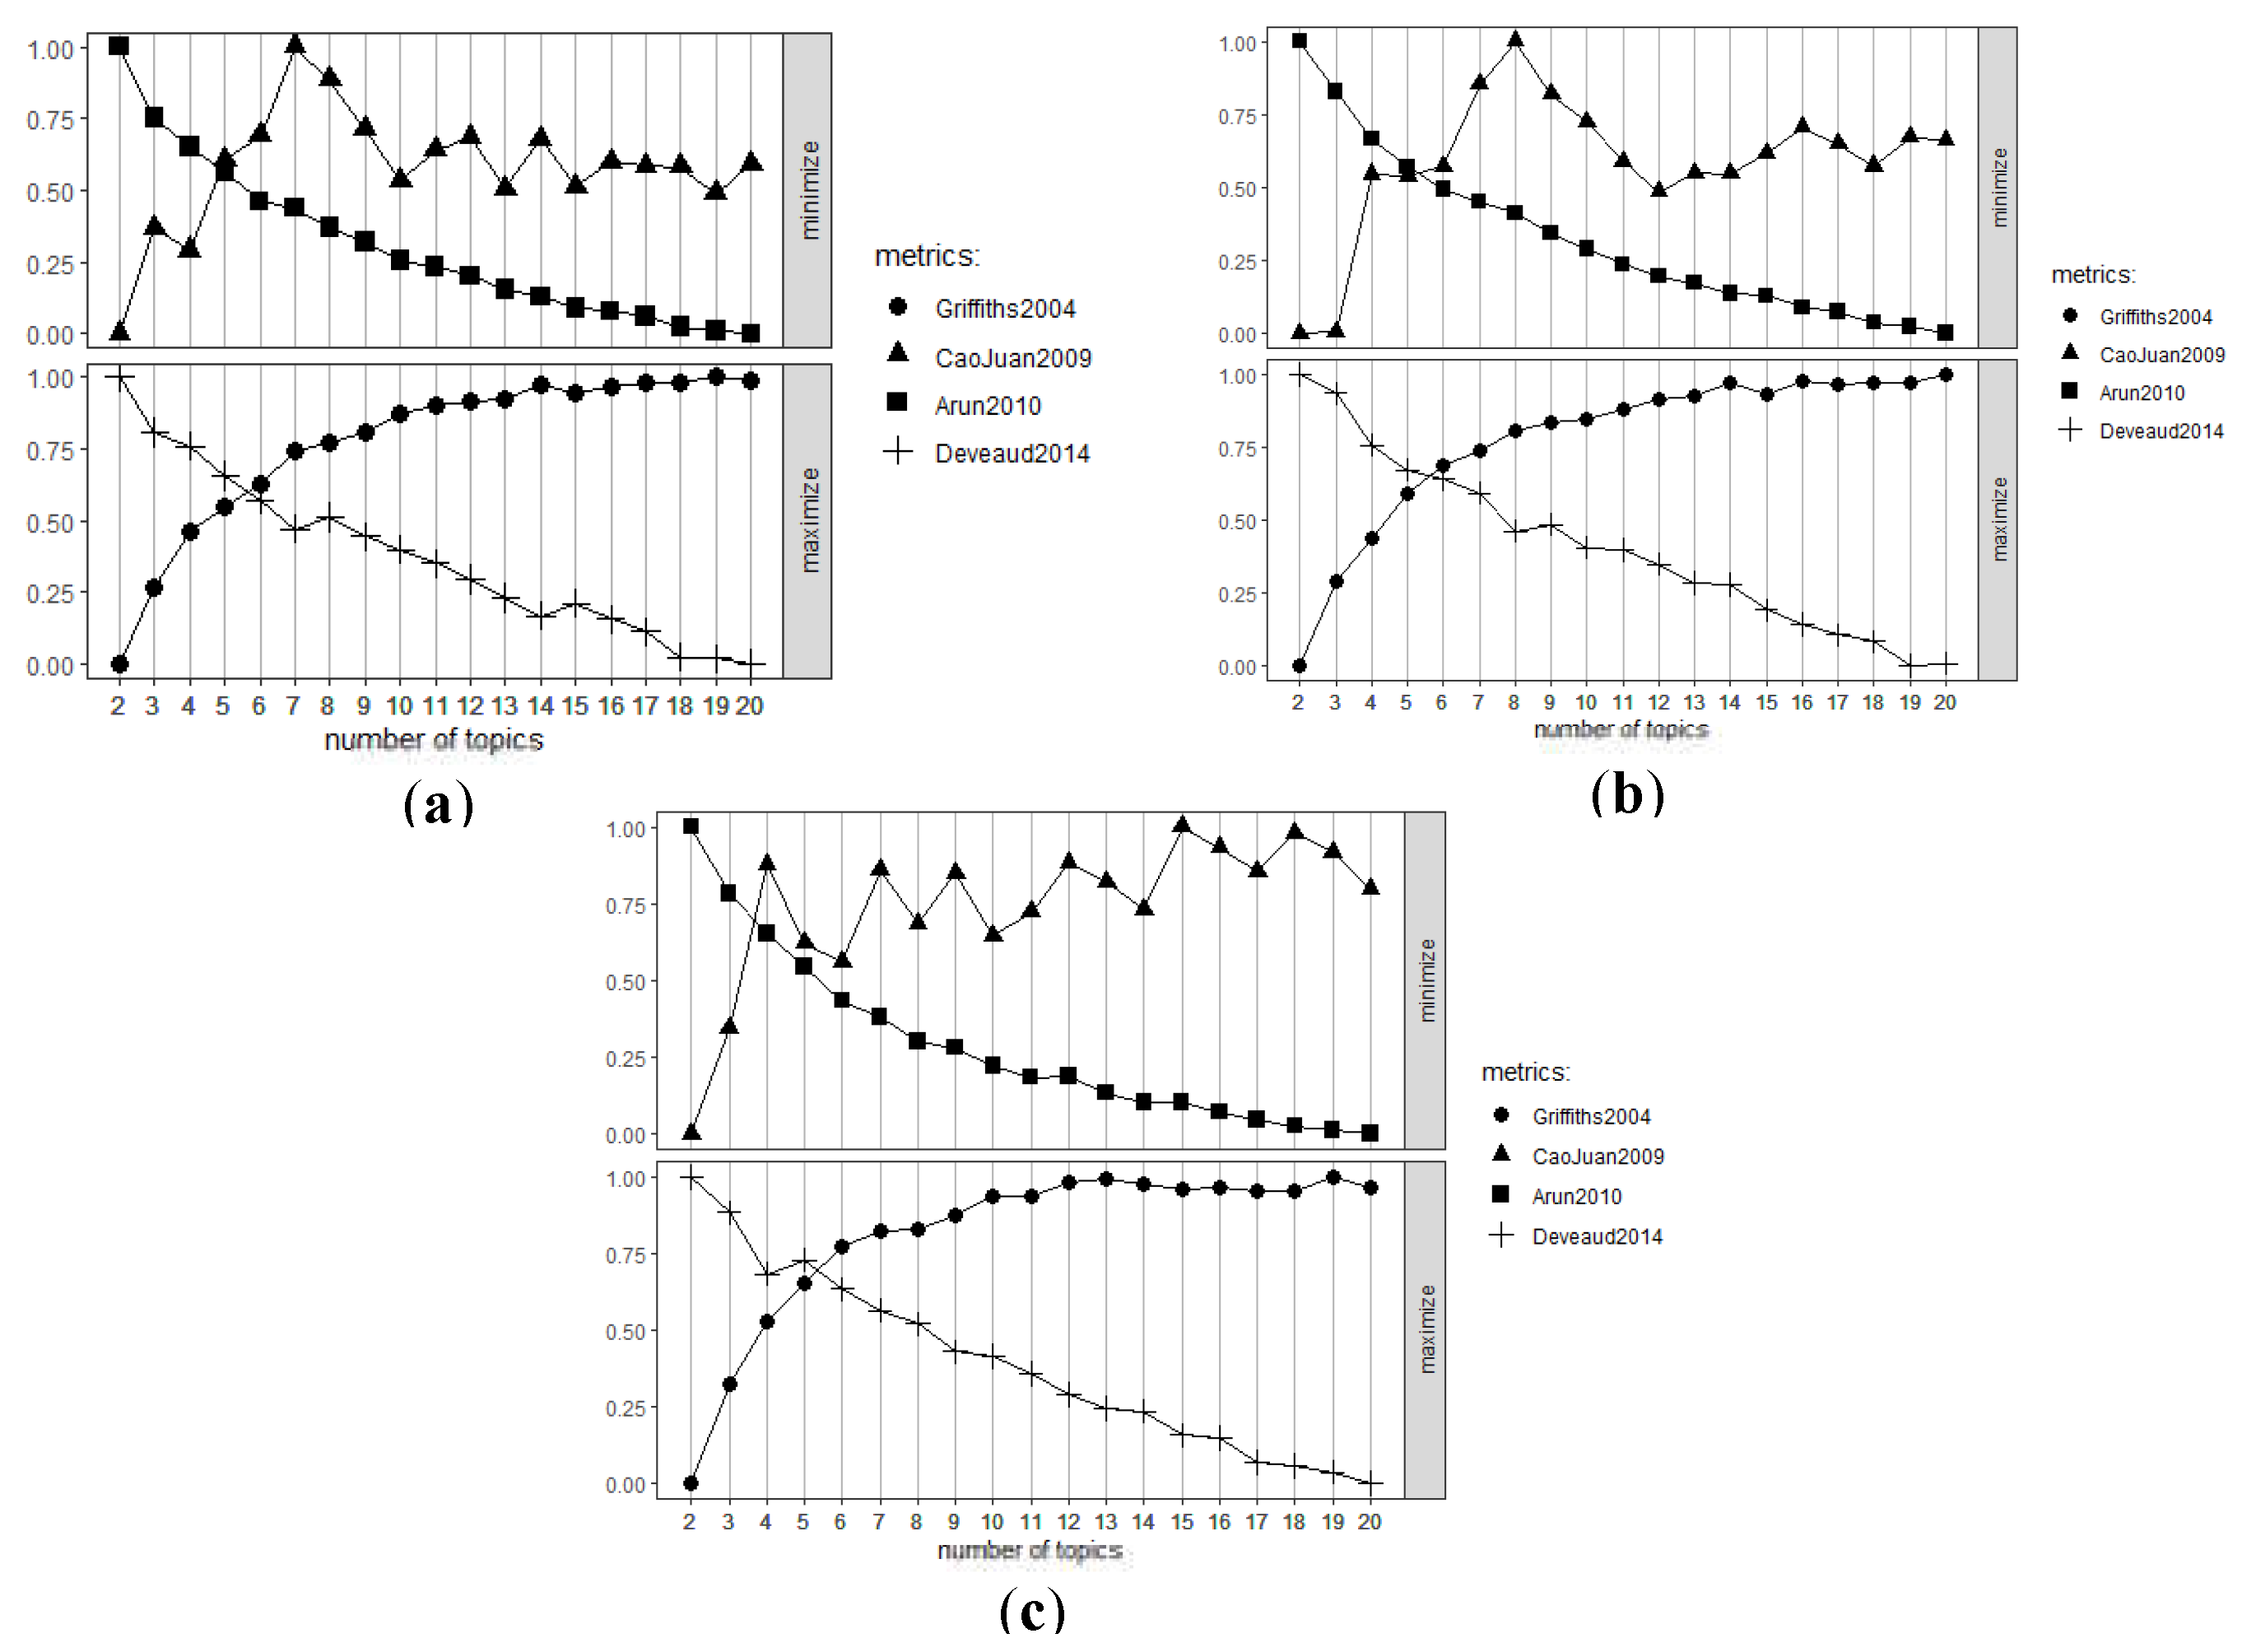
Figure 17.
Distribution of topics (a) Acueducto, (b) Enel y (c) Vanti.
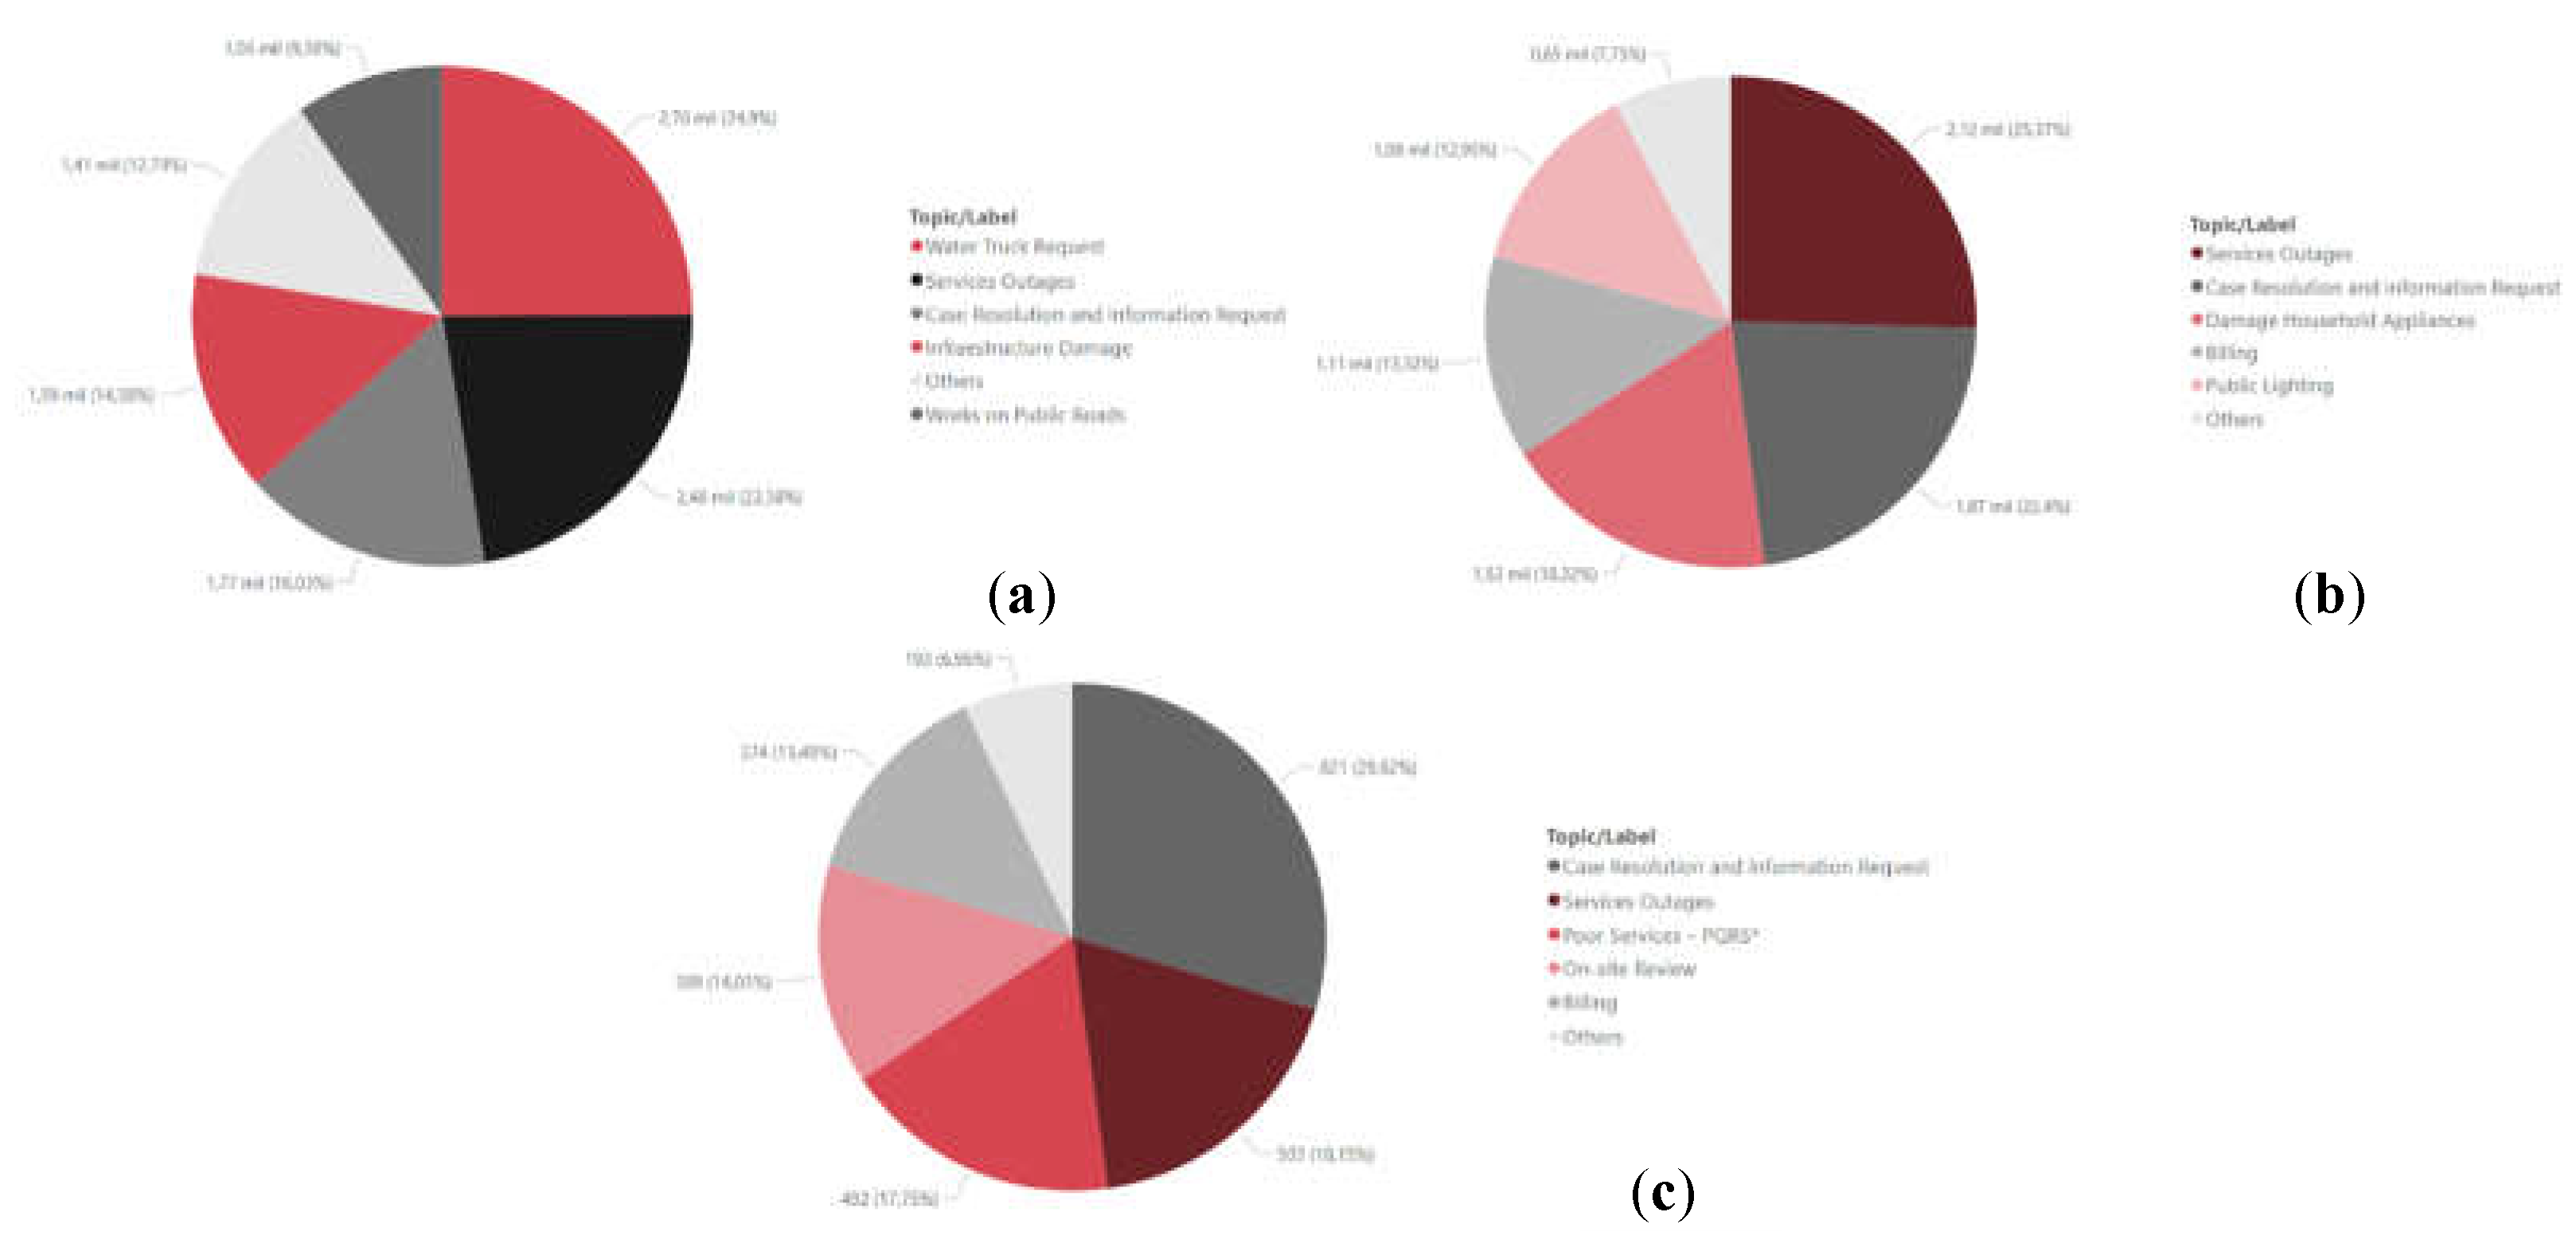
Figure 18.
Heatmaps group by day of week and topic (a) Acueducto, (b) Enel and (c) Vanti.
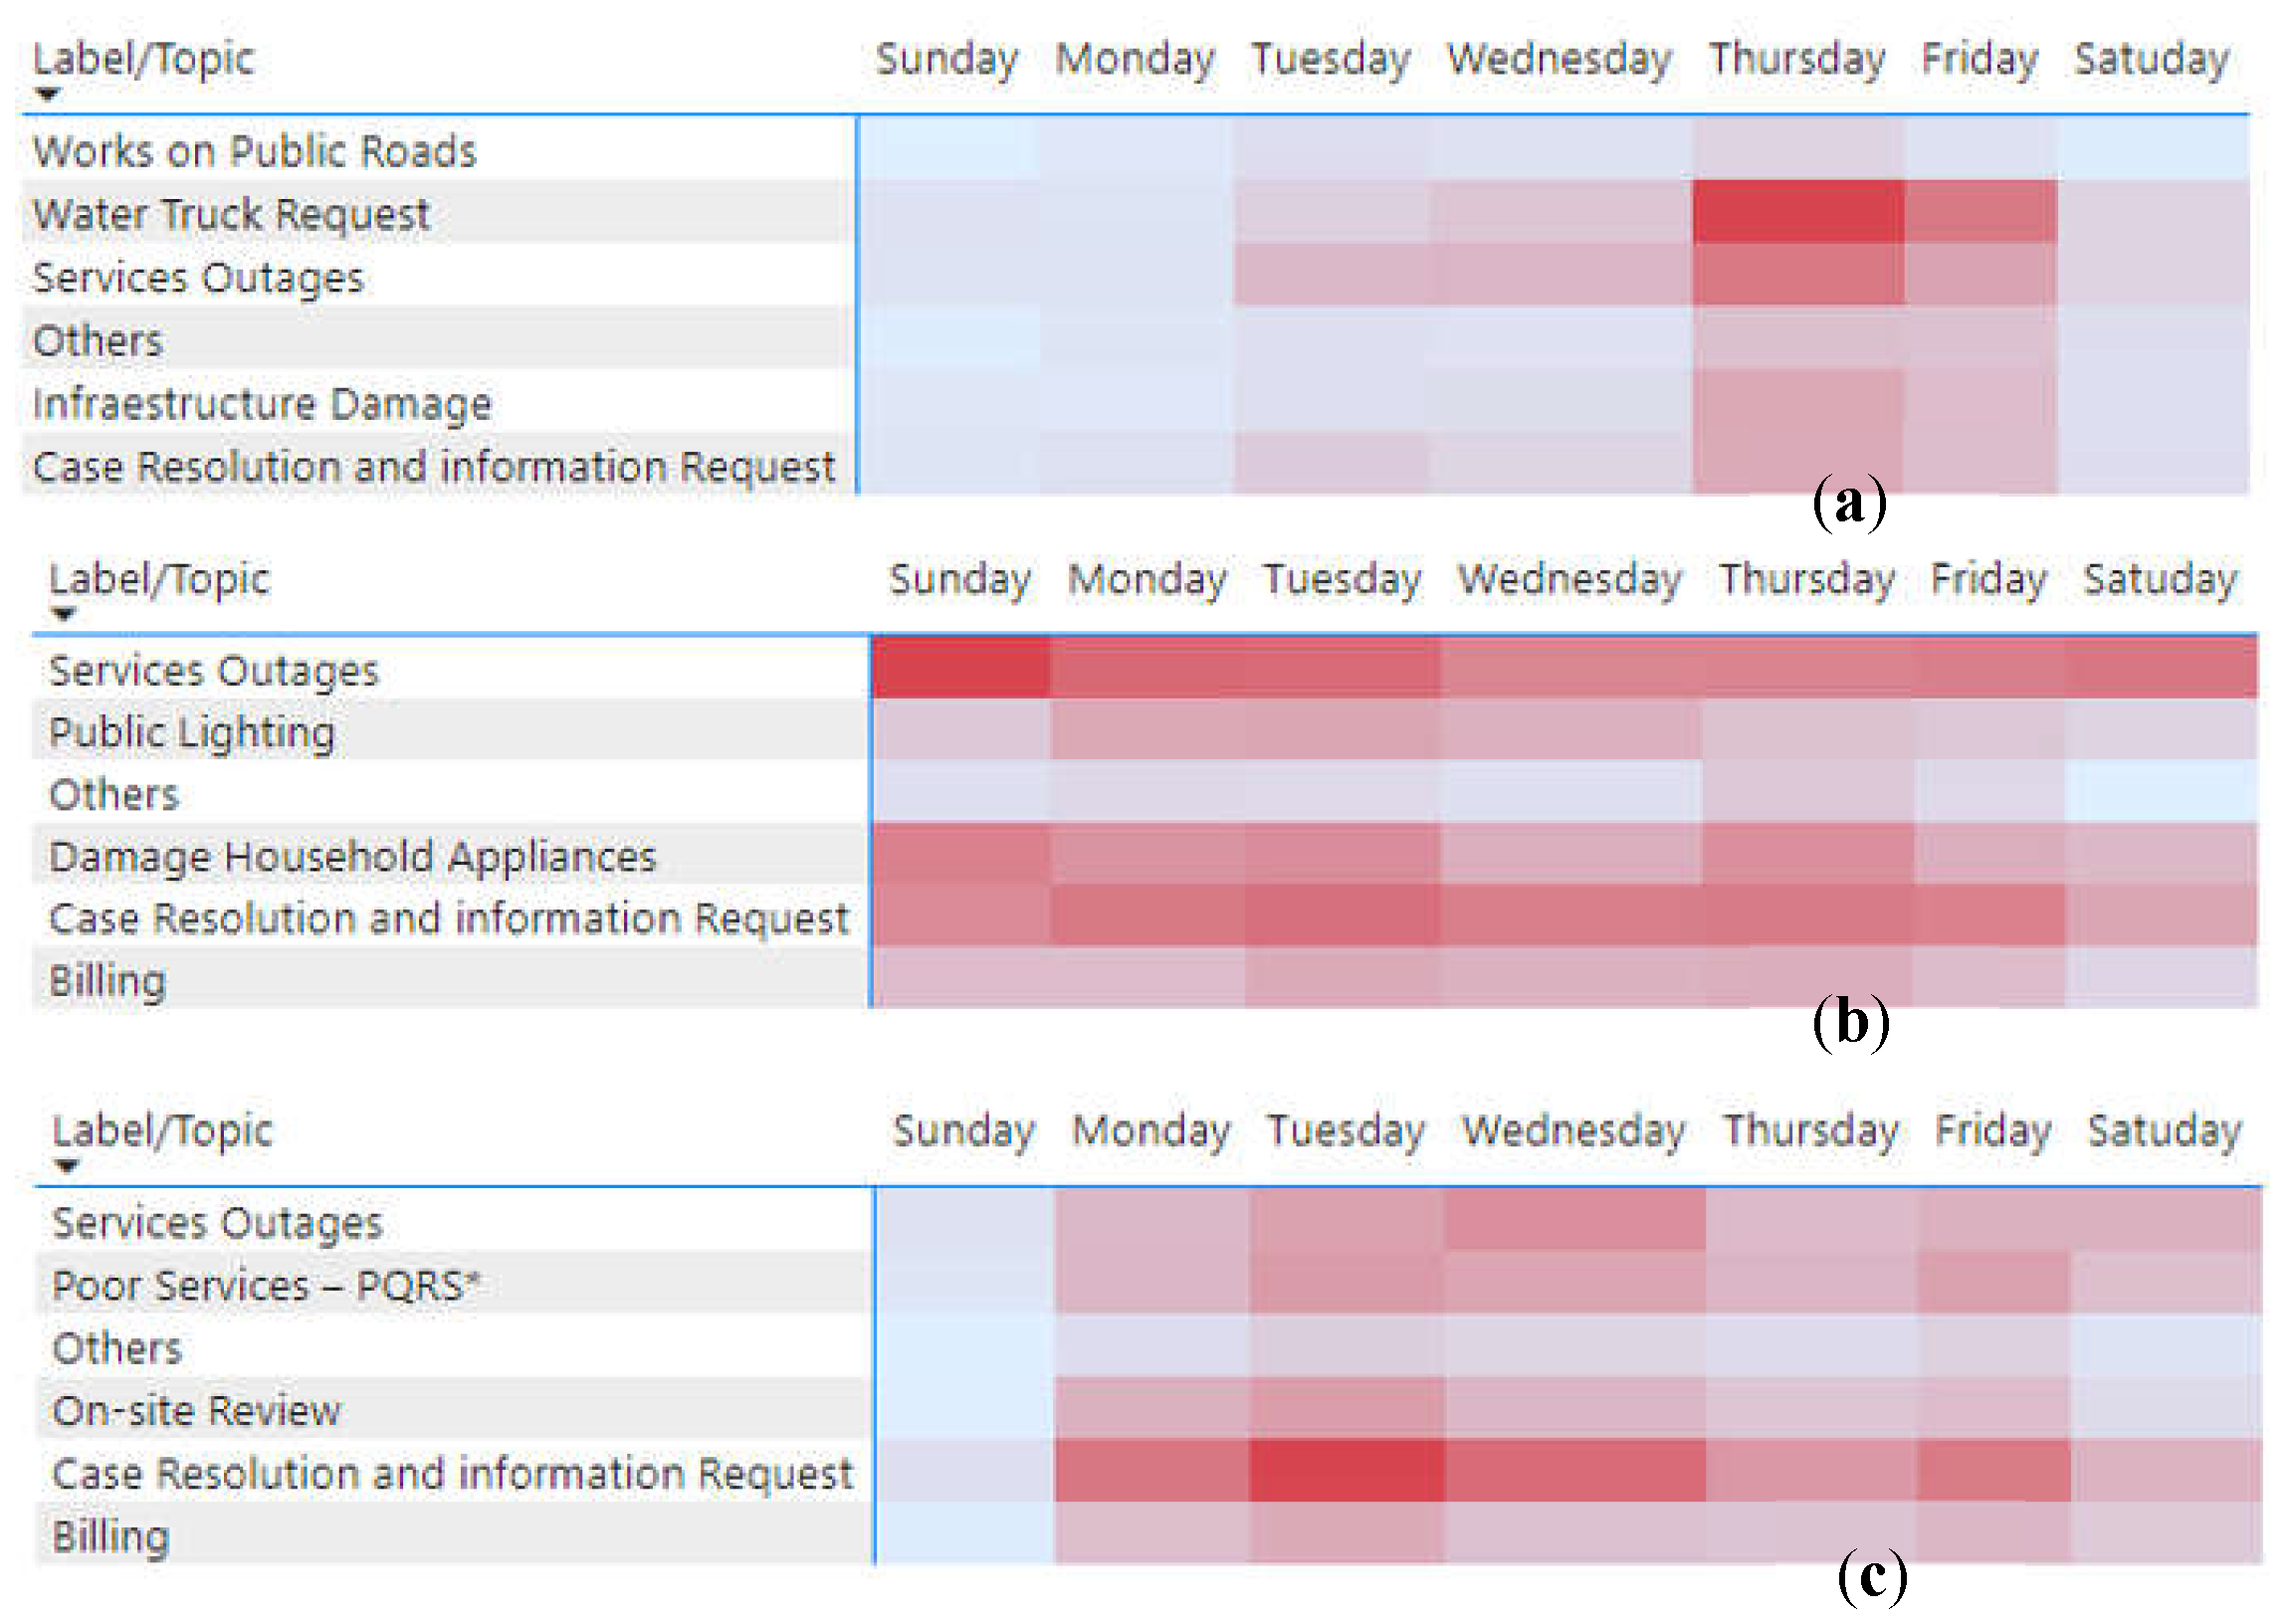
Figure 19.
Monthly evolution of topics for the Acueducto.

Figure 20.
Monthly evolution of topics for Enel.
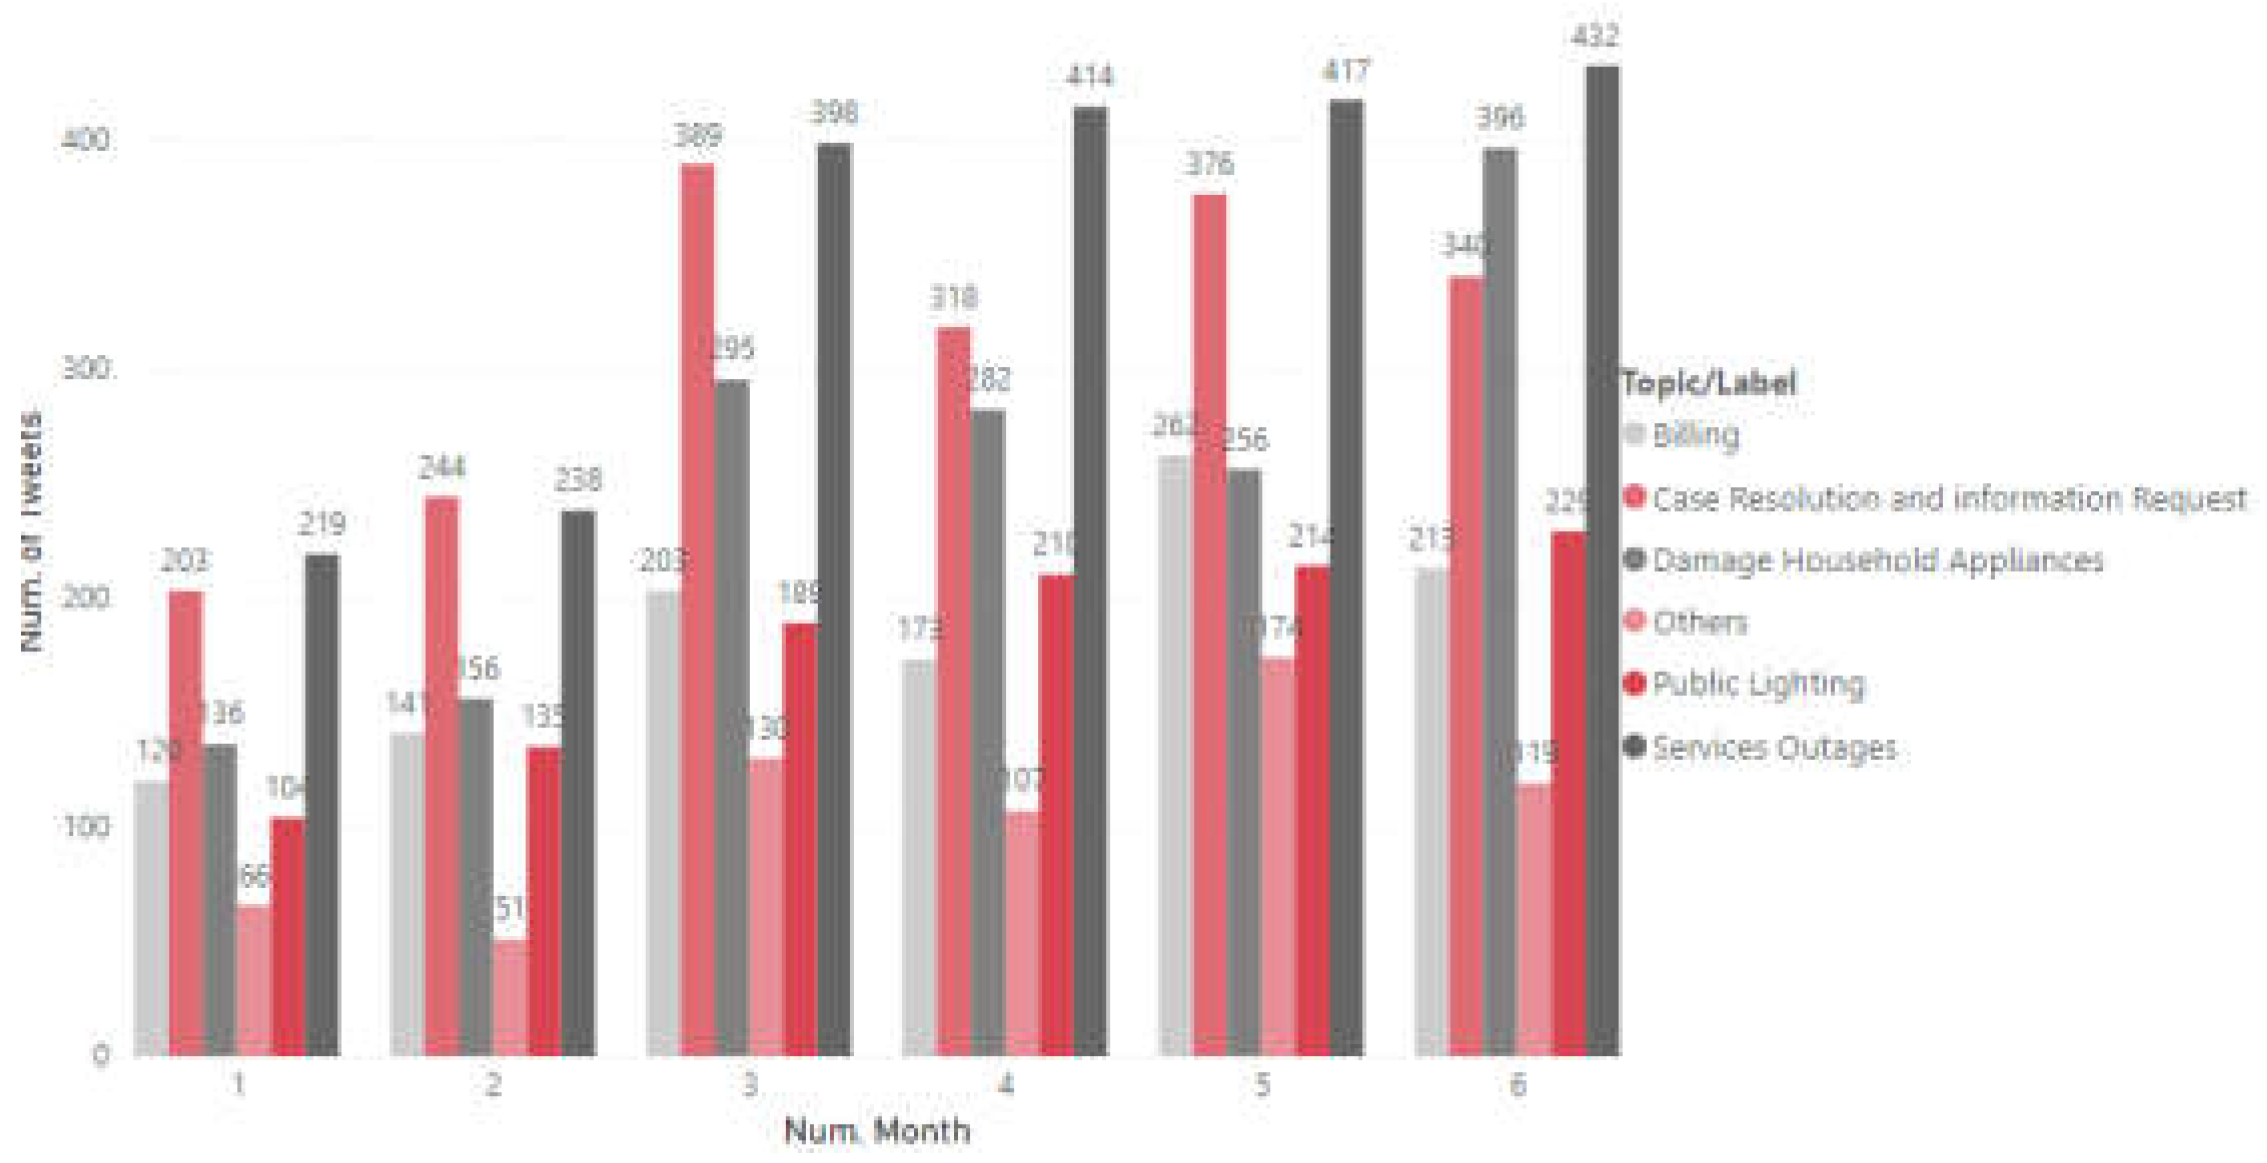
Figure 21.
Monthly evolution of topics for Vanti.
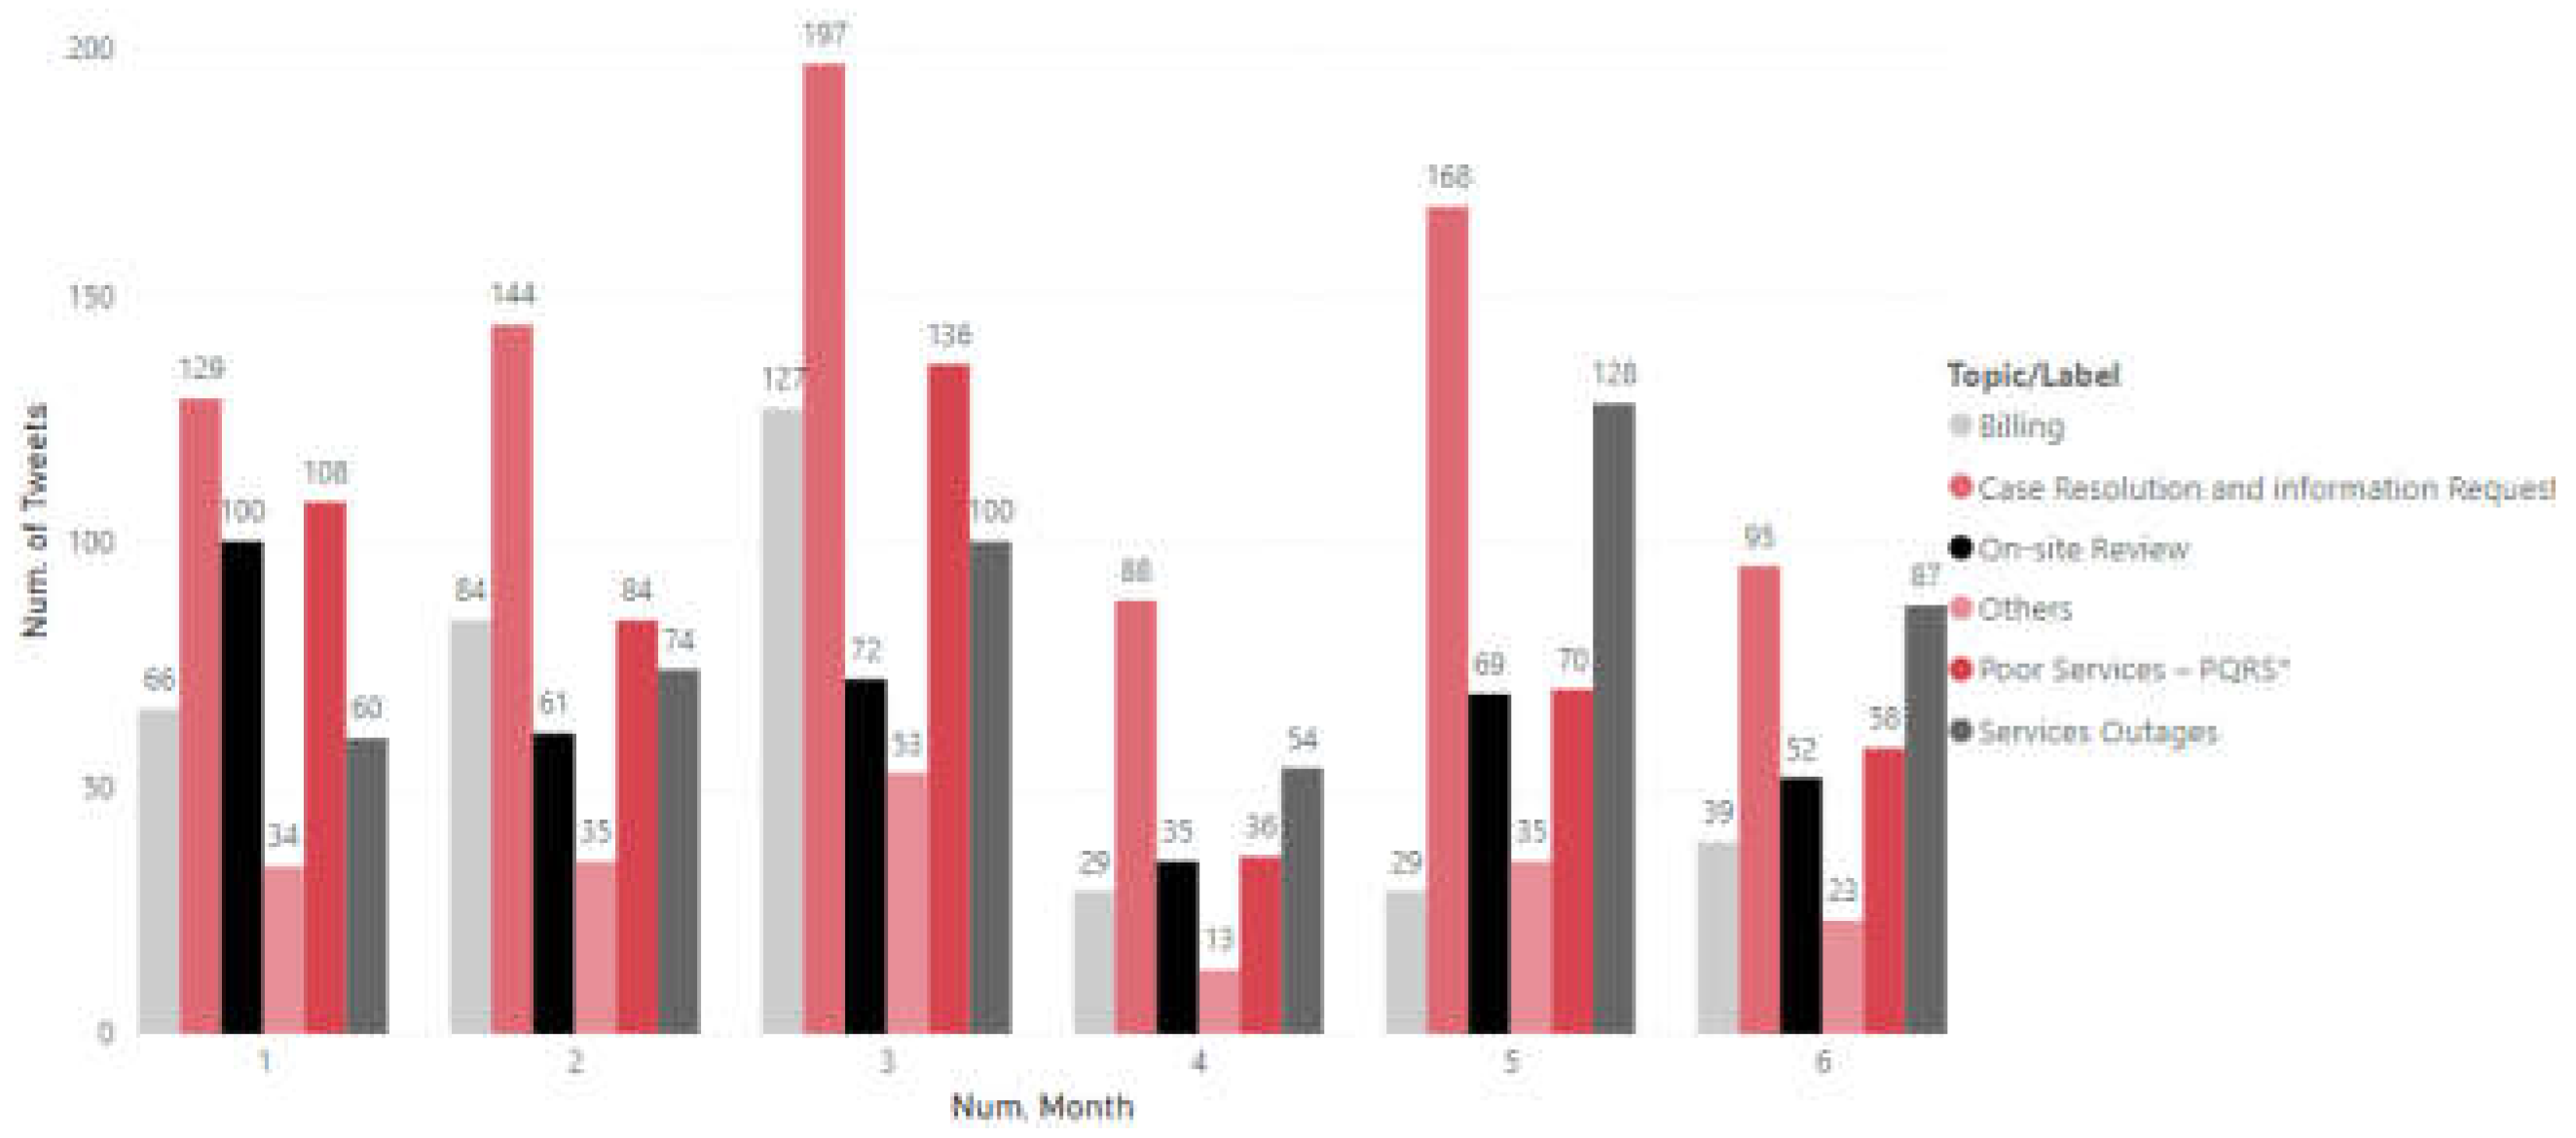
Table 1.
Results of evaluation of methods for sentiment analysis.
| Dictionary | Syuzhet Library | Merge (Assignment) | Result | ||
| No. Tweets affected | % | No. Tweets affected | % | ||
| Bing | 948 | 49.17 % | 1367 | 70.9 % | assignment |
| Affin | 728 | 37.75 % | 1226 | 63.59% | assignment |
| NRC | 845 | 43.82 % | 732 | 37.97 % | RStudio |
Table 2.
Name assignment by topic and company.
| Topic | Acueducto | Enel | Vanti |
|---|---|---|---|
| 1 | Water Truck Request | Services Outages | Billing |
| 2 | Services Outages | Case Resolution and information request | Services Outages |
| 3 | Infrastructure Damage | Billing | On-site Review |
| 4 | Works on Public Roads | Public Lighting | Poor Services – PQRS * |
| 5 | Case Resolution and information Request | Damage Household Appliances | Case Resolution and information Request |
* P(Questions), Q(Complaint), R(Claims), S(Request).
Table 3.
Approval intervals CIER survey.
| CIER Category | Lower Limit | Upper Limit | Number of Categorized Tweets |
|---|---|---|---|
| Very bad | -0,3022 | 171 | |
| Bad | -0,3022 | -0,1044 | 1025 |
| Regulars | -0,1044 | 0,0934 | 5158 |
| Good | 0,0934 | 0,2912 | 1842 |
Table 4.
CIER attributes and topics.
| CIER Item | Topic |
|---|---|
| Power supply | Service Outages |
| Customer service | Case Resolution and information Request |
| Energy bill | Billing |
| Street lighting | Public Lighting |
| Customer service | Damage Household Appliances |
Table 5.
Classification of approved attributes.
| CIER Category | Customer Service | Energy Bill | Power Supply | Street Lighting |
|---|---|---|---|---|
| Positives | 23,83% | 27,77% | 19,88% | 22,76% |
| Negatives | 13,21% | 13,84% | 14,81% | 11,10% |
| IDAR | 10,62% | 13,93% | 5,07% | 11,66% |
Disclaimer/Publisher’s Note: The statements, opinions and data contained in all publications are solely those of the individual author(s) and contributor(s) and not of MDPI and/or the editor(s). MDPI and/or the editor(s) disclaim responsibility for any injury to people or property resulting from any ideas, methods, instructions or products referred to in the content. |
© 2023 by the authors. Licensee MDPI, Basel, Switzerland. This article is an open access article distributed under the terms and conditions of the Creative Commons Attribution (CC BY) license (http://creativecommons.org/licenses/by/4.0/).
Copyright: This open access article is published under a Creative Commons CC BY 4.0 license, which permit the free download, distribution, and reuse, provided that the author and preprint are cited in any reuse.


