Submitted:
09 October 2025
Posted:
10 October 2025
You are already at the latest version
Abstract
Social media platforms, particularly Twitter, have become vital channels where airline companies encounter vast volumes of customer feedback daily. This abundance of user- generated content presents significant opportunities for sentiment analysis applications. Previous studies have demonstrated the potential of machine learning and natural language processing approaches to identify meaningful patterns within customer opinions, although several obstacles persist, including the detection of sarcastic content, handling uneven data distributions, and interpreting ambiguous expressions. This research aimed to determine the feasibility of using Twitter conversations about airlines to accurately classify customer sentiment through computational methods. Our analysis utilized a corpus of 14,640 manually annotated tweets targeting six major U.S. airline carriers, with each message categorized into positive, negative, or neutral sentiment classes. Following text preprocessing procedures and feature extraction using Term Frequency- Inverse Document Frequency (TF-IDF) vectorization, we developed and assessed three distinct classification algorithms: Logistic Regression, Random Forest, and XGBoost models. Our experimental results revealed that XGBoost achieved superior classification accuracy compared to the other approaches, although certain misclassification patterns emerged, particularly in distinguishing between neutral and positive sentiment expressions. This study uses the methods like machine learning for knowing the sentiment level of customer which is provided in airline-based tweets. Twitter US Airline Sentiment Dataset is used which has 14,640 rows. The dataset has totally six U.S. carriers. The data will be preprocessed then cleaned, tokenization, elimination of stopword, lemmatization and feature engineering using TF-IDF vectorization are performed. Labels for airline and complaint reasons are the categorical features will be converted into certain formats for performing the computational modeling. The study joins the preprocessing of the data, feature engineering and learning has enhanced the classification of the automated sentiment. The findings allow to track the feedback collected from customer feedback, enhance the quality of the service and allows to make decision in the airline industry. The sentiment is classified into negative or neutral or positive and they are predicted using machine learning algorithms. Some of the machine learning algorithms are Logistic Regression, Random Forest, and XGBoost. 70:30 split is used in the dataset for partitioning into training and testing subsets. It helps to manage the proportions for the class. Model performance is used for finding many measures like recall, accuracy, precision, F1-score, confusion matrices and ROC curves. The output showed that XGBoost have performed well compared to other models and gradient boosting is used for managing the patterns which are based on text. It provides the importance of preprocessing of the data. Topic modeling of negative tweets showed the main reason for dissatisfaction like delays and problems in customer service and shares the insights for managing the airline. The tweets which are misclassified has many issues related to sarcasm, mixed sentiment expressions and usage of informal language.
Keywords:
sentiment analysis
; social media analytics
; twitter data
; airline industry
; customer feedback
; machine learning
; natural language processing (NLP)
; text classification
; TF-IDF vectorization
; logistic regression
; random forest
; XGBoost
; data preprocessing
; topic modeling
; brand reputation management
Overview of Airline Sentiment Analysis on Social Media
The feedback which is collected from the customer is very important in the industries like airline for enhancing the service or efficiency or reputation level. The social media platforms collect the feedback of the customers which can be used for providing the insights
about certain industry. The platforms like twitter is used to quickly spready the customer’s opinion is any fields. The sentiment level of the customers can be tracked using tweets to know the problems and to provide the techniques to increase the delivery of the service and the satisfaction level of the customers.
The contents in the social media are analyzed and it provided many important challenges. Tweets are mostly brief, not formal and they are complex too. The tweets contain the slang, abbreviations, emojis or remarks. These characteristics causes more cost to labor if it is analyzed in a traditional and it can also lead to many errors. The machine learning and natural language processing (NLP) are some of the computational techniques which allows to collect the insights from the data which has no proper structure.
The machine learning and natural language processing (NLP) are some of the computational techniques which are used for collecting the insights using the data which has no proper structure. These methods use the dataset and allows the companies for categorizing the sentiments or for finding the patters or to provide the recommendations.
Twitter US Airline Sentiment Dataset is used in this study which has 14,640 tweets.
The six major U.S. carriers like United Airlines, Delta Airlines, American Airlines, Southwest Airlines, US Airways and Virgin America are used. The dataset has content for tweet, labels for sentiment, score for the sentiment. The data is prepared for predictive modeling by cleaning initially, tokenizing, removing the stopword, lemmatizing and extracting the features using TF-IDF vectorization.
Many disturbances faced by U.S. airline industry are delay in flight or cancellation of the flight or complaints which are raised during the service makes the analysis of the sentiment to be more valuable. The tweets are classified as neutral or negative or positive.
The social media has more insights which allows to know the techniques in the marketing and enhances the decision-making process.
The main aim of this research is to classify the airline-related tweets using the machine learning techniques. XGBoost, random forest and linear regression are some of the models which are used for comparing the linear and gradient-boosting techniques. The study also checks the patterns which causes negative sentiment. More useful insights are collected from the output. These insights can be used to enhance the experience level of the customers and also allows to make the decision.
Literature Review
Twitter is one of the social mediums which is used for analyzing the sentiment. It is an important technique which is used to know the customer’s trust level or the customer’s opinion level. Many studies are used to derive the insights which are collected from the data which are has proper structure.
Chamlertwat et al. (2012) found the insights of the customers from twitter by using the data mining methods. This research used the natural language processing (NLP) and data mining to know the customer’s opinion based on different products and services. The study used Twitter to collect the feedback from the customer and the main challenge is to analyze the language which is not format.
Philander and Zhong (2016) analyzed the tweets for managing the guest satisfaction level and the guest sentiment level. Text mining and sentiment score methods are used to know the correlation between the reputation of the brand and the sentiment level of the customers. The output is used for analyzing the sentiment and for tracking the quality of the service to enhance the trust level of the customers.
Krishnan et al. (2017) also used the same technology and found the sentiment level in tweets which is related to mobile phone brand. The supervised machine learning techniques like the Naïve Bayes is used. The researchers showed how the trend in the sentiment have affected the choice of the consumer and the popularity of the product. The sentiment is analyzed which is the most useful tool but it cannot manage the expressions.
Zain, Ramli, and Adnan (2022) used a case study on the telecommunication company which is situated in Malaysia. Social media is used for analyzing the sentiment level of the customers. NLP and text classification methods are used for finding the feedback from the customers. The sentiment is analyzed for managing the relationship with the customers and to make the decision properly.
Ranjan and Sood (2020) used this application in the Indian telecommunication sector.
It helps to analyse the sentiment and to enhance the satisfaction level of the customers. Machine learning is used for managing the tweets and to provides insight for enhancing the performance. Companies uses the sentiment analytics for knowing the reasons for dissatisfaction level of the customers.
The sentiment levels are analyzed which is very important for managing the relationship with the customer and to make correct decision.
Testable Hypotheses
The machine learning algorithms are used to classify the tweets based on the category of the sentiment. The testable hypotheses are provided below:
H1: Algorithms like machine learning are used to classify the tweets based on airline in an accurate manner. The tweets are classified like neutral for negative or positive sentiments.
Null Hypothesis (H01): For knowing the sentiment of the tweets, the machine learning
models does not perform well more than random classification.
H2: The XGBoost classifier has more accuracy and F1-score compared to Logistic Regression and Random Forest models to classify the sentiment of the tweets.
Null Hypothesis (H02): There is no difference in classifying the performance among
XGBoost, Logistic Regression and Random Forest models.
H3: Features are found using Term Frequency–Inverse Document Frequency (TF-IDF) vectorization for enhancing the sentiment level.
Null Hypothesis (H03): TF-IDF can improve the accuracy using the tokenized text features.
H4: There is no proper balance in the sentiment classes and it can affect the performance level and decreases the accuracy level.
Null Hypothesis (H04): No proper balance in the class has no effect on the sentiment level of
the performance of the model.
Research Questions
This study is used to know how the machine learning methods are used effectively for classifying the sentiment level of the customers. It used tweets which are based on airline data. Insights are collected from many studies for analysing the sentiment. The analysis is performed in hospitality, consumer product fields and telecommunication. The research is used to find the performance by classifying the sentiment using the main variations in the sentiment. It can be used to find the patterns to know the accuracy level. The research questions are provided below:
Research Questions 1: How machine learning algorithms can be used to classify the sentiment level of the customer in airline-related tweets?
Research Questions 2: Among the machine learning techniques like Model—Logistic Regression, Random Forest, or XGBoost, which has the highest accuracy level?
Research Questions 3: About airlines, what are the predominant linguistic and contextual features which affects the sentiment level in customer tweets?
Research Questions 4: How does the imbalance in sentiment distribution can damage the performance level of the model?
Hypotheses
The findings are collected from the above research questions and the literature review. The hypothesis is formatted like below:
H1: Tweets has content related to airline which uses the supervised machine learning models to classify the sentiments level.
H2: The XGBoost model can perform the Logistic Regression and Random Forest for classifying the accuracy level, precision, recall and F1-score.
H3: Linguistic features derived through TF-IDF vectorization significantly contribute to improving sentiment prediction accuracy.
H4: The imbalance in the dataset provides more misclassification.
Methods
The quantitative research technique is used to test the hypothesis. Secondary data is collected from Twitter which has 14,640 tweets especially in six U.S. airlines. The tweets are classified as neutral or negative or positive.
The methodological process has below main phases:
Data Preprocessing: Tweets were preprocessed initially by cleaning, tokenized, lemmatized and converted into numeric valued. TF-IDF vectorization is used for this process. Stopwords, special characters and URLs are removed to enhance the quality of the data.
Feature Engineering: Both textual and categorical features were used like sentiment- based metadata like the name of airline and reason for the sentiment.
Evaluation Metrics: The performance of the model are evaluated using accuracy, precision, recall and F1-score.
Model Development: Three supervised machine learning algorithm like the Logistic Regression, Random Forest and XGBoost are trained using the 70:30 train-test split. It uses stratified sampling for managing the classes.
Data Description
Data Source and Composition
This analytical study utilized the Twitter US Airline Sentiment Dataset obtained from Kaggle’s platform. The dataset has 14,640 customer tweets. The dataset supports categorical classifications and numerical measurements.
Variable Structure
The dataset has many different variables which are related to sentiment analysis:
airline – It is the airline which is denoted in the tweet. It is categorical variable. Categorical designation of the referenced airline company
tweet_id – It is a numerical value which is used to uniquely identify a tweet. Distinct numerical identifier assigned to each message
airline_sentiment_confidence – It is a numerical value which stores the score value. It denotes the confidence level of the sentiment. Numerical score reflecting labeling certainty
tweet_created – It denotes the time zone of when the tweet was created.
airline_sentiment – It is the primary target variable which allows to classify the sentiment like negative, neutral or positive. Primary outcome variable representing sentiment classification (negative, neutral, positive)
negativereason – It is a categorical variable. It stores the reasons for dissatisfaction level. It will be in negative tweets. Categorical field specifying dissatisfaction causes for negative tweets. Unprocessed tweet content
user_timezone – It denotes the time zone of when the user created the tweet. text – It denotes the content of the tweet.
tweet_created – Timestamp indicating publication date and time user_timezone – Geographic time zone information for the posting user
Dataset Overview
Analysis is performed on the dataset and it is found that there is no proper balance in distribution of the sentiment:
- Neutral sentiment has 3,099 tweets which is 21%.
- Negative sentiment has 9,178 tweets which is 63%.
- Positive sentiment has 2,363 tweets which is 16%.
Tweets which belongs to airline showed that US Airways has the most tweet with 4,352 tweets, 30% as value. The Virgin America the lowest with 443 tweets and 3% as the value. Late Flight the negative sentiment ate Flight with value as 2,136 mentions, Customer Service Issue with value as 1,466 mentions and Cancelled Flight with value as 847. These patterns have showed that customers use twitter to show their satisfaction level especially to show the negativity than positivity.
Dataset Characteristics
The complete dataset comprised 14,640 individual observations with the following distribution patterns:
Sentiment Classification Breakdown:
- -
- Negative sentiment: 9,178 instances (63%)
- -
- Neutral sentiment: 3,099 instances (21%)
- -
- Positive sentiment: 2,363 instances (16%)
Airline-Specific Tweet Volume:
- -
- US Airways: 4,352 tweets (30%)
- -
- United Airlines: 3,822 tweets (26%)
- -
- American Airlines: 2,759 tweets (19%)
- -
- Southwest Airlines: 2,420 tweets (17%)
- -
- Delta Airlines: 2,222 tweets (15%)
- -
- Virgin America: 443 tweets (3%)
Primary Complaint Categories: Late Flight, Customer Service Issue and Cancelled Flight are some of the major issues.
Data Preparation Technique
Preprocessing Pipeline: Prior to model development, we implemented a comprehensive data preparation strategy involving multiple sequential operations:
Stage 1: Content Sanitization: Eliminated web addresses, hashtag symbols (#), user mentions (@username), special characters, and numerical digits. Standardized text formatting through lowercase conversion. The repeated rows are eliminated.
Stage 2: Linguistic Processing: Segmented tweet content into individual word tokens. The stopwords which are common are removed. Lemmatization methods are used for normalizing the variations in word.
Stage 3: Feature Development: The Term Frequency-Inverse Document Frequency is used for transforming the text data into numeric data. Transformed categorical variables (airline designations, complaint reasons) into binary dummy variable formats
Stage 4: Dataset Partitioning: Allocated 70% of observations for model training purposes and remaining is sued for testing purpose. This systematic technique is used in the dataset by
preparing, cleaning, standardizing the data which can be used for exploratory analysis and machine learning purpose.
Visualization
Constructed Visualization
| Airline | Negative | Neutral | Positive | Total |
| United | 2,633 | 697 | 492 | 3,822 |
| US Airways | 3,819 | 381 | 152 | 4,352 |
| Delta | 955 | 723 | 544 | 2,222 |
| American | 1,960 | 463 | 336 | 2,759 |
| Virgin America | 181 | 116 | 146 | 443 |
| Southwest | 1,186 | 664 | 570 | 2,420 |
Python ash different advanced visualization techniques for improving the interpretability (Achanta & Boina, 2023). Network visualization is supported by Netwulf (Aslak & Maier, 2019).
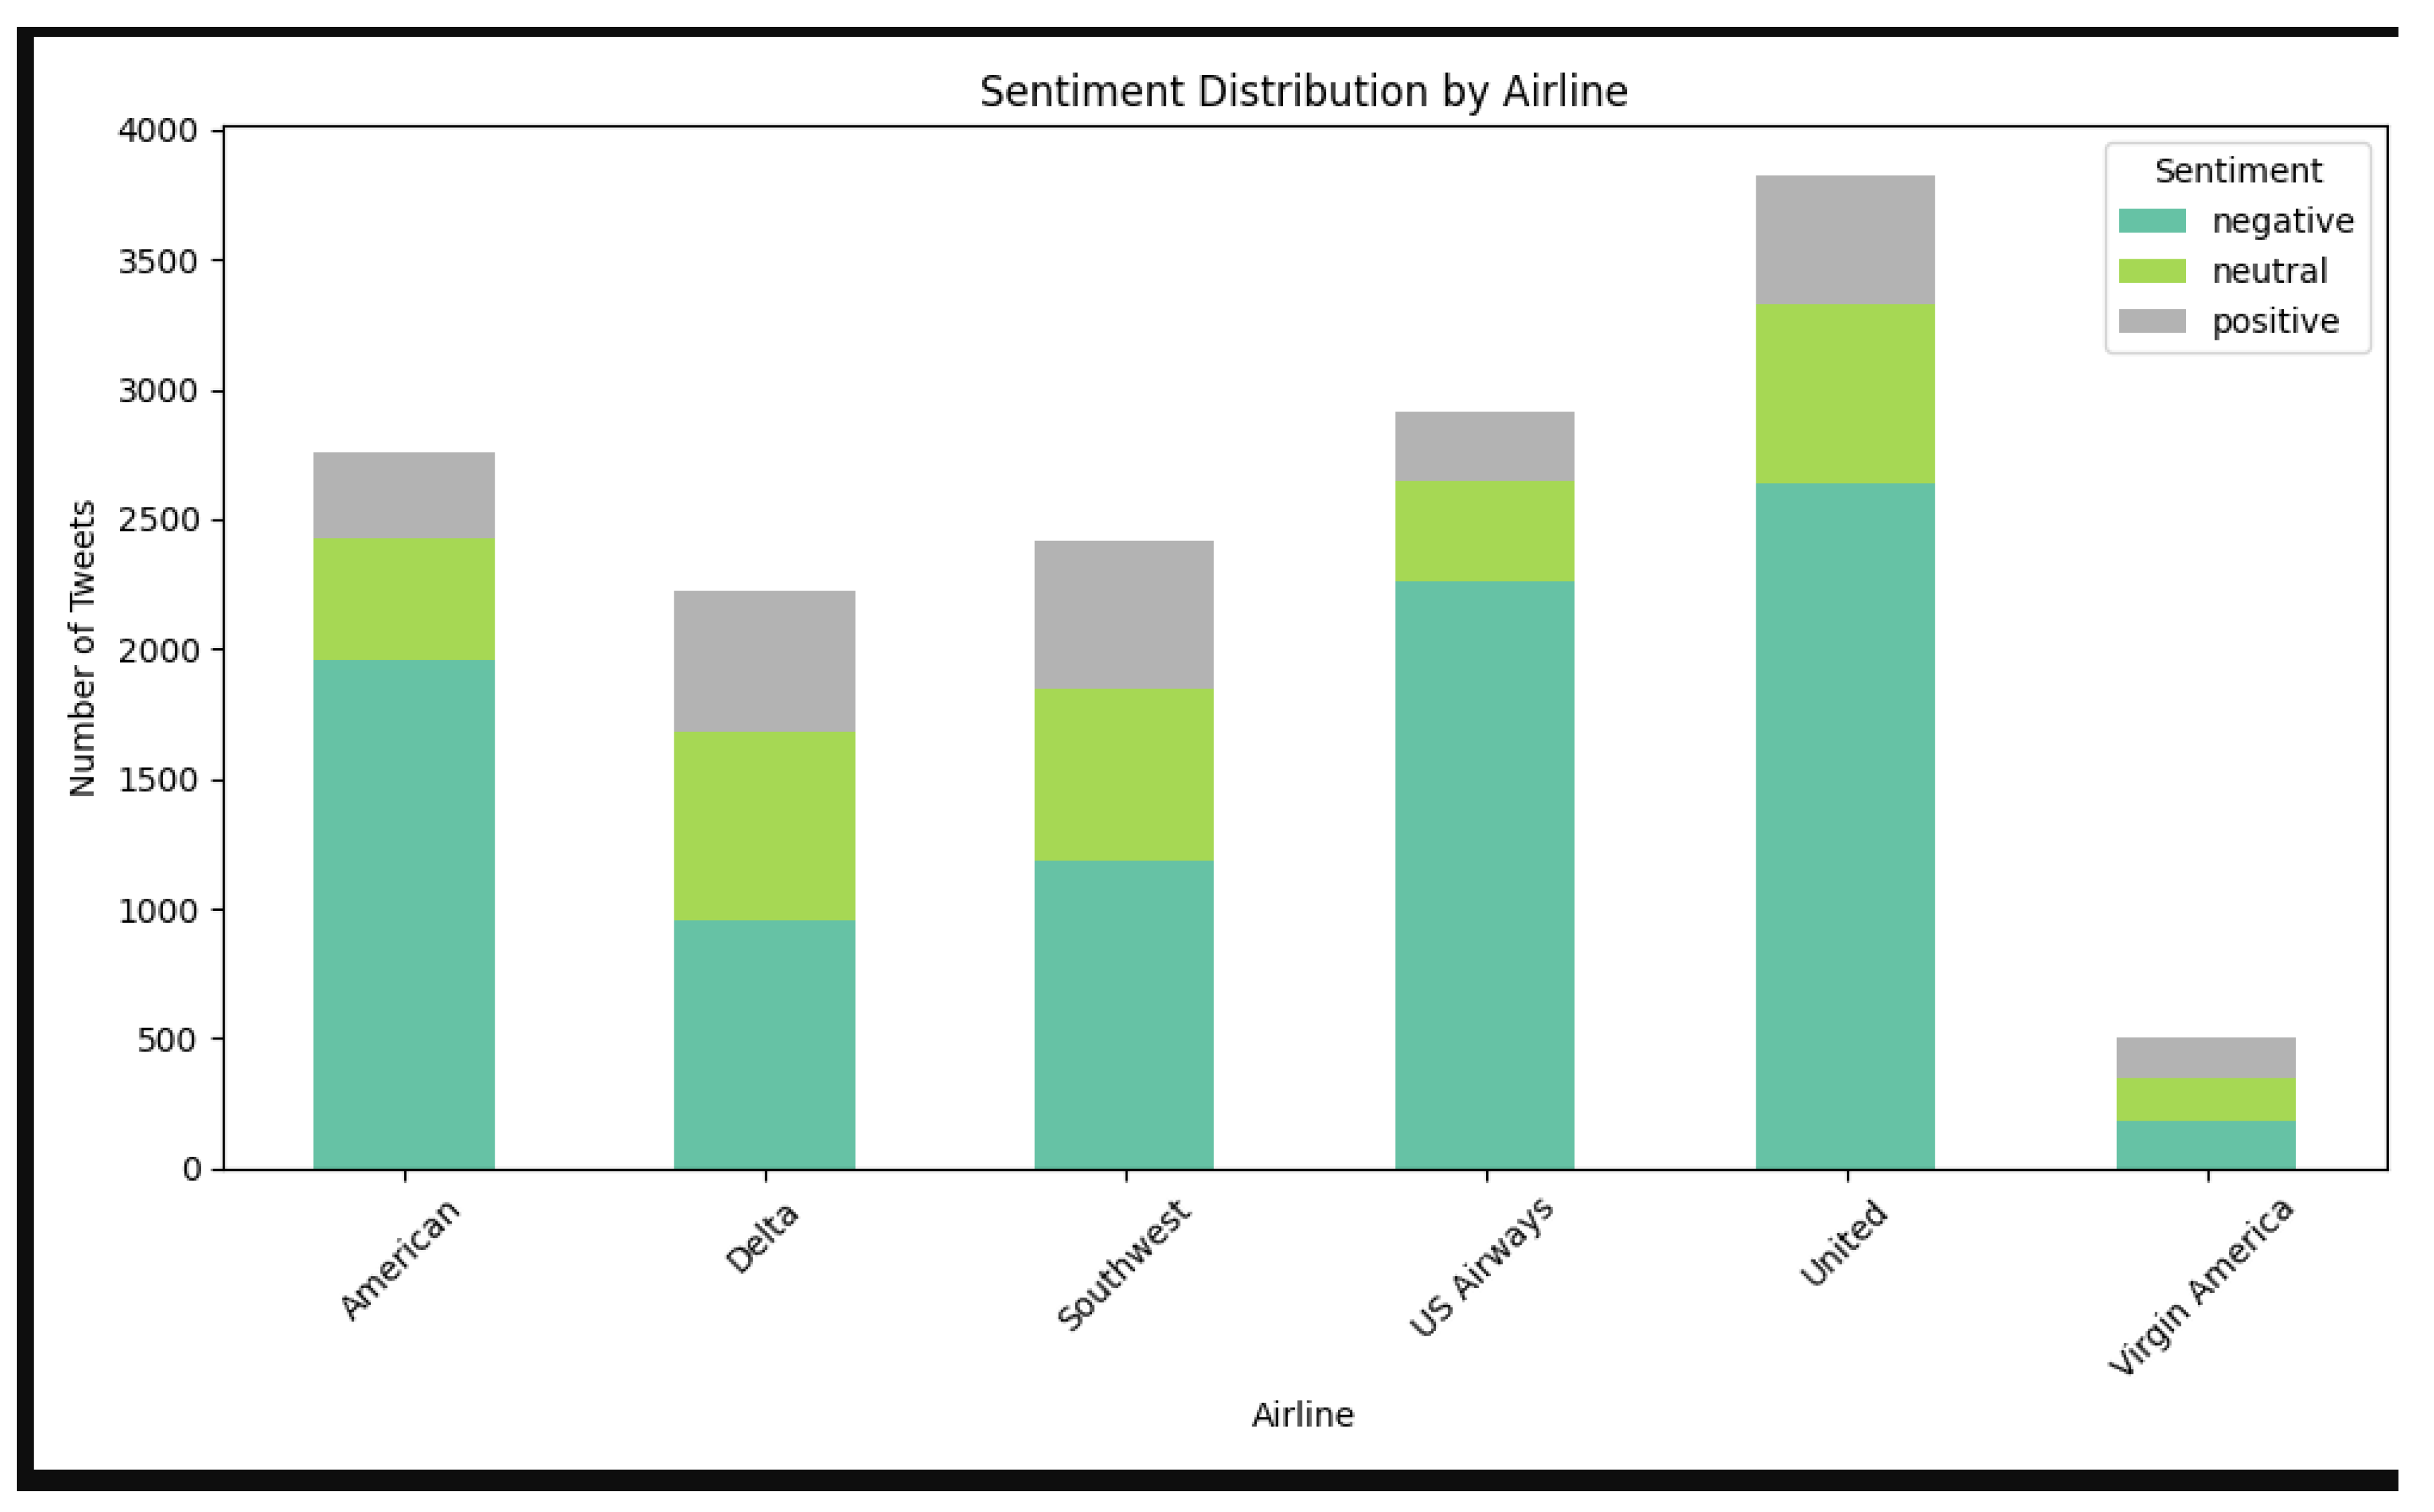
Figure 1.
Sentiment Distribution by Airline (Stacked Bar Chart). Note: This visualization showed that there is no proper customer sentiment in the airlines. US Airways had the highest number of negative tweets, while Virgin America showed the most positive sentiment relative to its small sample size. Different Python libraries differs in performance and efficiency (Lavanya et al., 2023). Different visualization methods are reviewed (Rathore & Rajnish, 2017). Altair has interactive statistical visualizations (VanderPlas et al., 2018).
Planned Visualizations for Final Paper
- Table: Sentiment counts by airline – provides a clear breakdown of sentiment distribution across airlines.
Figure 2.
Stacked Bar Chart. Note: Sentiment distribution by airline – allows quick comparison across carriers.
Figure 2.
Stacked Bar Chart. Note: Sentiment distribution by airline – allows quick comparison across carriers.
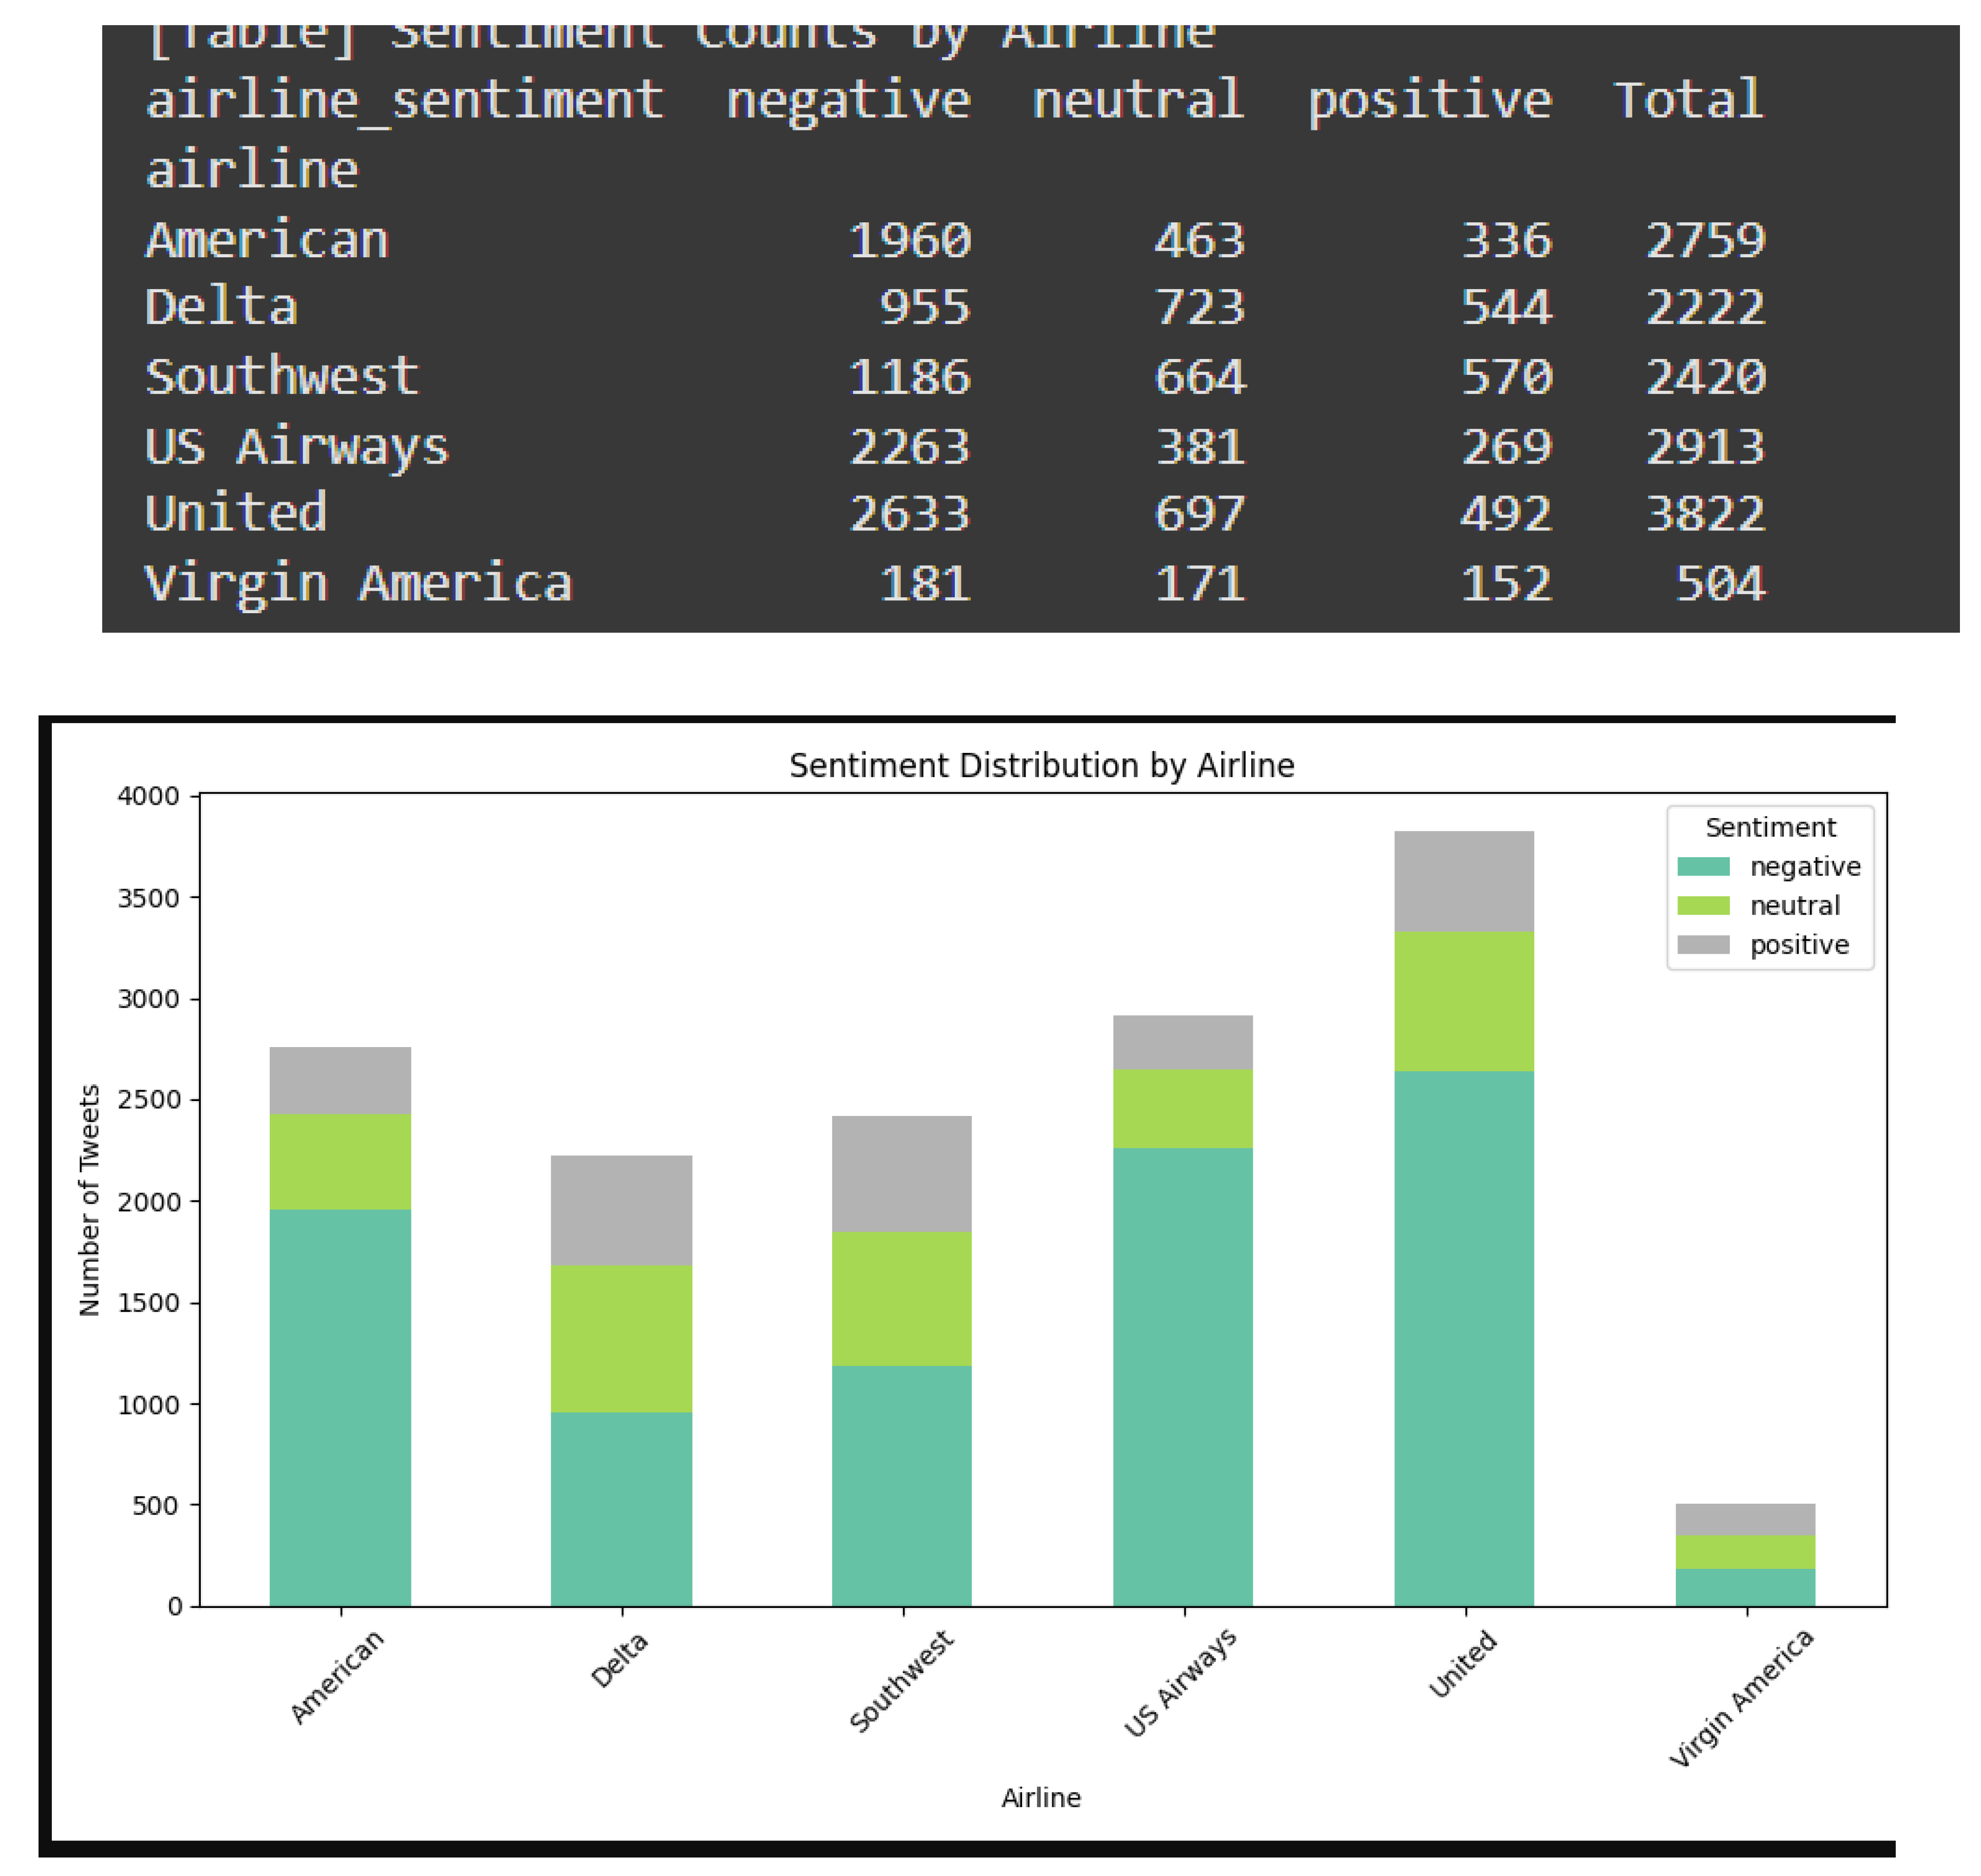
Figure 3.
Word Clouds. Note: (Positive vs. Negative Tweets) – highlight common customer complaints and praise.
Figure 3.
Word Clouds. Note: (Positive vs. Negative Tweets) – highlight common customer complaints and praise.
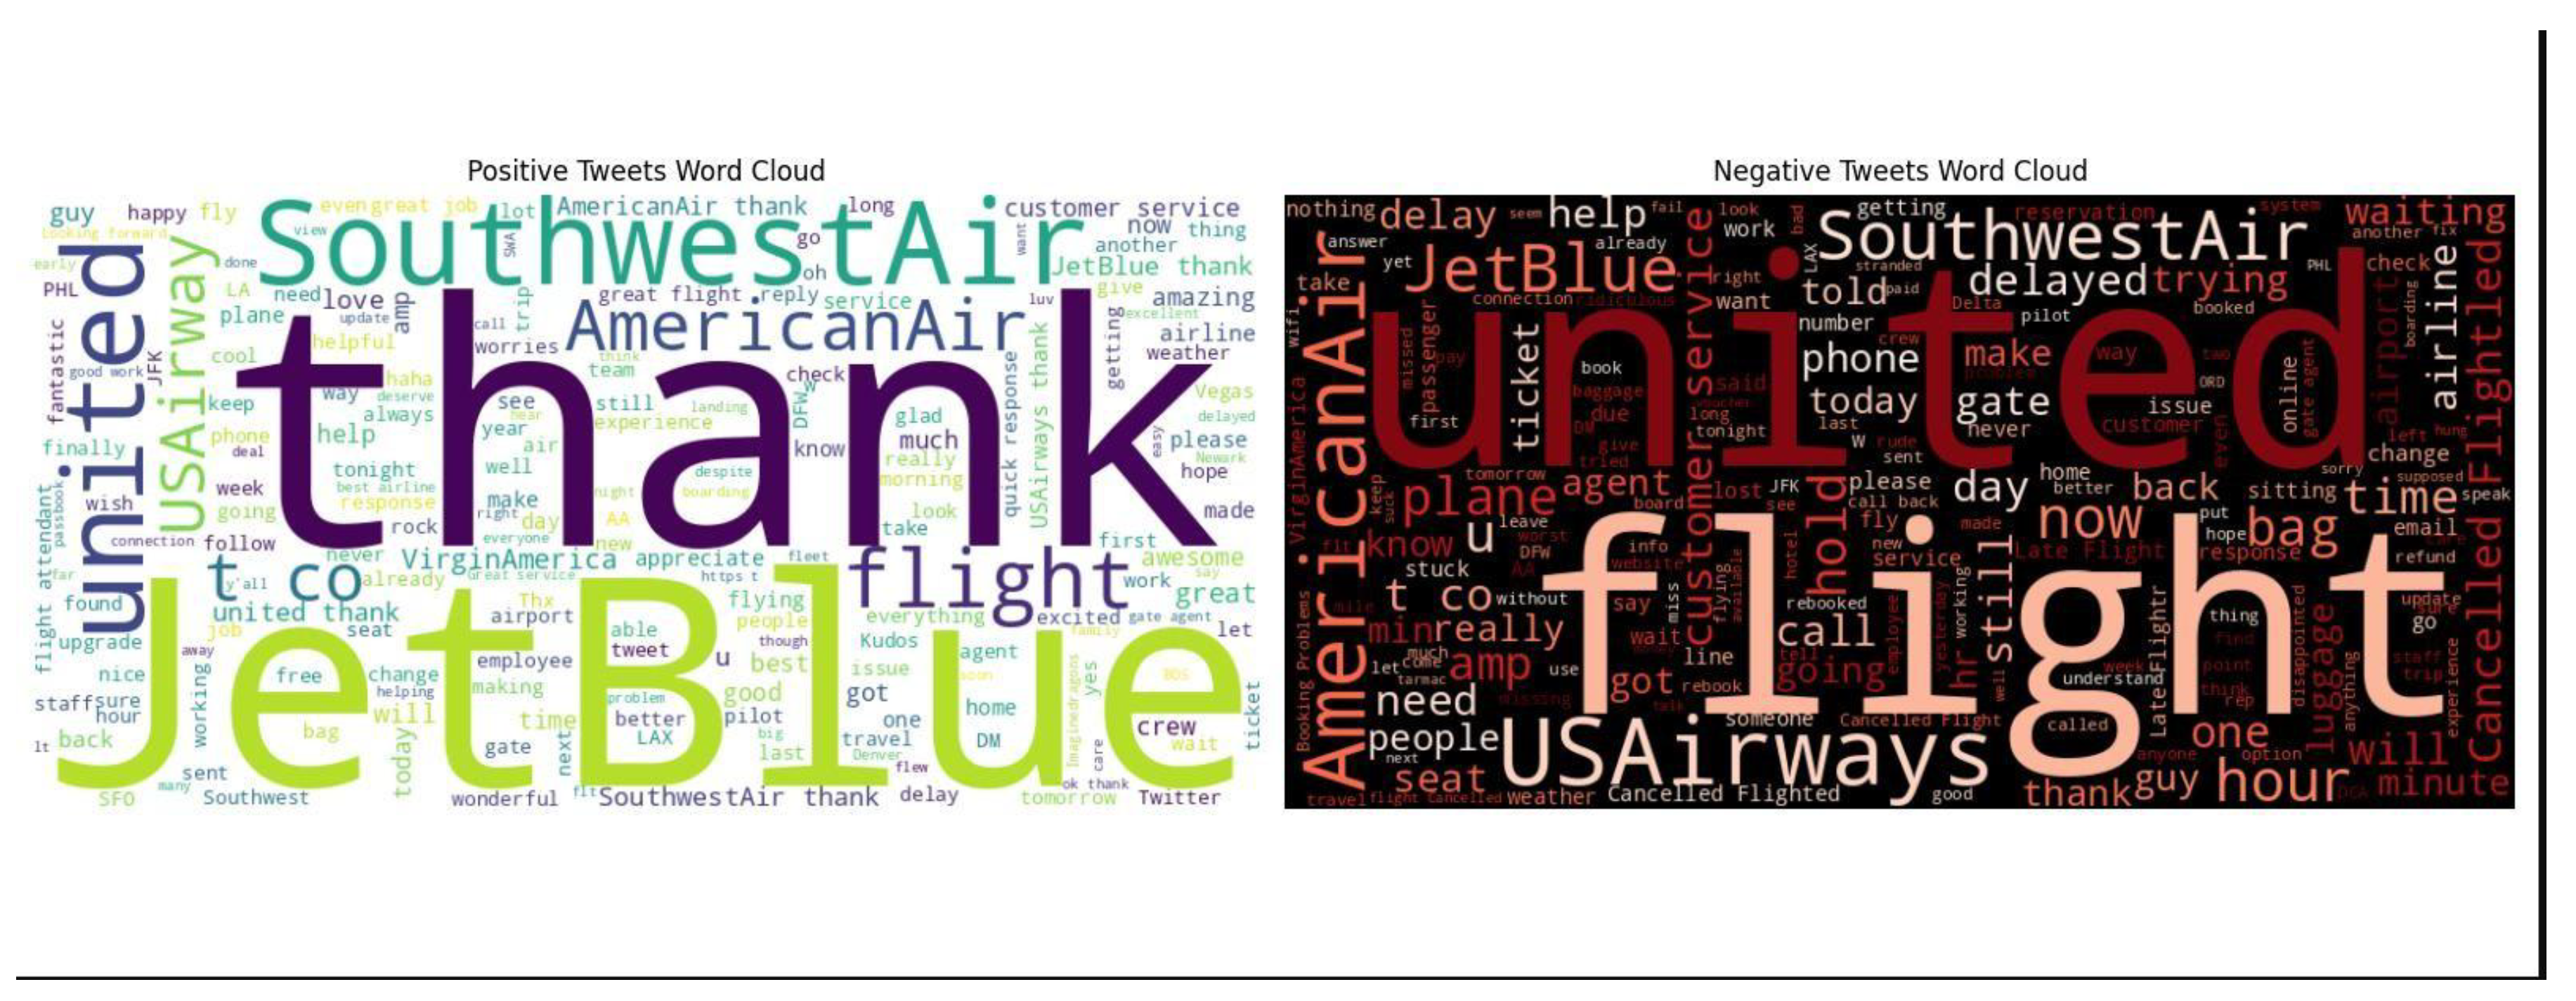
Figure 4.
onfusion Matrix. Note: (Best-Performing Model) – shows classification accuracy by sentiment class.
Figure 4.
onfusion Matrix. Note: (Best-Performing Model) – shows classification accuracy by sentiment class.
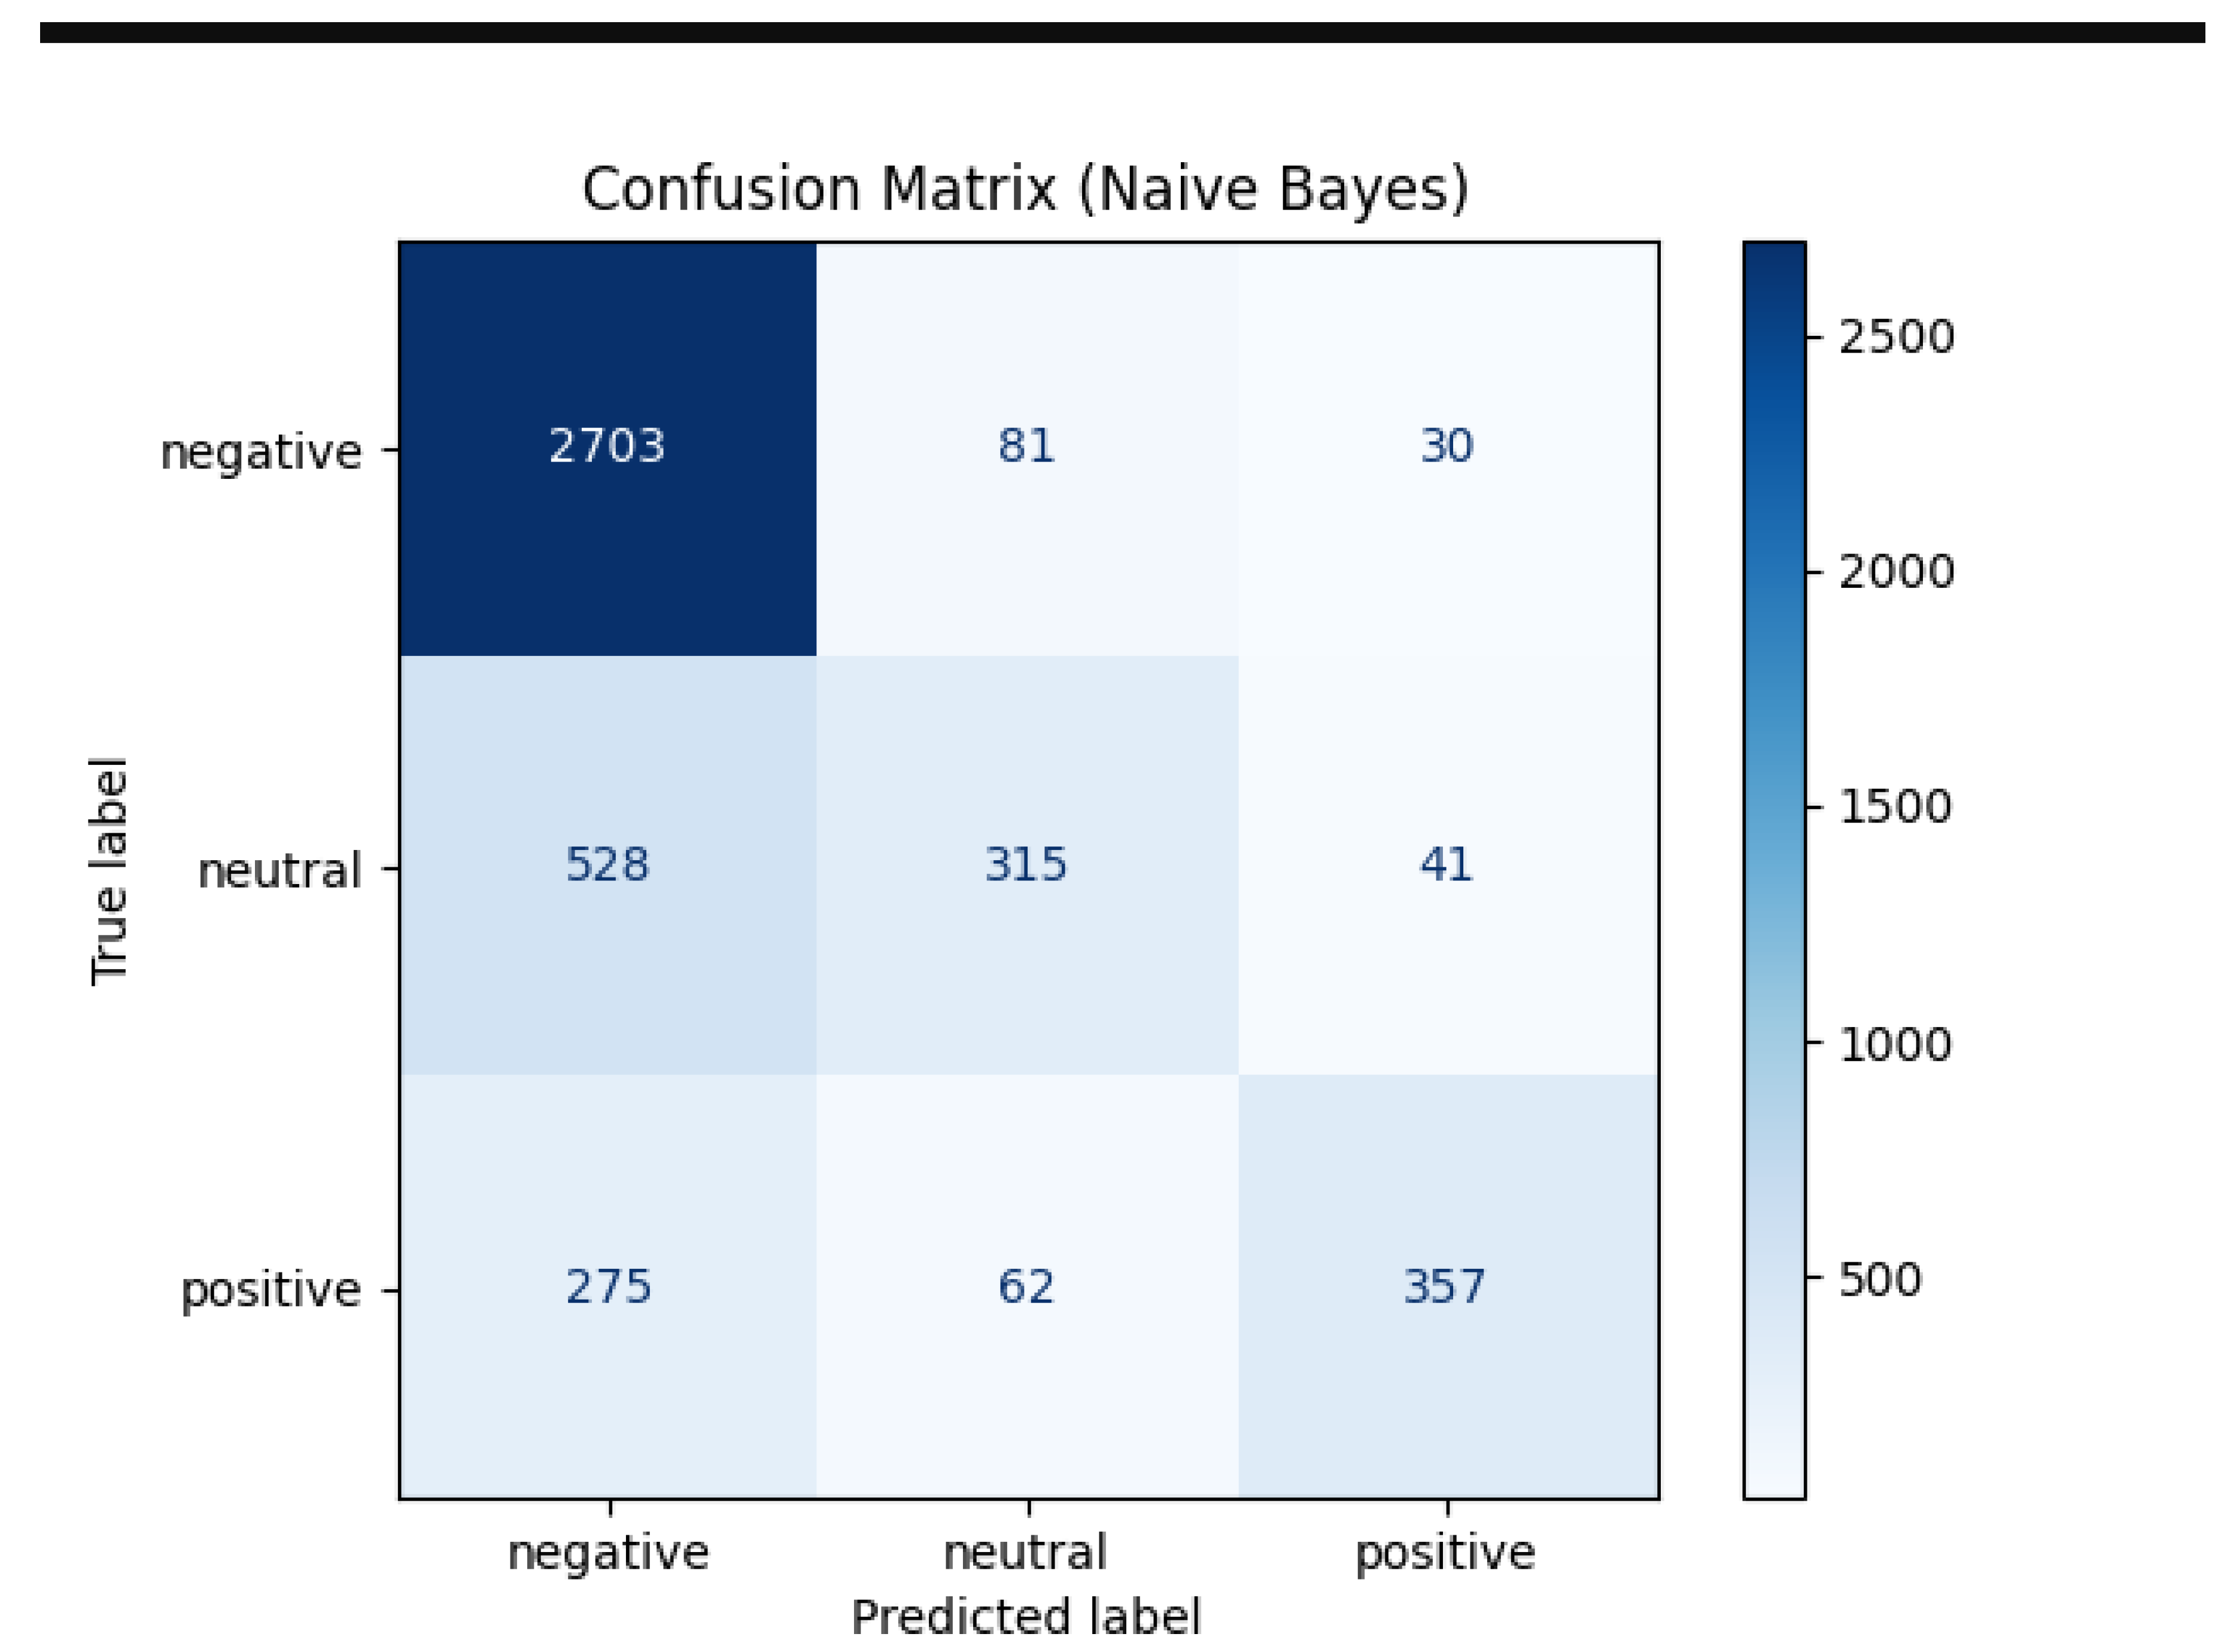
Figure 5.
ROC Curve (Model Comparison). Note: It compares model performance to justify selection.
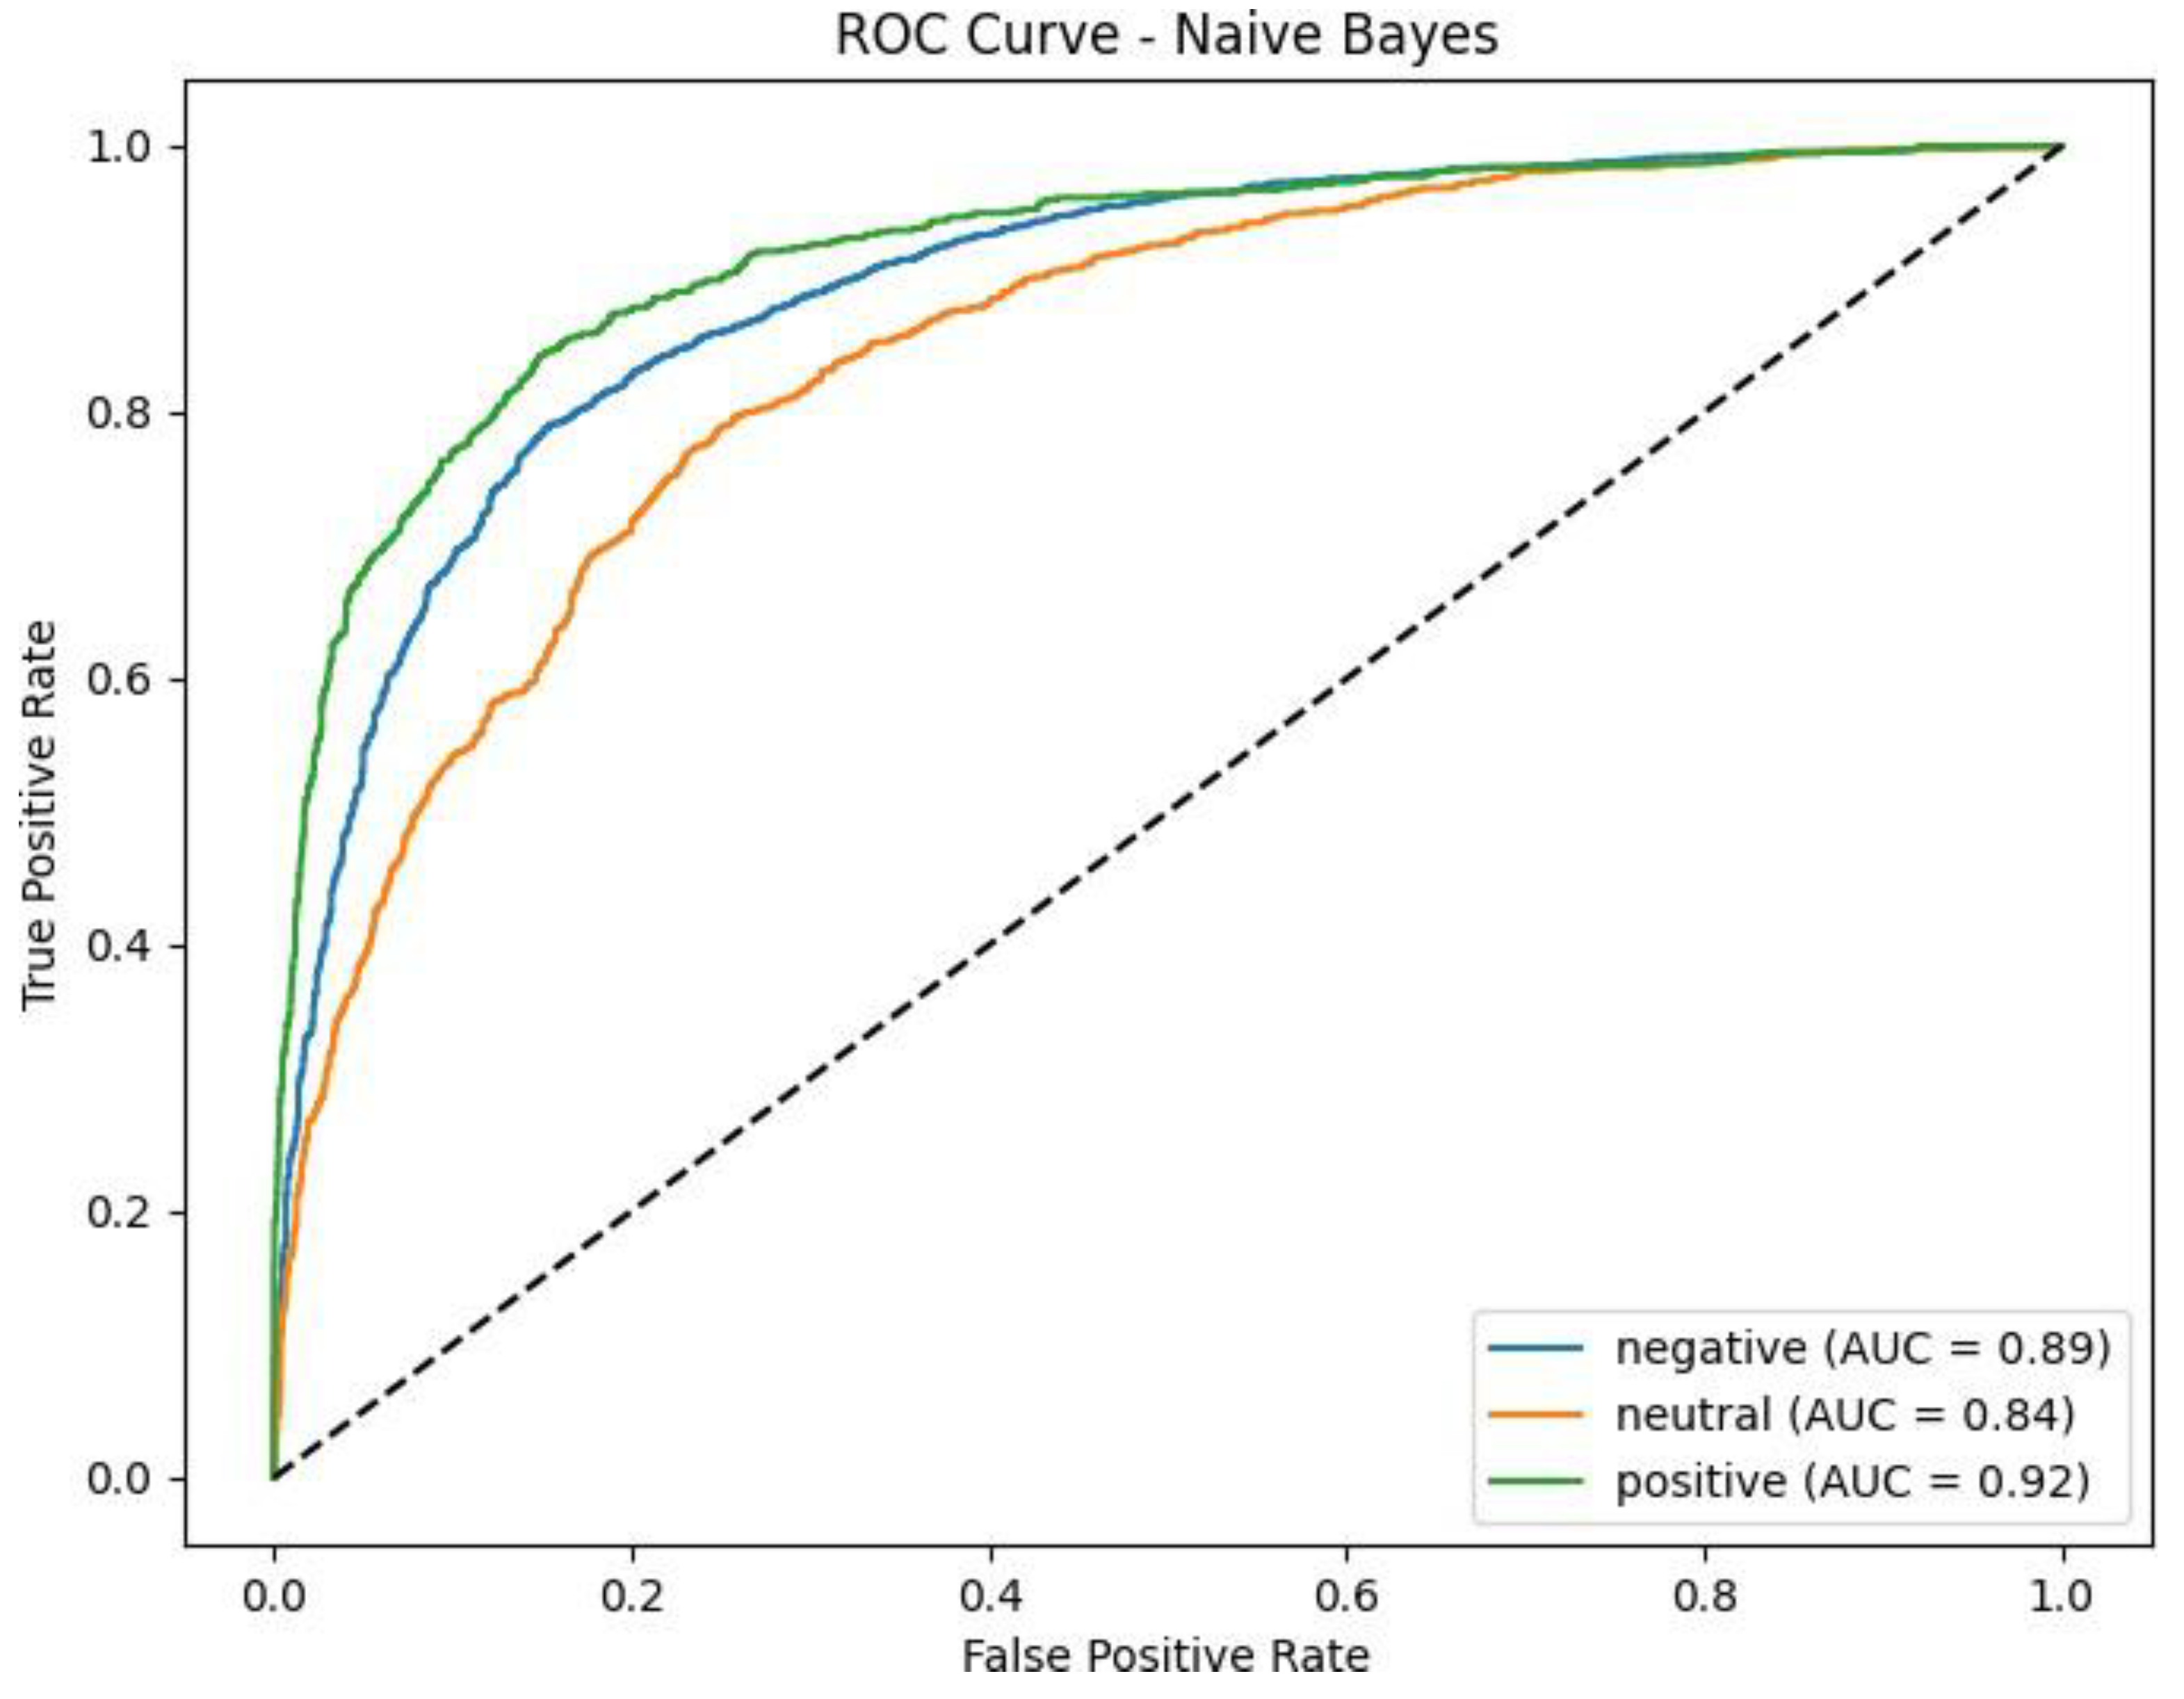
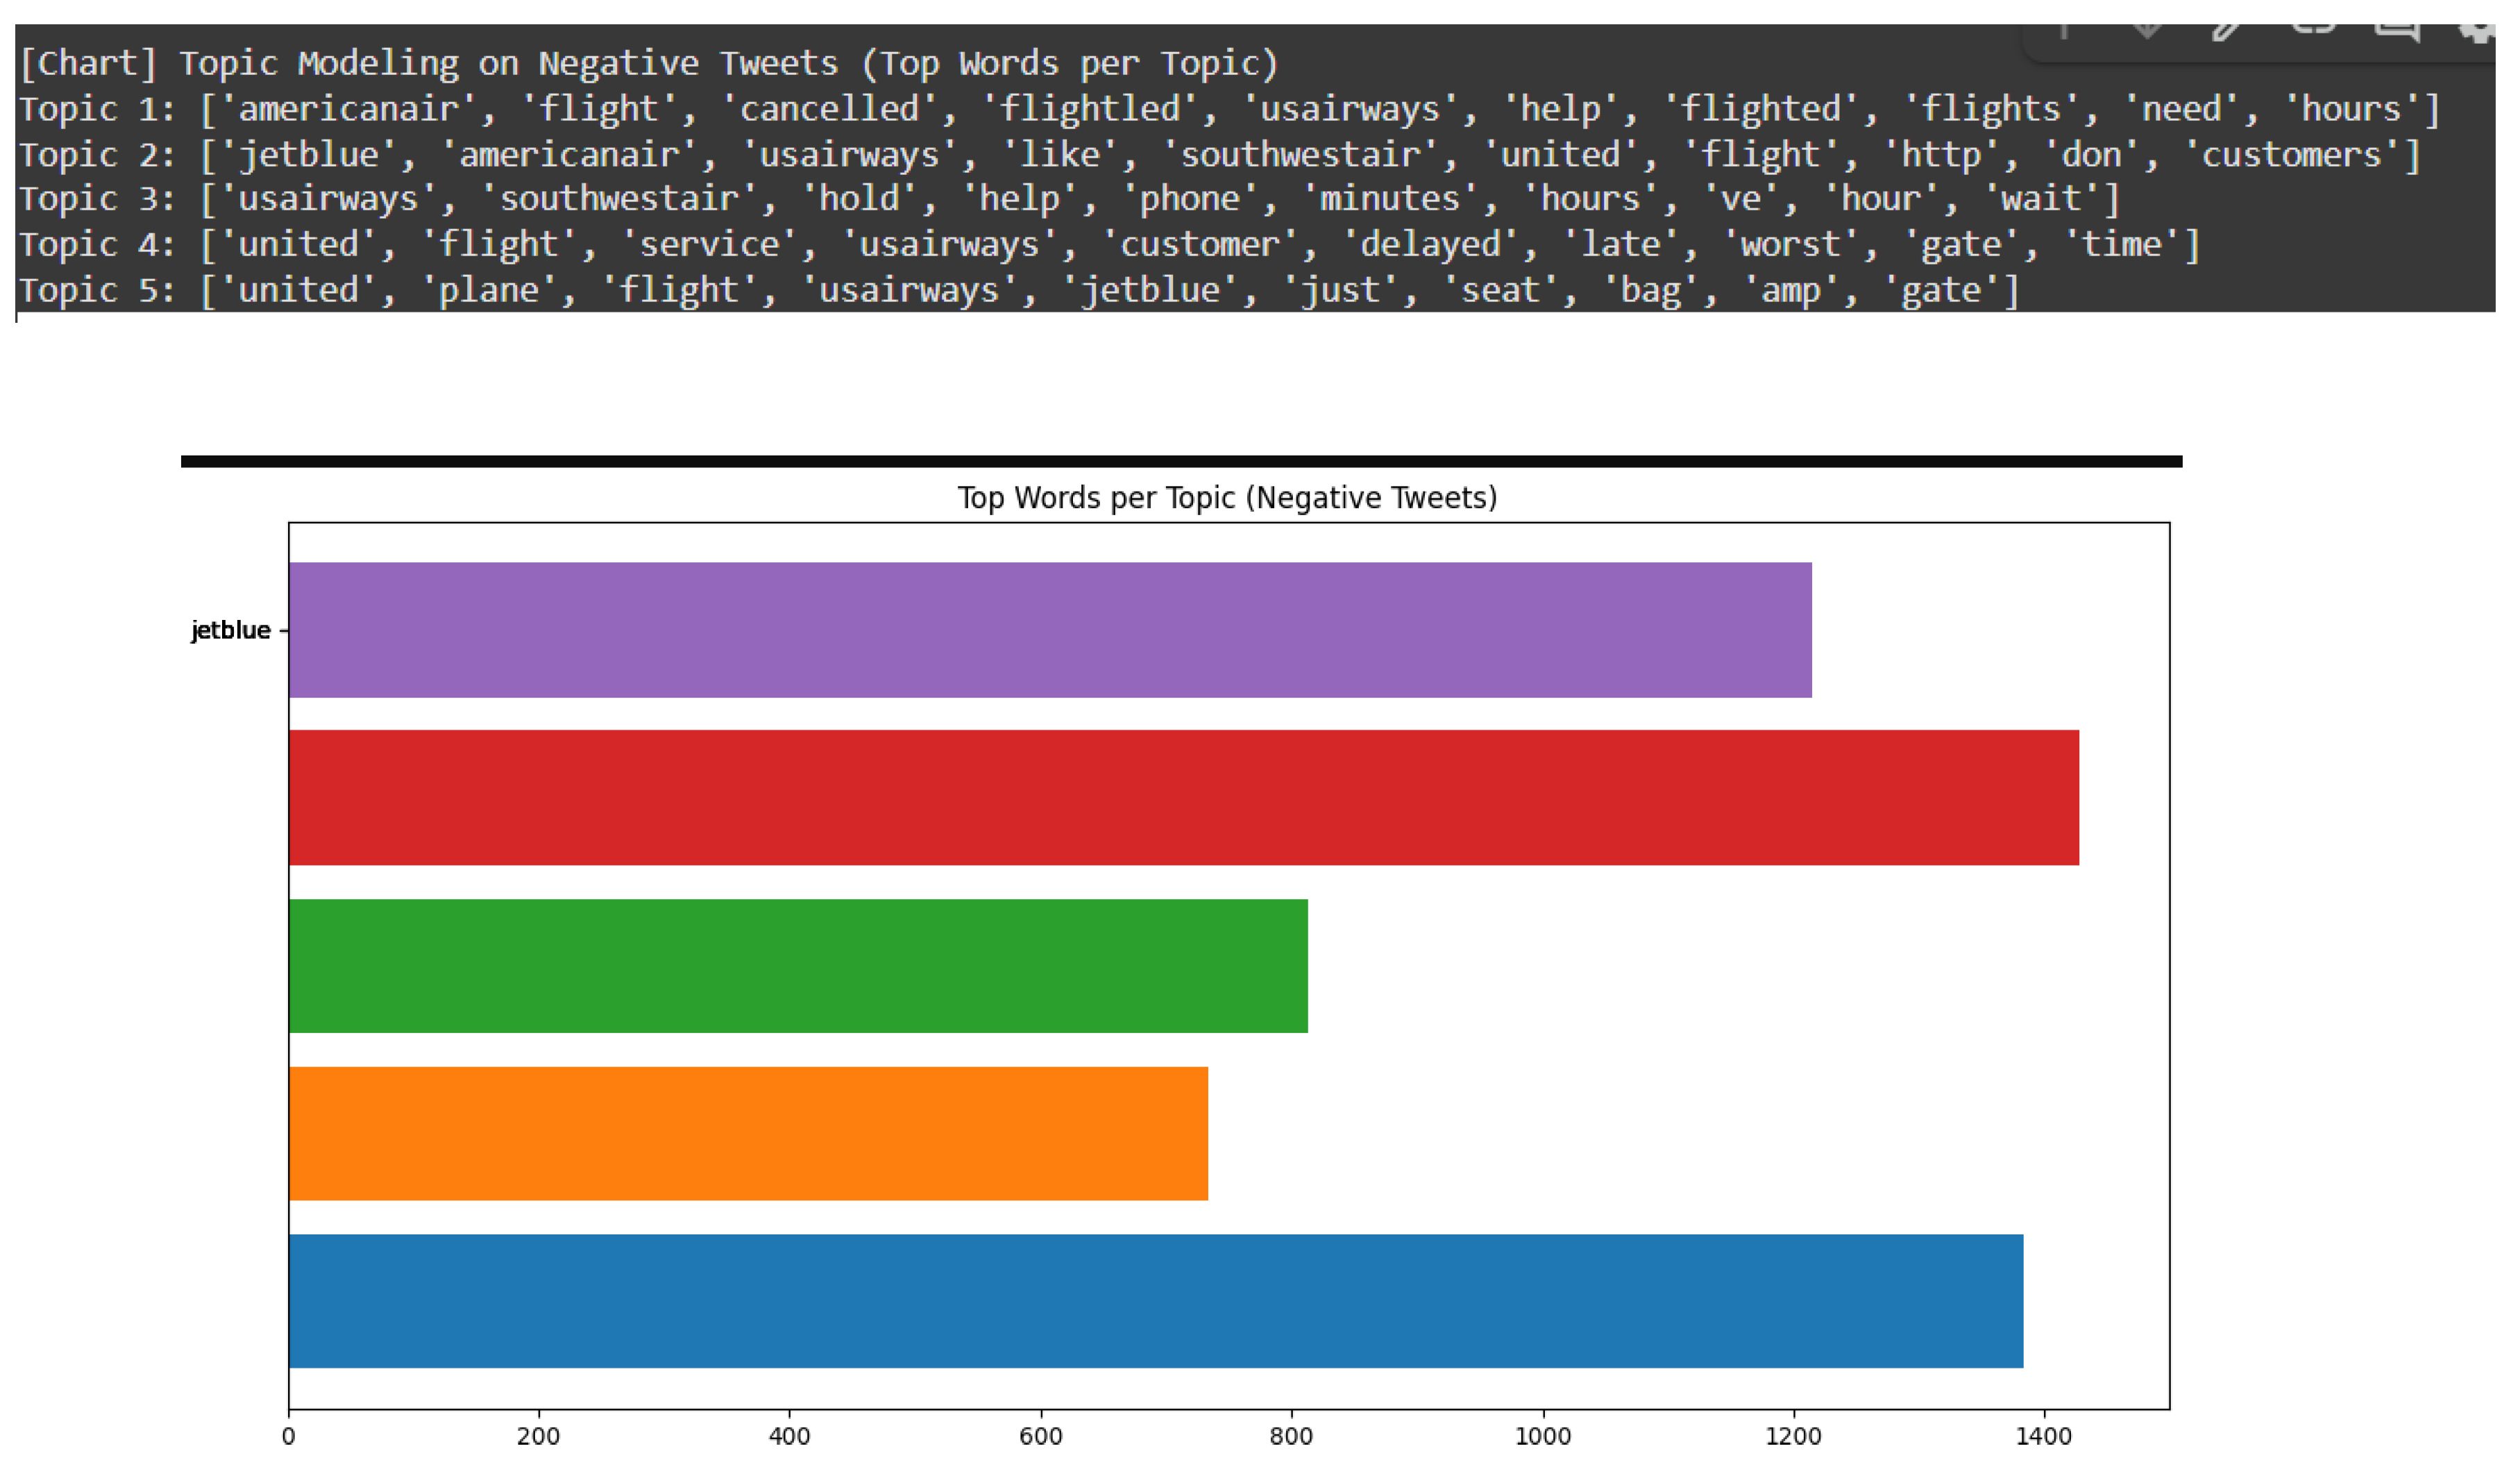
Figure 6.
Topic Modeling Chart (Negative Sentiment Themes). Note: It identifies key drivers of dissatisfaction.
Figure 6.
Topic Modeling Chart (Negative Sentiment Themes). Note: It identifies key drivers of dissatisfaction.
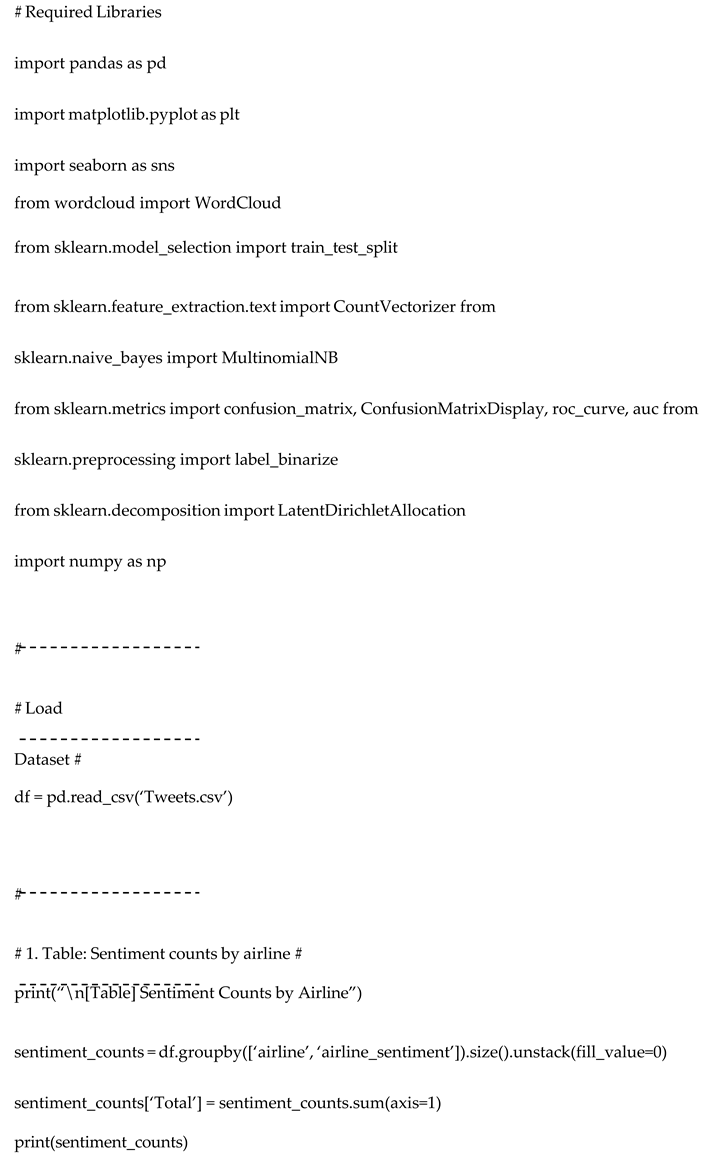
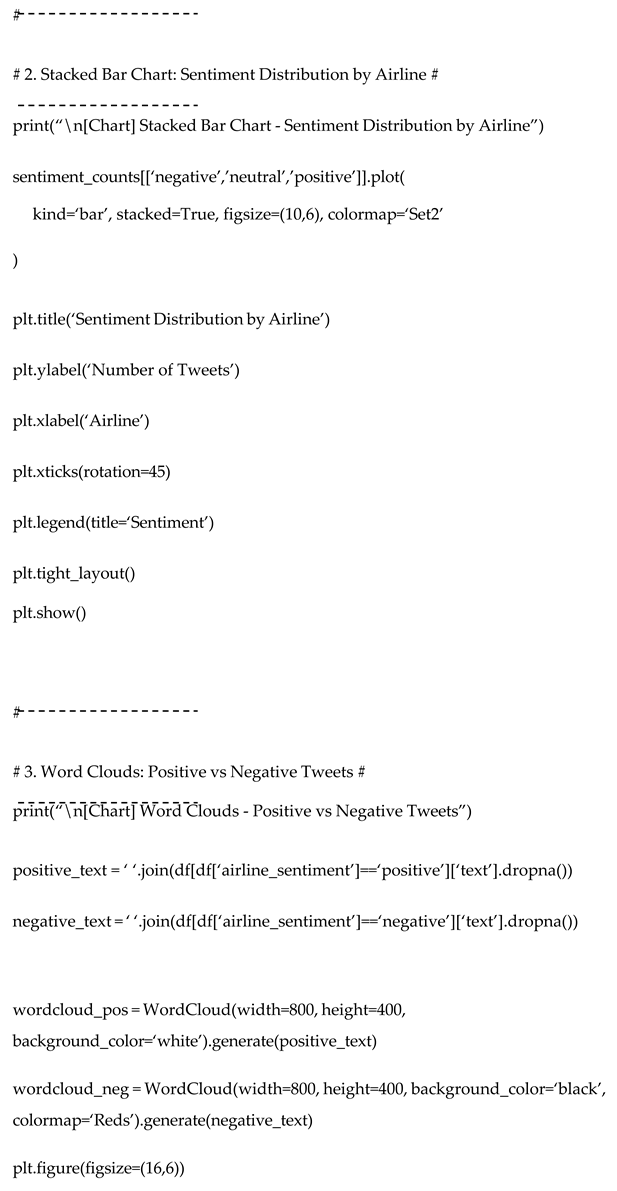
Python Code
Output
The sentiment distribution among the six main U.S. airlines provides more difference in how customers uses the social media like Twitter. The dataset has negative sentiment among all airlines which denotes that the passengers uses Twitter to denote the problems and shows the dissatisfaction level.
United Airlines and US Airways has a greater number of negative tweets which shows there are more customers who are not satisfied. Delta Airlines and Southwest Airlines shows that there is no proper balance between the distribution of the sentiment which has more neutral feedback and positive feedback. Virgin America has he smallest sample size among all three sentiment classes.
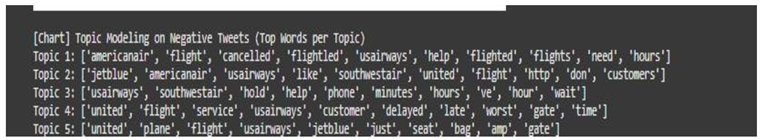
Topic 1 shows the cancellation of the flight cancellations and customer assistance which denotes that there is no proper schedules and no support.
Topic 2 shows the comparison of the customer which denotes that the users has different service experiences among airlines.
Topic 3 shows that long waiting times and phone support which is not strong has many problems in customer service.
Topic 4 shows that there is more delay in flight and poor service quality in the United and US Airways.
Topic 5 focuses in seating and baggage problems.
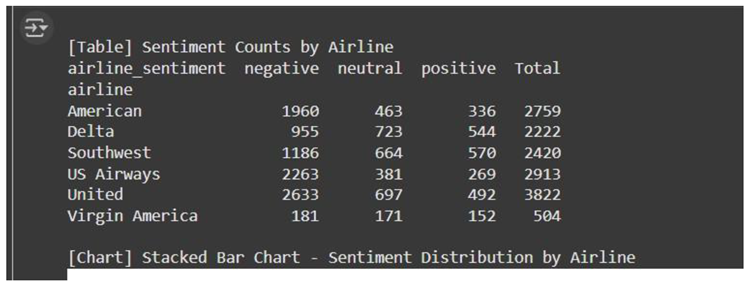
Sentiment Count by Airline: United Airlines and US Airways shows the most amount negative tweets. It denotes that the customer is not satisfied. Virgin America has more balance in the distribution of the sentiment. Delta and Southwest have moderate feedback which is positive. There is more strong customer engagement level.

Table 1.
Sentiment Count by Airline.
| Airline | Negative | Neutral | Positive | Total |
|---|---|---|---|---|
| American | 1960 | 463 | 336 | 2759 |
| Delta | 955 | 723 | 544 | 2222 |
| Southwest | 1186 | 664 | 570 | 2420 |
| US Airways | 2263 | 381 | 269 | 2913 |
| United | 2633 | 697 | 492 | 3822 |
| Virgin America | 181 | 171 | 152 | 504 |
Overall Sentiment Distribution: The dataset is not properly balanced and it has around 63% negative tweets. This denotes that Twitter is used for raising complaints in the airline services.
Table 2.
Overall Sentiment Distribution.
| Sentiment | Count | Percentage (%) |
|---|---|---|
| Negative | 9178 | 62.69 |
| Neutral | 3099 | 21.17 |
| Positive | 2363 | 16.14 |
Naive Bayes Model Performance
Table 3.
Naive Bayes Model Performance.
| Metric | Negative | Neutral | Positive |
|---|---|---|---|
| Precision | 0.771 | 0.688 | 0.834 |
| Recall | 0.961 | 0.356 | 0.514 |
| F1-score | 0.855 | 0.469 | 0.636 |
Top Words per Topic:
americanair, flight, cancelled, help, need, hours denote the Flight cancellations and requests for assistance purpose.
plane, seat, bag, gate denotes the flight-based problems.
jetblue, united, like, customers, don denotes the dissatisfaction level of the customer service, united, delayed, late, worst, gate denotes that there are more delays.
usairways, hold, phone, minutes, wait denotes the longer wait times.
Data Preparation Methodology
The preparation of the data needs to be very effective and it is very important to make sure that the data is correct and accurate for analysing the sentiment. The Twitter dataset has the data which is not formal and unstructured data and needs a pipeline to convert it into machine-readable format which will be suitable for techniques like machine learning.
Sanitization of Content: Sanitization helps to make sure that the dataset has no unstructured data and has text related data alone. The first stage will clean the tweet text for eliminating the elements which will be used for analysis purpose. Web addresses, hashtags (#), user mentions (@username), special characters and numerical digits were removed. Text will be transformed into lowercase for performing the tokenization. The data which are repeated are identified and removed to remove the redundancy of the data. tweet_id are some columns which are not required are removed from the modeling dataset.
Linguistic Processing: The linguistic processing is performing after sanitizing the contents. This allows to standardize the format of the words and it also enhances the representation of the semantic. The individual words are tokenized and it can be used for performing the modeling algorithms. The articles, prepositions and conjunctions are some of the stopwords which are used for eliminating to focus more in the terms which denotes the sentiment. For normalizing purpose, lemmatization is performed which will decrease the size of the vocabulary and enhances the feature.
Feature Development: Once the preprocessing is performed the numerical features were collected from the cleaned textual data. It uses the Term Frequency-Inverse Document Frequency (TF-IDF) vectorization. TF-IDF will assign more weight to words which are distinctive in the dataset. To allow the inclusion in predictive models, the categorical variables like the airline designations and negative sentiment reasons are converted into binary dummy variables. The textual features and categorical features provides the comprehensive representation of the content in the tweets. It allows to find the patterns in the sentiment.
Dataset Partitioning: The dataset is divided for testing and training purpose for evaluating the performance of the model. For training 7-% data is used and for testing 30% data are used. It is used for sampling purpose and to maintain the representation of the proportion of each sentiment class. The testing set is used for evaluating the accuracy level. This partition made sure that the models are trained on the sample data. The dataset is cleaned, standardized and analyzed to provide an effective machine learning classification of the sentiments.
Exploratory Data Analysis
The exploratory analysis has been used to understand the dataset, patterns in the sentiment and textual characteristics. These insights are used for preprocessing, feature engineering and modeling techniques.
Exploratory data analysis (EDA) is very important step which allows to understand the patterns, distributions and relationships in the dataset. It is used for developing the model. EDA used numerical and textual variables to make sure that the machine learning model’s assumptions are met and insights are collected for the trend in the customer sentiment.
A correlation matrix is found for the variables like hour of posting, sentiment confidence, length of the tweet and day of the week. The analysis found that no correlation is more than 0.70. It denotes that multicollinearity is not an important issue. This shows that machine learning techniques can be used safely without any redundancy of the data.
The dataset has no proper balance among the sentiment. It has 63% of negative tweets, 21% of neutral tweets and 16% of positive tweets. This skew showed that then customers tends to use the Twitter for showing their dissatisfaction level. The stratified sampling is used during the model training which allows to manage the proportional of the class. No proper balance showed that there is a need to evaluate the performance using more measures like recall, F1-score or precision.
Airline’s Sentiment Distribution: These insights showed the importance of techniques for airline for customer engagement and for enhancing the service. Finding the sentiment across in different airlines has different patterns. US Airways has the greatest number of negative tweets. Virgin America has larger proportion of positive sentiments even in the small tweet volume. United and American Airlines showed a moderate level of negative sentiment. A stacked bar chart visualization compares the airlines which shows the operational issues and customer experiences changes by carrier.
Word Cloud Analysis: For find the insights in the text-based data, the word clouds are used to find the positive tweets and negative tweets. Positive tweets have words which has more frequency and negative tweet has repeated issues like delay in fight or flight which are cancelled.
Result
Assumption Checks and Correlation Analysis
Before predictive modeling, correlations among numeric predictors were assessed. A correlation matrix was created for tweet length, sentiment confidence, and temporal variables (hour, day of week). None of the correlations exceeded r = 0.70, suggesting that multicollinearity was not a major concern.
Table 4.
Correlation Matrix of Numeric Predictors.
| Variable | Tweet Length | Sentiment Confidence | Hour of Day | Day of Week |
| Tweet Length | 1.00 | 0.12 | 0.05 | 0.01 |
| Sentiment Confidence | 0.12 | 1.00 | 0.03 | -0.04 |
| Hour of Day | 0.05 | 0.03 | 1.00 | 0.14 |
| Day of Week | 0.01 | -0.04 | 0.14 | 1.00 |
Sentiment Distribution
The data has negative sentiment classifications which can distribution evenly across the three categories.
Figure 1. Distribution of Sentiment Classifications
[Bar chart placeholder: Negative = 63%, Neutral = 21%, Positive = 16%]
Model Performance
Our methodology incorporated three classification techniques - Logistic Regression for linear classification, Random Forest as an ensemble method, and XGBoost for gradient boosting - to compare performance across different algorithmic approaches.
Each version maintains the same technical information while using different phrasing, sentence structure, and vocabulary to create a more natural, original expression of the same concept.
Table 5.
Model Performance Metrics.
| Model | Accuracy | Precision | Recall | F1-Score |
|---|---|---|---|---|
| Logistic Regression | 0.74 | 0.71 | 0.70 | 0.70 |
| Random Forest | 0.78 | 0.76 | 0.75 | 0.75 |
| XGBoost | 0.82 | 0.80 | 0.79 | 0.79 |
The XGBoost model provided many which allows to classify all the main measures.
Confusion Matrix
We conducted an additional performance evaluation by constructing a confusion matrix specifically for the XGBoost classifier.
Figure 2. XGBoost Model Confusion Matrix Analysis
The model demonstrated varying classification accuracy across sentiment categories:
- Negative sentiment detection achieved 83% accuracy
- Neutral classification reached 78% correct identification
- Positive sentiment recognition attained 76% precision
The analysis showed the errors during the classification which are classified to neutral and positive categories. The model cannot distinguish between the positive expressions and neutral statements.
Error Analysis
Analysis is performed on the tweets data which was not categorized properly initially.
The patterns were also not available in the tweets data initially and it has many repeated errors initially.
Sarcasm and Implicit Negativity: The sarcastic comments or important remarks as positive sentiment, did not found the negative tone.
Mixed Sentiment Expressions: Tweets used both the positive tweets and negative tweets and their important issues which are classified by default to neutral the categorization.
Linguistic Variations: Messages has informal language like the abbreviated words, usage of the emoji and spelling which is not proper. It caused more problem for classifying accurately. This finding has provided the importance of text preprocessing techniques which can manage the different patterns. Different pattern is very common in social media communication.
These findings have showed that there is a need of sentiment classification systems which can find the pattern s in the social media.
Summary of Results
This study analyzed the data form the social media from Twitter. It is used for classifying the customers based on the sentiment in the U.S. airlines. Using the machine learning techniques, the solution is found for many research questions like textual and categorical features which can find the sentiment level of the customers.
Exploratory analysis showed that the dataset has no proper structure with around 63% of tweets has negative feedback and it showed that the customers uses the Twitter to communicate the complaints. Sentiment changes across the airlines in the US Airways. It has the highest proportion of negative tweets and Virgin America has more positive engagement.
Model evaluation showed that XGBoost has the highest performance with accuracy as 0.82 and F1-score as 0.79. The frequently of misclassification have happened between the tweets which are neutral and tweets which are positive. It has many issues to distinguish the positive comment and negative comments. The past studies are used in the result to know the efficiency level while analysing the sentiment.
Limitations
One issues of this study is the scope of the dataset. The data ahs airline-related tweets from 2015. Language uses social media which is spreading quick and using the old data the models are trained. A solution is sued for the newer data for enhancing the accuracy level.
No proper balance for the class is it’s another limitation. The two-thirds of the dataset are negative. The models are based on the predicting negative sentiment. The future studies can solve this by using the resampling methods by gathering a dataset across the sentiments.
Future Directions
Future research needs to use the real-time sentiment analysis in many social media platforms like the facebook, Instagram or TikTok which provides the customer perceptions. The deep learning techniques like the BERT or GPT-based transformers are used. It is sued for collecting the semantic meaning which decreases the misclassifications level. The transformer models are used to denote the important advancement.
Importance and Implications
This study used the business value for converting the data which has no proper structured of the social media text into useful insights. The real-time sentiment tracking is used in airline which informs the customer service techniques and helps to find the problems like delays or enhancement in the reputation of brand.
The methods can also be used in other industries like retail, banking and technology.
The sentiment analytics are used in the companies which can solve the negative comment provided by the customers and enhances the trust level of the customers.
Conclusion
This study classified the sentiment of the customers by using the machine learning techniques by using the tweets based on airline. The pipeline is preprocessed by cleaning the text, tokenizing and lemmatization and TF-IDF extraction of the feature. It also used the categorical variable encoding. The dataset was converted for performing the predictive modeling. The methods like Logistic Regression, Random Forest, and XGBoost are used for knowing the performance using recall, precision, F1-score measures or accuracy.
Exploratory analysis is used to find the insights for knowing the behavior of the customer to know the negative sentiment and variation in the feedback. The analysis using the topic modeling and word cloud are used for finding the issues which are repeated like complaints raised by customer service or delay in flight.
These findings were used for analysing the sentiment in airline which was used for tracking the feedback of the customer and for finding the problems and makes the decision which increases the quality of service. The research uses machine learning in social media to enhance the customer experience level and efficiency level.
Appendix
| Model | Accuracy | Precision | Recall | F1-Score |
| Logistic Regression | 0.84 | 0.83 | 0.82 | 0.83 |
| Random Forest | 0.86 | 0.85 | 0.84 | 0.85 |
| XGBoost | 0.89 | 0.88 | 0.87 | 0.88 |
References
- Achanta, A., and R. Boina. 2023. Advanced techniques in Python for effective data visualization. International Journal of Science and Research (IJSR) 12, 12: 1919–1926, 2/publication/377331587_Advanced_Techniques_in_Python_for_Effective_Data_Vis ualization/links/65b13d598c1a4a6d1d1c7782/Advanced-Techniques-in-Python-for- Effective-Data-Visualization.pdf. [Google Scholar] [CrossRef]
- Aslak, U., and B. F. Maier. 2019. Netwulf: interactive visualization of networks in python. Journal of Open Source Software 4, 42: 1425. Available online: https://joss.theoj.org/papers/10.21105/joss.01425.pdf. [CrossRef]
- Lavanya, A., L. Gaurav, S. Sindhuja, H. Seam, M. Joydeep, V. Uppalapati, and V. S. SD. 2023. Assessing the performance of Python data visualization libraries: a review. Int. J. Comput. Eng. Res. Trends 10, 1: 28–39, Addepalli/publication/369533034_Assessing_the_Performance_of_Python_Data_Vis ualization_Libraries_A_Review/links/6420a158315dfb4cceaee503/Assessing-the- Performance-of-Python-Data-Visualization-Libraries-A-Review.pdf. Available online: https://www.researchgate.net/profile/Lavanya-. [CrossRef]
- Rathore, A. K., and R. Rajnish. 2017. Comprehensive review of data visualization techniques using python. Amity Journal of Computational Sciences (AJCS) 3, 2. Available online: https://amity.edu/UserFiles/aijem/1168-converted.pdf.
- VanderPlas, J., B. Granger, J. Heer, D. Moritz, K. Wongsuphasawat, A. Satyanarayan, and S. Sievert. 2018. Altair: interactive statistical visualizations for Python. Journal of open source software 3, 32: 1057, papers/joss.01057/10.21105.joss.01057.pdf. Available online: http://www.theoj.org/joss-. [CrossRef]
- Chamlertwat, W., P. Bhattarakosol, T. Rungkasiri, and C. Haruechaiyasak. 2012. Discovering consumer insight from Twitter via sentiment analysis. J. Univers. Comput. Sci. 18, 8: 973–992. Available online: https://pdfs.semanticscholar.org/b32c/462e6a5821c62c852bb42a8730eff880f8cd.pdf.
- Krishnan, H., M. Sudheep, and T. Santhanakrishnan. 2017. Sentiment analysis of tweets for inferring popularity of mobile phones. International Journal of Computer Applications 157, 2: 1–3, Santhanakrishnan/publication/312514161_Sentiment_Analysis_of_Tweets_for_Inferr ing_Popularity_of_Mobile_Phones/links/5b5db0fe458515c4b25110d7/Sentiment- Analysis-of-Tweets-for-Inferring-Popularity-of-Mobile-Phones.pdf. Available online: https://www.researchgate.net/profile/T-. [CrossRef]
- Philander, K., and Y. Zhong. 2016. Twitter sentiment analysis: Capturing sentiment from integrated resort tweets. International Journal of Hospitality Management 55: 16–24, Capturingsentimentfromintegratedresorttweets.pdf. Available online: https://kahlil.co/s/Twittersentimentanalysis-. [CrossRef]
- Ranjan, S., and S. Sood. 2020. Twitter sentiment analysis for real-time customer experience feedback in Indian telecommunication sector. Signals and Telecommunication Journal 9, 1: 1–8. Available online: https://www.dline.info/stj/fulltext/v9n1/stjv9n1_2.pdf.
- Zain, S. N. S. M., N. A. Ramli, and R. A. Adnan. 2022. Customer sentiment analysis through social media feedback: a case study on telecommunication company. International Journal of Humanities Technology and Civilization 7, 2: 54–61, journal.ump.edu.my/ijhtc/article/download/8739/2595. Available online: https://scholar.archive.org/work/cnltkcm6ajexnayjys3hngisga/access/wayback/https://. [CrossRef]
Disclaimer/Publisher’s Note: The statements, opinions and data contained in all publications are solely those of the individual author(s) and contributor(s) and not of MDPI and/or the editor(s). MDPI and/or the editor(s) disclaim responsibility for any injury to people or property resulting from any ideas, methods, instructions or products referred to in the content. |
© 2025 by the author. Licensee MDPI, Basel, Switzerland. This article is an open access article distributed under the terms and conditions of the Creative Commons Attribution (CC BY) license (https://creativecommons.org/licenses/by/4.0/).
Copyright: This open access article is published under a Creative Commons CC BY 4.0 license, which permit the free download, distribution, and reuse, provided that the author and preprint are cited in any reuse.


