
Submitted:
05 May 2023
Posted:
06 May 2023
You are already at the latest version
Abstract
Erectile dysfunction (ED) is a common and feared complication of radical prostatectomy (RP) for prostate cancer. Recently, tissue engineering is being attempted for post-prostatectomy ED, with controlled interactions between cells, growth factors, and extracellular matrix (ECM) being important for nerve regeneration's structural integrity. In this study, we evaluated the effects of biomechanical ECM patch on human bone marrow-derived mesenchymal stem cells (hBMSCs) morphology and behavior in bilateral cavernous nerve injury (BCNI) rat model. The ECM patch, made of decellularized human fibroblast-derived ECM (hFDM) and a biocompatible polyvinyl alcohol (PVA) hydrogel, was tested with human bone marrow-derived mesenchymal stem cells (hBMSCs) on a bilateral cavernous nerve injury (BCNI) rat model. In vitro analysis showed that the hFDM/PVA + hBMSCs patches significantly increased neural development markers. In vivo experiments demonstrated that the rats treated with the hFDM/PVA patch had higher ICP/MAP ratio, a higher ratio of smooth muscle to collagen, increased content of nNOS, higher levels of eNOS protein expression, and a higher cGMP level compared to the BCNI group. These results indicate that the hFDM/PVA patch is effective in promoting angiogenesis, smooth muscle regeneration, and nitrergic nerve regeneration, which could contribute to improved erectile function in post-prostatectomy ED.
Keywords:
1
; erectile dysfunction 2
; stem cell delivery 3
; prostate cancer 4
; biofabrication
1. Introduction
ED is a common and feared complication of RP for prostate cancer, with many patients seeing recovery of their ability to have an erection as the true measure of treatment success. Recovery of sexual function after RP was historically low, but nerve-sparing techniques have increased the possibility for many patients [1]. Current studies show that recovery rates range from 25-75% within a year of RP using nerve-sparing techniques, with younger and more sexually active patients having higher rates [2]. Despite nerve-sparing techniques, ED remains an inevitable complication of RP for prostate cancer. Researchers are investigating factors influencing sexual function recovery and the pathophysiology of iatrogenic ED, including nerve injury and neurapraxia [3]. Therapeutic approaches that have been studied include pluripotent stem cells and human amnion-chorion membrane allografts enriched with cytokines [4,5].
Mesenchymal stem cells (MSCs) possess long-term self-renewal capacity and can differentiate into different cell types under specific conditions [6,7]. In various physiological and pathological conditions, MSCs can aid in maintaining homeostasis by differentiating in multiple directions [7]. New MSC-based therapeutic strategies have demonstrated promising results in clinical practice, including the treatment of nerve damage, inflammation, and transplantation [8]. And the MSC therapy for ED is still being studied in clinical trials [9]. Many studies have revealed positive outcomes of MSC therapy on ED [10]. Although MSC therapy has demonstrated positive outcomes for ED, the exact impact of MSCs on this condition and the underlying mechanisms remain incompletely understood [11,12,13]. And proper evaluation of the engraft of MSCs in the injection site and delivery methods have not been done yet [14,15,16].
The cell-derived matrix (CDM) plays a role in neural differentiation, influencing cell behavior and differentiation through physical and biochemical cues [17]. The composition and mechanical properties of the CDM can provide physical and biochemical cues that influence neural progenitor cell behavior and differentiation, including cell adhesion, migration, proliferation, and signaling pathways that control gene expression and cell death [18]. It can be used to create supportive scaffolds in tissue engineering, mimicking the natural microenvironment of developing neurons [19]. While CDM is easy to generate in vitro, its fragility and manipulation difficulties make it less practical for in vivo applications. Combining CDM with a mechanical platform for MSC engraftment may enhance its effect [20].
To investigate enhanced delivery of MSCs, we conducted a study using a CDM platform. This platform stamps CDM onto a mechanically-compliant polyvinyl alcohol (PVA) / polyethylene glycol (PEG) hydrogel (Figure 1A) with human fibroblast-derived matrix (hFDM), stabilizing the structure and promoting nerve regeneration [21,22]. In this study, we evaluated the effects of biomechanical CDM patch on hBMSCs in BCNI rat model.
2. Materials and Methods
2.1. Preparation of Human Fibroblast-Derived ECM (hFDM) Patch
The fabrication of patches composed of hFDM and PVA was based on previously reported papers [22,23]. Human fibroblasts (WI-38, CCL-75) cells were obtained from the American Type Culture Collection (Manassas, VA). Figure 1A shows a schematic of hFDM combined with PVA (upper) and a successful stamping image (lower). The state of the hFDM was assessed after each cycle using a light microscope (Axio Vert.A1; Carl Zeiss) (Figure 1B).
2.2. Cell Culture and Differentiation
The Catholic Institute of Cell Therapy (Seoul, Korea) provided the Human bone marrow-derived mesenchymal stem cells (hBMSCs, Catholic MASTER Cells) that were used in this study. The hBMSCs were cultured in DMEM supplemented with 20% fetal bovine serum and 1% penicillin-streptomycin, in a 5% CO2 atmosphere at 37°C. To induce neuronal differentiation, the cells were grown in neuronal induction medium made up of neurobasal media, FBS (2%), 50μM forskolin, epidermal growth factor, basic fibroblast growth factor, laminin, brain-derived neurotrophic factor, and penicillin-streptomycin. The differentiation medium was exchanged every 2 days up to 21 days.
2.3. Cell Adhesion and Proliferation on FN and hFDM Patch
PVA/hFDM hydrogel membranes with ECM facing upwards were placed in 12-well plates, and hBMSCs(2x10⁴) were seeded onto each substrate. Cell proliferation and viability were assessed using a Cell Counting Kit-8 (CCK-8; Dojindo) assay and live/dead viability assay kit (Invitrogen Life Technologies; Thermo Fisher Scientific, Inc., Waltham, MA), respectively, 7 days after seeding. To perform the CCK-8 assay, 100µL aliquots were taken from each sample and added to a 96-well plate. The plate was then incubated with 10% CCK-8 solution at 37°C for 2hours, and the absorbance of each well was measured at 450nm.
2.4. Immunocytochemistry
After neuronal differentiation induction, cells were fixed with 4% paraformaldehyde for 20min, and then permeabilized in 0.5% Triton X-100 for 10min. The cells were blocked by incubation with bovine serum albumin (5%,1hour), and then incubated overnight with primary anti-neuron-specific β-tubulin III (diluted 1:200, ab78078; Abcam). Samples were incubated for 2 hours with a secondary antibody (Alexa 488-conjugated goat anti-mouse) following washing. Confocal microscopy (LSM 800w/Airyscan; Carl Zeiss Inc.) was utilized
2.5. Quantitative Reverse Transcription-PCR (qRT-PCR)
Total RNA was extracted from differentiated cells using TRIzol® reagent (Invitrogen Life Technologies; Thermo Fisher Scientific, Waltham, MA) following the manufacturer’s protocol. Total RNA (1µg) was reverse transcribed to cDNA using the a PrimeScriptTM RT reagent Kit (Takara Bio, Shiga, Japan) and The TB Green™ Premix Ex Taq™ II (Takara Bio, Shiga, Japan) was used for PCR amplification. The qRT-PCR was conducted with the following primers: Nestin, 5′-CCAGTTCTGCTCCTCTCCAG-3′(forward) and 5′-GCCCACAGATTCCTCTTCTG-3′(reverse); β-tubulin III, sense 5′-ATGGGATGGGTGTTCCTACA-3′(forward) and 5′-GTCTTAGAGAGGGCGACGTG-3′ (reverse); GFAP, 5′-CAACCACCCTCTTCACCACT-3′(forward) and 5′-GATCTTCTGGGGTGGTCTCA-3′(reverse); Glyceraldehyde 3-phosphate dehydrogenase (GAPDH), 5′-CAAGAACCCCAAGGACAAGA-3′(forward) and 5′-GAATCCATCGGTCATGCTCT-3′(reverse). Relative gene expression levels were determined using the 2−ΔΔCT method and normalized to GAPDH, which served as an internal control.
2.6. Animal Experiments
Sprague-Dawley rats (8 weeks old) were obtained from a commercial vendor (Orient Bio, Seoul, Korea). Rats were randomly divided into five groups (n=5 per group): an age matched normal control (Normal), BCNI, hBMSC (5x10⁵), hBMSC (1x10⁵) seeded on the hFDM (hFDM / hBMSC(1x10⁵)), and hBMSC (5x10⁵) seeded on the hFDM (hFDM / hBMSC (5x10⁵)) group. Rats were given a combination of Zoletil 50 (15mg/kg, Virbac Laboratories, Carros, France) and Xylazine Hydrochlorid (5mg/kg, Bayer, Seoul, Korea) for anesthesia. The BCNI rat model was used, which involved making a inferior midline incision to access from bladder to prostate and compressing the bilateral cavernous nerves for 2minutes with a hemostat. To track the hBMSCs, they were labeled with red fluorescent dye PKH-67 (PKH-67 fluorescent cell linker kits; Sigma-Aldrich). 200µL of hBMSCs (5x10⁵ cells) were then injected around each injured cavernous nerve in the hBMSC groups. Figure 1C illustrates the surgical application of a 10mm patch to the MPG.
2.7. Erectile Function Measurement
The After a 4-week period, intracavernosal pressure (ICP) / mean arterial pressure (MAP) was measured to assess erectile function. To measure ICP, a 23-gauge butterfly needle containing heparin solution (250U/mL) was inserted into the proximal corpus cavernosum and connected to a pressure transducer. Then, the MPG was stimulated with a bipolar stainless-steel electrical stimulator for 50 seconds (10V, 2.4mA, 3.5ms pulse). During nerve electrostimulation, a force transducer was used to measure the maximal peak of ICP. The recorded data was acquired by a data acquisition system (Power Lab; AD Instruments, Dunedin, New Zealand).
The measurement of MAP was taken by inserting PE-50 tubing (BD Intramedic, Franklin Lakes, NJ) into the carotid artery. Half of each penis was fixed in paraformaldehyde (4%) and embedded within paraffin wax, the other half was preserved at -70°C.
2.8. Immunohistochemistry
For in vivo cell tracking, paraffin-embedded cavernous nerve sections were immunostained with the following primary antibodies: cell nuclei (DAPI; Vector Laboratories, Burlingame, CA) and anti-β-tubulin III. The penile tissue was sectioned to a thickness of 4μm for staining with Masson trichrome for smooth muscle and collagen. The paraffin sections were used for immunostaining analysis, and the following primary antibodies were applied: anti-neuronal nitric oxide synthase (nNOS, diluted 1:100, ab76067; Abcam), anti-β-tubulin III, anti-α-smooth muscle actin (α-SMA, diluted 1:250, ab5694; Abcam), anti-endothelial nitric oxide synthase (eNOS, diluted 1:100, ab5589; Abcam), anti-CD31 (diluted 1:50, ab28364; Abcam), and DAPI. Using a microscope (Zeiss, LSM 510 Meta Confocal, Germany), fluorescent images were captured, and the mean fluorescent intensity was analyzed using ZEN2012 software (Zeiss, Germany). An optical microscope (Olympus, BX50) was used to obtain digital images, and GraphPad Prism v5 software (GraphPad Prism Software, CA) was used to calculate the mean fluorescent intensity.
2.9. Measurement of Cyclic Guanosine Monophosphate (cGMP) Levels
Penile tissue (50mg) was homogenized with HCl (0.1M, 300mL) and silica beads (BioSpec Products, Inc., Guelph, Canada), and then centrifuged at 4°C and 12,000g for 10 minutes. The collected supernatant was used to measure cGMP levels with the cGMP Direct Immunoassay Kit (K372-100; BioVision, Canada).
2.10. Statistical Analyses
The statistical analysis was performed using GraphPad Prism v5 and the results were expressed as mean ± SD. One-way ANOVA was used to compare the differences between groups, followed by Tukey’s post-hoc test. A p-value of less than 0.05 was considered statistically significant.
3. Results
3.1. Characterization of PVA/hFDM
Figure 1A illustrates the method for incorporating PVA hydrogel with hFDM. The hFDM is prepared using a previously reported method [22,23,24], and the presence of the ECM fibrillar structure is confirmed through optical microscopy (Figure 1B). PVA solution is then added to the hFDM and freeze-thaw induced physical cross-linked of the hydrogel [25]. A membrane of PVA/hFDM is then carefully removed from the plastic substrate using forceps, ensuring a secure coupling of hFDM with the PVA hydrogel.
3.2. Cell Viability and Cell Adhesion of hBMSC Seeded on Patch
The biological properties of hFDM/PVA patch were evaluated via cell viability and cell adhesion. hBMSCs were seeded on FN or hFDM-coated PVA and grown for 7days, followed by Live & Dead staining. As a result, hBMSC cells cultured on hFDM exhibited a higher percentage of viable cells, and they spread quite well with spindle like morphology compared to the control FN (Figure 2A). The cell viability rate was analyzed using the CCK-8 at 3,7days of growth. We found that cell growth was improved on hFDM, when compared with the FN both 3,7 days (Figure 2B). Furthermore, immunofluorescence staining showed that the ECM on the hFDM/PVA membrane showed a favorable integration with hBMSCs. (green: fibronectin, red: f-actin). These findings suggest that the interaction between ECM and cells is stronger in the hFDM group compared to the FN group (Figure 2C).
3.3. Cell Differentiation of hBMSC Seeded on Patch
To assess the effect of the hFDM patch on hBMSC neural differentiation, cells were seeded on either FN or hFDM-coated PVA and cultured for one to three weeks. Neural differentiation was evaluated by immunocytochemistry and qRT-PCR. The fluorescence microscope image (Figure 3A) demonstrates that hBMSCs cultured on hFDM-coated PVA exhibit greater expression of the neuronal marker β-tubulin III compared to those cultured on FN-coated PVA. Subsequently, mRNA expression level was confirmed using qRT-PCR to assess the effect of PVA on neural differentiation. Similar to the immunocytochemistry result, mRNA expression of β-tubulin III cultured on hFDM for 1week was higher than on the FN (Figure 3B). Moreover, it was increased significantly at seeded on hFDM for 3weeks compared to FN. GFAP (glial marker) expression was also higher on the hFDM than FN. On the other hand, the level of nestin (neural stem cell marker) was decreased at 3weeks compare to 1week, and was significantly decreased cultured on hFDM than the FN. Our results demonstrate that the hFDM induces differentiation of neural stem cells.
3.4. hBMSC Seeded on Patch Improves Erectile Function
To investigate the potential of the patch to treat ED in the BCNI rat model, hBMSC seeded on patch were attached to the injured cavernous nerve (Figure 4A). A representative ICP curves and ICP/MAP ratios for all groups were shown in Figure 4B,C. The ICP/MAP ratios of all hBMSC groups, including the hBMSC (5×10⁵), hFDM/hBMSC (1×10⁵) and hFDM/hBMSC (5×10⁵) groups was significantly higher when compared to the BCNI group. The ICP/MAP ratios in the hBMSC (5×10⁵) and hFDM/hBMSC (1×10⁵) group were similarly increased despite the lower cell seeding density of hFDM/hBMSC (1×10⁵) group. Moreover, the ICP/MAP ratio was significantly increased in the hFDM/hBMSC (5×10⁵) group compared to the hBMSC-only group when seeded at the same density. These results indicate that the patch could effectively improve erectile function compared to hBMSC cells alone.
To confirm hBMSC survival, we were investigated PKH-67 labeled hBMSCs. PKH-67 labeled hBMSC (red) were localized around the cavernous nerve injury site in all hBMSC groups, including the hBMSC (5×10⁵), hFDM/hBMSC (1×10⁵) and hFDM/hBMSC (5×10⁵) groups (Figure 5).
3.5. hBMSCs Seeded in the Patch Increases Smooth Muscle Cells in the Corpus Cavernosum
Figure 6A,B shows the representative images of smooth muscle in the corpus cavernosum, which were obtained through Masson’s trichrome staining to evaluate its association with erectile dysfunction. Compared to the normal group, the BCNI group caused penile fibrosis in the corpus cavernosum, which is demonstrated by a decrease in smooth muscle content(red) and an increase in collagen content(blue). On the other hand, the hBMSC (5×10⁵) and hFDM/hBMSC (1×10⁵) groups showed an increase in the SMA/collagen ratio, whereas it was reduced in the BCNI group.
Surprisingly, the hFDM / hBMSC (5×10⁵) group was significantly increased SMA/collagen ratio compared to the respective expression levels of the hBMSC (5×10⁵) and hFDM / hBMSC (1×10⁵) groups. Additionally, the level of α-SMA, a smooth muscle cell marker, was determined by immunohistochemical staining in the corpus cavernosum. Consistent with the previous results, expression of α-SMA in the hBMSC (5×10⁵) and hFDM / hBMSC (1×10⁵) groups were higher than in the BCNI group, and α-SMA in the hFDM / hBMSC (5×10⁵) group was notably increased compare to the hBMSC (5×10⁵) and hFDM / hBMSC (1×10⁵) groups (Figure 6C,D). These results mean that the patch was improved erectile function by increasing smooth muscle cells.
3.6. hBMSCs Seeded in the Patch Restores Nitric Oxide (NO)/cGMP Signaling Pathway
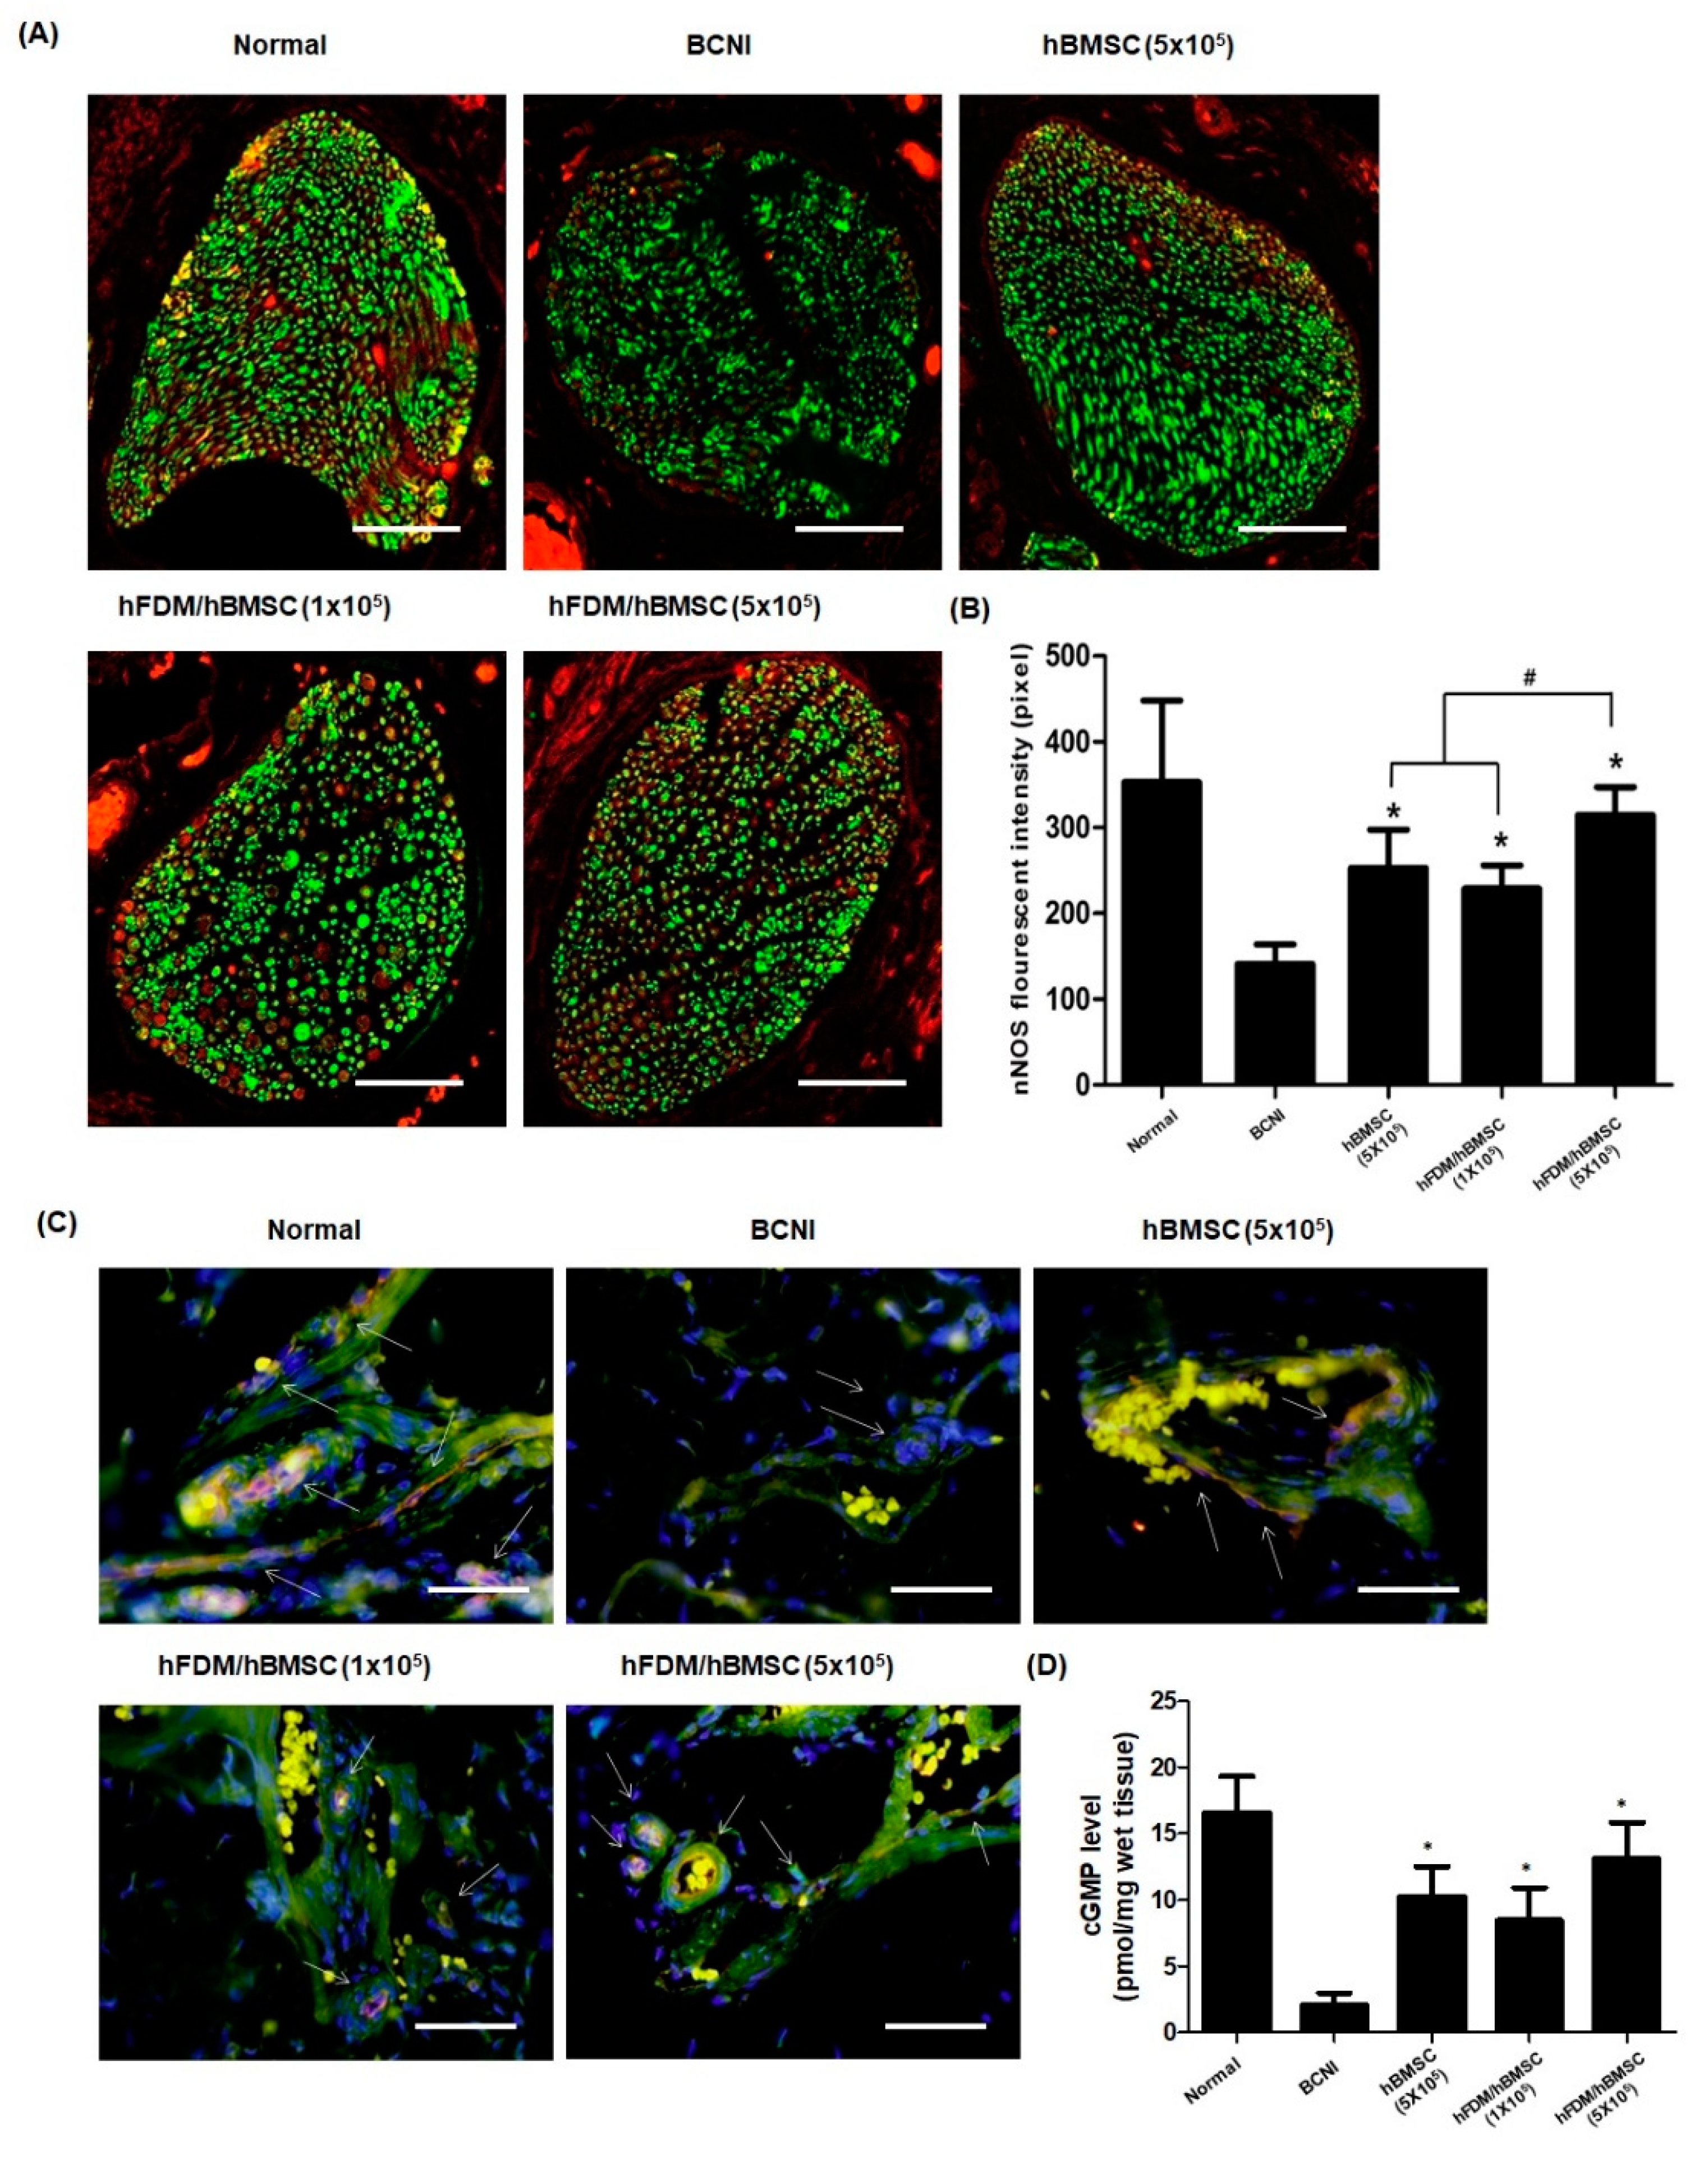
The nNOS and eNOS are two most factors that produce NO. As shown in Figure 7A, nNOS expression(red) was decreased after nerve injury when compared to the normal group. However, nNOS in the hBMSC (5×10⁵) and hFDM / hBMSC (1×10⁵) groups was showed higher expression than in the BCNI group, and the nNOS levels were significantly higher in the hFDM / hBMSC (5×10⁵) group than in the other two groups (Figure 7B). Next, we performed immunohistochemical staining for eNOS and CD31 (endothelial marker) to evaluate the eNOS expression and endothelial cell in corpus cavernosum. The hBMSC (5×10⁵), hFDM / hBMSC (1×10⁵), and hFDM/hBMSC (5×10⁵) groups showed increased expression of eNOS(red) compared to the BCNI group, as depicted in Figure 7C. Furthermore, cGMP levels in the corpus cavernosum, as measured using the cGMP Direct Immunoassay Kit, were significantly higher in the hBMSC (5×10⁵), hFDM / hBMSC(1×10⁵), and hFDM / hBMSC(5×10⁵) groups compared to the BCBI group (Figure 7D). These results indicate that the patch enhances the NO/cGMP pathway, thereby improving erectile function.
4. Discussion
Authors The clinical challenges of regenerating and repairing cavernous nerve after RP have not yet been successfully addressed. Yiou et al. [10] conducted a clinical trial evaluating the efficacy of MSCs obtained from the iliac crest and injected in the cavernosum of the penis, but not directly into the cavernous nerve injury site. This study found that MSC injection improved erectile function after one-year follow-up, providing a promising outcome. According to Liang et al. [26], one of the main challenges in using MSCs for treatment is that the transplanted cells may not effectively reach and function at the targeted area. Many other studies [10,27,28] have used cavernosum injection as a method of delivering MSCs, but, this approach is associated with the potential risk of MSCs migrating into the circulatory system and failing to accumulate in adequate concentrations at the targeted injury site, resulting in suboptimal therapeutic effects [29,30]. Therefore, it is more advantageous to directly deliver MSCs to the cavernous nerve where the actual injury site and where the delivered MSCs can differentiate into neural cells.
In this study, we assessed the effects of MSCs in vitro and in vivo using a patch layered on a PVA hydrogel surface. The patch, which combines MSCs and CDM, provides physical, topographical, and chemical signals for cell attachment and proliferation through protein synthesis. The matrix-derived collagen, fibronectin, laminin, and other biomaterial components create a chemical microenvironment that favors the differentiation of specific cells [31]. And, we combined MSCs and CDM with a patch and attached the site of cavernosal nerve injury. The high-density MSC injection group with the patch exhibited the most significant improvement in erectile function, which could be attributed to enhanced mechanical stability and cell retention. Our results suggest that the patch may augment the effects of MSC transplantation for nerve injury repair.
However, the European Society for Sexual Medicine stated that stem cells may accelerate the recovery process, instead of increasing the overall recovery rate [32]. Many studies evaluated the recovery of erectile function just 4-12weeks after nerve injury, disregarding the natural improvement in erectile function, which can take several months after BNCI. Moreover, most studies used young rats without comorbidities, whereas prostate cancer patients are generally older and may have other comorbidities that could affect recovery rates after RP.
A recent study by Castiglione et al. [33] investigated the long-term effects of BNCI rats with type 1 diabetes and found that, unlike healthy rats, diabetic rats did not show natural recovery of erectile function at 4months after BNCI. While Zhang et al. [30] suggested that stem cell injection is effective in treating diabetes-induced ED in a rat model. This study revealed that adipose-derived stem cells have therapeutic potential for improving ED by differentiating into smooth muscle-like cells.
The effect of neuronal differentiation of MSCs transplanted into the patch for nerve injury repair remains unclear, but the use of a mechanically stable patch has shown promise in enhancing MSC biologic function and improving erectile function. Further research is needed to validate these findings.
5. Conclusions
In conclusion, the novel patch was made by combining hFDM with PVA to create a mechanically robust and biocompatible. In vitro analysis showed hFDM promoted neurogenesis, and in vivo analysis showed it improved angiogenesis and sexual function. The PVA/hFDM patch shows potential for nerve regeneration as a promising approach for post prostatectomy ED.
Author Contributions
Conceptualization and design; LJY, PKD. Data analysis and interpretation; KIG, KMY, JAR, MHW. Statistical analysis; JAR, KMY, MHW. Drafting the manuscript; MHW, KMY. Critical revision of the manuscript for scientific and factual context; KMY, KIG, LJY. Supervision; LJY, PKD. The author(s) read and approved the final manuscript.
Funding
This work was supported by the National Research Foundation of Korea (NRF) grant funded by the Korea government (MSIT). (No. NRF-2019R1A2C2086549). And this research was partly supported by the Korean Fund for Regenerative Medicine (KFRM) grant (KFRM21A0102L1-11) funded by the Ministry of Science and ICT, Republic of Korea.
Institutional Review Board Statement
The animal study protocol was approved by the Institutional Animal Care and Use Committee of The Catholic university of Korea (2019-0277-07).
Informed Consent Statement
Not applicable.
Data Availability Statement
Not applicable.
Conflicts of Interest
The authors declare no conflict of interest.
References
- Walsh PC, Donker PJ. Impotence following radical prostatectomy: insight into etiology and prevention. J Urol 1982;128:492-7. [CrossRef]
- Nguyen LN, Head L, Witiuk K, Punjani N, Mallick R, Cnossen S, et al. The Risks and Benefits of Cavernous Neurovascular Bundle Sparing during Radical Prostatectomy: A Systematic Review and Meta-Analysis. J Urol 2017;198:760-9. [CrossRef]
- Kilminster S, Müller S, Menon M, Joseph JV, Ralph DJ, Patel HR. Predicting erectile function outcome in men after radical prostatectomy for prostate cancer. BJU Int 2012;110:422-6. [CrossRef]
- Matz EL, Terlecki R, Zhang Y, Jackson J, Atala A. Stem Cell Therapy for Erectile Dysfunction. Sex Med Rev 2019;7:321-8. [CrossRef]
- Patel VR, Samavedi S, Bates AS, Kumar A, Coelho R, Rocco B, et al. Dehydrated Human Amnion/Chorion Membrane Allograft Nerve Wrap Around the Prostatic Neurovascular Bundle Accelerates Early Return to Continence and Potency Following Robot-assisted Radical Prostatectomy: Propensity Score-matched Analysis. Eur Urol 2015;67:977-80. [CrossRef]
- Bunpetch V, Wu H, Zhang S, Ouyang H. From “Bench to Bedside”: Current Advancement on Large-Scale Production of Mesenchymal Stem Cells. Stem Cells Dev 2017;26:1662-73. [CrossRef]
- Uccelli A, Moretta L, Pistoia V. Mesenchymal stem cells in health and disease. Nat Rev Immunol 2008;8:726-36. [CrossRef]
- Reinders MEJ, de Fijter JW, Roelofs H, Bajema IM, de Vries DK, Schaapherder AF, et al. Autologous bone marrow-derived mesenchymal stromal cells for the treatment of allograft rejection after renal transplantation: results of a phase I study. Stem Cells Transl Med 2013;2:107-11. [CrossRef]
- Fode M, Nadler N, Lund L, Azawi N. Feasibility of minimally invasive, same-day injection of autologous adipose-derived stem cells in the treatment of erectile dysfunction. Scand J Urol 2022:1-5. [CrossRef]
- Yiou R, Hamidou L, Birebent B, Bitari D, Lecorvoisier P, Contremoulins I, et al. Safety of Intracavernous Bone Marrow-Mononuclear Cells for Postradical Prostatectomy Erectile Dysfunction: An Open Dose-Escalation Pilot Study. Eur Urol 2016;69:988-91. [CrossRef]
- Castiglione F, Cakir OO, Satchi M, Fallara G, Pang KH, European Society for Sexual Medicine Scientific Collaboration and Partnership. The Current Role and Implications of Stem Cell Therapy in Erectile Dysfunction: A Transformation from Caterpillar to Butterfly Is Required. Eur Urol Focus 2023;9:28-31. [CrossRef]
- Siregar S, Novesar AR, Mustafa A. Application of Stem Cell in Human Erectile Dysfunction - A Systematic Review. Res Rep Urol 2022;14:379-88. [CrossRef]
- Kang J, Song Y, Zhang Z, Wang S, Lu Y, Liu X. Identification of Key microRNAs in Diabetes Mellitus Erectile Dysfunction Rats with Stem Cell Therapy by Bioinformatic Analysis of Deep Sequencing Data. World J Mens Health 2022;40:663-77. [CrossRef]
- You D, Jang MJ, Lee J, Suh N, Jeong IG, Sohn DW, et al. Comparative analysis of periprostatic implantation and intracavernosal injection of human adipose tissue-derived stem cells for erectile function recovery in a rat model of cavernous nerve injury. Prostate 2013;73:278-86. [CrossRef]
- Chen X, Yang Q, Xie Y, Deng C, Liu G, Zhang X. Comparative study of different transplantation methods of adipose tissue-derived stem cells in the treatment of erectile dysfunction caused by cavernous nerve injury. Andrologia 2021;53:e13950. [CrossRef]
- Gur S, Hellstrom WJG. Harnessing Stem Cell Potential for the Treatment of Erectile Function in Men with Diabetes Mellitus: From Preclinical/Clinical Perspectives to Penile Tissue Engineering. Curr Stem Cell Res Ther 2020;15:308-20.
- Lau LW, Cua R, Keough MB, Haylock-Jacobs S, Yong VW. Pathophysiology of the brain extracellular matrix: a new target for remyelination. Nat Rev Neurosci 2013;14:722-9. [CrossRef]
- Yang L, Wei M, Xing B, Zhang C. Extracellular matrix and synapse formation. Biosci Rep 2023;43:BSR20212411. [CrossRef]
- Jung AR, Kim RY, Kim HW, Shrestha KR, Jeon SH, Cha KJ, et al. Nanoengineered Polystyrene Surfaces with Nanopore Array Pattern Alters Cytoskeleton Organization and Enhances Induction of Neural Differentiation of Human Adipose-Derived Stem Cells. Tissue Eng Part A 2015;21:2115-24. [CrossRef]
- Subramanian A, Krishnan UM, Sethuraman S. Development of biomaterial scaffold for nerve tissue engineering: Biomaterial mediated neural regeneration. J Biomed Sci 2009;16:108. [CrossRef]
- Kim IG, Hwang MP, Park JS, Kim SH, Kim JH, Kang HJ, et al. Stretchable ECM Patch Enhances Stem Cell Delivery for Post-MI Cardiovascular Repair. Adv Healthc Mater 2019;8:e1900593. [CrossRef]
- Suhaeri M, Noh MH, Moon JH, Kim IG, Oh SJ, Ha SS, et al. Novel skin patch combining human fibroblast-derived matrix and ciprofloxacin for infected wound healing. Theranostics 2018;8:5025-38. [CrossRef]
- Ha SS, Song ES, Du P, Suhaeri M, Lee JH, Park K. Novel ECM Patch Combines Poly(vinyl alcohol), Human Fibroblast-Derived Matrix, and Mesenchymal Stem Cells for Advanced Wound Healing. ACS Biomater Sci Eng 2020;6:4266-75. [CrossRef]
- Suhaeri M, Subbiah R, Van SY, Du P, Kim IG, Lee K, et al. Cardiomyoblast (h9c2) differentiation on tunable extracellular matrix microenvironment. Tissue Eng Part A 2015;21:1940-51. [CrossRef]
- Lotfipour F, Alami-Milani M, Salatin S, Hadavi A, Jelvehgari M. Freeze-thaw-induced cross-linked PVA/chitosan for oxytetracycline-loaded wound dressing: the experimental design and optimization. Res Pharm Sci 2019;14:175-89. [CrossRef]
- Liang X, Huang X, Zhou Y, Jin R, Li Q. Mechanical Stretching Promotes Skin Tissue Regeneration via Enhancing Mesenchymal Stem Cell Homing and Transdifferentiation. Stem Cells Transl Med 2016;5:960-9. [CrossRef]
- Fandel TM, Albersen M, Lin G, Qiu X, Ning H, Banie L, et al. Recruitment of intracavernously injected adipose-derived stem cells to the major pelvic ganglion improves erectile function in a rat model of cavernous nerve injury. Eur Urol 2012;61:201-10. [CrossRef]
- Kim SG, You D, Kim K, Aum J, Kim YS, Jang MJ, et al. Therapeutic Effect of Human Mesenchymal Stem Cell-Conditioned Medium on Erectile Dysfunction. World J Mens Health 2022;40:653-62. [CrossRef]
- Lin H, Dhanani N, Tseng H, Souza GR, Wang G, Cao Y, et al. Nanoparticle Improved Stem Cell Therapy for Erectile Dysfunction in a Rat Model of Cavernous Nerve Injury. J Urol 2016;195:788-95. [CrossRef]
- Zhang HB, Chen FZ, He SH, Liang YB, Wang ZQ, Wang L, et al. In vivo tracking on longer retention of transplanted myocardin gene-modified adipose-derived stem cells to improve erectile dysfunction in diabetic rats. Stem Cell Res Ther 2019;10:208. [CrossRef]
- Singh P, Carraher C, Schwarzbauer JE. Assembly of fibronectin extracellular matrix. Annu Rev Cell Dev Biol 2010;26:397-419. [CrossRef]
- Weyne E, Ilg MM, Cakir OO, Muneer A, Roussel DB, Albersen M, et al. European Society for Sexual Medicine Consensus Statement on the Use of the Cavernous Nerve Injury Rodent Model to Study Postradical Prostatectomy Erectile Dysfunction. Sex Med 2020;8:327-37. [CrossRef]
- Castiglione F, Albersen M, Fiorenzo S, Hedlund P, Cakir OO, Pavone C, et al. Long-term consequences of bilateral cavernous crush injury in normal and diabetic rats: a functional study. Int J Impot Res 2022;34:781-5. [CrossRef]
Figure 1.
Fabrication of hFDM-loaded PVA/PEG gel. (A) Schematic illustration in fabricating hFDM-loaded PVA/PEG gel. (B) After physical stimulation, the nanofibrous structure on the surface of the hFDM/PVA membrane was confirmed through phase contrast images. Stamping image and microscopic image of hFDM/PVA gel. (C) Schematic diagram showing application of hBMSC attached to hFDM/PVA gel on injured CN. hFDM, human fibroblast-derived matrix; PVA, polyvinyl alcohol; PEG, polyethylene glycol; hBMSC, human bone marrow-derived mesenchymal stem cells; MPG, major pelvic ganglion; CN, cavernous nerve.
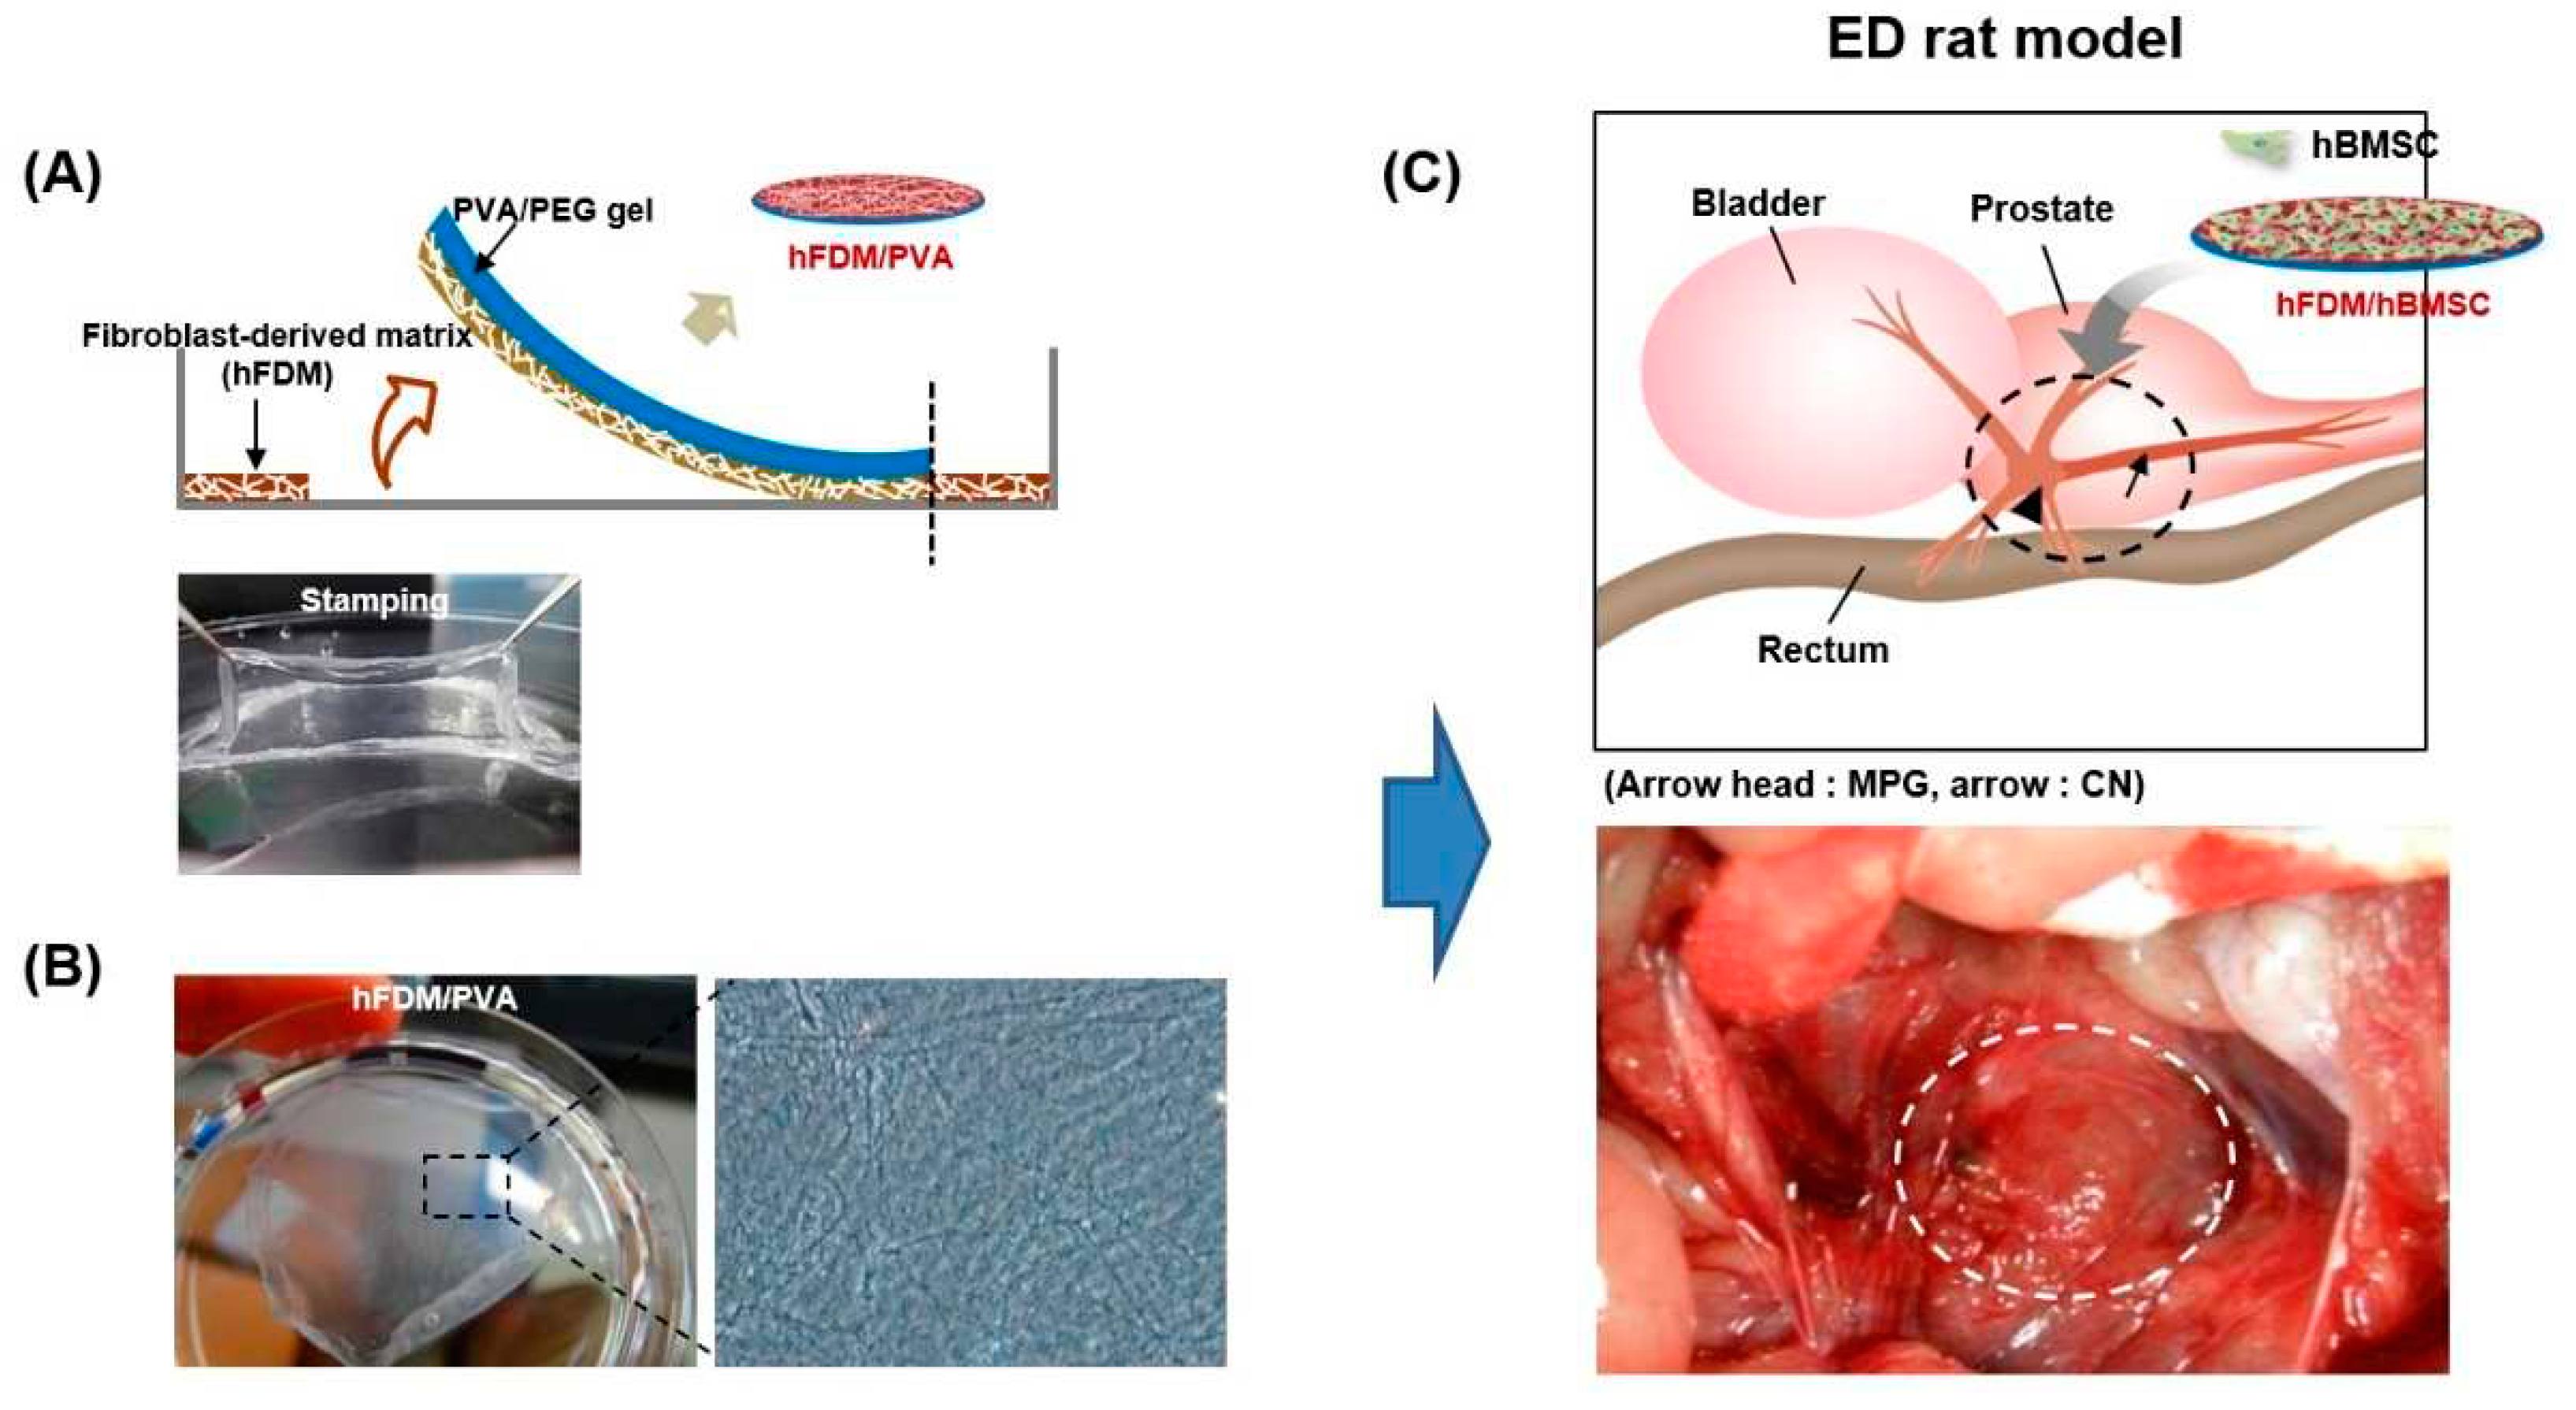
Figure 2.
Characterization of hFDM/PVA patch. (A) Cell viability of hBMSC after 7 days culture on each substrate was evaluated via live/dead assay. Live cells were stained green and dead cells were stained blue. Scale bars are 200 μm. The inserts are enlarged-images enlarged with the built-in enlarging feature in the software of the microscope. (B) Cell proliferation was determined by counting the number of cells after 3 or 7 day culture on each substrate. Data is means ± SD. *p < 0.05. (C) Immunofluorescence of fibronectin (green) and F-actin (red) in the FN/PVA and hFDM/PVA. hBMSCs were cultured on each substrate for 3 days, and cell adhesion were detected by immunofluorescence staining. Nuclei were counterstained with 4’,6-diamidino-2-phenylindole (DAPI) (blue). Scale bars are 50 μm.
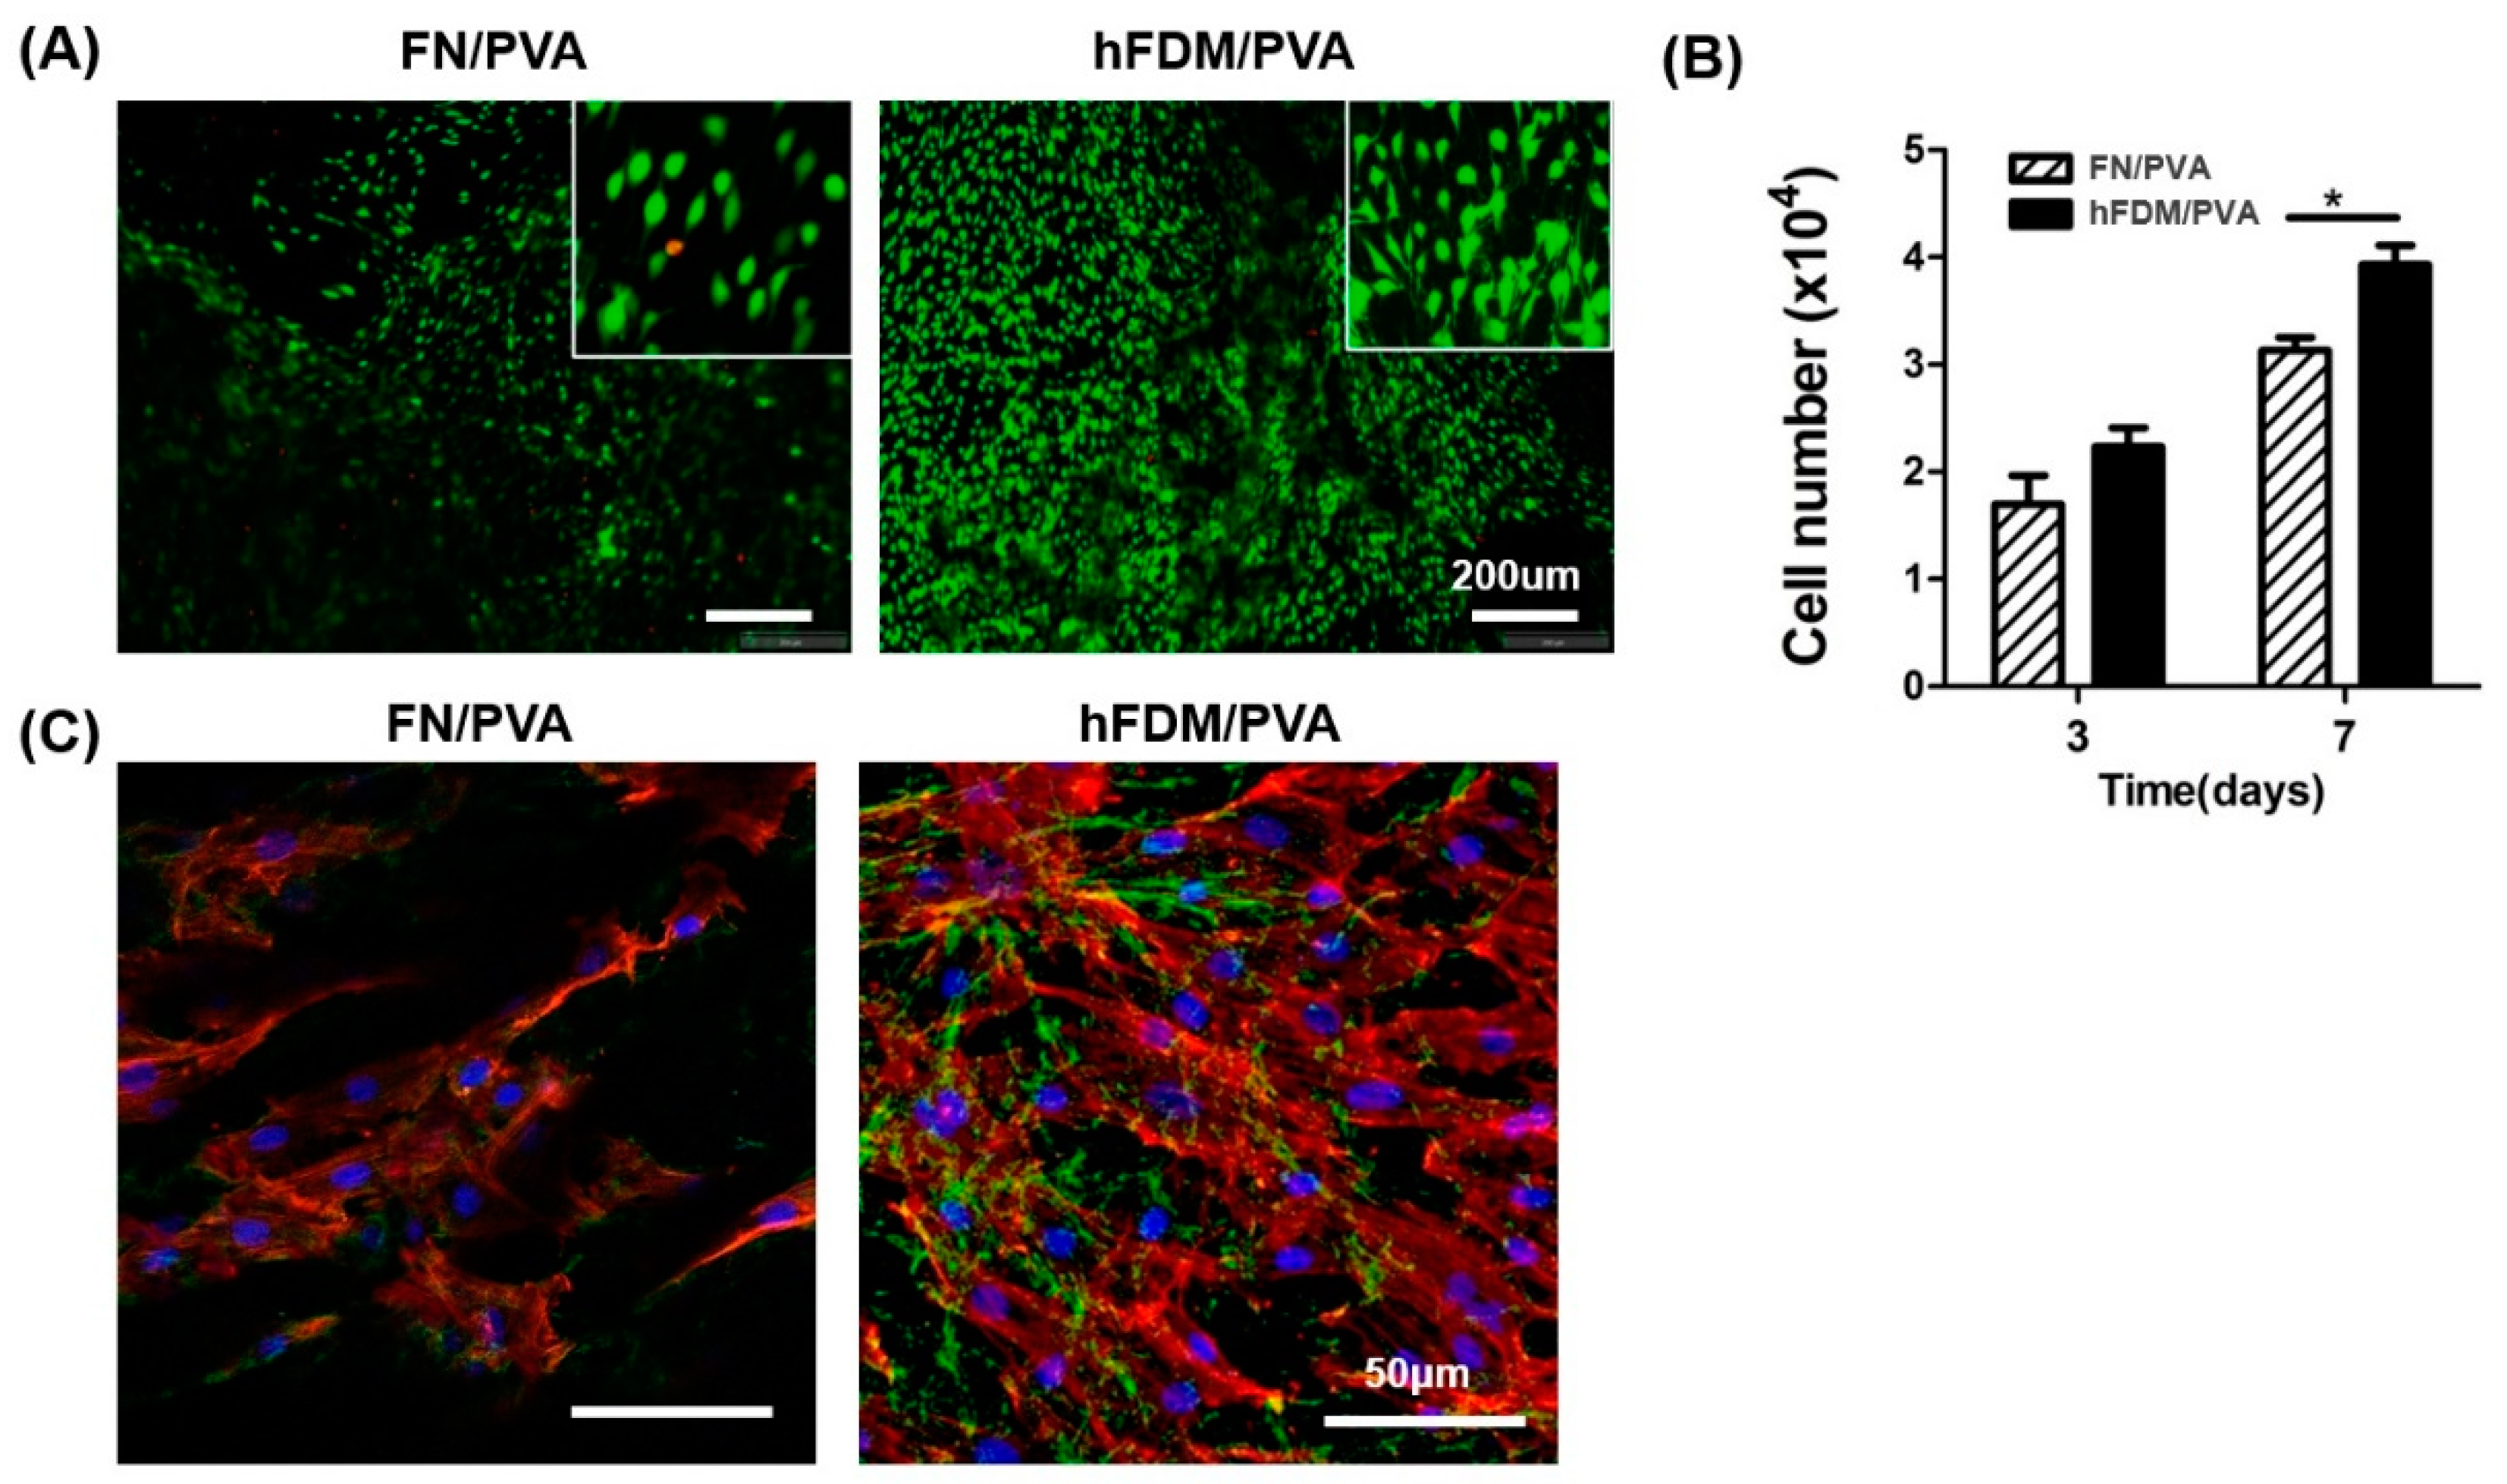
Figure 3.
Neuronal differentiation of hBMSCs seeded on hFDM/PVA patch. (A) The neural differentiation of hBMSCs was induced by growing cells of each substrate in neural induction medium for 1 week. Mature neurons were visualized with β-tubulin III (green), and the nuclei were visualized with 4’,6-diamidino-2-phenylindole (DAPI) (blue). Scale bar is 50 μm. (B) Expression of mRNA for nestin, GFAP, and β-tubulin III were quantified by qRT-PCR. GAPDH mRNA was used as an internal control to normalize the data. Data are means ± SD. *p < 0.05.
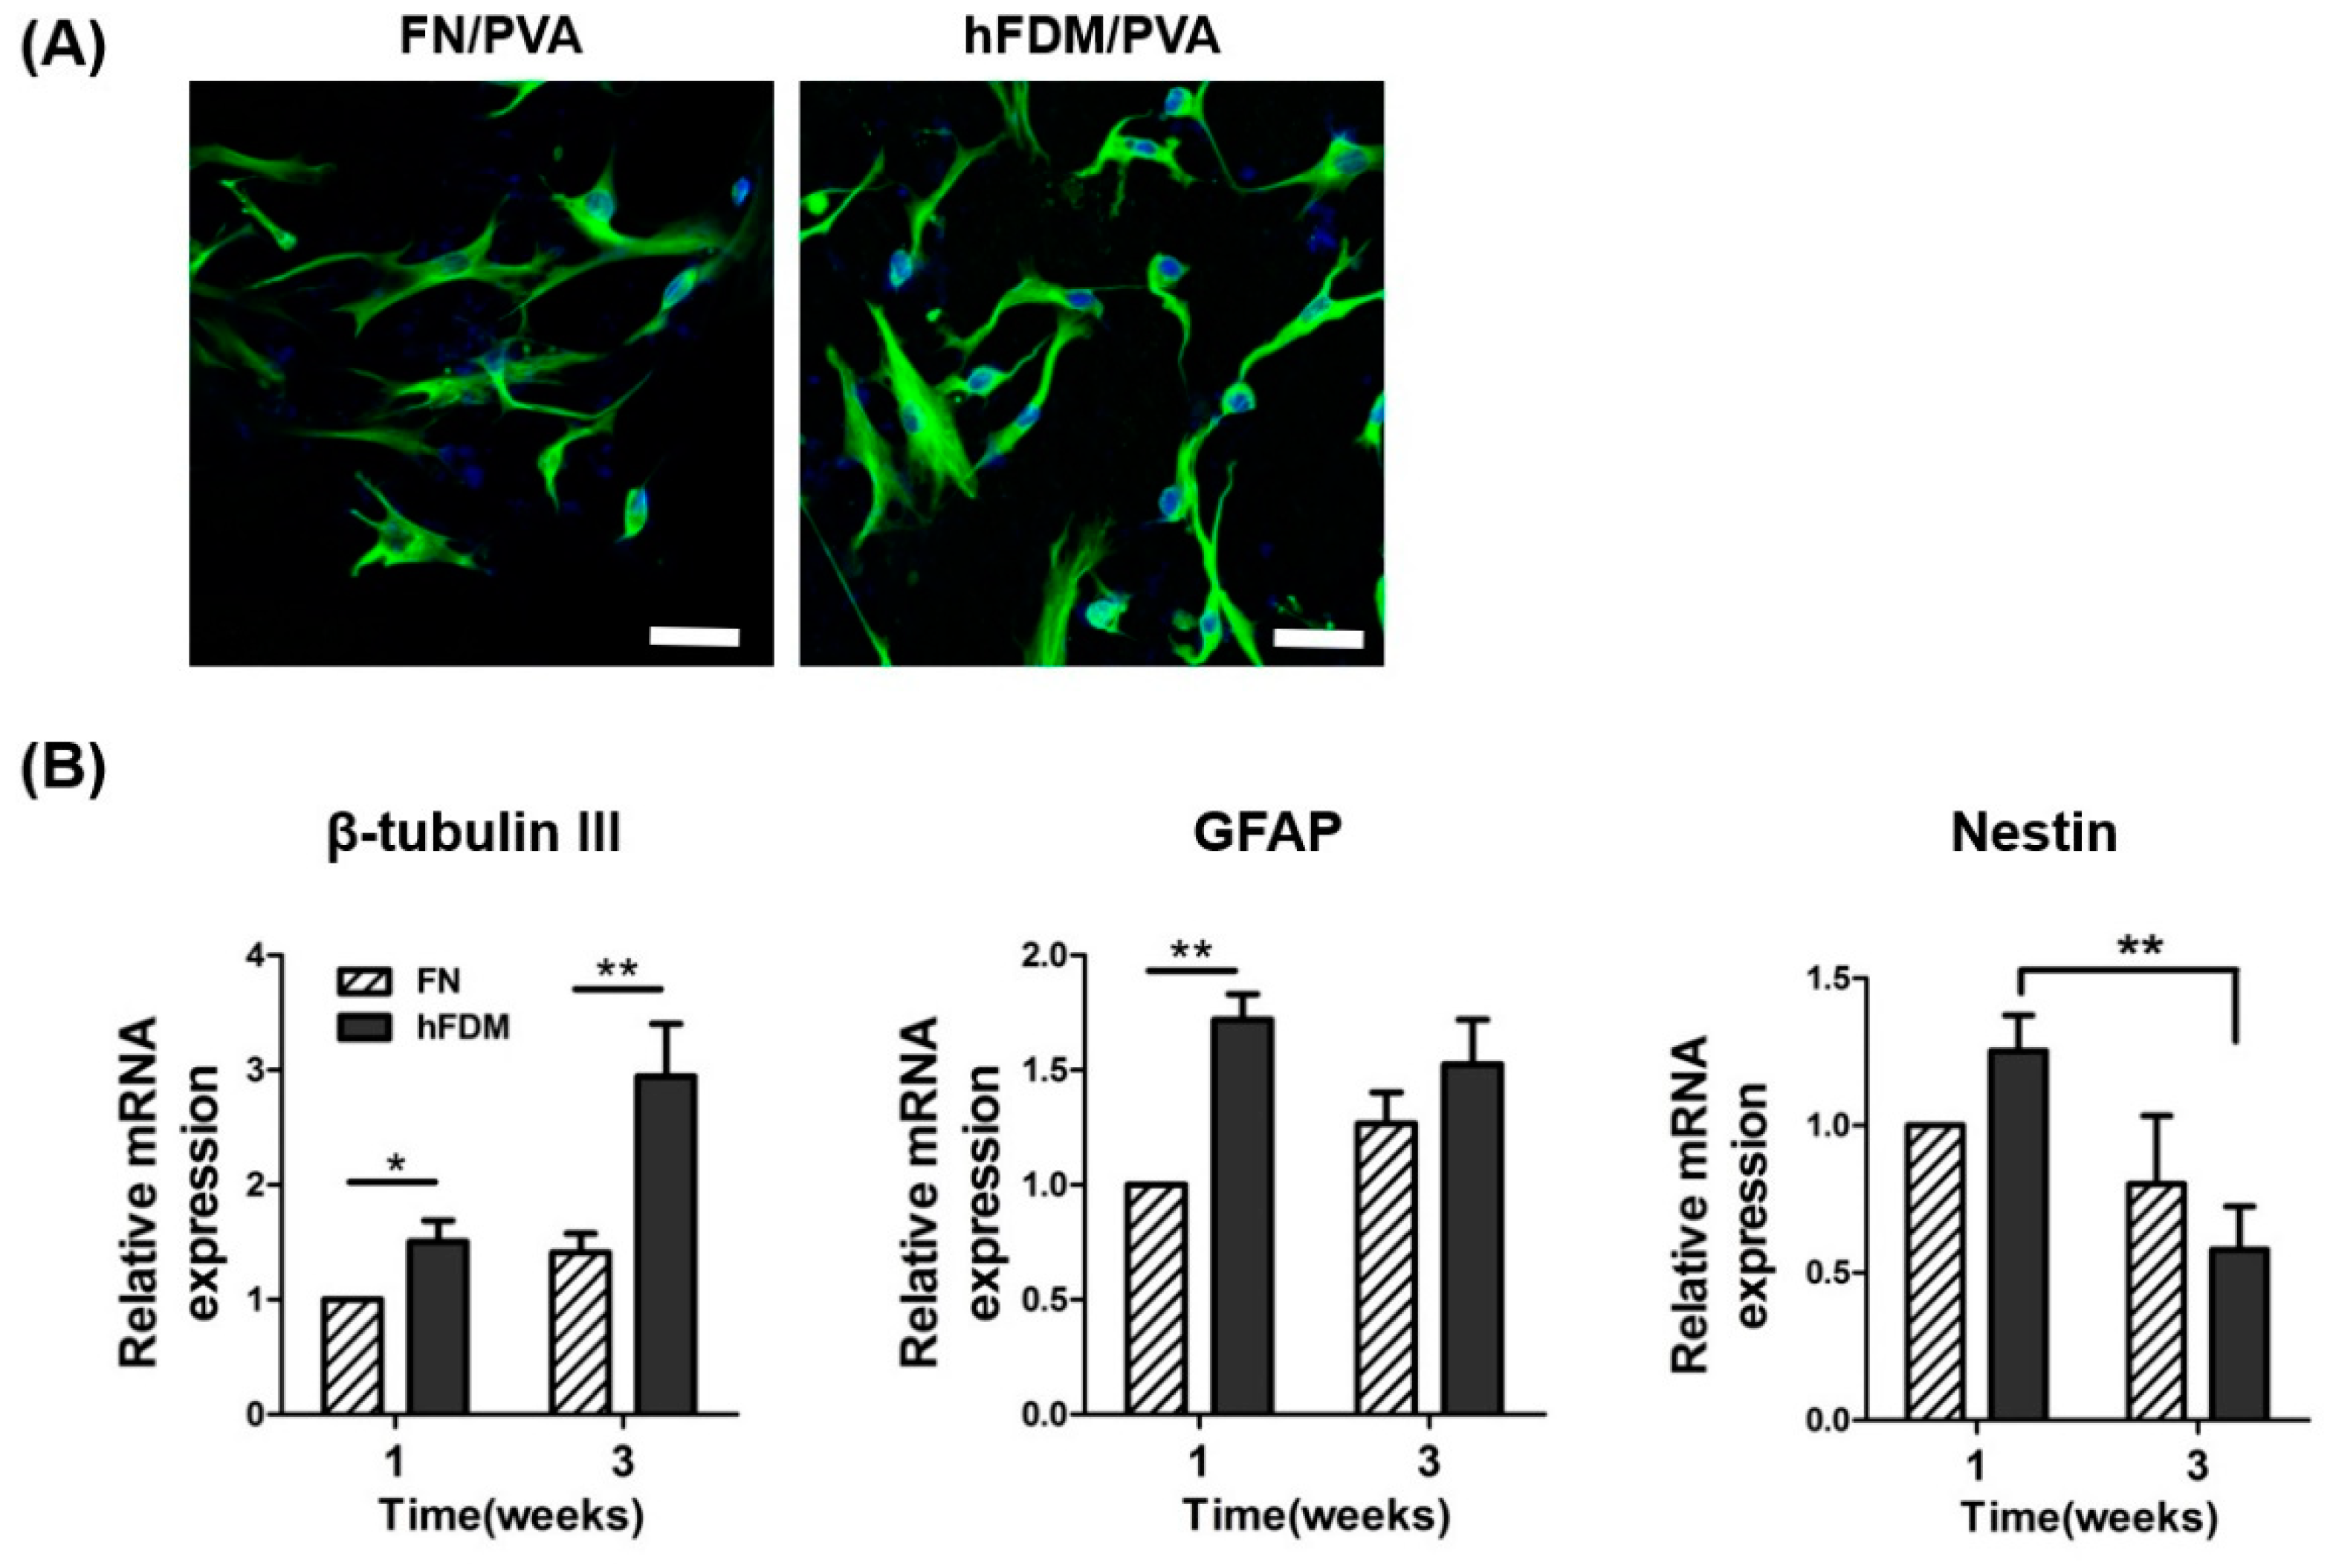
Figure 4.
Erectile function assessment of hFDA/PVA patch. (A) Representative image of the hFDM/hBMSC attachment to the injured CN in the BCNI model. (B) Representative ICP curves for the normal group, BCNI group, hBMSC (5×10⁵) group, hFDM/hBMSC (1×10⁵) group and hFDM/hBMSC (5×10⁵) group. ICP curve recorded in response to electrostimulation of the cavernous nerve for 40 s. (C) The bar graph shows the ratio of ICP to MAP. Each bar represents mean ± SD (n = 5 animals per group). *p < 0.05 compared with BCNI, #p < 0.05 compared with hBMSC (5×10⁵) or hFDM/hBMSC (1×10⁵). BCNI, bilateral cavernous nerve injury; ICP, intracavernosal pressure; MAP, mean arterial pressure.
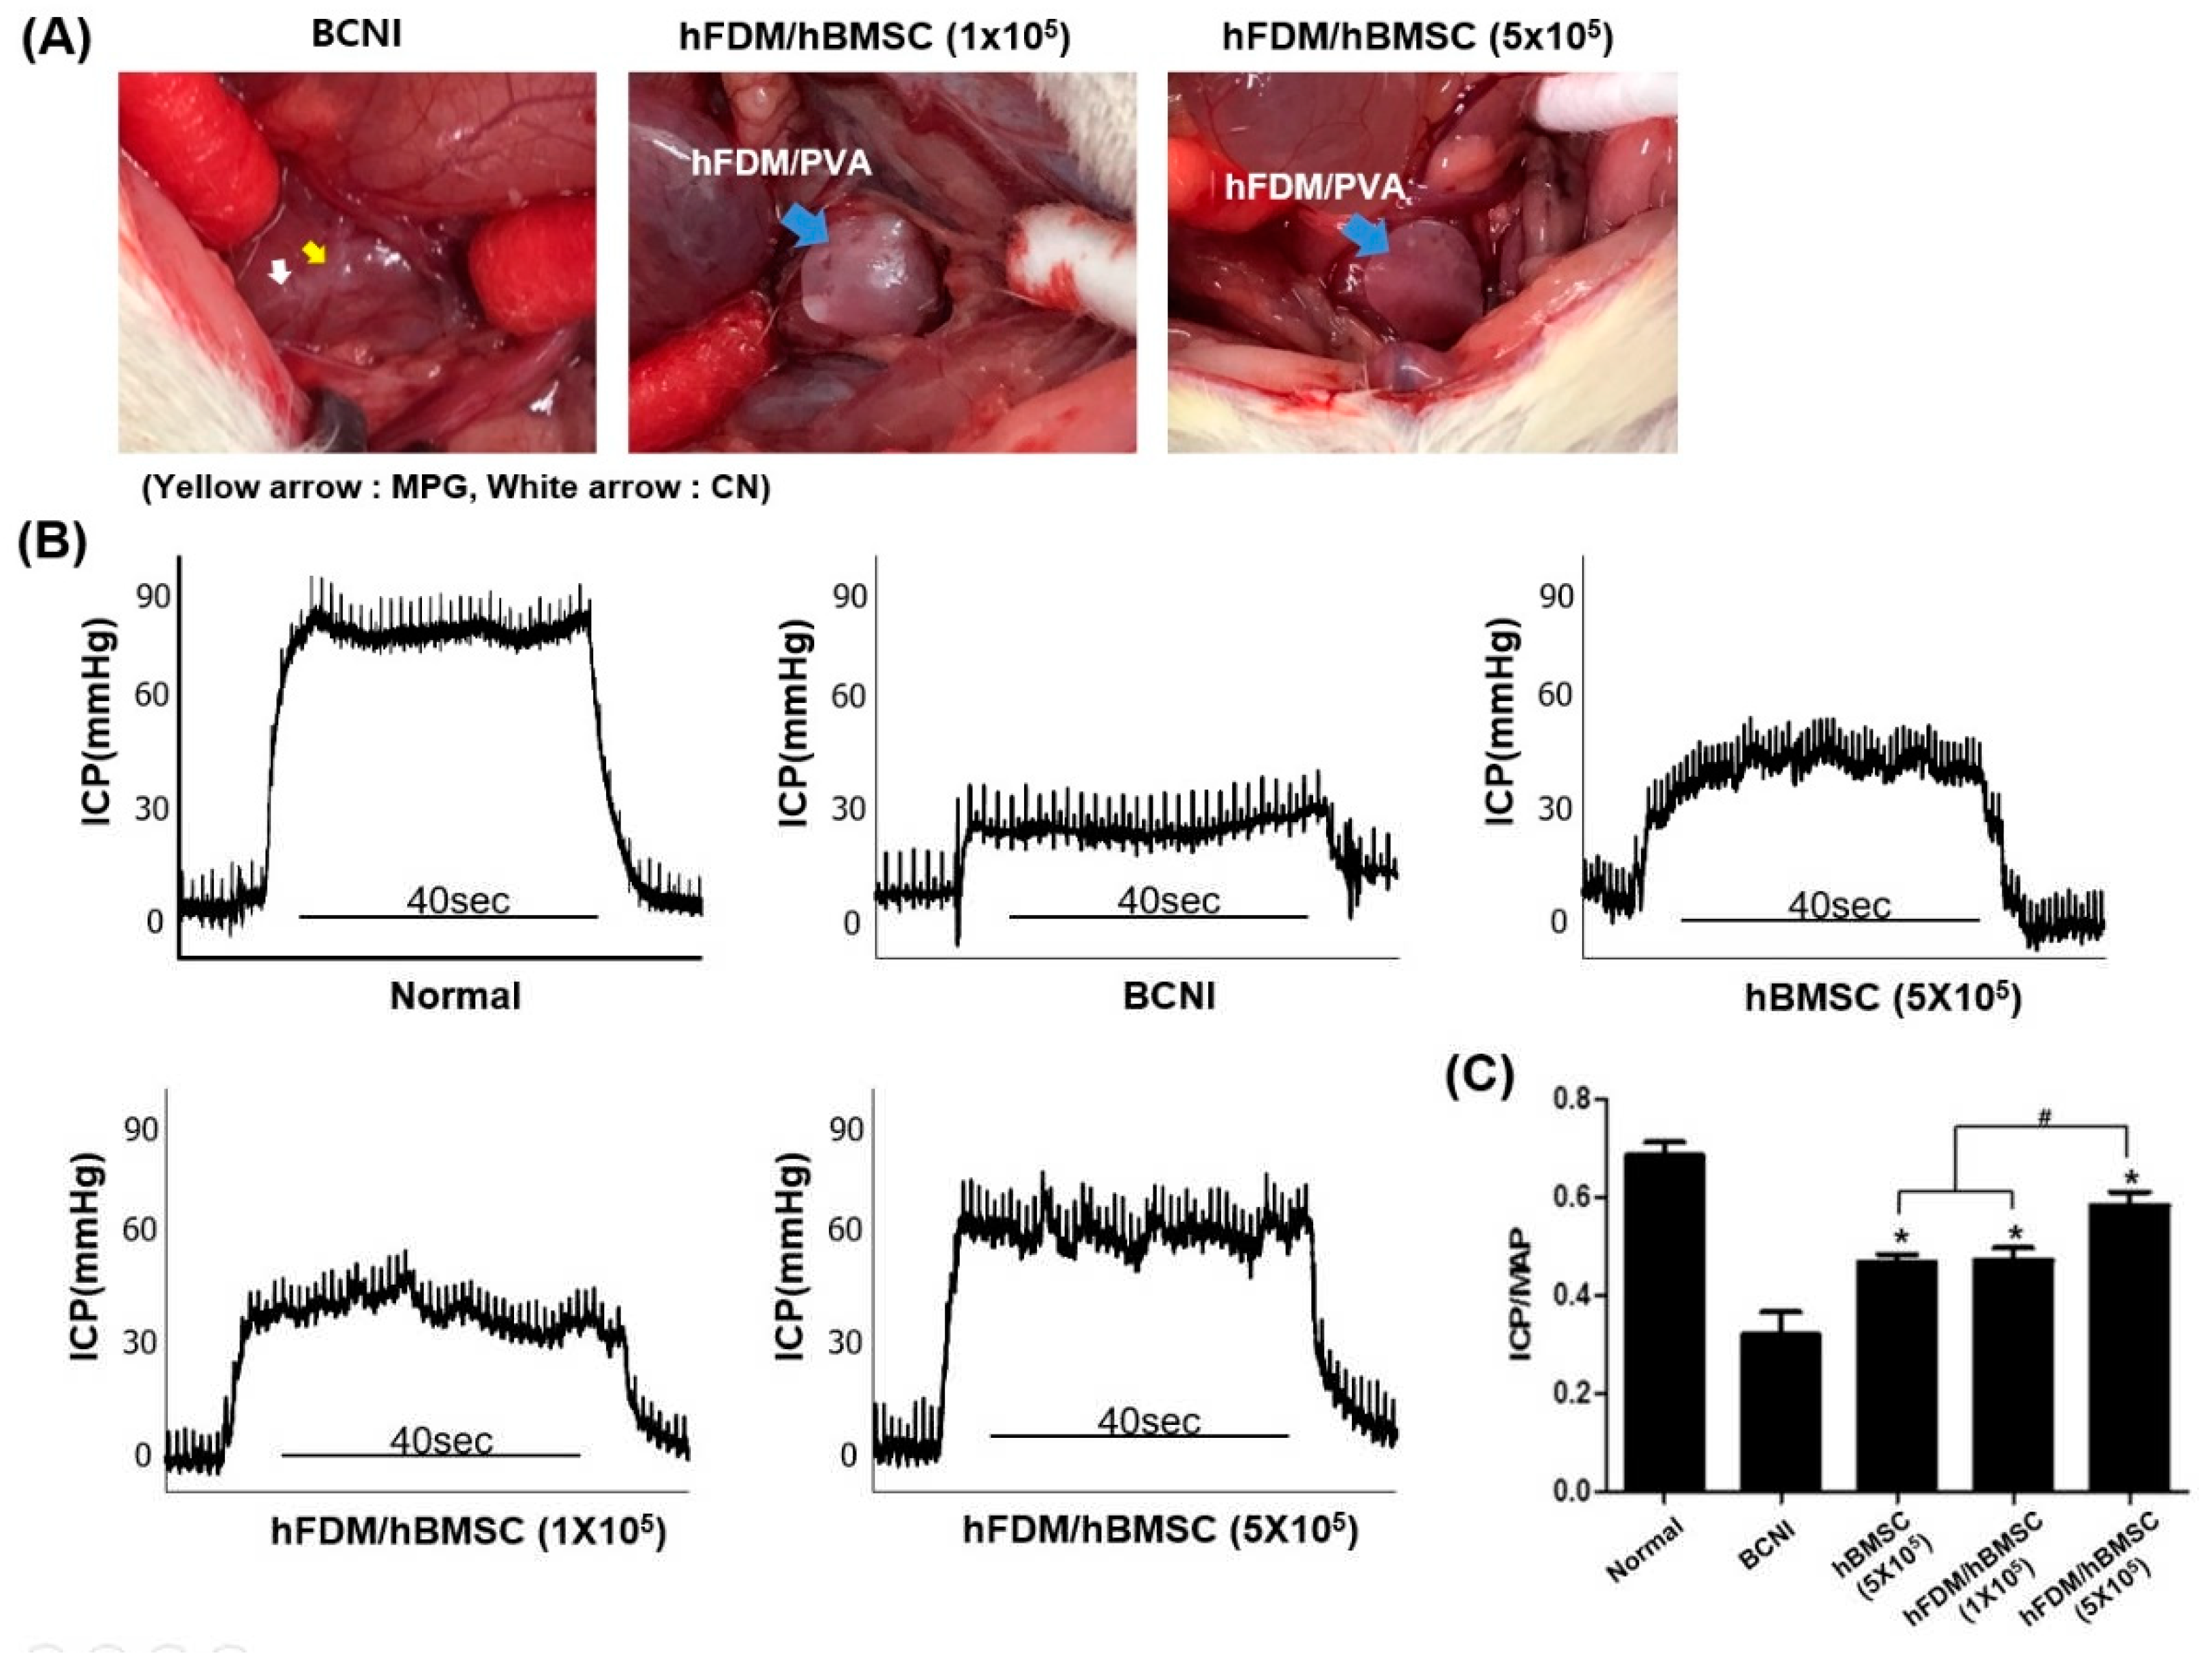
Figure 5.
In vivo tracking of PKH67-labeled hBMSCs seeded on hFDA / PVA patch in BCNI model. Cells were immunostained using β-tubulin III (green) and PKH-67 (red) 4 weeks after surgery, and the nuclei were visualized with 4’,6-diamidino-2-phenylindole (DAPI) (blue). PKH67-labeled hBMSCs are indicated by arrows. Scale bar is 100 μm.
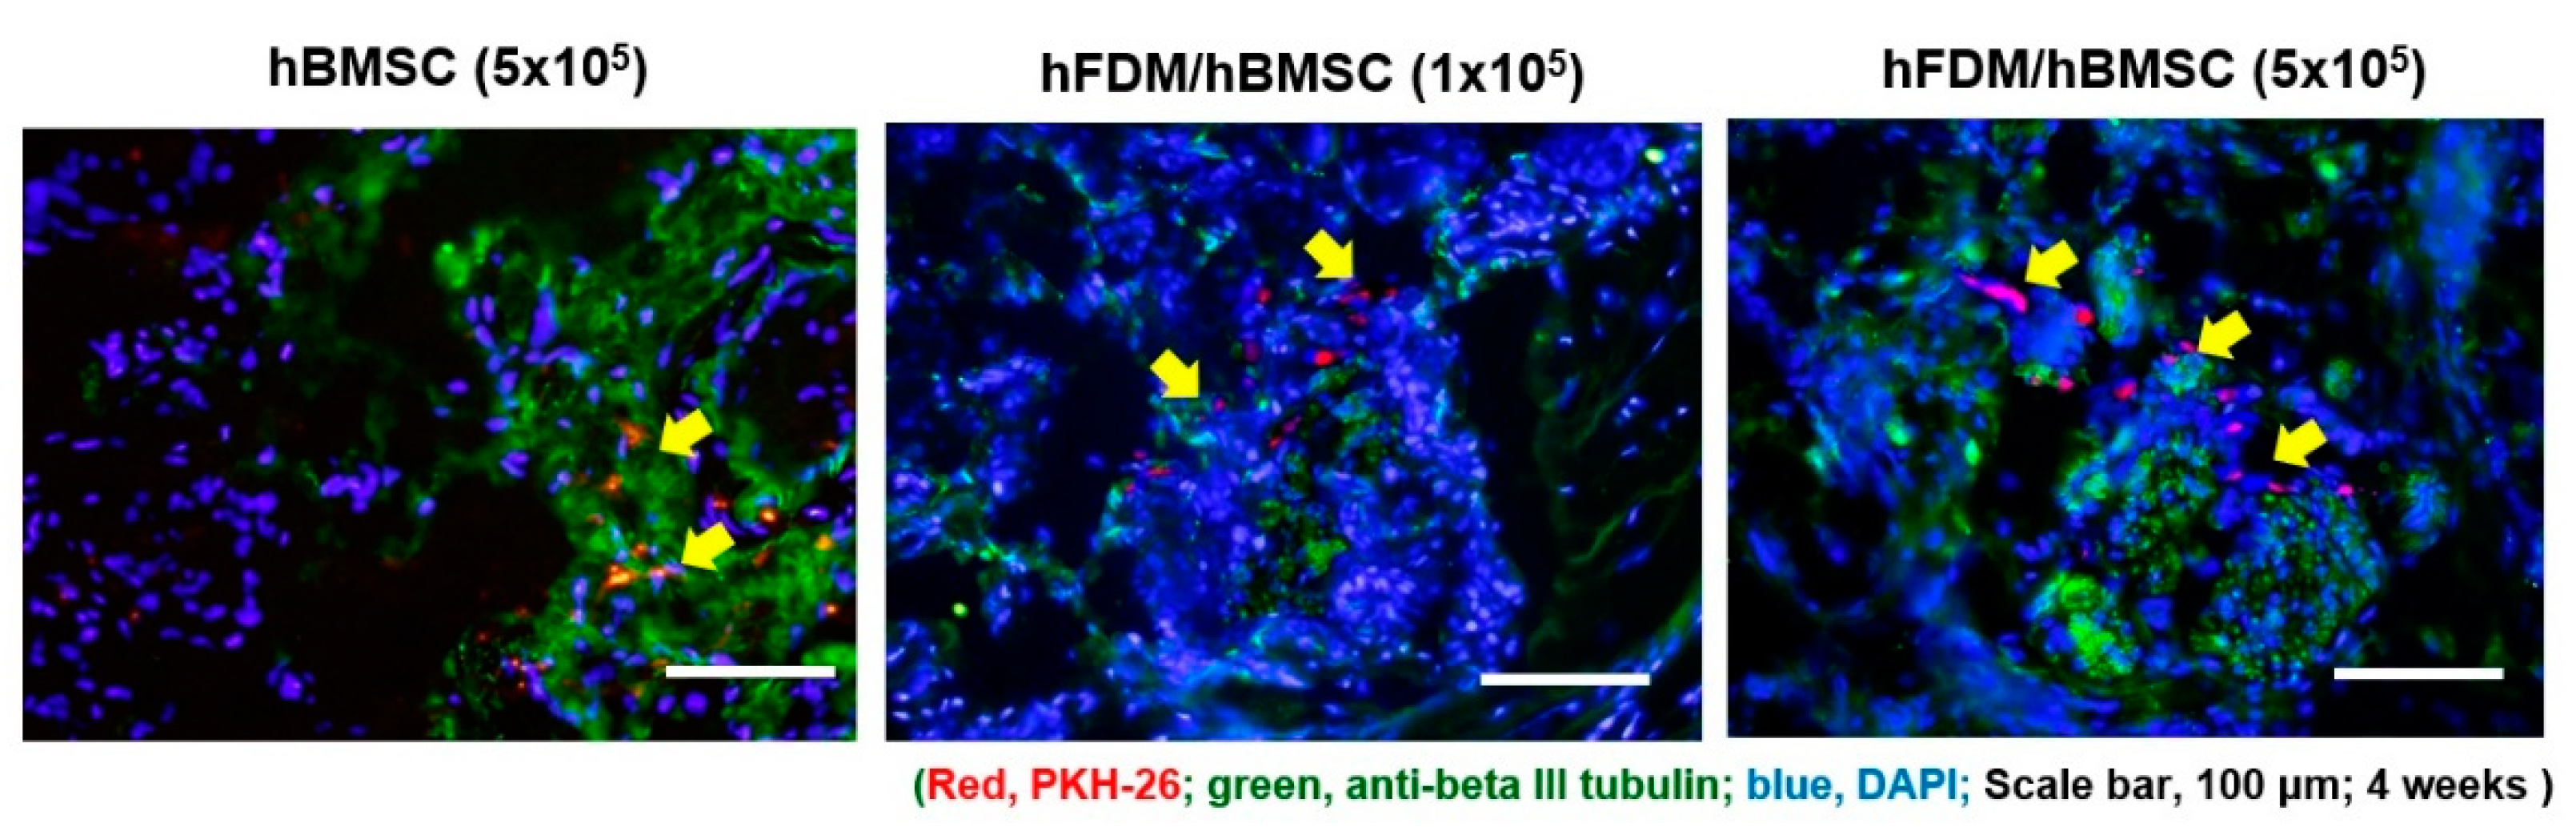
Figure 6.
Change of smooth muscle content in corpus cavernosum tissue. (A) Representative images showing Masson trichrome staining in all five groups. Smooth muscle and collagen were stained in red and blue, respectively. (B) The bar graph shows the smooth muscle/collagen ratio (mean ± SD) (C) Representative results of immunohistochemistry for alpha smooth muscle actin (α-SMA) in all five groups. α-SMA was stained brown, and nuclei were counterstained with hematoxylin (blue). (D) The bar graph represents a quantitative assessment of α-SMA expression (mean ± SD). Magnification, ×200. *p < 0.05 compared with BCNI, #p < 0.05 compared with hBMSC (5×10⁵) or hFDM/hBMSC (1×10⁵).
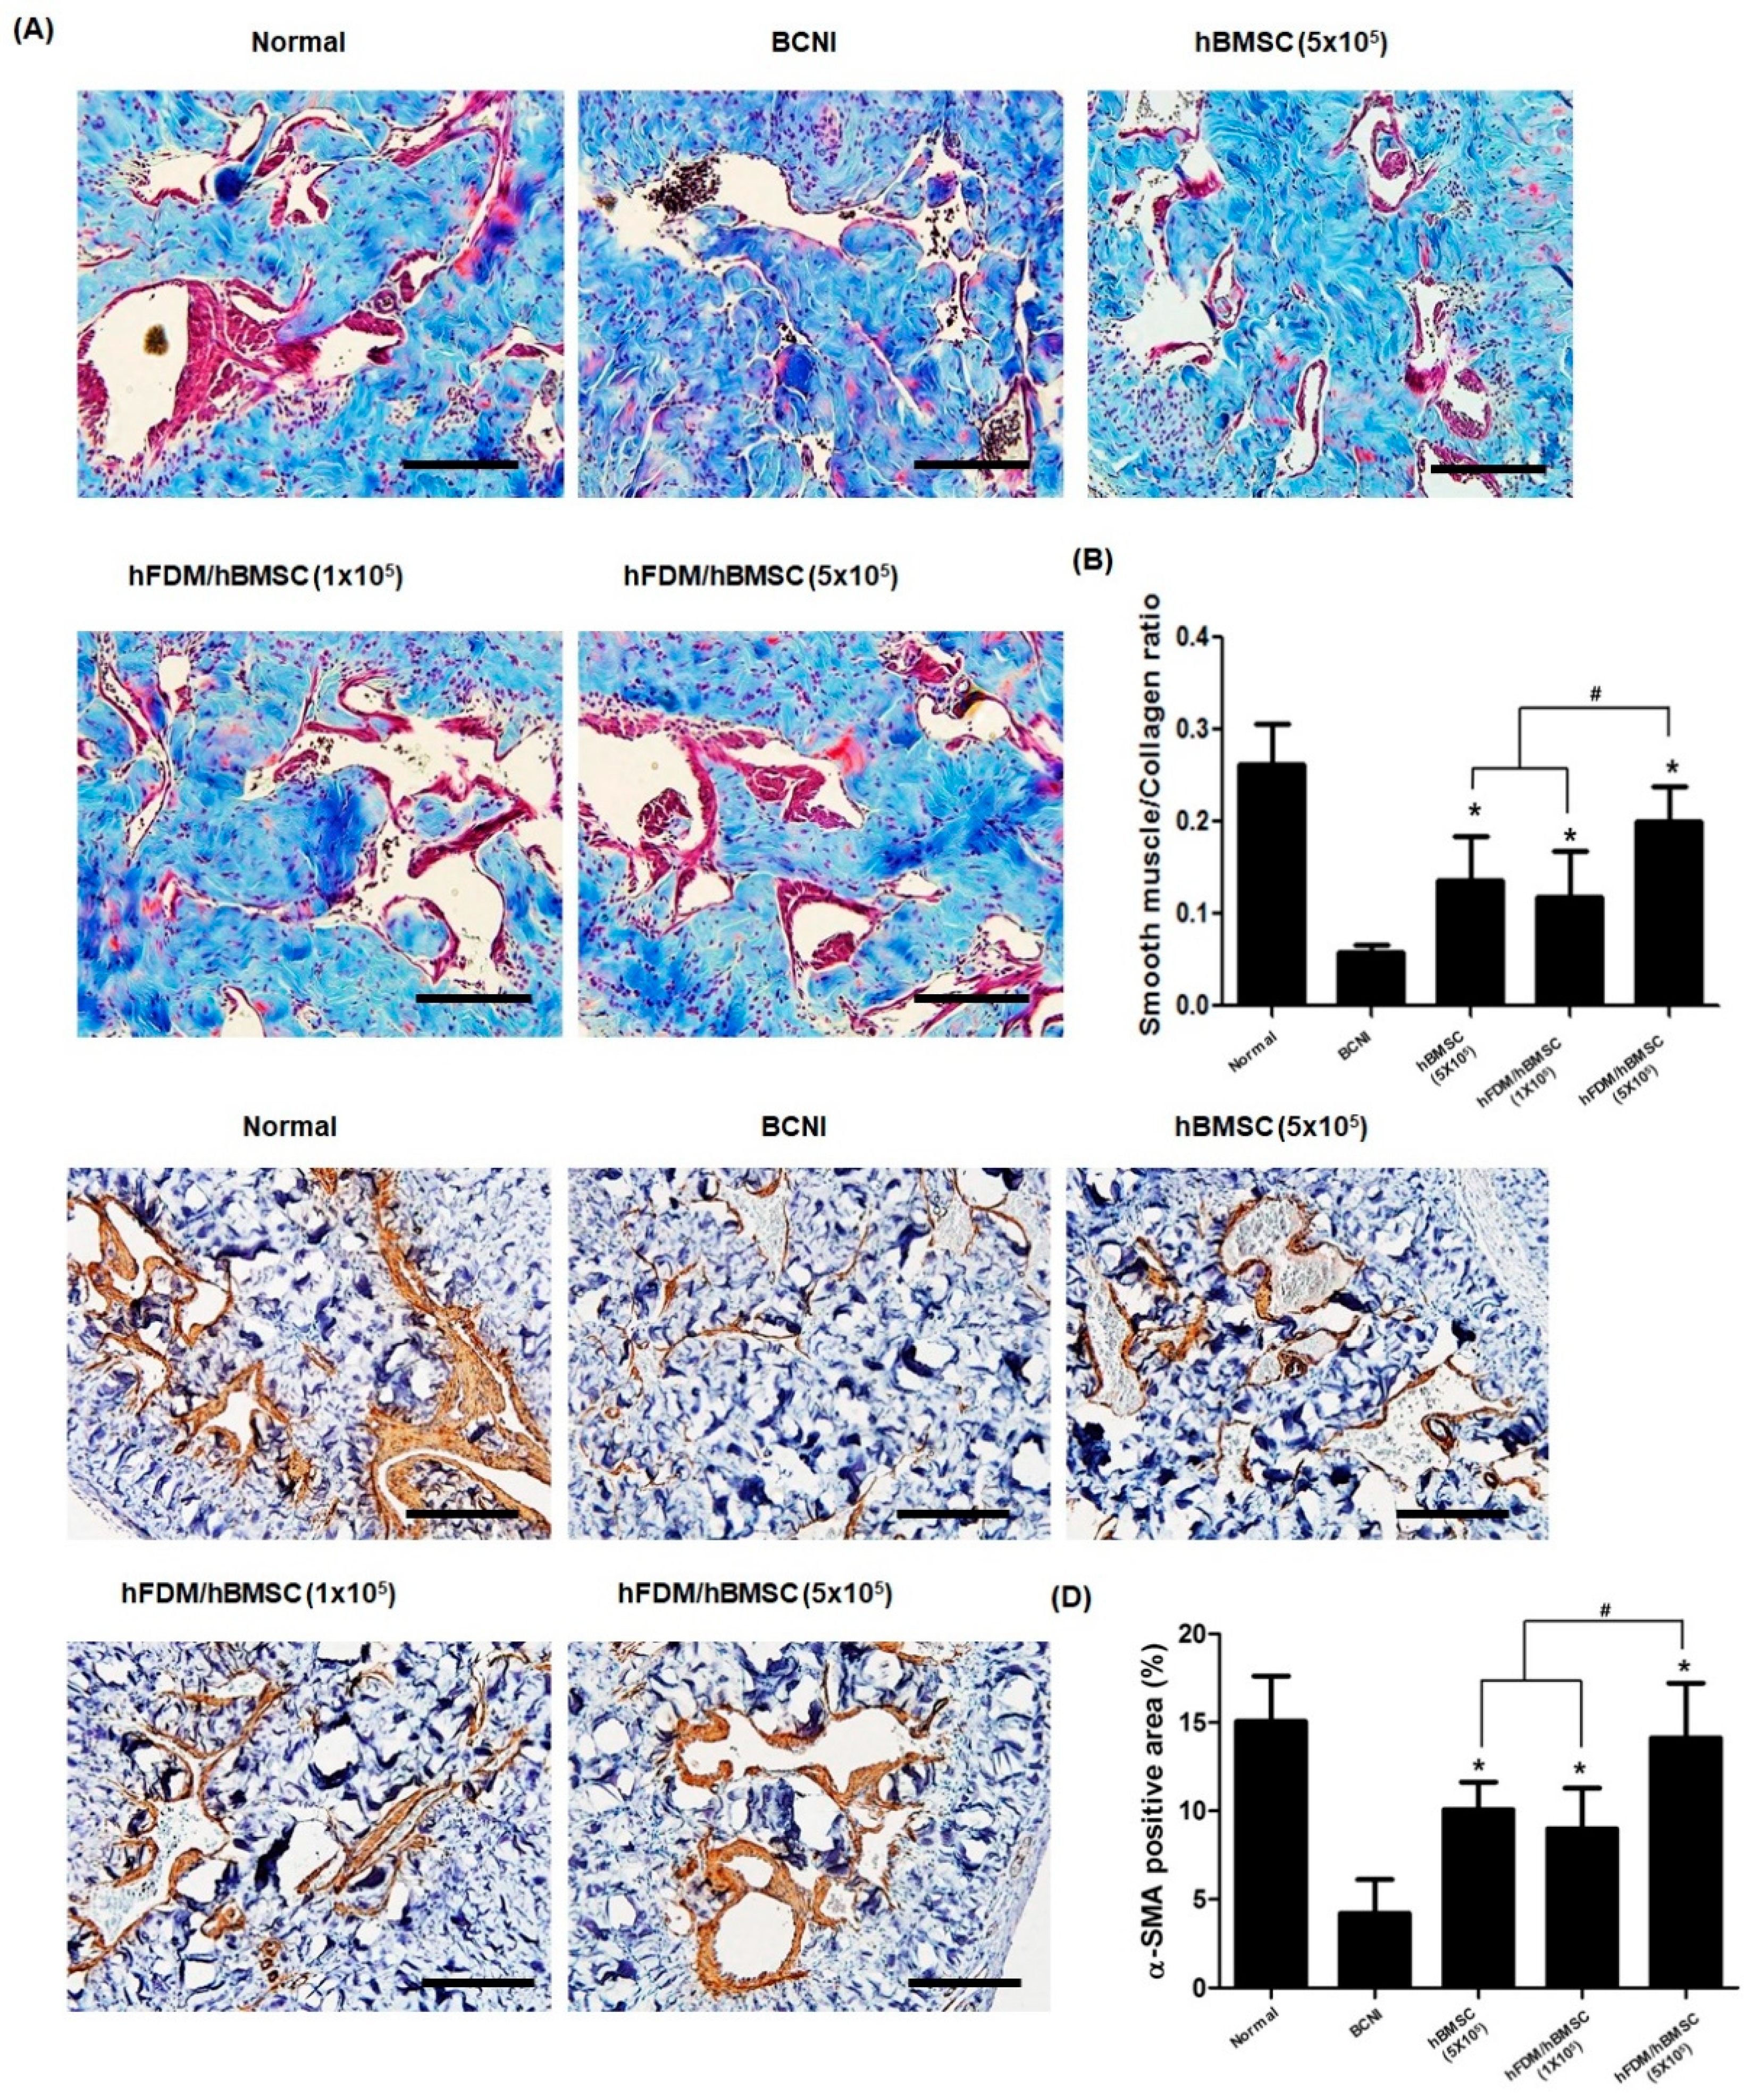
Figure 7.
Expression of nNOS and eNOS, and level of cGMP in corpus cavernosum. (A) Representative images of immunohistochemical staining in the dorsal penile nerve. nNOS was stained red and neuron-specific β-tubulin III was stained green (magnification, ×400). (B) Quantification of nNOS expression expressed as the fluorescence intensity of the dorsal penile nerve in each group (mean ± SEM). (C) Representative images of immunohistochemical staining in the corpus cavernosum. eNOS was stained red and endothelial-specific CD31 was stained green (magnification, ×400). (D) cGMP levels in the corpus cavernosum was measured by a cGMP Direct Immunoassay Kit. Each bar represents mean ± standard error. *p < 0.05 compared with BCNI, #p < 0.05 compared with hBMSC (5×10⁵) or hFDM / hBMSC (1×10⁵). nNOS, neuronal nitric oxide synthase; eNOS, endothelial nitric oxide synthase; cGMP, cyclic guanosine monophosphate.
Disclaimer/Publisher’s Note: The statements, opinions and data contained in all publications are solely those of the individual author(s) and contributor(s) and not of MDPI and/or the editor(s). MDPI and/or the editor(s) disclaim responsibility for any injury to people or property resulting from any ideas, methods, instructions or products referred to in the content. |
© 2023 by the authors. Licensee MDPI, Basel, Switzerland. This article is an open access article distributed under the terms and conditions of the Creative Commons Attribution (CC BY) license (https://creativecommons.org/licenses/by/4.0/).
Copyright: This open access article is published under a Creative Commons CC BY 4.0 license, which permit the free download, distribution, and reuse, provided that the author and preprint are cited in any reuse.


